Introduction
Hepatocellular carcinoma (HCC) is the most common
reported malignancy and the second leading cause of all
cancer-associated mortalities (1).
At present, surgical intervention is considered the first option
for treating patients with HCC. However, their prognosis remains
poor due to recurrence, and resistance to chemotherapy and
radiotherapy makes tumor recurrence almost inevitable (2–5).
In attempting to explain HCC carcinogenesis, the
theory of cancer stem cells (CSCs), also referred to as
tumor-initiating cells (TICs), has attracted wide attention.
Experimental evidence supported by clinical observations has
highlighted the importance of the association of tumor drug
resistance-related properties in HCC with CSCs (6–8). In our
previous study, a cell culture system allowing the enrichment of
hepatic stem-like cancer cells (HCSCs) from HCC cell lines and
human primary HCC tissues was established. HCSCs were demonstrated
to show stem cell properties, including the overexpression of stem
cell markers, acquisition of epithelial-mesenchymal transition
(EMT), drug resistance, and increased tumor-initiating capabilities
(9).
Over the past two decades, several well-accepted
stem cell surface markers have been exploited in HCSCs, including
CD133 (7), CD90 (10) and EpCAM (11). However, the regulatory mechanism by
which HCSCs acquire the ability to resist drugs and be efficiently
transplanted remains unclear. Therefore, high-throughput
transcriptomic sequencing is essential for better understanding the
cellular characteristics and signaling pathways of HCSCs involved
in tumor initiation or progression (12).
The present study developed a serum-free cell
culture system that allows the enrichment and expansion of HCSCs
and maintains their stem cell properties with the most important
characteristic of tumor initiation ability. The HCSCs exhibit the
upregulation of CSC biomarkers, including CD90, the enhancement of
EMT properties, the potential of self-renewal and invasion, and
resistance to chemotherapeutics. Furthermore, the tumor-initiating
ability of the HCSCs is significantly enhanced (9). Therefore, the cell culture system
developed in our previous study confirmed the reliability of HCSCs
sourced from HCC cell lines. Subsequent research was performed via
small RNA high-throughput sequencing in HCSCs, and the integrated
miRNA and mRNA data preliminarily clarified the regulatory networks
of HCSCs.
In the present study, to further profile the
enriched signatures in HCSCs, the high-throughput screening of 3
pairs of HCSCs and case-matched human HCC cells was performed. The
forthcoming integrated miRNA and mRNA data will reveal HCSC
regulatory networks according to their properties associated with
tumor initiation and chemotherapeutic resistance. The present study
identifies novel biomarkers and pathways for the regulation of
HCSCs.
Materials and methods
Experimental cell lines
Human hepatoma Hep3B and Huh7 cell lines were
obtained from the American Type Culture Collection (Manassas, VA,
USA). The MHCC97H cell line was gifted by Shanghai Zhongshan
Hospital (Shanghai, China). All cell lines were maintained in DMEM
with 10% FBS, 100 IU/ml penicillin G and 100 µg/ml streptomycin at
37°C in a 5% CO2 incubator. Three pairs of HCSC sublines (Huh7-C,
Hep3B-C and MHCC97H-C), which were previously demonstrated to show
the reinforcement of stem cell properties, induction of drug
resistance, an emergence of EMT properties, and enhancement of
tumor-initiating capabilities (9),
were derived from their case-matched human HCC cells (Hep3B, Huh7
and MHCC97H) and cultured in serum-free media with DMEM/F12 50%,
Neurobasal™-A Medium 50%, B-27 Supplement Minus Vitamin A, EGF 20
µg/ml, FGF-10 20 µg/ml, IGF-1 20 µg/ml, heparin 20 µg/ml, β-ME 20
µg/ml, NEAA, BSA 0.25%, GlutaMAX™-1. The study assembled all the
aforementioned human HCC cell lines for RNA sequencing (RNA-Seq;
Table I).
 | Table I.Details of datasets from HCSCs and
case-matched cells for RNA sequencing. |
Table I.
Details of datasets from HCSCs and
case-matched cells for RNA sequencing.
| Data | Cells | Total reads | Normalized |
|---|
| RNA | Hep3B-C | 5762058 | RPKM |
|
| Huh7-C | 5886142 |
|
|
| MHCC97H-C |
|
|
|
| Hep3B | 6116344 |
|
|
| Huh7 | 5998659 |
|
|
| MHCC97H |
|
|
RNA-seq
RNA-seq was used to profile genes differentially
expressed in cancer stem cells and their parental cell lines,
Hep3B, Huh7 and MHCC97H. RNA-seq was performed by the Beijing
Genomics Institute (BGI, Beijing, China). Total RNA was extracted
using Eastep™ Super Total RNA Extraction kit (Promega Corporation,
Madison, WI, USA) and treated with DNase I. Subsequently, mRNA from
total RNA was enriched with oligo (dT) magnetic beads for
eukaryotes, followed by fragmentation into ~200 bp short fragments
by mixing with Fragmentation Reagents (Beckman Coulter, Inc.,
Danvers, MA, USA). Random hexamer priming was used to synthesize
the first strand of cDNA; DNA polymerase I, dNTPs and RNase H were
used to synthesize the second strand; the double-stranded cDNA was
purified with magnetic beads; and end repair and 3′-end single
nucleotide A addition were performed. Next, the adapter-modified
fragments were enriched via PCR amplification (13). To monitor the quantity and quality of
the DNA sample library, a quality control procedure was performed
with an Agilent 2100 Bioanalyzer (Agilent Technologies, Inc., Santa
Clara, CA, USA) and an ABI StepOnePlus RT-PCR system (Thermo Fisher
Scientific, Inc., Waltham, MA, USA). The captured DNA library was
sequenced to a depth of 30-fold coverage with the Illumina HiSeq™
2000 Analyzer (Illumina, Inc., San Diego, CA, USA).
Raw sequence preprocessing
To obtain high-quality reads for further analysis,
data filtering was performed on the basis of adaptor sequences to
remove low-quality reads, which were defined by a percentage of
unknown bases (N) >10% or the presence of >50% of bases with
a quality value of 5 or less in a read. The clean reads were mapped
to reference genomes and sequences with SOAP software (14). To exclude the effect of sequencing
discrepancies and various gene lengths, gene expression levels were
normalized using RPKM algorithms (reads per kb per million reads),
making the transcripts across multiple samples comparable (15).
Data mining
The differentially expressed genes (DEGs) between
the HCSCs and case-matched hepatic cancer cells were analyzed by
the fold-change method (cut-off >2 or cut-off <0.5).
Subsequently, genes with coherent differences in expression
(consistently up- or downregulated in Huh7-C, Hep3B-C and MHCC97H-C
cells, referred to as meta-DEGs) were selected, and the overlapping
number of genes among the three cell line datasets was calculated
using the Venny tool and illustrated in a Venn diagram.
Hierarchical gene clustering was conducted using Cluster 3.0
software (16). The Euclidean
distance similarity metric and the average linkage clustering
method were used to measure gene patterns. TreeView X version 0.5.1
software (Slashdot Media, San Diego, CA, USA) was used to generate
the clustering map.
Enrichment analysis was performed to study the
functions and mechanisms of the DEGs. The OntoExpression tool was
used to identify significantly enriched gene functions in the Gene
Ontology (GO) database (http://geneontology.org/). Fisher's exact test was
used for GO analysis. Gene Ontology functional classification was
performed using WEGO software (17)
to classify GO functions for DEGs. To identify the known pathways
with significant enrichment with DEGs in HCSCs, pathway enrichment
analysis was performed using Pathway-Express software in the Kyoto
Encyclopedia of Genes and Genomes (KEGG) database (18). A hypergeometric test for the
statistical scenario was used to screen GO terms or pathways that
were significantly enriched in DEGs compared with the genomic
background. The candidate GO terms or pathways with corrected
P-values of <0.05 were considered to be significantly
enriched.
miRNA target prediction
To analyze the interaction between miRNAs and genes,
the results from 6 existing miRNA-target prediction programs
including DIANA-microTv4.0 (19),
miRanda-rel2010 (20), miRDB4.0
(21), miRWalk2.0 (22), RNAhybrid2.1 (23), PicTar4 (24), PITA (25), RNA22v2 (26) and Targetscan6.2 (27), were compared. Candidate paired miRNAs
and DEGs with at least five sources were considered for further
analysis.
miRNA expression detection
The differential expression of miRNAs in cancer stem
cells and their parental cell lines was detected by RT-qPCR
(reverse transcription-quantitative polymerase chain reaction)
using Eastep™ RT Master Mix (5X) (Promega, Madison, WI, USA).
Experimental validation
Perl scripts were run to conduct text-mining
searches in the Entrez PubMed database.
Statistical analysis
Statistical analyses were performed using GraphPad
Prism5 and R software version 3.2.1 (http://www.r-project.org/). Data are presented as the
mean ± standard deviation of the mean from at least three
independent experiments. Statistically significant differences were
calculated using Student's t-test and Kaplan-Meier survival
analyses. Fisher's exact test was used to analyze the mRNA
expression levels in hepatocellular carcinoma cells and
corresponding hepatocellular carcinoma stem-like cells. *P<0.05;
**P<0.01; ***P<0.001.
Results
Data and primary analysis
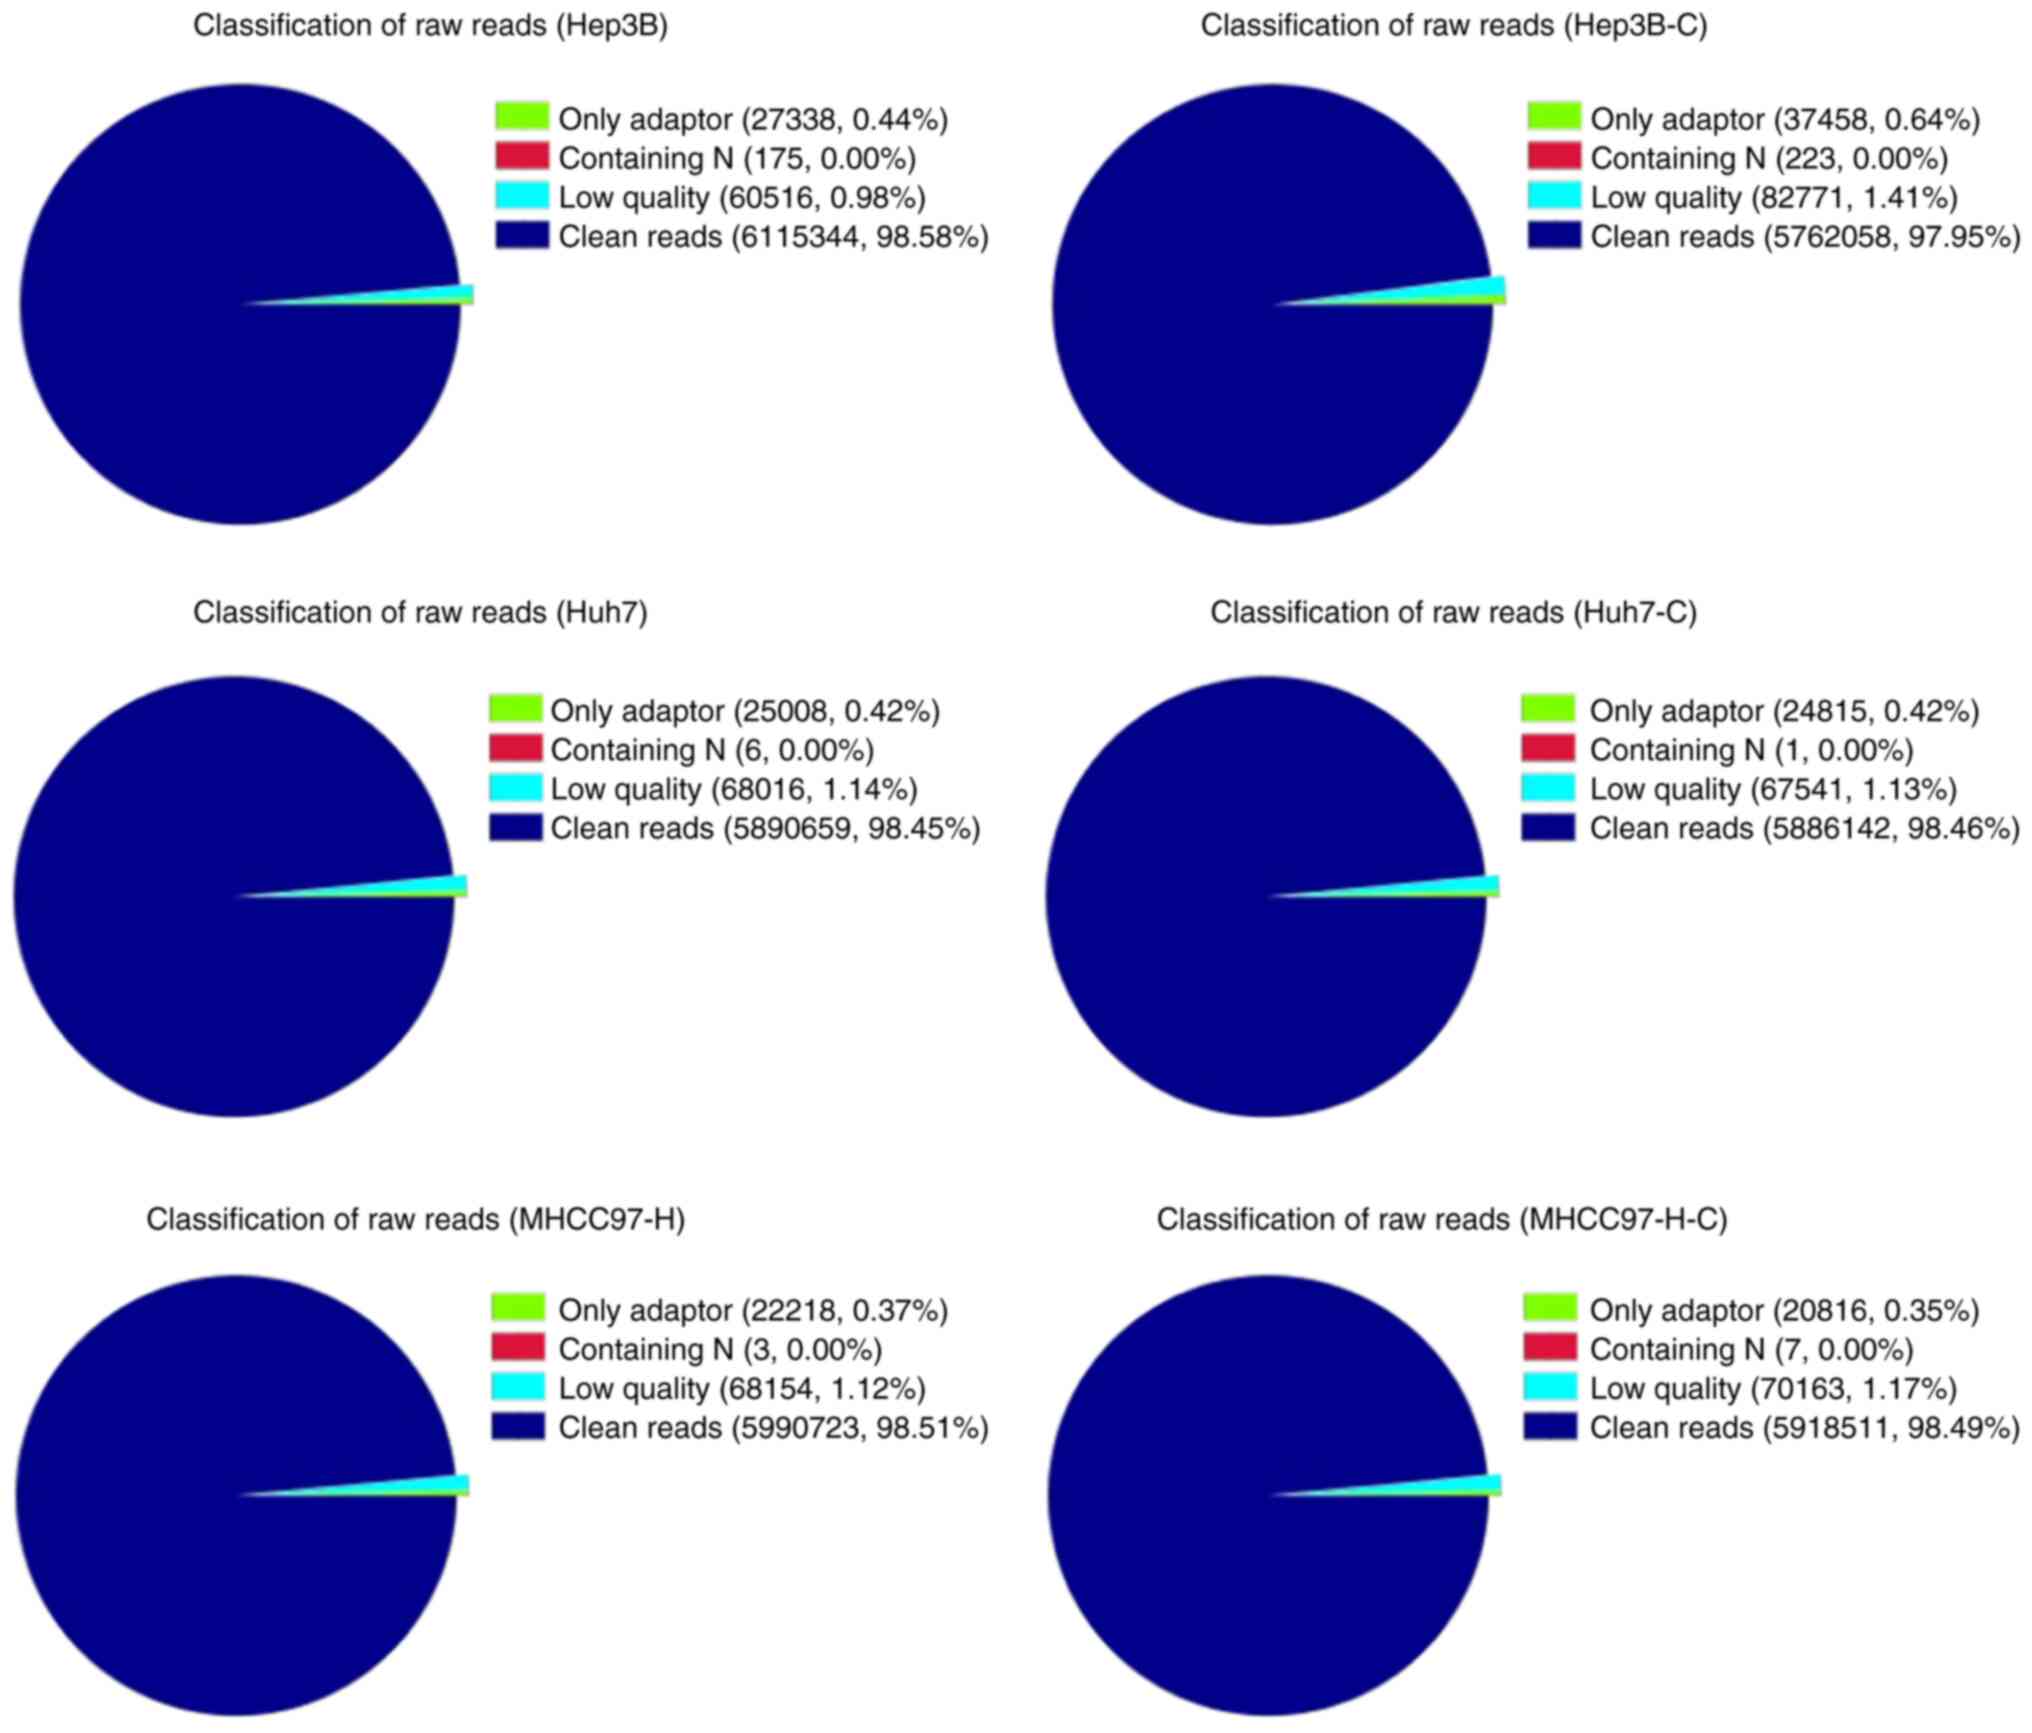
A data preprocessing procedure was performed for all
samples to obtain high-quality reads, which demonstrated the
classification of raw reads (Fig.
1). The proportion of clean reads was >97.9% of the total
reads in all the detected samples, indicating the existence of
high-quality sequences following data filtering, upon which all
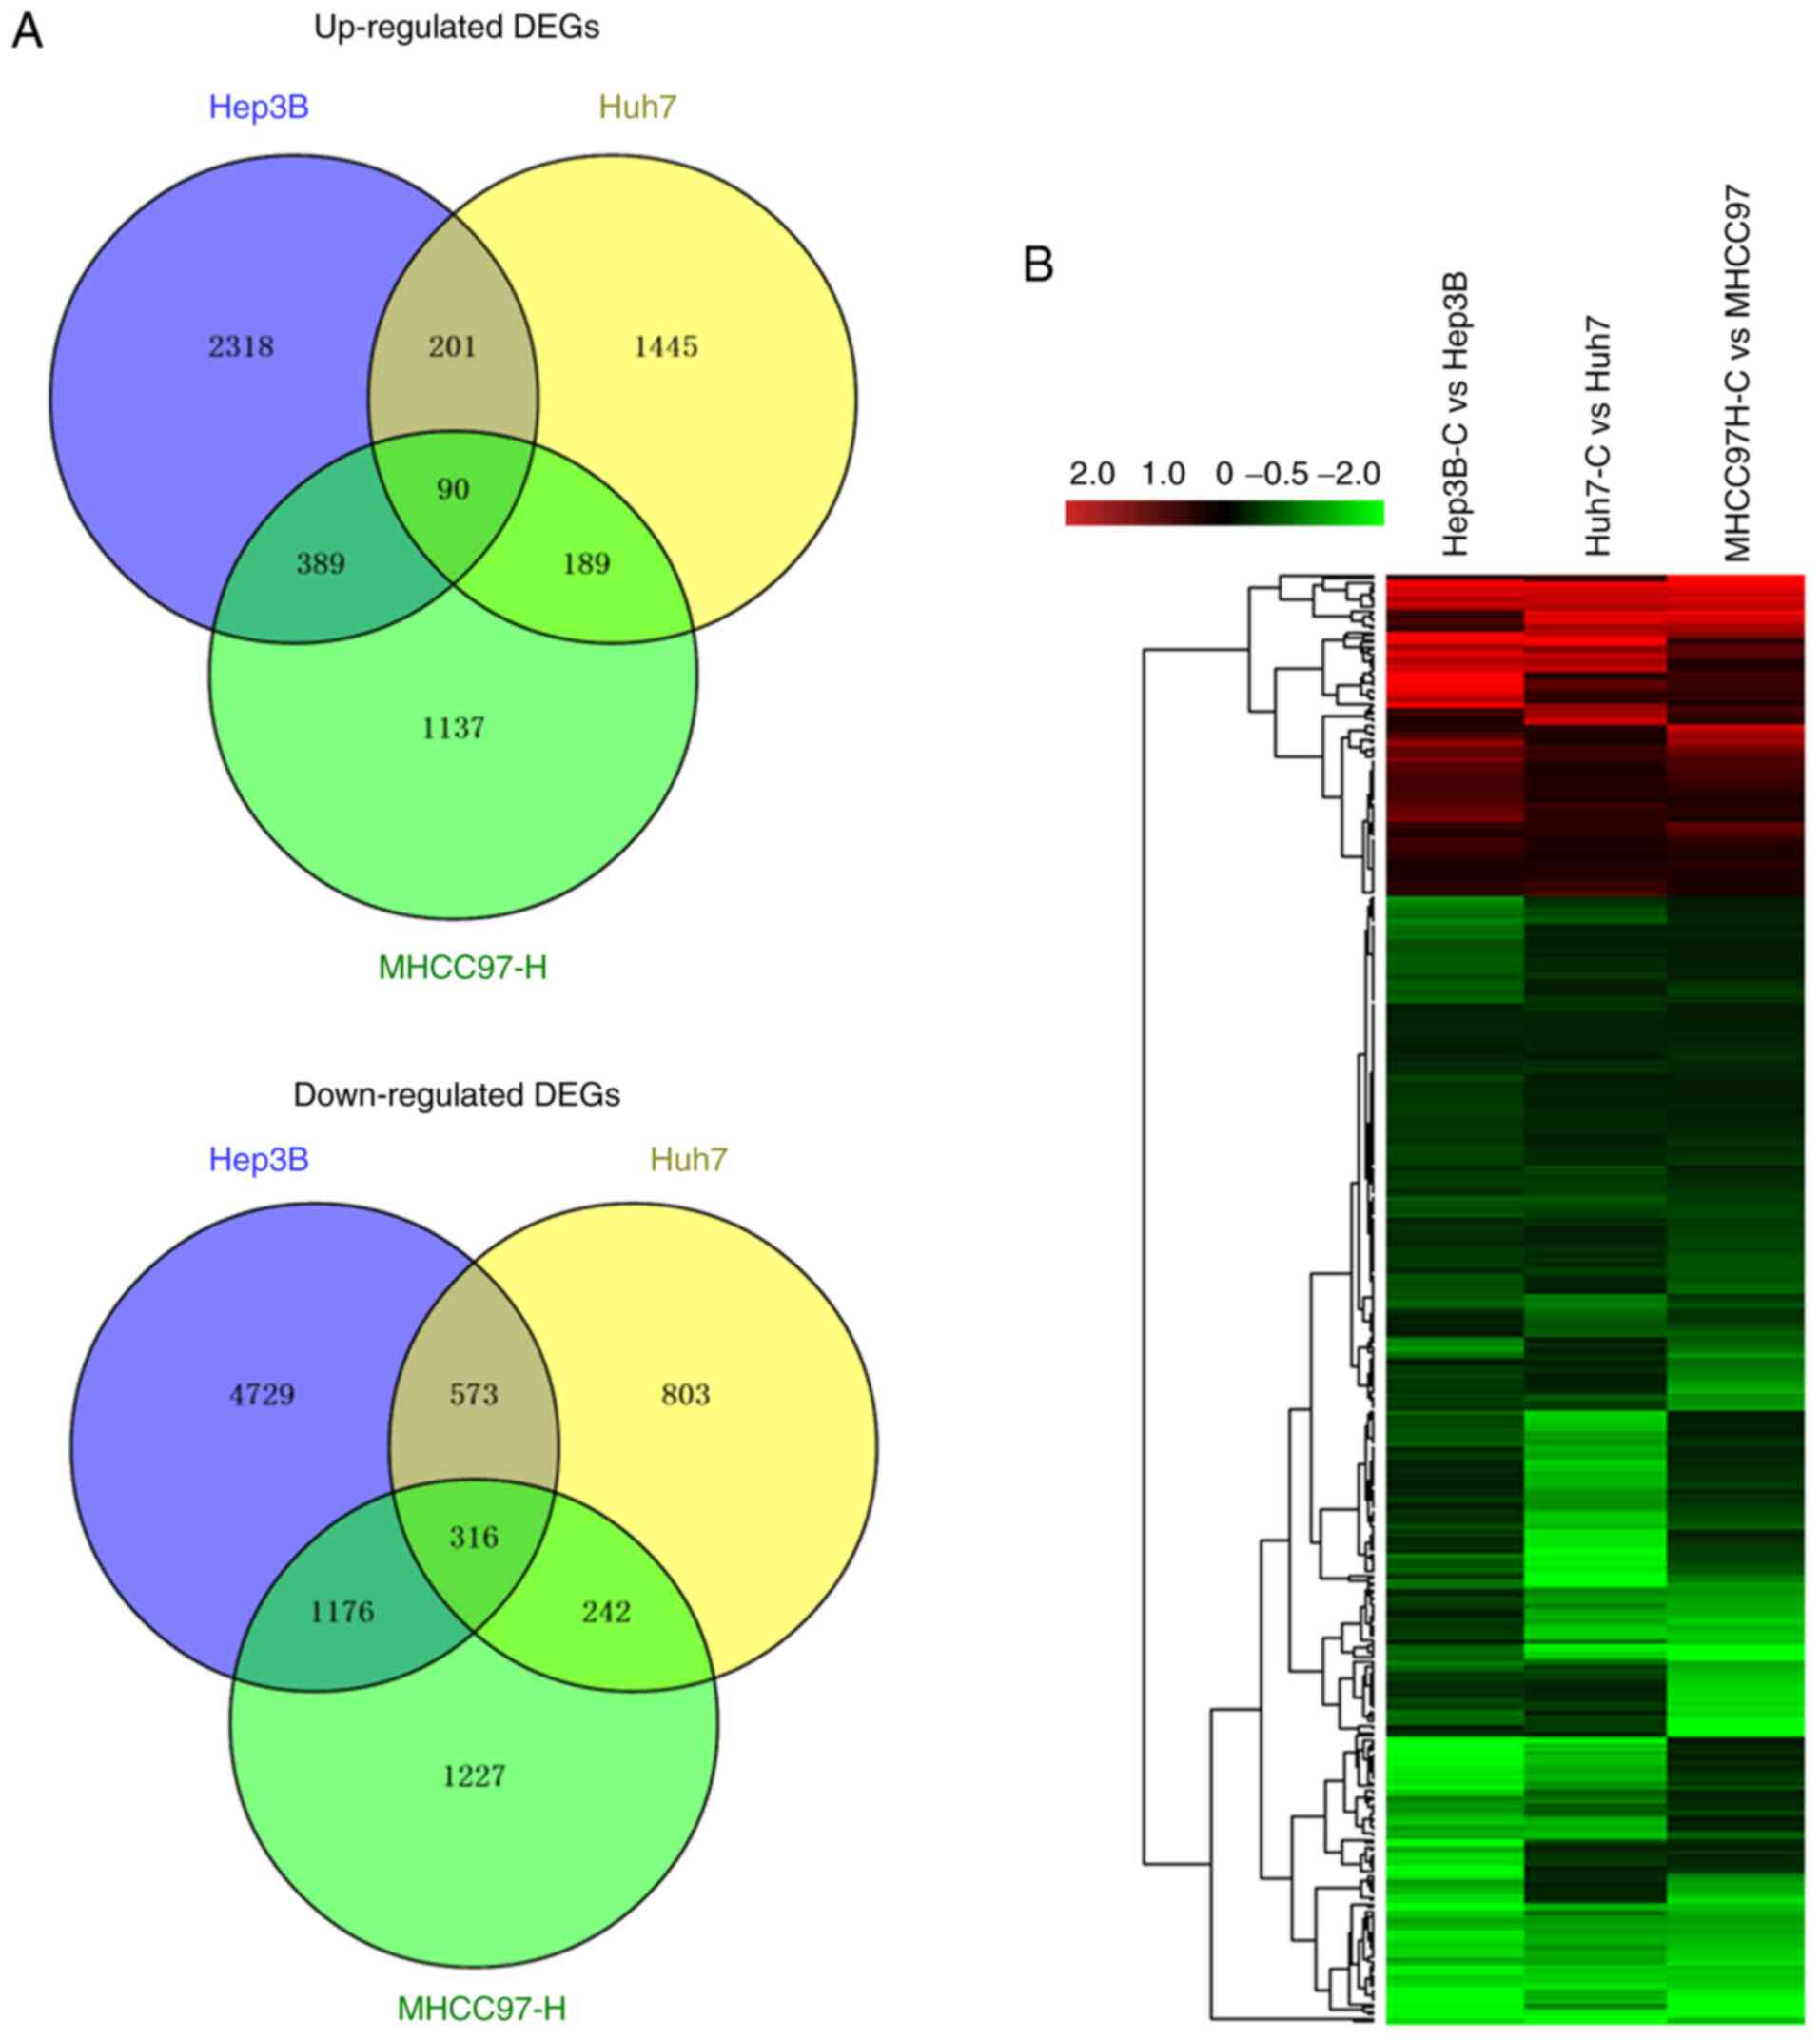
subsequent analyses were based. Venn analysis with domestic code
was applied to the three differentially expressed gene sets (DEGs
according to the criteria: Of log2FC>1 or <-1), and 1,012
DEGs were extracted from sphere-forming cells compared with the
parental cells. Among these 1,012 DEGs satisfying the criterion of
a fold-change of >2 or <0.5, 406 DEGs overlapped with the
consistent expression patterns among the three cell lines,
including 90 DEGs that were upregulated and 316 DEGs that were
downregulated in all three cell-lines (Fig. 2A). Similar expression patterns and
functional correlations of these DEGs were also displayed (Fig. 2B).
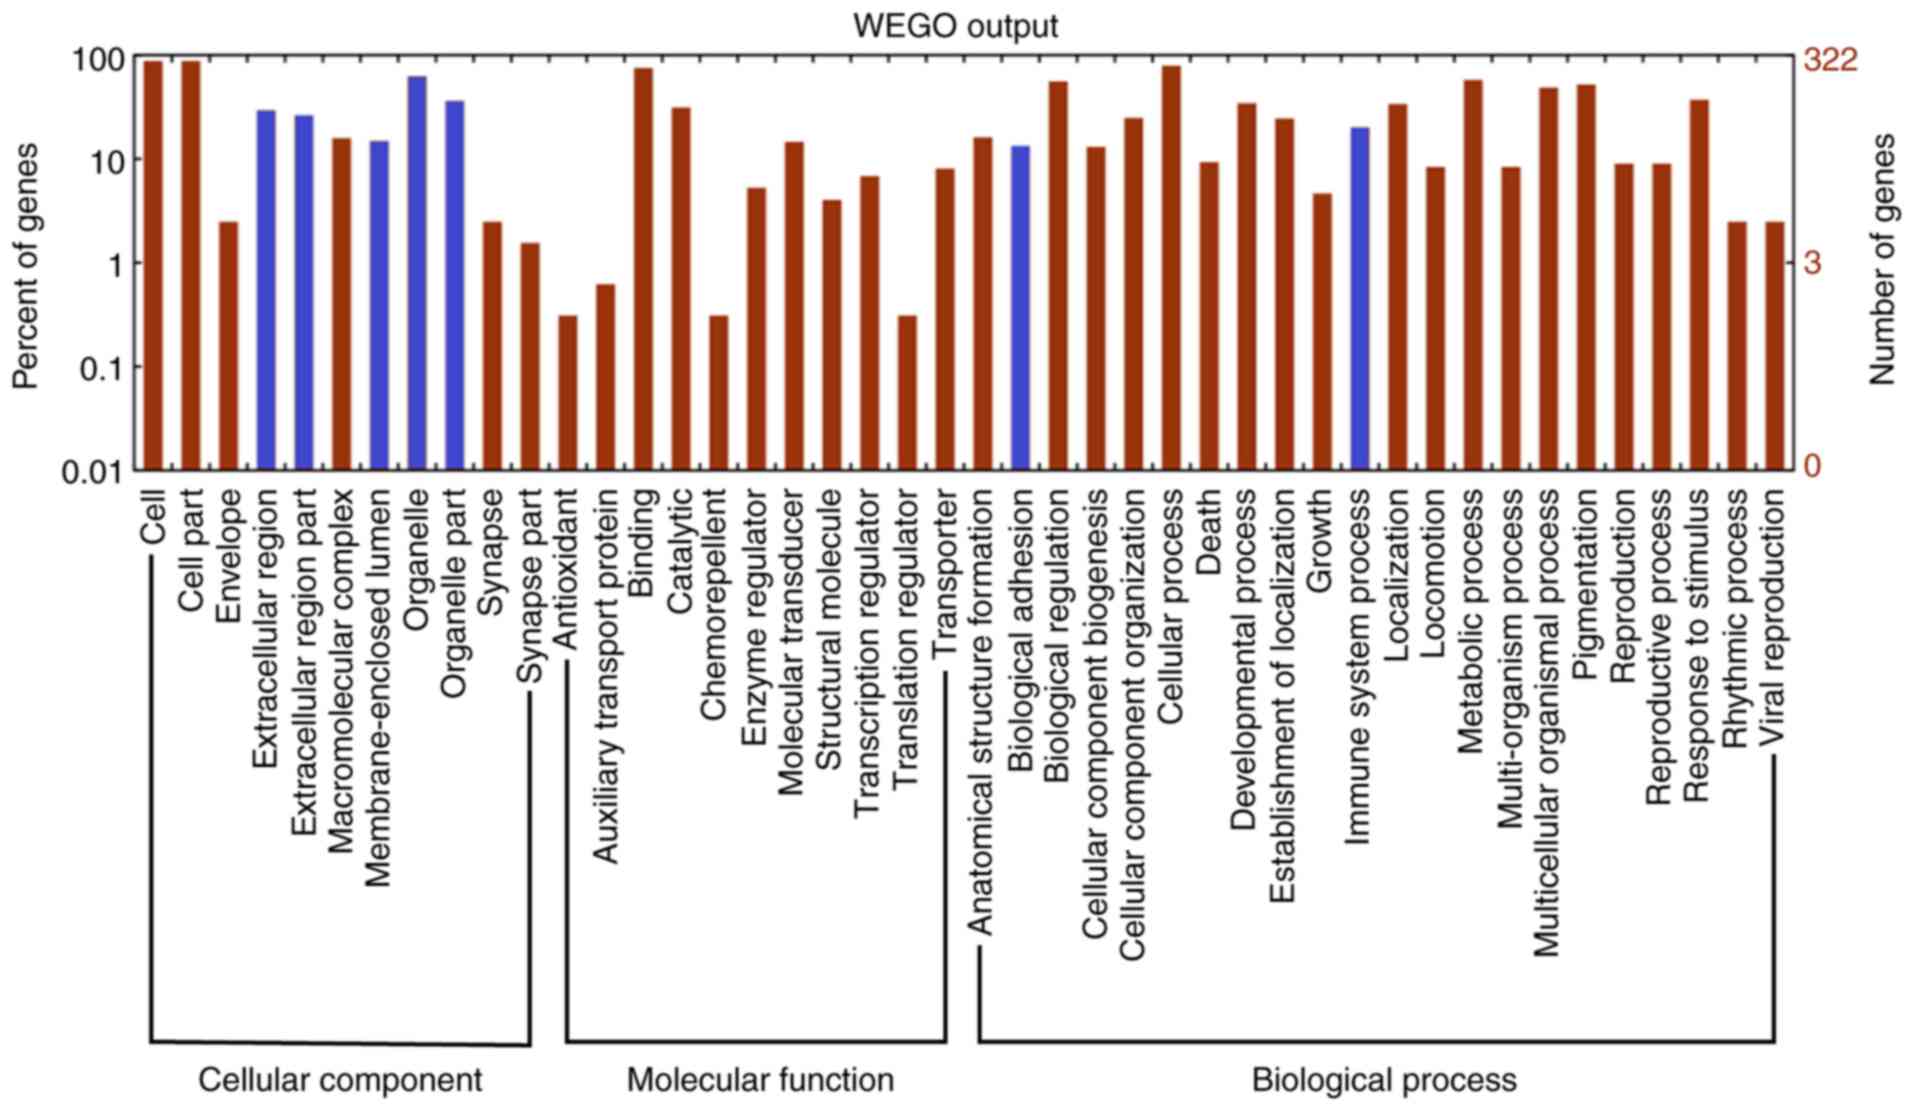
GO functional classification and
distribution of DEGs
To investigate the underlying mechanisms of the
HCSCs, 406 DEGs were retrieved and their associations with HCSCs
were investigated through analyzing GO and pathway enrichment. The
WEGO tool was used to visualize the GO terms in molecular function,
cellular component and biological process categories, which
revealed the GO functional classification and distribution for the
406 DEGs (Fig. 3). The 7 most highly
enriched terms for each level are indicated with blue color
(corrected P-value <0.05), and 39, 8, and 26 GO terms were
significantly enriched in the molecular function, cellular
component and biological process categories, respectively, with
corrected P-values of <0.05 (Tables
SI–III).
KEGG pathways enriched with DEGs
There were 53 pathways enriched with DEGs, including
the complement and coagulation cascade pathway, the peroxisome
proliferator-activated receptor (PPAR) signaling pathway, the
extracellular matrix (ECM)-receptor interaction pathway, and the
transforming growth factor (TGF)-beta signaling pathway. However,
only the complement and coagulation cascade pathways reached
statistical significance according to Pathway-Express (corrected
P-value=0.0330, P-value=0.0006; Table
II). It was also found that the DEGs were enriched in
ECM-receptor interaction, the PPAR signaling pathway and the TGF-α
signaling pathway associated with signaling transduction, although
none of the corresponding corrected P-values reached statistical
significance, as calculated by false discovery rate (FDR)
correction.
| Table II.Significantly enriched Kyoto
Encyclopedia and Genes and Genomes pathways. |
Table II.
Significantly enriched Kyoto
Encyclopedia and Genes and Genomes pathways.
| Pathway name | Input | Reference | P-value | Corrected
P-value |
|---|
| Complement and
coagulation cascades | 7 | 62 | 0.000617 | 0.032717195 |
| ECM-receptor
interaction | 7 | 77 | 0.002234 | 0.059193855 |
| PPAR signaling | 5 | 63 | 0.016303 | 0.28801761 |
| TGF-beta
signaling | 5 | 82 | 0.044279 | 0.586702115 |
Functional analysis of
complement-related DEGs
As expected, several DEGs were also enriched in the
GO term of complement activation, with a corrected P-value of
0.0260 (Fig. 4A). The scatterplots
comparing the deviation of DEGs between HCSC samples and
case-matched hepatic cancer cell samples are shown, in which 7
complement-related DEGs including complement component 1s (C1S),
complement component 1r (C1R), complement factor I (CFI), C3,
serpin family A member 5 (SERPINA5), serpin family G member 1
(SERPING1) and kininogen 1 (KNG1), are indicated with blue dots
(Fig. 4B). Clustering analysis was
also integrated to obtain the expression patterns of 7 DEGs
involved in complement activation (Fig.
4C).
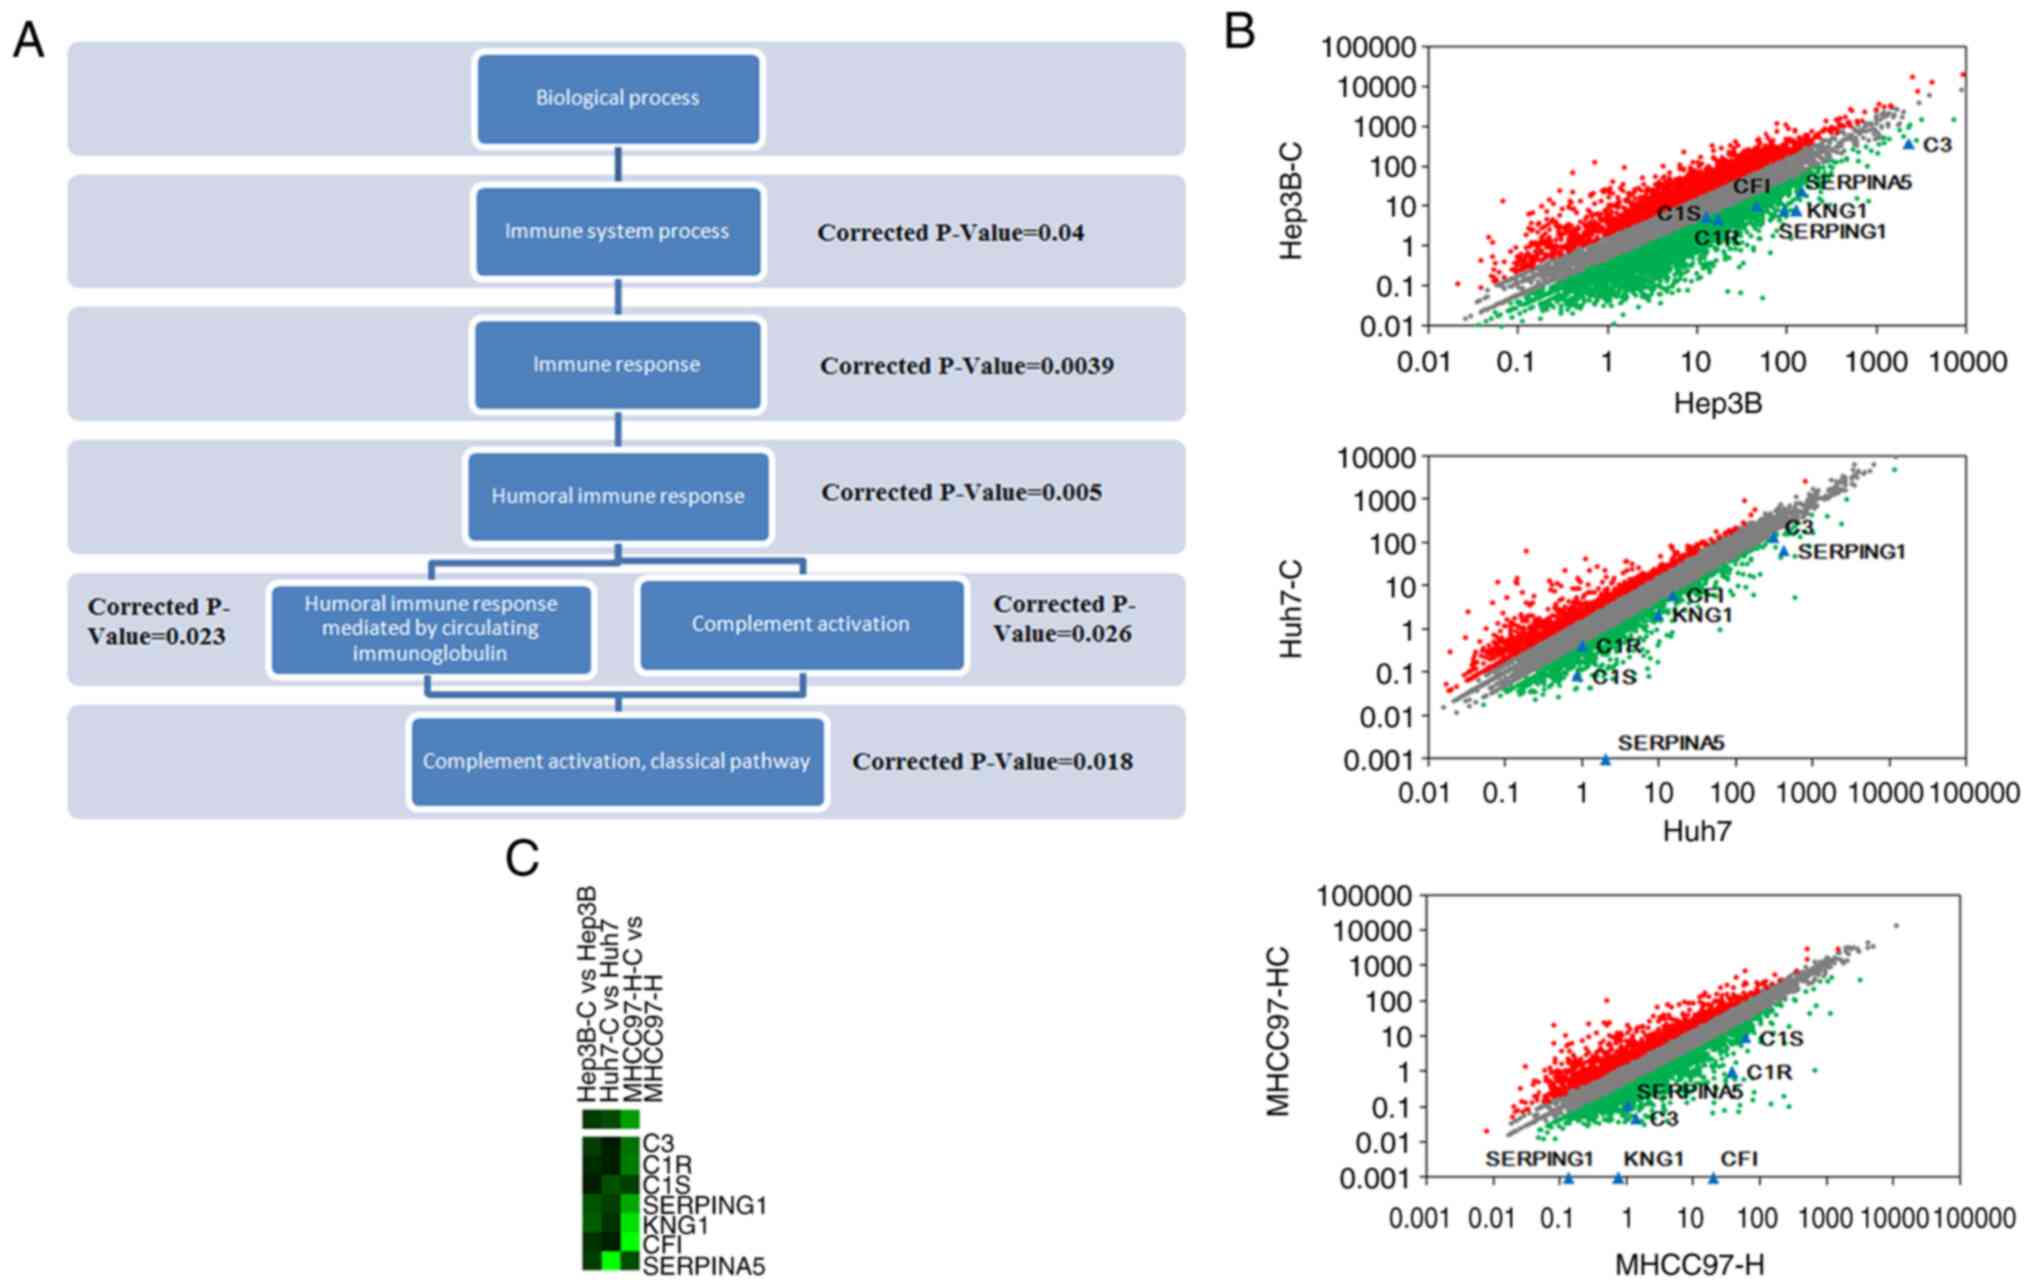 | Figure 4.Functional analysis of
complement-related DEGs (differentially expressed genes). (A) The
term subordination relationship of immune system process in GO
(gene ontology) analysis. The subordination relationships of the GO
terms are reflected by their positions in the figure. Corrected
P-values are indicated in the figure. (B) Scatter plots of global
gene expression patterns and 7 DEGs. The scatter plots describe
global gene expression patterns between hepatic cancer stem cells
and human hepatocellular carcinoma samples. Red, grey and green
represent gene expression showing upregulated, equivalent- and
downregulated levels. The positions of C1S, C1R, CFI, C3, SERPINA5,
SERPING1 and KNG1 are indicated with blue dots. (C) Two-way
hierarchical clustering showing the 7 complement activation-related
genes. C1S, complement component 1s; CR1, complement component 1r;
CFI, complement factor I; SERPINA5, serpin family A member 5;
SERPING1, serpin family G member 1; KNG1, kininogen 1. |
Prediction of miRNA target networks
involving complement-related DEGs
The associations between the enriched pathways were
investigated via text mining searches in NCBI PubMed. Notably, the
complement and coagulation cascade pathways were found to be
implicated in the development of HCSCs, which has been investigated
previously in HCC. However, the downregulation of these pathways
has not been described in HCSCs. In our previous study (9), the analysis of miRNAs and target genes
was integrated to study the molecular signatures and regulatory
mechanisms in HCSCs. Through network analysis, miRNA target
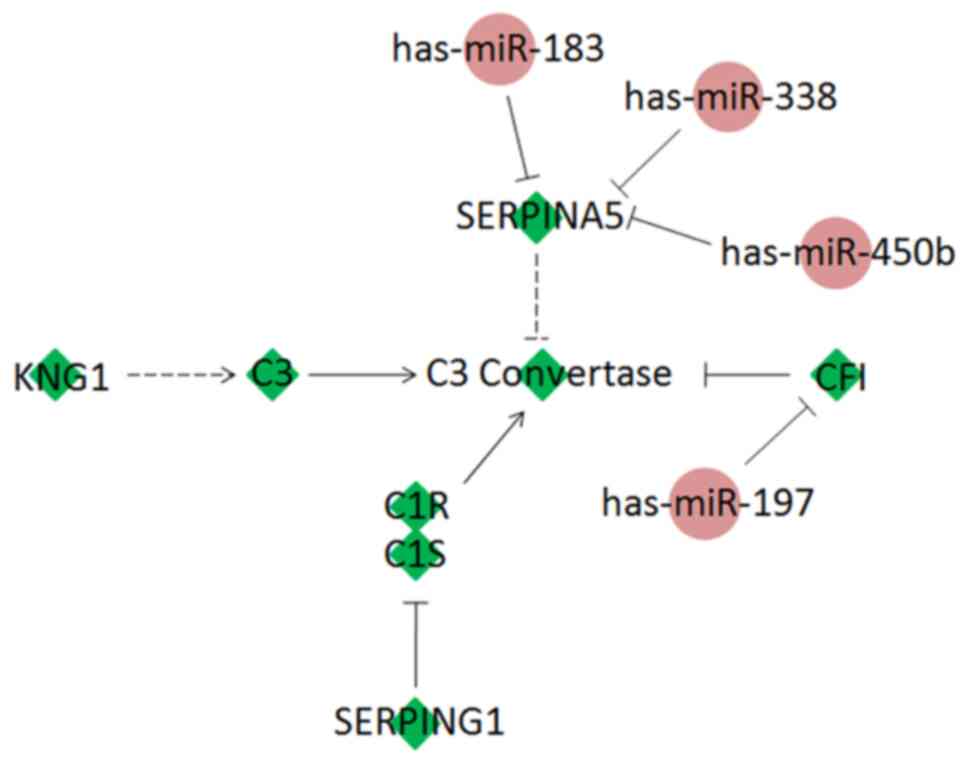
networks were constructed. In the present study, twenty miRNAs were
predicted to be candidates involved in complement activation
(Table III). Among these miRNAs, 7
(4 up- and 3 downregulation) had previously been shown to be
differentially expressed by miRNA high-throughput sequencing. It
was predicted that hsa-miR-186 and hsa-miR-187 may regulate C1S,
hsa-miR-197 may interact with CFI, and SERPINA5 was targeted by
hsa-miR-183, hsa-miR-450b and hsa-miR-532 (Fig. 5).
| Table III.Details of differentially expressed
genes regulated by predicted miRNAs. |
Table III.
Details of differentially expressed
genes regulated by predicted miRNAs.
| Gene name | MicroRNA | SUM | CHIP |
|---|
| C1S | hsa-miR-186 | 6 | DOWN |
|
| hsa-miR-187 | 5 | DOWN |
|
| hsa-miR-501-5p | 6 |
|
|
| hsa-miR-580 | 6 |
|
|
| hsa-miR-634 | 5 |
|
| CFI | hsa-miR-197 | 5 | UP |
|
| hsa-miR-412 | 5 |
|
|
| hsa-miR-580 | 6 |
|
| SERPINA5 | hsa-miR-138 | 5 |
|
|
| hsa-miR-183 | 5 | UP |
|
| hsa-miR-205 | 6 |
|
|
| hsa-miR-211 | 5 |
|
|
| hsa-miR-31 | 6 |
|
|
| hsa-miR-338-3p | 5 | UP |
|
| hsa-miR-376a | 5 |
|
|
|
hsa-miR-450b-5p | 6 | UP |
|
| hsa-miR-532-3p | 5 | DOWN |
|
| hsa-miR-636 | 5 |
|
|
| hsa-miR-643 | 6 |
|
|
| hsa-miR-649 | 6 |
|
Discussion
To clarify the carcinogenic mechanisms of HCC to
investigate effective strategies to treat HCC, our previous studies
provided evidence of the establishment of a cell culture system
that allowed the culture and amplification of HCSCs (9). Subsequently, a large-scale
investigation was performed encompassing whole-genome
transcriptomic profiling, analysis for pathways, gene ontologies
and miRNA-target interaction predictions to investigate, not only
the gene expression alteration of HCSCs, but also the signaling
pathways involving these DEGs as well as the potential roles of
HCSCs.
A total of 406 significantly DEGs were identified
and stratified according to the selected criteria. An enrichment
analysis was performed using the publicly available GO and KEGG
datasets to investigate HCSC regulatory mechanisms. Seventy-three
GO terms were found to be significantly associated with genes that
were up- or downregulated in HCSCs (corrected P-value <0.05).
Next, the enrichment of DEGs were searched for in pathways through
Pathway-Express analysis. Only complement and coagulation cascade
pathways were identified as significantly enriched pathways
(corrected P-value <0.05). Gene expression studies have
previously implicated these pathways in HCC (28–30).
These results revealed the upregulation of the complement and
coagulation cascade pathways in HCC cases versus patients with
liver cirrhosis. Recently, the upregulated expression of mCRPs
(membrane-bound complement restriction proteins) was reported to
sequester cancer cells from complement-dependent cytotoxicity and
enhance the survival ability of cancer cells in head and neck
cancer (31). However, the
downregulation of complement and coagulation cascade pathways has
not been described previously in HCSCs. By combining the results
from the GO and KEGG analyses, 7 genes were found to be
downregulated in the complement and coagulation cascade pathways
(C1S, C1R, CFI, C3, SERPINA5, SERPING1 and KNG1). These genes were
previously confirmed to serve an important role in cancer. For
example, CFI is overexpressed in cutaneous squamous cell carcinoma
progression (32) and is upregulated
in breast cancer and involved in poor clinical outcomes (33). CFI is a potential suppressive protein
in gastric cancer (34), and both
CFI and KNG1 show differential expression compared with their
levels in HBV-infected and healthy controls, which suggests that
there is a possible association between these genes and HCC
progression (35). Additionally,
SERPINA5 serves an important role in the regulation of HCC
migratory and metastatic potentials (36). Our RNA-seq results demonstrated that
the expression of C1S, C1R, CFI, C3, SERPINA5, SERPING1 and KNG1
was significantly different between carcinoma stem-like cells and
tumor cells. All the results are presented in Table SIV.
The miRNA-mRNA network constructed in the present
study consisted of 7 complement activation related genes and their
computationally predicted associated miRNAs. The data resources of
the predictive computation databases were derived from the
comparison of binding sites in 12 existing miRNA-target predictive
programs. Seven miRNAs were predicted to target several
downregulated genes involved in the complement activation pathway.
C1S was demonstrated to bind the putative binding sites for
hsa-miR-186 and hsa-miR-187, and hsa-miR-197 was found to bind the
3′-UTR of CFI. Similarly, SERPINA5 was identified to contain
binding sites for several miRNAs, including hsa-miR-183,
hsa-miR-450b and hsa-miR-532.
The expression of miR-338 and miR-450b in Hep3B,
Hep3B-C, Huh7 and Huh7-C cells was detected by reverse
transcription-quantitative polymerase chain reaction. The results
showed that the expression of miR-338 and miR-450b was
significantly increased in HCSCs (Fig.
S1). Notably, hsa-miR-450b-5p was also identified in our
previous study, which was predicted to participate in HCSC
invasion-related pathways. The mitogen-activated protein kinase
(MAPK)/extracellular signal-regulated kinase (ERK) signaling
pathway was enriched with several target genes of hsa-miR-450b-5p.
A recent study involving a pluripotent stem cell model revealed the
essential role of miR-450b-5p in embryonic corneal lineage
specification (37). However, the
regulation of miR-450b-5p as a molecular switch of SERPINA5
involved in the complement and coagulation cascade pathways has not
yet been investigated.
In conclusion, the present analysis, together with
mRNA and miRNA high-throughput sequencing data, revealed novel
distinctive signatures of HCSCs. The complement and coagulation
cascade pathways were identified during the development of HCSCs,
which may contribute toward hepatic cancer stem cell studies and
the identification of new drugs for the treatment of HCC. However,
this study only performed RNA-seq on three hepatocellular carcinoma
cell lines, and no study was conducted on fresh HCC tissue samples.
The conclusions of the present study need to be further confirmed
by a broader investigation.
Supplementary Material
Supporting Data
Acknowledgements
Not applicable.
Funding
The present study was supported by the National Key
R&D Program of China (grant no. 2018YFA0900900) and the
National Natural Science Foundation of China (grant nos. 81802736
and 81773251).
Availability of data and materials
All data generated or analyzed during this study are
included in this published article.
Authors' contributions
JL and KL designed and performed all the
experiments. JL, KL, YS, QZ, LC, HQ and HW participated in the
acquisition and analysis of data. JL and CS drafted and revised the
article. CS designed the experiments and agreed to be accountable
for all aspects of the work in ensuring that questions related to
the accuracy or integrity of any part of the work are appropriately
investigated and resolved. All authors read and approved the final
manuscript.
Ethics approval and consent to
participate
Not applicable.
Patient consent for publication
Not applicable.
Competing interest
The authors declare that they have no competing
interests.
References
|
1
|
Siegel RL, Miller KD and Jemal A: Cancer
statistics, 2020. CA Cancer J Clin. 70:7–30. 2020. View Article : Google Scholar : PubMed/NCBI
|
|
2
|
Villanueva A, Minguez B, Forner A, Reig M
and Llovet JM: Hepatocellular carcinoma: Novel molecular approaches
for diagnosis, prognosis, and therapy. Annu Rev Med. 61:317–328.
2010. View Article : Google Scholar : PubMed/NCBI
|
|
3
|
Yang JD and Roberts LR: Hepatocellular
carcinoma: A global view. Nat Rev Gastroenterol Hepatol. 7:448–458.
2010. View Article : Google Scholar : PubMed/NCBI
|
|
4
|
Yau T, Chan P, Epstein R and Poon RT:
Evolution of systemic therapy of advanced hepatocellular carcinoma.
World J Gastroenterol. 14:6437–6441. 2008. View Article : Google Scholar : PubMed/NCBI
|
|
5
|
Chun JM, Kwon HJ, Sohn J, Kim SG, Park JY,
Bae HI, Yun YK and Hwang YJ: Prognostic factors after early
recurrence in patients who underwent curative resection for
hepatocellular carcinoma. J Surg Oncol. 103:148–151. 2011.
View Article : Google Scholar : PubMed/NCBI
|
|
6
|
Guo Z, Li LQ, Jiang JH, Ou C, Zeng LX and
Xiang BD: Cancer stem cell markers correlate with early recurrence
and survival in hepatocellular carcinoma. World J Gastroenterol.
20:2098–2106. 2014. View Article : Google Scholar : PubMed/NCBI
|
|
7
|
Ma S, Lee TK, Zheng BJ, Chan KW and Guan
XY: CD133+ HCC cancer stem cells confer chemoresistance by
preferential expression of the Akt/PKB survival pathway. Oncogene.
27:1749–1758. 2008. View Article : Google Scholar : PubMed/NCBI
|
|
8
|
Sell S and Leffert HL: Liver cancer stem
cells. J Clin Oncol. 26:2800–2805. 2008. View Article : Google Scholar : PubMed/NCBI
|
|
9
|
Li J, Yu Y, Wang J, Yan Z, Liu H, Wang Y,
Ding M, Cui L, Wu M, Jiang X and Qian Q: Establishment of a novel
system for the culture and expansion of hepatic stem-like cancer
cells. Cancer Lett. 360:177–186. 2015. View Article : Google Scholar : PubMed/NCBI
|
|
10
|
Yang ZF, Ho DW, Ng MN, Lau CK, Yu WC, Ngai
P, Chu PW, Lam CT, Poon RT and Fan ST: Significance of CD90+ cancer
stem cells in human liver cancer. Cancer Cell. 13:153–166. 2008.
View Article : Google Scholar : PubMed/NCBI
|
|
11
|
Yamashita T, Forgues M, Wang W, Kim JW, Ye
Q, Jia H, Budhu A, Zanetti KA, Chen Y, Qin LX, et al: EpCAM and
alpha-fetoprotein expression defines novel prognostic subtypes of
hepatocellular carcinoma. Cancer Res. 68:1451–1461. 2008.
View Article : Google Scholar : PubMed/NCBI
|
|
12
|
Szeto CY, Lin CH, Choi SC, Yip TT, Ngan
RK, Tsao GS and Li Lung M: Integrated mRNA and microRNA
transcriptome sequencing characterizes sequence variants and
mRNA-microRNA regulatory network in nasopharyngeal carcinoma model
systems. FEBS Open Biol. 4:128–140. 2014. View Article : Google Scholar
|
|
13
|
Lin T, Liu Q and Chen J: Identification of
differentially expressed genes in Monochamus alternatus digested
with azadirachtin. Sci Rep. 6:334842016. View Article : Google Scholar : PubMed/NCBI
|
|
14
|
Li R, Li Y, Kristiansen K and Wang J:
SOAP: Short oligonucleotide alignment program. Bioinformatics.
24:713–714. 2008. View Article : Google Scholar : PubMed/NCBI
|
|
15
|
Mortazavi A, Williams BA, McCue K,
Schaeffer L and Wold B: Mapping and quantifying mammalian
transcriptomes by RNA-Seq. Nat Methods. 5:621–628. 2008. View Article : Google Scholar : PubMed/NCBI
|
|
16
|
de Hoon MJ, Imoto S, Nolan J and Miyano S:
Open source clustering software. Bioinformatics. 20:1453–1454.
2004. View Article : Google Scholar : PubMed/NCBI
|
|
17
|
Ye J, Zhang Y, Cui H, Liu J, Wu Y, Cheng
Y, Xu H, Huang X, Li S, Zhou A, et al: WEGO 2.0: A web tool for
analyzing and plotting GO annotations, 2018 update. Nucleic Acids
Res. 46:W71–W75. 2018. View Article : Google Scholar : PubMed/NCBI
|
|
18
|
Kanehisa M, Araki M, Goto S, Hattori M,
Hirakawa M, Itoh M, Katayama T, Kawashima S, Okuda S, Tokimatsu T
and Yamanishi Y: KEGG for linking genomes to life and the
environment. Nucleic Acids Res. 36((Database Issue)): D480–D484.
2008.PubMed/NCBI
|
|
19
|
Maragkakis M, Vergoulis T, Alexiou P,
Reczko M, Plomaritou K, Gousis M, Kourtis K, Koziris N, Dalamagas T
and Hatzigeorgiou AG: DIANA-microT Web server upgrade supports fly
and worm miRNA target prediction and bibliographic miRNA to disease
association. Nucleic Acids Res. 39((Web Server Issue)): W145–W148.
2011. View Article : Google Scholar : PubMed/NCBI
|
|
20
|
John B, Enright AJ, Aravin A, Tuschl T,
Sander C and Marks DS: Human MicroRNA targets. PLoS Biol.
2:e3632004. View Article : Google Scholar : PubMed/NCBI
|
|
21
|
Wang X: miRDB: A microRNA target
prediction and functional annotation database with a wiki
interface. RNA. 14:1012–1017. 2008. View Article : Google Scholar : PubMed/NCBI
|
|
22
|
Dweep H, Sticht C, Pandey P and Gretz N:
miRWalk-database: Prediction of possible miRNA binding sites by
‘walking’ the genes of three genomes. J Biomed Inform. 44:839–847.
2011. View Article : Google Scholar : PubMed/NCBI
|
|
23
|
Rehmsmeier M, Steffen P, Hochsmann M and
Giegerich R: Fast and effective prediction of microRNA/target
duplexes. RNA. 10:1507–1517. 2004. View Article : Google Scholar : PubMed/NCBI
|
|
24
|
Krek A, Grün D, Poy MN, Wolf R, Rosenberg
L, Epstein EJ, MacMenamin P, da Piedade I, Gunsalus KC, Stoffel M
and Rajewsky N: Combinatorial microRNA target predictions. Nat
Genet. 37:495–500. 2005. View
Article : Google Scholar : PubMed/NCBI
|
|
25
|
Kertesz M, Iovino N, Unnerstall U, Gaul U
and Segal E: The role of site accessibility in microRNA target
recognition. Nat Genet. 39:1278–1284. 2007. View Article : Google Scholar : PubMed/NCBI
|
|
26
|
Miranda KC, Huynh T, Tay Y, Ang YS, Tam
WL, Thomson AM, Lim B and Rigoutsos I: A pattern-based method for
the identification of MicroRNA binding sites and their
corresponding heteroduplexes. Cell. 126:1203–1217. 2006. View Article : Google Scholar : PubMed/NCBI
|
|
27
|
Lewis BP, Burge CB and Bartel DP:
Conserved seed pairing, often flanked by adenosines, indicates that
thousands of human genes are microRNA targets. Cell. 120:15–20.
2005. View Article : Google Scholar : PubMed/NCBI
|
|
28
|
Tsai TH, Song E, Zhu R, Di Poto C, Wang M,
Luo Y, Varghese RS, Tadesse MG, Ziada DH, Desai CS, et al:
LC-MS/MS-based serum proteomics for identification of candidate
biomarkers for hepatocellular carcinoma. Proteomics. 15:2369–2381.
2015. View Article : Google Scholar : PubMed/NCBI
|
|
29
|
Zhang L, Guo Y, Li B, Qu J, Zang C, Li F,
Wang Y, Pang H, Li S and Liu Q: Identification of biomarkers for
hepatocellular carcinoma using network-based bioinformatics
methods. Eur J Med Res. 18:352013. View Article : Google Scholar : PubMed/NCBI
|
|
30
|
Lv J, Zhu B, Zhang L, Xie Q and Zhuo W:
Detection and screening of small molecule agents for overcoming
Sorafenib resistance of hepatocellular carcinoma: A bioinformatics
study. Int J Clin Exp Med. 8:2317–2325. 2015.PubMed/NCBI
|
|
31
|
Kesselring R, Thiel A, Pries R,
Fichtner-Feigl S, Brunner S, Seidel P, Bruchhage KL and Wollenberg
B: The complement receptors CD46, CD55 and CD59 are regulated by
the tumour microenvironment of head and neck cancer to facilitate
escape of complement attack. Eur J Cancer. 50:2152–2161. 2014.
View Article : Google Scholar : PubMed/NCBI
|
|
32
|
Riihilä P, Nissinen L, Farshchian M,
Kivisaari A, Ala-Aho R, Kallajoki M, Grénman R, Meri S, Peltonen S,
Peltonen J and Kähäri VM: Complement factor I promotes progression
of cutaneous squamous cell carcinoma. J Invest Dermatol.
135:579–588. 2015. View Article : Google Scholar : PubMed/NCBI
|
|
33
|
Okroj M, Holmquist E, Nilsson E,
Anagnostaki L, Jirström K and Blom AM: Local expression of
complement factor I in breast cancer cells correlates with poor
survival and recurrence. Cancer Immunol Immunother. 64:467–478.
2015. View Article : Google Scholar : PubMed/NCBI
|
|
34
|
Liu W, Liu B, Xin L, Zhang Y, Chen X, Zhu
Z and Lin Y: Down-regulated expression of complement factor I: A
potential suppressive protein for gastric cancer identified by
serum proteome analysis. Clin Chim Acta. 377:119–126. 2007.
View Article : Google Scholar : PubMed/NCBI
|
|
35
|
He X, Wang Y, Zhang W, Li H, Luo R, Zhou
Y, Liao CL, Huang H, Lv X, Xie Z and He M: Screening differential
expression of serum proteins in AFP-negative HBV-related
hepatocellular carcinoma using iTRAQ-MALDI-MS/MS. Neoplasma.
61:17–26. 2014. View Article : Google Scholar : PubMed/NCBI
|
|
36
|
Jing Y, Jia D, Wong CM, Oi-Lin Ng I, Zhang
Z, Liu L, Wang Q, Zhao F, Li J, Yao M, et al: SERPINA5 inhibits
tumor cell migration by modulating the fibronectin-integrin β1
signaling pathway in hepatocellular carcinoma. Mol Oncol.
8:366–377. 2014. View Article : Google Scholar : PubMed/NCBI
|
|
37
|
Shalom-Feuerstein R, Serror L, De La
Forest Divonne S, Petit I, Aberdam E, Camargo L, Damour O,
Vigouroux C, Solomon A, Gaggioli C, et al: Pluripotent stem cell
model reveals essential roles for miR-450b-5p and miR-184 in
embryonic corneal lineage specification. Stem Cells. 30:898–909.
2012. View Article : Google Scholar : PubMed/NCBI
|