Introduction
The World Health Organization (WHO) classifies human
spinal cord gliomas (SCGs) into four different grades (I–IV),
according to the increase in malignancy (1). Low-grade SCGs (classed as WHO stage
I–II) have a tendency for local recurrence and may trend towards
the development of high-grade SCG (classed as WHO stage IV)
(2). Post-surgery, patients with
low-grade SCG usually exhibit recurrence of tumors within months or
years, whereas patients with high-grade SCG, also known as
glioblastoma, have a median survival period of only 1 year
(3,4). Therefore, studies exploring the
mechanism underlying occurrence and progression of SCG may assist
in improving our understanding of the biological behavior of SCG
and thus result in improved treatment strategies.
MicroRNAs (miRNAs/miRs) are a class of endogenous
non-coding small RNAs (~22 nucleotides in length) which negatively
regulate target genes at the post-transcriptional level by
incomplete binding to the target gene (5,6). miRNAs,
which are hypothesized to serve as targets for tumor therapy, can
promote cell proliferation, inhibit apoptosis, promote angiogenesis
and serve a regulatory role in tumor pathogenesis (7–9).
Furthermore, miRNAs may be involved in tumor resistance and may be
a valuable diagnostic and prognostic factor for patients with SCG
(10).
To the best of our knowledge, the expression of
miRNAs in SCG has not been extensively studied, particularly
regarding miRNAs which may be implicated in the development of SCG.
The present study used miRNA microarrays to detect differentially
expressed (DE)miRNAs in the blood of patients with different grades
of SCG. The identification of novel DEmiRNAs may provide novel
insights into the progression and treatment of SCG.
Materials and methods
Study patients and blood samples
The present study was approved and supervised by The
Ethics Committees of Beijing University of Chinese Medicine
(Beijing, China) and Sanbo Brain Hospital, Capital Medical
University (Beijing, China). Written informed consent was obtained
from all patients prior to the study start. According to the WHO
(2016) (1) classification of
neurological tumors, a total of 10 patients with SCG who underwent
surgical treatment at Sanbo Brain Hospital, without preoperative
chemotherapy or radiotherapy were recruited between February 2016
to December 2016, and blood samples were collected from low-grade
or high-grade SCG cases. In addition, blood was collected from five
patients with benign tumors as a control. Arterial blood was stored
in liquid nitrogen immediately after extraction.
Microarray determination
Total miRNAs were labeled and hybridized according
to the manufacturers' protocol (Qiagen China Co., Ltd.). The slides
were scanned using the Axon GenePix 4000B microarray scanner
(Molecular Devices, LLC.). The scanned images were imported into
GenePix Pro version 6.0 (Molecular Devices, LLC.) for grid
alignment and data extraction. After median normalization,
significant DEmiRNAs between the two groups were identified based
on the fold change (FC) values and P-value.
Reverse transcription quantitative
(RT-q)PCR
Total RNA was extracted as previously described
(11). Total RNA was extracted from
the blood of patients with SCG and control patients using
TRIzol® reagent (Invitrogen; Thermo Fisher Scientific
Inc.). The RNA quantity and quality were determined using a
NanoDrop spectrophotometer (ND-1000, NanoDrop Technologies; Thermo
Fisher Scientific, Inc.). Total RNA was reverse transcribed into
cDNA using the cDNA Reverse Transcription kit (Invitrogen; Thermo
Fisher Scientific Inc.), with 2 µg total RNA. qPCR was subsequently
performed using SYBR Premix ExTaq and the MX3000 instrument
(Kangchen BioTech Co., Ltd.), according to the manufacturer's
protocol. RT-qPCR was performed using a 7500 Real-Time PCR System
(Applied Biosystems; Thermo Fisher Scientific, Inc.), accordingly
to the manufacturer's protocol. The sequences of the primers used
are presented in Table I. mRNA
expression levels were quantified using the 22−ΔΔCq
method (11) and normalized to the
internal reference gene U6.
 | Table I.miRNA and mRNA primers for
quantitative PCR analysis. |
Table I.
miRNA and mRNA primers for
quantitative PCR analysis.
| Primer | Sequence |
|---|
| U6 |
|
|
Forward |
5′-GCTTCGGCAGCACATATACTAAAAT-3′ |
|
Reverse |
5′-CGCTTCACGAATTTGCGTGTCAT-3′ |
|
hsa-miR-3189-3p |
|
|
Forward |
5′-CCGCGCCCTTGGGTCTGATG-3′ |
|
Reverse |
5′-ATCCAGTGCAGGGTCCGAGG-3′ |
| miRNA
specific primer |
GTCGTATCCAGTGCAGGGTCCGAGGTATTCGCACTGGATACGACCTACCC |
| hsa-miR-4527 |
|
|
Forward |
5′-AGCCGCGTGGTCTGCAAACACAT-3′ |
|
Reverse |
5′-ATCCAGTGCAGGGTCCGAGG-3′ |
| miRNA
specific primer |
GTCGTATCCGCAGGGTCCGAGGTATTCGCACTGGATACGACACAGTC |
Differential miRNA target gene
prediction
MirDB (version 5; http://www.mirdb.org) and TargetScan (version 7.1;
http://www.targetscan.org) databases were used to
predict and analyze the target genes of the abnormally expressed
miRNAs. The final results from the prediction utilized the
overlapping regions of the gene obtained between the two
databases.
Gene Ontology (GO) and Kyoto
Encyclopedia of Genes and Genomes (KEGG) pathway analyses
The GO database (http://geneontology.org) includes molecular function,
cellular component and biological processes as the three categories
to stratify function. GO analysis was used to obtain the
significantly enriched GO articles and corresponding genes in order
to deduce the biological functions of DEmiRNAs in SCG.
Using the KEGG database (https://www.kegg.jp), the pathways most associated
with the DEmiRNAs were determined.
Statistical analysis
SPSS software (version 20.0; IBM, Corp.) was used
for statistical analysis. The results are expressed as the mean ±
standard error of the mean. Unpaired Student's t-test was used to
calculate the P-value between the normalized signals of the two
sets of samples and the standardized signal values were used to
calculate the FC (FC>2, P<0.05). A Fisher's exact test was
used to identify which pathways and GO entries were significantly
associated with the DEmiRNAs. P<0.05 was considered to indicate
a statistically significant difference.
Results
Patient characteristics
A total of 10 patients with SCG, consisting of five
patients with high-grade SCG and five patients with low-grade SCG
were recruited. Blood samples were collected and staged according
to the WHO (2016) classification of neurological tumors. Basic
information on the patients, including age, sex and tumor location
are presented in Table II.
| Table II.Clinical characteristics of the
patients. |
Table II.
Clinical characteristics of the
patients.
| Patient no. | Age, years | Sex | Tumor pathology
classification | Tumor grade | Tumor location |
|---|
| 25343 | 28 | Female | Glioblastoma,
NOS | IV | T10-L1 |
| 26600 | 15 | Male | Glioblastoma,
NOS | IV | C5-7 |
| 26600(2) | 17 | Male | Glioblastoma,
NOS | IV | T1-5 |
| 28553 | 14 | Female | Glioblastoma,
NOS | IV | T1-8 |
| 28378 | 11 | Male | Glioblastoma,
NOS | IV | T9-12 |
| 26051 | 48 | Male | Astrocytoma,
NOS | II | C1-3 |
| 506353 | 47 | Female | Astrocytoma,
NOS | II | T5-7 |
| 511691 | 45 | Female | Astrocytoma,
NOS | II | C6-T1 |
| 27110 | 17 | Male | Hair cell
astrocytoma | I | T1-2 |
| 503550 | 13 | Male | Hair cell
astrocytoma | I | T1-4 |
| 1 | 38 | Female | Arnold-chiari
deformity | Control | Craniotomy |
| 2 | 36 | Male | Atlantoaxial
dislocation | Control | C1-3 |
| 3 | 25 | Female | Atlantoaxial
dislocation | Control | C1-3 |
| 4 | 19 | Female | Hemifacial
spasm | Control | Craniotomy |
| 5 | 13 | Male | Trauma | Control | T1-3 |
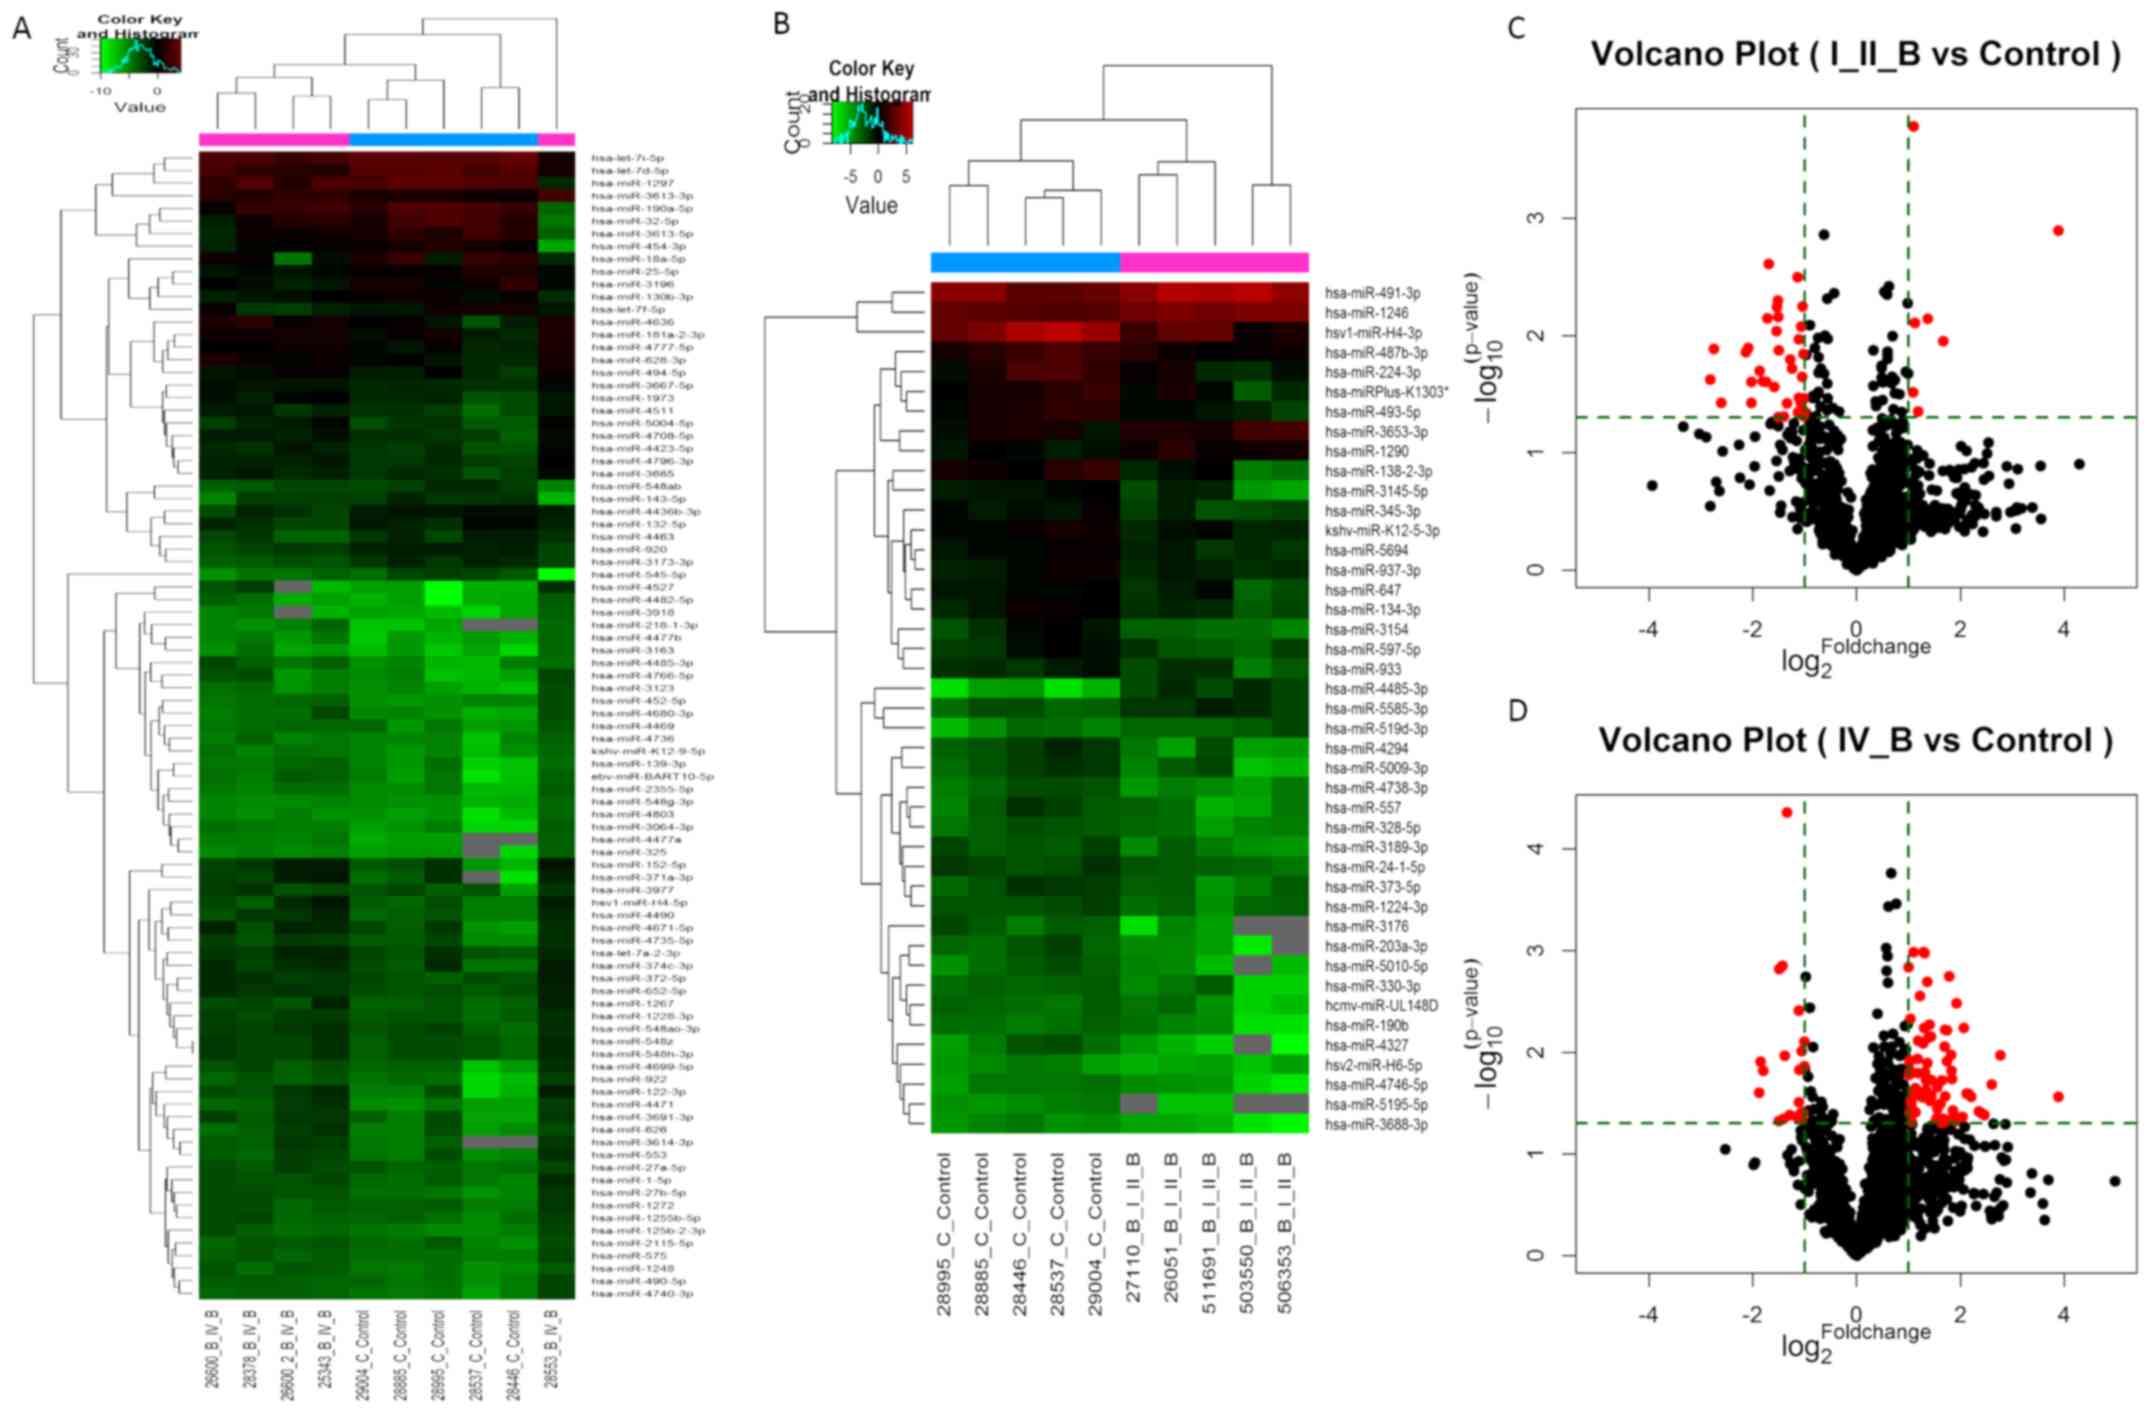
DEmiRNAs in the blood of patients with
SCG
Compared with the normal group, there were 156
upregulated miRNAs and 84 downregulated miRNAs (FC>2) in the
low-grade SCG group (Table SI).
Among these, seven upregulated miRNAs and 36 downregulated miRNAs
were statistically significant (P<0.05; Tables III and IV). In the high-grade group, 251
upregulated miRNAs and 35 downregulated miRNAs were identified
(FC>2). Of these, 70 upregulated and 20 downregulated miRNAs
were statistically significant (P<0.05, FC>2; Table SII). The number of DEmiRNAs in the
high-grade group was higher compared with the low-grade SCG group,
in terms of the expression profiles of miRNAs in the blood of the
tumor patients (Fig. 1A). The top 10
most upregulated and downregulated genes are listed in Tables V and VI.
| Table III.Upregulated miRNAs in the blood of
patients with low grade spinal cord glioma. |
Table III.
Upregulated miRNAs in the blood of
patients with low grade spinal cord glioma.
| Patient ID | miRNA | Fold change | P-value |
|---|
| 168870 | hsa-miR-1246 | 2.1296 | 0.0002c |
| 46808 |
hsa-miR-4485-3p | 14.7751 | 0.0013b |
| 168558 |
hsa-miR-5585-3p | 2.5819 | 0.0072b |
| 168568 | hsa-miR-1290 | 2.1757 | 0.0078b |
| 147701 | hsa-miR-491-3p | 3.1754 | 0.0111a |
| 46221 |
hsa-miR-519d-3p | 2.1241 | 0.0304a |
| 148377 |
hsa-miR-3653-3p | 2.2735 | 0.0446a |
| Table IV.Top 10 downregulated miRNAs in blood
of patients with low grade spinal cord glioma. |
Table IV.
Top 10 downregulated miRNAs in blood
of patients with low grade spinal cord glioma.
| Patient ID | miRNA | Fold change |
P-valuea |
|---|
| 146159 | hsv1-miR-H4-3p | 0.1415 | 0.0237 |
| 147707 | hsa-miR-3154 | 0.1485 | 0.0130 |
| 147796 | hsa-miR-4327 | 0.1643 | 0.0375 |
| 11004 |
hsa-miR-203a-3p | 0.2281 | 0.0138 |
| 148278 |
hsa-miR-138-2-3p | 0.2355 | 0.0128 |
| 146163 | hsa-miR-224-3p | 0.2454 | 0.0375 |
| 46567 | hsa-miR-3176 | 0.2456 | 0.0248 |
| 147627 | hsa-miR-4294 | 0.2740 | 0.0199 |
| 169013 |
hsa-miR-5195-5p | 0.2849 | 0.0245 |
| 168684 |
hsa-miR-5010-5p | 0.2985 | 0.0248 |
| Table V.Top 10 upregulated miRNAs in blood of
patients with high grade glioma. |
Table V.
Top 10 upregulated miRNAs in blood of
patients with high grade glioma.
| Patient ID | miRNA | Fold change |
P-valuea |
|---|
| 169006 | hsa-miR-4527 | 14.7266 | 0.0274a |
| 169029 | hsa-miR-4471 | 6.8163 | 0.0107a |
| 42551 | hsa-miR-122-3p | 6.0684 | 0.0207a |
| 169249 |
hsa-miR-4482-5p | 5.4977 | 0.0413a |
| 42941 |
hsa-miR-218-1-3p | 5.3011 | 0.0396a |
| 168860 |
hsa-miR-4766-5p | 5.1045 | 0.0381a |
| 146157 | hsv1-miR-H4-5p | 4.5925 | 0.0274a |
| 169223 |
hsa-miR-4680-3p | 4.4346 | 0.0256a |
| 46808 |
hsa-miR-4485-3p | 4.3325 | 0.0254a |
| 169369 | hsa-miR-4490 | 4.1875 | 0.0058b |
| Table VI.Top 10 downregulated miRNAs in blood
of patients with high grade glioma. |
Table VI.
Top 10 downregulated miRNAs in blood
of patients with high grade glioma.
| Patient ID | miRNA | Fold change |
P-valuea |
|---|
| 147195 | hsa-miR-18a-5p | 0.2722 | 0.0249a |
| 42956 | hsa-miR-545-5p | 0.2765 | 0.0123a |
| 147334 |
hsa-miR-3613-5p | 0.2877 | 0.0152a |
| 11053 | hsa-miR-32-5p | 0.3543 | 0.0472a |
| 147845 |
hsa-miR-3173-3p | 0.3550 | 0.0015b |
| 145968 | hsa-let-7d-5p | 0.3723 | 0.0014b |
| 147817 | hsa-miR-3196 | 0.3755 | 0.0450a |
| 148620 | hsa-miR-454-3p | 0.3825 | 0.0108a |
| 42932 | hsa-miR-920 | 0.3947 | 0.0000c |
| 17752 | hsa-let-7f-5p | 0.4082 | 0.0415a |
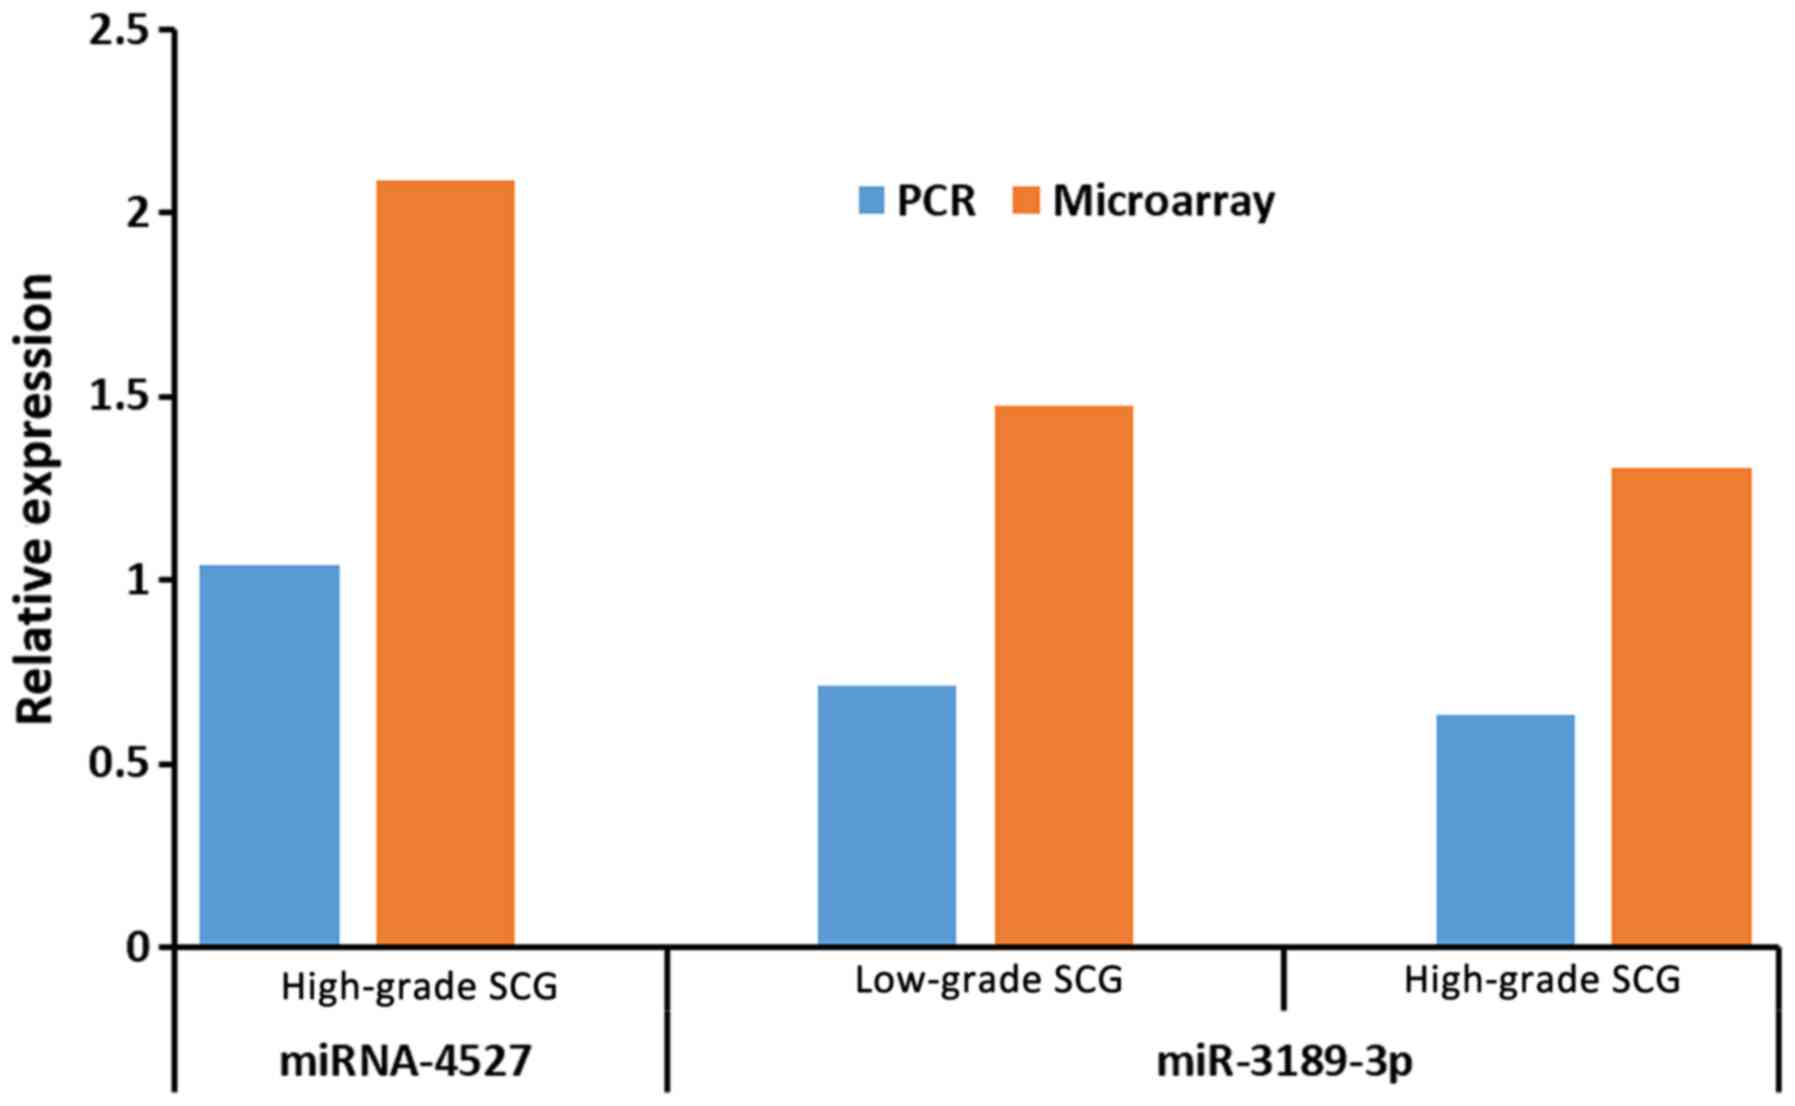
To validate the results of the microarray analysis,
two DEmiRNAs were randomly chosen for RT-qPCR; miR-3189-3p was
upregulated in both the low-grade and the high-grade group and
miR-4527 was upregulated in the high-grade group. The results
obtained from RT-qPCR were consistent with those of the microarray
analysis and showed statistical significance (P<0.05; Fig. 2). All of the data on dysregulated
expression of the DEmiRNAs identified are presented in Tables SI and SII.
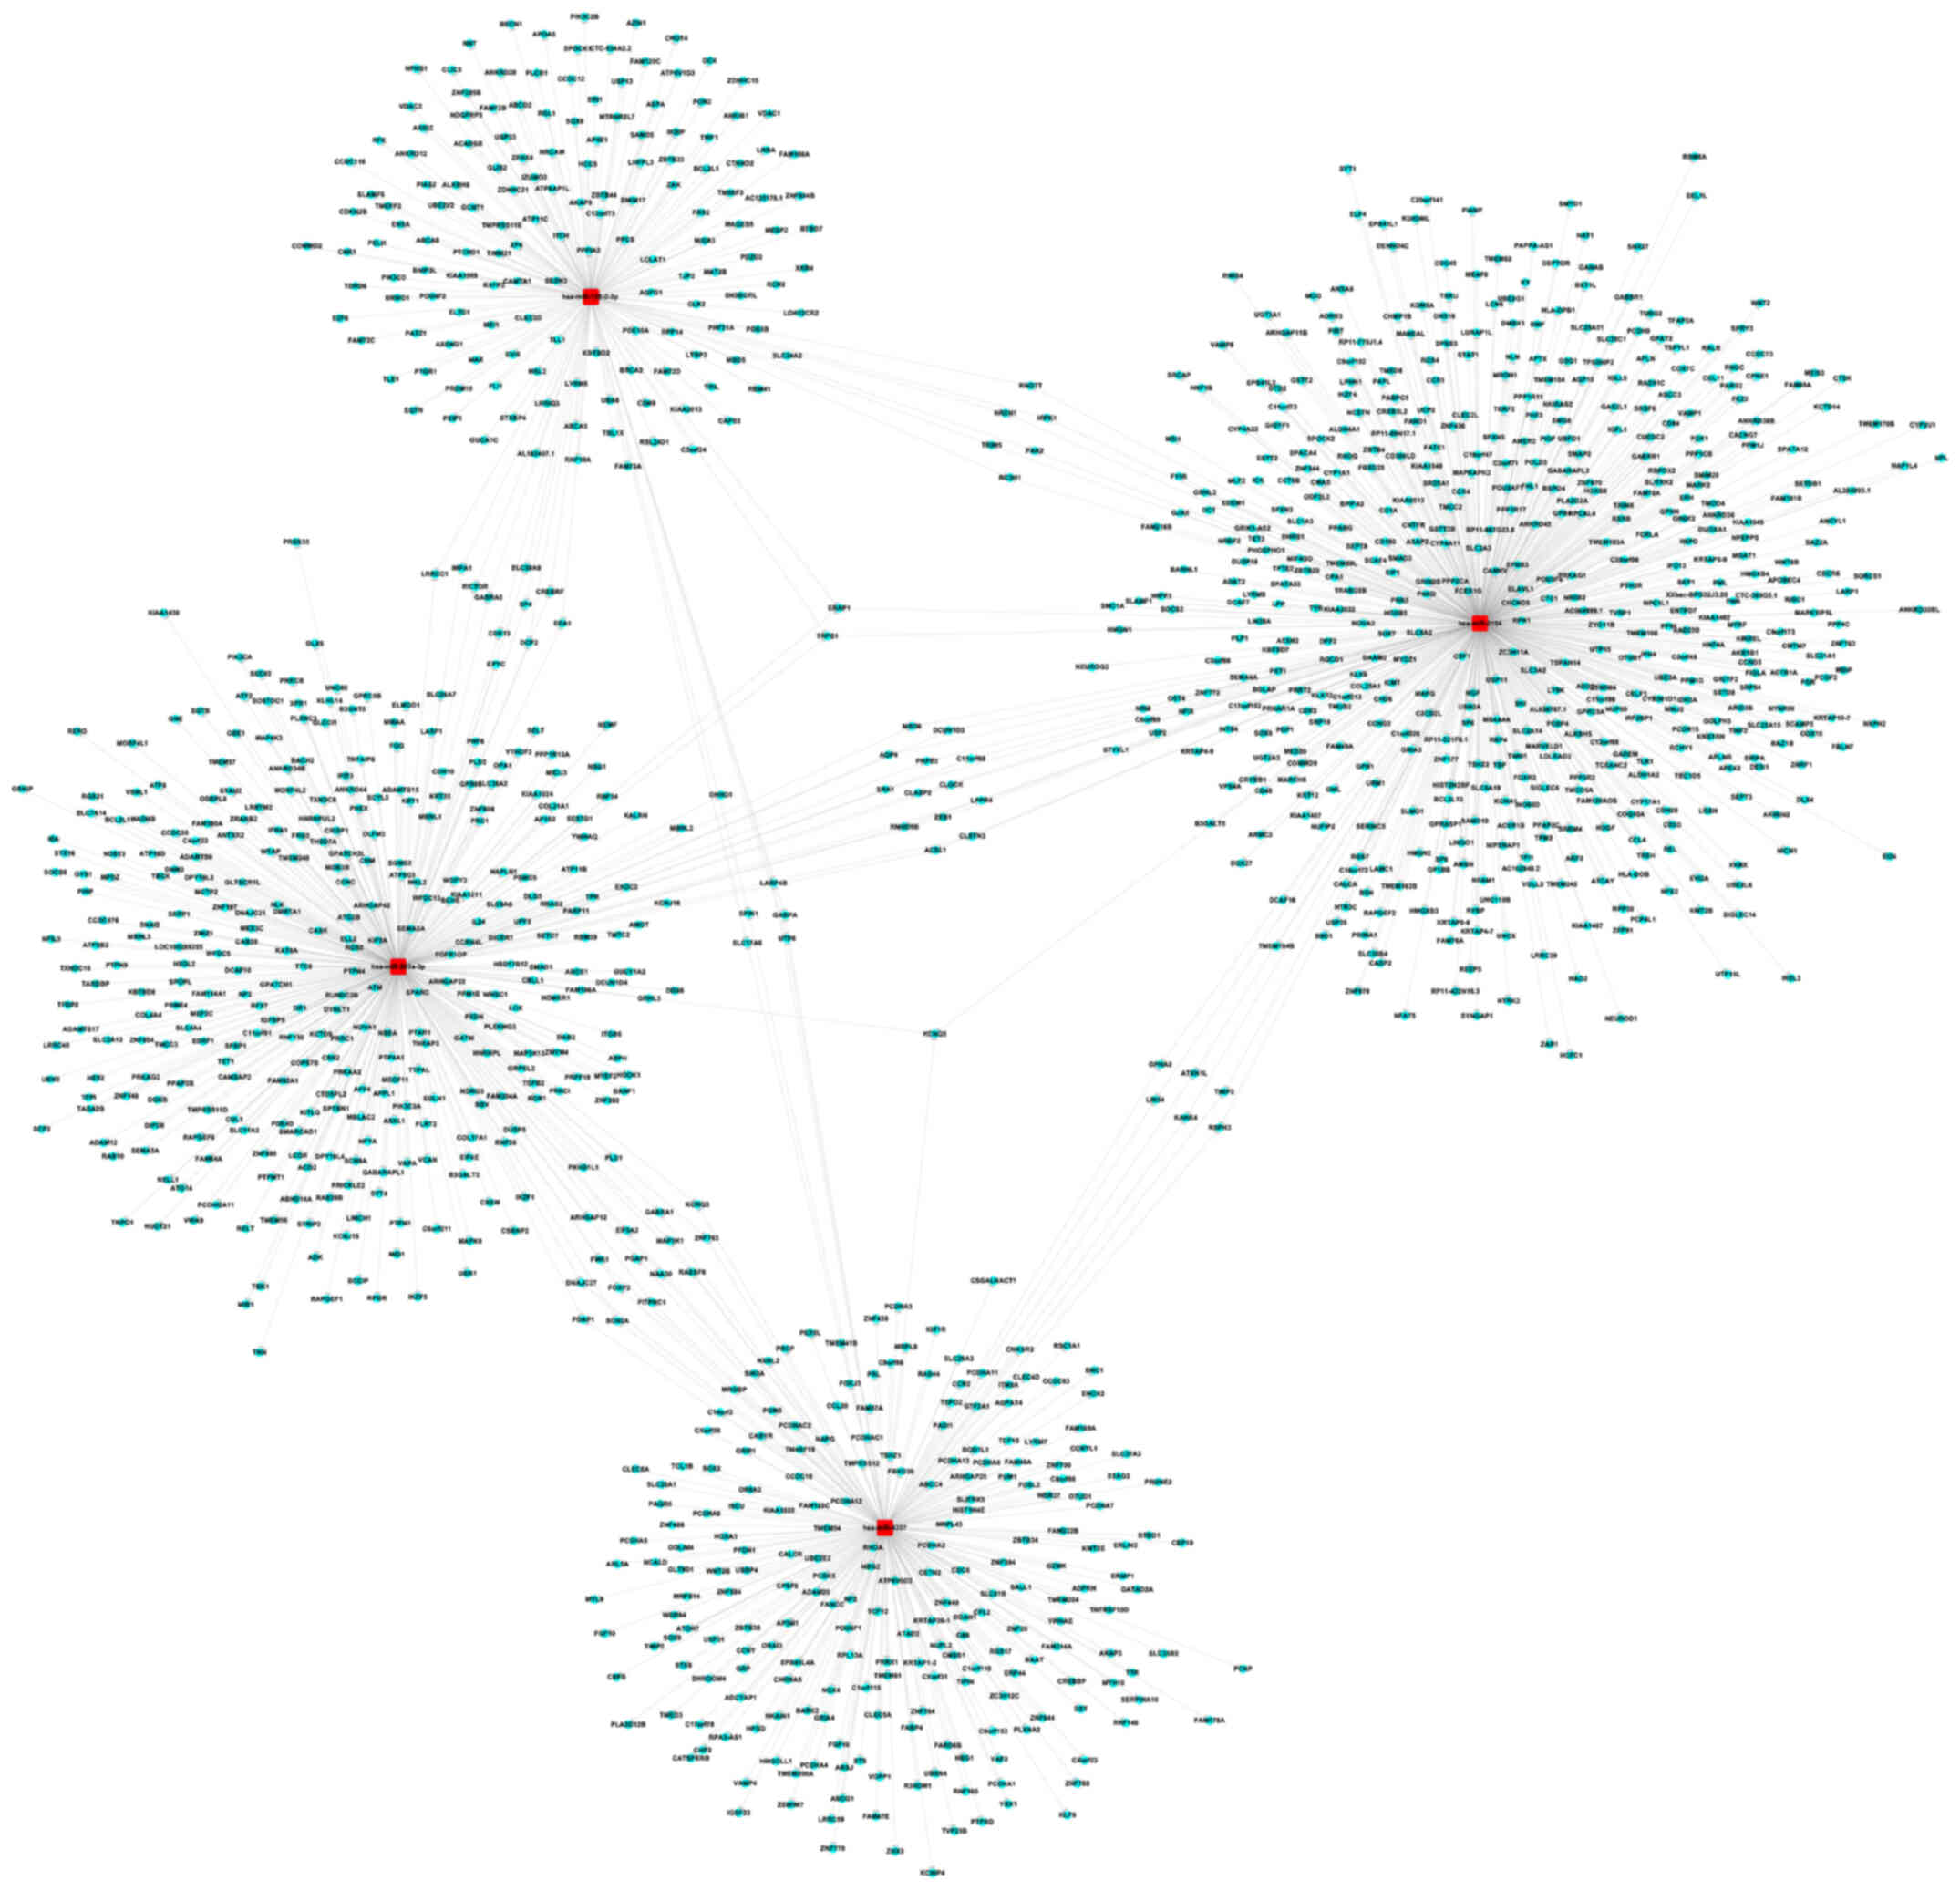
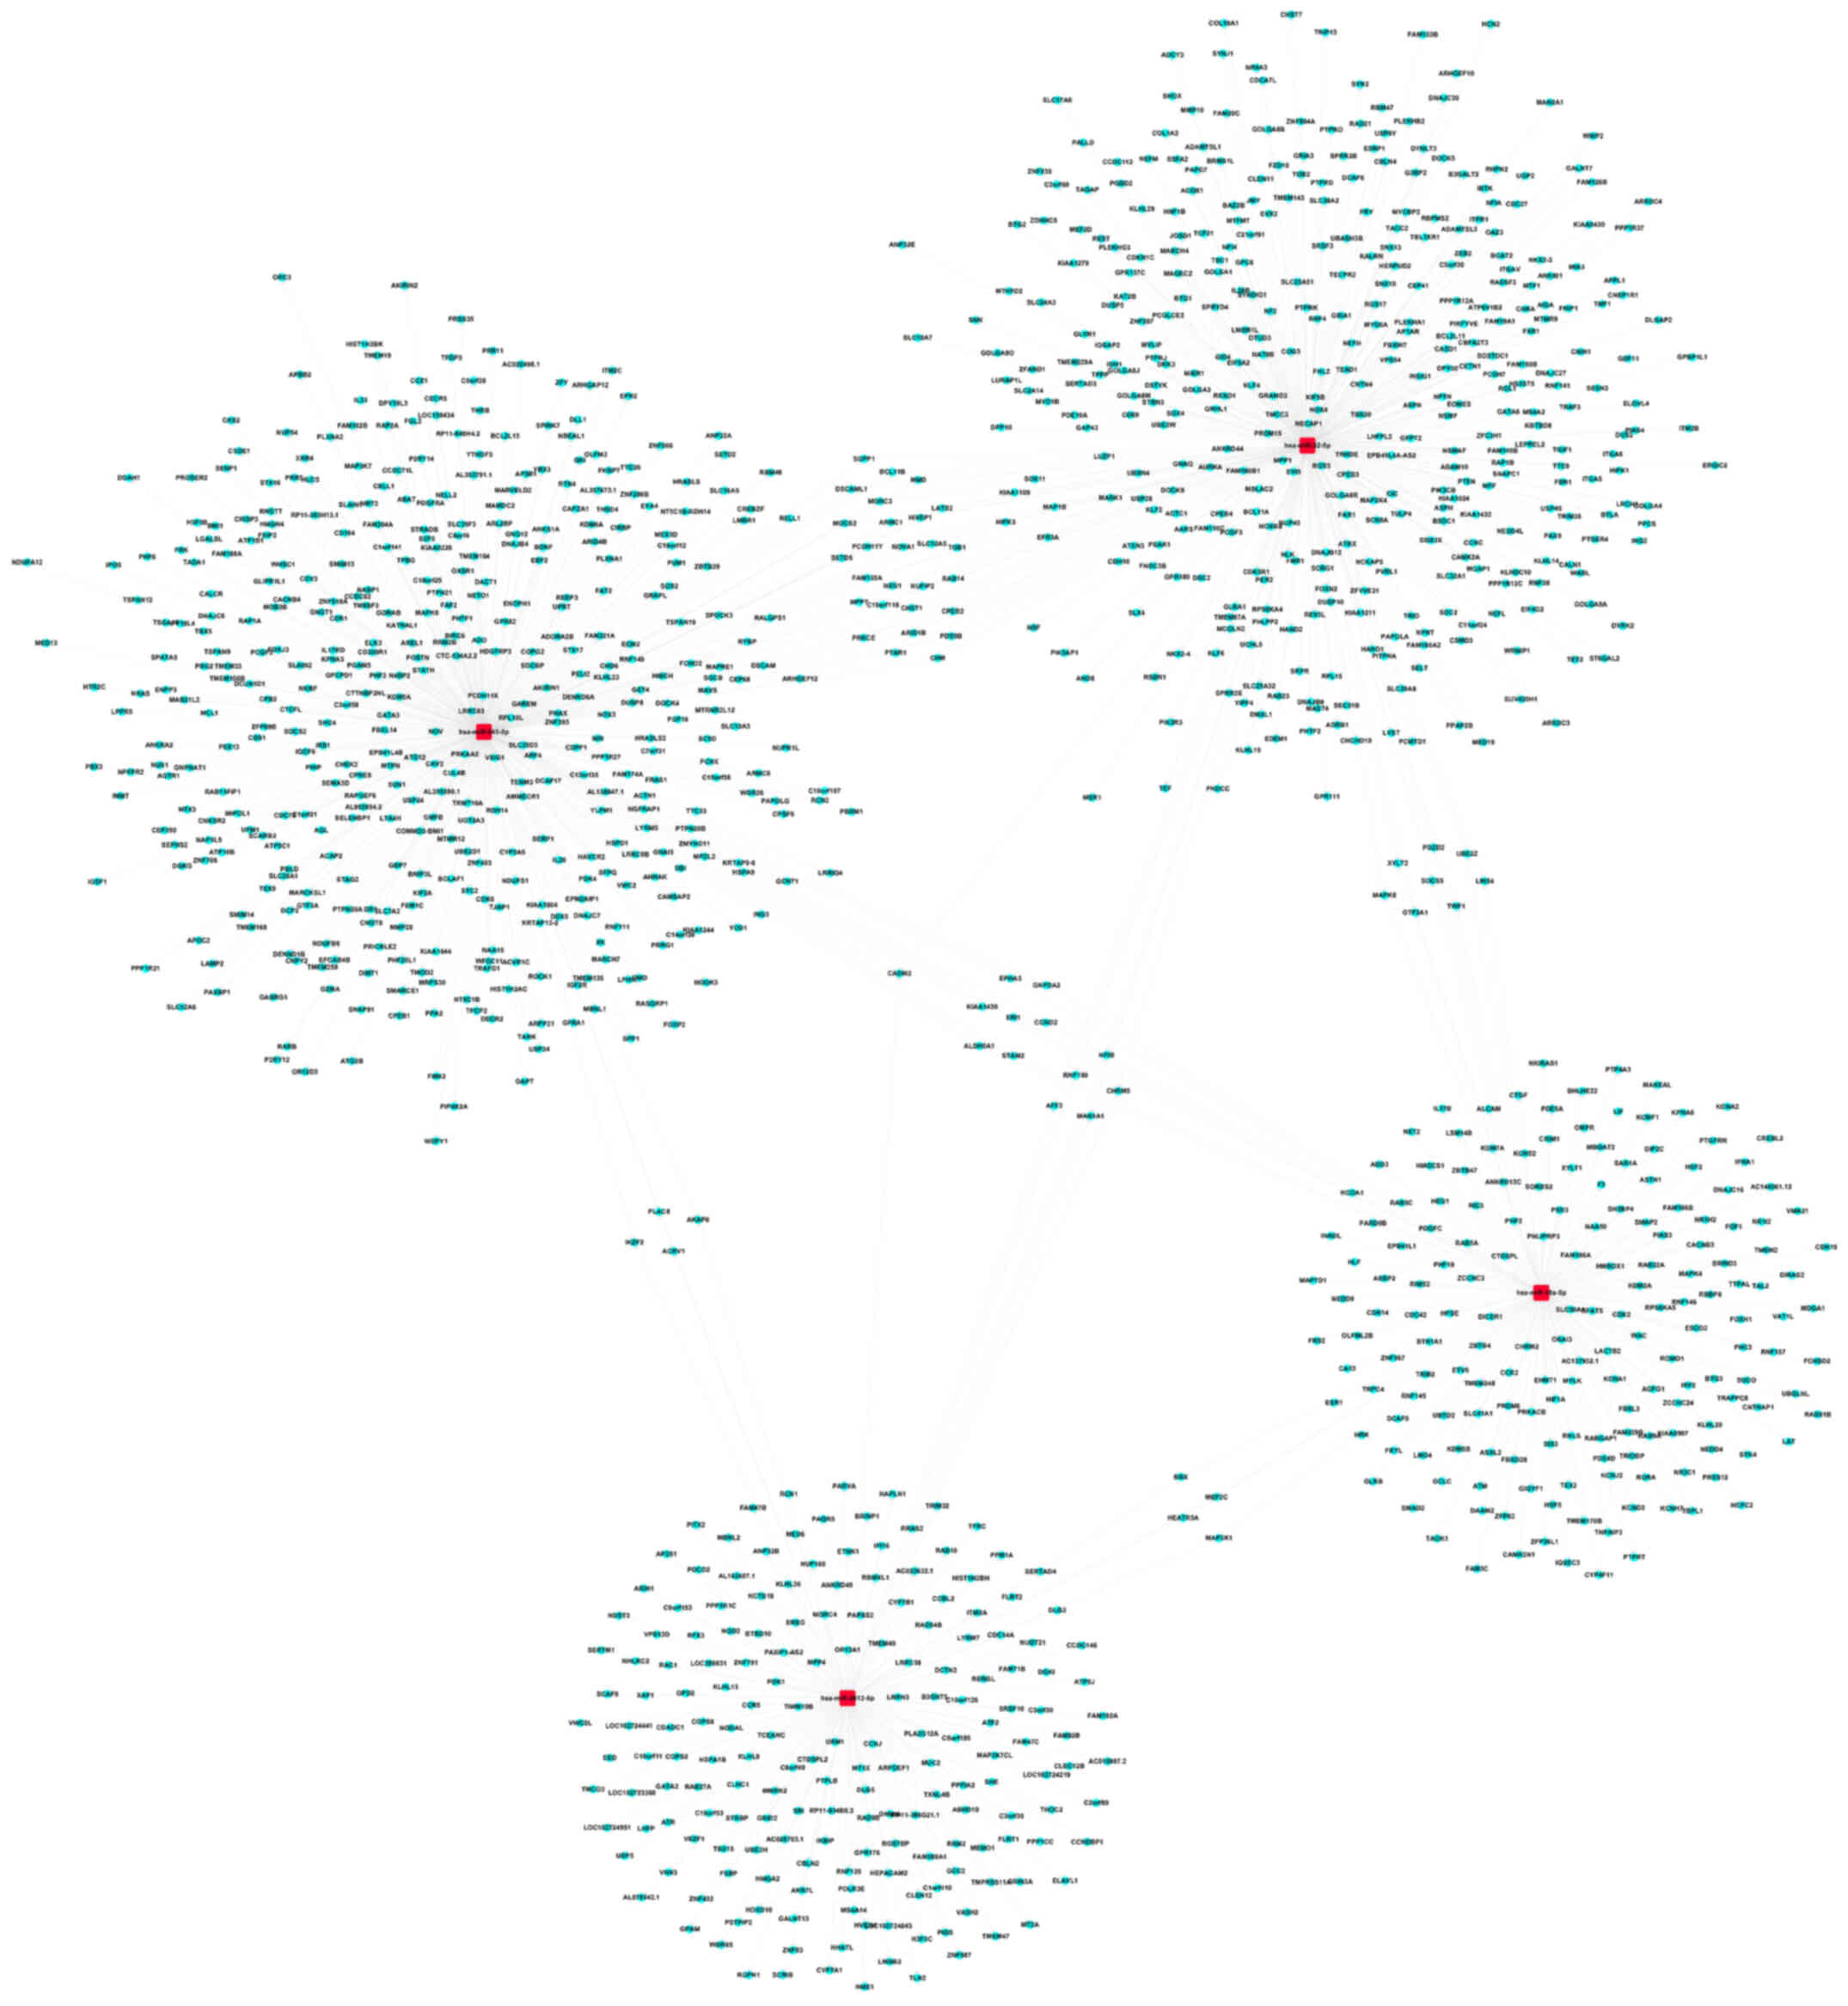
Target prediction for the DEmiRNAs in
the low-grade and high-grade groups
The top 18 and 20 miRNAs in the low-grade and
high-grade groups, respectively, were selected for prediction of
their target genes, based on the FC values for the DEmiRNAs. A
total of 348 and 728 target genes for the upregulated and
downregulated miRNAs, respectively in the low-grade group were
identified (Table SIII). In
addition, 772 and 1,731 target genes were predicted for the
upregulated and downregulated miRNAs, respectively, in the
high-grade group (Table SIV). The
network diagram of the 4 downregulated miRNAs associated with
spinal glioma development, and their target genes from the
low-grade (hsa-miR-3154, hsa-miR-4327, hsa-miR-203a-3p and
hsa-miR-138-2-3p) and high-grade (hsa-miR-18a-5p, hsa-miR-545-5p,
hsa-miR-3613-5p and hsa-miR-32-5p) blood sample groups are
presented in Figs. 3 and 4, respectively.
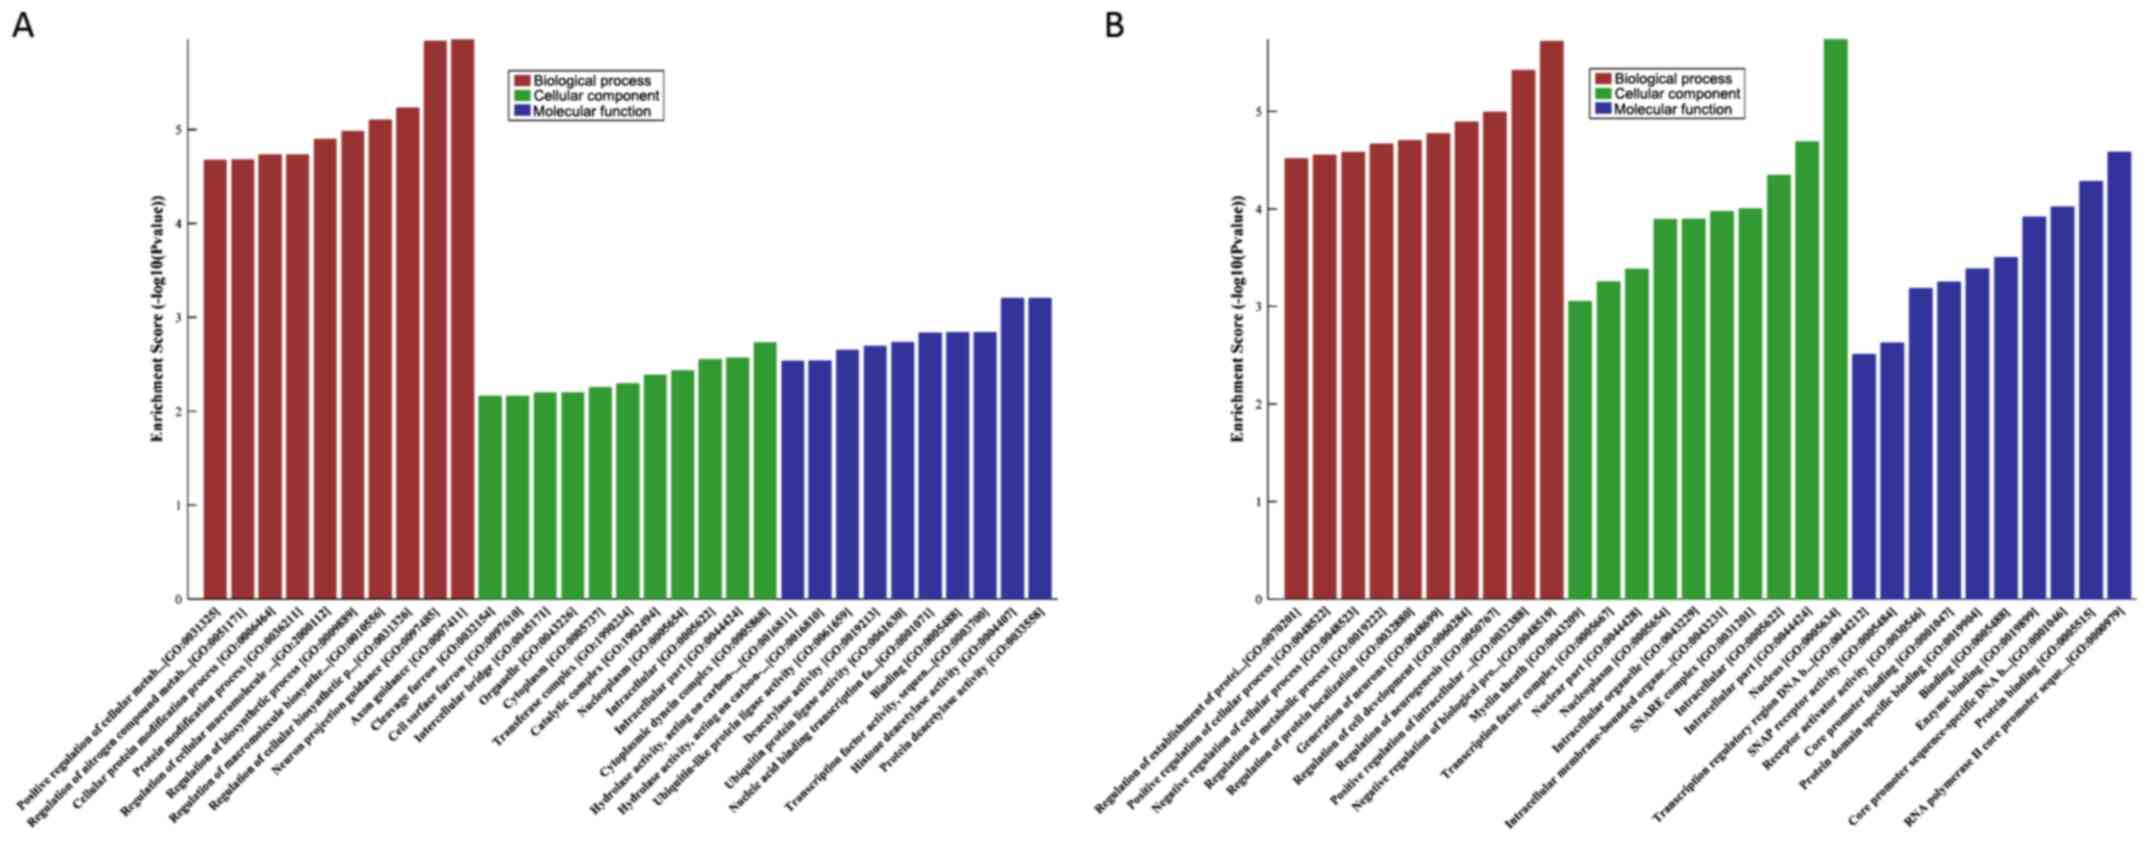
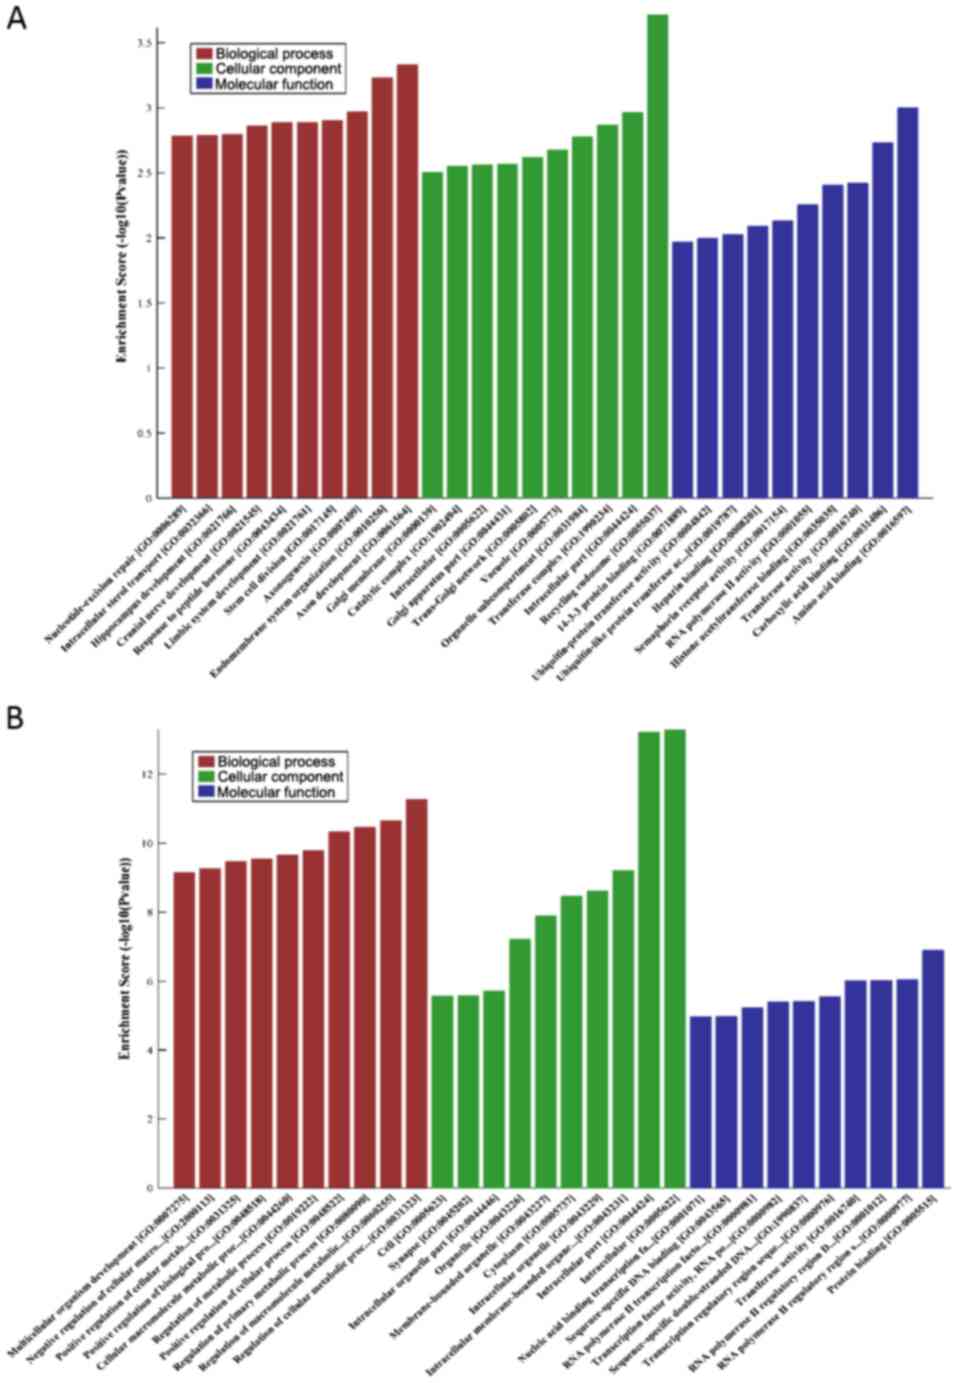
GO analysis of the DEmiRNAs in the
low-grade and high-grade groups
GO analysis of the differentially expressed genes
was performed. The results of the low-grade group showed that the
coding genes adjacent to the downregulated miRNAs were primarily
involved in the ‘negative regulation of biological process’ and
‘positive regulation of intracellular transport’, and the
upregulated miRNAs were primarily enriched in ‘axon guidance’ and
‘neuron projection guidance’. In addition, the most enriched GO
targets for the high-grade group were ‘regulation of cellular
metabolic process’ (downregulated) and ‘axon development’
(upregulated) (Figs. 5 and 6; Tables SV
and SVI).
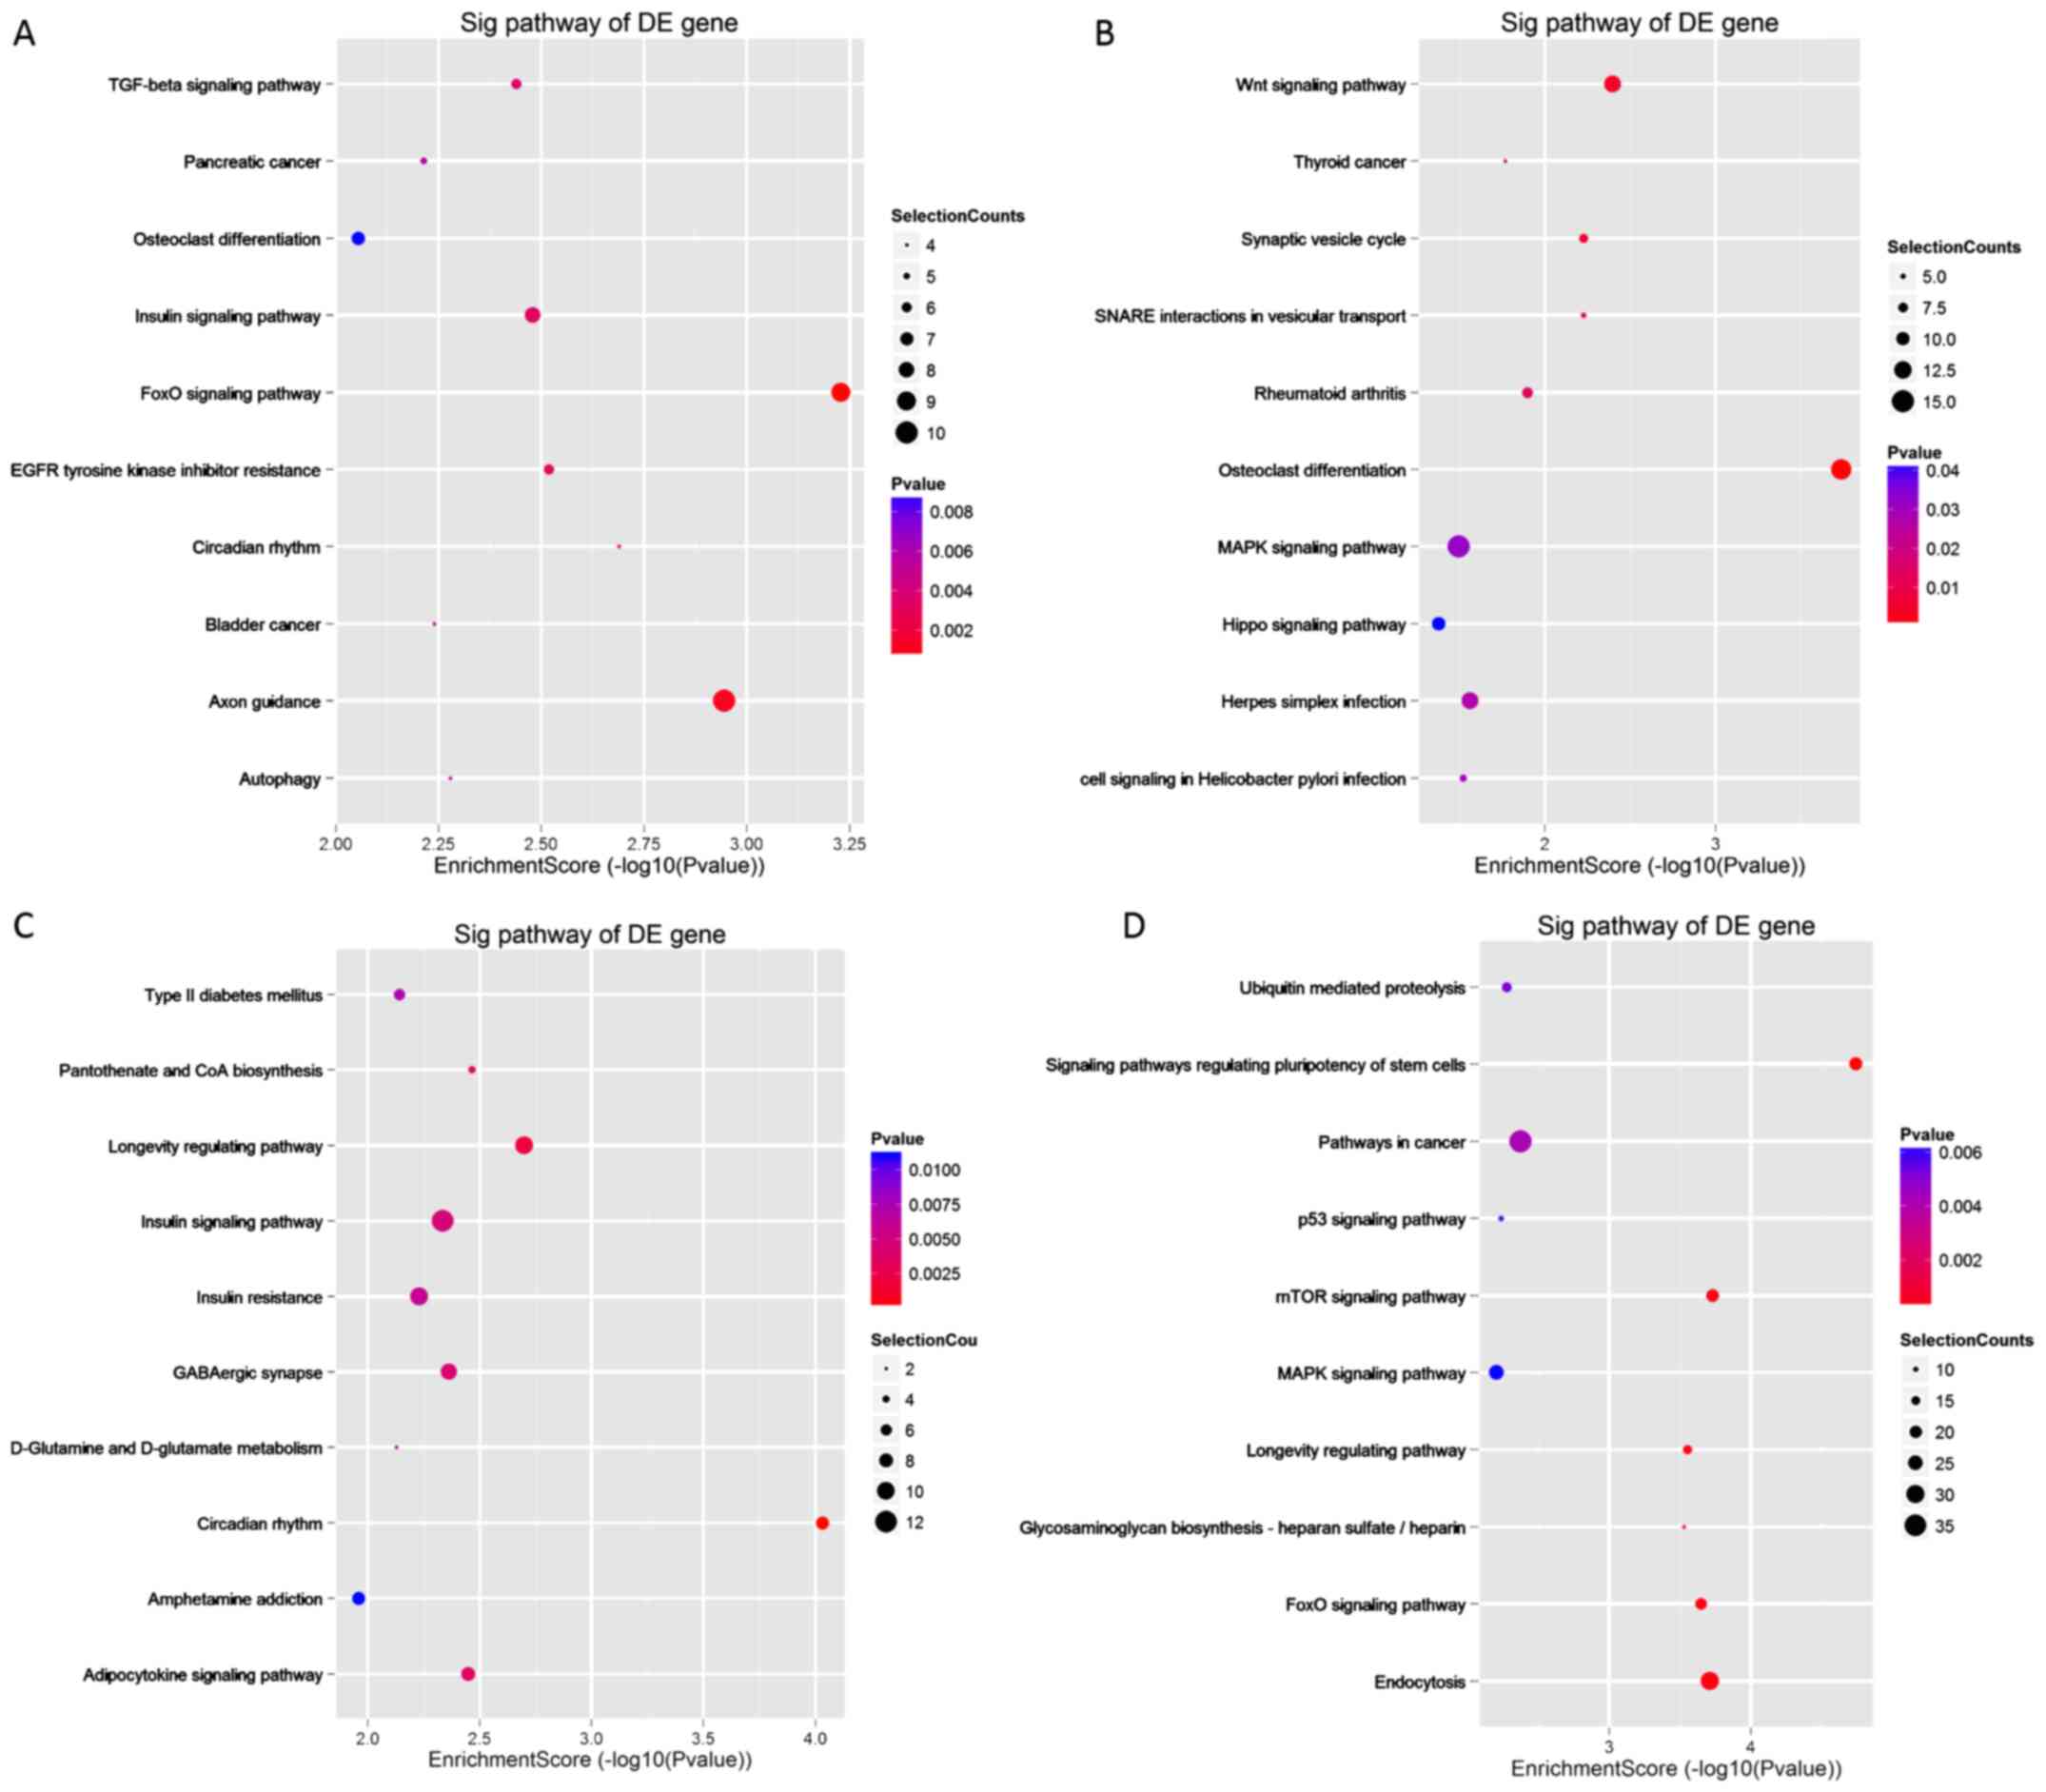
Pathway analysis of the DEmiRNAs in
the low-grade and high-grade groups
Based on the KEGG database, the significance levels
of the differentially expressed gene pathways were analyzed.
Results showed that the downregulated miRNAs in the low-grade group
were primarily involved in the ‘FoxO signaling pathway’, and the
upregulated genes were primarily involved in ‘Osteoclast
differentiation’ and the ‘Wnt signaling pathway’. Furthermore, the
differentially expressed genes in the high-grade group were
primarily involved in the ‘circadian rhythm’, ‘Longevity regulating
pathway’, ‘mTOR signaling pathway’ and ‘Signaling pathways
regulating pluripotency of stem cells’ (Fig. 7). The top 10 pathways in which the
DEmiRNAs were involved in are listed in descending order of the
enrichment factors in Fig. 7.
Similarities between identified
DEmiRNAs in the low-grade and high-grade groups
To examine the differences in miRNA expression
between the low-grade and high-grade groups, the DEmiRNA data for
both groups were compared, and DEmiRNAs that were present in both
groups were selected. A total of 27 upregulated miRNAs were present
in the blood samples of both groups. Among these, the expression
levels of 12 DEmiRNAs were higher in the low-grade group compared
with the high-grade group, whereas the other 15 DEmiRNAs were more
highly expressed in the high-grade group compared with the
low-grade group (P<0.05; Table
VII).
| Table VII.Co-expression of differentially
expressed miRNAs between blood samples from patients with low-grade
or high-grade spinal glioma. |
Table VII.
Co-expression of differentially
expressed miRNAs between blood samples from patients with low-grade
or high-grade spinal glioma.
| Patient ID | miRNA | Low grade, FC | High grade, FC |
|---|
| 42530 |
hsa-let-7a-2-3p | 3.250.967 | 2.010.692 |
| 42551 | hsa-miR-122-3p | 5.070.068 | 6.068.409 |
| 46633 | hsa-miR-1267 | 2.778.844 | 3.180.956 |
| 46363 | hsa-miR-1272 | 2.277.376 | 2.086.202 |
| 148536 | hsa-miR-1-5p | 2.235.554 | 3.068.592 |
| 146165 | hsa-miR-1973 | 2.203.796 | 2.687.838 |
| 148338 |
hsa-miR-3064-3p | 3.556.303 | 3.537.826 |
| 147651 | hsa-miR-3123 | 4.102.231 | 3.878.089 |
| 11058 | hsa-miR-325 | 4.038.391 | 2.888.924 |
| 11083 |
hsa-miR-371a-3p | 2.065.478 | 3.602.984 |
| 168768 |
hsa-miR-4423-5p | 22.859 | 2.520.848 |
| 169029 | hsa-miR-4471 | 1.165.354 | 6.816.256 |
| 169247 | hsa-miR-4477a | 8.457.066 | 3.624.097 |
| 168801 | hsa-miR-4477b | 8.578.137 | 3.521.554 |
| 46808 |
hsa-miR-4485-3p | 1.477.512 | 4.332.511 |
| 169369 | hsa-miR-4490 | 5.428.902 | 418.754 |
| 168917 | hsa-miR-4511 | 214.971 | 2.591.108 |
| 29379 | hsa-miR-452-5p | 2.131.956 | 3.120.335 |
| 169223 |
hsa-miR-4680-3p | 5.799.037 | 443.464 |
| 169335 |
hsa-miR-4699-5p | 2.611.289 | 325.914 |
| 168910 |
hsa-miR-4735-5p | 2.191.187 | 2.564.797 |
| 169048 | hsa-miR-4736 | 2.331.175 | 2.060.894 |
| 168860 |
hsa-miR-4766-5p | 4.579.327 | 5.104.469 |
| 169154 | hsa-miR-4803 | 2.315.542 | 2.705.104 |
| 168896 |
hsa-miR-548ao-3p | 2.169.132 | 2.038.673 |
| 17626 | hsa-miR-575 | 2.654.789 | 2.269.628 |
| 33407 | hsa-miR-626 | 3.676.464 | 3.089.695 |
Discussion
SCG is a tumor of the central nervous system with a
relatively low incidence, accounting for 10% of all types of tumor
of the entire spinal canal, with an annual incidence of
~0.22/100,000 in the USA (12). SCG
occurrence and development are thought to be the result of the
combined influence of genetic and environmental factors that are
regulated by multiple genes. With developments in the fields of
tumor molecular biology and molecular genetics, multiple molecular
changes, including abnormal expression and mutations in miRNAs,
have been discovered (13,14). These genetic changes may improve
early diagnosis of cancer and typing and prognosis of patients.
Therefore, the search for novel, sensitive and specific biomarkers
associated with development of SCG are important for early
diagnosis, prognostic evaluation and clinical treatment.
At present, a number of studies have focused on the
role and abnormal expression of miRNAs in the progression of
glioma, but there are fewer studies investigating specific miRNA
expression profiles (15,16). The expression of miRNAs in peripheral
blood has been associated with different types of tumor and tissue
specificity, which has allowed them to be used as a diagnostic
criterion (17). In the present
study, miRNA microarray technology was used to compare the
expression of miRNAs in the blood of patients with SCG with
patients with a benign tumor. The miRNA expression profiles for the
different grades of SCG were screened to identify differentially
expressed miRNAs which may serve a role in the development of SCG,
and thus may serve as biomarkers for specific stages of SCG.
In the present study, 43 and 90 miRNAs were
abnormally expressed in the low-grade and high-grade groups,
respectively, compared with the matched control group. Certain
miRNAs were not abnormally expressed in the low-grade group, but
were abnormally expressed in the high-grade group, and these miRNAs
may be closely associated with malignant progression of SCG and may
serve as useful biomarkers to aid in diagnosis and prognosis of
patients. Additionally, whilst the majority of the abnormally
expressed miRNAs identified in the low-grade and high-grade groups
were different, 27 DEmiRNAs were observed in both groups.
Therefore, it is hypothesized that these miRNAs may be involved in
the pathogenesis of SCG and their specific mechanism of action will
be the focus of future studies.
As an mRNA may be regulated by multiple miRNAs, and
one miRNA may regulate multiple mRNAs (18), differentially expressed miRNAs from
the low-grade and high-grade groups were selected to construct the
miRNA-mRNA networks, enabling further investigation of potential
associations at the mRNA and protein levels. Pathway knowledge can
provide disease marker information crucial for diagnosis, drug
choice and patient treatment (19).
The GO and KEGG analysis of the target genes revealed that the
target genes of these miRNAs were enriched in processes and
signaling pathways associated with the nervous system and tumors.
KEGG signaling pathway analysis revealed a number of target genes
enriched in tumor-related signaling pathways, such as the FoxO,
MAPK and Wnt signaling pathways. Abnormal activation of the Wnt
signaling pathway is a ubiquitous change observed in numerous
different types of cancer, including gliomas, and it affects the
proliferation and invasion of glioma cells (20,21).
Abnormalities in the MAPK signaling pathway serves a role in the
invasion and metastasis of glioma cells and in the maintenance of
biological processes, such as the dryness of glioma stem cells
(22–25).
The DEmiRNAs investigated in the present study, some
of which have been reported in previous studies, regulate the
expression of protein-coding genes and affect several biological
functions, serving a role in the occurrence and development of
diseases. Studies have shown that miR-1246 may be involved in the
development of autoimmune diseases and acts as a transfer messenger
that leads to DNA damage by directly inhibiting the ligase 4 gene
(26,27). The plasma expression levels of
miR-1246 has been used as a diagnostic biomarker for hepatocellular
carcinoma (28,29), and miR-1246 regulates the progression
of breast and prostate cancer, highlighting the potential of
miR-1246 in miRNA-based therapies (30,31). In
the present study, the expression levels of hsa-miR-1246 were
significantly higher in the low-grade group compared with the
control group, demonstrating that hsa-miR-1246 expression levels
are dysregulated in SCG and therefore highlighting hsa-miR-1246 as
a potential target for treatment of SCG.
Several abnormally expressed miRNA molecules
identified in the present study have not been reported in previous
studies. In the present study, it was shown that miR-4680 was
abnormally expressed in SCG, with high expression levels in both
the low-grade and high-grade groups for the first time, to the best
of our knowledge. Using TargetScan version 7.1, 137 potential
target genes associated with miR-4680 were identified. A total of
348 target genes, based on miR-4680 were associated with gliomas,
such as cyclin-dependent kinase 6 (CDK6) which is involved in
survival of glioma cells (32).
Following small interfering RNA mediated downregulation of CDK6
expression levels, tumor cells were arrested in the G1/S phase and
cell proliferation was inhibited (32). These newly discovered and aberrantly
expressed miRNAs may provide insight into the mechanisms underlying
the development of SCG, and their role in SCG progression requires
further investigation.
In conclusion, the present study compared DEmiRNAs
in low-grade and high-grade groups with the control group and
identified several miRNAs which may serve a role in the progression
of SCG. These identified miRNAs may serve as novel biomarkers or
molecular targets for clinical diagnosis and treatment of patients
with SCG.
Supplementary Material
Supporting Data
Acknowledgements
Not applicable.
Funding
The present study was funded by The National Natural
Science Foundation of China (grant no. NSFC81774171), The Tangshan
Science and Technology Innovation Team Training Program (grant nos.
18130219A and 19130201C) and The Collaborative innovation project
of Chaoyang District in Beijing (grant no. CYXC1719).
Availability of data and materials
The datasets used and/or analyzed during the present
study are available from the corresponding authors upon reasonable
request.
Authors’ contributions
GJJ and TF designed the experiments. TA analyzed and
interpreted the data. JL, XQZ, YXW, QSY, YFL and TA performed the
experiments. CYC, CL, YQW, MHM and BHL interpreted the data. All
authors have read and approved the final manuscript.
Ethics approval and consent to
participate
The present study was approved and supervised by The
Ethics Committees of Beijing University of Chinese Medicine and
Sanbo Brain Hospital, Capital Medical University (Beijing, China).
Written informed consent was obtained from all patients prior to
the study start.
Patient consent for publication
Not applicable.
Competing interests
The authors declare that they have no competing
interests.
Glossary
Abbreviations
Abbreviations:
|
miRNA
|
microRNA
|
|
SCG
|
spinal cord gliomas
|
|
GBM
|
glioblastoma
|
|
DEmiRNAs
|
differentially expressed miRNAs
|
|
DEgenes
|
differentially expressed genes
|
|
GO
|
gene ontology
|
|
BP
|
biological processes
|
|
KEGG
|
Kyoto Encyclopedia of Genes and
Genomes
|
|
CDK6
|
cyclin-dependent kinase 6
|
|
FC
|
Fold change
|
References
|
1
|
Louis DN, Perry A, Reifenberger G, von
Deimling A, Figarella-Branger D, Cavenee WK, Ohgaki H, Wiestler OD,
Kleihues P and Ellison DW: The 2016 World Health Organization
classification of tumors of the central nervous system: A summary.
Acta Neuropathol. 131:803–820. 2016. View Article : Google Scholar : PubMed/NCBI
|
|
2
|
Appin CL and Brat DJ: Molecular pathways
in gliomagenesis and their relevance to neuropathologic diagnosis.
Adv Anat Pathol. 22:50–58. 2015. View Article : Google Scholar : PubMed/NCBI
|
|
3
|
Tanaka S, Louis DN, Curry WT, Batchelor TT
and Dietrich J: Diagnostic and therapeutic avenues for
glioblastoma: No longer a dead end? Nat Rev Clin Oncol. 10:142013.
View Article : Google Scholar : PubMed/NCBI
|
|
4
|
Kalpathy-Cramer J, Gerstner ER, Emblem KE,
Andronesi O and Rosen B: Advanced magnetic resonance imaging of the
physical processes in human glioblastoma. Cancer Res. 74:4622–4637.
2014. View Article : Google Scholar : PubMed/NCBI
|
|
5
|
Dlouhá D and Hubáček JA: Regulatory RNAs
and cardiovascular disease-with a special focus on circulating
microRNAs. Physiol Res. 66 (Suppl 1):S21–S38. 2017. View Article : Google Scholar : PubMed/NCBI
|
|
6
|
Gregory RI and Shiekhattar R: MicroRNA
biogenesis and cancer. Cancer Res. 65:3509–3512. 2005. View Article : Google Scholar : PubMed/NCBI
|
|
7
|
Xu HS, Zong HL, Shang M, Ming X, Zhao JP,
Ma C and Cao L: MiR-324-5p inhibits proliferation of glioma by
target regulation of GLI1. Eur Rev Med Pharmacol Sci. 18:828–832.
2014.PubMed/NCBI
|
|
8
|
Duan R, Han L, Wang Q, Wei J, Chen L,
Zhang J, Kang C and Wang L: HOXA13 is a potential GBM diagnostic
marker and promotes glioma invasion by activating the Wnt and TGF-β
pathways. Oncotarget. 6:27778–27793. 2015. View Article : Google Scholar : PubMed/NCBI
|
|
9
|
Cui R, Guan Y, Sun C, Chen L, Bao Y, Li G,
Qiu B, Meng X, Pang C and Wang Y: A tumor-suppressive microRNA,
miR-504, inhibits cell proliferation and promotes apoptosis by
targeting FOXP1 in human glioma. Cancer Lett. 374:1–11. 2016.
View Article : Google Scholar : PubMed/NCBI
|
|
10
|
Gu Y, Zhang Z, Yin J, Ye J, Song Y, Liu H,
Xiong Y, Lu M, Zheng G and He Z: Epigenetic silencing of miR-493
increases the resistance to cisplatin in lung cancer by targeting
tongue cancer resistance-related protein 1(TCRP1). J Exp Clin
Cancer Res. 36:1142017. View Article : Google Scholar : PubMed/NCBI
|
|
11
|
Mo FF, An T, Zhang ZJ, Liu YF, Liu HX, Pan
YY, Miao JN, Zhao DD, Yang XY, Zhang DW, et al: Jiang Tang Xiao Ke
Granule Play an anti-diabetic role in diabetic mice pancreatic
tissue by regulating the mRNAs and MicroRNAs associated with
PI3K-Akt signaling pathway. Front Pharmacol. 8:7952017. View Article : Google Scholar : PubMed/NCBI
|
|
12
|
Milano MT, Johnson MD, Sul J, Mohile NA,
Korones DN, Okunieff P and Walter KA: Primary spinal cord glioma: A
surveillance, epidemiology, and end results database study. J
Neurooncol. 98:83–92. 2010. View Article : Google Scholar : PubMed/NCBI
|
|
13
|
Jansen M, Yip S and Louis DN: Molecular
pathology in adult gliomas: Diagnostic, prognostic, and predictive
markers. Lancet Neurol. 9:717–726. 2010. View Article : Google Scholar : PubMed/NCBI
|
|
14
|
Riddick G and Fine HA: Integration and
analysis of genome-scale data from gliomas. Nat Rev Neurol.
7:439–450. 2011. View Article : Google Scholar : PubMed/NCBI
|
|
15
|
Schratt GM, Tuebing F, Nigh EA, Kane CG,
Sabatini ME, Kiebler M and Greenberg ME: A brain-specific microRNA
regulates dendritic spine development. Nature. 439:283–289. 2006.
View Article : Google Scholar : PubMed/NCBI
|
|
16
|
Davis-Dusenbery BN and Hata A: MicroRNA in
cancer: The involvement of aberrant MicroRNA biogenesis regulatory
pathways. Genes Cancer. 1:1100–1114. 2010. View Article : Google Scholar : PubMed/NCBI
|
|
17
|
Molina-Pinelo S, Suárez R, Pastor MD,
Nogal A, Márquez-Martín E, Martín-Juan J, Carnero A and Paz-Ares L:
Association between the miRNA signatures in plasma and
bronchoalveolar fluid in respiratory pathologies. Dis Markers.
32:221–230. 2012. View Article : Google Scholar : PubMed/NCBI
|
|
18
|
Sud N, Zhang H, Pan K, Cheng X, Cui J and
Su Q: Aberrant expression of microRNA induced by high-fructose
diet: Implications in the pathogenesis of hyperlipidemia and
hepatic insulin resistance. J Nutr Biochem. 43:125–131. 2017.
View Article : Google Scholar : PubMed/NCBI
|
|
19
|
Jiang G, Ma Y, An T, Pan Y, Mo F, Zhao D,
Liu Y, Miao JN, Gu YJ, Wang Y and Gao SH: Relationships of circular
RNA with diabetes and depression. Sci Rep. 7:72852017. View Article : Google Scholar : PubMed/NCBI
|
|
20
|
Wang K, Wang X, Zou J, Zhang A, Wan Y, Pu
P, Song Z, Qian C, Chen Y, Yang S and Wang Y: miR-92b controls
glioma proliferation and invasion through regulating
Wnt/beta-catenin signaling via Nemo-like kinase. Neuro Oncol.
15:578–588. 2013. View Article : Google Scholar : PubMed/NCBI
|
|
21
|
Zhang H, Qi Y, Geng D, Shi Y, Wang X, Yu R
and Zhou X: Expression profile and clinical significance of Wnt
signaling in human gliomas. Oncol Lett. 15:6102018.PubMed/NCBI
|
|
22
|
Guo G, Yao W, Zhang Q and Bo Y: Oleanolic
acid suppresses migration and invasion of malignant glioma cells by
inactivating MAPK/ERK signaling pathway. PLoS One. 8:e720792013.
View Article : Google Scholar : PubMed/NCBI
|
|
23
|
Dong L, Qi N, Ge RM, Cao CL, Lan F and
Shen L: Overexpression of CD133 promotes the phosphorylation of Erk
in U87MG human glioblastoma cells. Neurosci Lett. 484:210–214.
2010. View Article : Google Scholar : PubMed/NCBI
|
|
24
|
Wang BQ, Yang B, Yang HC, Wang JY, Hu S,
Gao YS and Bu XY: MicroRNA-499a decelerates glioma cell
proliferation while accelerating apoptosis through the suppression
of Notch1 and the MAPK signaling pathway. Brain Res Bull.
142:96–106. 2018. View Article : Google Scholar : PubMed/NCBI
|
|
25
|
Wang R, Deng D, Shao N, Xu Y, Xue L, Peng
Y, Liu Y and Zhi F: Evodiamine activates cellular apoptosis through
suppressing PI3K/AKT and activating MAPK in glioma. Onco Targets
Ther. 11:1183–1192. 2018. View Article : Google Scholar : PubMed/NCBI
|
|
26
|
Ishibe Y, Kusaoi M, Murayama G, Nemoto T,
Kon T, Ogasawara M, Kempe K, Yamaji K and Tamura N: Changes in the
expression of circulating microRNAs in systemic lupus erythematosus
patient blood plasma after passing through a plasma adsorption
membrane. Ther Apher Dial. 22:278–289. 2018. View Article : Google Scholar : PubMed/NCBI
|
|
27
|
Mo LJ, Song M, Huang QH, Guan H, Liu XD,
Xie DF, Huang B, Huang RX and Zhou PK: Exosome-packaged miR-1246
contributes to bystander DNA damage by targeting LIG4. Br J Cancer.
119:492–502. 2018. View Article : Google Scholar : PubMed/NCBI
|
|
28
|
Moshiri F, Salvi A, Gramantieri L,
Sangiovanni A, Guerriero P, De Petro G, Bassi C, Lupini L, Sattari
A, Cheung D, et al: Circulating miR-106b-3p, miR-101-3p and
miR-1246 as diagnostic biomarkers of hepatocellular carcinoma.
Oncotarget. 9:15350–15364. 2018. View Article : Google Scholar : PubMed/NCBI
|
|
29
|
Wang Y, Zhang C, Zhang P, Guo G, Jiang T,
Zhao X, Jiang J, Huang X, Tong H and Tian Y: Serum exosomal
microRNAs combined with alpha-fetoprotein as diagnostic markers of
hepatocellular carcinoma. Cancer Med. 7:1670–1679. 2018. View Article : Google Scholar : PubMed/NCBI
|
|
30
|
Bhagirath D, Yang TL, Bucay N, Sekhon K,
Majid S, Shahryari V, Dahiya R, Tanaka Y and Saini S: MicroRNA-1246
is an exosomal biomarker for aggressive prostate cancer. Cancer
Res. 78:1833–1844. 2018. View Article : Google Scholar : PubMed/NCBI
|
|
31
|
Li XJ, Ren ZJ, Tang JH and Yu Q: Exosomal
MicroRNA MiR-1246 promotes cell proliferation, invasion and drug
resistance by targeting CCNG2 in breast cancer. Cell Physiol
Biochem. 44:1741–1748. 2017. View Article : Google Scholar : PubMed/NCBI
|
|
32
|
Chen SM, Chen HC, Chen SJ, Huang CY, Chen
PY, Wu TW, Feng LY, Tsai HC, Lui TN, Hsueh C and Wei KC:
MicroRNA-495 inhibits proliferation of glioblastoma multiforme
cells by downregulating cyclin-dependent kinase 6. World J Surg
Oncol. 11:872013. View Article : Google Scholar : PubMed/NCBI
|