Introduction
Molecular targeted therapy is considered a novel
treatment method following surgery, radiotherapy and chemotherapy
(1). Molecular targeted drugs, such
as gefitinib (2), lapatinib
(3), pazopanib (4), have been successfully applied for the
treatment of lung, breast and colon cancers. However, there is
currently a lack of effective targeted drugs for esophageal cancer.
Thus, further studies are required to understand the tumorigenesis
and identify therapeutic targets for esophageal cancer.
Huntingtin interacting protein 1 (HIP1) is a protein
associated with Huntington's disease (5). HIP1, as an endocytic oncoprotein,
participates in clathrin-mediated vesicle trafficking (6,7).
Previous studies have demonstrated the involvement of HIP1 in
tumorigenesis (8,9). For example, Marghalani et al
(10) demonstrated that HIP1
contributes to the pathological diagnosis of Merkel cell carcinoma.
Furthermore, Rao et al (11)
reported that HIP1 is overexpressed in prostate and colon cancers,
whereby its high expression levels promote cancer cell survival.
Thus, it was hypothesized that HIP1 may be a novel oncogene in
malignant tumor. However, the role of HIP1 in esophageal squamous
cell carcinoma (ESCC) remains unclear. Thus, the present study
aimed to investigate HIP1 expression in 173 ESCC tissues via
immunohistochemical staining. In addition, the association between
HIP1 expression and the clinicopathological characteristics of
patients with ESCC was statistically analyzed. HIP1 was
overexpressed and downregulated in ESCC cell lines, and its
biological functions were investigated in vitro.
The results of the present study demonstrated that
HIP1 expression was higher in ESCC tissues compared with adjacent
normal tissues. Furthermore, high HIP1 expression was associated
with promoting ESCC metastasis, while low HIP1 expression inhibited
ESCC metastasis. Taken together, these results suggest that HIP1
may be a marker to predict the metastasis of patients with
ESCC.
Materials and methods
Patients and tissue samples
A total of 178 paraffin-embedded ESCC tissues were
randomly selected from the biological sample bank at the Department
of Thoracic Surgery, Second Affiliated Hospital of Air Force
Medical University (Xi'an, China), between December 2006 and
February 2013. Patients who received preoperative chemotherapy,
radiotherapy or other treatments were excluded from the present
study. Among the 178 patients, 173 patients were confirmed ESCC
(97.2%), and five patients were confirmed esophagus adeno cancer
(EAC; 2.8%). Considering the small number of specimens, patients
with EAC were also excluded from the present study. Among 173
patients, there were 139 men and 34 women (median age, 60 years;
age range 41–79 years). Patient information, including age and sex
were collected from the medical records. The last follow-up was on
June 12, 2018, with a median follow-up period of 38 months (1–145
months). The present study was approved by the Regional Ethics
Committee for Clinical Research of the Air Force Military Medical
University (Xi'an, China; approval no. TDLL-201712-22). Written
informed consent was provided by all patients prior to the study
start for use of their medical records and tissue specimens for
research purposes.
Cell culture
The ESCC cell lines (EC109, Kyse30, TE-10 and TE-11)
were preserved at the Department of Thoracic Surgery, Second
Affiliated Hospital of Air Force Medical University (Xi'an, China),
while the human esophageal epithelial cell line (HEEpiC) was
purchased from the American Type Culture Collection. All cells were
maintained in RPMI-1640 medium (HyClone; GE Healthcare Life
Sciences) supplemented with 10% fetal bovine serum (FBS, Gibco;
Thermo Fisher Scientific, Inc,) and 1% penicillin/streptomycin
(cat. no. C0222, Beyotime Institute of Biotechnology), at 37°C in
5% CO2.
Immunohistochemistry (IHC)
Tumor tissue samples were fixed with 10%
formaldehyde for 48 h at room temperature and embedded in paraffin.
Paraffin-embedded tissue samples were cut into 4-µm-thick sections.
Tissue sections were dewaxed using xylene, digested with urea for
30 min and incubated with 3% hydrogen peroxide for 30 min to
inhibit endogenous peroxidase activity at room temperature.
Subsequently, the tissue sections were repaired for 20 min (750 W
for 5 min and 450 W for 15 min) using a microwave and cooled in
citric acid buffer (pH 6.0). Tissue sections were blocked with 5%
goat serum for 30 min and washed three times with PBS solution (5
min each time) at room temperature. The sections were incubated
with HIP1 primary antibody (1:80; cat. no. 22231-1-AP; ProteinTech
Group, Inc.) overnight at 4°C. Following the primary incubation,
tissue sections were incubated with contents of the EnVision™
Detection kit (cat. no. CW20355, Kangwei, http://cwbiotech.bioon.com.cn/) at 37°C for 45 min,
according to the manufacturer's instructions (12). The sections were subsequently
counterstained with hematoxylin for 90 secs and treated with
hydrochloric acid alcohol differentiation fluid for 7 sec at room
temperature.
Evaluation of IHC staining
Following IHC staining, tissue sections were
observed in five randomly selected fields under a fluorescence
microscope (Leica Microsystems GmbH, DM4000B; magnification, ×200).
The total immunostaining score was calculated as the product of the
proportion score and the intensity score (13). The proportion score represented the
estimated fraction of positively stained tumor cells, as follows:
0, 0–5%; 1, 6–25%; 2, 26–50%; 3, 51–75% and 4, 76–100%. The
intensity score represented the estimated staining intensity, as
follows: 0, negative; 1, weak; 2, moderate and 3, strong. These
scores were measured according to the result of the degree
multiplied by the score of the staining intensity, as follows: 0,
0; 1+, 1–4; 2+, 5–8 and 3+, 9–12. A score of 0 was considered
negative, whereas scores 1+ to 3+ were considered positive. Thus,
the total score ranged from 0–12.
Reverse transcription quantitative
(RT-q)PCR
Total RNA was extracted from tissue samples and cell
lines using TRIzol® reagent (Invitrogen; Thermo Fisher
Scientific, Inc.), according to the manufacturer's protocol. Total
RNA was reverse transcribed into cDNA using the Thermo scientific
Revert Aid First Strand cDNA Synthesis kit (100rxns, Thermo Fisher
Scientific, Inc.). qPCR was subsequently performed using the SYBR
Green Premix Ex Taq II kit (cat. no. CW0957M; Kangwei, http://cwbiotech.bioon.com.cn/). Relative
expression levels were calculated using the 2−ΔΔCq
method (14) and normalized to the
internal reference gene β-actin.
The following primer sequences were used for qPCR:
HIP1 forward, 5′-GTTGTGGCCTCAACCATT-3′ and reverse,
5′-ACCACTTCTTGCAGTGTAG-3′; and β-actin forward,
5′-CTCCATCCTGGCCTCGCTGT-3′ and reverse, 5′-GCTGTCACCTTCACCGTTCC-3′.
Relative expression levels were normalized to the internal
reference gene β-actin.
Western blotting
Total protein was extracted from tissues and cells
using RIPA lysate (cat. no. P0013; Beyotime Institute of
Biotechnology). Total protein was quantified using the BCA Protein
Assay kit (cat. no. 23227, Pierce; Thermo Fisher Scientific, Inc.).
The extracted protein was mixed with the loading buffer (10×, cat.
no. CW0027A; CWBio) and heated at 65°C for 30 min. The proteins (30
µg) were separated by SDS-PAGE (5% concentrated glue and 12%
separated glue). Subsequently, the proteins were transferred onto
the polyvinylidene fluoride membranes (Beijing Solarbio Science
& Technology Co., Ltd.) via electroblotting (Bio-Rad
Laboratories, Inc.). Membranes were blocked with 5% skim milk
powder, which was dissolved in TBST for 3 h at room temperature,
and subsequently incubated with HIP1 primary antibody (cat. no.
22231-1-AP, monoclonal antibody, 1:1,000, ProteinTech Group, Inc.)
and β-actin (cat. no. CW0097, polyclonal antibody, 1:2,500, CWBio)
diluted with WB Antibody Diluent (P0023A; Beyotime Institute of
Biotechnology) overnight at 4°C. Following the primary incubation,
the membranes were incubated with secondary antibody (1:5,000; cat.
no. EK020; Zhuangzhi Bio, http://www.zhuangzhibio.com) diluted with WB Secondary
Antibody Diluent (cat. no. P0023A; Beyotime Institute of
Biotechnology) at room temperature for 35 min. Membranes were
washed six times with TBST, and protein bands were detected using
the Millipore chromogenic kit (cat. no. WBKLS0500; Millipore).
Relative quantitative analysis was performed using the GelDox XR
system (Bio-Rad Laboratories, Inc.) (15).
Lentiviral construction of stable cell
lines with overexpressed or downregulated HIP1 and cell
transfection
As demonstrated in Fig.
1E and F, HIP1 mRNA and protein expression levels are higher in
EC109 cells compared with TE-10 cells, and lower in Kyser 0 cells
compared with TE-11 cells. Thus, EC109 was selected as the cell
line where lentivirus interfered with the expression of the HIP1
gene, and Kyse30 was selected as the cell line that promoted the
expression of the HIP1 gene.
 | Figure 1.HIP1 is highly expressed in human ESCC
and predicts a poor prognosis. (A) Reverse
transcription-quantitative PCR analysis demonstrated that HIP1 mRNA
expression levels were higher in ESCC tumor tissues compared with
paracancerous tissues. (B) HIP1 expression in ESCC clinical
specimens were divided into four groups (scores 0–3) by
immunohistochemistry (magnification, ×200). (C) Western blot
analysis demonstrated that HIP1 protein expression levels were
higher in ESCC tumor tissues compared with paracancerous tissues,
and β-actin was used as the internal control. (D) Malignant
differentiation (poor), late TNM stages (III–IV), transferred lymph
node and high HIP1 expression were significantly associated with
poor overall survival in patients with ESCC. (E) HIP1 mRNA
expression levels were higher in ESCC cells compared with normal
HEEpiC cells. (F) HIP1 protein expression levels were higher in
ESCC cells compared with normal HEEpiC cells, and β-actin was used
as the internal control. Data are presented as the mean ± standard
deviation. HIP1, huntingtin interacting protein 1; ESCC, esophageal
squamous cell carcinoma; T, tumor; N, normal; TNM,
tumor-node-metastasis; HEEpiC, human esophageal epithelial cell
line. |
To stably overexpress (OE) the HIP1 gene, Kyse30
cells were infected with a lentivirus vector encoding the
full-length sequence of human HIP1 gene. The untargeted sequence
was used as OE-control group. Untreated cells were used as the
control group. When the infection efficiency of cells treated with
lentivirus green fluorescent protein (GFP) reached 80%, and the
results of RT-qPCR and western blotting found that significantly
improving expressions of HIP1 mRNA and protein, the overexpression
was considered successful.
EC109 cells were infected with
hU6-MCS-CMV-EGFP-lentivirus or an empty lentiviral control vector
(Shanghai GeneChem Co., Ltd.) to inhibit HIP1 gene expression
(Genebank no. 3092). The short hairpin (sh)RNA HIP1 sequences were
as follows: #1, 5′-AAGCTATTCAGGTGCTCAT-3′; #2,
5′-TTCAATTTCAACAGTCAAA-3′; and #3, 5′-TCTTCCAAACAGTATTCAA-3′, and
the shRNA control sequence was as follows:
5′-TTCTCCGAACGTGTCACGT-3′.
The untargeted sequence was used as the
shRNA-control group, and untreated cells were used as the control
group. When the infection efficiency of cells treated with
lentivirus green fluorescent protein (GFP) reached 80%, and the
results of RT-qPCR and western blot analyses demonstrated
significant inhibition of HIP1 mRNA and protein levels, then the
lentivirus interference succeeded.
MTT assay
After 6 days of lentivirus vector overexpression or
shRNA infection, the treated cells were seeded into 96-well plates
at a density of 4×10³ cells/well. Cell viability was
measured at days 1, 2, 3, 4, 5 and 6 following incubation at 37°C
in 5% CO2. A total of 20 µl MTT reagent (5 mg/ml,
dissolved in PBS; Sigma-Aldrich; Merck KGaA) was added into each
well and incubated at 37°C for 4 h. Following the MTT incubation,
the purple formazan crystals were dissolved using 150 µl dimethyl
sulfoxide and cell viability was subsequently analyzed at a
wavelength of 570 nm using an ELISA detector (Thermo Fisher
Scientific, Inc.), and the growth curve was plotted according to
the OD value (15).
Cell cycle analysis
The effect of HIP1 expression on ESCC cell cycle
distribution was assessed via flow cytometry. Flow cytometric
analysis was performed as previously described (15).
Wound healing assay
The wound healing assay was performed as previously
described (16). Briefly, both
transfected and untreated Kyse30 and EC109 cells were harvested and
seeded into 6-well plates at a density of 5×10⁵
cells/well, 5 days post-lentiviral vector overexpression or shRNA
infection. Cells were incubated overnight at 37°C in 5%
CO2 until they reached 80% confluence, and the monolayer
was subsequently scratched using a 200 µl pipette tip. The debris
was removed and fresh serum-free RPMI-1640 medium (HyClone; GE
Healthcare Life Sciences) was added to the wells. Cells were
captured at 0, 24 and 48 h using a fluorescence microscope (Zeisis,
AXIOVERT 40C; magnification, ×200). Cell migration was analyzed
using ImageJ software (version 1.48u; National Institutes of
Health) at three different sites from each wound area of scratch,
at each time point. The percentage change in migration was
determined by comparison of the differences in wound width.
Migration and invasion assays
The migration and invasion assays were performed
in vitro as previously described (8) using 8 µm pore size Transwell chambers
(Corning, Inc.), according to the manufacturer's protocol. For the
invasion assay, Matrigel (5 mg/ml; Corning, Inc.) was diluted in 1
mg/ml ice-cold RPMI-1640 medium supplemented with 10% FBS. An
aliquot of 200 µl diluted Matrigel was added to the upper Transwell
chambers and incubated for 4 h at 37°C. A total of 1×10⁵
transfected and untreated Kyse30 and EC109 cells were plated in the
upper chambers in 400 µl RPMI-1640 medium (HyClone; GE Healthcare
Life Sciences) without FBS. RPMI-1640 medium (600 µl) supplemented
with 10% FBS was plated in the lower chambers as a chemo
attractant. Following incubation for 48 h at 37°C, the non-invasive
cells in the upper chambers were carefully removed using a cotton
swab, while the invasive cells in the lower chambers were fixed in
dehydrated alcohol for 30 min at room temperature and subsequently
stained with 4 mg/ml crystal violet for 10 min at room temperature.
Stained cells well counted in five randomly selected fields using a
fluorescence microscope (magnification, ×200).
Statistical analysis
Statistical analysis was performed using SPSS 18.0
software (SPSS, Inc.). Data are presented as the mean ± standard
deviation. All experiments were performed in triplicate. As the
data were not normally distributed, non-parametric tests were used
in the present study. The difference in HIP1 expression among three
or more groups was assessed using the Kruskal-Wallis H and
Mann-Whitney U tests. Survival analysis was performed using the
Kaplan-Meier method, and the Cox proportional hazards model was
used for multivariate analysis. P<0.05 was considered to
indicate a statistically significant difference.
Results
Patient characteristics
The clinicopathological data of 173 patients with
ESCC are presented in Table I. Among
these patients, 139 were men and 34 were women, with a median age
of 60 years (age range, 41–79 years). Among the 173 patients, 37
cases were highly differentiated (21.4%), 99 cases were moderately
differentiated (57.2%) and 37 cases were poorly differentiated
(21.4%). With regards to the tumor-node-metastasis (TNM) stage, 92
cases were classified as stages I–II (53.2%), while 81 cases were
classified as stages III–IV (46.8%). All tumors were staged
according to the pathological tumor/node/metastasis (p-TNM)
classification (8th edition) of the International Union against
Cancer (17).
 | Table I.Patient characteristics (n=173). |
Table I.
Patient characteristics (n=173).
| Characteristic | Number of cases,
n | % |
|---|
| Age, years |
|
Median | 60 |
|
|
Range | 41-79 |
|
| Sex |
| Male | 139 | 80.3 |
|
Female | 34 | 19.7 |
| Smoking history |
|
Smoker | 92 | 53.2 |
|
Non-smoker | 81 | 46.8 |
| Pathological
type |
| Squamous
cell carcinoma | 168 | 97.1 |
|
Adenocarcinoma | 5 | 2.9 |
| Differentiation |
| Well | 37 | 21.4 |
|
Moderate | 99 | 57.2 |
| Poor | 37 | 21.4 |
| TNM stage |
| I–II | 92 | 53.2 |
|
III–IV | 81 | 46.8 |
| Primary tumor size,
cm |
| ≤4 | 91 | 52.6 |
|
>4 | 82 | 47.4 |
| Lymph node
metastasis |
|
Yes | 82 | 47.4 |
| No | 91 | 52.6 |
HIP1 is highly expressed in human ESCC
tissues and cell lines, and predicts a poor prognosis
HIP1 mRNA expression was significantly higher in
ESCC tissues compared with adjacent normal tissues (Fig. 1A). IHC analysis demonstrated that
there were 155 positive results of HIP1 in ESCC tissues (89.6%,
155/173), which was higher than that of HIP1 in adjacent normal
tissues (23.1%, 40/173). The ESCC staining results were sub-divided
into four groups: HIP1 negative group (score 0), low HIP1
expression group (score 1), moderate HIP1 expression group (score
2) and high HIP1 expression group (score 3). The HIP1 positive rate
in the ESCC tissues of the moderate and high groups (50.3%) was
higher than that in the low group (39.3%) (Fig. 1B). Furthermore, HIP1 protein
expression was significantly higher in ESCC tissues compared with
the adjacent normal tissues (Fig.
1C).
The results demonstrated that high positive HIP1
expression was significantly associated with moderate and poor
differentiation, TNM stages III–IV and lymph node metastasis, while
low positive HIP1 expression was significantly associated with well
differentiation (P<0.001), TNM stages I–II (P<0.001)and lymph
node non-metastasis (P<0.001) (Table
II). Kaplan-Meier survival analysis demonstrated that
differentiation (P=0.001), TNM stages (P<0.001), lymph node
metastasis (P=0.001) and HIP1 expression (P<0.001) were all
significantly associated with the overall survival (OS) time of
patients with ESCC (Fig. 1D and
Table III). Cox regression
analysis indicated that differentiation (P=0.037), TNM stages
(P=0.014) and HIP1 expression (P=0.001) were significant prognostic
influences for OS (Table IV).
| Table II.Association between HIP1 expression
and the clinicopathological characteristics of patients with
esophageal squamous cell carcinoma. |
Table II.
Association between HIP1 expression
and the clinicopathological characteristics of patients with
esophageal squamous cell carcinoma.
|
|
| HIP1
expression |
|
|---|
|
|
|
|
|
|---|
| Characteristic | Number of patients,
n | − | + | ++ | +++ | P-value |
|---|
| Sex |
|
|
|
|
| 0.281 |
|
Male | 139 | 17 | 48 | 60 | 14 |
|
|
Female | 34 | 1 | 20 | 12 | 1 |
|
| Age, years |
|
|
|
|
| 0.427 |
|
≤60 | 78 | 5 | 33 | 32 | 8 |
|
|
>60 | 95 | 13 | 35 | 40 | 7 |
|
| Smoking
history |
|
|
|
|
| 0.911 |
|
Smoker | 92 | 14 | 32 | 34 | 12 |
|
|
Non-smoker | 81 | 4 | 36 | 38 | 3 |
|
| Primary tumor size,
cm |
|
|
|
|
| 0.140 |
| ≤4 | 91 | 8 | 33 | 40 | 10 |
|
|
>4 | 82 | 10 | 35 | 32 | 5 |
|
|
Differentiation |
|
|
|
|
| <0.001 |
|
Well | 37 | 7 | 22 | 8 | 0 |
|
|
Moderate | 99 | 6 | 34 | 48 | 11 |
|
|
Poor | 37 | 5 | 12 | 16 | 4 |
|
| TNM stage |
|
|
|
|
| <0.001 |
|
I–II | 92 | 12 | 46 | 30 | 4 |
|
|
III–IV | 81 | 6 | 22 | 42 | 11 |
|
| Lymph node
metastasis |
|
|
|
|
| <0.001 |
|
Yes | 82 | 4 | 26 | 40 | 12 |
|
| No | 91 | 14 | 42 | 32 | 3 |
|
| Table III.Kaplan-Meier survival analysis of
variables affecting survival in patients with esophageal squamous
cell carcinoma. |
Table III.
Kaplan-Meier survival analysis of
variables affecting survival in patients with esophageal squamous
cell carcinoma.
| Variable | Number of patients,
n | Mean overall
survival, months | 95% CI, months | P-value |
|---|
| Total, n | 173 | 68.600 | 59.052–78.148 |
|
| Age, years |
|
≤60 | 78 | 65.663 | 52.122–79.205 | 0.685 |
|
>60 | 95 | 69.873 | 56.979–82.767 |
|
| Sex |
|
Male | 139 | 63.366 | 53.302–73.429 | 0.175 |
|
Female | 34 | 83.054 | 60.842–105.265 |
|
| Smoking
history |
|
Never | 81 | 69.335 | 55.276–83.395 | 0.794 |
|
Ever | 92 | 65.363 | 53.097–77.630 |
|
|
Differentiation |
| Well +
moderate | 136 | 73.469 | 63.027–83.910 | 0.001 |
|
Poor | 37 | 42.961 | 25.411–60.512 |
|
| TNM stage |
|
I–II | 92 | 85.222 | 72.178–98.267 | <0.001 |
|
III–IV | 81 | 39.948 | 30.924–48.973 |
|
| Lymph node
metastasis |
| No | 91 | 82.656 | 69.632–95.679 | 0.001 |
|
Yes | 82 | 41.865 | 32.663–51.067 |
|
| HIP1
expression |
|
−−+ | 86 | 86.883 | 73.578–100.187 | <0.001 |
|
++-+++ | 87 | 48.335 | 36.683–59.987 |
|
| Table IV.Multivariate analysis for overall
survival according to Cox proportional hazards model. |
Table IV.
Multivariate analysis for overall
survival according to Cox proportional hazards model.
|
|
| Multivariate
analysis |
|---|
|
|
|
|
|---|
| Variable | Category | HR (95% CI) | P-Value |
|---|
|
Differentiation | Poor/well +
moderate | 1.603
(1.030–2.496) | 0.037 |
| TNM
stage | I–II/III–IV | 0.593
(0.390–0.901) | 0.014 |
| HIP1
expression | −−+/++−+++ | 2.004
(1.310–3.067) | 0.001 |
Higher HIP1 mRNA levels were detected in ESCC cell
lines compared with HEEpiC cells. With regards to the ESCC cell
lines, HIP1 mRNA expression was higher in EC109 and TE-10 cells and
lower in Kyse30 and TE-11 cells (Fig.
1E). HIP1 protein expression levels were significantly higher
in ESCC cells compared with HEEpiC cells. With regards to the ESCC
cell lines, HIP1 protein expression was higher in EC109 and T10
cells, and lower in Kyse30 and T11 cells (Fig. 1F).
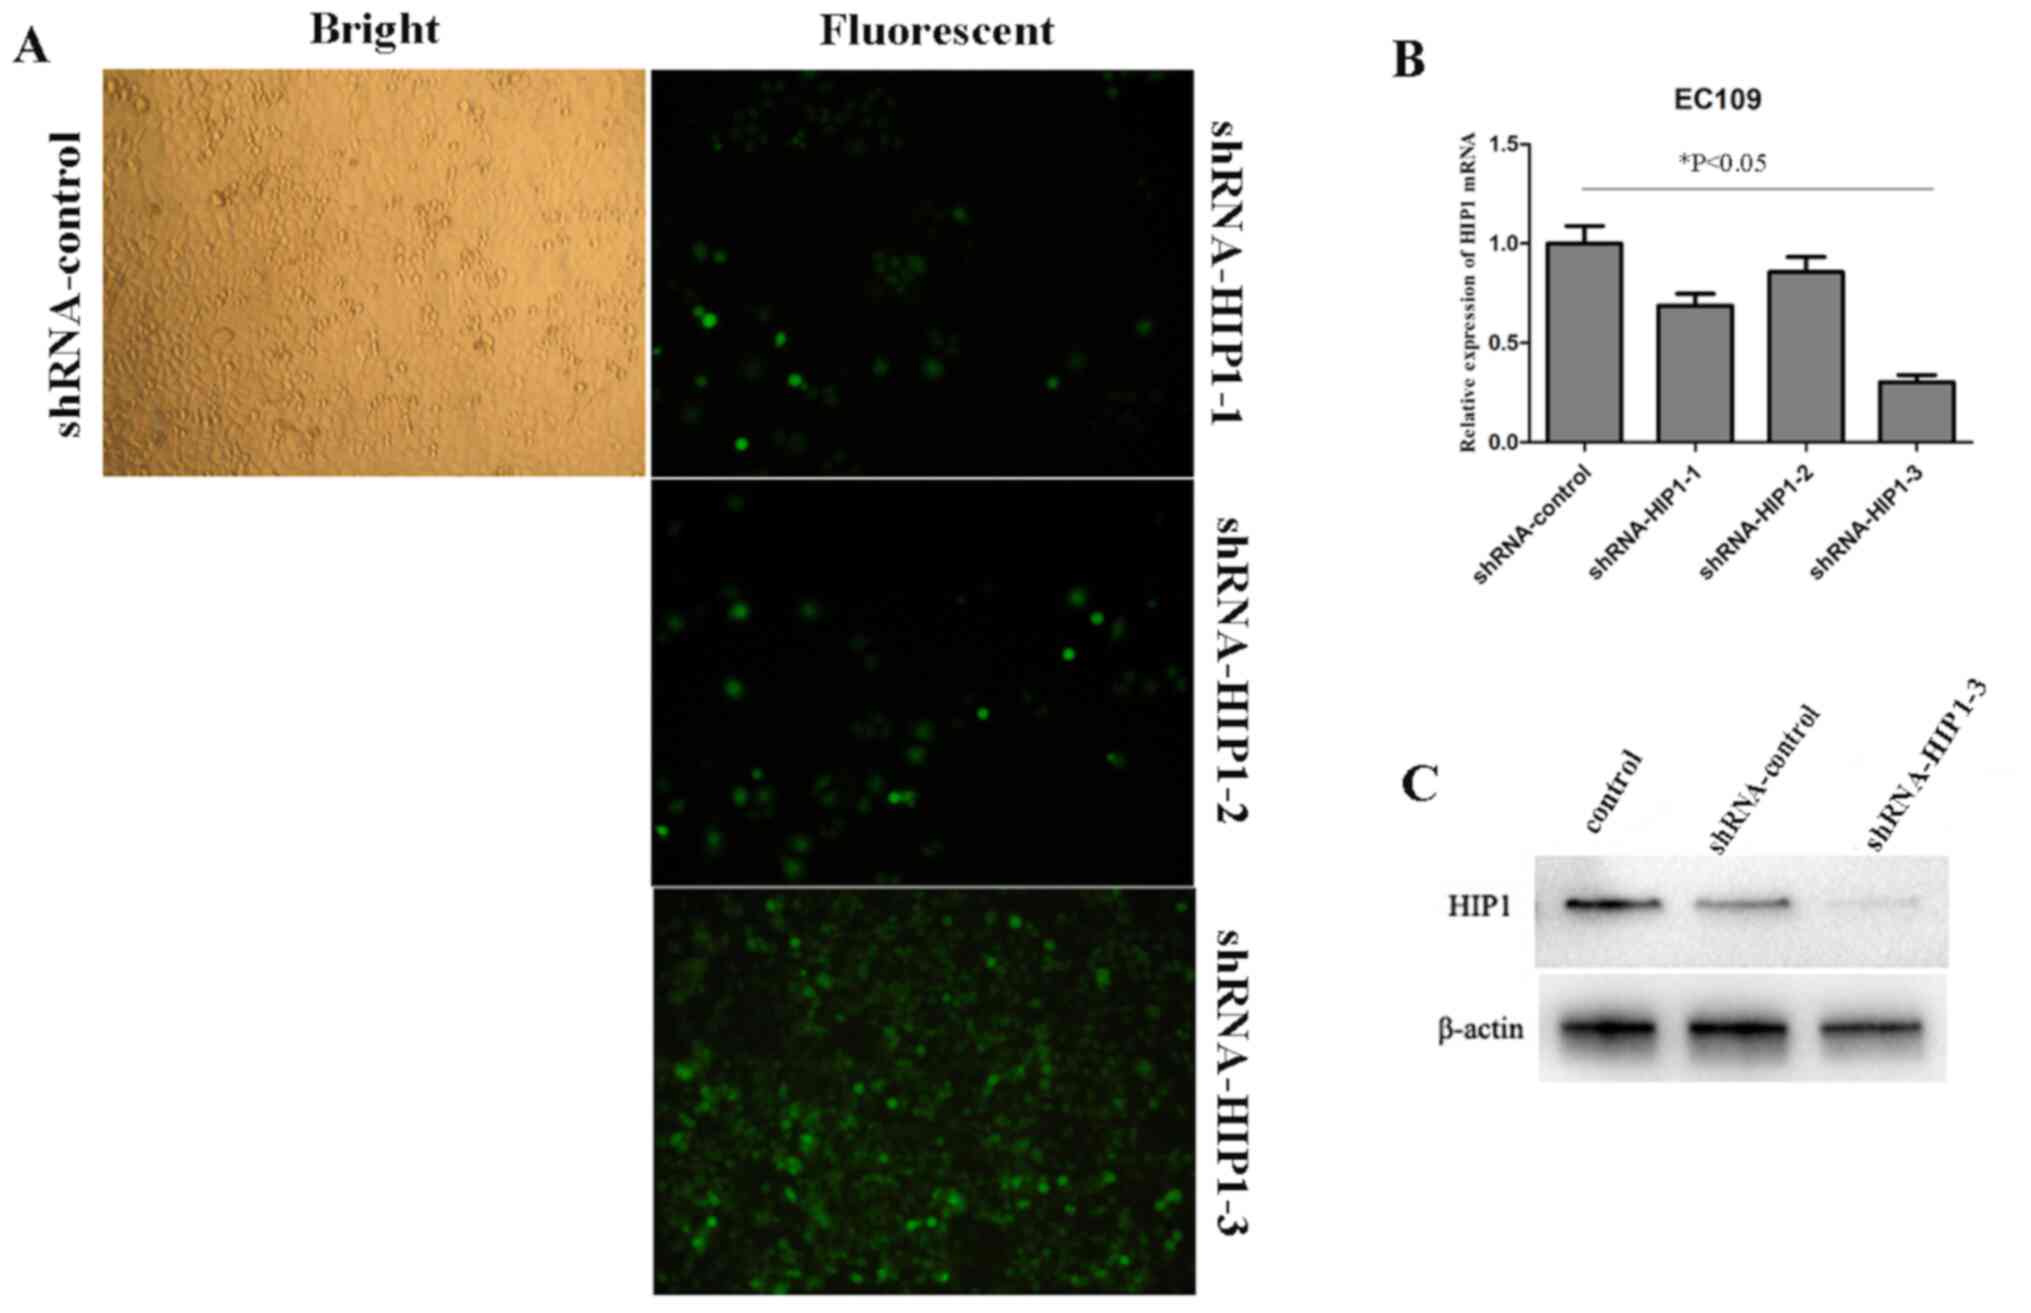
Silencing HIP1 expression by
lentivirus-delivered RNA interfering
To further investigate the underlying molecular
mechanism of HIP1 in ESCC, EC109 cells were infected with
shRNA-HIP1 (#1, #2 and #3) and shRNA-control. The infection
efficiency of green fluorescent protein (GFP) in EC109 cells
infected with shRNA-HIP1-3 was 80~85% after 3 days of infection, at
a multiplicity of infection (MOI) of 10 (Fig. 2A). After 3 days of interfering,
RT-qPCR and western blot analyses were performed to determine the
knockdown efficiency, respectively. The results demonstrated that
HIP1 mRNA and protein expressions levels were significantly
inhibited in cells transfected with shRNA-HIP1-3 (P<0.05;
Fig. 2B and C), and moderately
decreased by the other two shRNAs (shRNA-HIP1-1 and shRNA-HIP1-2
compared with the shRNA-control group and control group. Thus,
shRNA-HIP1-3 was selected for further lentivirus-delivered RNA
interfering experiments. The successful establishment of a HIP1
gene silencing lentivirus provided a useful tool for further
investigating the function of HIP1 in ESCC cell lines.
HIP1 knockdown significantly
suppresses ESCC cell proliferation, migration and invasion
The results of the MTT assay demonstrated that
shRNA-HIP1 cells proliferated at a slower rate compared with the
shRNA-control and control group cells, whereby the difference was
statistically significant from day 4 (Fig. 3A). The results of the wound healing
assay demonstrated that shRNA-control cells migrated at a faster
rate compared with the shRNA-HIP1 cells (Fig. 3B). Similarly, the results of the
Transwell assay demonstrated that shRNA-control cells migrated at a
faster rate compared with the shRNA-HIP1 cells (Fig. 3C). The results of the invasion assay
demonstrated that the invasive ability of shRNA-HIP1 cells
significantly decreased compared with the shRNA-control cells
(Fig. 3D).
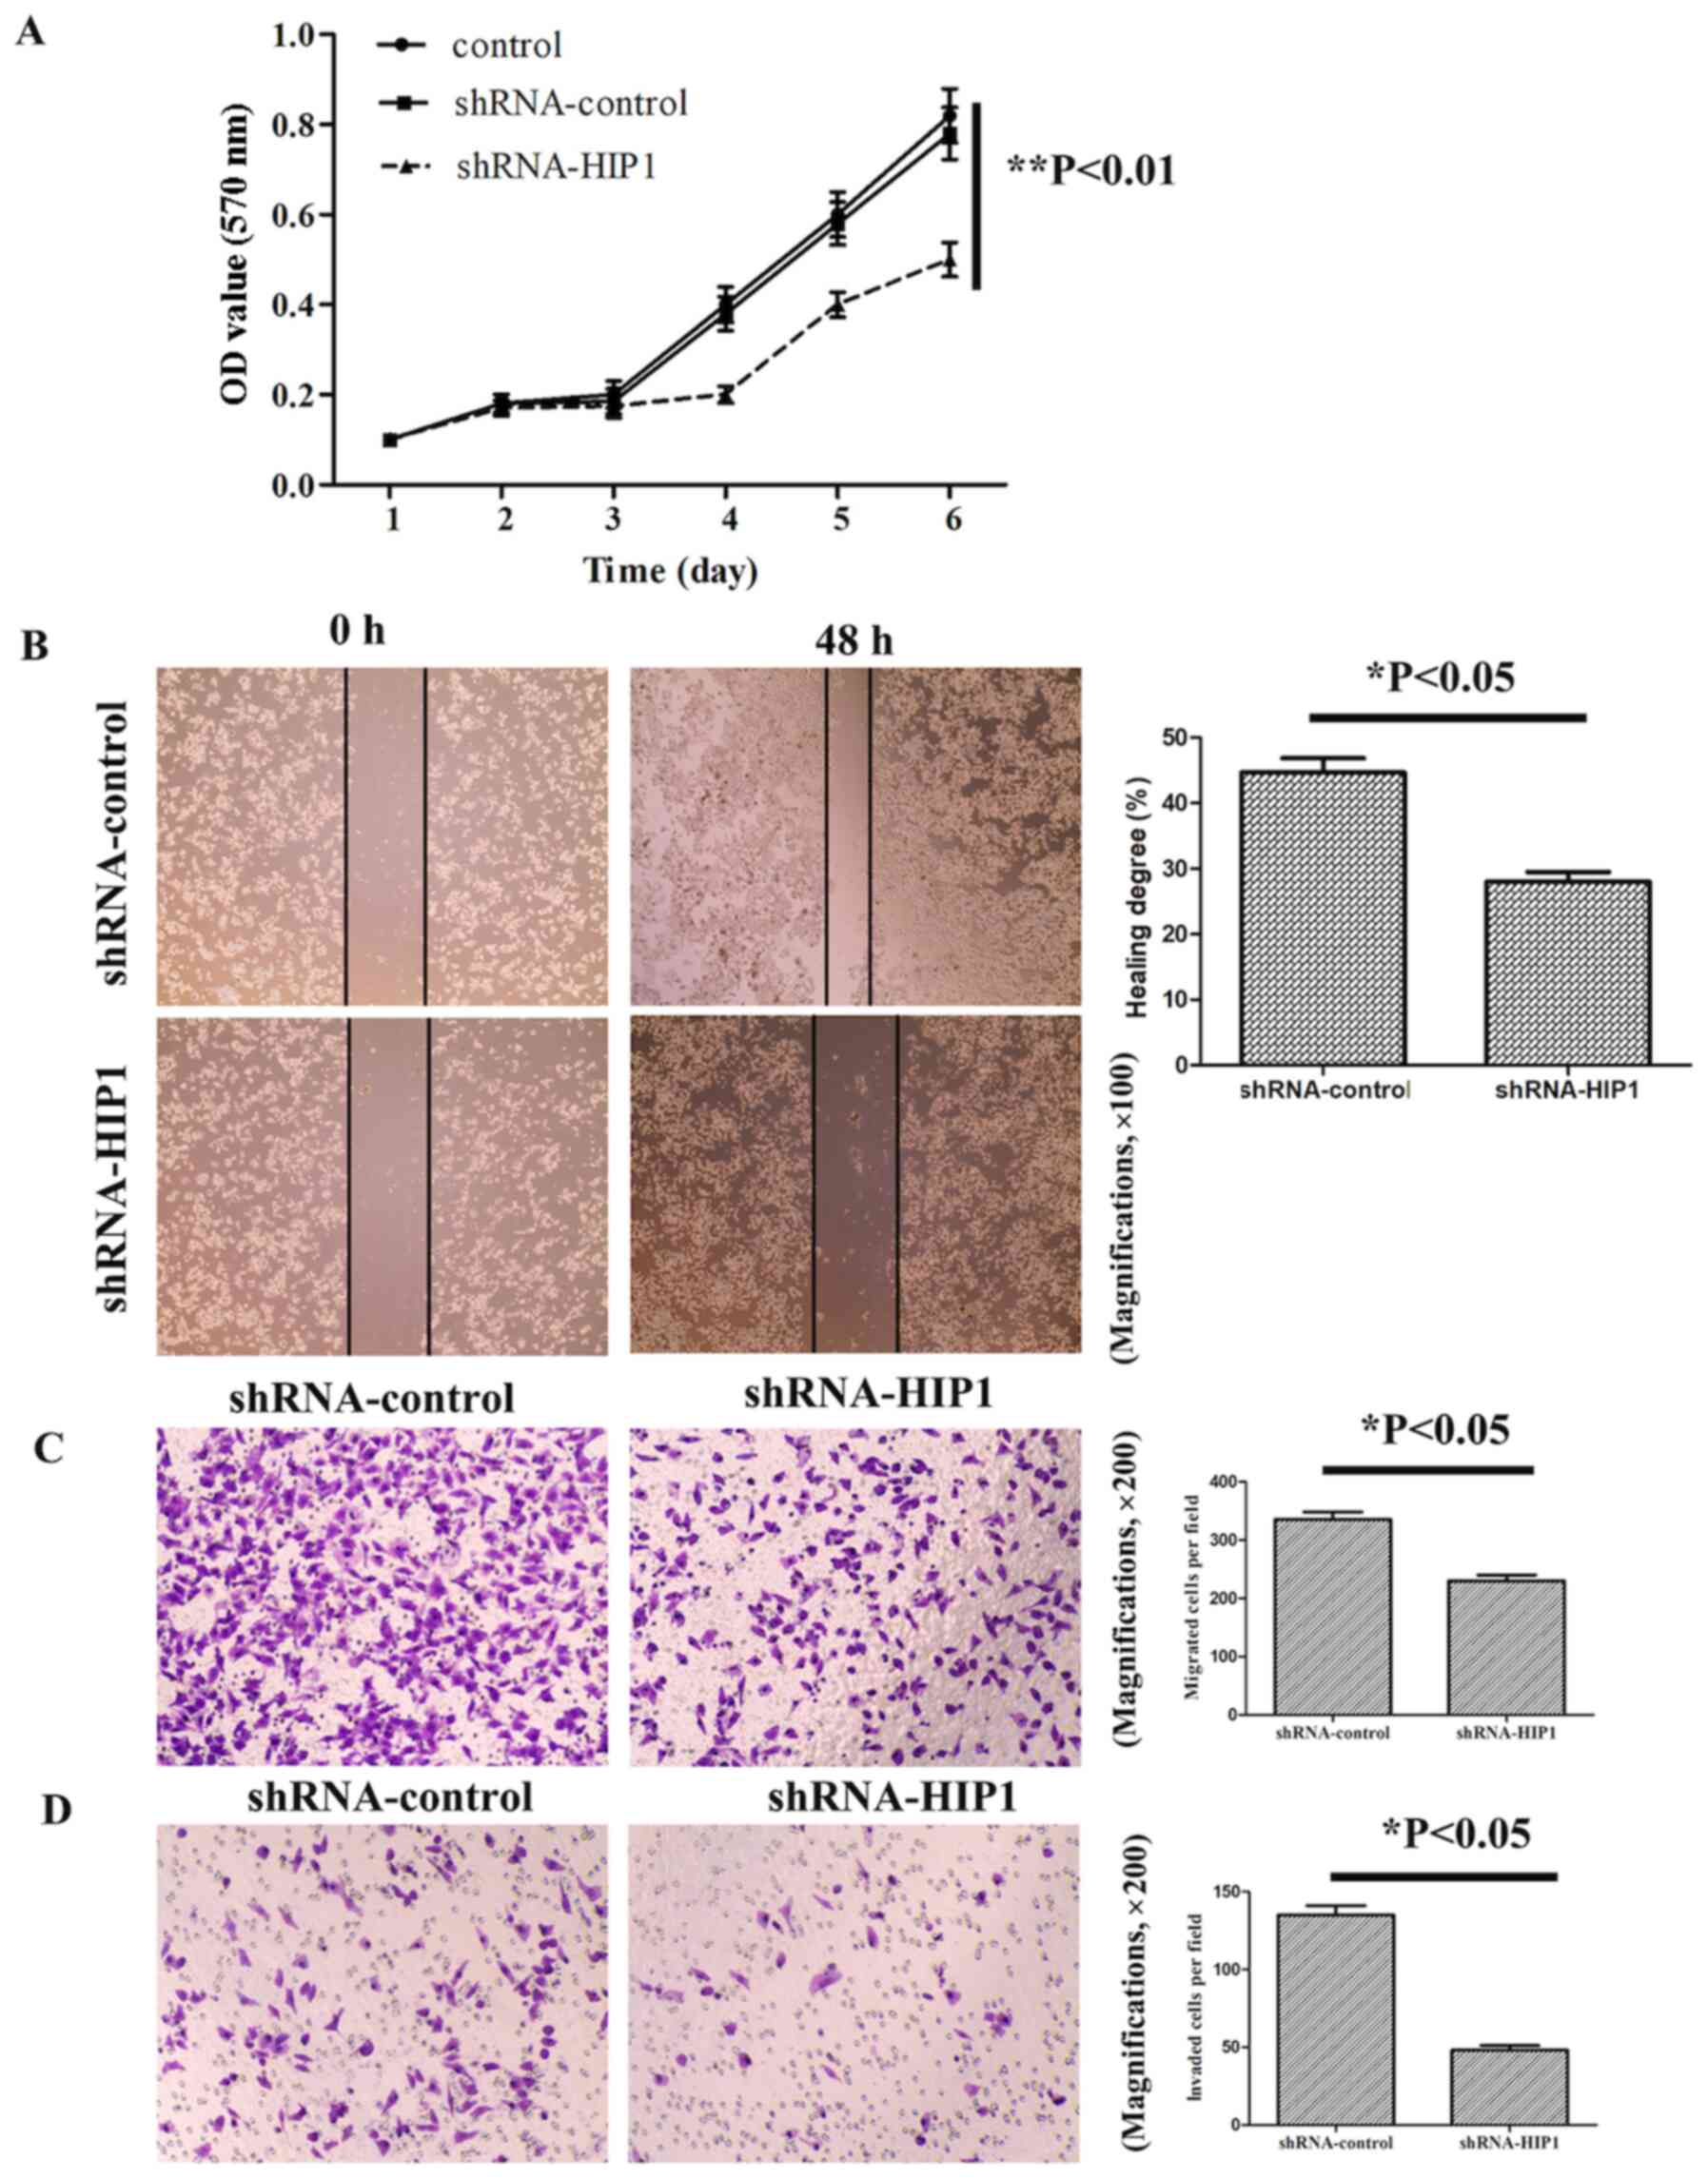 | Figure 3.HIP1 knockdown significantly
suppresses esophageal squamous cell carcinoma cell proliferation,
migration and invasion. (A) The results of the MTT assay
demonstrated that shRNA-HIP1 cells proliferated at a slower rate,
in a time-dependent manner, compared with the shRNA-control and
control cells. (B) The wound healing and (C) Transwell migration
assays demonstrated that HIP1 knockdown inhibited the migratory
ability of EC109 cells (magnifications, ×100 and ×200,
respectively). (D) The Transwell invasive assay demonstrated that
HIP1 knockdown inhibited the invasive ability of EC109 cells
(magnification, ×200). *P<0.05, **P<0.01. HIP1, huntingtin
interacting protein 1; sh, short hairpin; OD, optical density. |
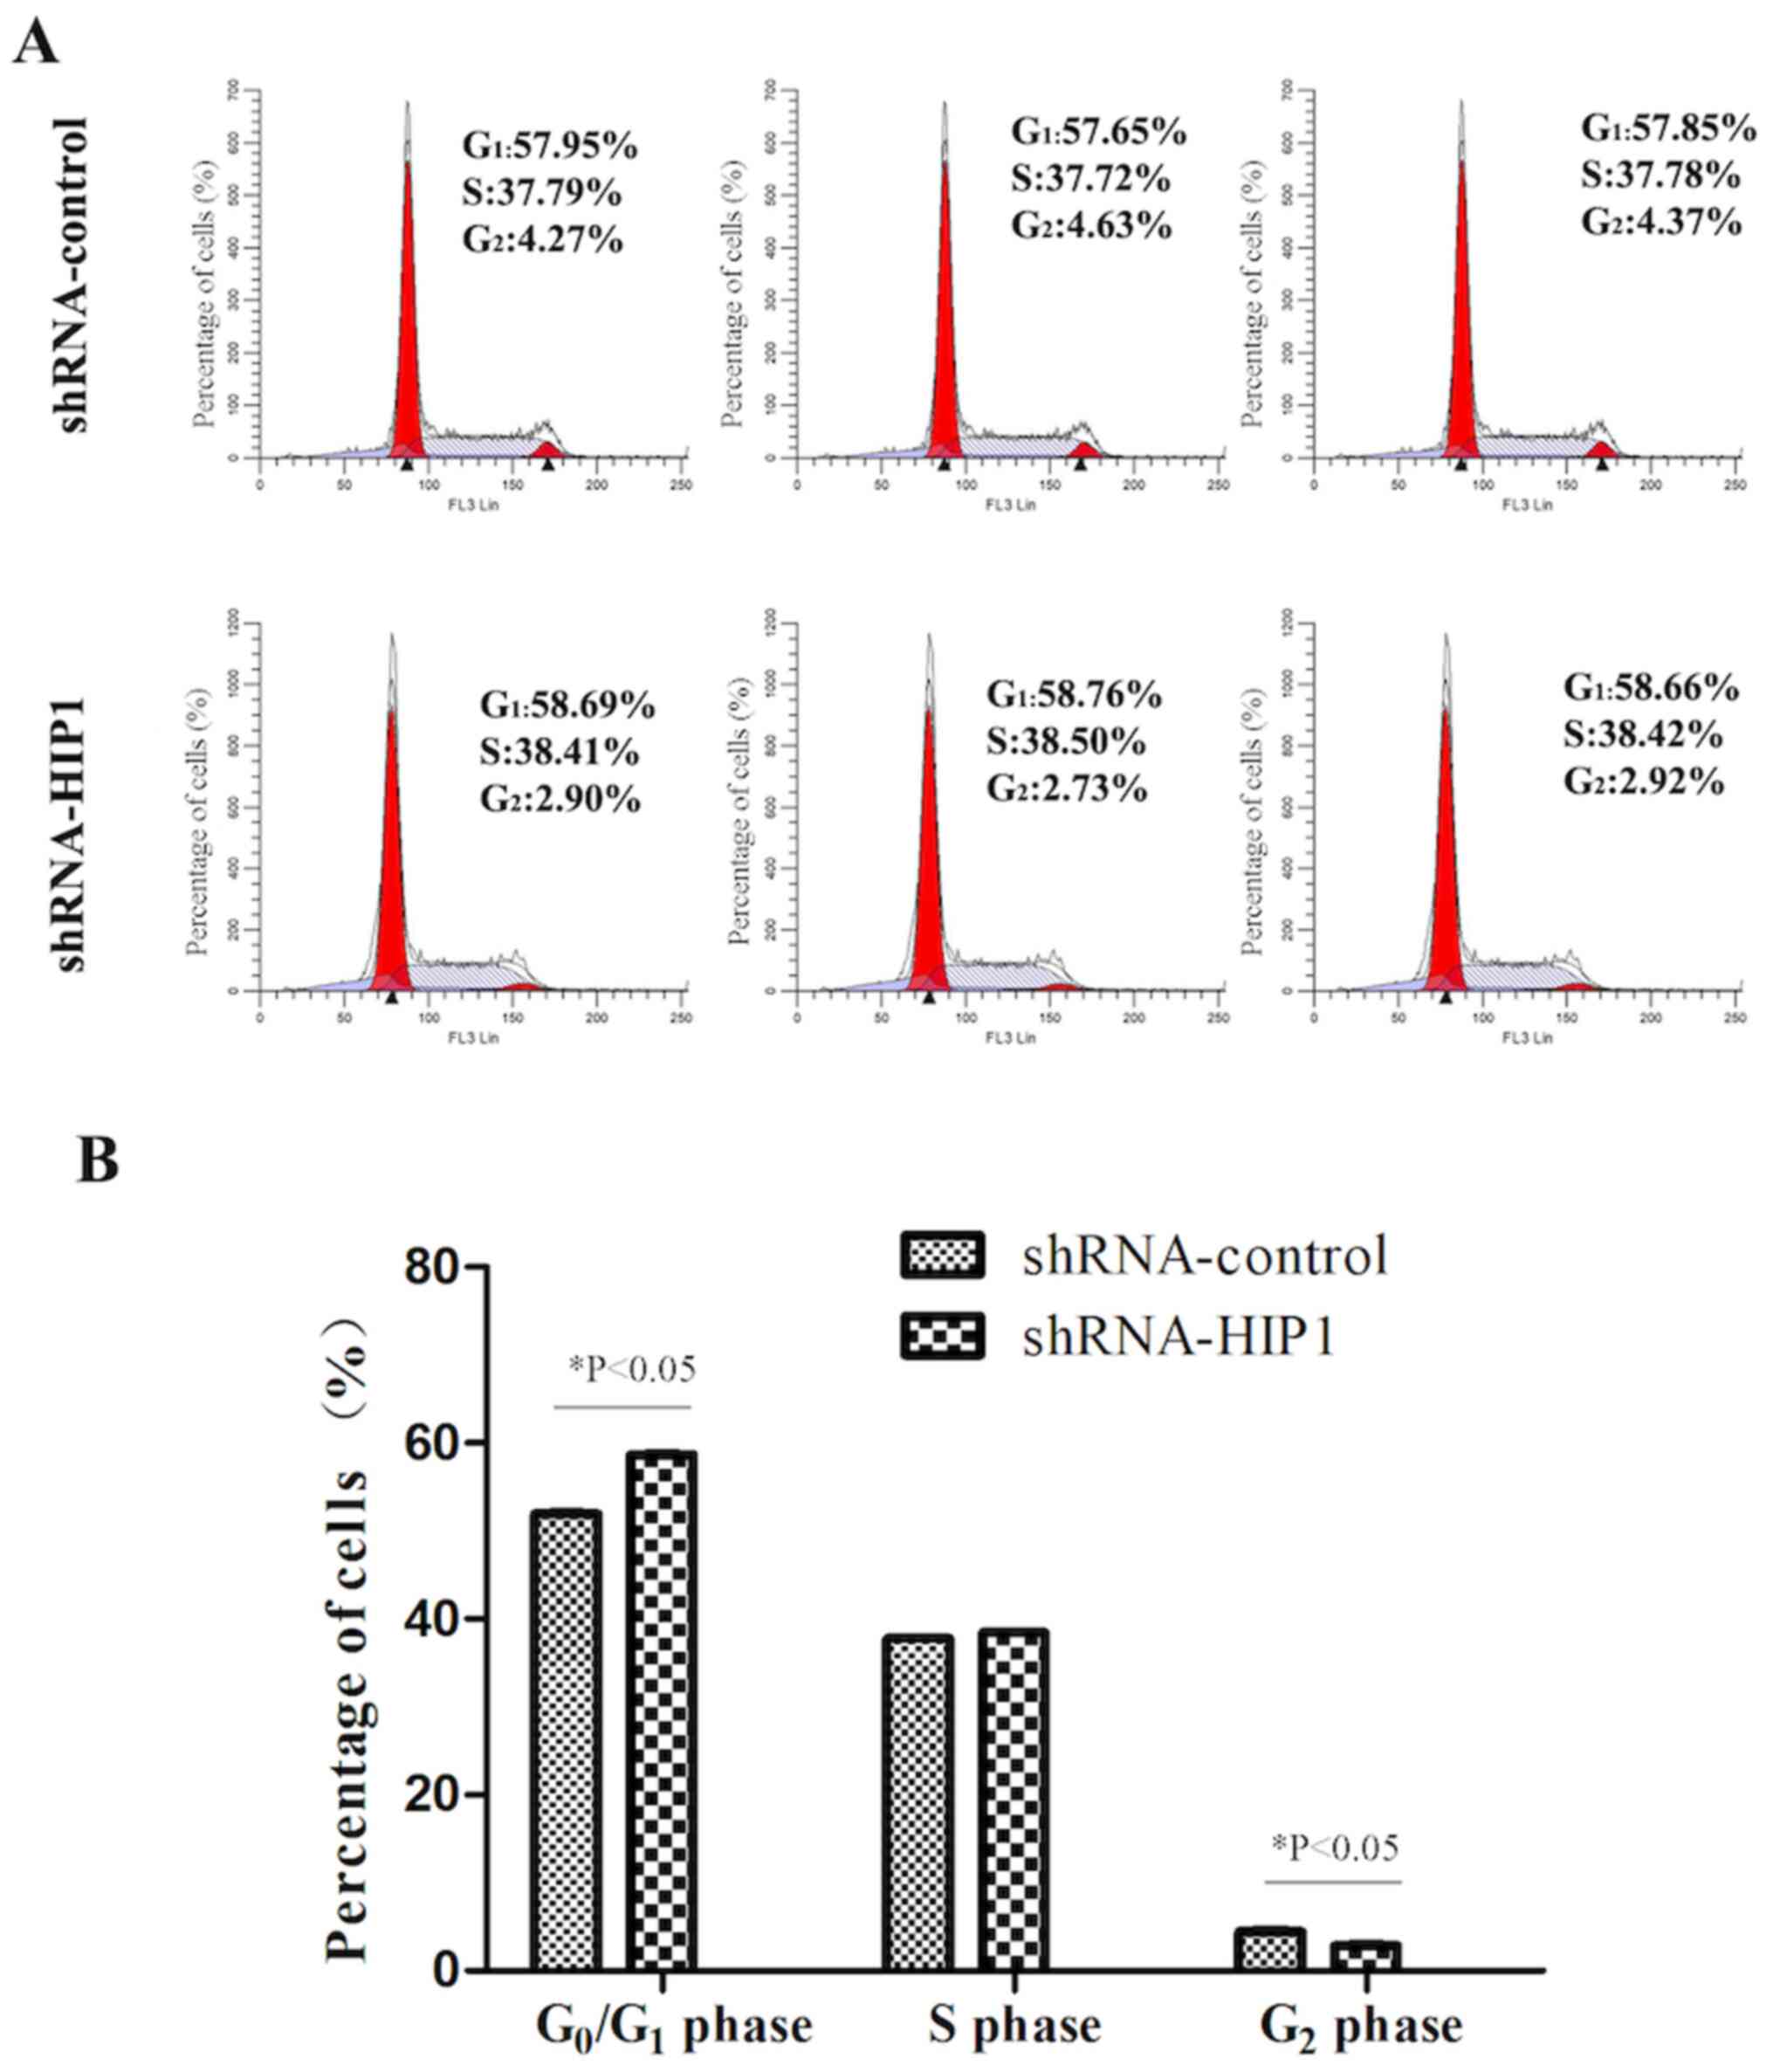
HIP1 knockdown arrests EC109 cells in
the G1 phase of the cell cycle
Flow cytometric analysis demonstrated that the
percentage of the shRNA-HIP1 group cells in the G1 phase
was significantly higher than the shRNA-control group (58.70±0.05%
vs. 57.82±0.15%; P<0.05; Fig. 4A and
B). Conversely, the percentages of the shRNA-HIP1 group cells
in the S phase (38.44±0.05% vs. 37.76±0.04%; P>0.05) and
G2 phase (2.85±0.10% vs. 4.42±0.19%; P<0.05) were
significantly lower than the shRNA-control group (Fig. 4A and B). Taken together, these
results suggest that inhibiting HIP1 exerts an inhibitory effect on
ESCC proliferation by inducing cells to enter the G1
phase from the S phase.
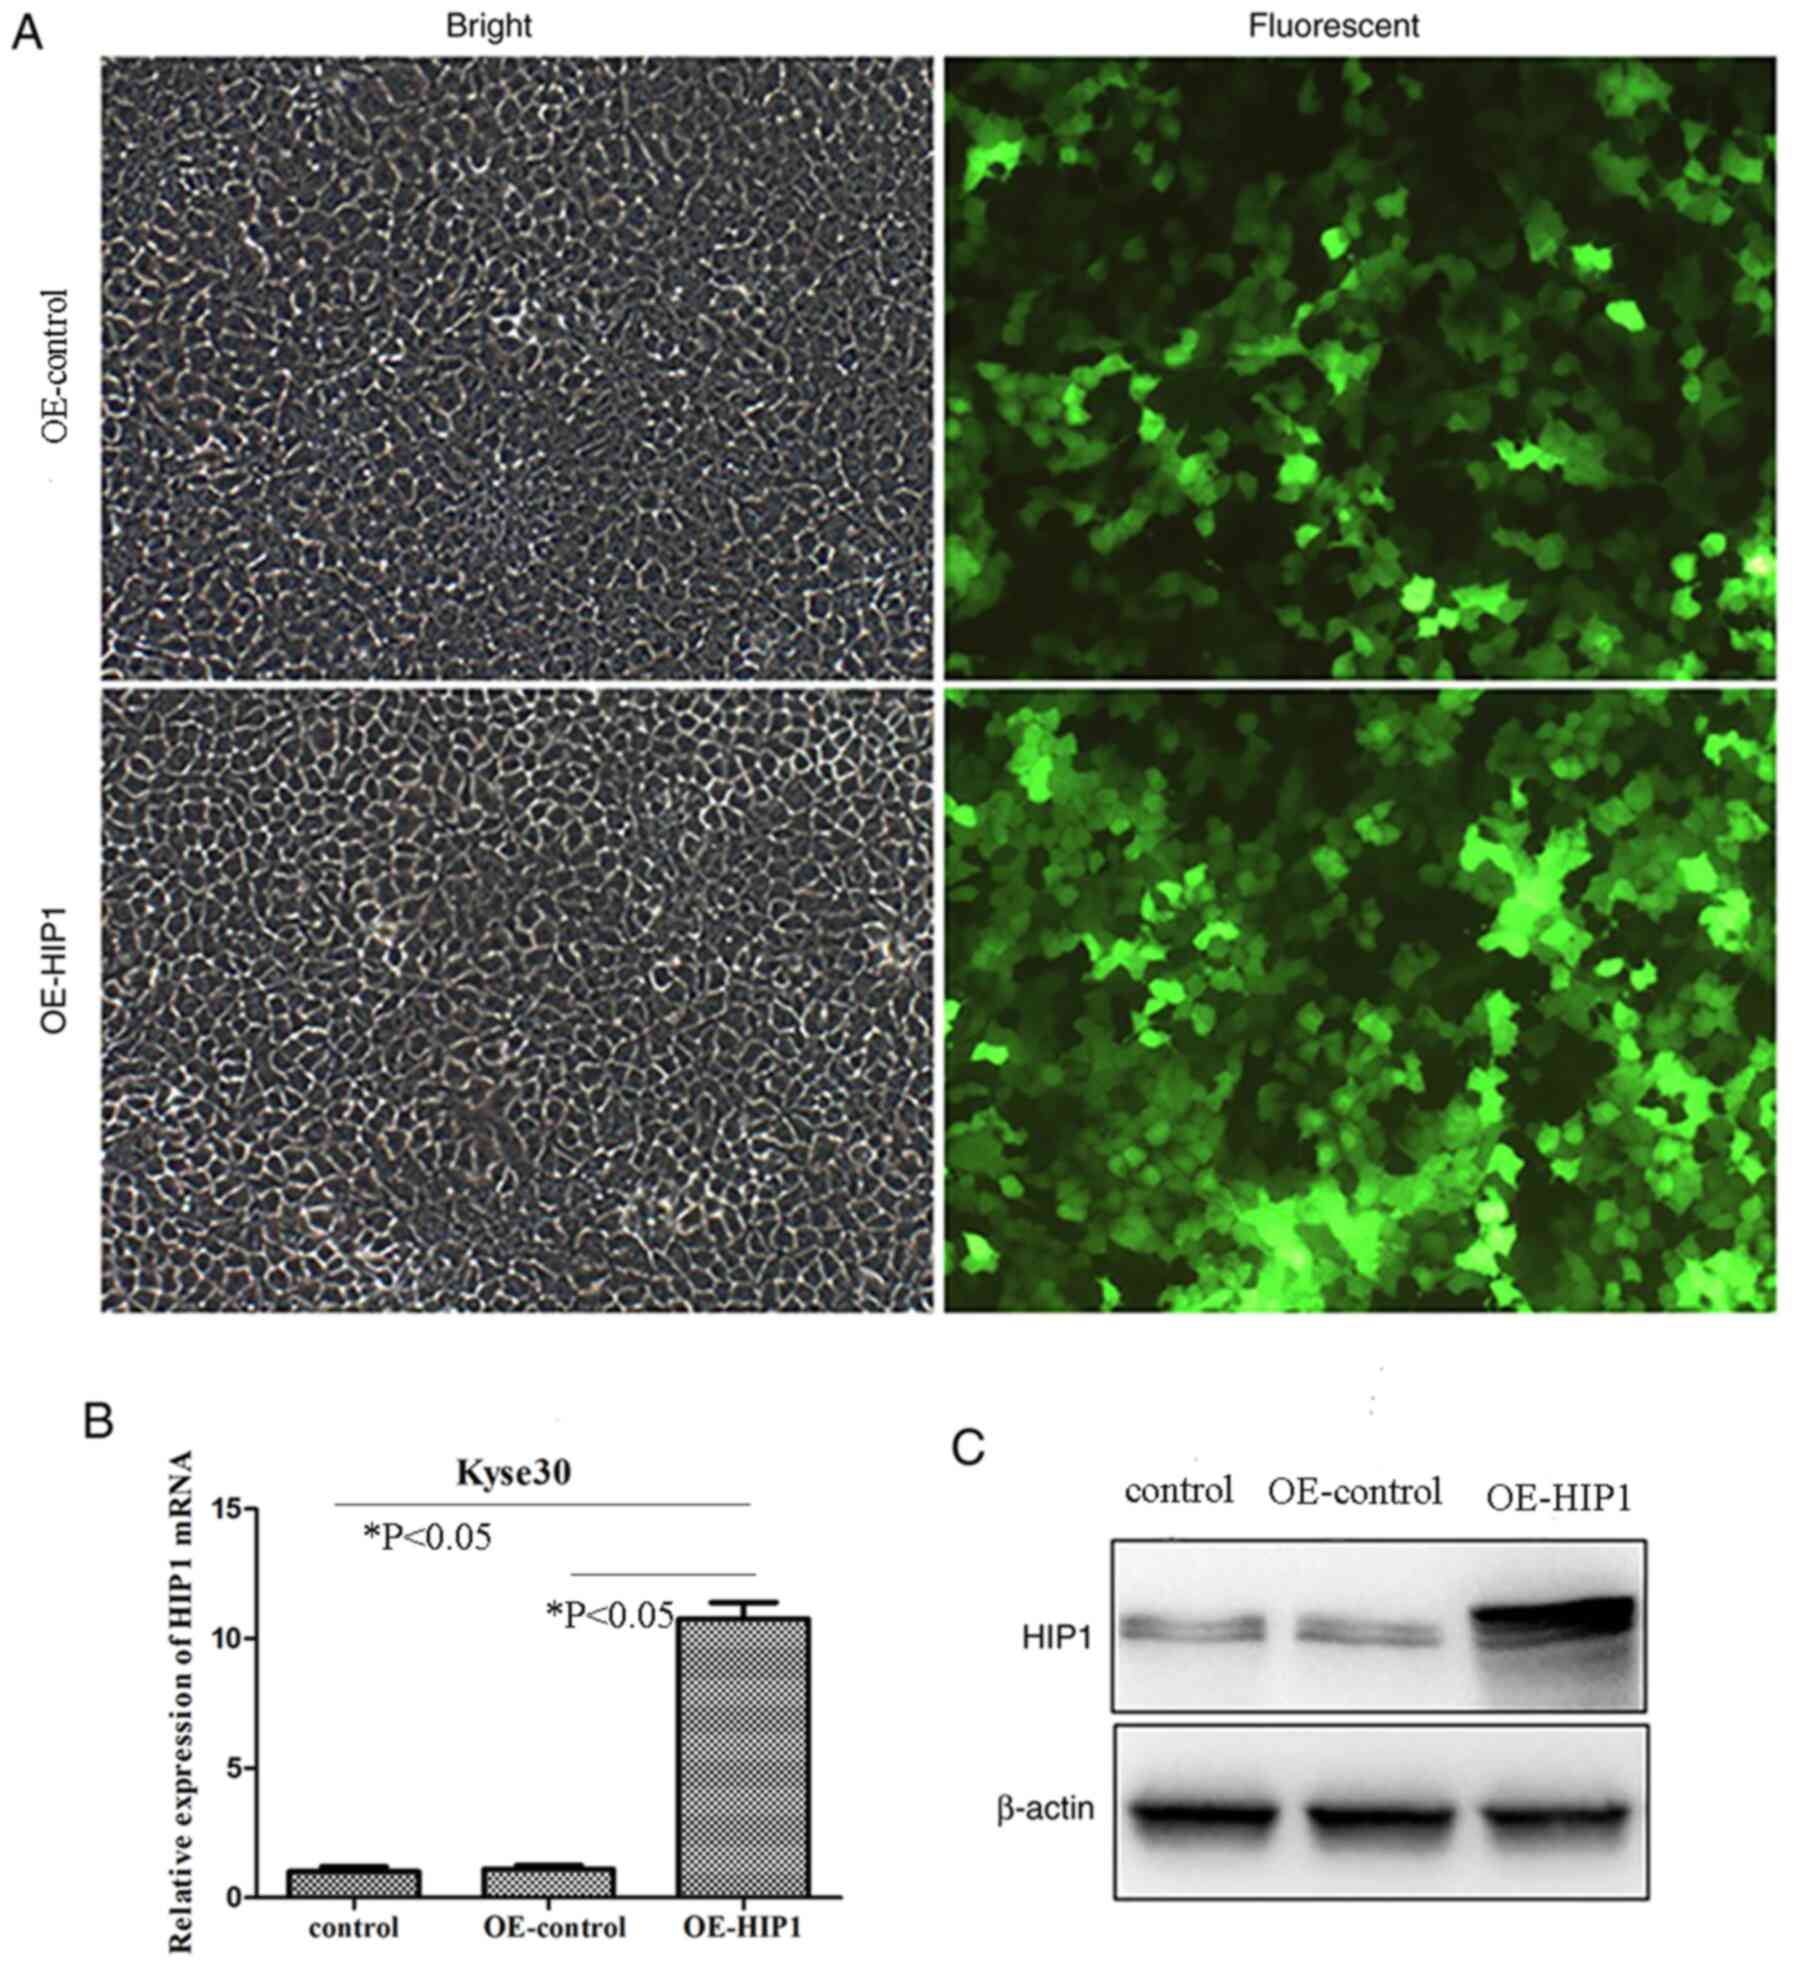
Overexpression of HIP1 by
lentivirus-delivered RNA interfering
The results of the present study demonstrated that
HIP1 mRNA and protein expression levels were lower in Kyse30 cells
compared with all other ESCC cell lines. Thus, to further
investigate the underlying molecular mechanism of HIP1 in ESCC,
Kyse30 cells were infected with a lentiviral vector to overexpress
HIP1 expression. The infection efficiency of GFP in Kyse30 cells
infected with OE-HIP1 was >80% after 3 days of infection, at a
MOI of 20 (Fig. 5A). After 3 days,
RT-qPCR and western blot analyses were performed to determine the
overexpression efficiency, respectively. The results demonstrated
that HIP1 mRNA and protein expressions levels were significantly
promoted in cells transfected with OE-HIP1 compared with the
OE-control and control groups (P<0.05; Fig. 5B and C). The successful establishment
of HIP1 gene overexpression provided a useful tool for further
investigating the function of HIP1 in ESCC cell lines.
Overexpression of HIP1 promotes ESCC
cell proliferation, migration and invasion
To determine the effect of HIP1 overexpression on
the biological behaviors of ESCC cells, overexpressed HIP1 cells
were transfected into Kyse30 cells. The results of the MTT assay
demonstrated that OE-HIP1 cells significantly promoted
proliferation compared with the OE-control group (P<0.01;
Fig. 6A). The results of the wound
healing assay demonstrated that OE-HIP1 cells migrated at a faster
rate compared with the OE-control group (P<0.05; Fig. 6B). Similarly, the results of the
Transwell assay demonstrated that OE-HIP1 cells migrated at a
faster rate compared with the OE-control group (P<0.01; Fig. 6C). The results of the invasion assay
demonstrated that OE-HIP1 cells significantly promoted the invasive
ability of Kyse30 cells (P<0.01; Fig.
6D). Collectively, these results suggest that overexpression of
HIP1 in Kyse30 cells may promote ESCC migration and invasion.
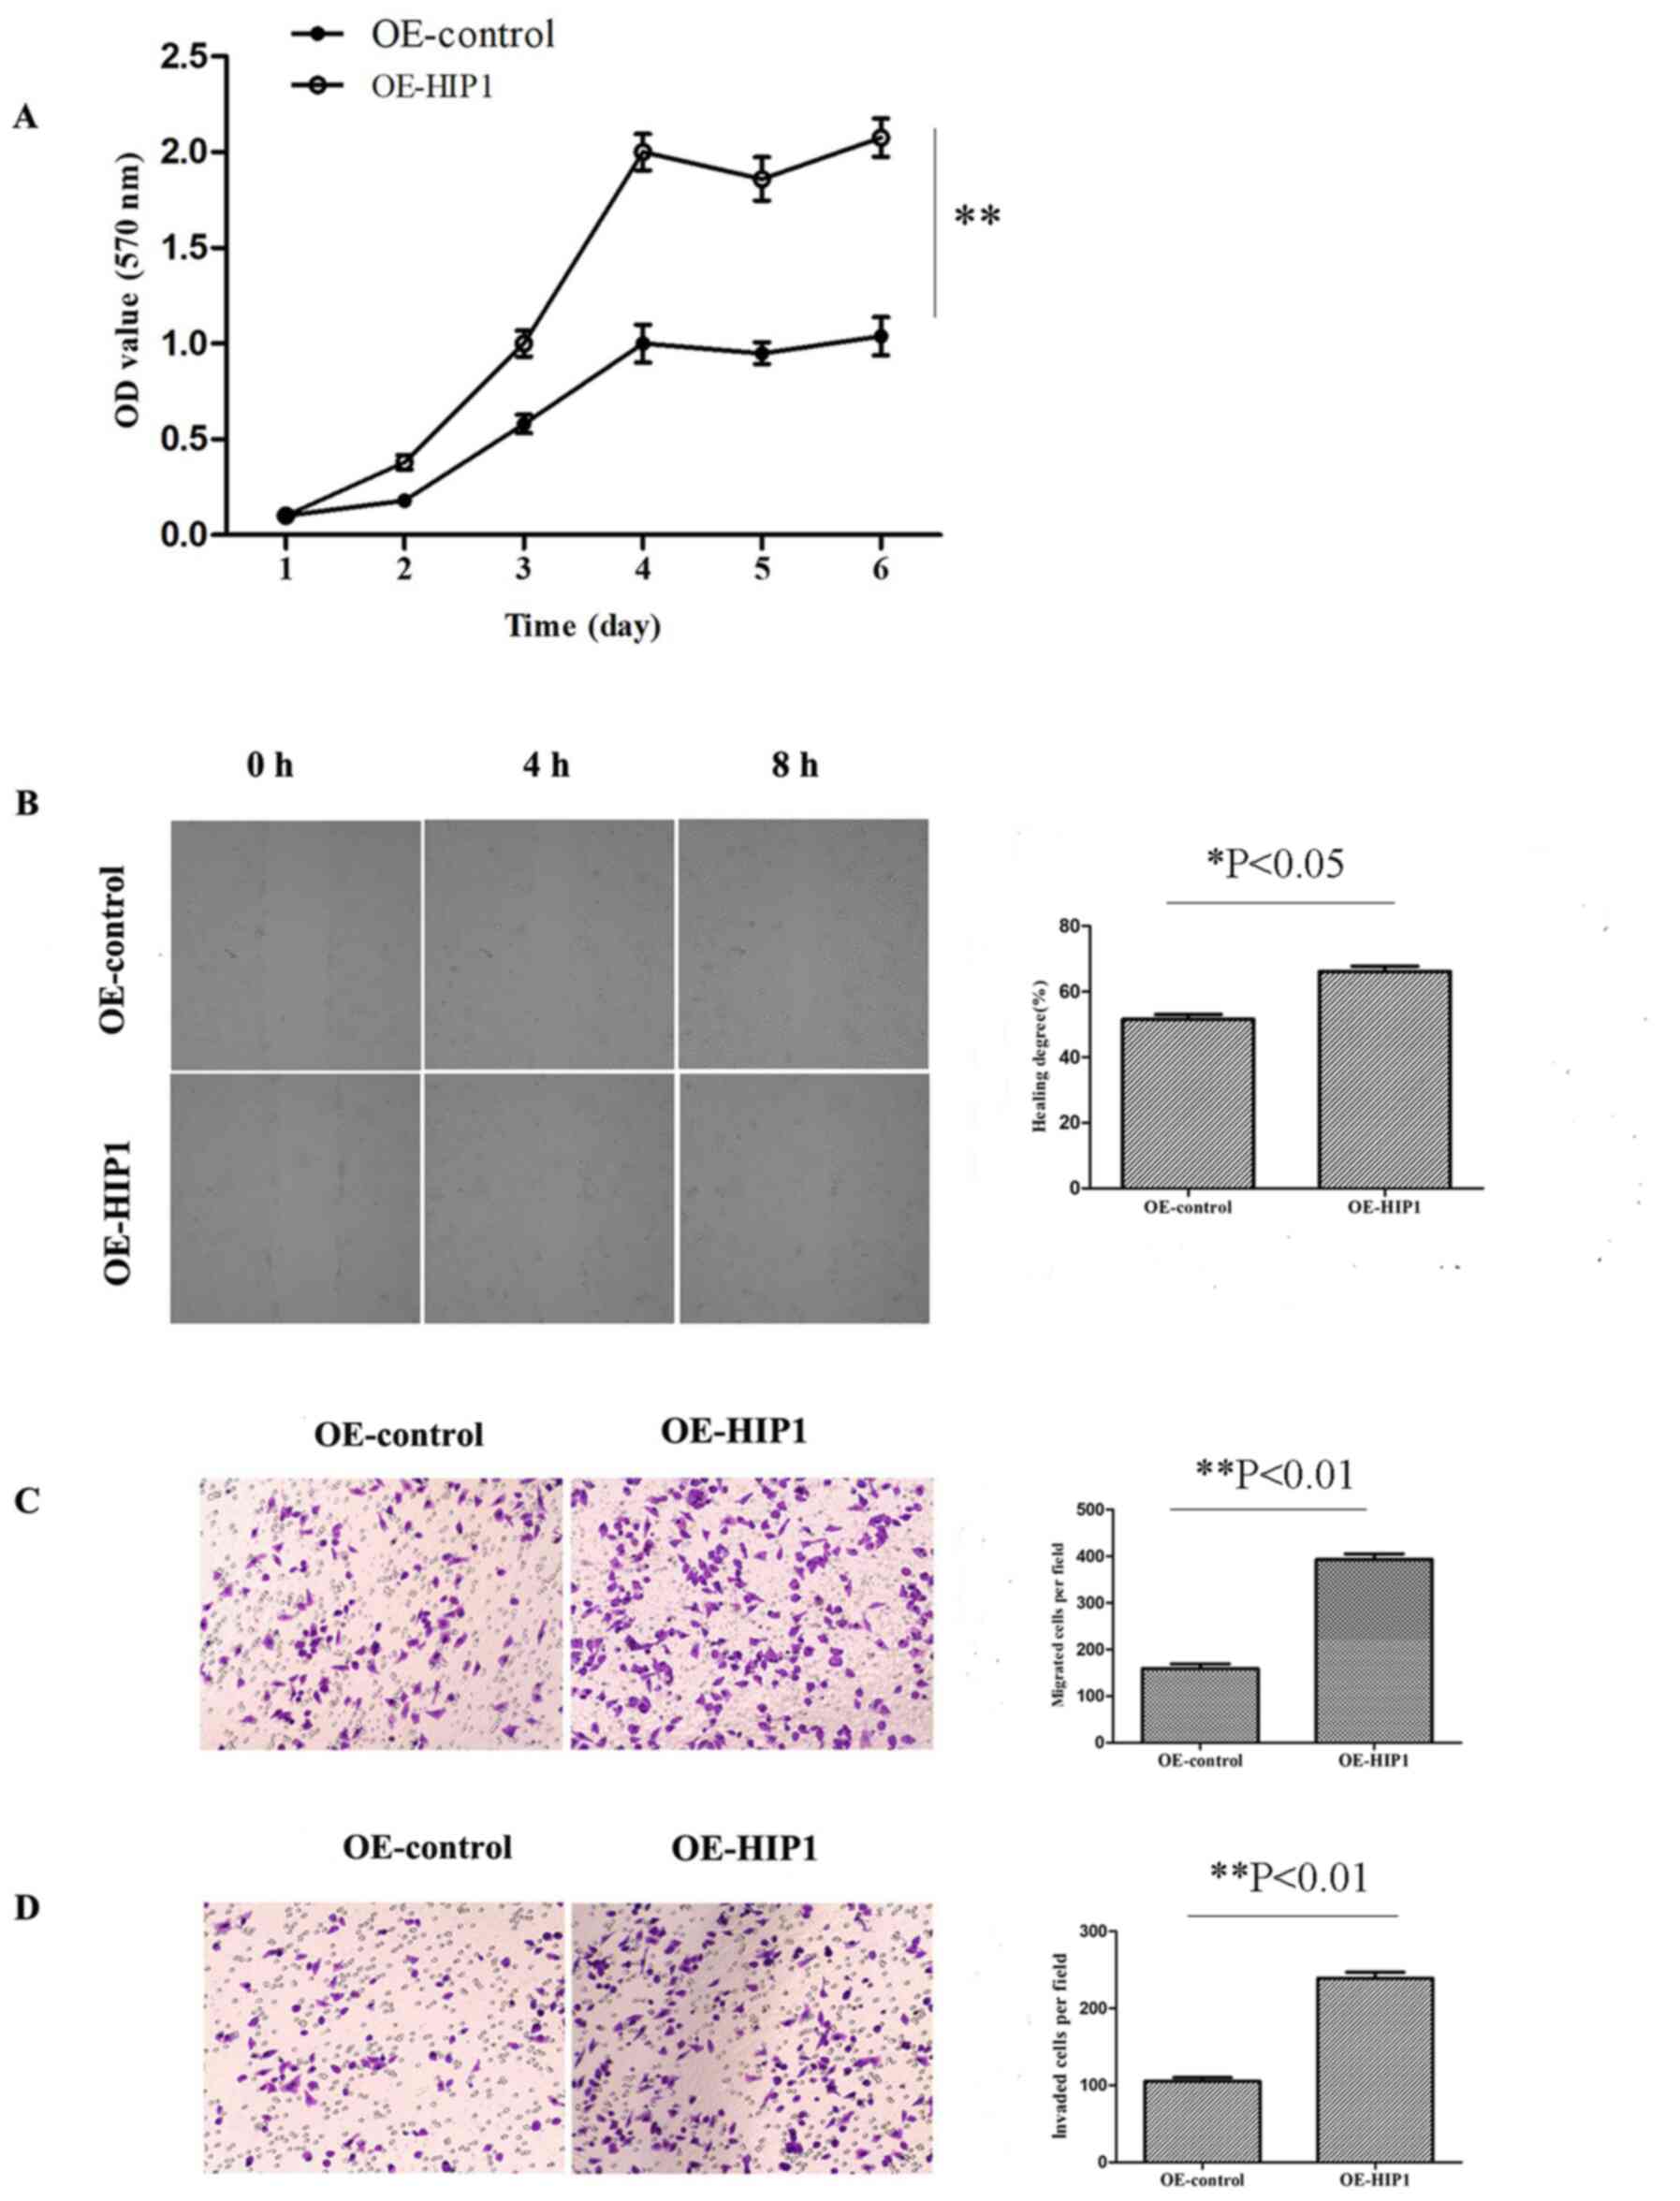 | Figure 6.Overexpression of HIP1 significantly
promotes esophageal squamous cell carcinoma cell proliferation,
migration and invasion. (A) The results of the MTT assay
demonstrated that OE-HIP1 promoted the proliferation of Kyse30
cells, in a time-dependent manner, compared with the OE-control
group. The (B) wound healing and (C) Transwell migration assays
demonstrated that overexpression of HIP1 promoted the migratory
ability of Kyse30 cells (magnifications, ×100 and ×200,
respectively). (D) The transwell invasion assay demonstrated that
overexpression of HIP1 promoted the invasive ability of Kyse30
cells (magnification, ×200). *P<0.05, **P<0.01. HIP1,
huntingtin interacting protein 1; OE, overexpression; OD, optical
density. |
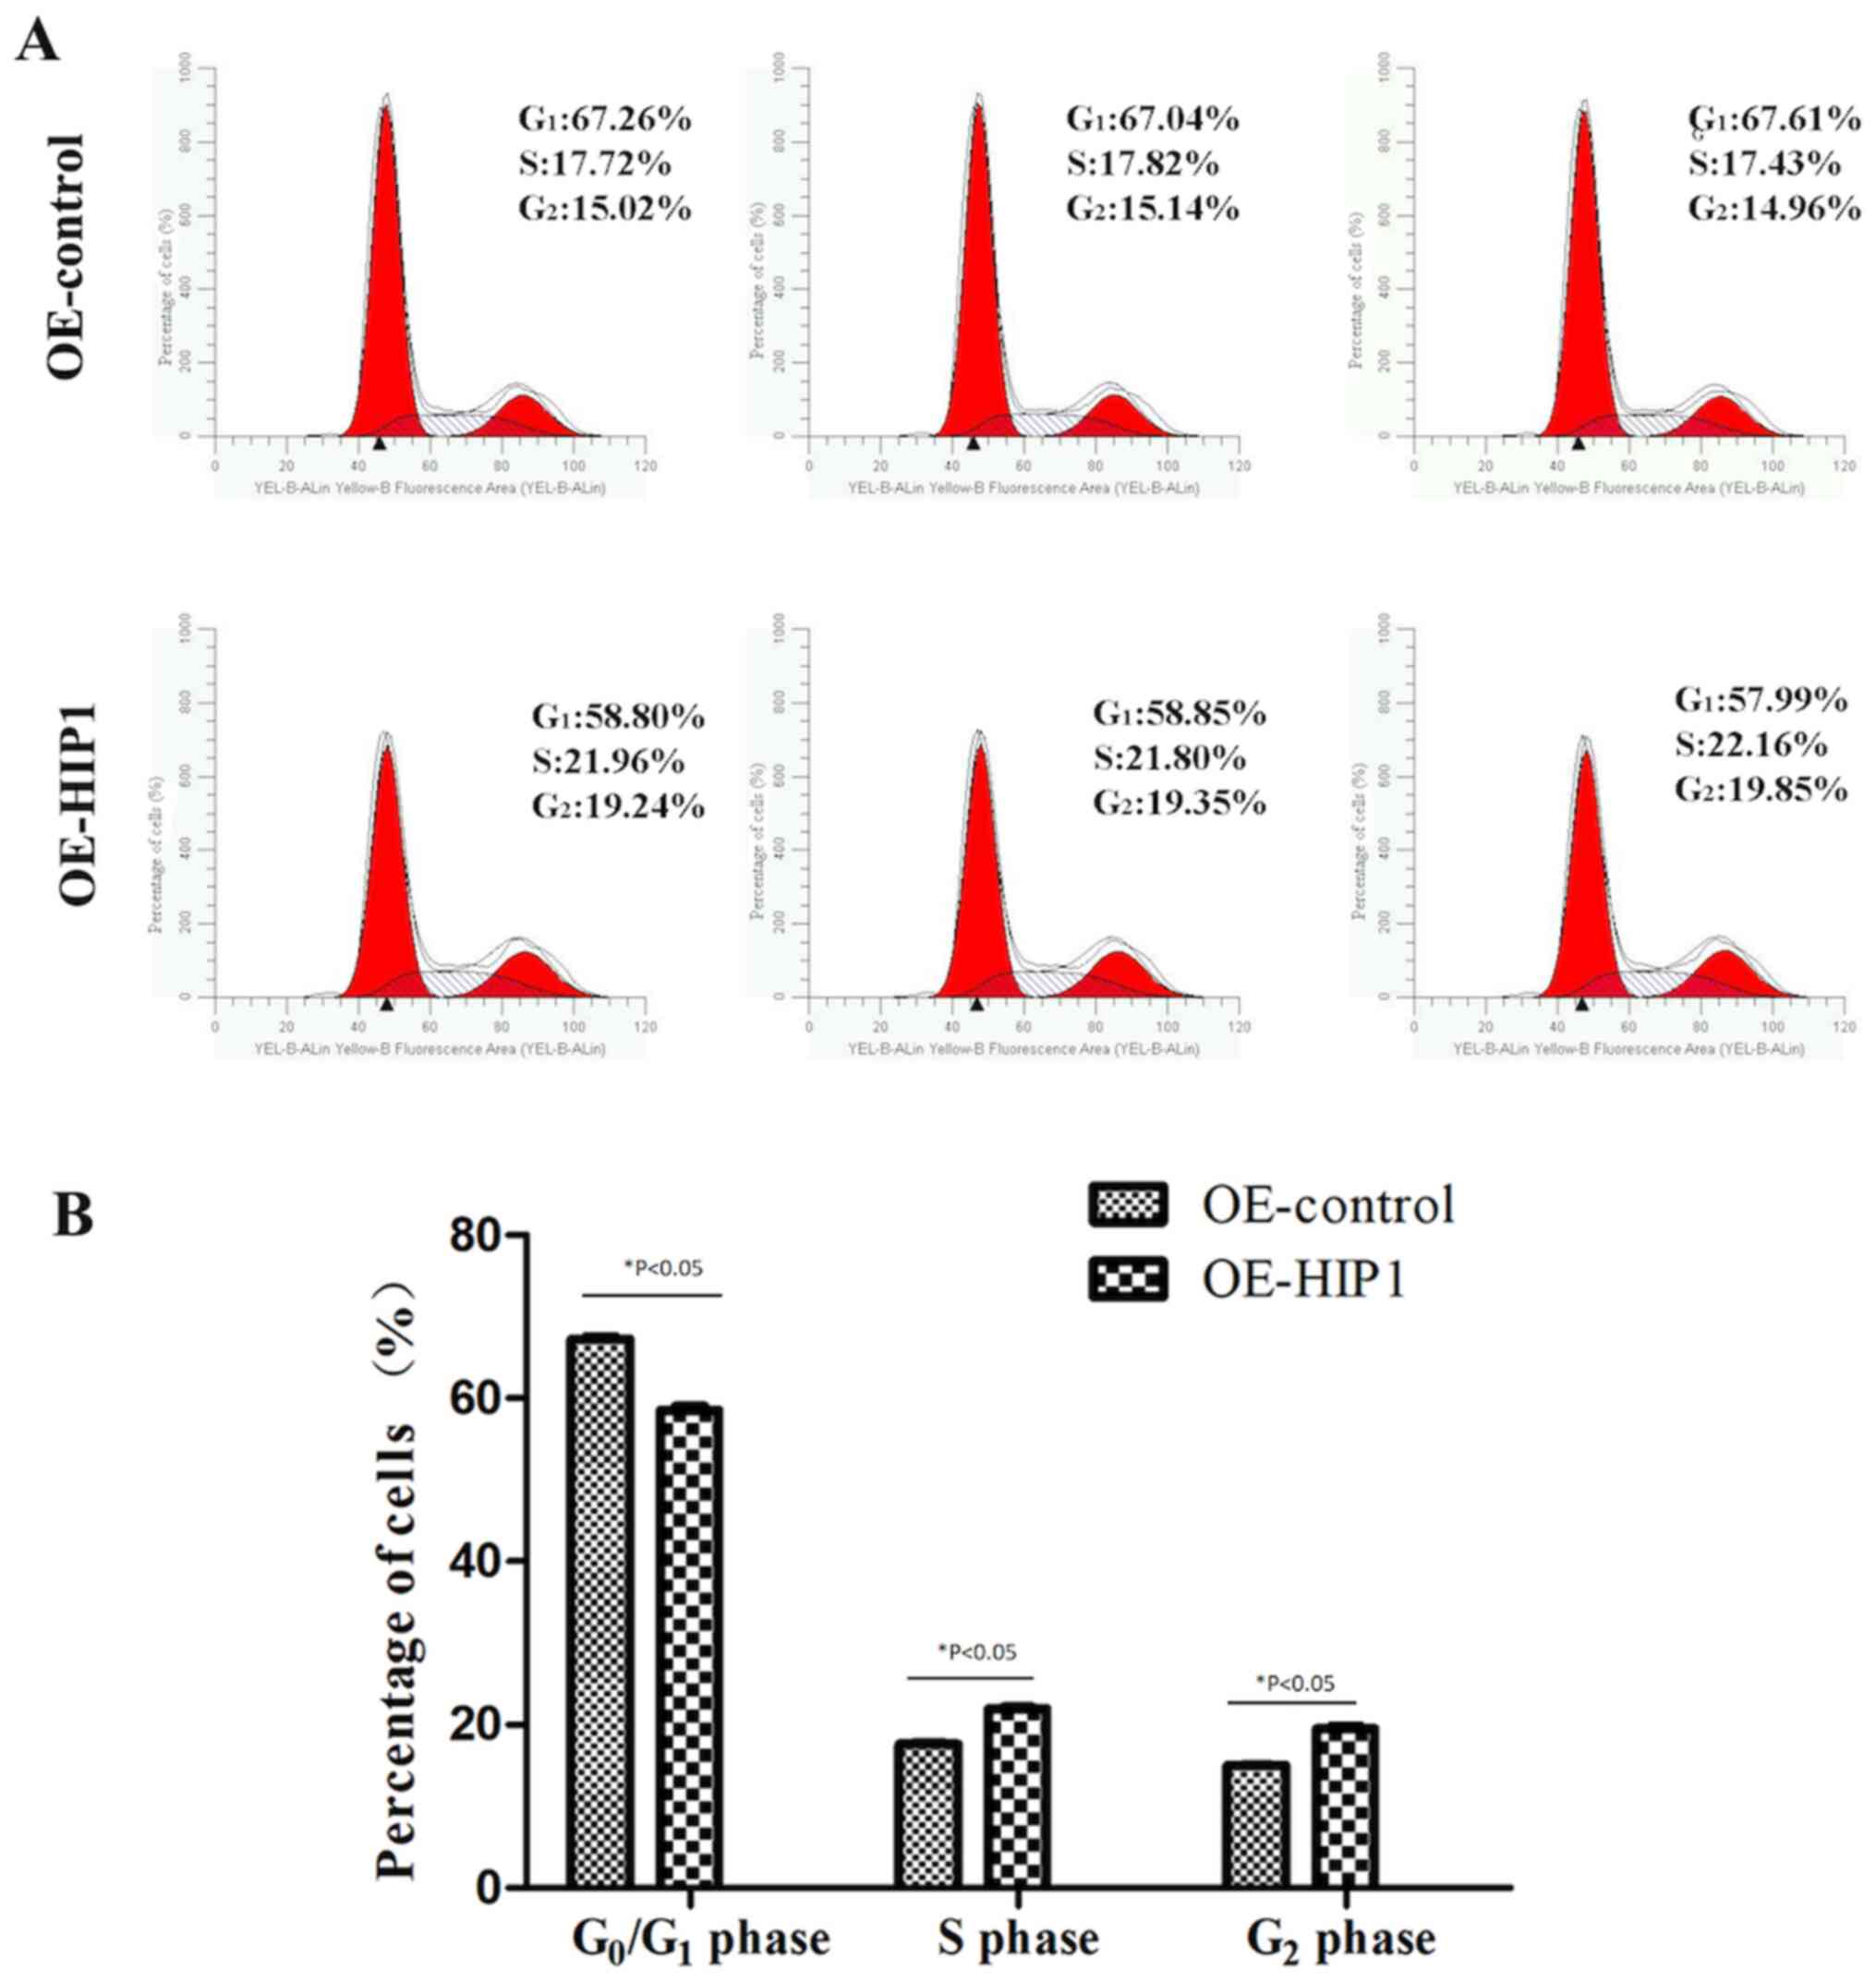
Overexpression of HIP1 induces Kyse30
cells to enter the S and G2 phases from the
G1 phase
Flow cytometric analysis demonstrated that
overexpression of HIP1 decreased the proportion of Kyse30 cells in
the G1 phase (58.55±0.48% vs. 67.31±0.29%; P<0.05),
with concomitant increase in the S phase (21.97±0.18% vs.
17.66±0.20%; P<0.05) and G2 phase (19.48±0.33% vs.
15.04±0.09%; P<0.05), compared with the OE-control cells
(Fig. 7A and B). Taken together,
these results suggest that overexpression of HIP1 may induce Kyse30
cells to enter the S and G2 phases from the
G1 phase of the cell cycle.
Discussion
Efforts of molecular targeted drugs in tumor therapy
are encouraging. However, there is a notable lag in the treatment
of esophageal cancer, thus it remains critical to identify novel
biomarkers for early diagnosis and prognosis prediction. Previous
studies have demonstrated the oncogenic function of HIP1, since it
association with cancer was reported in 1997–1998 (18,19).
These findings suggest that HIP1 may be a novel oncogene in tumors.
However, the role and underlying molecular mechanism of HIP1 in
ESCC have not yet been reported. Thus, the present study aimed to
investigate the role of HIP1 in ESCC tumor progression.
IHC analysis was performed to detect HIP1 expression
in 173 patients with ESCC. The results demonstrated that 89.6%
(155/173) of patients with ESCC expressed HIP1. HIP1 mRNA and
protein expression levels were also assessed via RT-qPCR and
western blot analyses. The results demonstrated that HIP1 mRNA and
protein expression levels were significantly higher in ESCC tissues
compared with adjacent normal tissues. Wang et al (20) reported that elevated HIP1 expression
is present in 67% of acute myeloid leukemia. By expanding the
clinical sample size, the present study confirmed that patients
with ESCC have elevated HIP1 mRNA and protein expression levels,
suggesting that HIP1 expression is easily detectable in ESCC
tissues. Hsu et al (21)
demonstrated that low HIP1 expression is associated with clinical
stage and inhibits the metastasis in non-small cell lung cancer.
The results of the present study demonstrated that HIP1 expression
was significantly associated with histological differentiation, TNM
stage and lymph node metastasis in patients with ESCC. However, no
significant association was observed between HIP1 expression and
smoking. Given that alcohol consumption was not included in the
clinicopathological data, the association between HIP1 expression
and alcohol consumption was not statistically analyzed in the
present study. Thus, this will be investigated in prospective
studies. In addition, whether there are other genes that cause
abnormal HIP1 expression, or whether HIP1 is like the epidermal
growth factor receptor gene in lung cancer remains the focus of
future research. Taken together, the results of the present study
suggest that HIP1 plays an important role in the occurrence and
development of ESCC. However, whether HIP1 promotes or inhibits
ESCC transfer needs to be confirmed through subsequent
experiments.
The effect of different clinicopathological
characteristics on the OS time of patients with ESCC was also
investigated in the present study. Survival analysis demonstrated
that differentiation, TNM stage and lymph node metastasis were all
significantly associated with poor prognosis of ESCC. Similarly,
Wang et al (20) reported
that HIP1 expression is associated with poor prognosis in patients
with acute myeloid leukemia. The results of the present study
demonstrated that patients with high HIP1 expression had a
significantly shorter survival time than patients with low HIP1
expression. Thus, it was hypothesized that HIP1 may be a
transforming factor associated with poor prognosis in the
development of ESCC.
Kaplan-Meier survival analysis demonstrated that
differentiation, TNM stage, lymph node metastasis and HIP1
expression were all significantly associated with the prognosis of
patients with ESCC. Notably, multivariate survival analysis
demonstrated that differentiation, TNM stage and HIP1 expression
were independent prognostic factors. Given that the TNM stage
includes lymph node metastasis, only pathological grade, TNM stage
and HIP1 expression were included in the multivariate survival
analysis. The results demonstrated that the effect of HIP1
expression was more significant on the prognosis compared with
differentiation and TNM stage, which may be closely associated with
the importance of HIP1 on the prognosis of patients with ESCC.
Collectively, these results suggest that HIP1 may be used as a
potential independent biomarker to predict the prognosis of
patients with ESCC.
The present study investigated the biological
effects of inhibiting and overexpressing HIP1 on ESCC cell mobility
in vitro. The results of the MTT, wound healing, and
migration and invasion assays demonstrated that overexpressing HIP1
increased the proliferation, migration and invasion of Kyse30
cells, whereas silencing HIP1 decreased the proliferation,
migration and invasion of EC109 cells. Flow cytometric analysis
demonstrated that overexpression of HIP1 induced Kyse30 cells to
enter the S and G2 phases from the G1 phase
of the cell cycle, while HIP1 knockdown arrested EC109 cells in the
G1 phase. The results of the present study demonstrated
that HIP1 affected cell cycle as well as cell migration and
invasion; however, it is unclear whether these processes involve
the same molecular mechanisms. It was speculated that when the
esophagus becomes cancerous, HIP1 expression increases, which is
accompanied by the proliferation of cancer cells and migration of
cells into the S and G2 phases. However, this
speculation requires further investigation. Taken together, these
results suggest that high HIP1 expression is closely associated
with the development of esophageal cancer.
In conclusion, the results of the present study
demonstrated that HIP1 expression was significantly higher in ESCC
tissues compared with adjacent normal tissues. In addition, HIP1
expression was significantly associated with histological
differentiation, TNM stage and lymph node metastasis. Notably, high
HIP1 expression was associated with poor prognosis. Survival
analysis demonstrated that HIP1 may be an independent predictor and
potential target for patients with ESCC. The results also
demonstrated that overexpressing HIP1 promoted ESCC cell
proliferation in vitro, while suppressing HIP1 inhibited
ESCC cell proliferation by regulating the cell cycle. However,
further studies involving animal experiments and clinical trials
are required to determine whether HIP1 is a clinical therapeutic
target for ESCC.
Acknowledgements
Not applicable.
Funding
The present study was supported by the Air Force
Medical University Tangdu Hospital Innovation and Development
foundation (grant no. 2016JCYJ009).
Availability of data and materials
The datasets used and analyzed during the present
study are available from the corresponding author upon reasonable
request.
Authors' contributions
YaZ, ZZ and TJ designed the present study. YS, JX,
XW and YoZ performed the experiments. MW and JZ analyzed the data,
and YS, YaZ, ZZ and TJ prepared and revised the manuscript for
important intellectual content. All authors have read and approved
the final manuscript.
Ethics approval and consent to
participate
The present study was approved by the Regional
Ethics Committee for Clinical Research of the Air Force Military
Medical University (Xi'an, China; approval no. TDLL-201712-22).
Written informed consent was provided by all patients prior to the
study start for use of their medical records and tissue specimens
for research purposes.
Patient consent for publication
Not applicable.
Competing interests
The authors declare that they have no competing
interests.
References
|
1
|
Lee YT, Tan YJ and Oon CE: Molecular
targeted therapy: Treating cancer with specificity. Eur J
Pharmacol. 834:188–196. 2018. View Article : Google Scholar
|
|
2
|
da Cunha Santos G, Shepherd FA and Tsao
MS: EGFR mutations and lung cancer. Annu Rev Pathol. 6:49–69. 2011.
View Article : Google Scholar
|
|
3
|
Mahtani R, Holmes FA, Badve S, Caldera H,
Coleman R, Mamounas E, Kalinsky K, Kittaneh M, Lower E, Pegram M,
et al: A roundtable discussion of the breast cancer therapy expert
group (BCTEG): Clinical developments and practice guidance on human
epidermal growth factor receptor 2 (HER2)-positive breast cancer.
Clin Breast Cancer. 20:e251–e260. 2020. View Article : Google Scholar
|
|
4
|
Zhang L, Wang H, Li W, Zhong J, Yu R,
Huang X, Wang H, Tan Z, Wang J and Zhang Y: Pazopanib, a novel
multi-kinase inhibitor, shows potent antitumor activity in colon
cancer through PUMA-mediated apoptosis. Oncotarget. 8:3289–3303.
2017. View Article : Google Scholar
|
|
5
|
Kalchman MA, Koide HB, McCutcheon K,
Graham RK, Nichol K, Nishiyama K, Kazemi-Esfarjani P, Lynn FC,
Wellington C, Metzler M, et al: HIP1, a human homologue of S.
cerevisiae Sla2p, interacts with membrane-associated huntingtin
in the brain. Nat Genet. 16:44–53. 1997. View Article : Google Scholar
|
|
6
|
Waelter S, Scherzinger E, Hasenbank R,
Nordhoff E, Lurz R, Goehler H, Gauss C, Sathasivam K, Bates GP,
Lehrach H and Wanker EE: The huntingtin interacting protein HIP1 is
a clathrin and alpha-adaptin-binding protein involved in
receptor-mediatendocytosis. Hum Mol Genet. 10:1807–1817. 2001.
View Article : Google Scholar
|
|
7
|
Metzler M, Legendre-Guillemin V, Gan L,
Chopra V, Kwok A, McPherson PS and Hayden MR: HIP1 functions in
clathrin-mediated endocytosis through binding to clathrin and
adaptor protein 2. J Biol Chem. 276:39271–39276. 2001. View Article : Google Scholar
|
|
8
|
Gottfried I, Ehrlich M and Ashery U: HIP1
exhibits an early recruitment and a late stage function in the
maturation of coated pits. Cell Mol Life Sci. 66:2897–2911. 2009.
View Article : Google Scholar
|
|
9
|
Bradley SV, Smith MR, Hyun TS, Lucas PC,
Li L, Antonuk D, Joshi I, Jin F and Ross TS: Aberrant Huntingtin
interacting protein 1 in lymphoid malignancies. Cancer Res.
67:8923–8931. 2007. View Article : Google Scholar
|
|
10
|
Marghalani S, Feller JK, Mahalingam M and
Mirzabeigi M: Huntingtin interacting protein 1 as a histopathologic
adjunct in the diagnosis of merkel cell carcinoma. Int J Dermatol.
54:640–647. 2015. View Article : Google Scholar
|
|
11
|
Rao DS, Hyun TS, Kumar PD, Mizukami IF,
Rubin MA, Lucas PC, Sanda MG and Ross TS: Huntingtin-interacting
protein 1 is overexpressed in prostate and colon cancer and is
critical for cellular survival. J Clin Invest. 110:351–360. 2002.
View Article : Google Scholar
|
|
12
|
Sun Y, Han Y, Wang X, Wang W, Wang X, Wen
M, Xia J, Xing H, Li X and Zhang Z: Correlation of EGFR Del 19 with
Fn14/JAK/STAT signaling molecules in non-small cell lung cancer.
Oncol Rep. 36:1030–1040. 2016. View Article : Google Scholar
|
|
13
|
Zhao J, Zhou Y, Zhang Z, Tian F, Ma N, Liu
T, Gu Z and Wang Y: Upregulated fascin1 in non-small cell lung
cancer promotes the migration and invasiveness, but not
proliferation. Cancer Lett. 290:238–247. 2010. View Article : Google Scholar
|
|
14
|
Wang WP, Sun Y, Lu Q, Zhao JB, Wang XJ,
Chen Z, Ni YF, Wang JZ, Han Y, Zhang ZP, et al: Gankyrin promotes
epithelial-mesenchymal transition and metastasis in NSCLC through
forming a closed circle with IL-6/STAT3 and TGF-β/SMAD3 signaling
pathway. Oncotarget. 8:5909–5923. 2017. View Article : Google Scholar
|
|
15
|
Liu T, Li WM, Wang WP, Sun Y, Ni YF, Xing
H, Xia JH, Wang XJ, Zhang ZP and Li XF: Inhibiting CREPT reduces
the proliferation and migration of non-small cell lung cancer cells
by down-regulating cell cycle related protein. Am J Transl Res.
8:2097–2113. 2016.
|
|
16
|
Liang CC, Park AY and Guan JL: In vitro
scratch assay: A convenient and inexpensive method for analysis of
cell migration in vitro. Nat Protoc. 2:329–333. 2007. View Article : Google Scholar
|
|
17
|
Donohoe CL and Phillips AW: Cancer of the
esophagus and esophagogastric junction: An 8th edition staging
primer. J Thorac Dis. 9:E282–E284. 2017. View Article : Google Scholar
|
|
18
|
Ross TS, Bernard OA, Berger R and
Gilliland DG: Fusion of Huntingtin interacting protein 1 to
platelet-derived growth factor beta receptor (PDGFbetaR) in chronic
myelomonocytic leukemia with t(5;7)(q33;q11.2). Blood.
91:4419–4426. 1998. View Article : Google Scholar
|
|
19
|
Hong M, Kim RN, Song JY, Choi SJ, Oh E,
Lira ME, Mao M, Takeuchi K, Han J, Kim J and Choi YL: HIP1-ALK, a
novel fusion protein identified in lung adenocarcinoma. J Thorac
Oncol. 9:419–422. 2014. View Article : Google Scholar
|
|
20
|
Wang J, Yu M, Guo Q, Ma Q, Hu C, Ma Z, Yin
X, Li X, Wang Y, Pan H, et al: Prognostic significance of
huntingtin interacting protein 1 expression on patients with acute
myeloid leukemia. Sci Rep. 7:459602017. View Article : Google Scholar
|
|
21
|
Hsu CY, Lin CH, Jan YH, Su CY, Yao YC,
Cheng HC, Hsu TI, Wang PS, Su WP, Yang CJ, et al:
Huntingtin-interacting protein-1 is an early-stage prognostic
biomarker of lung adenocarcinoma and suppresses metastasis via
Akt-mediated epithelial-mesenchymal transition. Am J Respir Crit
Care Med. 193:869–880. 2016. View Article : Google Scholar
|