Introduction
Leukaemia stem cells (LSCs) present similar
morphology to normal haematopoietic stem cells and are
characterized by their self-renewal capacity and differentiation
potential (1). The sub-population of
LSCs existing in leukaemia is considered to contribute to leukaemia
chemoresistance, relapse and prognosis (2,3).
Completely eliminating LSCs and reducing doses of chemotherapeutic
agents is one of most promising strategies for improving the
prognosis in patients with leukaemia (4). LSCs are also characterized by the
surface markers CD34+ and CD38−, which are
widely expressed in the human leukaemia cell line KG-1α (5,6).
Notably, KG-1α cells have a similar phenotype of self-renewal
capacity and chemoresistance to LSCs, including sensitivity to the
widely used chemoagent cytarabine arabinoside (Ara-C) (5,6) and are
thus considered an ideal cell model for LSC investigation.
Hypoxia is a critical regulator of tumourigenesis
mainly by stimulating angiogenesis through hypoxia-inducible factor
(HIF)-1α-mediated upregulation of VEGF. Hypoxia regulates the
microenvironment and exerts pro-survival effects on acute myeloid
leukaemia (AML) cells by activating the PI3K/Akt pathway via
directly upregulating HIF-1α (7).
Moreover, hypoxia also regulates malignant behaviors of LSCs via
activating HIF-1α activity. Zhang et al (8) previously reported that HIF-1α, a master
transcriptional regulator responsible for hypoxia exposure, is
essential for survival maintenance of LSCs by activating TGF-β. It
has also been demonstrated that HIF-1α has a protective role for
LSCs against oxidative stress under hypoxic conditions,
chemotreatment and oncogene transformation (8). Although accumulating evidence suggests
that HIF-1α serves a critical regulatory role in LSCs, the
molecular mechanisms by which hypoxia regulates LSCs are still
largely unknown (9,10).
Several studies have revealed that B-cell-specific
Moloney murine leukaemia virus integration site (BMI)-1 plays an
important role in maintaining the self-renewal capacity of LSCs, as
well as in normal haematopoietic stem cells (11–14).
BMI-1 functions as a transcriptional inhibitor and represses the
transcription of a range of target genes, including
cyclin-dependent kinase inhibitor 2A and HOX cluster genes
(15,16). It is also reported that BMI-1 is
overexpressed in AML and is associated with aggressiveness and poor
outcome for patients with AML (17,18).
This is possibly due to the hypoxic microenvironment of the bone
marrow, where LSCs mainly exist (19). Inhibition of BMI-1 using a
preclinical medicine, PTC-209, markedly suppresses colorectal
cancer cell growth and eradicates cancer-initiating cells (20). In LSCs, inhibition of BMI-1 induces
apoptosis and promotes the phosphorylation of the Akt pathway in
CD34+CD38− cells from patients with AML
(21). Accordingly, hypoxic stress
may regulate LSCs by regulating BMI-1 expression.
The present study investigated the effects of
hypoxia on the malignant behaviours of LSCs derived from KG-1α
cells and the mechanisms of action in LSCs. The results provide
evidence demonstrating that hypoxia-stimulated HIF-1α
transcriptionally activated BMI-1 and thus activated the PI3K/Akt
and EMT pathways.
Materials and methods
Cell culture and treatment
The human leukaemia cell line KG-1α bought from the
American Type Culture Collection was cultured in RPMI-1640
supplemented with 10% fetal bovine serum (FBS, Gibco; Thermo Fisher
Scientific, Inc.) and 1% penicillin/streptomycin. To sort the LSC
subpopulation, cells were separated and enriched for
CD34+CD38− sub-population using magnetic
microbeads (Miltenyi Biotec, Inc.). PE-labelled CD34 (CD34-PE),
FITC-labelled CD38 (CD38-FITC) or specific isotype control
antibodies were bought from Abcam. In total, eight newly diagnosed
and untreated patients with AML (6 males and 2 females) ranging
from 3–13 years (median age of 8 years) were involved in the
present study and LSC subpopulation was separated from peripheral
blood samples. As inclusion criteria, all patients with AML
classified as the M1 or M2 French-American-British (FAB) subtypes
were included (22), and all other
patients were excluded. Written informed consent was obtained from
all the parents of the patients in this study. The samples were
obtained from the West China Second University Hospital of Sichuan
University (Chengdu, China) between September 2019 and October
2019. The study was approved by the Institutional Ethics Committee
of the West China Second University Hospital of Sichuan University
(Chengdu, China). The same sorting procedure as aforementioned was
performed.
For hypoxia exposure, LSCs were cultured in a gas
generator system (Model MCO 18 M; Sanyo Biomedical Electrical Co.;
http://www.panasonic.com/global/home.html) containing
1% O2, 5% CO2 and 94% N2 for 48 h.
As the normoxic control, LSCs were cultured in 20% O2,
5% CO2 and 75% N2 for 48 h. For
CoCl2 and echinomycin treatment, LSCs were cultured in
original medium supplemented with 125 nM CoCl2 or 200 nM
echinomycin in normoxic or hypoxic condition for 0–48 h.
Western blotting
Total protein was extracted using a
SoniConvert® sonicator (DocSense; http://www.doc-sense.com/index.html) following the
manufacturer's instruction at room temperature for 3 sec and
concentration was measured using a BCA assay (Sigma Aldrich; Merck
KGaA) and 20 µg total protein was loaded per well onto a 6–10%
gradient polyacrylamide gel and resolved using SDS-PAGE. Then the
fractionated proteins were transferred to a PVDF membrane (EMD
Millipore). Then membrane was blocked with blocking buffer (0.1%
Tween-20 in 5% skimmed milk) at room temperature for 0.5 h. The
primary antibodies used were are follows: Anti-HIF-1α (cat. no.
ab16066, diluted in 1:1,000), anti-BMI-1 (cat. no. ab38295, diluted
in 1:1,000), anti-β-actin (cat. no. ab8226, diluted in 1:2,000),
anti-cleaved caspase-3 (cat. no. ab2302, diluted in 1:1,000),
anti-PI3K p85 (cat. no. ab180967, diluted in 1:1,000), anti-PI3K
antibody (cat. no. ab32089; 1:1,000), anti-pan-AKT (phosphorylated
T308) (cat. no. ab38449; 1:1,000), anti-pan-AKT (cat. no. ab8805;
1:1,000), anti-E cadherin (cat. no. ab1416; 1:1,000) and
anti-vimentin (cat. no. ab193555; 1:1,000) were all bought from
Abcam. Then, the membrane was washed with 0.1% Tween-20
Tris-buffered saline and incubated with horseradish peroxidase
(HRP)-conjugated secondary antibodies (goat anti-rabbit IgG
H&L; cat. no. ab6721; 1:10,000) for 0.5 h at room temperature.
The bound antibodies were detected using a ECL detection kit (EMD
Millipore). β-actin was used as an internal control. The density of
the bands was analyzed using the Quantity One software version
4.3.1 (Bio-Rad Laboratories, Inc.).
Luciferase reporter assay
The dual-luciferase reporter assay kit (Promega
Corporation) was employed to evaluate the interaction between
hypoxia- or CoCl2-induced HIF-1α and BMI-1 promoter
region. The sequences of the promoter region (−877 to +23 bp
upstream of transcriptional start point) of BMI-1 was cloned into
the luciferase reporter pGL4.11 (Promega, Corporation). In total,
1×10⁵ LSCs sorted from KG-1α cells were cultured in
12-well plates, transfected with BMI-1 promoter region (Beyotime
Institute of Biotechnology), and then cells were exposed to hypoxia
or CoCl2 according to the kit manufacturer's protocol
(23). Luciferase activity was
measured 48 h after transfection using the Dual-Luciferase Reporter
Assay system (Beyotime Institute of Biotechnology) and firefly
luciferase readings were normalized to the activity of
Renilla luciferase enzyme.
Cell Counting Kit (CCK)-8 assay
To detect cell viability, ~5.0×10³ cells
were seeded into each well of a 96-well plate. In total, 10 µl
CCK-8 (Sigma-Aldrich; Merck KGaA) was added to each well and
incubated for 4 h. Cell viability was evaluated based on absorbance
at 490 nm in a microplate reader (Synergy 2 Multi-Mode Microplate
Reader; BioTek Instruments, Inc.). Inhibitory concentration (IC)
was calculated according to the following formula: % inhibition
=[1-(Absorbance of treatments/absorbance of DMSO) ×100].
IC30 and IC50 values of Ara-c, which
represent the concentration of Ara-c that is required for 30 or 50
inhibition in vitro, were marked on X and Y axis
respectively. The combination index of each treatment was
calculated according to the classic isobologram equation
combination index=
[(D)1/(Dx)1]+[(D)2/(Dx)2]
(24). The percent inhibition was
calculated according to the following formula: % Inhibition
=[1-(absorbance of treatments/absorbance of DMSO) ×100].
Apoptosis assay
To detect total apoptosis, cells were collected and
incubated with 5 µl binding reagent and 5 µl Annexin V-FITC (BD
Biosciences). After 30-min incubation, cells were washed three
times with PBS and stained with 5 µl propidium iodide (PI; Sigma
Aldrich; Merck KGaA) for 15 min at room temperature according to
the manufacturer's instructions. The lethal dose (LD)50 was defined
as the concentration of the drug required to induce cell death by
50%. LD50 was calculated by detecting the apoptosis rate after
treatment with different Ara-c concentrations. Briefly, inhibition
rate was calculated according to the following formula =[1-(death
rate of treatments/death rate of DMSO) ×100]. LD50 was the
concentration that induces 50% inhibiting rate. The experiments
were repeated three times. All data were analysed and calculated
using FlowJo software 7.2.4 (Tree Star, Inc.).
Small interfering (si)RNA
transfection
To knock down the expression of BMI-1 in LSCs, the
BMI-1-specific siRNA was synthesized by Guangzhou RiboBio Co., Ltd.
The sequences of the siRNAs used to suppress BMI-1 were as follows:
forward, 5′-GCGGUAACCACCAAUCUUCdTdT-3′ and reverse,
3′-dTdTCGCCAUUGGUGGUUAGAAG-5′, which targeted the sequence of
5′-GCGGTAACCACCAATCTTC-3′. The scrambled siRNA sequences were
employed as negative control as follows: forward,
5′-GACAUGAuCUCCGACCAUCdTdT-3′ and reverse,
3′-dTdTCGCGUGAGGUUGAAUCGAU-5′. The siRNA or scrambled siRNA were
mixed with Lipofectamine® 2000 (Invitrogen; Thermo
Fisher Scientific, Inc.) according to the manufacturer's
instructions. After transfection for 72 h, total protein and RNAs
were prepared from the cells using TRIzol® reagent
(Invitrogen; Thermo Fisher Scientific, Inc.) following
manufacturer's instructions, and were subjected to western blot
analysis and quantitative PCR (qPCR) by using BlazeTaq™
SYBR® Green qPCR Mix 2.0 kit (Guangzhou RiboBio Co.,
Ltd.), respectively. The primers for detecting BMI-1 and β-actin
mRNA were descripted as follows: BMI-1, forward,
5′-CCACCTGATGTGTGTGCTTG-3′ and reverse,
5′-TTCAGTAGTGGTCTGGTCTTGT-3′; β-actin, forward,
5′-CATGTACGTTGCTATCCAGGC-3′ and reverse,
5′-CTCCTTAATGTCACGCACGAT-3′. The concentration of purified RNA was
determined by the UV spectrophotometer (Invitrogen; Thermo Fisher
Scientific, Inc.). CDNA was reversibly transcribed from the
extracted total RNA using a Reverse Transcriptase kit (cat. no.:
QP006; Guangzhou RiboBio Co., Ltd.) according to the manufacturer's
protocol. The PCR reaction was performed on an Applied Biosystems
7500 Real-Time System (ABI 7500HT instrument). Thermocycling
conditions were also follows: 5 min At 50°C, 2 min at 95°C and 40
cycles of 10 sec at 95°C and 60 s at 60°C. Experiments were
performed in triplicate. The qPCR results were analyzed and
expressed relative to the threshold cycle (Cq) values, and were
then converted to fold-change values; all data was analyzed using
2−ΔΔCq method (25). A
2.0-fold change was considered to be significant (25). In total, three repeats were conducted
for each sample.
Colony formation in soft agar
For the soft agar assay, 1×10³ LSCs were
mixed with 0.3% low melting agar in RPMI-1640 medium supplemented
with 10% FBS and plated on a 0.6% low melting agar-coated 6-well
plate. The plates were incubated at 37°C in a humidified incubator
containing 5% CO2 for 2 weeks. Every well was stained
with 0.2 ml 0.05% crystal violet for 0.5 h at 37°C. The numbers of
positive colonies (>8 cells/colony) were counted. The
experiments were performed at least three times.
Statistical analysis
Statistical analysis was performed using SPSS
version 19.0 (IBM Corp.). The data are presented as the mean ± SD,
unless otherwise shown. A two-tailed unpaired Student's t-test was
used for statistical analysis. ANOVA was performed to compare
multiple groups with one variable followed by Tukey's post hoc
test. P<0.05 was considered to indicate a statistically
significant difference. The experiments were repeated at least
three times.
Results
Hypoxia exposure induces BMI-1
expression in LSCs
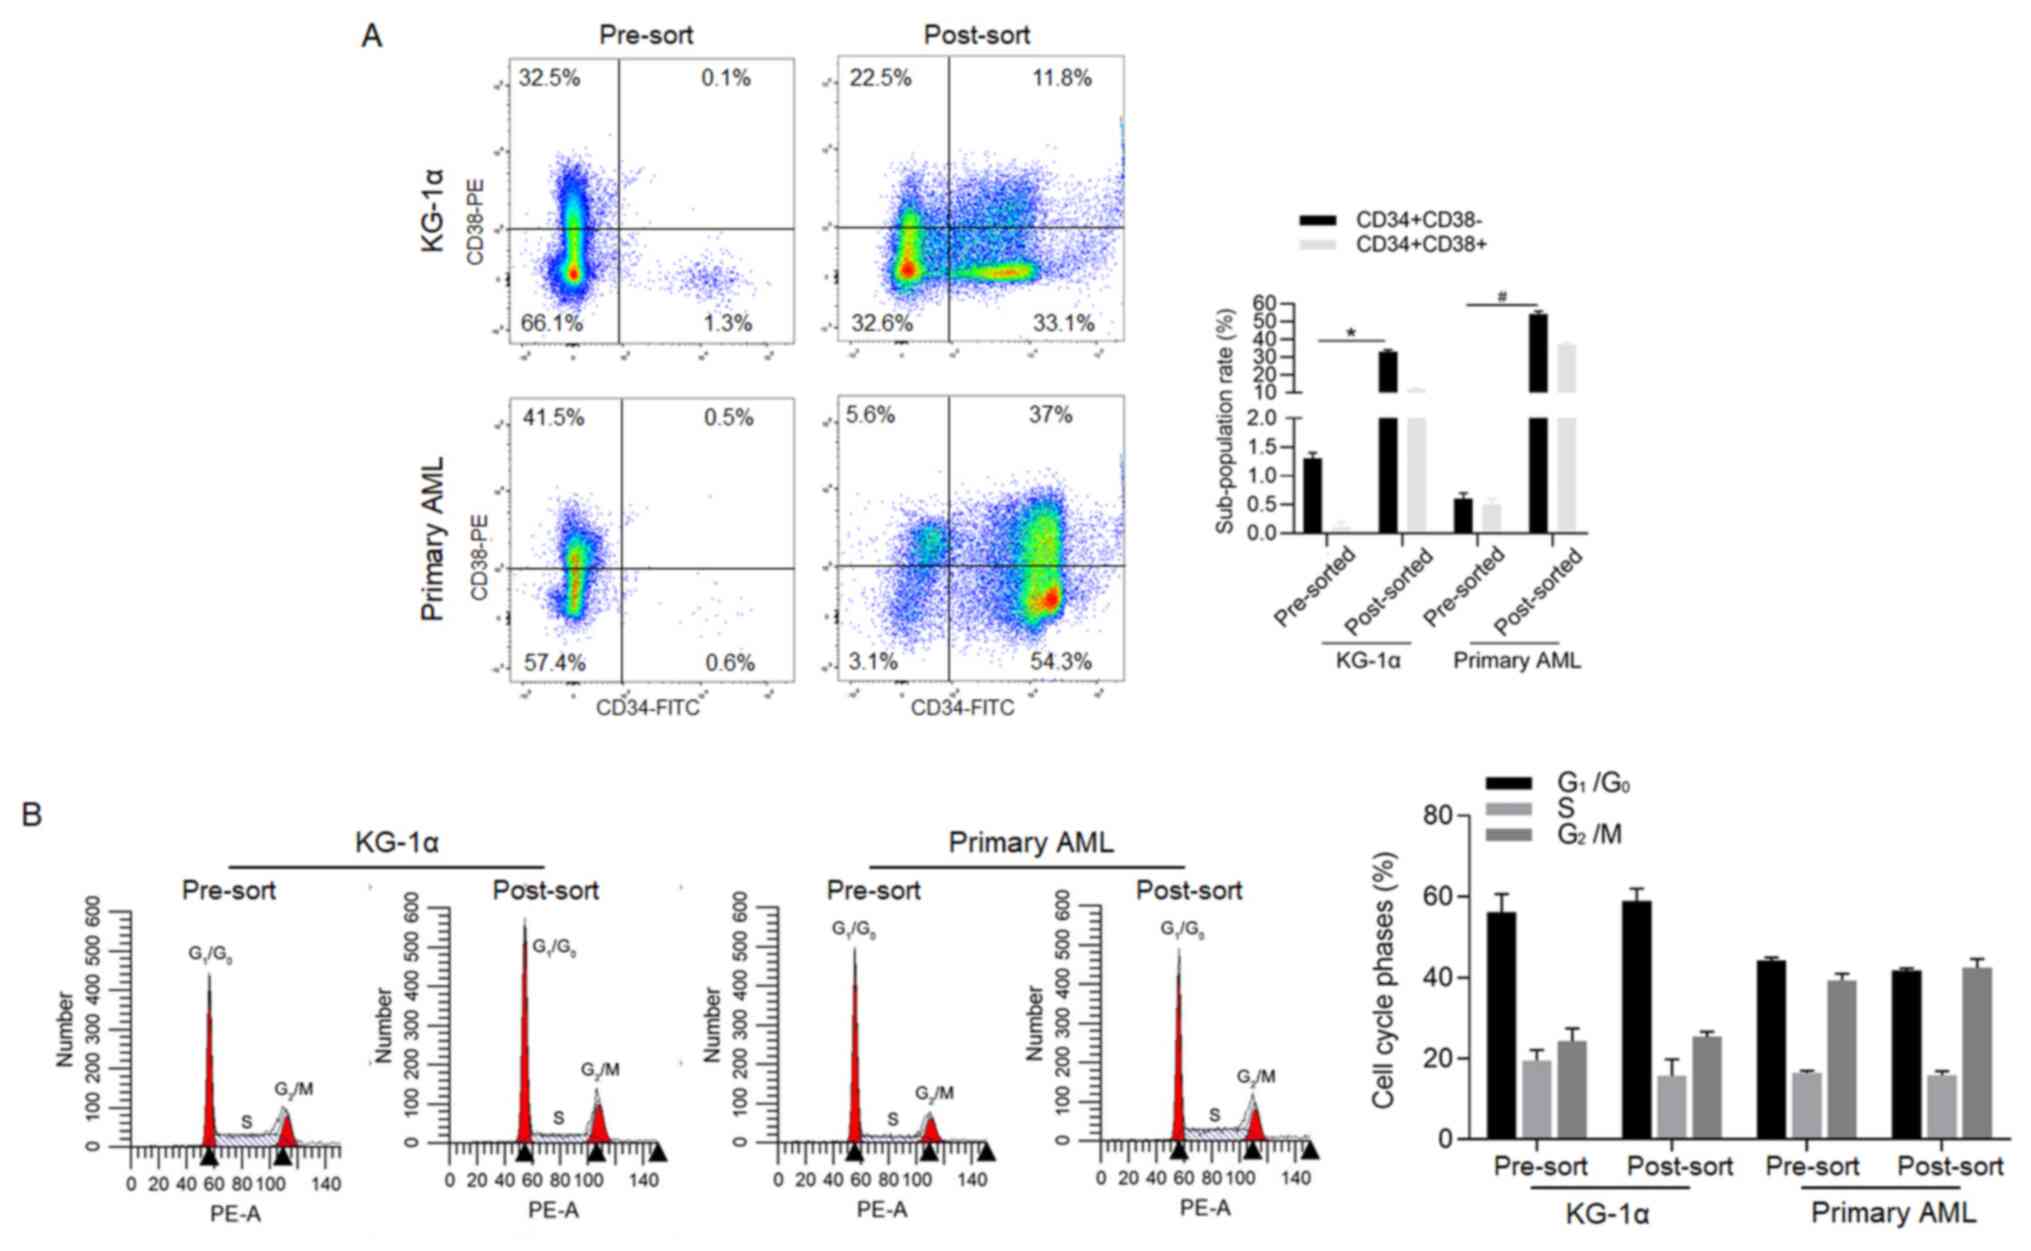
To obtain LSCs from KG-1α and primary AML cells,
cells were stained with anti-CD38 PE-conjugated antibody and
anti-CD34 FITC-conjugated antibody and sorted using flow cytometry,
then the proportion of CD34+CD38- was measured. As shown in
Fig. 1A, in post-sorted cells of
KG-1α, the proportion of CD34+CD38- (33.1±0.9%, in quadrant 3) was
significantly higher compared with that in pre-sorted cells
(1.3±0.3%, in quadrant 3). In post-sorted cells of primary AML, the
proportion of CD34+CD38- (54.3±0.7%, in quadrant 3) was also higher
compared with that in pre-sorted cells (0.6±0.3%, in quadrant 3).
Cell cycle analysis then demonstrated that there was no significant
difference in proliferation between pre-sorted and post-sorted
cells (Fig. 1B).
Enriched LSCs were exposed to hypoxia from 0–48 h
and then analysed using western blotting. The results demonstrated
that hypoxia significantly induced HIF-1α and BMI-1 protein levels
in LSCs after 18-h exposure to hypoxia (Fig. 2A). As shown in Fig. 2A, the steady-state level of BMI-1
increased at 6 h, reached a peak at 18 h, and was sustained at
least to 48 h after hypoxia exposure. Expectedly, upregulation of
HIF-1α was also observed after hypoxia exposure. To confirm whether
hypoxia upregulates HIF-1α and BMI-1 in primary AML LSCs, eight LSC
clones were exposed to hypoxia for 24 h. Consistently, both HIF-1α
and BMI-1 were notably upregulated (Fig.
2B). This indicated that the effect of hypoxia on HIF-1α and
BMI-1 were long-lasting, and so further analyses using LSCs sorted
from KG-1α cells were performed.
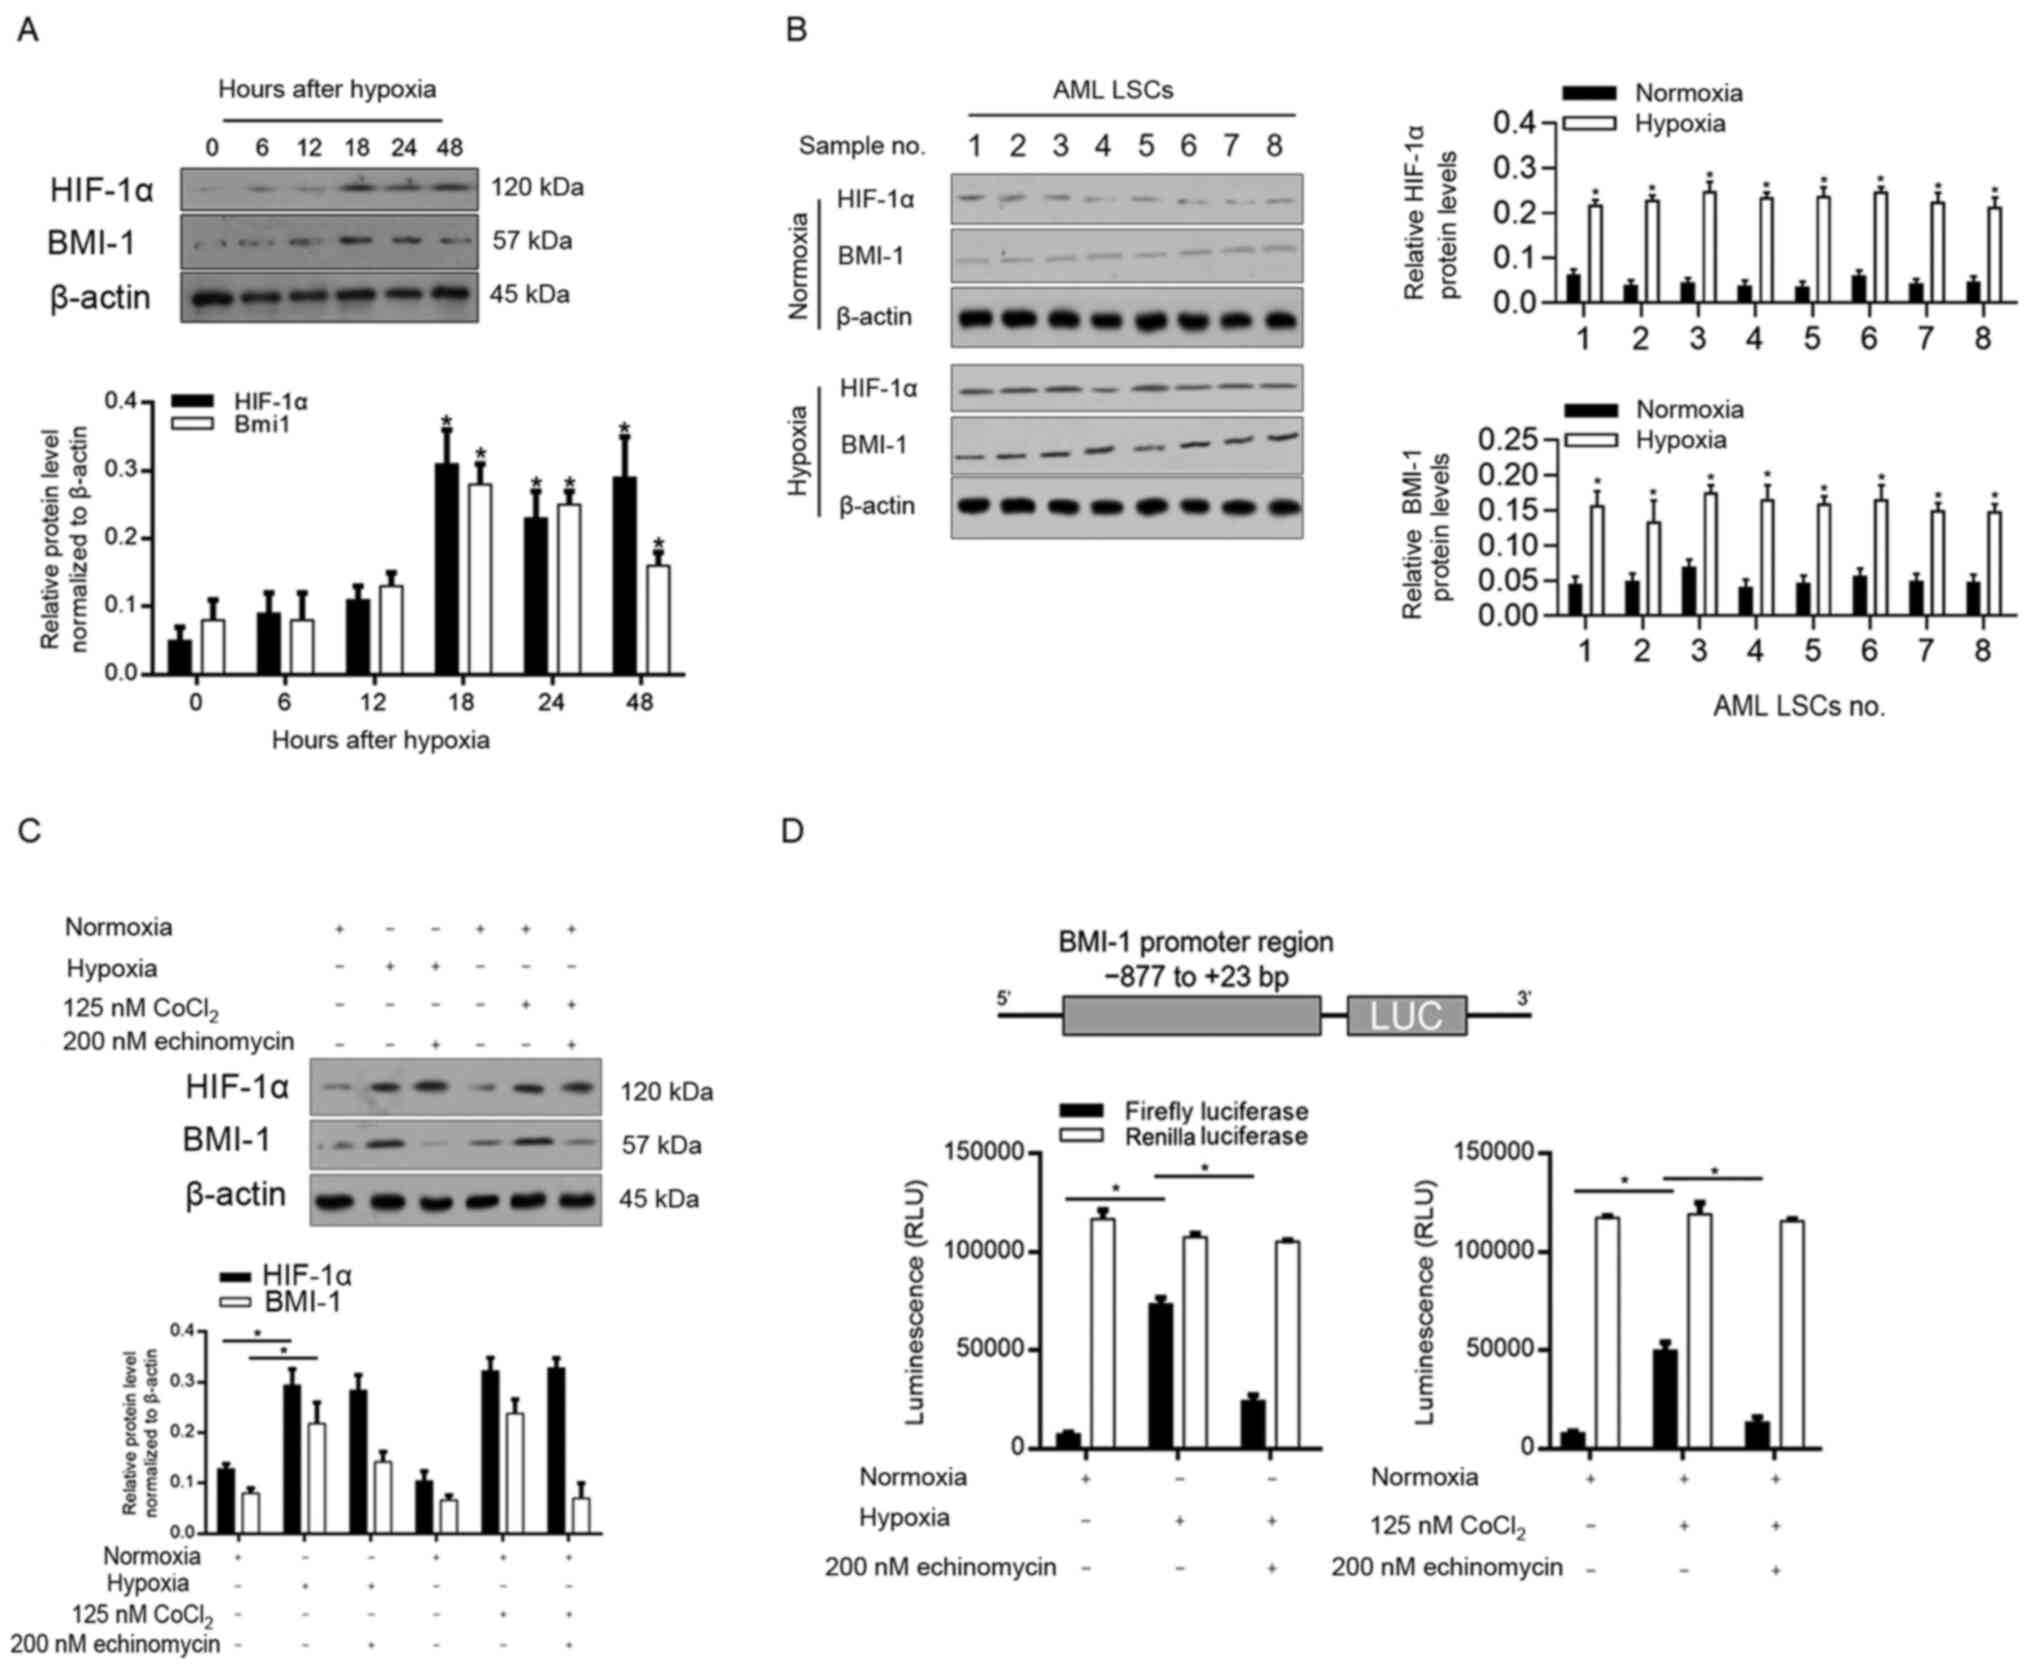 | Figure 2.Hypoxia exposure induces BMI-1
expression in LSCs sorted from KG-1α cells. (A) After hypoxia
exposure for 0–48 h, the protein levels of HIF-1α and BMI-1 were
measured by semi-quantitative western blotting in LSCs sorted from
KG-1α. (B) After hypoxia exposure, eight LSCs sorted from primary
AML samples were detected for HIF-1α and BMI-1 protein levels. (C)
HIF-1α and BMI-1 were measured after hypoxia and CoCl2
exposure with or without 200 nM echinomycin for 48 h in LSCs sorted
from KG-1α. (D) Relative luciferase activity of the BMI-1 promoter
reporter genes was measured in LSCs sorted from KG-1α. *P<0.05
vs. 0 h or normoxia group, *P<0.05, vs. 0 h or hypoxia group,
*P<0.05, vs. CoCl2 treated group. LSCs, leukaemia
stem cells; HIF-1α, hypoxia-inducible factor-1α; BMI-1, B
cell-specific Moloney murine leukaemia virus integration site 1;
AML, acute myeloid leukaemia; LUC. |
BMI-1 is transcriptionally activated by HIF-1α
induction after hypoxia exposure (22). To confirm whether BMI-1 is
transcriptionally regulated by HIF-1α, 125 nM CoCl2 was
added to induce HIF-1α under normoxic conditions and 200 nM
echinomycin was employed to abolish HIF-1α transcriptional
activity. As it is shown in Fig. 2C,
both hypoxia and CoCl2 exposure upregulated HIF-1α and
BMI-1, and addition of 200 nM echinomycin disturbed the
upregulation of BMI-1 without affecting HIF-1α, indicating that
transcriptional activity of HIF1-α is responsible for the
regulation of BMI-1 after hypoxia and CoCl2 exposure. To
further confirm whether hypoxia-induced BMI-1 is mediated by
HIF-1α, luciferase reporter plasmids were constructed containing
the BMI-1 promoter region (−877 to +23 bp; Fig. 2D) and tested the effects of HIF-1α on
their activity. Both hypoxia and CoCl2 exposure
increased luciferase activity compared with the normoxia group, and
are reversed by co-culturing with 200 nM echinomycin. These
findings suggested that BMI-1 upregulated by hypoxia was
transcriptionally dependent on HIF-1α. All these data indicated
that hypoxia exposure transcriptionally upregulated BMI-1 via
HIF-1α in LSCs.
Hypoxia induces chemoresistance in
LSCs
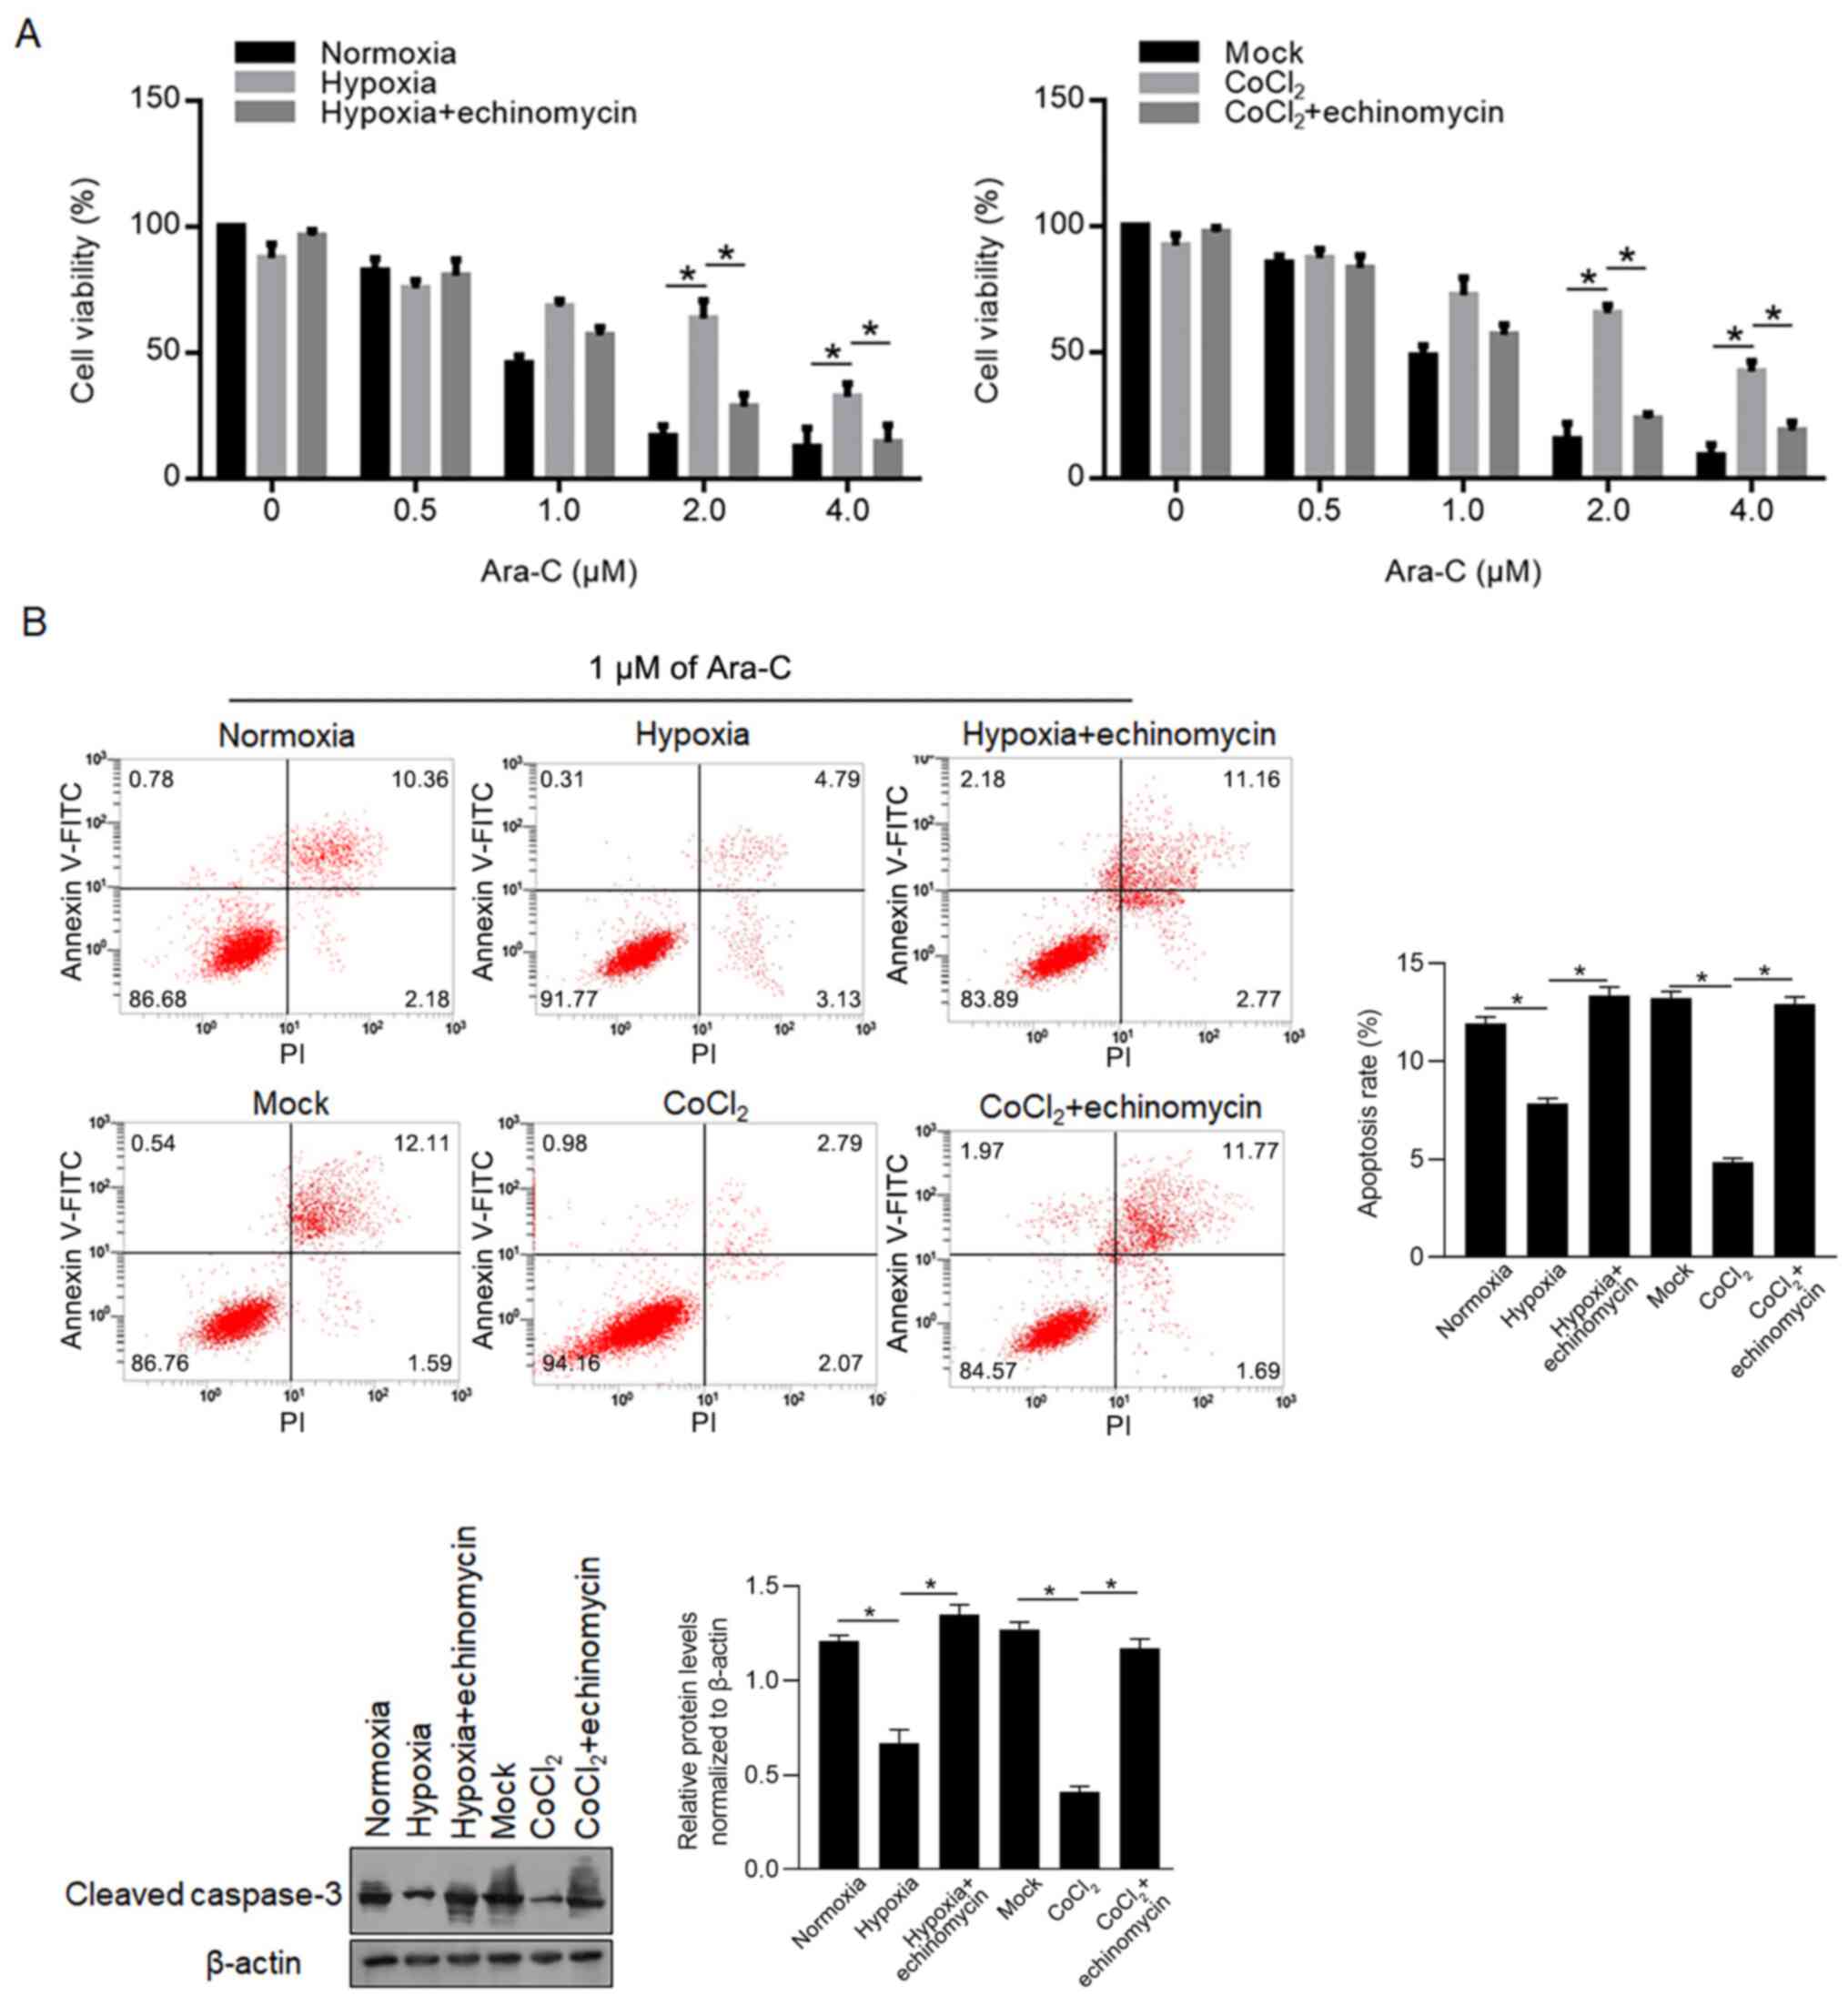
To determine the effect of hypoxia exposure on
chemosensitivity of LSCs, 0–4.0 µM Ara-C was supplemented in
culture medium and cell viability was measured 24 h later. As it is
shown in Fig. 3A (left panel),
hypoxia exposure significantly inhibited the decrease of cell
viability compared with the normoxia group, which was reversed by
200 nM echinomycin co-treatment. It is also observed that
CoCl2-exposed LSCs presented the same tendency (Fig. 3A, right panel), indicating the
potential involvement of HIF-1α. Then, the apoptosis induced by 1
µM Ara-C after 24 h was analysed using Annexin V-FITC/PI double
staining and western blotting for cleaved caspase-3. In Fig. 3B, it is observed that 1 µM of Ara-C
treatment induced 12.54±0.85% total apoptosis in normoxia group and
13.79±1.22% total apoptosis in Mock group, and hypoxia (7.92±0.47%)
and CoCl2 exposure (4.86±0.52%) decreased total
apoptosis induced by 1 µM of Ara-C treatment in LSCs, which was
reversed by echinomycin co-treatment (Fig. 3B, left panel). Western blotting also
confirmed that cleaved caspase-3 was decreased by hypoxia and
CoCl2 exposure (Fig. 3B,
right panel).
Hypoxia-induced BMI-1 activates the
PI3K/Akt pathway and is partially responsible for chemoresistance
to Ara-C in LSCs
BMI-1 is reported to activate the PI3K/Akt pathway
and thus causes chemoresistance (26,27).
Therefore, the present study investigated the role of
hypoxia-induced BMI-1 in regulating the PI3K/Akt pathway and
chemoresistance. Firstly, the high efficacy of siBMI-1-mediated
knockdown of BMI-1 protein level was confirmed (Fig. 4A). Expectedly, addition of
echinomycin failed to affect HIF-1α protein level. By performing
western blotting, it was demonstrated that phosphorylated PI3K and
Akt were increased after hypoxia exposure and decreased by
BMI-1-knockdown and inhibition of HIF-1α transcriptional activity
(Fig. 4B). Notably, siBMI1
significantly decreased the levels of phosphorylated Akt, via
decreasing total Akt protein level at least partially. As expected,
hypoxia-induced chemoresistance and total apoptosis (10.83±0.45% in
Hypoxia+siScrambled group) are notably reversed by BMI-1-knockdown
(15.40±1.33%) and inhibition of HIF-1α (12.91±0.75%) (Fig. 4C-E).
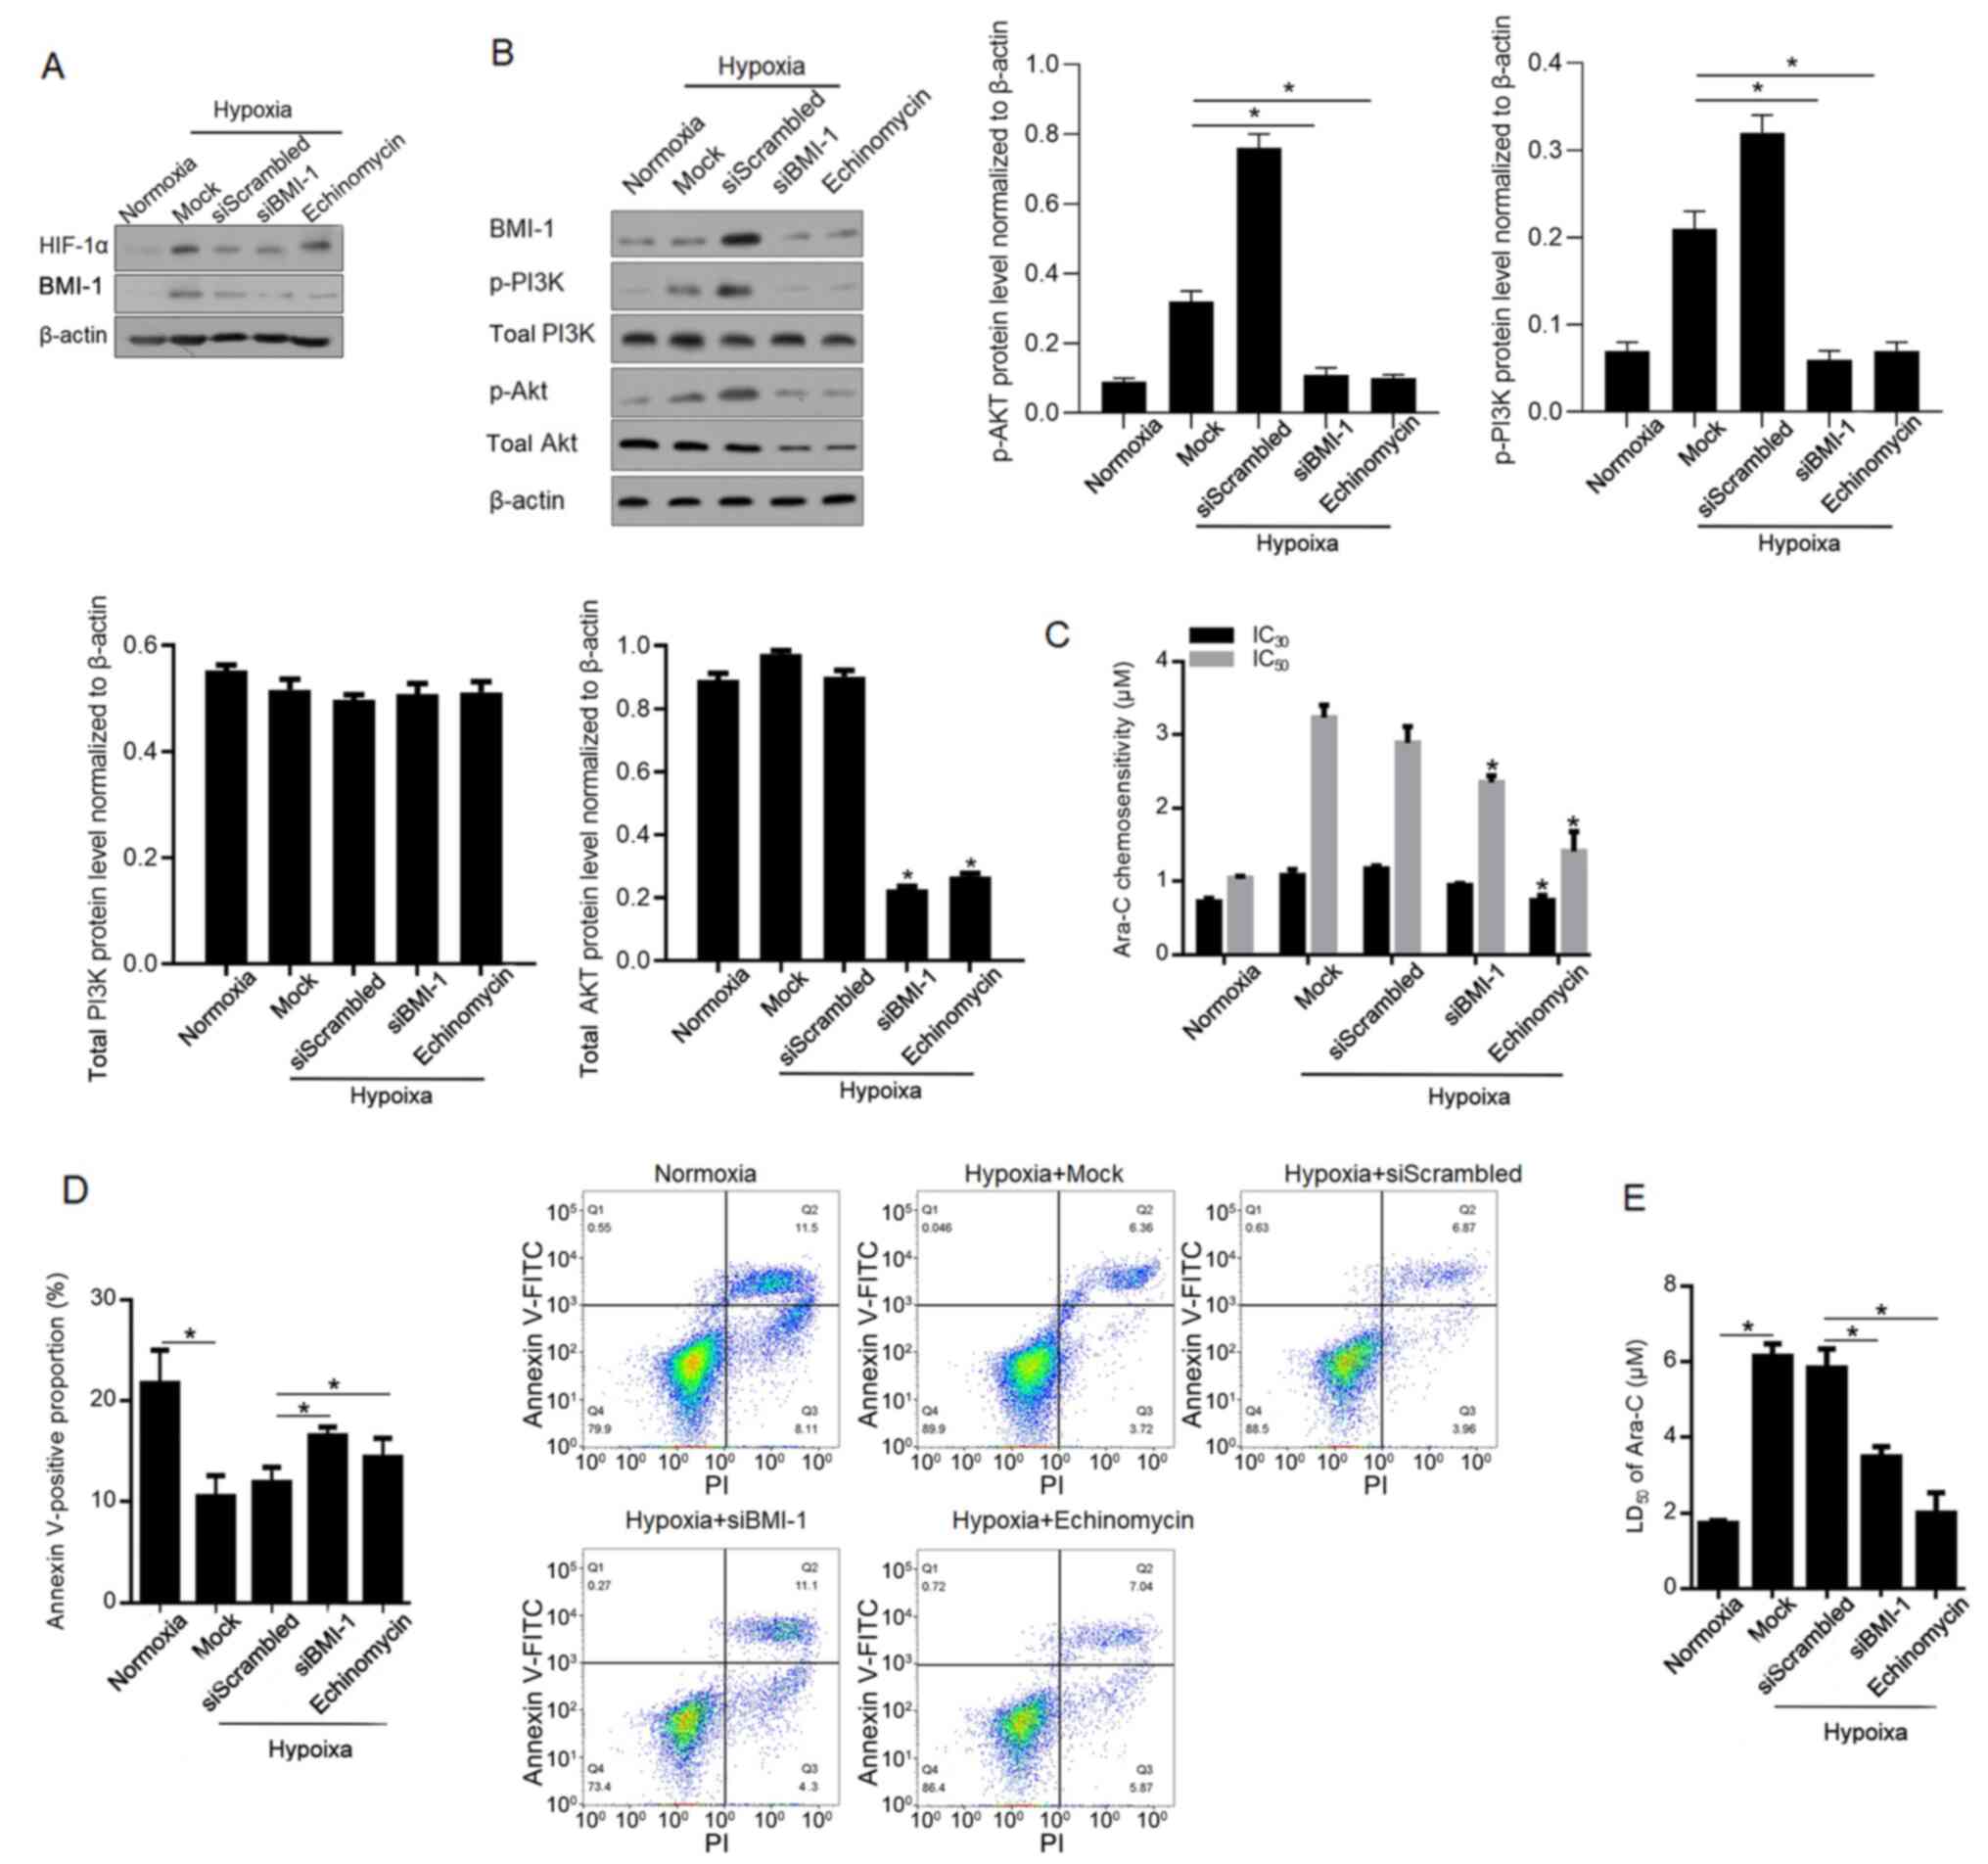 | Figure 4.BMI-1 activates the PI3K/Akt pathway,
inducing chemoresistance to Ara-C in leukaemia stem cells sorted
from KG-1α cells. (A) After siRNA target to BMI-1 mRNA
transfection, the knockdown efficacy of BMI-1 was confirmed using
western blotting. (B) Levels of p-PI3K, PI3K, p-Akt and Akt were
measured after BMI-1-knockdown. (C) IC30 and
IC50 of Ara-C were measured. (D) Apoptotic rate was
measured after 1 µM Ara-C treatment. (E) LD50 was
measured after Ara-C treatment. *P<0.05, vs. siScrambled group
or normoxia group. si, small interfering; BMI-1, B cell-specific
Moloney murine leukaemia virus integration site 1; p-,
phosphorylated; Ara-C, cytarabine arabinoside; LD, lethal dose; IC,
inhibitory concentration. |
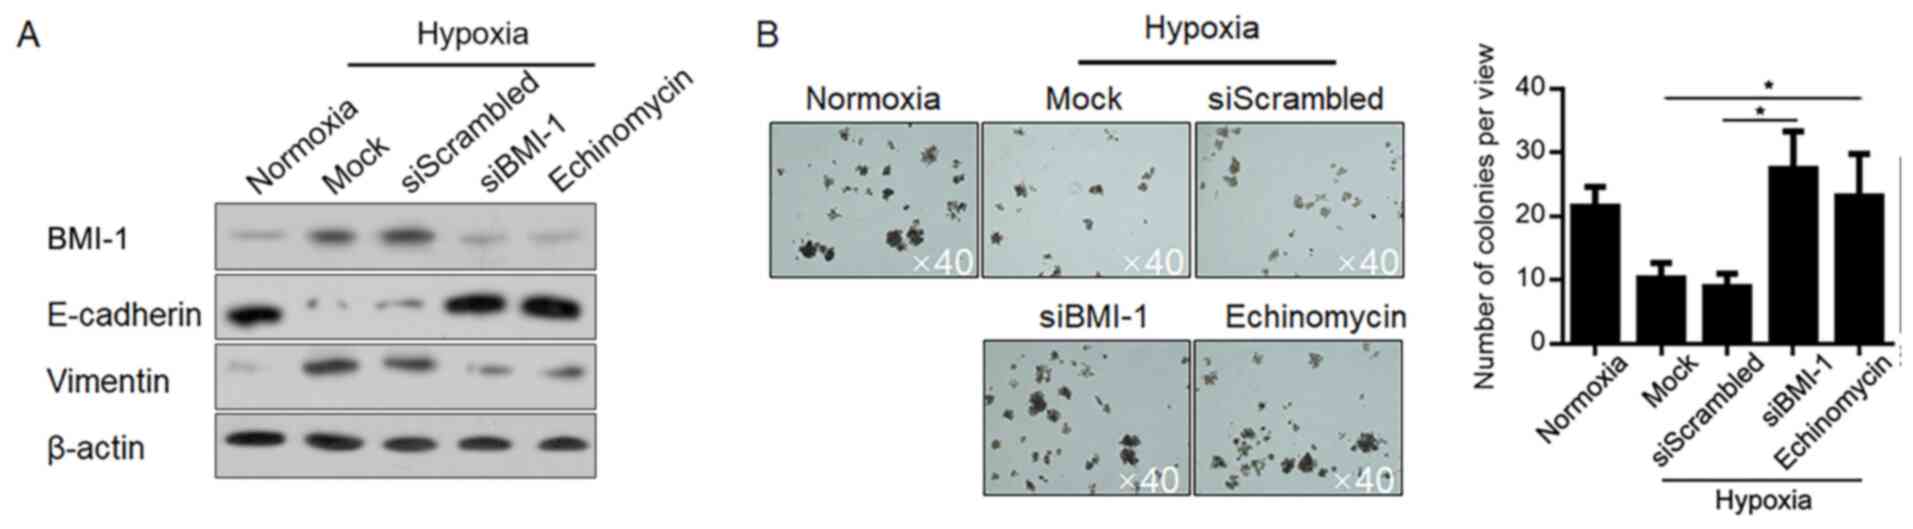
Hypoxia-induced BMI-1 promotes EMT and
inhibits self-renewal of LSCs under hypoxic conditions
BMI-1 is reported to regulate EMT in several other
kinds of cancer (28–30), therefore, the present study analysed
the effect of hypoxia-induced BMI-1 on EMT. Expectedly, hypoxia
exposure downregulated E-cadherin and upregulated vimentin compared
with the normoxia group, which were notably reversed by
BMI-1-knockdown and HIF-1α inhibition (Fig. 5A). Accordingly, BMI-1 increased the
self-renewal capacity of LSCs and promoted EMT under normoxic
conditions (31), then BMI-1 was
knocked down or HIF-1α transcriptional activity was inhibited, and
colony formation in soft agar was analysed. As expected,
hypoxia-induced inhibition in colony formation was significantly
increased by BMI-1-knockdown and abolished HIF-1α transcriptional
activity compared with the scrambled control, demonstrating that
hypoxia-induced BMI-1 is critical in inhibiting malignance of LSCs
(Fig. 5B). Taken together, all these
results indicated that hypoxia exposure-induced HIF-1α tightly
regulates EMT and stemness in LSCs via regulating BMI-1.
Discussion
The present study demonstrated that overexpression
of HIF-1α transcriptionally activates BMI-1, a member of the
Polycomb group family of transcription repressors (32), and thus activates the PI3K/Akt
pathway and promotes the EMT. Consequently, hypoxia exposure
stimulated HIF-1α and affected malignant behaviours in LSCs in this
manner. It was reported that both hypoxia and CoCl2
exposure-induced HIF-1α successfully upregulated BMI-1 in LSCs and
that such induction is dependent on the transcriptional activity of
HIF-1α. Hypoxia notably activated the PI3K/Akt pathway by promoting
the phosphorylation of PI3K and Akt, and blockage of HIF-1α
transcriptional activity and knockdown of BMI-1 resulted in
blockade of PI3K/Akt, at least in part. It is also observed that
hypoxia exposure promoted EMT dependent on the induction of HIF-1α.
These observations demonstrated that HIF-1α/BMI-1 may act as a
functional element that serves an important role in regulating the
malignant behaviours and self-renewal capacity of LSCs in an
hypoxia-modified microenvironment.
BMI-1 is widely overexpressed in several types of
cancer, including leukaemia, gastric and lung cancer, and is
responsible for promoting malignant behaviours, including
transformation, proliferation, invasion, distant metastasis and
poor survival (1–4). Moreover, BMI-1 maintains the
self-renewal of cancer stem-like cells (CSCs) under normoxic
conditions in some tumours, including breast cancer, glioma and
leukaemia (5,6). Chiba et al (33) reported that BMI-1 promotes the
maintenance of the self-renewal capacity of CSCs enriched from
hepatocellular carcinoma. Jin et al (34) reported that, in prostate cancer
cells, knockdown of BMI-1 blocked tumorigenic potential and
inhibited the cells' self-renewal capacity. According to these
studies, BMI-1 acts as a promoter of self-renewal capacity of CSCs
under normoxia conditions. The present study aimed to determine the
potential effects of BMI-1 under hypoxic conditions, instead of
normoxic conditions. Notably, after hypoxia-exposure, it was
observed that the stemness of LSCs decreased, which could be
reversed by BMI-1-knockdown or inhibition of HIF-1α transcriptional
activity by addition of echinomycin. All these results indicated
that BMI-1 may exert different roles under hypoxic compared with
normoxic conditions. However, the results only detected the
subpopulations of CD34 and CD38, instead of detecting stem cell
markers, including NANOG, OCT4 and SOX2 (31), which is a limitation of the present
study.
Upregulated BMI-1 also induces the EMT, activates
the PI3K/Akt pathway and subsequently promotes the aggressiveness
of human carcinoma cells, including nasopharyngeal carcinoma
(9) and colon cancer (10). The present results demonstrated that
transcriptionally upregulated BMI-1 by hypoxia-induced HIF-1α
markedly activated the PI3K/Akt pathway and promoted EMT. HIF-1α,
as the most important oxygen-sensitive sub-unit of HIF-1, activates
the transcription of numerous genes that regulate several
physiological processes, including angiogenesis, cell proliferation
and survival, glucose metabolism, pH regulation and migration in
cancer (11). The present study
reported that following knockdown of BMI-1 after hypoxia exposure,
the malignant behaviours are inhibited, similar to the effect of
inhibiting HIF-1α transcriptional activity. However, it is still
unknown whether HIF-1α-induced BMI-1 is necessary for regulating
malignant behaviours in LSCs. Another limitation of the present
study was that it was not confirmed whether BMI-1 regulates EMT
processes under normoxia. It would be valuable to investigate the
regulatory role of BMI-1 on EMT processes and stemness maintenance
in LSCs, which could provide further information regarding the
function of BMI-1 under normoxia.
In summary, the present data demonstrated that
hypoxia-induced HIF-1α transcriptionally upregulated BMI-1 in LSCs.
Upregulated BMI-1 regulated malignant behaviours and
chemoresistance and inhibited the self-renewal capacity potentially
by activating the PI3K/Akt pathway and promoting EMT in LSCs. These
findings emphasized that, in a hypoxic microenvironment supporting
LSC survival, the hypoxia-activated HIF-1α/BMI-1 pathway may
provide potential opportunities to improve the therapeutic
targeting of LSCs.
Acknowledgements
The authors would like to thank Dr Daiwen Zhao
(Chongqing University) for language editing.
Funding
The present study was funded by The National Science
Foundation for Young Scientists of China (grant no. 81600122), The
Health and Family Planning Commission of Sichuan Province (grant
no. 150106) and The Application Foundation Program of Science and
Technology Department of Sichuan Province (grant nos. 19ZDYF1202
and 2020YFS0253).
Availability of data and materials
The datasets used and/or analysed during the current
study are available from the corresponding author on reasonable
request.
Authors' contributions
MYJ, GQH and JG designed detailed protocols and
strategies and performed experiments. XG, JHL and JRL were
responsible for the data collection and analysis. JHL and JRL
interpretated the data. JG supervised the experiments, and was
involved in writing and revision of the manuscript. All authors
read and approved the final manuscript.
Ethics approval and consent to
participate
Not applicable.
Patient consent for publication
Not applicable.
Competing interests
The authors declare that they have no competing
interests.
References
|
1
|
Hu Y and Li S: Survival regulation of
leukemia stem cells. Cell Mol Life Sci. 73:1039–1050. 2016.
View Article : Google Scholar : PubMed/NCBI
|
|
2
|
Dean M, Fojo T and Bates S: Tumour stem
cells and drug resistance. Nat Rev Cancer. 5:275–284. 2005.
View Article : Google Scholar : PubMed/NCBI
|
|
3
|
Linenberger ML, Hong T, Flowers D, Sievers
EL, Gooley TA, Bennett JM, Berger MS, Leopold LH, Appelbaum FR and
Bernstein ID: Multidrug-resistance phenotype and clinical responses
to gemtuzumab ozogamicin. Blood. 98:988–994. 2001. View Article : Google Scholar : PubMed/NCBI
|
|
4
|
Pei S and Jordan CT: How close are we to
targeting the leukemia stem cell? Best Pract Res Clin Haematol.
25:415–418. 2012. View Article : Google Scholar : PubMed/NCBI
|
|
5
|
She M, Niu X, Chen X, Li J, Zhou M, He Y,
Le Y and Guo K: Resistance of leukemic stem-like cells in AML cell
line KG1a to natural killer cell-mediated cytotoxicity. Cancer
Lett. 318:173–179. 2012. View Article : Google Scholar : PubMed/NCBI
|
|
6
|
Fuchs D, Daniel V, Sadeghi M, Opelz G and
Naujokat C: Salinomycin overcomes ABC transporter-mediated
multidrug and apoptosis resistance in human leukemia stem cell-like
KG-1a cells. Biochem Biophys Res Commun. 394:1098–1104. 2010.
View Article : Google Scholar : PubMed/NCBI
|
|
7
|
Chen EY, Mazure NM, Cooper JA and Giaccia
AJ: Hypoxia activates a platelet-derived growth factor
receptor/phosphatidylinositol 3-kinase/Akt pathway that results in
glycogen synthase kinase-3 inactivation. Cancer Res. 61:2429–2433.
2001.PubMed/NCBI
|
|
8
|
Zhang H, Li H, Xi HS and Li S: HIF1α is
required for survival maintenance of chronic myeloid leukemia stem
cells. Blood. 119:2595–2607. 2012. View Article : Google Scholar : PubMed/NCBI
|
|
9
|
Majmundar AJ, Wong WJ and Simon MC:
Hypoxia-inducible factors and the response to hypoxic stress. Mol
Cell. 40:294–309. 2010. View Article : Google Scholar : PubMed/NCBI
|
|
10
|
Hermitte F, Brunet de la Grange P, Belloc
F, Praloran V and Ivanovic Z: Very low O2 concentration (0.1%)
favors G0 return of dividing CD34+ cells. Stem Cells. 24:65–73.
2006. View Article : Google Scholar : PubMed/NCBI
|
|
11
|
Rizo A, Dontje B, Vellenga E, de Haan G
and Schuringa JJ: Long-term maintenance of human hematopoietic
stem/progenitor cells by expression of BMI1. Blood. 111:2621–2630.
2008. View Article : Google Scholar : PubMed/NCBI
|
|
12
|
Iwama A, Oguro H, Negishi M, Kato Y,
Morita Y, Tsukui H, Ema H, Kamijo T, Katoh-Fukui Y, Koseki H, et
al: Enhanced self-renewal of hematopoietic stem cells mediated by
the polycomb gene product Bmi-1. Immunity. 21:843–851. 2004.
View Article : Google Scholar : PubMed/NCBI
|
|
13
|
Lessard J and Sauvageau G: Bmi-1
determines the proliferative capacity of normal and leukaemic stem
cells. Nature. 423:255–260. 2003. View Article : Google Scholar : PubMed/NCBI
|
|
14
|
Park IK, Qian D, Kiel M, Becker MW,
Pihalja M, Weissman IL, Morrison SJ and Clarke MF: Bmi-1 is
required for maintenance of adult self-renewing haematopoietic stem
cells. Nature. 423:302–305. 2003. View Article : Google Scholar : PubMed/NCBI
|
|
15
|
Siddique HR and Saleem M: Role of BMI1, a
stem cell factor, in cancer recurrence and chemoresistance:
Preclinical and clinical evidences. Stem Cells. 30:372–378. 2012.
View Article : Google Scholar : PubMed/NCBI
|
|
16
|
Meng S, Luo M, Sun H, Yu X, Shen M, Zhang
Q, Zhou R, Ju X, Tao W, Liu D, et al: Identification and
characterization of Bmi-1-responding element within the human p16
promoter. J Biol Chem. 285:33219–33229. 2010. View Article : Google Scholar : PubMed/NCBI
|
|
17
|
Saudy NS, Fawzy IM, Azmy E, Goda EF, Eneen
A and Abdul SE: BMI1 gene expression in myeloid leukemias and its
impact on prognosis. Blood Cells Mol Dis. 53:194–198. 2014.
View Article : Google Scholar : PubMed/NCBI
|
|
18
|
Cerami E, Gao J, Dogrusoz U, Gross BE,
Sumer SO, Aksoy BA, Jacobsen A, Byrne CJ, Heuer ML, Larsson E, et
al: The cBio cancer genomics portal: An open platform for exploring
multidimensional cancer genomics data. Cancer Discov. 2:401–404.
2012. View Article : Google Scholar : PubMed/NCBI
|
|
19
|
Ye H, Adane B, Khan N, Sullivan T,
Minhajuddin M, Gasparetto M, Stevens B, Pei S, Balys M, Ashton JM,
et al: Leukemic stem cells evade chemotherapy by metabolic
adaptation to an adipose tissue niche. Cell Stem Cell. 19:23–37.
2016. View Article : Google Scholar : PubMed/NCBI
|
|
20
|
Kreso A, van Galen P, Pedley NM,
Lima-Fernandes E, Frelin C, Davis T, Cao L, Baiazitov R, Du W,
Sydorenko N, et al: Self-renewal as a therapeutic target in human
colorectal cancer. Nat Med. 20:29–36. 2014. View Article : Google Scholar : PubMed/NCBI
|
|
21
|
Nishida Y, Maeda A, Kim MJ, Cao L, Kubota
Y, Ishizawa J, AlRawi A, Kato Y, Iwama A, Fujisawa M, et al: The
novel BMI-1 inhibitor PTC596 downregulates MCL-1 and induces
p53-independent mitochondrial apoptosis in acute myeloid leukemia
progenitor cells. Blood Cancer J. 7:e5272017. View Article : Google Scholar : PubMed/NCBI
|
|
22
|
Bennet JM, Catovsky D, Daniel MT, Flandrin
G, Galton DA, Gralnick HR and Sultan C: Proposal for the
classification of acute leukaemias. French-American-British (FAB)
Co-Operative Group. Br J Haematol. 33:451–458. 1976. View Article : Google Scholar : PubMed/NCBI
|
|
23
|
Du R, Xia L, Ning X, Liu L, Sun W, Huang
C, Wang H and Sun S: Hypoxia-induced Bmi1 promotes renal tubular
epithelial cell-mesenchymal transition and renal fibrosis via
PI3K/Akt signal. Mol Biol Cell. 25:2650–2659. 2014. View Article : Google Scholar : PubMed/NCBI
|
|
24
|
Chou TC and Talalay P: Analysis of
combined drug effects: A new look at a very old problem. Trends
Pharmacol Sci. 4:450–454. 1983. View Article : Google Scholar
|
|
25
|
Livak KJ and Schmittgen TD: Analysis of
relative gene expression data using real-time quantitative PCR and
the 2(-Delta Delta C(T)) method. Methods. 25:402–408. 2001.
View Article : Google Scholar : PubMed/NCBI
|
|
26
|
Wu Z, Min L, Chen D, Hao D, Duan Y, Qiu G
and Wang Y: Overexpression of BMI-1 promotes cell growth and
resistance to cisplatin treatment in osteosarcoma. PLoS One.
6:e146482011. View Article : Google Scholar : PubMed/NCBI
|
|
27
|
Zhang Z, Bu X, Chen H, Wang Q and Sha W:
Bmi-1 promotes the invasion and migration of colon cancer stem
cells through the downregulation of E-cadherin. Int J Mol Med.
38:1199–1207. 2016. View Article : Google Scholar : PubMed/NCBI
|
|
28
|
Li H, Song F, Chen X, Li Y, Fan J and Wu
X: Bmi-1 regulates epithelial-to-mesenchymal transition to promote
migration and invasion of breast cancer cells. Int J Clin Exp
Pathol. 7:3057–3064. 2014.PubMed/NCBI
|
|
29
|
Yuan W, Yuan Y, Zhang T and Wu S: Role of
Bmi-1 in regulation of ionizing irradiation-induced
epithelial-mesenchymal transition and migration of breast cancer
cells. PLoS One. 10:e1187992015.
|
|
30
|
Jiang L, Wu J, Yang Y, Liu L, Song L, Li J
and Li M: Bmi-1 promotes the aggressiveness of glioma via
activating the NF-kappaB/MMP-9 signaling pathway. BMC Cancer.
12:4062012. View Article : Google Scholar : PubMed/NCBI
|
|
31
|
Paranjape AN, Balaji SA, Mandal T, Krushik
EV, Nagaraj P, Mukherjee G and Rangarajan A: Bmi1 regulates
self-renewal and epithelial to mesenchymal transition in breast
cancer cells through Nanog. BMC Cancer. 14:7852014. View Article : Google Scholar : PubMed/NCBI
|
|
32
|
Alkema MJ, Wiegant J, Raap AK, Berns A and
van Lohuizen M: Characterization and chromosomal localization of
the human proto-oncogene BMI-1. Hum Mol Genet. 2:1597–1603. 1993.
View Article : Google Scholar : PubMed/NCBI
|
|
33
|
Chiba T, Miyagi S, Saraya A, Aoki R, Seki
A, Morita Y, Yonemitsu Y, Yokosuka O, Taniguchi H, Nakauchi H and
Iwama A: The polycomb gene product BMI1 contributes to the
maintenance of tumor-initiating side population cells in
hepatocellular carcinoma. Cancer Res. 68:7742–7749. 2008.
View Article : Google Scholar : PubMed/NCBI
|
|
34
|
Jin M, Zhang T, Liu C, Badeaux MA, Liu B,
Liu R, Jeter C, Chen X, Vlassov AV and Tang DG: miRNA-128
suppresses prostate cancer by inhibiting BMI-1 to inhibit
tumor-initiating cells. Cancer Res. 74:4183–4195. 2014. View Article : Google Scholar : PubMed/NCBI
|