Introduction
Bone sarcomas and soft-tissue sarcomas (STSs) are
very rare and biologically heterogeneous malignancies. There are
0.8 malignant bone tumors and ~2 malignant soft tissue sarcomas per
100,000. These are very few compared with that in other types of
cancer in 2013. In addition, malignant bone tumors and soft tissue
sarcomas are classified into ~20 and 40 types, respectively
(1). The treatment option for
patients with advanced STS is single systemic chemotherapy
(2). In contrast to bone sarcomas
and STSs, osteosarcoma (OS) and the Ewing sarcoma family of tumors
(ESFT) are the most frequent primary malignant bone tumors found in
adolescents and young adults, worldwide (3,4). The
introduction of preoperative chemotherapy has significantly
improved the overall survival time of these patients (5,6).
Nevertheless, the prognosis of patients with OS and ESFT, who
exhibit a poor response to chemotherapy remains unfavorable, due to
their high risk of developing distant metastases. The mainstay of
treatment for other bone sarcoma tumors, such as chondrosarcoma and
chordoma is surgical resection. The use of chemotherapy for these
bone tumors is considered ineffective (7,8).
Immune surveillance against tumors has attracted
considerable attention, due to the development of immune-checkpoint
inhibitors, that have shown antitumor effects against certain types
of cancer, such as breast, colorectal, gastric, lung, pancreatic
and renal cancers (9,10). The balance between activation and
inhibition of immune responses may determine whether cancers can
avoid detection based on immune recognition. The simultaneous
inhibition of more than one immune target may regulate the
expression level of various molecules, including programmed death-1
(PD-1), cytotoxic T lymphocyte-associated molecule-4 (CTLA-4),
lymphocyte-activation gene-3 (LAG-3), T cell immunoglobulin and
mucin domain-3 (Tim-3) and natural killer group 2 member A (NKG2A),
which have also been recognized as immune-checkpoint molecules that
are present on the surface of CD4+ and CD8+ T
cells (11–14). Furthermore, co-stimulated activated
molecules, such as CD28, CD134 (OX-40), CD137 (4–1BB), inducible
co-stimulatory molecule (ICOS) and natural killer group 2 member D
(NKG2D), are also known to be present on the surface of
CD4+ and CD8+ T cells (15–19).
Since the approval of immune checkpoint inhibitor therapies, such
as the application of PD-1 and CTLA-4 antibodies, several clinical
studies have been conducted worldwide on the effects of these
treatments on various types of cancer, including colorectal and
thyroid cancers and lymphoid malignancies (20–22). In
addition, immune-suppressive cells, such as myeloid-derived
suppressor cells (MDSC) and regulatory T cells (Treg) do not
trigger the activation and/or proliferation of effector T cells and
thereby escape the immune response (23,24).
Previous studies have shown higher quantities of MDSCs to be
associated with poor outcomes in patients with certain solid
tumors, such as colon cancer, melanoma, hepatocellular carcinoma
and breast cancer (25–28). These studies were conducted using
patient peripheral blood samples. Serial collection of tumor
samples from patients with metastatic sarcoma is usually difficult.
Therefore, the use of peripheral blood samples, which can be
collected with minimally invasive methods, will be extremely
valuable for the identification of potential biomarker
candidates.
The immunological status (the number of immune cell
subsets, such as T and B cells, NK cells and immuno-suppressive
cells, as well as those corresponding to cells secreting immune
checkpoint molecules) for patients with bone sarcoma and STS remain
uncertain. In the present study, the immunological status of
patients with bone sarcoma and STS was assessed in peripheral blood
samples. The results provide more information on the host immune
reaction against sarcoma based on analysis of T-cell expression in
response to co-stimulation with activated molecules.
Materials and methods
Patients
Following institutional review board approval
(approval no. 2014-287), the patients who were treated at the
National Cancer Center Hospital (Tokyo, Japan) between April 2015
and March 2017 were prospectively enrolled. In total, 86 patients
were enrolled, of which 61 patients had no metastasis of high-grade
sarcoma and 25 patients presented with metastatic sarcoma. No
metastasis was defined as stages I–III and metastatic sarcoma as
stage IV. The characteristics of the patients are summarized in
Table I. The patients provided
written informed consent. The patients who met the following
exclusion criteria were not enrolled in the study: i) Subjects
under 15 years of age, ii) the presence of active viral infections,
such as human immunodeficiency virus or hepatitis B and/or
hepatitis C, and iii) ongoing treatment with steroids.
 | Table I.Clinicopathological characteristics
of the patients with bone and soft-tissue sarcoma, and with and
without metastasis |
Table I.
Clinicopathological characteristics
of the patients with bone and soft-tissue sarcoma, and with and
without metastasis
|
| Free of metastasis
and high-grade sarcoma (n=61) | Metastatic sarcoma
(n=25) |
|---|
|
|
|
|
|---|
| Clinicopathological
characteristic | Value | Percentage | Value | Percentage |
|---|
| Median age (range),
years | 56 (19–83) |
| 60.1 (24–77) |
|
| Sex |
|
Male | 39 | 65.0 | 14 | 56.0 |
|
Female | 22 | 35.0 | 11 | 44.0 |
| PS |
| 0 | 44 | 72.1 | 9 | 36.0 |
| 1 | 17 | 27.9 | 8 | 32.0 |
| 2 |
|
| 5 | 20.0 |
| 3 |
|
| 2 | 8.0 |
| 4 |
|
| 1 | 4.0 |
| Location |
|
Bone | 15 |
| 5 |
|
|
Femur | 7 | 46.6 | 4 | 16.0 |
|
Rib | 3 | 20.0 |
|
|
|
Tibia | 2 | 13.3 |
|
|
|
Scapula | 1 | 6.7 |
|
|
|
Radius | 1 | 6.7 |
|
|
|
Sacrum | 1 | 6.7 |
|
|
|
Toe |
|
| 1 | 4.0 |
| Soft
tissue | 46 |
| 20 |
|
|
Femur | 16 | 34.7 | 3 | 12.0 |
|
Retroperitoneum | 8 | 17.3 | 4 | 16.0 |
|
Lower leg | 6 | 13.1 | 3 | 12.0 |
|
Axilla | 3 | 6.5 | 6 | 24.0 |
|
Neck | 1 | 2.2 | 1 | 4.0 |
|
Back | 2 | 4.4 | 1 | 4.0 |
|
Forearm | 2 | 4.4 |
|
|
|
Shoulder | 2 | 4.4 |
|
|
|
Foot | 1 | 2.2 |
|
|
|
Humerus | 1 | 2.2 |
|
|
|
Inguinal | 1 | 2.2 |
|
|
|
Knee | 1 | 2.2 |
|
|
|
Buttocks | 2 | 4.4 |
|
|
|
Chest wall |
|
| 1 | 4.0 |
|
Pelvis |
|
| 1 | 4.0 |
| Sarcoma |
|
Liposarcoma | 15 | 24.6 | 6 | 24.0 |
|
Myxoid LS | 7 |
| 2 |
|
|
Dedifferentiated
LS | 6 |
| 1 |
|
|
Pleomorphic
LS | 2 |
| 3 |
|
|
UPS | 9 | 14.8 | 4 | 16.0 |
| OS | 9 | 14.8 | 4 | 16.0 |
|
Myxofibrosarcoma | 8 | 13.1 | 1 | 4.0 |
|
MPNST | 6 | 9.8 | 3 | 12.0 |
|
Chondrosarcoma | 5 | 8.3 | 1 | 4.0 |
|
Synovial sarcoma | 3 | 4.9 | 2 | 8.0 |
|
Epithelioidsarcoma | 2 | 3.3 |
|
|
|
Angiosarcoma | 1 | 1.6 |
|
|
|
Fibrosarcoma | 1 | 1.6 |
|
|
|
Leiomyosarcoma | 1 | 1.6 | 2 | 8.0 |
|
Myxofibrosarcoma |
|
| 1 | 4.0 |
|
Malignant rhabdoid tumor |
|
| 1 | 4.0 |
|
Rhabdomyosarcoma |
|
| 1 | 4.0 |
|
Malignant perineurolima | 1 | 1.6 |
|
|
| TNM stage |
|
IIA | 5 | 8.2 |
|
|
|
IIB | 9 | 14.8 |
|
|
|
III | 47 | 77.0 |
|
|
| IV |
|
| 25 | 100 |
Clinicopathological factors and
staining of peripheral blood mononuclear cells (PBMCs)
The peripheral blood samples were collected prior to
treatment, including surgery and chemotherapy. Levels of alkaline
phosphatase (ALP), C-reactive protein (CRP) and lactate
dehydrogenase (LDH), white blood count and differential count of
leukocytes, including lymphocytes, neutrophils, monocytes and
eosinocytes were analyzed. The blood samples were centrifuged at
425 × g for 10 min at room temperature, using density gradient
centrifugation, and the separated plasma samples were cryopreserved
at −80°C in cryogenic tubes (Thermo Fisher Scientific, Inc.) using
CELLBANKER (Nippon Zenyaku Kogyo). Fresh PBMC samples were stained
for the myeloid cell subset, since the MDSC fraction was decreased
by cryopreservation (29). Each
sample was also stained for the subset of dendritic cells (DC)
concomitantly with MDSC measurement, since a common flow cytometry
panel was used for both of these cell subsets. The remaining PBMCs
were cryopreserved and used for measurements of T, B and NK cell
subsets.
PBMCs (5×10⁵) were suspended in 100 ml
staining buffer (PBS containing 2% FBS (Sigma-Aldrich; Merck KGaA).
The antibodies for the surface markers were subsequently added
followed by a 30-min incubation period at 4°C. The staining of the
intracellular proteins (LAG-3 and FOXP3) was performed using the
Foxp3/Transcription Factor Fixation/Permeabilization Concentrate
and Diluent with a 30-min incubation at 4°C (cat. no. 12-4777-42;
eBioscience; Thermo Fisher Scientific, Inc.) according to the
manufacturer's protocol. The antibodies used were as follows:
Lineage (Lin; CD3, CD16, CD19, CD20 and CD56) cocktail FITC (cat.
no. 643397; BD Pharmingen; BD Biosciences), LAG-3 FITC (cat. no.
ALX-804-806F-C100; Enzo Life Sciences, Inc.), OX-40 FITC (cat. no.
55837; BD Pharmingen; BD Biosciences), CD14 peridinin chlorophyll
protein (PerCP)-Cy5.5 (cat. no. 561116; BD Pharmingen; BD
Biosciences,), CD28 PerCP-cy5.5 (cat. no. 337181; BD Pharmingen; BD
Biosciences), CD11b allophycocyanin (APC)-Cy7 (cat. no. 557754; BD
Pharmingen; BD Biosciences), CD8 APC-Cy7 (cat. no. 557834; BD
Pharmingen; BD Biosciences), CD33-phycoerythrin (PE)-Cy7 (cat. no.
333946; BD Pharmingen; BD Biosciences), ICOS PE-Cy7 (cat. no.
25-9948-42; eBioscience; Thermo Fisher Scientific, Inc.), NKG2D
PE-Cy7 (cat. no. 320812; BioLegend, Inc.), CD11c Alexa Fluor700
(cat. no. 561352; BD Pharmingen; BD Biosciences), CD45RA Alexa
Fluor700 (cat. no. 304120; BioLegend, Inc.), CD123 Brilliant Violet
421 (cat. no. 562517; BD Pharmingen; BD Biosciences), CD62-L (cat.
no. 304828; BioLegend, Inc.), CD15 V500 (cat. no. 561585; BD
Pharmingen; BD Biosciences), CD66b APC (cat. no. 561645; BD
Pharmingen; BD Biosciences), PD-1 APC (cat. no. 558694; BD
Pharmingen; BD Biosciences), NKG2A APC (cat. no. PN A60797; Beckman
Coulter, Inc.), HLA-DR ECD (cat. no. PN IM3636; Beckman Coulter,
Inc.), CD56 PE-CF 594 (cat. no. 562289; BD Pharmingen; BD
Biosciences), FOXP3 PE (cat. no. 12-4777-42; eBioscience, Thermo
Fisher Scientific, Inc.), CD16 BUV395 (cat. no. 563785; BD
Pharmingen; BD Biosciences), CD3 BUV496 (cat. no. 564809; BD
Pharmingen; BD Biosciences), CD4 Brilliant Violet 650 (cat. no.
317436; BioLegend, Inc.), CCR7 BV711 (cat. no. 353228; BioLegend,
Inc.), 4-1BB BV711 (cat. no. 740798; BD Pharmingen; BD
Biosciences), CTLA-4 BV786 (cat. no. 563931; BD Pharmingen; BD
Biosciences), Tim-3 BV786 (cat. no. 345032; BioLegend, Inc.) and
CD19 PE-Cy5.5 (cat. no. 35-0198-42; eBioscience, Thermo Fisher
Scientific, Inc.). Isotype controls included the appropriate
fluorochrome-conjugate as follows: Brilliant violet 421 mouse IgG1,
κ isotype control (cat. no. 400158; BioLegend, Inc.), brilliant
violet 711 mouse IgG2a, κ isotype control (cat. no. 400272;
BioLegend, Inc.), BV786 mouse IgG2b-κ isotype control (cat. no.
563732; BD Pharmingen; BD Biosciences), FITC mouse IgG1, κ isotype
control (cat. no. 400108; BioLegend, Inc.), PerCP-Cy5.5 mouse IgG1
κ isotype control (cat. no. 45-4714-82; eBioscience), PE mouse IgG1
κ isotype control (cat. no. 12-4714-82; eBioscience), PE-Cy7 mouse
IgG1 κ isotype control (cat. no. 25-4714-42; eBioscience), APC
mouse IgG1 κ isotype control (cat. no. 555751; eBioscience),
brilliant violet 711 mouse IgG1, κ isotype control (cat. no.
400168; BioLegend, Inc.) and brilliant violet 785™ mouse IgG1, κ
isotype control (cat. no. 400170; BioLegend, Inc.).
The stained cells were detected using an LSR
Fortessa X-20 with the FACSDiva software (BD Biosciences). The
analyses were performed using a FlowJo microplate reader (Tomy
Digital Biology Co., Ltd.).
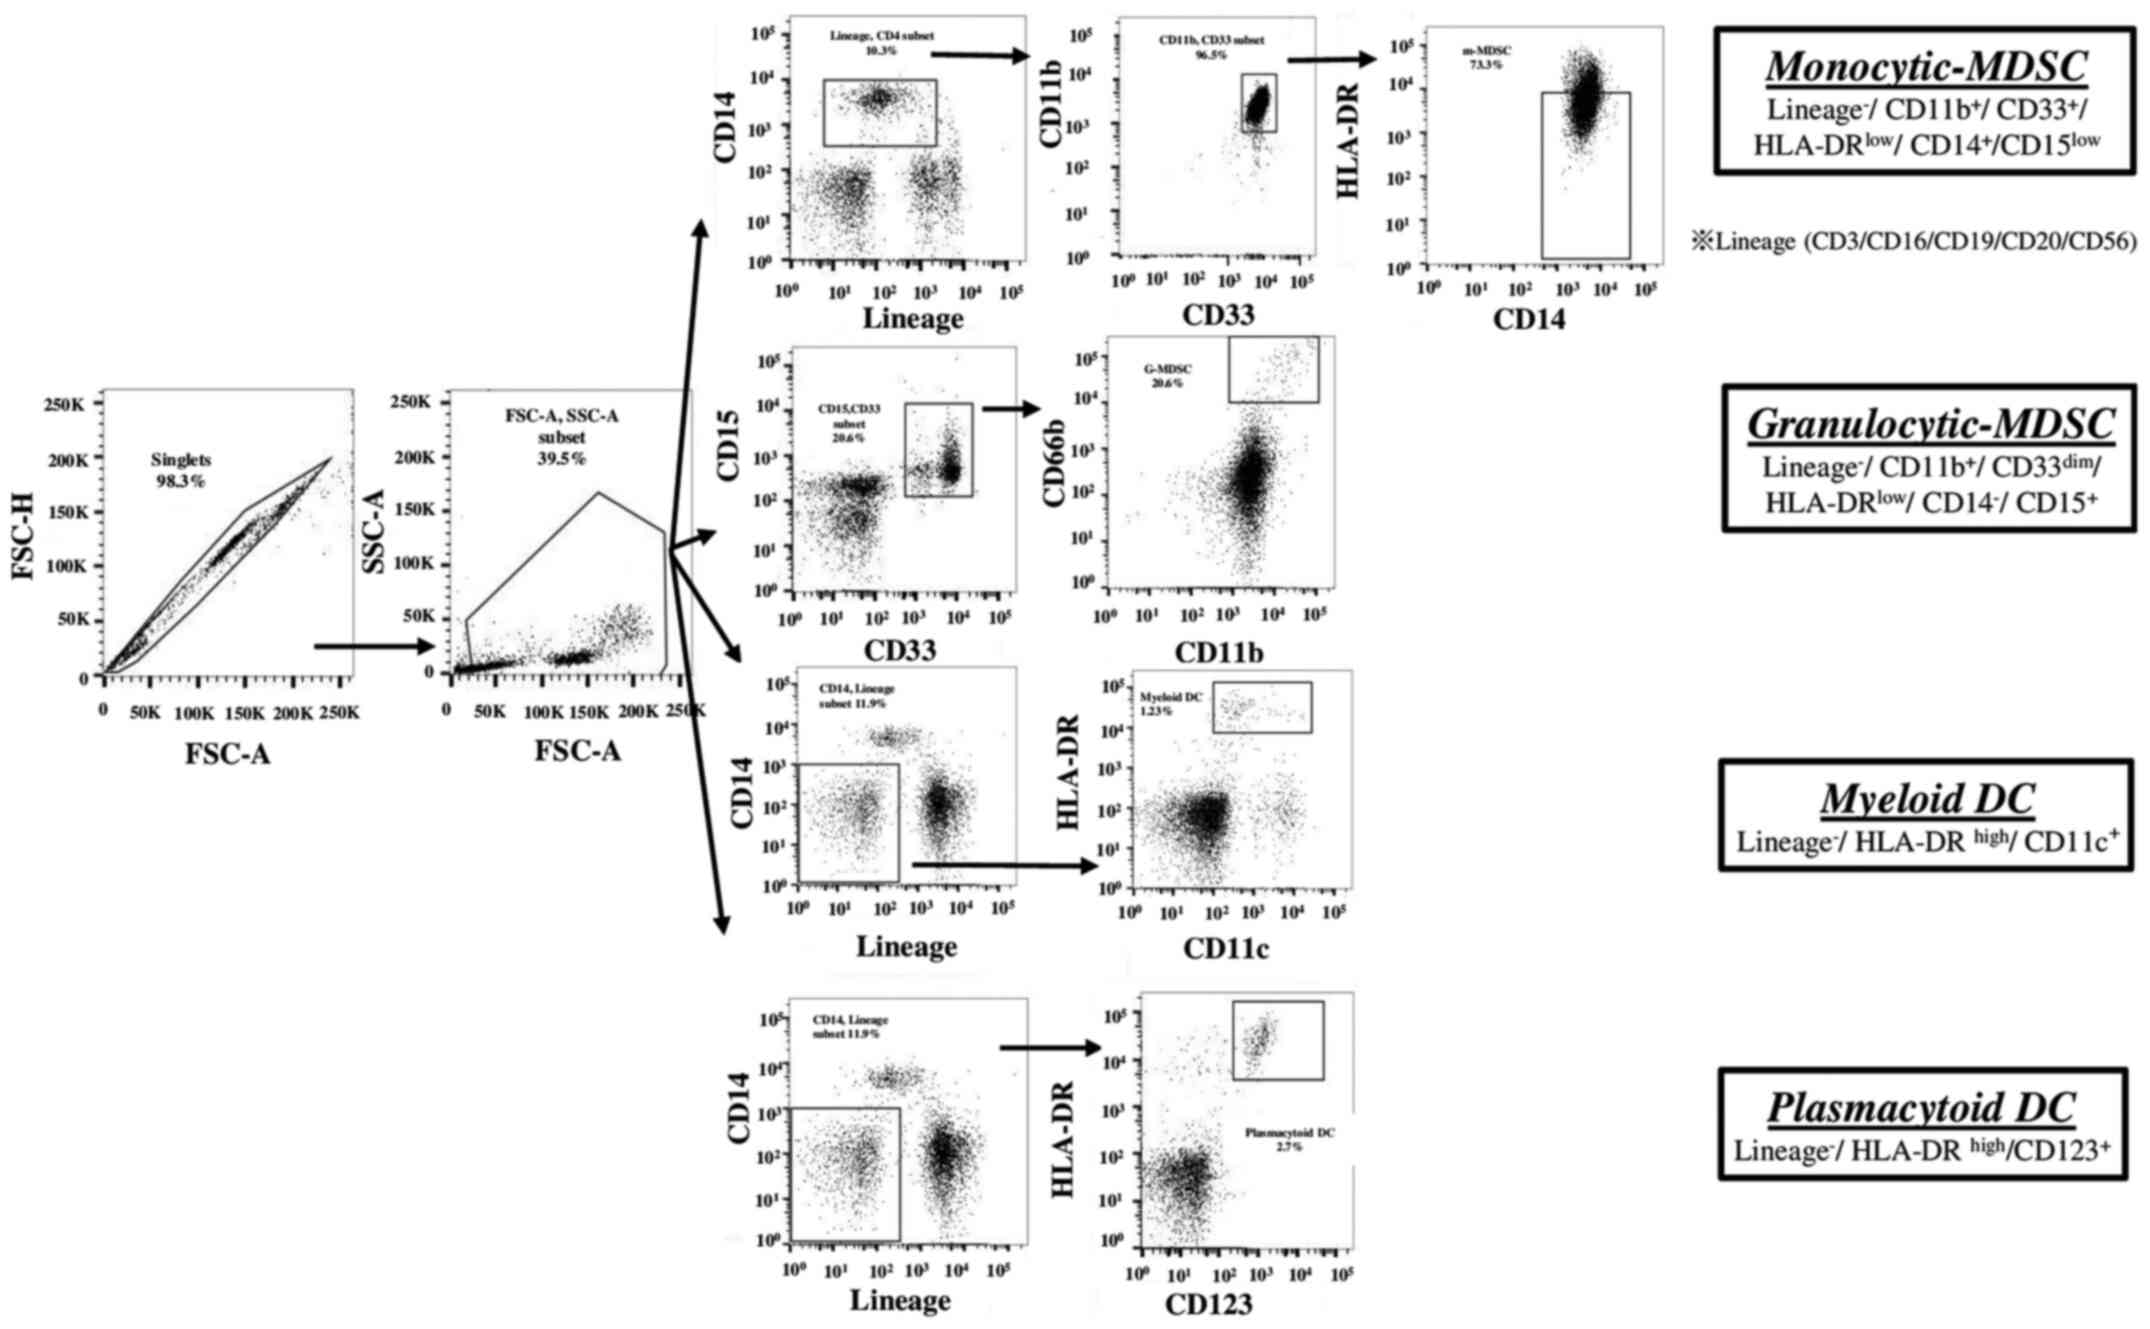
Definition and analysis of the immune
cell subsets
A total of 41 immune cell subsets were analyzed in
the present study. They were defined as follows: Monocytic-MDSCs
(M-MDSCs):
Lin-CD14+CD33+CD11b+HLA-DRlow/−;
granulocytic MDSCs (Gr-MDSCs):
CD33dimCD15+CD66+CD11b+;
Myeloid DCs (M-DCs): Lin-CD14−CD11c+
HLADRhigh; plasmacytoid DCs (p-DCs):
Lin-CD14−CD123+HLA-DRhigh; naive
T-regs:
CD3+CD4+CD45RA−FOXP3high;
and effector T-regs:
CD3+CD4+CD45RA+FOXP3high.
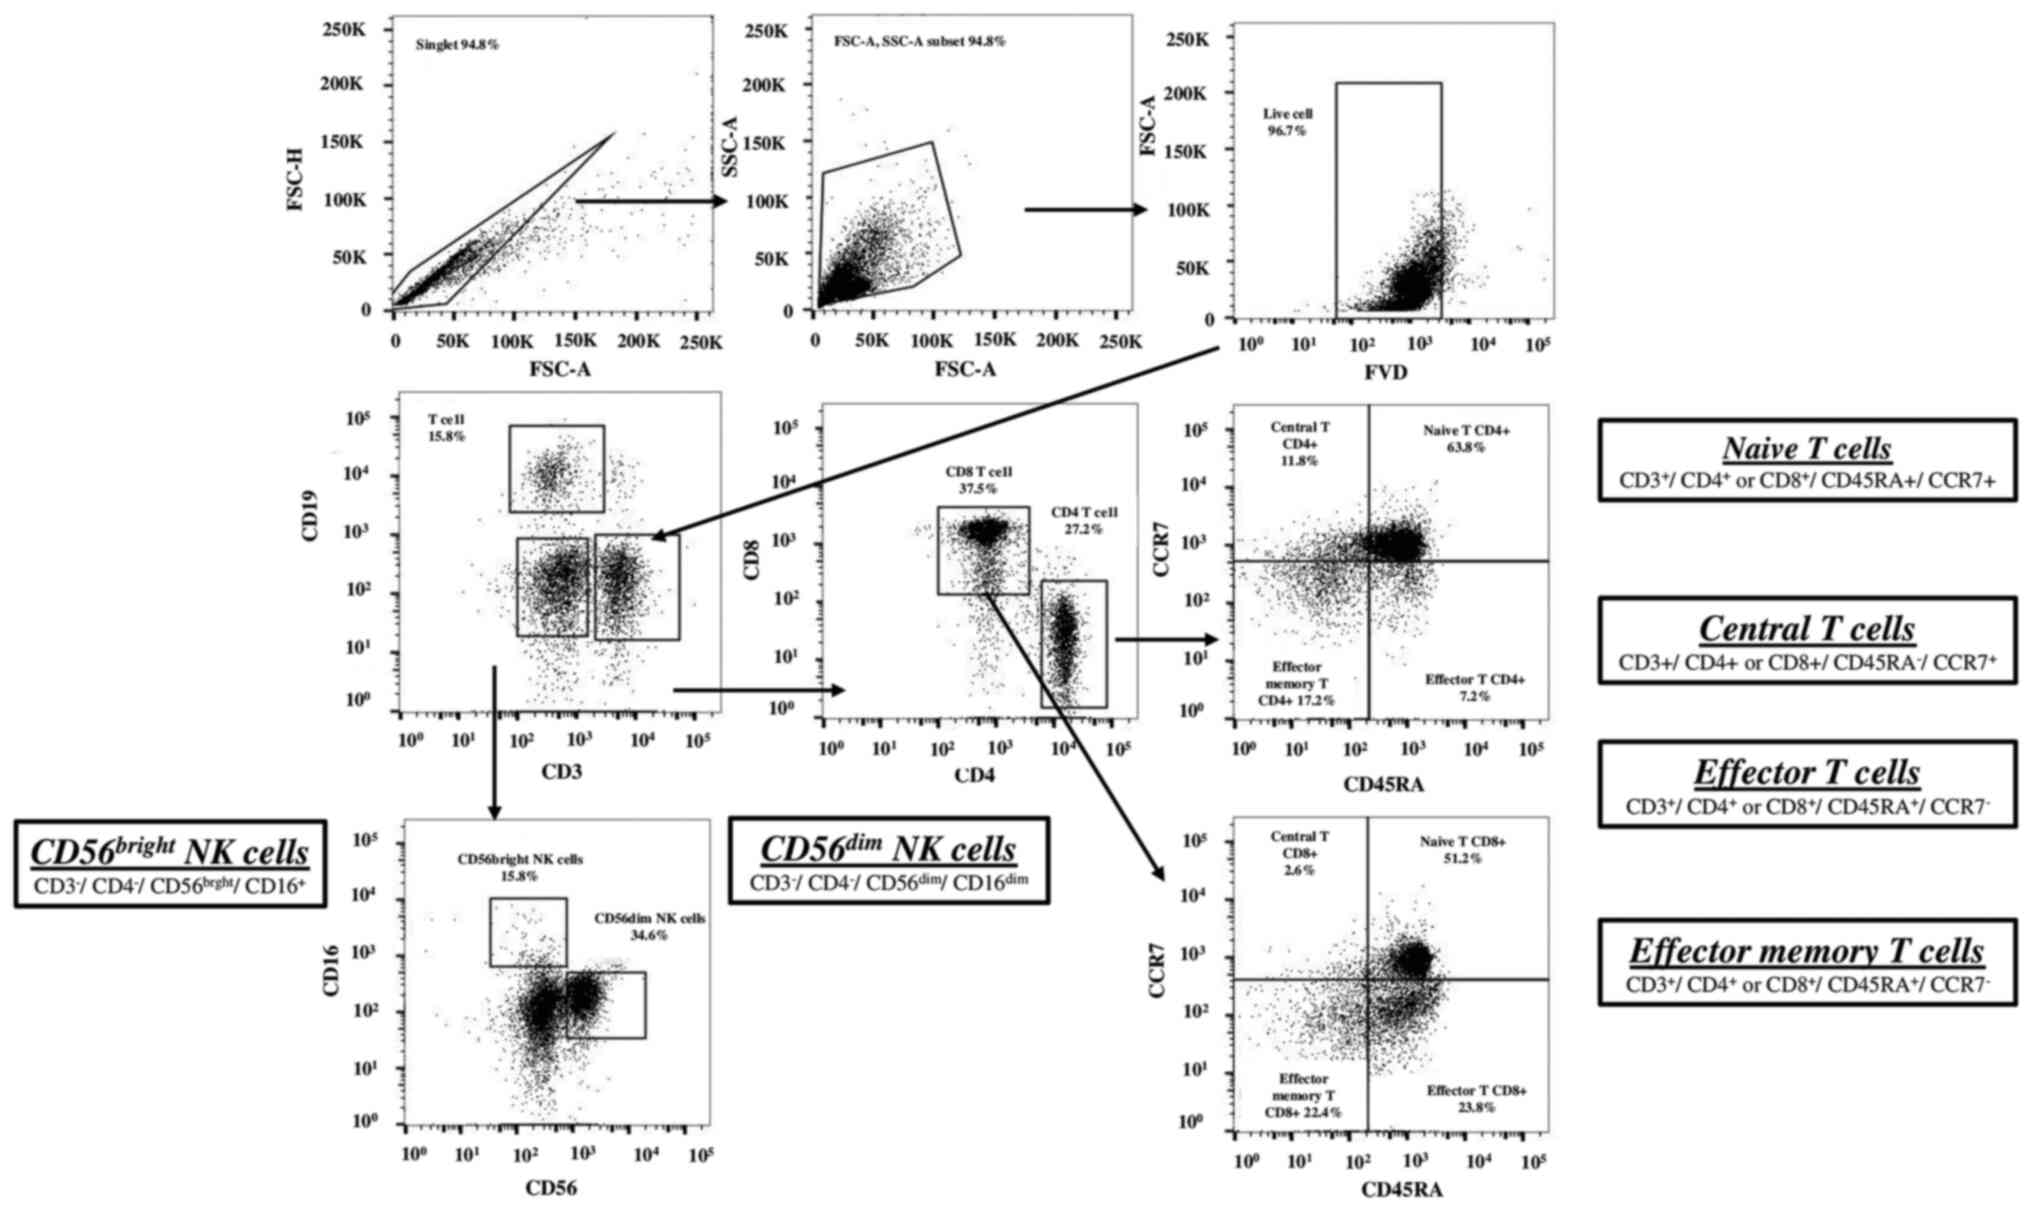
T cells were classified as naïve T cells
(CD45RA+CCR7+), effector T cells
(CD45RA+CCR7−), effector memory T cells
(CD45RA−CCR7−) and central memory T cells
(CD45RA−CCR7+), in populations of
CD4+ or CD8+ cells (Fig. 1). NK cells were classified as
CD56bright NK cells
(CD3−CD19−CD14−CD16+CD56bright)
and CD56dim NK cells
(CD3−CD19−CD14−CD16+CD56dim).
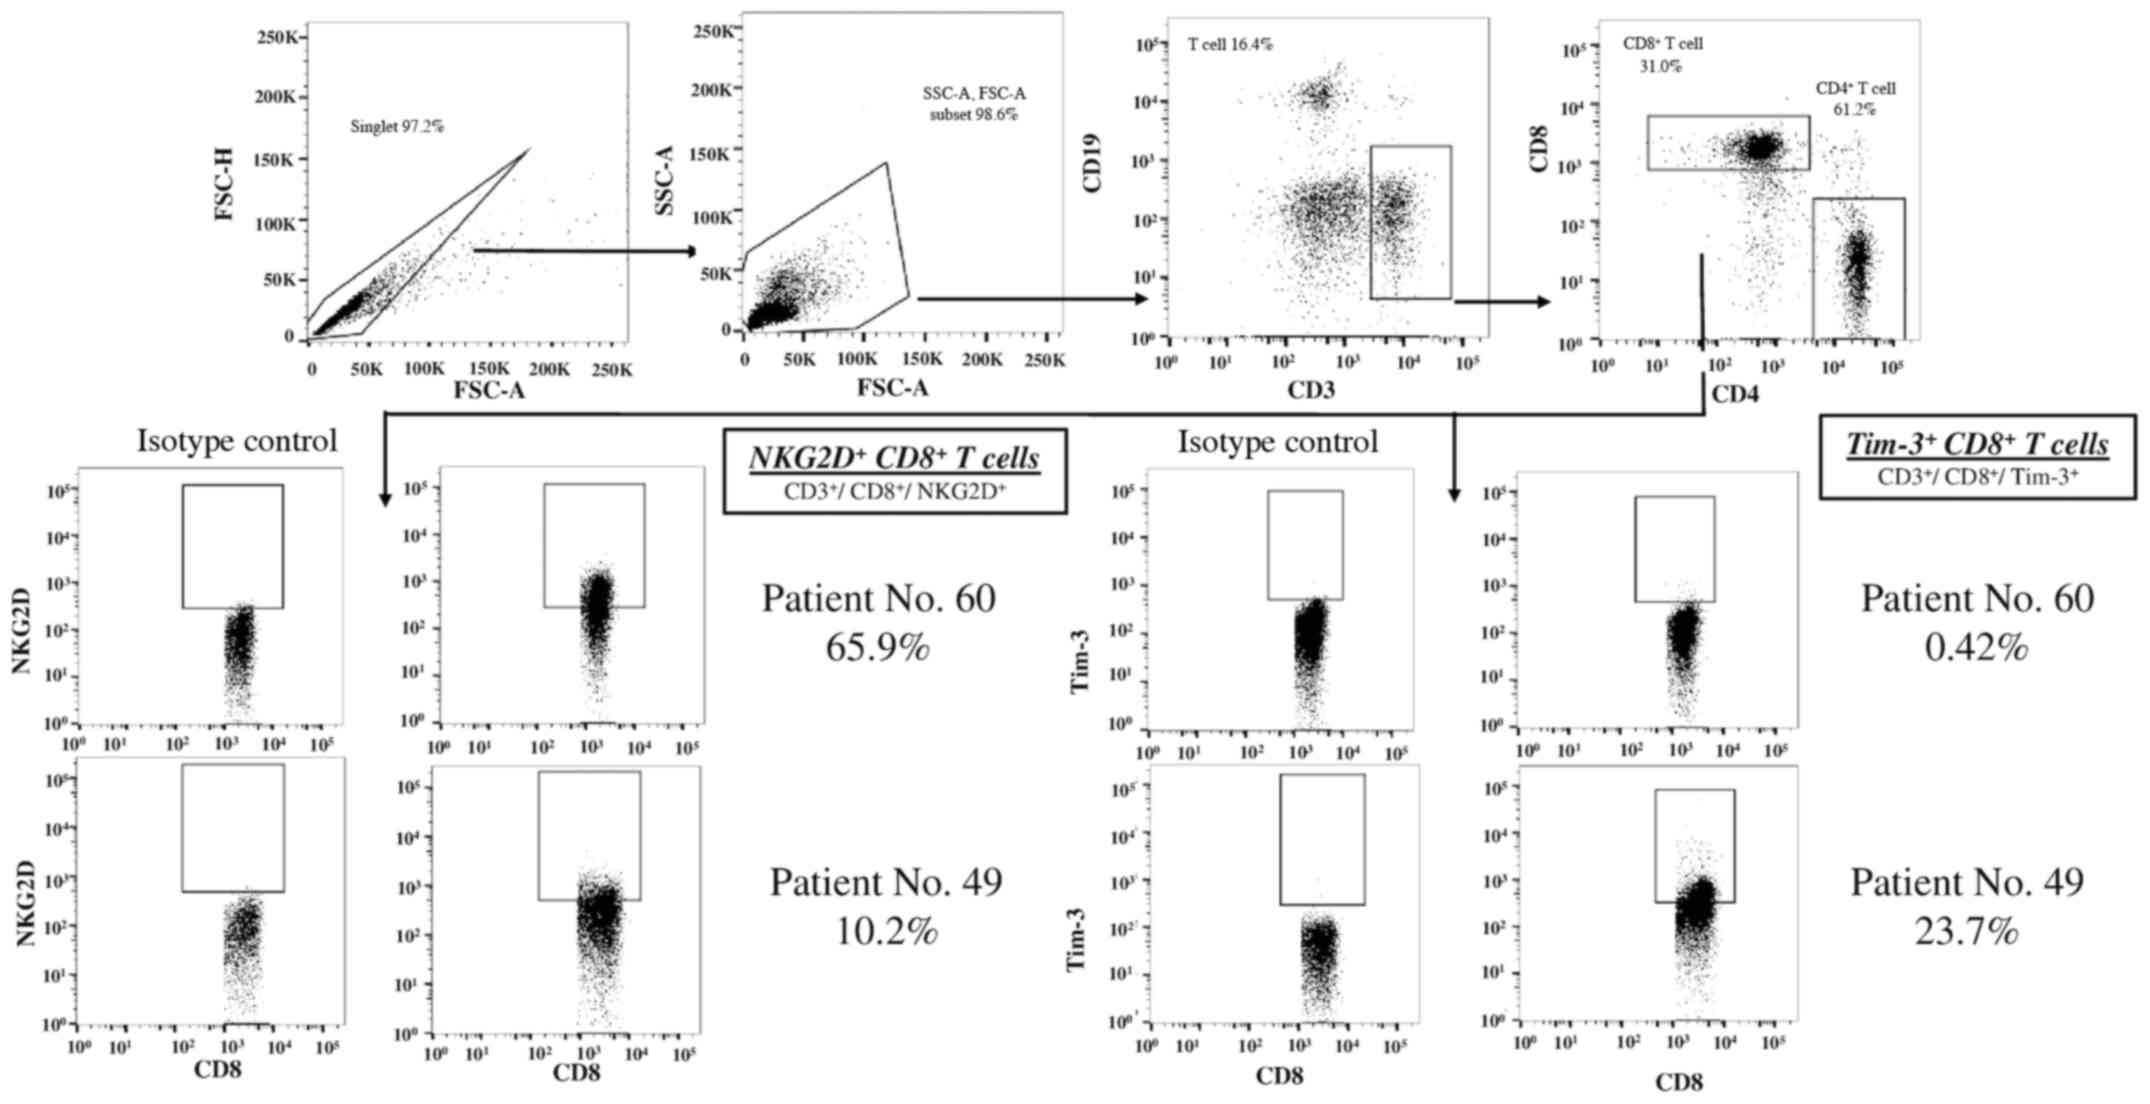
The quantities of CD28, 4-1BB, ICOS, OX-40, CTLA-4, PD-1, Tim-3,
LAG-3, NKG2D, NKG2A and CD62-L were also assessed in
CD4+ and CD8+ T cells and NK cells (Figs. 2 and 3). Isotype controls were used to determine
the cut-off levels for distinguishing between positivity and
negativity. The quantities of the lymphoid subsets were obtained by
dividing the cell number of each subset by the cell number of the
lymphocyte fraction, based on the results obtained from the flow
cytometry analysis. The quantities of Gr-MDSCs were calculated by
dividing the cell number of
CD33dimCD15+CD66+CD11b+
cells by the number of PBMCs. The patients were divided, based on
the median values, according to the proportion of each immune cell
subset into elevated and non-elevated groups.
Statistical analysis
In the present study, DFS was defined follows: From
the day of study registration and blood collection after the
primary treatment for tumor ended until the day of confirmation of
a new lesion or symptom of the tumor. PFS was defined follows: From
the day of study registration and blood collection after the
treatment of a disease until the day of confirmation of disease
progression. Imaging studies, such as CT scans, were performed
approximately every three months to check for disease progression
and the appearance of new lesions, and was assessed according to
the Response Evaluation Criteria in Solid Tumors guidelines (v1.1)
(30). The data are presented as the
mean ± SD. The association between clinicopathological factors, and
the different immune cell subsets with DFS and PFS were analyzed
using univariate logistic analysis. The patients were divided into
elevated and non-elevated groups based on the median values and
according to the proportion of each immune cell subset. The DFS and
PFS curves were calculated using the Kaplan-Meier method and
compared with the log-rank test. Pearson's correlation was used to
evaluate for correlations between each pair of immune cell subset.
Multivariate cox regression analysis was used to investigate the
association between clinicopathological factors and DFS. P<0.05
was considered to indicate a statistically significant difference.
Statistical analyses were performed using the GraphPad Prism
software (v7; GraphPad Software, Inc.) and the SPSS statistical
software (v21.0; IBM Corp.). The experiments were repeated three
times.
Results
Quality of immune cell subsets in
patients with bone sarcoma and STS
Each immune cell subset was detected using flow
cytometry. The median values of the proportion and range in
patients with high-grade non-metastatic are shown in Table SI. In addition, the median values of
the proportion and range of the patients with metastatic sarcoma
are shown in Table SII.
Associations between
clinicopathological factors/number of suppressor cells and number
of antigen-presenting cells/effector cells/cells secreting immune
checkpoint proteins and DFS/PFS
A total of 61 patients with no metastasis and
high-grade sarcoma, and 25 patients with metastatic sarcoma were
examined. The associations between clinicopathological factors and
DFS/PFS times are shown in Table
II. The patients were divided into elevated and non-elevated
groups based on the median value of each factor. No significant
differences were noted between the DFS time in patients without
metastasis and PFS time in patients with metastasis. The gating
strategies for suppressor, antigen-presenting and effector cells
are shown in Figs. 1 and 2. The associations between the quantities
of these cell types and the DFS time in patients without metastasis
and the PFS time in patients with metastasis are shown in Tables III and IV. The patients were divided into elevated
and non-elevated groups based on the median values and according to
the proportion of each immune cell subset. The DFS time in patients
without metastasis and the PFS time in patients with metastasis
were compared between each pair of immune cell subsets. High M-MDSC
number was significantly associated with lower DFS time in patients
without metastasis and PFS time in patients with metastasis. The
gating strategies used to determine the expression levels of
molecules, such as immune checkpoint proteins, in CD4+
T, CD8+ T and NK cells are shown in Figs. 2 and 3. There were 65.9 and 10.2% of the
NKG2D+ CD8+ T cells, and 0.42 and 23.7% of
the Tim-3+ CD8+ T cells in patient nos. 60
and 49. The associations between the expression levels of these
molecules and DFS time in patients without metastasis and PFS time
in patients with metastasis are shown in Tables III and IV. The patients were divided, based on the
median values of the immune cell subsets, into elevated and
non-elevated groups. DFS time in patients without metastasis and
PFS time in patients with metastasis were compared between
molecules, such as immune checkpoint proteins on CD4+ T,
CD8+ T and B cells. Low numbers of NKG2D+
CD8+ T cells and high numbers of Tim-3+
CD8+ T cells were significantly associated with lower
DFS time in patients without metastasis. However, no significant
differences were noted in comparisons of PFS time in patients with
metastasis between two groups.
| Table II.Association between the
clinicopathological factors and DFS and PFS. |
Table II.
Association between the
clinicopathological factors and DFS and PFS.
|
| Free of metastasis
and high-grade sarcoma (N=61) | Metastatic sarcoma
(N=25) |
|---|
|
|
|
|
|---|
| Clinicopathological
factors | HR (95% CI) | P-value | HR (95% CI) | P-value |
|---|
| Age, years |
|
<56 | Reference |
| Reference |
|
|
≥56 | 0.9 (0.3–2.6) | 0.96 | 2.1 (0.8–3.4) | 0.71 |
| Sex |
|
Male | Reference |
| Reference |
|
|
Female | 1.0 (0.3–3.0) | 0.87 | 0.4 (0.4–3.7) | 0.55 |
| PS |
| 0 | Reference |
|
|
|
| 1 | 1.1 (0.2–5.1) | 0.88 |
|
|
|
0-1 |
|
| Reference |
|
|
2-4 |
|
| 2.2 (0.3–3.3) | 0.43 |
| ALP, U/l |
|
<322 | Reference |
| Reference |
|
|
≥322 | 1.5 (0.4–5.7) | 0.52 | 2.3 (0.7–5.5) | 0.43 |
| LDH, U/l |
|
<222 | Reference |
| Reference |
|
|
≥222 | 3.3 (0.8–12.3) | 0.08 | 4.3 (0.6–7.3) | 0.66 |
| WBC, µl |
|
<8600 | Reference |
| Reference |
|
|
≥8600 | 2.1 (0.6–7.2) | 0.25 | 2.3 (0.8–4.2) | 0.39 |
| Lymphocytes, % |
|
<38.9 | Reference |
| Reference |
|
|
≥38.9 | 0.1 (0–2.3) | 0.77 | 0.5 (0.5–2.6) | 0.29 |
| Neutrophils, % |
|
<72.7 | Reference |
| Reference |
|
|
≥72.7 | 2.4 (0.9–7.0) | 0.09 | 5.2 (0.4–6.1) | 0.12 |
| Monocyte, % |
|
<8.7 | Reference |
| Reference |
|
|
≥8.7 | 1.0 (0.1–10.9) | 0.95 | 3.6 (0.2–6.9) | 0.55 |
| Eosinocyte, % |
|
<5.0 | Reference |
| Reference |
|
|
≥5.0 | 0.1 (0.1–2.4) | 0.78 | 0.3 (0.3–2.9) | 0.33 |
| CRP, mg/dl |
|
<0.14 | Reference |
| Reference |
|
|
≥0.14 | 1.9 (0.6–5.5) | 0.23 | 7.9 (0.9–8.9) | 0.41 |
| Table III.Association between the quantity of
each immune cell subset and disease-free survival in patients with
high-grade sarcoma and without metastasis. |
Table III.
Association between the quantity of
each immune cell subset and disease-free survival in patients with
high-grade sarcoma and without metastasis.
| Immune cell
subset | Median, % | HR (95% CI) | P-value |
|---|
| Suppressor
cells |
|
M-MDSC | ≤21.4 | Reference |
|
|
| >21.4 | 2.9 (1.0–8.4) | 0.04a |
|
Gr-MDSC | ≤0.04 | Reference |
|
|
| >0.04 | 1.5 (0.5–4.3) | 0.41 |
| Naïve
Tregs | ≤0.31 | Reference |
|
|
| >0.31 | 0.9 (0.3–2.7) | 0.94 |
|
Effector Tregs | ≤0.01 | Reference |
|
|
| >0.01 | 0.7 (0.2–2.0) | 0.50 |
| Antigen-presenting
cells |
| Myeloid
DC | ≤0.31 | Reference |
|
|
| >0.31 | 1.5 (0.5–4.4) | 0.44 |
|
Plasmacytoid DC | ≤0.22 | Reference |
|
|
| >0.22 | 0.9 (0.3–2.6) | 0.91 |
| Effector cells |
|
CD4+ T cells | ≤35.5 | Reference |
|
|
| >35.5 | 1.0 (0.4–3.1) | 0.89 |
|
Naïve | ≤15.4 | Reference |
|
|
| >15.4 | 1.0 (0.4–3.0) | 0.94 |
|
Effector | ≤20.2 | Reference |
|
|
| 20.2 | 2.2 (0.7–6.8) | 0.16 |
|
Effector memory | ≤28.9 | Reference |
|
|
| >28.9 | 0.4 (0.2–1.3) | 0.13 |
| Central
memory | ≤58.8 | Reference |
|
|
| >58.8 | 0.7 (0.3–2.1) | 0.58 |
| CD8+ T
cells | ≤42.8 | Reference |
|
|
| >42.8 | 0.33 (0.4–3.5) | 0.72 |
|
Naïve | ≤27.0 | Reference |
|
|
| >27.0 | 3.0 (0.9–7.8) | 0.60 |
|
Effector | ≤25.2 | Reference |
|
|
| >25.2 | 2.9 (1.0–8.9) | 0.12 |
|
Effector memory | ≤64.8 | Reference |
|
|
| >64.8 | 0.4 (0.1–1.1) | 0.07 |
| Central
memory | ≤30.3 | Reference |
|
|
| >30.3 | 0.7 (0.2–1.9) | 0.47 |
| B cells | ≤1.05 | Reference |
|
|
| >1.05 | 0.9 (0.3–2.6) | 0.89 |
|
CD56bright NK cells | ≤11.5 | Reference |
|
|
| >11.5 | 1.7 (0.6–4.9) | 0.33 |
| CD56dim
NK cells | ≤1.1 | Reference |
|
|
| >1.1 | 0.6 (0.2–1.7) | 0.33 |
| Expression on
CD4+ T cells |
|
CD28 | ≤0.32 | Reference |
|
|
| >0.32 | 0.6 (0.2–1.8) | 0.41 |
|
4-1BB | ≤20.3 | Reference |
|
|
| >20.3 | 2.6 (0.5–13.3) | 0.24 |
|
ICOS | ≤3.26 | Reference |
|
|
| >3.26 | 0.8 (0.3–2.2) | 0.65 |
|
OX-40 | ≤0.35 | Reference |
|
|
| >0.35 | 1.4 (0.4–5.1) | 0.59 |
|
CTLA-4 | ≤1.03 | Reference |
|
|
| >1.03 | 0.4 (0.1–1.1) | 0.07 |
|
PD-1 | ≤0.11 | Reference |
|
|
| >0.11 | 0.7 (0.2–2.0) | 0.50 |
|
LAG-3 | ≤0.08 | Reference |
|
|
| >0.08 | 0.5 (0.17–1.4) | 0.19 |
|
Tim-3 | ≤5.8 | Reference |
|
|
| >5.8 | 1.3 (0.3–5.4) | 0.72 |
|
NKG2D | ≤10.2 | Reference |
|
|
| >10.2 | 2.9 (0.8–11.9) | 0.12 |
|
NKG2A | ≤0.14 | Reference |
|
|
| >0.14 | 2.2 (0.7–7.7) | 0.19 |
|
CD62-L | ≤16.7 | Reference |
|
|
| >16.7 | 0.3 (0.1–1.0) | 0.06 |
| Expression on
CD8+ T cells |
|
CD28 | ≤0.11 | Reference |
|
|
| >0.11 | 0.5 (0.17–1.5) | 0.23 |
|
4-1BB | ≤15.8 | Reference |
|
|
| >15.8 | 15.9 (0.1–4.4) | 0.75 |
|
ICOS | ≤0.43 | Reference |
|
|
| >0.43 | 1.3 (0.5–4.0) | 0.54 |
|
OX-40 | ≤0.19 | Reference |
|
|
| >0.19 | 1.6 (0.5–5.3) | 0.38 |
|
CTLA-4 | ≤0.68 | Reference |
|
|
| >0.68 | 0.4 (0.2–1.3) | 0.15 |
|
PD-1 | ≤0.39 | Reference |
|
|
| >0.39 | 0.3 (0.4–2.3) | 0.21 |
|
LAG-3 | ≤7.6 | Reference |
|
|
| >7.6 | 0.5 (0.2–1.5) | 0.21 |
|
Tim-3 | ≤8.7 | Reference |
|
|
| >8.7 | 3.4 (1.0–11.1) | 0.04a |
|
NKG2D | ≤26.6 | Reference |
|
|
| >26.6 | 0.3 (0.1–0.9) | 0.05a |
|
NKG2A | ≤1.4 | Reference |
|
|
| >1.4 | 1.6 (0.5–4.8) | 0.41 |
|
CD62-L | ≤24.7 | Reference |
|
|
| >24.7 | 0.7 (0.2–2.0) | 0.50 |
| Table IV.Association between the quantity of
each immune cell subset and progression-free survival in patients
with metastatic sarcoma. |
Table IV.
Association between the quantity of
each immune cell subset and progression-free survival in patients
with metastatic sarcoma.
| Immune cell
subset | Median, % | HR (95% CI) | P-value |
|---|
| Suppressor
cells |
|
M-MDSC | ≤44.2 | Reference |
|
|
| >44.2 | 5.9 (1.3–26.7) | 0.02a |
|
Gr-MDSC | ≤0.63 | Reference |
|
|
| >0.63 | 0.3 (0.7–1.2) | 0.09 |
| Naïve
Tregs | ≤0.62 | Reference |
|
|
| >0.62 | 3.2 (0.5–3.5) | 0.34 |
|
Effector Tregs | ≤0.03 | Reference |
|
|
| >0.03 | 0.7 (0.2–7.9) | 0.88 |
| Antigen-presenting
cells |
| Myeloid
DC | ≤0.34 | Reference |
|
|
| >0.34 | 1.5 (0.4–6.1) | 0.52 |
|
Plasmacytoid DC | ≤0.48 | Reference |
|
|
| >0.48 | 2.1 (0.5–8.2) | 0.30 |
| Effector cells |
|
CD4+ T cells | ≤29.7 | Reference |
|
|
| >29.7 | 0.5 (0.1–4.3) | 0.53 |
|
Naïve | ≤21.8 | Reference |
|
|
| >21.8 | 0.2 (0.1–1.7) | 0.14 |
|
Effector | ≤3.42 | Reference |
|
|
| >3.42 | 2.1 (0.3–16.5) | 0.50 |
|
Effector memory | ≤32.4 | Reference |
|
|
| >32.4 | 0.1 (0.1–1.4) | 0.09 |
| Central
memory | ≤33.1 | Reference |
|
|
| >33.1 | 0.3 (0.1–2.4) | 0.23 |
| CD8+ T
cells | ≤26.8 | Reference |
|
|
| >26.8 | 1.4 (0.2–11.8) | 0.77 |
|
Naïve | ≤16.7 | Reference |
|
|
| >16.7 | 1.4 (0.1–15.7) | 0.77 |
|
Effector | ≤14.6 | Reference |
|
|
| >14.6 | 5.1 (0.4–2.3) | 0.33 |
|
Effector memory | ≤46.7 | Reference |
|
|
| >46.7 | 11.2
(0.6–21.7) | 0.11 |
| Central
memory | ≤9.28 | Reference |
|
|
| >9.28 | 0.2 (0.1–3.0) | 0.23 |
| B cells | ≤8.39 | Reference |
|
|
| >8.39 | 0.3 (0.1–3.9) | 0.36 |
|
CD56bright NK
cells | ≤13.4 | Reference |
|
|
| >13.4 | 1.2 (0.2–9.0) | 0.83 |
|
CD56dim NK
cells | ≤2.3 | Reference |
|
|
| >2.3 | 7.4 (0.9–60.3) | 0.62 |
| Expression on
CD4+ T cells |
|
CD28 | ≤0.77 | Reference |
|
|
| >0.77 | 0.3 (0.1–3.8) | 0.38 |
|
4-1BB | ≤10.2 | Reference |
|
|
| >10.2 | 1.7 (0.2–12.1) | 0.60 |
|
ICOS | ≤4.98 | Reference |
|
|
| >4.98 | 0.3 (0.1–2.1) | 0.19 |
|
OX-40 | ≤0.53 | Reference |
|
|
| >0.53 | 0.24 (0.1–2.9) | 0.26 |
|
CTLA-4 | ≤1.31 | Reference |
|
|
| >1.31 | 0.3 (0.1–2.4) | 0.25 |
|
PD-1 | ≤0.52 | Reference |
|
|
| >0.52 | 16.1 (0.6–4.1) | 0.09 |
|
LAG-3 | ≤0.29 | Reference |
|
|
| >0.29 | 0.4 (0.1–3.2) | 0.39 |
|
Tim-3 | ≤3.58 | Reference |
|
|
| >3.58 | 0.3 (0.1–2.6) | 0.28 |
|
NKG2D | ≤7.9 | Reference |
|
|
| >7.9 | 0.1 (0.1–1.4) | 0.09 |
|
NKG2A | ≤0.82 | Reference |
|
|
| >0.82 | 0.7 (0.1–4.1) | 0.65 |
|
CD62-L | ≤53.2 | Reference |
|
|
| >53.2 | 6.0 (0.2–15.2) | 0.28 |
| Expression on
CD8+ T cells |
|
CD28 | ≤0.49 | Reference |
|
|
| >0.49 | 6.8 (0.3–15.7) | 0.23 |
|
4-1BB | ≤8.07 | Reference |
|
|
| >8.07 | 2.3 (0.4–2.8) | 0.33 |
|
ICOS | ≤0.45 | Reference |
|
|
| >0.45 | 1.5 (0.1–24.1) | 0.78 |
|
OX-40 | ≤1.44 | Reference |
|
|
| >1.44 | 0.3 (0.3–1.8) | 0.55 |
|
CTLA-4 | ≤0.57 | Reference |
|
|
| >0.57 | 0.4 (0.4–4.1) | 0.46 |
|
PD-1 | ≤0.23 | Reference |
|
|
| >0.23 | 2.7 (0.2–32.2) | 0.44 |
|
LAG-3 | ≤0.08 | Reference |
|
|
| >0.08 | 0.2 (0.1–3.7) | 0.30 |
|
Tim-3 | ≤0.88 | Reference |
|
|
| >0.88 | 2.8 (0.4–9.2) | 0.12 |
|
NKG2D | ≤15.4 | Reference |
|
|
| >15.4 | 1.5 (0.9–9.2) | 0.87 |
|
NKG2A | ≤3.68 | Reference |
|
|
| >3.68 | 0.4 (0.9–12.5) | 0.55 |
|
CD62-L | ≤33.9 | Reference |
|
|
| >33.9 | 0.1 (0.1–2.7) | 0.18 |
Association of the number of M-MDSC,
NKG2D+ CD8+ T cells and Tim-3+
CD8+ T cells with DFS
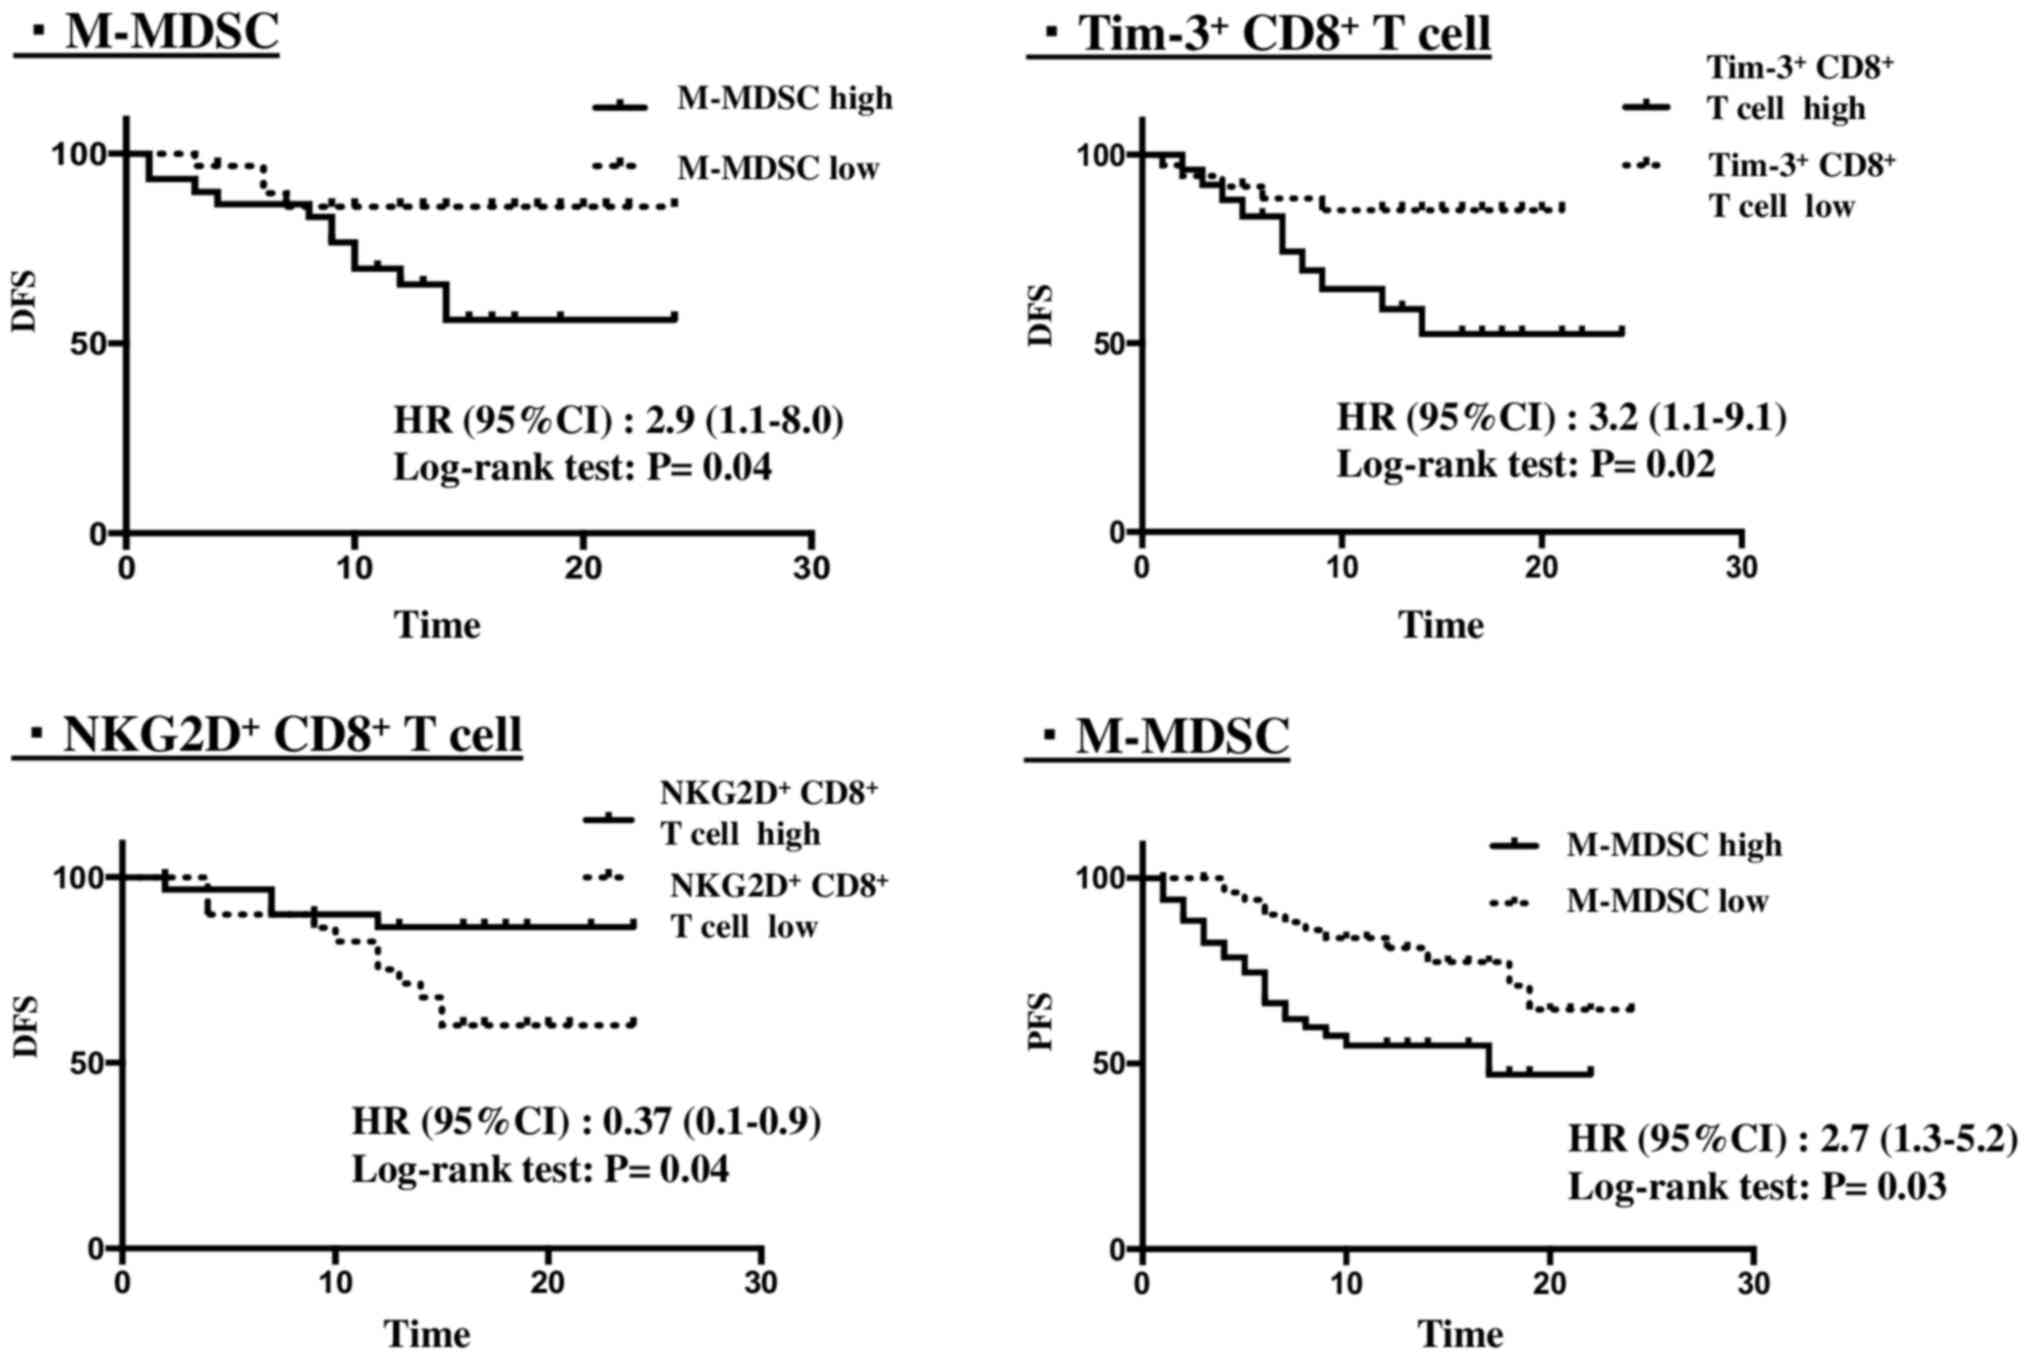
The association between the number of immune subset
cells with DFS times in patients without metastasis was
investigated. The patients were divided into ‘elevated’ and
‘non-elevated’ groups. The cut-off/threshold value was used based
on the median value of immune subset cells. The data indicated that
the number of M-MDSC, NKG2D+ CD8+ T cells and
Tim-3+ CD8+ T cells was significantly
associated with DFS based on the Kaplan-Meier method and the
comparisons performed using the log-rank test (Fig. 4). High numbers of M-MDSC and
Tim-3+ CD8+ T cells were significantly
associated with poor DFS times (P=0.04 and 0.02, respectively),
while high levels of NKG2D+ CD8+ T cells were
significantly associated with longer DFS times (P=0.04).
Multivariate Cox regression analysis revealed that the quantities
of Tim-3+ CD8+ T cells were associated with a
lower DFS time (Table V).
| Table V.Multivariate analysis for
disease-free survival. |
Table V.
Multivariate analysis for
disease-free survival.
| Clinicopathological
characteristics | HR (95% CI) | P-value |
|---|
| M-MDSC, % |
|
<21.4 | Reference |
|
|
≥21.4 | 2.3 (0.6–8.3) | 0.17 |
| NKG2D+
CD8+ T cell, % |
|
<26.6 | Reference |
|
|
≥26.6 | 0.3 (0.1–1.3) | 0.12 |
| Tim-3+
CD8+ T cell, % |
|
<8.7 | Reference |
|
|
≥8.7 | 3.7 (1.0–12.9) |
0.04a |
Association between the number of
M-MDSCs and PFS
The association between the number of immune subset
cells and PFS time was examined. The patients with metastasis were
divided into ‘high’ and ‘low’ groups. The cut-off/threshold value
was used based on the median value of immune subset cells. The data
indicated that the number of M-MDSCs was significantly associated
with PFS time based on the Kaplan-Meier method and comparisons
using the log-rank test (Fig. 4). A
high number of M-MDSCs was significantly associated with poor PFS
(P=0.03).
Pairwise correlation of
Tim-3+ CD8+ T, M-MDSC and NKG2D+
CD8+ T cell number
The initial analysis demonstrated that the number of
M-MDSCs, Tim-3+ CD8+ T cells and
NKG2D+ CD8+ T cells was associated with DFS
time. Subsequently, Pearson's correlation analysis was performed
between each pair of these variables, corresponding to the three
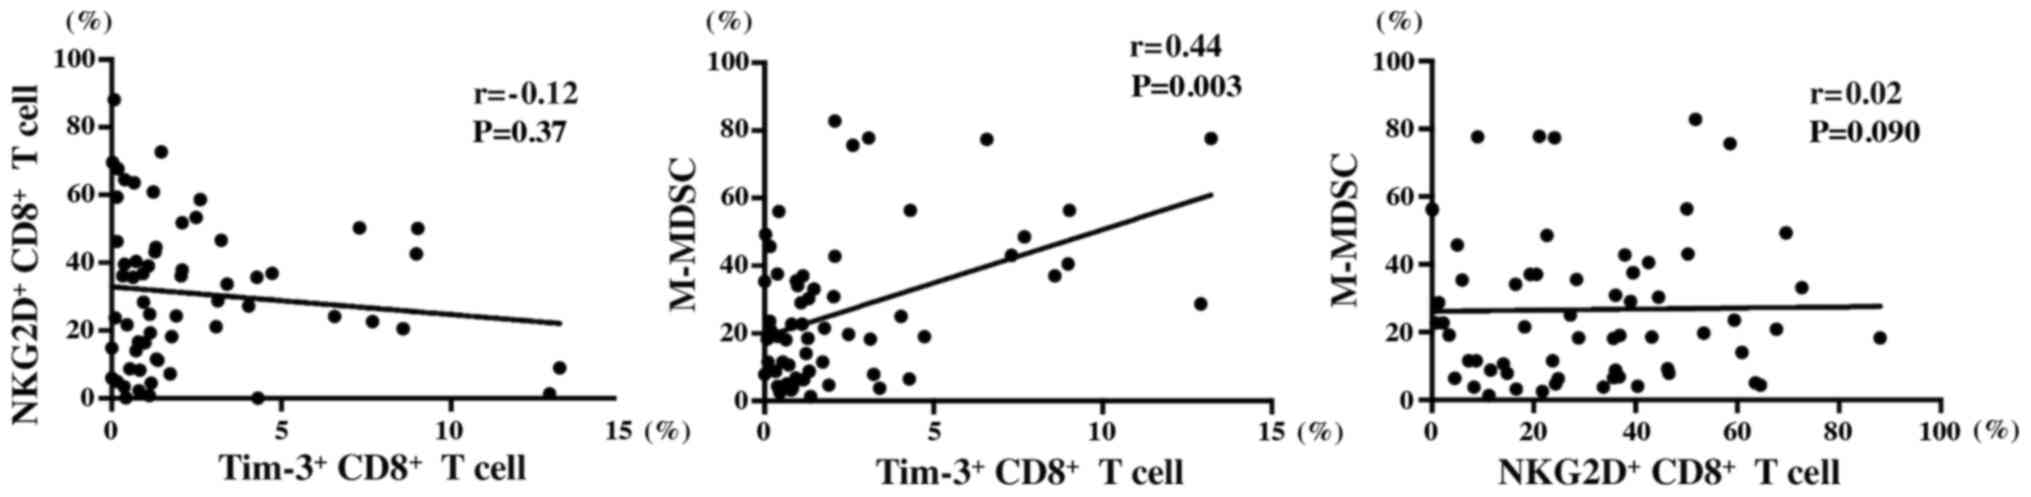
different cell types (Fig. 5). No
correlation was found between the number of Tim-3+
CD8+ T and NKG2D+ CD8+ T cells
(r=−0.12; P=0.37). Similarly, no correlation was noted between the
number of NKG2D+ CD8+ T and M-MDSC cells
(r=−0.02; P=0.90). However, a weak correlation was observed between
the number of M-MDSCs and Tim-3+ CD8+ T cells
(r=−0.44; P=0.003).
Discussion
In the present study, the immunological status of
peripheral blood samples from patients with bone sarcoma and STS
was investigated and also the association between the quantity of
each immune cell subset and DFS/PFS times in patients with sarcoma.
A higher number of M-MDSCs and Tim-3+ CD8+ T
cells was significantly associated with poor DFS times, while a
higher number of NKG2D+ CD8+ T cells was
significantly associated with longer DFS times. In addition, a
higher number of M-MDSCs was significantly associated with poor PFS
time and a weak positive correlation was found between the number
of M-MDSCs and Tim-3+ CD8+ T cells.
In previous studies, high quantities of M-MDSCs in
peripheral blood samples were identified as a poor prognostic
factor for various types of cancer, such as melanoma,
hepatocellular carcinoma, colorectal cancer and non-small cell lung
cancer (25,26,28,31,32). In
patients with gastric cancer, a higher number of granulocyte-MDSCs
was found to be a significant adverse factor for PFS time (33). The present study revealed that higher
quantities of M-MDSCs were associated with poor DFS and PFS times.
However, the granulocyte-MDSC ratio was not associated with DFS and
PFS. The findings suggested similar results with those obtained in
other types of tumors.
MDSCs are a heterogeneous population of granulocyte
and monocyte-like cells that inhibit T cell function (23). Significant accumulation of MDSCs has
been observed in patients with certain conditions, including
chronic infections, transplantation and multiple malignancies
compared with that in healthy subjects (23). The functions of MDSCs, including
production of arginase 1, release of reactive oxygen species and
nitric oxide and secretion of immune-suppressive cytokines, leads
to suppression of the immune responses (34). In addition, MDSCs are a potential
therapeutic target. Clinical trials have examined the
administration of multiple kinase inhibitors as inhibitors of MDSC
proliferation (35,36). In addition, phosphodiesterase-5
inhibitors have been used to deactivate MDSCs and all-trans
retinoic acid has been used to prevent the differentiation of MDSCs
(34). These trials are ongoing. The
present study demonstrated that the number of M-MDSCs in patients
with metastatic sarcoma was higher compared with that in patients
with no high-grade sarcoma metastasis. The quantities of M-MDSCs
may depend on the potential tumor clinical stage. Therefore, the
number of M-MDSCs in patients with metastatic sarcoma may cause
suppression of immune responses and consequently the inhibition of
M-MDSC proliferation may be a potential therapeutic strategy.
As a co-inhibitory receptor present on the surface
of T cells, Tim-3 plays a role in immune regulation (14). Galectin-9 has been described as a
binding receptor that mediates the T cell inhibitory effects of
Tim-3 (37). Tim-3 has also been
shown to be expressed on Th1 cells, as well as on CD4+
and CD8+ T cells, Treg, Th17, NK, DCs, monocytes and
mast cells (38). Upregulation of
TIM-3 expression has been observed on exhausted CD8+ T
cells (39,40). In certain tumors, such as lung
cancer, lymphomas and breast cancer, higher quantities of
Tim-3+ CD8+ T cells were associated with poor
disease outcomes (41–45). Ge et al (42) reported that Tim-3+
CD4+ T and CD8+ T cells may serve as novel
diagnostic and prognostic biomarkers of OS. However, to the best of
our knowledge, the number of Tim-3+ CD8+ T
cells in peripheral blood specimens from patients with STS has not
been previously investigated, with respect to disease progression
and patient survival. The present study indicated that the higher
number of Tim-3+ CD8+ T cells was associated
with poor DFS time in peripheral blood specimens derived from
patients with bone sarcoma and STS.
The results of the present study suggested that the
host immune response to tumors occurred in some, but not all,
patients with bone sarcomas and STSs. Feng and Guo (46) demonstrated that the Tim-3 protein was
overexpressed and that its mRNA expression levels were increased in
OS tissues in vitro, as demonstrated by immunohistochemistry
and reverse transcription-quantitative PCR. These findings
suggested that the anti-Tim-3 antibody may exert significant
tumor-associated effects on STS cells, as well as on T cells
expressing the Tim-3 protein on their surface.
In addition, the present study indicated that high
levels of NKG2D+ CD8+ T cells were favorable
factors for DFS time in patients with early stage bone sarcoma and
STS. NKG2D is a stimulatory receptor expressed on the surface of NK
cells and subsets of T cells (47).
The function of NKG2D, as a co-stimulatory molecule on the surface
of tumor infiltrating lymphocytes, involves its ligands, MICA/B and
ULBPs, which are present in tumors, as well as the stimulation of
the antitumor immunity (48,49). Several studies have shown that the
protein expression levels of NKG2D were associated with optimal
outcomes in patients with cancer, such as nasopharyngeal carcinoma,
cervical cancer and pancreatic cancer (50–52).
Similarly, the findings from the present study suggested that high
levels of NKG2D+ CD8+ T cells were found to
be favorable factors for DFS time in patients with early stage bone
sarcoma and STS.
Furthermore, a high number of M-MDSCs was identified
as a poor prognostic factor, indicating low PFS time in patients
with metastasis. These observations suggested that immune
surveillance, i.e. the host immune reaction against cancer, existed
in patients with bone sarcomas and STSs. Notably, a high number of
M-MDSCs was associated with DFS and PFS times, suggesting that it
could be used as a prognostic factor.
In advanced cancer progression cases, the number of
immunosuppressor cells, such as Tregs and MDSCs typically increases
according to their tumor volume. Furthermore, T cell function is
strongly suppressed. Therefore, the activation of the surface
markers, such as Tim-3 and NKG2D and the associated fatigue caused
on T cells may not correlate with prognosis in patients who are at
the late disease stages (53–55).
The present study contains certain limitations. The
cohort was small, since bone sarcomas and STSs are rare tumors.
Furthermore, it is important to identify associations between the
immunological status of peripheral blood samples and the findings
of pathological specimens, and to compare the immune status between
patients with non-metastatic sarcoma and with patients with
subsequent metastatic to predict prognosis. However, in the current
study, specimens were not collected in the same patient at
subsequent metastases. These aspects will be investigated in future
studies. In addition, the interference of other factors, such as
chemotherapy could not be excluded. Therefore, patients with
high-grade sarcoma and no metastasis or those with metastatic
sarcoma were only included to minimize the impact of differences in
disease background and interventions. This is a preliminary,
exploratory study and the results will be subsequently validated in
a larger number of patients in the future.
In conclusion, the present study demonstrated that
the immune status of patients with high-grade sarcoma and no
metastasis or those with metastatic sarcoma who were treated with
non-immunotherapy methods was associated with PFS or DFS times.
These results may indicate that patients with bone sarcoma and STS,
who develop an antitumor immune response over the natural course of
their disease and those who develop a strong antitumor immune
response, may have improved disease outcomes. The results of the
present study may aid the development of novel strategies for
sarcoma treatment based on the use of specific biomarkers or
immunotherapeutic targets.
Supplementary Material
Supporting Data
Acknowledgements
The authors would like to thank Mr. Masafumi Fuse,
Ms Moeko Inoue and Dr Tetsuhiko Asao (all Department of
Experimental Therapeutics and Exploratory Oncology Research and
Clinical Trial Center, National Cancer Center Hospital, Tokyo,
Japan) for their useful discussion with respect to the writing of
the manuscript.
Funding
This study was supported by the Japan Society for
the Promotion of science (JSPS), Grant-in Aid for Scientific
Research (B) (grant no. 15H04964), JSPS, Grant-in Aid for
Scientific Research (C) (grant no. 17K07208), JSPS, Grant-in Aid
for Young Scientists B) (grant no. 16K20076), JSPS, Grant-in Aid
for Young Scientists (grant no. 18K16634) and the Uehara Memorial
Foundation and The Nakatomi Foundation.
Availability of data and materials
The datasets used and/or analyzed during the current
study are available from the corresponding author on reasonable
request.
Authors' contributions
EK, AK and SK supervised the research. YK, EK, YS,
TN, KK and SK designed the study and performed the experiments. YK,
EK, DK, YT, ME, FN, AK obtained patient consent and collected the
samples. YK and AI analyzed and interpreted the data. All authors
wrote the manuscript and approved the final version for
publication.
Ethics approval and consent to
participate
This study was approved by the Institutional Review
Board (approval no. 2014-287) from the National Cancer Center
(Tokyo, Japan). All participants provided written informed
consent.
Patient consent for publication
Not applicable.
Competing interests
Shigehisa Kitano reports personal fees from Astra
Zeneca, Chugai Pharmaceutical Co., Ltd., Pfizer, Inc., Sanofi S.A.,
Nippon Kayaku Co., Ltd., Meiji Seika Kaisha, Ltd., Taiho
Pharmaceutical Co., Ltd., Novartis International AG, Daiichi-Sankyo
Co., Ltd., personal fees from Merck Sharp and Dohme Corp., Kyowa
Kirin Co., Ltd., Celgene Corporation, Sumitomo Dainippon Pharma
Co., Ltd., Astellas Pharma, Inc., Ono Pharmaceutical Co., Ltd.,
Bristol-Myers Squibb Company, AYUMI Pharmaceutical Corporation,
Rakuten Medical, Inc., and Pharmaceuticals and Medical Devices
Agency. In addition, grants and personal fees from Boehringer
Ingelheim, Eisai Co., Ltd., and Regeneron Pharmaceuticals, Inc.,
and grants from Gilead Sciences, Inc., Japan Agency for Medical
Research and Development, and Japan Society for the Promotion of
Science, outside the submitted work.
References
|
1
|
Zambo I and Veselý K: WHO classification
of tumours of soft tissue and bone 2013: The main changes compared
to the 3rd edition. Cesk Patol. 50:64–70. 2014.PubMed/NCBI
|
|
2
|
Gelderblom H, Blay JY, Seddon BM, Leahy M,
Ray-Coquard R, Sleijfer S, Kerst JM, Rutkowski P, Bauer S, Ouali M,
et al: Brostallicin versus doxorubicin as first-line chemotherapy
in patients with advanced or metastatic soft tissue sarcoma: an
European Organisation for Research and Treatment of Cancer Soft
Tissue and Bone Sarcoma Group randomised phase II and
pharmacogenetic study. Eur J Cancer. 50:388–396. 2014. View Article : Google Scholar : PubMed/NCBI
|
|
3
|
Mirabello L, Troisi RJ and Savage SA:
International osteosarcoma incidence patterns in children and
adolescents, middle ages and elderly persons. Int J Cancer.
125:229–234. 2009. View Article : Google Scholar : PubMed/NCBI
|
|
4
|
Esiashvili N, Goodman M and Marcus RB Jr:
Changes in incidence and survival of Ewing sarcoma patients over
the past 3 decades: Surveillance Epidemiology and End Results data.
J Pediatr Hematol Oncol. 30:425–430. 2008. View Article : Google Scholar : PubMed/NCBI
|
|
5
|
Goorin AM, Schwartzentruber DJ, Devidas M,
Gebhardt MC, Ayala AG, Harris MB, Helman LJ, Grier HE and Link MP;
Pediatric Oncology Group, : Presurgical chemotherapy compared with
immediate surgery and adjuvant chemotherapy for nonmetastatic
osteosarcoma: Pediatric Oncology Group Study POG-8651. J Clin
Oncol. 21:1574–1580. 2003. View Article : Google Scholar : PubMed/NCBI
|
|
6
|
Nesbit ME Jr, Gehan EA, Burgert EO Jr,
Vietti TJ, Cangir A, Tefft M, Evans R, Thomas P, Askin FB and
Kissane JM: Multimodal therapy for the management of primary,
nonmetastatic Ewing's sarcoma of bone: A long-term follow-up of the
First Intergroup study. J Clin Oncol. 8:1664–1674. 1990. View Article : Google Scholar : PubMed/NCBI
|
|
7
|
Italiano A, Mir O, Cioffi A, Palmerini E,
Piperno-Neumann S, Perrin C, Chaigneau L, Penel N, Duffaud F, Kurtz
JE, et al: Advanced chondrosarcomas: Role of chemotherapy and
survival. Ann Oncol. 24:2916–2922. 2013. View Article : Google Scholar : PubMed/NCBI
|
|
8
|
George B, Bresson D, Herman P and Froelich
S: Chordomas: A review. Neurosurg Clin N Am. 26:437–452. 2015.
View Article : Google Scholar : PubMed/NCBI
|
|
9
|
Swann JB and Smyth MJ: Immune surveillance
of tumors. J Clin Invest. 117:1137–1146. 2007. View Article : Google Scholar : PubMed/NCBI
|
|
10
|
Pardoll DM: The blockade of immune
checkpoints in cancer immunotherapy. Nat Rev Cancer. 12:252–264.
2012. View Article : Google Scholar : PubMed/NCBI
|
|
11
|
McCoy KD and Le Gros G: The role of CTLA-4
in the regulation of T cell immune responses. Immunol Cell Biol.
77:1–10. 1999. View Article : Google Scholar : PubMed/NCBI
|
|
12
|
Nishimura H and Honjo T: PD-1: An
inhibitory immunoreceptor involved in peripheral tolerance. Trends
Immunol. 22:265–268. 2001. View Article : Google Scholar : PubMed/NCBI
|
|
13
|
He Y, Rivard CJ, Rozeboom L, Yu H, Ellison
K, Kowalewski A, Zhou C and Hirsch FR: Lymphocyte-activation
gene-3, an important immune checkpoint in cancer. Cancer Sci.
107:1193–1197. 2016. View Article : Google Scholar : PubMed/NCBI
|
|
14
|
Cheng L and Ruan Z: Tim-3 and Tim-4 as the
potential targets for antitumor therapy. Hum Vaccin Immunother.
11:2458–2462. 2015. View Article : Google Scholar : PubMed/NCBI
|
|
15
|
Riha P and Rudd CE: CD28 co-signaling in
the adaptive immune response. Self Nonself. 1:231–240. 2010.
View Article : Google Scholar : PubMed/NCBI
|
|
16
|
Redmond WL, Ruby CE and Weinberg AD: The
role of OX40-mediated co-stimulation in T-cell activation and
survival. Crit Rev Immunol. 29:187–201. 2009. View Article : Google Scholar : PubMed/NCBI
|
|
17
|
Palazón A, Teijeira A, Martínez-Forero I,
Hervás-Stubbs S, Roncal C, Peñuelas I, Dubrot J, Morales-Kastresana
A, Pérez-Gracia JL, Ochoa MC, et al: Agonist anti-CD137 mAb act on
tumor endothelial cells to enhance recruitment of activated T
lymphocytes. Cancer Res. 71:801–811. 2011. View Article : Google Scholar : PubMed/NCBI
|
|
18
|
Dong C, Juedes AE, Temann UA, Shresta S,
Allison JP, Ruddle NH and Flavell RA: ICOS co-stimulatory receptor
is essential for T-cell activation and function. Nature.
409:97–101. 2001. View Article : Google Scholar : PubMed/NCBI
|
|
19
|
Pende D, Cantoni C, Rivera P, Vitale M,
Castriconi R, Marcenaro S, Nanni M, Biassoni R, Bottino C, Moretta
A, et al: Role of NKG2D in tumor cell lysis mediated by human NK
cells: Cooperation with natural cytotoxicity receptors and
capability of recognizing tumors of nonepithelial origin. Eur J
Immunol. 31:1076–1086. 2001. View Article : Google Scholar : PubMed/NCBI
|
|
20
|
Overman MJ, McDermott R, Leach JL, Lonardi
S, Lenz HJ, Morse MA, Desai J, Hill A, Axelson M, Moss RA, et al:
Nivolumab in patients with metastatic DNA mismatch repair-deficient
or microsatellite instability-high colorectal cancer (CheckMate
142): An open-label, multicentre, phase 2 study. Lancet Oncol.
18:1182–1191. 2017. View Article : Google Scholar : PubMed/NCBI
|
|
21
|
Capdevila J, Wirth LJ, Ernst T, Ponce Aix
S, Lin CC, Ramlau R, Butler MO, Delord JP, Gelderblom H, Ascierto
PA, et al: PD-1 blockade in anaplastic thyroid carcinoma. J Clin
Oncol. 38:2620–2627. 2020. View Article : Google Scholar : PubMed/NCBI
|
|
22
|
Armand P, Lesokhin A, Borrello I,
Timmerman J, Gutierrez M, Zhu L, Popa McKiver M and Ansell SM: A
phase 1b study of dual PD-1 and CTLA-4 or KIR blockade in patients
with relapsed/refractory lymphoid malignancies. Leukemia. Jun
29–2020.(Epub ahead of print). doi: 10.1038/s41375-020-0939-1.
View Article : Google Scholar
|
|
23
|
Gabrilovich DI and Nagaraj S:
Myeloid-derived suppressor cells as regulators of the immune
system. Nat Rev Immunol. 9:162–174. 2009. View Article : Google Scholar : PubMed/NCBI
|
|
24
|
Kondĕlková K, Vokurková D, Krejsek J,
Borská L, Fiala Z and Ctirad A: Regulatory T cells (TREG) and their
roles in immune system with respect to immunopathological
disorders. Acta Med (Hradec Kralove). 53:73–77. 2010. View Article : Google Scholar
|
|
25
|
Tada K, Kitano S, Shoji H, Nishimura T,
Shimada Y, Nagashima K, Aoki K, Hiraoka N, Honma Y, Iwasa S, et al:
Pretreatment immune status correlates with progression-free
survival in chemotherapy-treated metastatic colorectal cancer
patients. Cancer Immunol Res. 4:592–599. 2016. View Article : Google Scholar : PubMed/NCBI
|
|
26
|
Kitano S, Postow MA, Ziegler CG, Kuk D,
Panageas KS, Cortez C, Rasalan T, Adamow M, Yuan J, Wong P, et al:
Computational algorithm-driven evaluation of monocytic
myeloid-derived suppressor cell frequency for prediction of
clinical outcomes. Cancer Immunol Res. 2:812–821. 2014. View Article : Google Scholar : PubMed/NCBI
|
|
27
|
Gonda K, Shibata M, Ohtake T, Matsumoto Y,
Tachibana K, Abe N, Ohto H, Sakurai K and Takenoshita S:
Myeloid-derived suppressor cells are increased and correlated with
type 2 immune responses, malnutrition, inflammation, and poor
prognosis in patients with breast cancer. Oncol Lett. 14:1766–1774.
2017. View Article : Google Scholar : PubMed/NCBI
|
|
28
|
Arihara F, Mizukoshi E, Kitahara M, Takata
Y, Arai K, Yamashita T, Nakamoto Y and Kaneko S: Increase in
CD14+HLA-DR−/low myeloid-derived suppressor
cells in hepatocellular carcinoma patients and its impact on
prognosis. Cancer Immunol Immunother. 62:1421–1430. 2013.
View Article : Google Scholar : PubMed/NCBI
|
|
29
|
Kotsakis A, Harasymczuk M, Schilling B,
Georgoulias V, Argiris A and Whiteside TL: Myeloid-derived
suppressor cell measurements in fresh and cryopreserved blood
samples. J Immunol Methods. 381:14–22. 2012. View Article : Google Scholar : PubMed/NCBI
|
|
30
|
Eisenhauer EA, Therasse P, Bogaerts J,
Schwartz LH, Sargent D, Ford R, Dancey J, Arbuck S, Gwyther S,
Mooney M, et al: New response evaluation criteria in solid tumours:
Revised RECIST guideline (version 1.1). Eur J Cancer. 45:228–247.
2009. View Article : Google Scholar : PubMed/NCBI
|
|
31
|
Gabitass RF, Annels NE, Stocken DD, Pandha
HA and Middleton GW: Elevated myeloid-derived suppressor cells in
pancreatic, esophageal and gastric cancer are an independent
prognostic factor and are associated with significant elevation of
the Th2 cytokine interleukin-13. Cancer Immunol Immunother.
60:1419–1430. 2011. View Article : Google Scholar : PubMed/NCBI
|
|
32
|
Vetsika EK, Koinis F, Gioulbasani M,
Aggouraki D, Koutoulaki A, Skalidaki E, Mavroudis D, Georgoulias V
and Kotsakis A: A circulating subpopulation of monocytic
myeloid-derived suppressor cells as an independent
prognostic/predictive factor in untreated non-small lung cancer
patients. J Immunol Res. 2014:6592942014. View Article : Google Scholar : PubMed/NCBI
|
|
33
|
Shoji H, Tada K, Kitano S, Nishimura T,
Shimada Y, Nagashima K, Aoki K, Hiraoka N, Honma Y, Iwasa S, et al:
The peripheral immune status of granulocytic myeloid-derived
suppressor cells correlates the survival in advanced gastric cancer
patients receiving cisplatin-based chemotherapy. Oncotarget.
8:95083–95094. 2017. View Article : Google Scholar : PubMed/NCBI
|
|
34
|
Wesolowski R, Markowitz J and Carson WE
III: Myeloid derived suppressor cells - a new therapeutic target in
the treatment of cancer. J Immunother Cancer. 1:102013. View Article : Google Scholar : PubMed/NCBI
|
|
35
|
Zhou J, Liu M, Sun H, Feng Y, Xu L, Chan
AW, Tong JH, Wong J, Chong CC, Lai PB, et al: Hepatoma-intrinsic
CCRK inhibition diminishes myeloid-derived suppressor cell
immunosuppression and enhances immune-checkpoint blockade efficacy.
Gut. 67:931–944. 2018. View Article : Google Scholar : PubMed/NCBI
|
|
36
|
Sade-Feldman M, Kanterman J, Klieger Y,
Ish-Shalom E, Olga M, Saragovi A, Shtainberg H, Lotem M and
Baniyash M: Clinical significance of circulating
CD33+CD11b+HLA-DR− myeloid cells
in patients with stage IV melanoma treated with Ipilimumab. Clin
Cancer Res. 22:5661–5672. 2016. View Article : Google Scholar : PubMed/NCBI
|
|
37
|
Zhu C, Anderson AC, Schubart A, Xiong H,
Imitola J, Khoury SJ, Zheng XX, Strom TB and Kuchroo VK: The Tim-3
ligand galectin-9 negatively regulates T helper type 1 immunity.
Nat Immunol. 6:1245–1252. 2005. View
Article : Google Scholar : PubMed/NCBI
|
|
38
|
Gorman JV and Colgan JD: Regulation of T
cell responses by the receptor molecule Tim-3. Immunol Res.
59:56–65. 2014. View Article : Google Scholar : PubMed/NCBI
|
|
39
|
Yan J, Zhang Y, Zhang JP, Liang J, Li L
and Zheng L: Tim-3 expression defines regulatory T cells in human
tumors. PLoS One. 8:e580062013. View Article : Google Scholar : PubMed/NCBI
|
|
40
|
Arai Y, Saito H and Ikeguchi M:
Upregulation of TIM-3 and PD-1 on CD4+ and
CD8+ T cells associated with dysfunction of
cell-mediated immunity after colorectal cancer operation. Yonago
Acta Med. 55:1–9. 2012.PubMed/NCBI
|
|
41
|
Anderson AC: Tim-3, a negative regulator
of anti-tumor immunity. Curr Opin Immunol. 24:213–216. 2012.
View Article : Google Scholar : PubMed/NCBI
|
|
42
|
Ge W, Li J, Fan W, Xu D and Sun S: Tim-3
as a diagnostic and prognostic biomarker of osteosarcoma. Tumour
Biol. Jul 3–2017.(Epub ahead of print).
doi.org/10.1177/1010428317715643. View Article : Google Scholar
|
|
43
|
Zhuang X, Zhang X, Xia X, Zhang C, Liang
X, Gao L, Zhang X and Ma C: Ectopic expression of TIM-3 in lung
cancers: A potential independent prognostic factor for patients
with NSCLC. Am J Clin Pathol. 137:978–985. 2012. View Article : Google Scholar : PubMed/NCBI
|
|
44
|
Dorfman DM, Hornick JL, Shahsafaei A and
Freeman GJ: The phosphatidylserine receptors, T cell immunoglobulin
mucin proteins 3 and 4, are markers of histiocytic sarcoma and
other histiocytic and dendritic cell neoplasms. Hum Pathol.
41:1486–1494. 2010. View Article : Google Scholar : PubMed/NCBI
|
|
45
|
Yang ZZ, Grote DM, Ziesmer SC, Niki T,
Hirashima M, Novak AJ, Witzig TE and Ansell SM: IL-12 upregulates
TIM-3 expression and induces T cell exhaustion in patients with
follicular B cell non-Hodgkin lymphoma. J Clin Invest.
122:1271–1282. 2012. View Article : Google Scholar : PubMed/NCBI
|
|
46
|
Feng ZM and Guo SM: Tim-3 facilitates
osteosarcoma proliferation and metastasis through the NF-κB pathway
and epithelial-mesenchymal transition. Genet Mol Res. Sep
2–2016.(Epub ahead of print). doi: 10.4238/gmr.15037844. View Article : Google Scholar
|
|
47
|
Groh V, Wu J, Yee C and Spies T:
Tumour-derived soluble MIC ligands impair expression of NKG2D and
T-cell activation. Nature. 419:734–738. 2002. View Article : Google Scholar : PubMed/NCBI
|
|
48
|
Raulet DH, Gasser S, Gowen BG, Deng W and
Jung H: Regulation of ligands for the NKG2D activating receptor.
Annu Rev Immunol. 31:413–441. 2013. View Article : Google Scholar : PubMed/NCBI
|
|
49
|
Zafirova B, Wensveen FM, Gulin M and Polić
B: Regulation of immune cell function and differentiation by the
NKG2D receptor. Cell Mol Life Sci. 68:3519–3529. 2011. View Article : Google Scholar : PubMed/NCBI
|
|
50
|
Xu Y, Zhou L, Zong J, Ye Y, Chen G, Chen
Y, Liao X, Guo Q, Qiu S, Lin S, et al: Decreased expression of the
NKG2D ligand ULBP4 may be an indicator of poor prognosis in
patients with nasopharyngeal carcinoma. Oncotarget. 8:42007–42019.
2017. View Article : Google Scholar : PubMed/NCBI
|
|
51
|
Cho H, Chung JY, Kim S, Braunschweig T,
Kang TH, Kim J, Chung EJ, Hewitt SM and Kim JH: MICA/B and ULBP1
NKG2D ligands are independent predictors of good prognosis in
cervical cancer. BMC Cancer. 14:9572014. View Article : Google Scholar : PubMed/NCBI
|
|
52
|
Chen J, Xu H and Zhu XX: Abnormal
expression levels of sMICA and NKG2D are correlated with poor
prognosis in pancreatic cancer. Ther Clin Risk Manag. 12:11–18.
2015.PubMed/NCBI
|
|
53
|
Gabrilovich DI: Myeloid-derived suppressor
cells. Cancer Immunol Res. 5:3–8. 2017. View Article : Google Scholar : PubMed/NCBI
|
|
54
|
Tcyganov E, Mastio J, Chen E and
Gabrilovich DI: Plasticity of myeloid-derived suppressor cells in
cancer. Curr Opin Immunol. 51:76–82. 2018. View Article : Google Scholar : PubMed/NCBI
|
|
55
|
Kumar V, Patel S, Tcyganov E and
Gabrilovich DI: The nature of myeloid-derived suppressor cells in
the tumor microenvironment. Trends Immunol. 37:208–220. 2016.
View Article : Google Scholar : PubMed/NCBI
|