Introduction
GBM, a grade IV glioma according to the World Health
Organization (WHO) classification, is the most malignant primary
brain tumor with strong invasive potential and rapid recurrence
after surgery. Although aggressive treatment strategies have been
used to prolong overall survival (OS) in patients with GBM, the
median 5-year OS rate is <20% (1). With the development of molecular
biology techniques in recent years, high-throughput sequencing and
microarray techniques have been used to improve our understanding
of the molecular events in GBM (2).
A combination of histological and molecular characteristics of
glioma, including the presence of isocitrate dehydrogenase-1
(IDH-1) mutations and 1p/19q codeletion, are associated with GBM
according to the 2016 WHO classification (2). The identification of this combination
has improved the accuracy of glioma diagnosis, treatment and
prognostic evaluation (2). Based on
data from The Cancer Genome Atlas (TCGA) Research Network, GBM is
divided into four subtypes, mesenchymal, classical, neural and
proneural, with different cellular features and genetic contexts
(3). The molecular characterization
of glioma has improved patient stratification and provided insight
into novel strategies for treating GBM. However, exploring the
molecular events involved in GBM is still necessary for developing
a targeted therapy (4).
Vacuolar (V)-ATPase is a complex consisting of
multiple subunits that play roles in multiple biological processes
in mammalian cells, intracellular membrane-associated V-ATPase can
acidifies lysosomes, endosomes and secretory vesicles, and
influences numerous processes associated with these organelles,
including vesicular trafficking, endocytosis, autophagy, receptor
recycling and protein degradation (5). V-ATPase is comprised of two functional
domains: The peripheral V1 domain, which consists of
eight subunits (A-H) and is mainly responsible for ATP hydrolysis,
and the V0 domain, which consists of five subunits (a,
c, c', d and e) and is responsible for proton translocation. The
main function of V-ATPase is to transport protons into
intracellular compartments, promote the acidification of endosomes
and lysosomes and excrete intracellular protons into the
extracellular space, thus maintaining H+ homeostasis
(5). Multiple studies have
demonstrated that V-ATPase plays critical roles in several cancer
types, especially in tumor invasion and migration (5–10). For
example, V-ATPase is overexpressed at the plasma membrane of
invasive MB231 human breast cancer cells (7), and inhibiting V-ATPase using proton
pump inhibitors or small interfering RNAs can suppress cancer cell
line proliferation and metastasis in animal models (6,9,10). Overexpression of V-ATPase at the
plasma membrane of invasive cancer cells facilitates the activation
of proteinases under low pH conditions and further modifies
components of the extracellular matrix, such as matrix
metalloproteinases (8). An acidic pH
in the tumor microenvironment can induce VEGF expression and
recruit and polarize macrophages (11).
Subunit ‘a’ is comprised of four isoforms
(a1-a4) and is located at the V0
domain, which is responsible for the subcellular localization of
V-ATPase (5). The delivery of
V-ATPase specifically to the plasma membrane of breast cancer cells
relies on the overexpression of the V0a3
subunit, which is also known as T cell immune regulator 1 (TCIRG1).
TCIRG1 normally localizes to lysosomes in osteoclasts and
insulin-containing secretory vesicles in pancreatic β cells,
suggesting that distinct subunit compositions support
cancer-specific functions (5–7).
Overexpression of TCIRG1 has also been reported in hepatocellular
carcinoma, melanoma and breast cancer (7,9,10). The role of the V-ATPase a3
subunit in mouse cytotoxic T lymphocytes is responsible for the
acidification of cytotoxic granules and contributes to the
maturation and efficient transport of cytotoxic granules to the
immune synapse (12). However, the
expression profiles of TCIRG1 and its function in GBM prognosis, as
well as the underlying mechanisms, remain to be understood
(13,14). In the present study, data mining was
used to characterize the profiles of TCIRG1 expression in glioma
and other malignant tumors, and investigated the association
between TCIRG1 expression levels and OS in patients with different
GBM subtypes. Furthermore, the correlation between TCIRG1
expression and tumor-infiltrating immune cells in the environment
surrounding GBM was explored using the Tumor Immune Estimation
Resource (TIMER) and Gene Expression Profiling Interactive Analysis
(GEPIA). The study revealed the important function of TCIRG1 in GBM
and explained the potential relationship and mechanism of the
interaction between TCIRG1 and tumor immunity.
Materials and methods
Gene expression array and online tool
analysis
TCIRG1 mRNA expression in diverse cancer types was
evaluated with the Oncomine database (https://www.oncomine.org/resource/main.html) with
cut-off values for the probability and fold-change were 0.05 and
1.5, respectively. TCIRG1 mRNA expression data were further
analyzed using the TIMER database (https://cistrome.shinyapps.io/timer/) (15), which contains >10,000 samples from
32 different kinds of cancer from TCGA for estimating tumor purity
and the abundance of immune infiltrates, including B cells, CD4+ T
cells, CD8+ T cells, neutrophils, macrophages and dendritic cells
(DCs).
A gene expression array (AffyU133a) of TCGA-GBM was
obtained by using the University of California Santa Cruz Xena
browser (https://xenabrowser.net), which contains
529 GBM tissues and 10 non-tumor tissues. Gene expression
microarray data from the GSE16011 dataset [eight normal brain
tissues, 159 GBM tissues and 117 low-grade glioma (LGG) tissues]
(16) and RNA sequencing data (443
cases of LGG, 249 cases of GBM and one case without a defined WHO
grade) from Chinese Glioma Genome Atlas (CGGA) were downloaded
through the GlioVis portal (http://gliovis.bioinfo.cnio.es/) (17) and CGGA portal (http://www.cgga.org.cn/), respectively. The clinical
data included the demographic and survival data, IDH-1 status, GBM
subtypes (3), and chemotherapy and
radiation therapy information. GBM subtypes classification were
performed by Verhaak methods (3),
and the specificity and sensitivity of TCIRG1 expression with
mesenchymal subtype GBM were evaluated by receiver operating
characteristic (ROC) curves and the value of area under the curve
(AUC). Genes that showed a strong correlation (correlation |r|≥0.5)
with TCIRG1 in GBM samples from the TCGA-GBM and GSE16011 cohorts
were calculated using Pearson's coefficient analysis (18), data derived from the GlioVis portal
(17) and the R2: Genomics Analysis
and Visualization platform (http://r2.amc.nl).
GO category analysis was performed using the Database for
Annotation, Visualization and Integrated Discovery (DAVID) version
6.8 (https://david.ncifcrf.gov/) (19). The protein-protein interaction (PPI)
networks were constructed using the STRING online tool (version
11.0; http://string-bd.org/) (combined score
≥0.4 was used as the cut-off criterion) and further visualized
using Cytoscape software (version 3.7.1) (20). The connectivity degree value of each
node in the PPI network was calculated by the CytoHubba plugin, and
the module analyses of the PPI network were performed by the MCODE
plugin (node score cut-off=0.2; K-core=2; maximum depth=100; degree
cut-off=2), in which modules contained >20 nodes were regarded
as the key modules in the PPI network. The relationship between
TCIRG1 and immune cell infiltration in GBM was evaluated using the
TIMER database, and the immune and stromal scores were calculated
using Estimation of STromal and Immune Cells in MAlignant Tumor
Tissues using Expression data (ESTIMATE) (https://bioinformatics.mdanderson.org/estimate/)
(15,21), which is widely used to evaluate
immune scores and stromal scores in cancer (22–24). The
immune gene markers that were significantly correlated (Spearman's
correlation with P-value <0.05) with TCIRG1 expression in the
TIMER database were further identified using the Gene Expression
Profiling Interactive Analysis (GEPIA) online database (http://gepia.cancerpku.cn/index.html)
(25). External validation of TCIRG1
expression based on immune signatures in GBM was performed using
GSE16011 with the GlioVis online tool by Spearman's correlation
coefficient analysis (16,17).
Clinical sample preparation
Fourteen tumor resection and peritumoral samples
(fresh-frozen) were obtained from the Department of Neurosurgery of
the First Hospital of China Medical University (Shenyang, China)
from September 2018 to October 2019, including four samples of
peritumoral tissues as a control group, four samples of LGG and six
samples of GBM as a glioma group (patients age ranged from 40 to
65, median age 55, including six females and eight males). Tumor
classification was based on the WHO grade classification, and the
experiments were approved by The Ethics Committee of the First
Hospital of China Medical University (Shenyang, China).
Western blotting (WB) experiment
Total protein was extracted from the aforementioned
tissues using radioimmunoprecipitation buffer (Beyotime Institute
of Biotechnology) and determined the protein concentration using an
Enhanced BCA Protein Assay kit (Beyotime Institute of
Biotechnology). The proteins in per lane were 120 µg loaded onto
12% gels, resolved using SDS-PAGE and transferred to a
polyvinylidene fluoride membrane. After blocking in 5% bovine serum
albumin (Beijing Solarbio Science & Technology Co., Ltd.) for 2
h at room temperature, the membranes were incubated overnight at
4°C with primary antibodies against TCIRG1 (1:1,000; cat. no.
A15382; ABclonal Biotech Co., Ltd.) and GAPDH (1:4,000; cat. no.
AC027; ABclonal Biotech Co., Ltd.). The secondary antibody,
horseradish peroxidase-conjugated goat anti-rabbit IgG (1:10,000,
cat. no. AS0014; ABclonal Biotech Co., Ltd.), was then applied for
2 h at 37°C. GAPDH served as the internal control for all WB
experiments. Densitometry for WB was performed by ImageJ software
(version 18.0; National Institutes of Health) and GraphPad Prism 7
(GraphPad Software).
Statistical analysis
High and low expression groups in each dataset were
defined by TCIRG1 median expression value and the data were
presented as mean ± standard deviation. GraphPad Prism 7 (GraphPad
Software) was used to compare the differences in TCIRG1 expression
among different groups. Kaplan-Meier survival analysis using
log-rank tests were performed to compare the OS data between the
two cohorts. Column analysis was performed using GraphPad Prism 7
using unpaired t-tests (two groups) and one-way ANOVA with Tukey's
post hoc test. A multivariate Cox regression analysis was used to
evaluate the prognostic value of TCIRG1 for the OS of patients with
GBM using SPSS 21.0 (IBM Corp). Correlation analysis was performed
by Pearson's coefficient analysis or Spearman analysis. All
experiments were repeated three times. P<0.05 was considered to
indicate a statistically significant difference.
Results
TCIRG1 expression in glioma and other
types of cancer
Using the Oncomine database, the difference in
TCIRG1 mRNA expression in different tumors and adjacent normal
tissues was analyzed. TCIRG1 expression levels were increased in
bladder, brain and central nervous system, breast, cervical,
colorectal, esophageal, gastric, head and neck and kidney cancer,
leukemia, liver and lung cancer, lymphoma, melanoma, myeloma and
pancreatic cancer and sarcoma (P<0.05). In addition, in some
datasets, TCIRG1 expression in breast cancer, leukemia, lung
cancer, melanoma, pancreatic and prostate cancer and sarcoma was
lower compared with that in normal tissues (Fig. 1A).
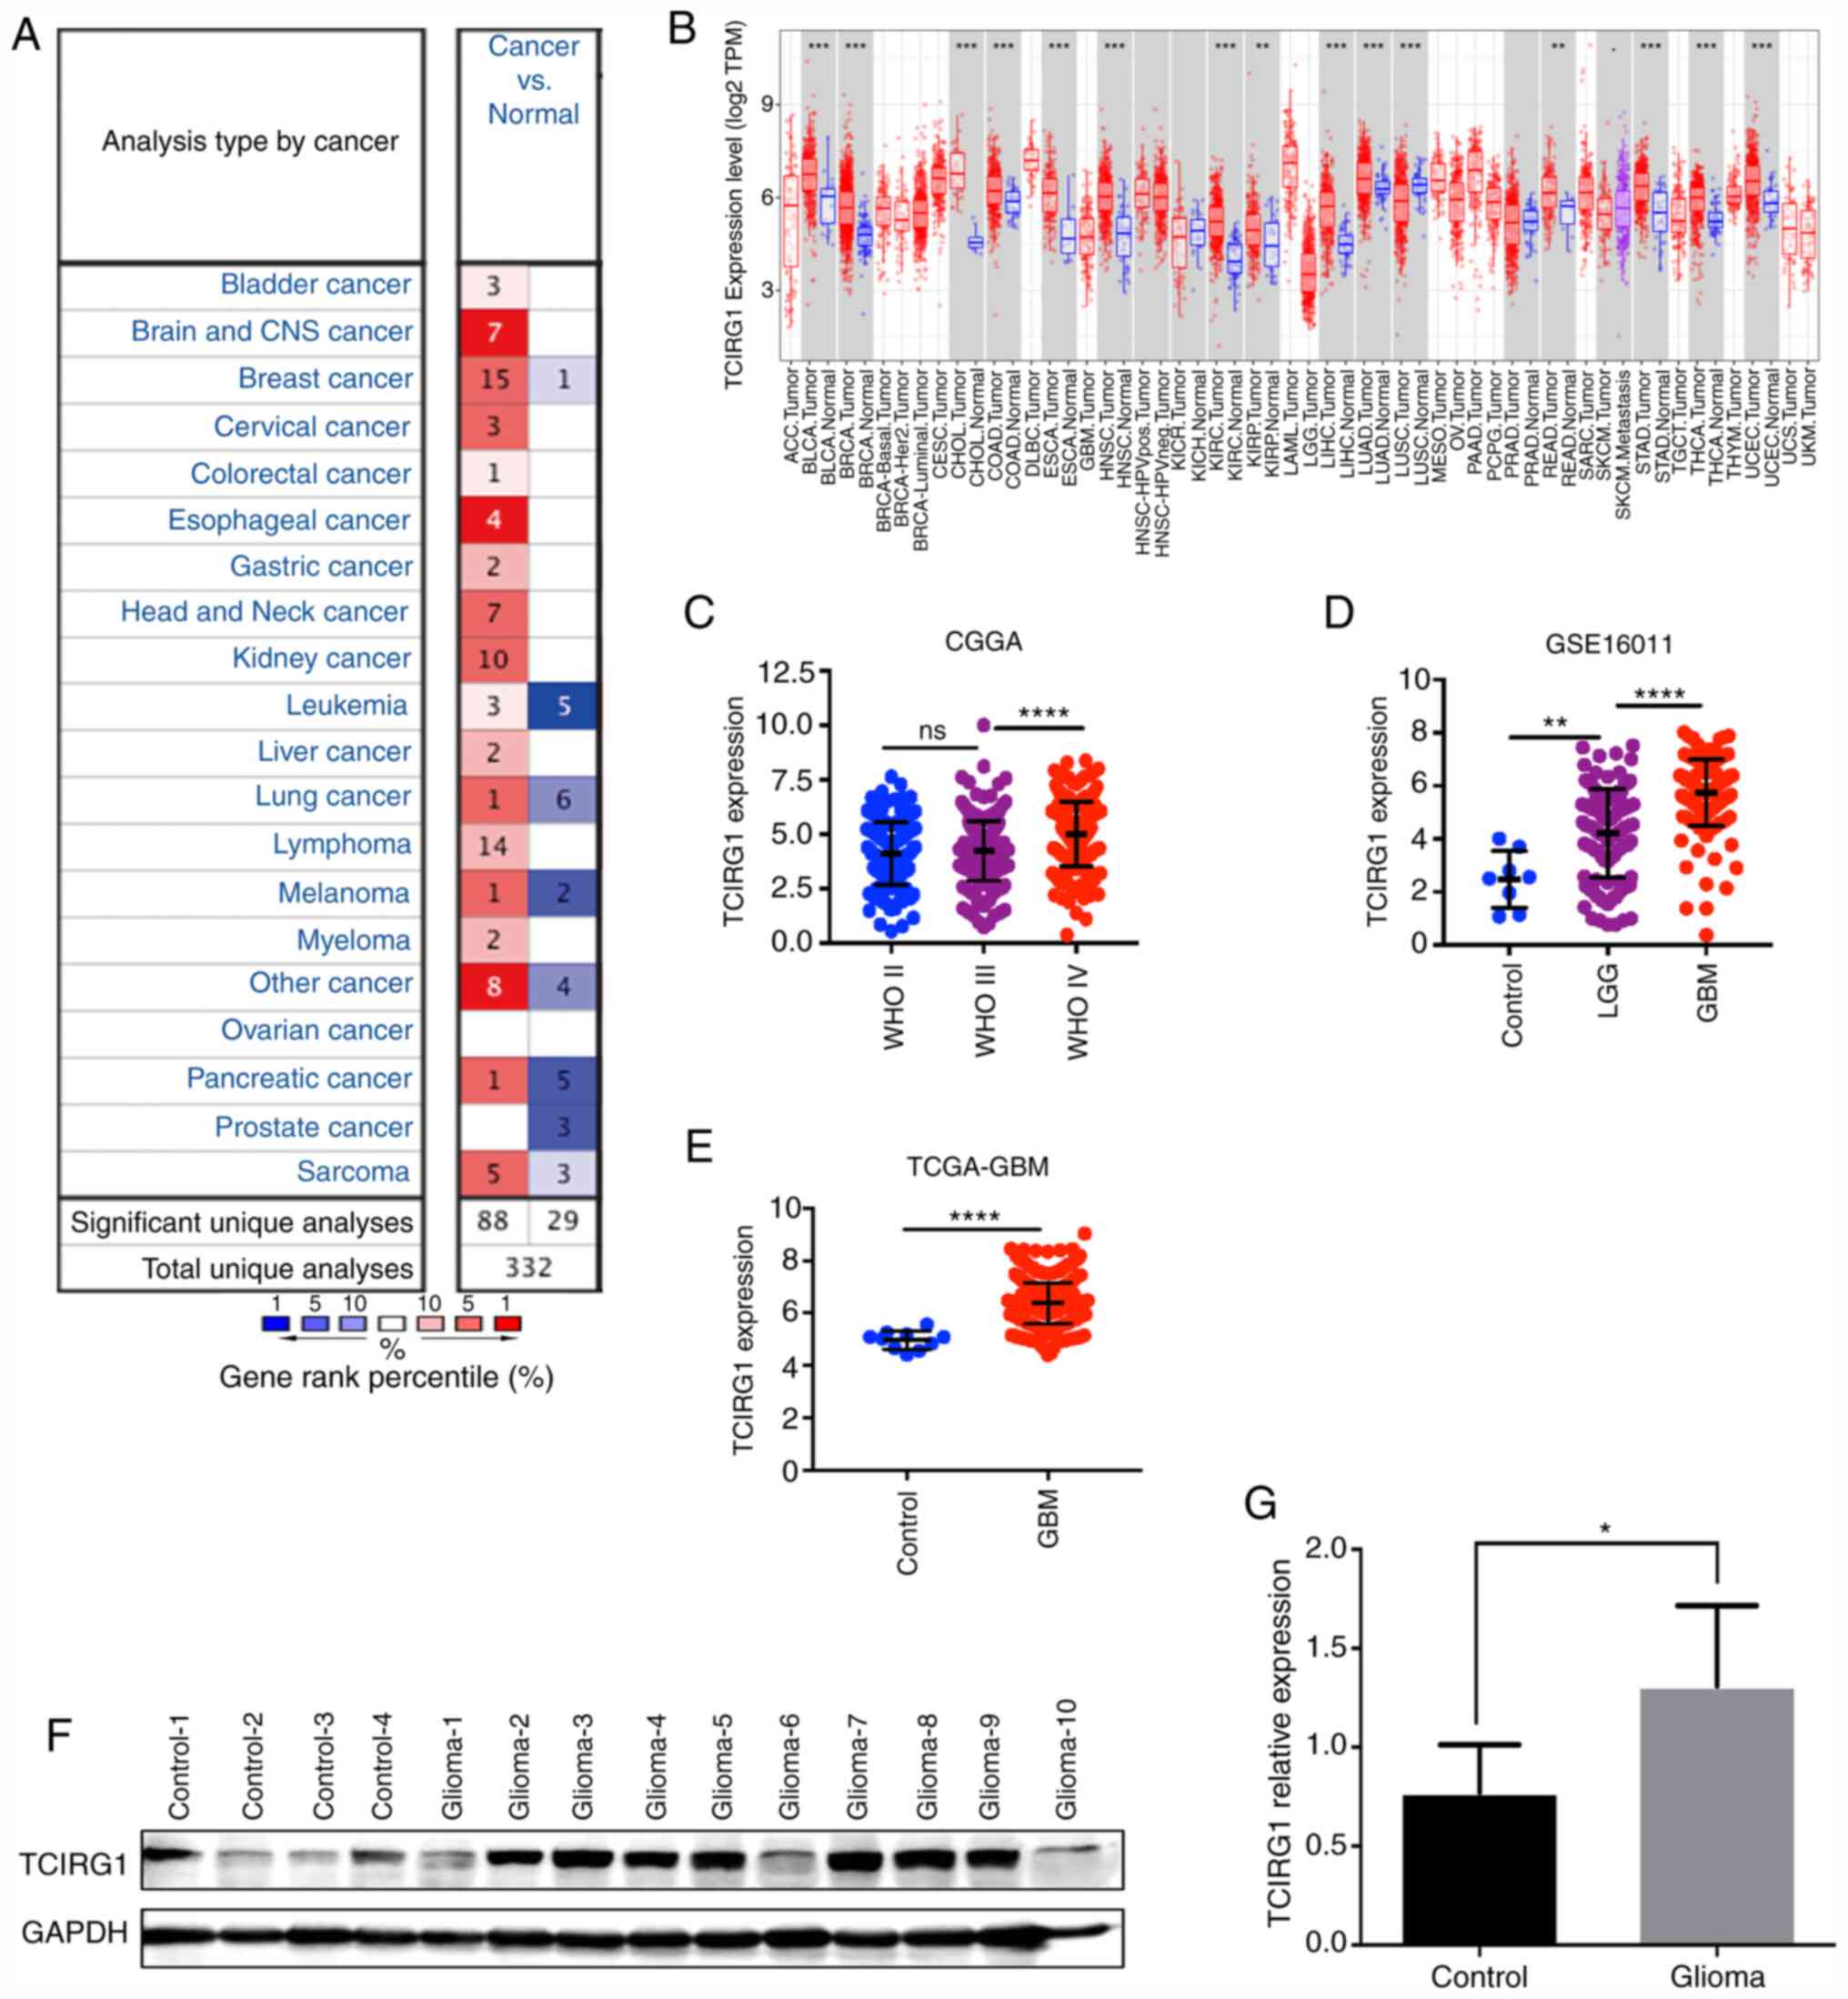 | Figure 1.TCIRG1 expression in different types
of cancer. (A) Expression levels of TCIRG1 in cancer and normal
tissues in the Oncomine database. (B) TCIRG1 expression data from
TCGA were compared using the TIMER database. Increased TCIRG1
expression was found in GBM according to data from (C) CGGA, (D)
GSE16011 and (E) TCGA-GBM. (F and G) Protein levels of TCIRG1 were
validated using western blot experiments, and increased expression
was found in the glioma group. ****P<0.0001 vs. WHO III or LGG,
**P<0.01 and *P<0.05 vs. respective control. TCIRG1, T cell
immune regulator 1; ns, no statistical significance; CGGA, Chinese
Glioma Genome Atlas; TCGA, The Cancer Genome Atlas, GBM,
glioblastoma; WHO, World Health Organization; TPM, transcripts per
million. |
To further evaluate TCIRG1 expression in different
human tumors, TCGA datasets were searched using the online tool
TIMER (15). The results showed that
TCIRG1 expression was higher in bladder cancer, breast cancer,
cholangiocarcinoma, colon adenocarcinoma, esophageal carcinoma,
head and neck cancer, kidney renal clear cell carcinoma, kidney
renal papillary cell carcinoma, liver hepatocellular carcinoma,
lung adenocarcinoma, rectum adenocarcinoma, stomach adenocarcinoma,
thyroid carcinoma and uterine corpus endometrial carcinoma tissues
compared with that in the corresponding normal tissues (Fig. 1B). However, low expression was found
in lung squamous cell carcinoma (Fig.
1B), which was similar to the results in Oncomine.
An analysis of the mRNA levels of TCIRG1 in gliomas
of different WHO grades showed that TCIRG1 expression was higher in
GBM tissues compared with that in LGG and normal brain tissues
(Fig. 1D and E). Through WB
experiments, it was demonstrated that TCIRG1 was also more highly
expressed in glioma tissues compared with that in control tissues
(Fig. 1F and G). These results
indicated that TCIRG1 expression could serve as a biomarker of
glioma malignancy.
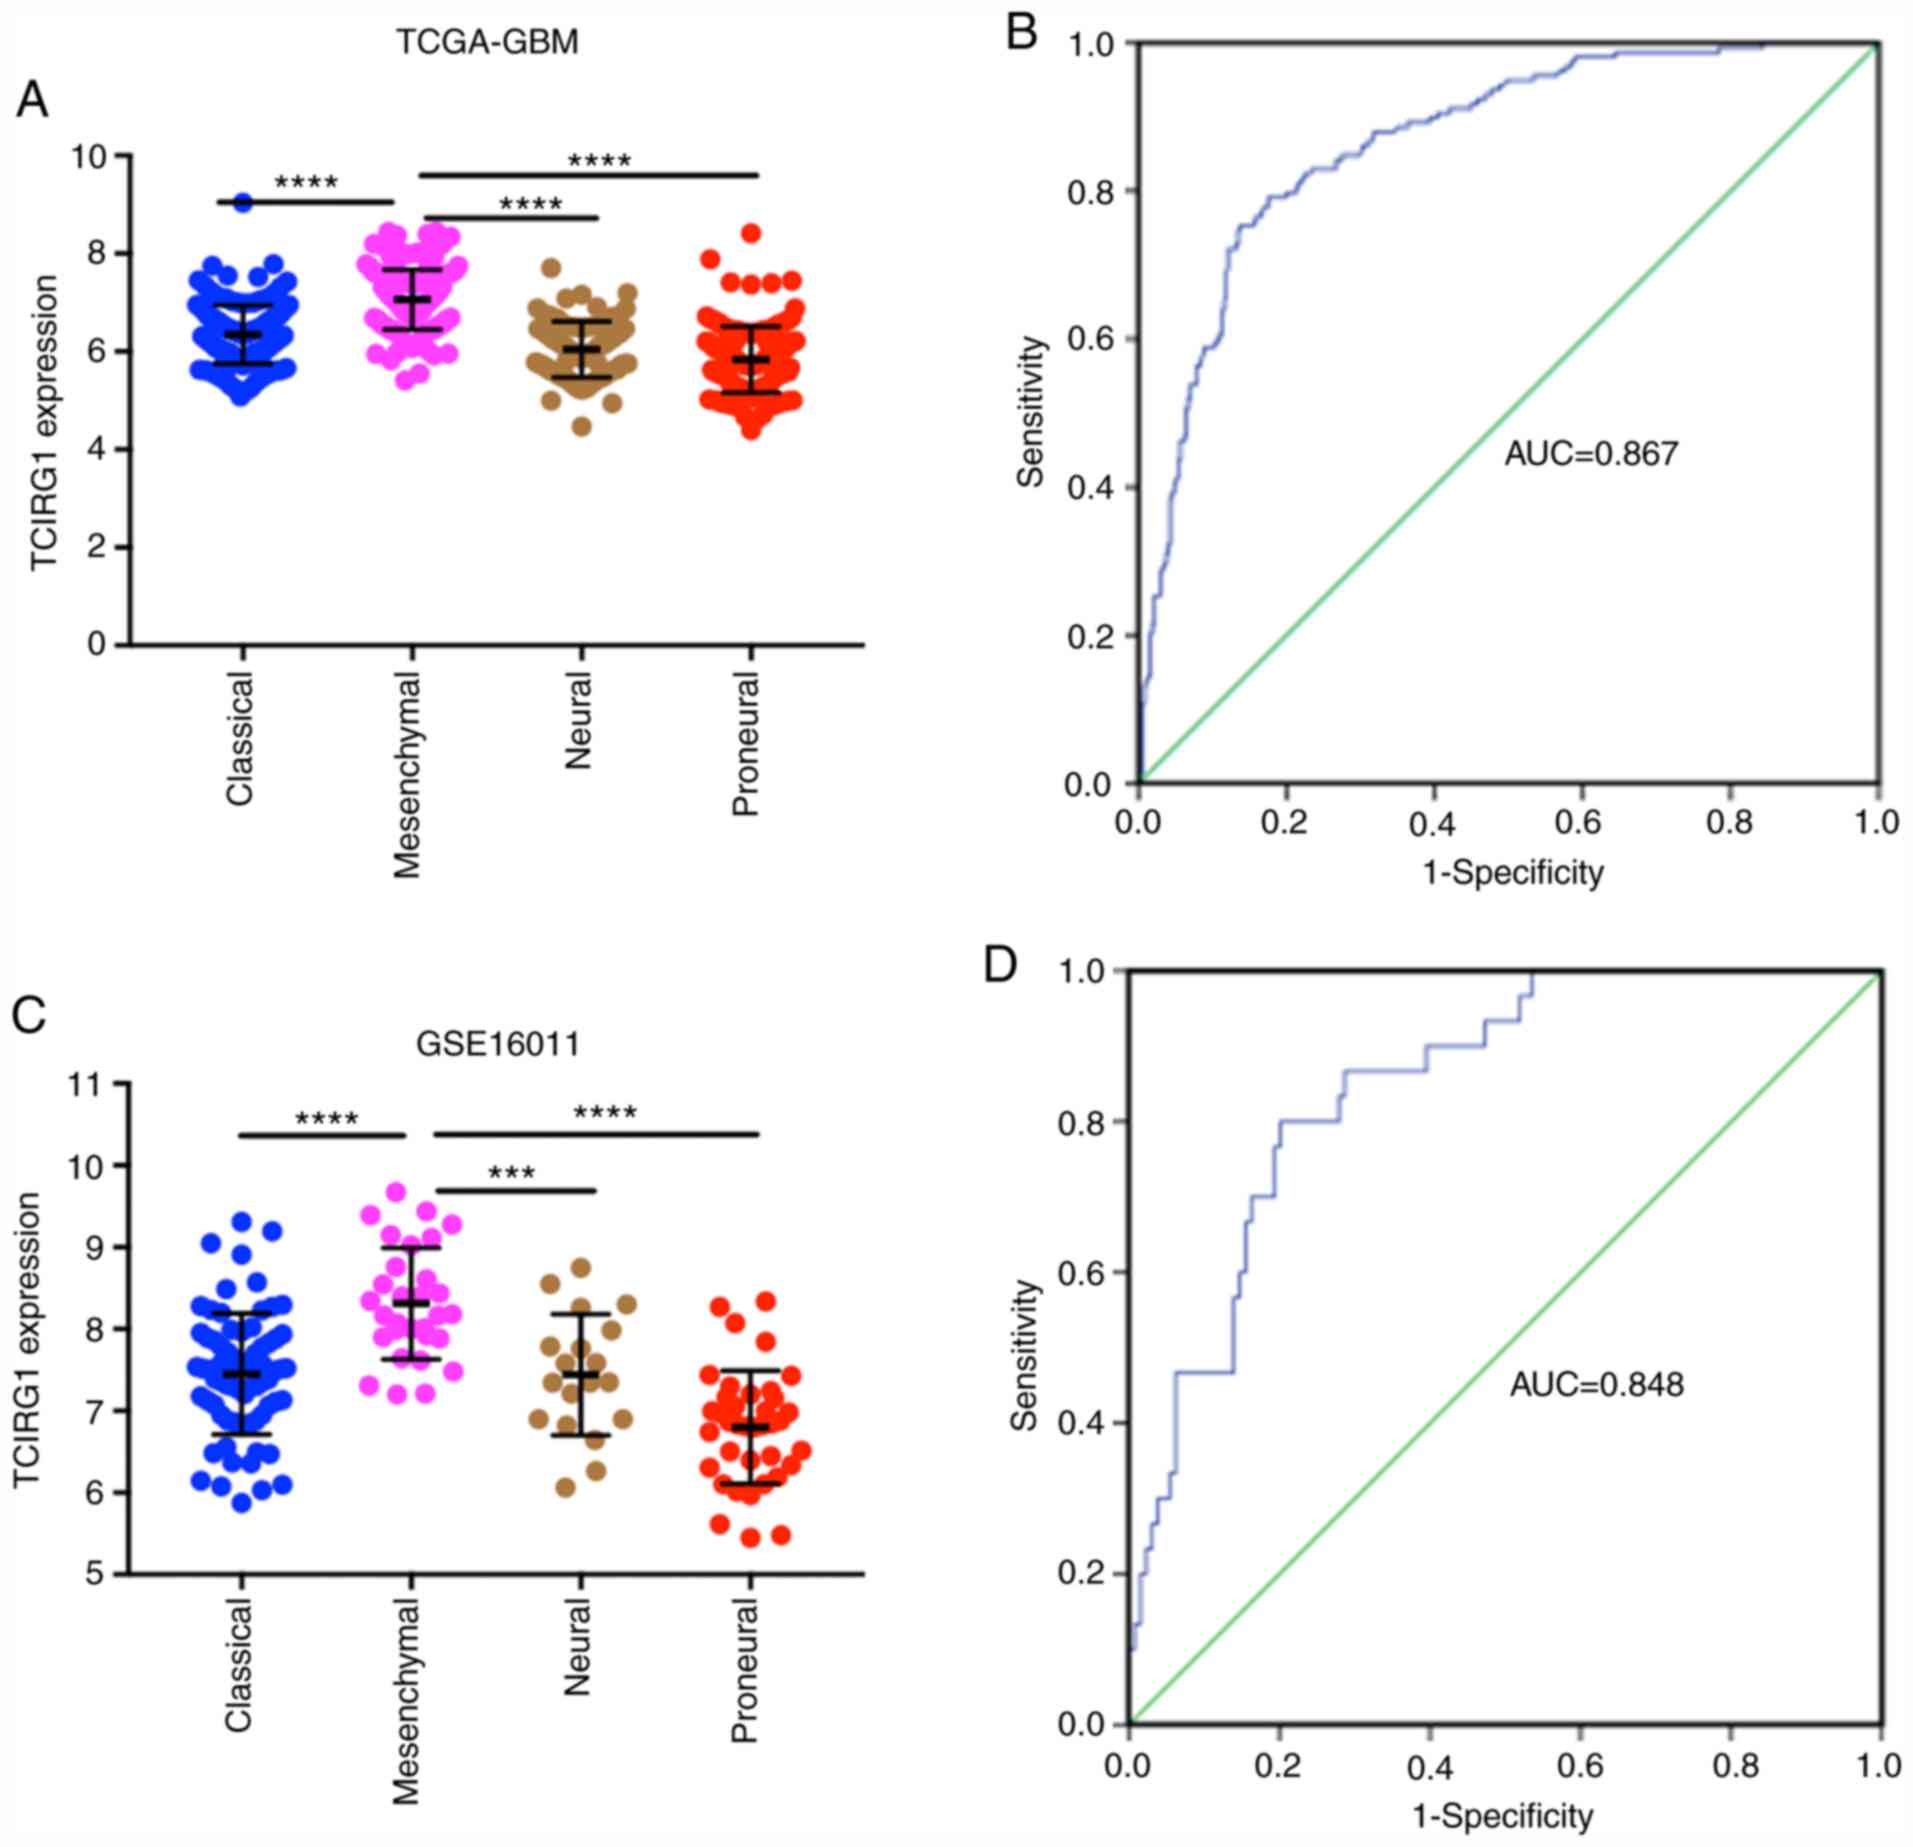
Increased TCIRG1 expression predicts a
mesenchymal subtype of GBM
To explore the expression profiles of TCIRG1 in
different subtypes of GBM, Verhaak classification methods were used
(3). In both the TCGA-GBM and
GSE16011 datasets, the highest TCIRG1 expression was observed in
the mesenchymal subtype, and the proneural subtype had the lowest
TCIRG1 expression (Fig. 2A and C).
Furthermore, TCIRG1 expression and mesenchymal subtype data were
used to generate ROC curves. In the TCGA-GBM cohort, the AUC was
0.867 (Fig. 2B). In the GSE16011
cohort, the AUC was 0.848 (Fig. 2D).
These results indicated that TCIRG1 expression might serve as an
indicator to predict the mesenchymal subtype of GBM.
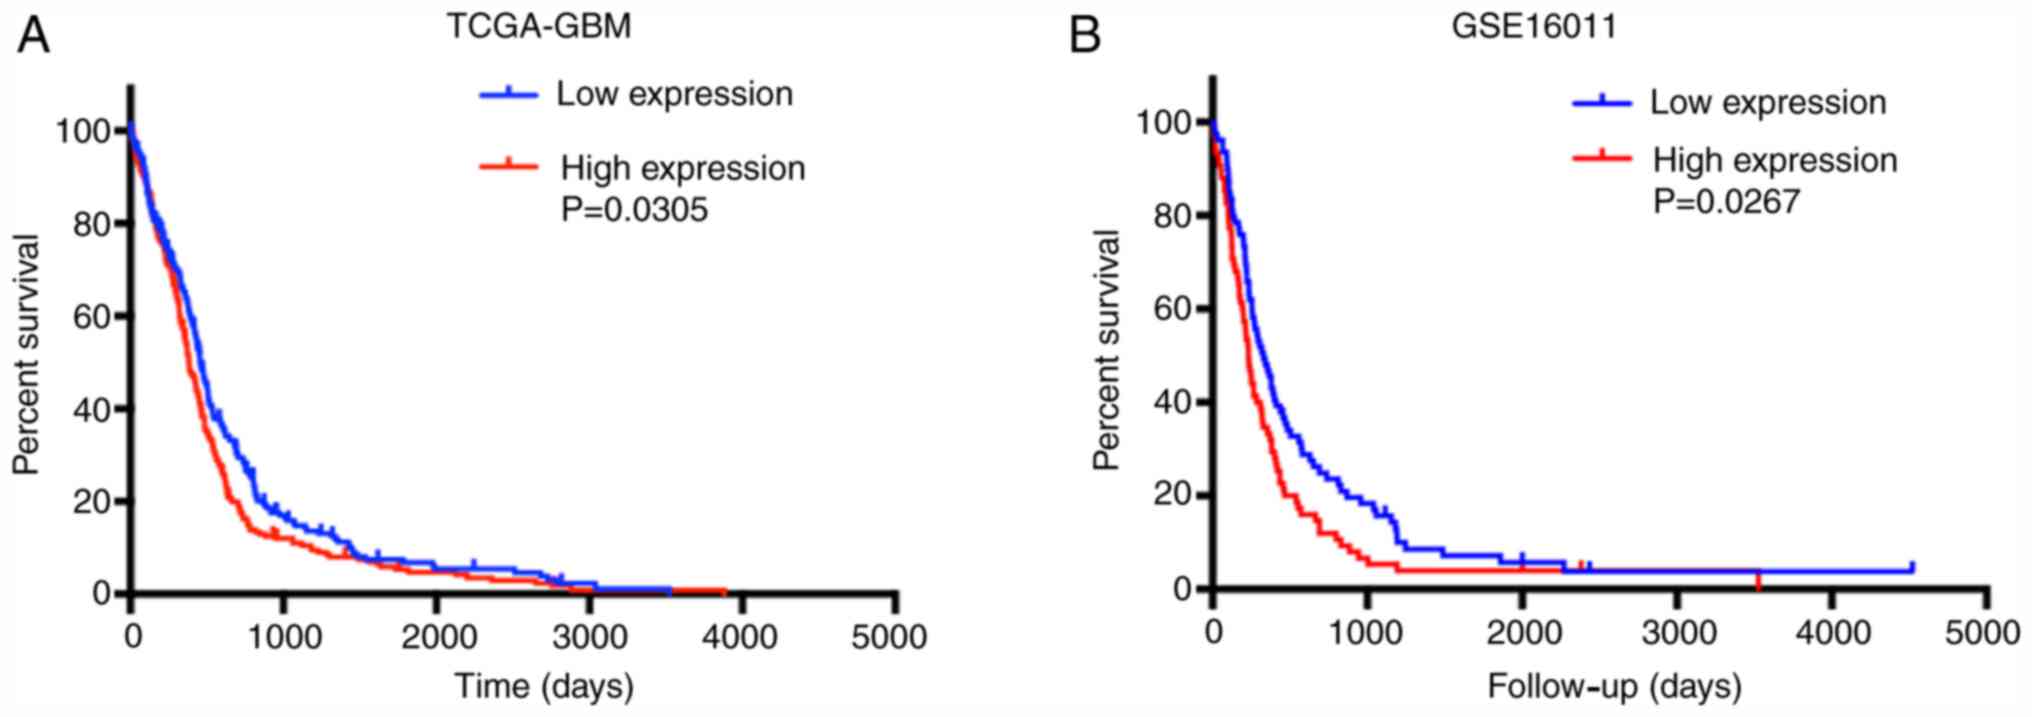
High TCIRG1 expression is associated
with poor OS in patients with GBM
The effect of TCIRG1 gene expression on the OS of
patients with GBM was further analyzed. In TCGA-GBM and GSE16011
datasets, high TCIRG1 expression predicted poor OS in GBM patients
(Fig. 3A and B). Multivariate Cox
regression analysis was then used to investigate the independent
role of TCIRG1 expression in the OS of patients with GBM. The
results showed that after adjusting for age, sex, IDH-1 status,
mesenchymal subtype, radiotherapy and chemotherapy, TCIRG1 still
affected the OS of patients with GBM (Table I). These results indicated that
TCIRG1 expression together with IDH-1 status, radiotherapy and
chemotherapy are risk factors for the poor prognosis in GBM.
 | Table I.Multivariate Cox regression analysis
in The Cancer Genome Atlas-Glioblastoma dataset. |
Table I.
Multivariate Cox regression analysis
in The Cancer Genome Atlas-Glioblastoma dataset.
|
| Univariate | Multivariate |
|---|
|
|
|
|
|---|
| Variables | HR | P-value | 95% CI | HR | P-value | 95% CI |
|---|
| TCIRG1
expression | 1.583 | 0.003 | 1.173 | 2.138 | 1.525 | 0.007 | 1.124 | 2.068 |
| Radiation
therapy | 5.521 | <0.001 | 3.719 | 8.197 | 3.853 | <0.001 | 2.486 | 5.972 |
| Chemotherapy | 2.916 | <0.001 | 2.308 | 4.173 | 1.907 | 0.002 | 1.274 | 2.854 |
| Mesenchymal
subtype | 1.267 | 0.146 | 0.921 | 1.743 |
|
|
|
|
| Sex | 0.884 | 0.450 | 0.643 | 1.216 |
|
|
|
|
| Age | 1.170 | 0.304 | 0.867 | 1.579 |
|
|
|
|
| IDH-1
expression | 3.685 | 0.004 | 1.511 | 8.991 | 2.761 | 0.027 | 1.124 | 6.781 |
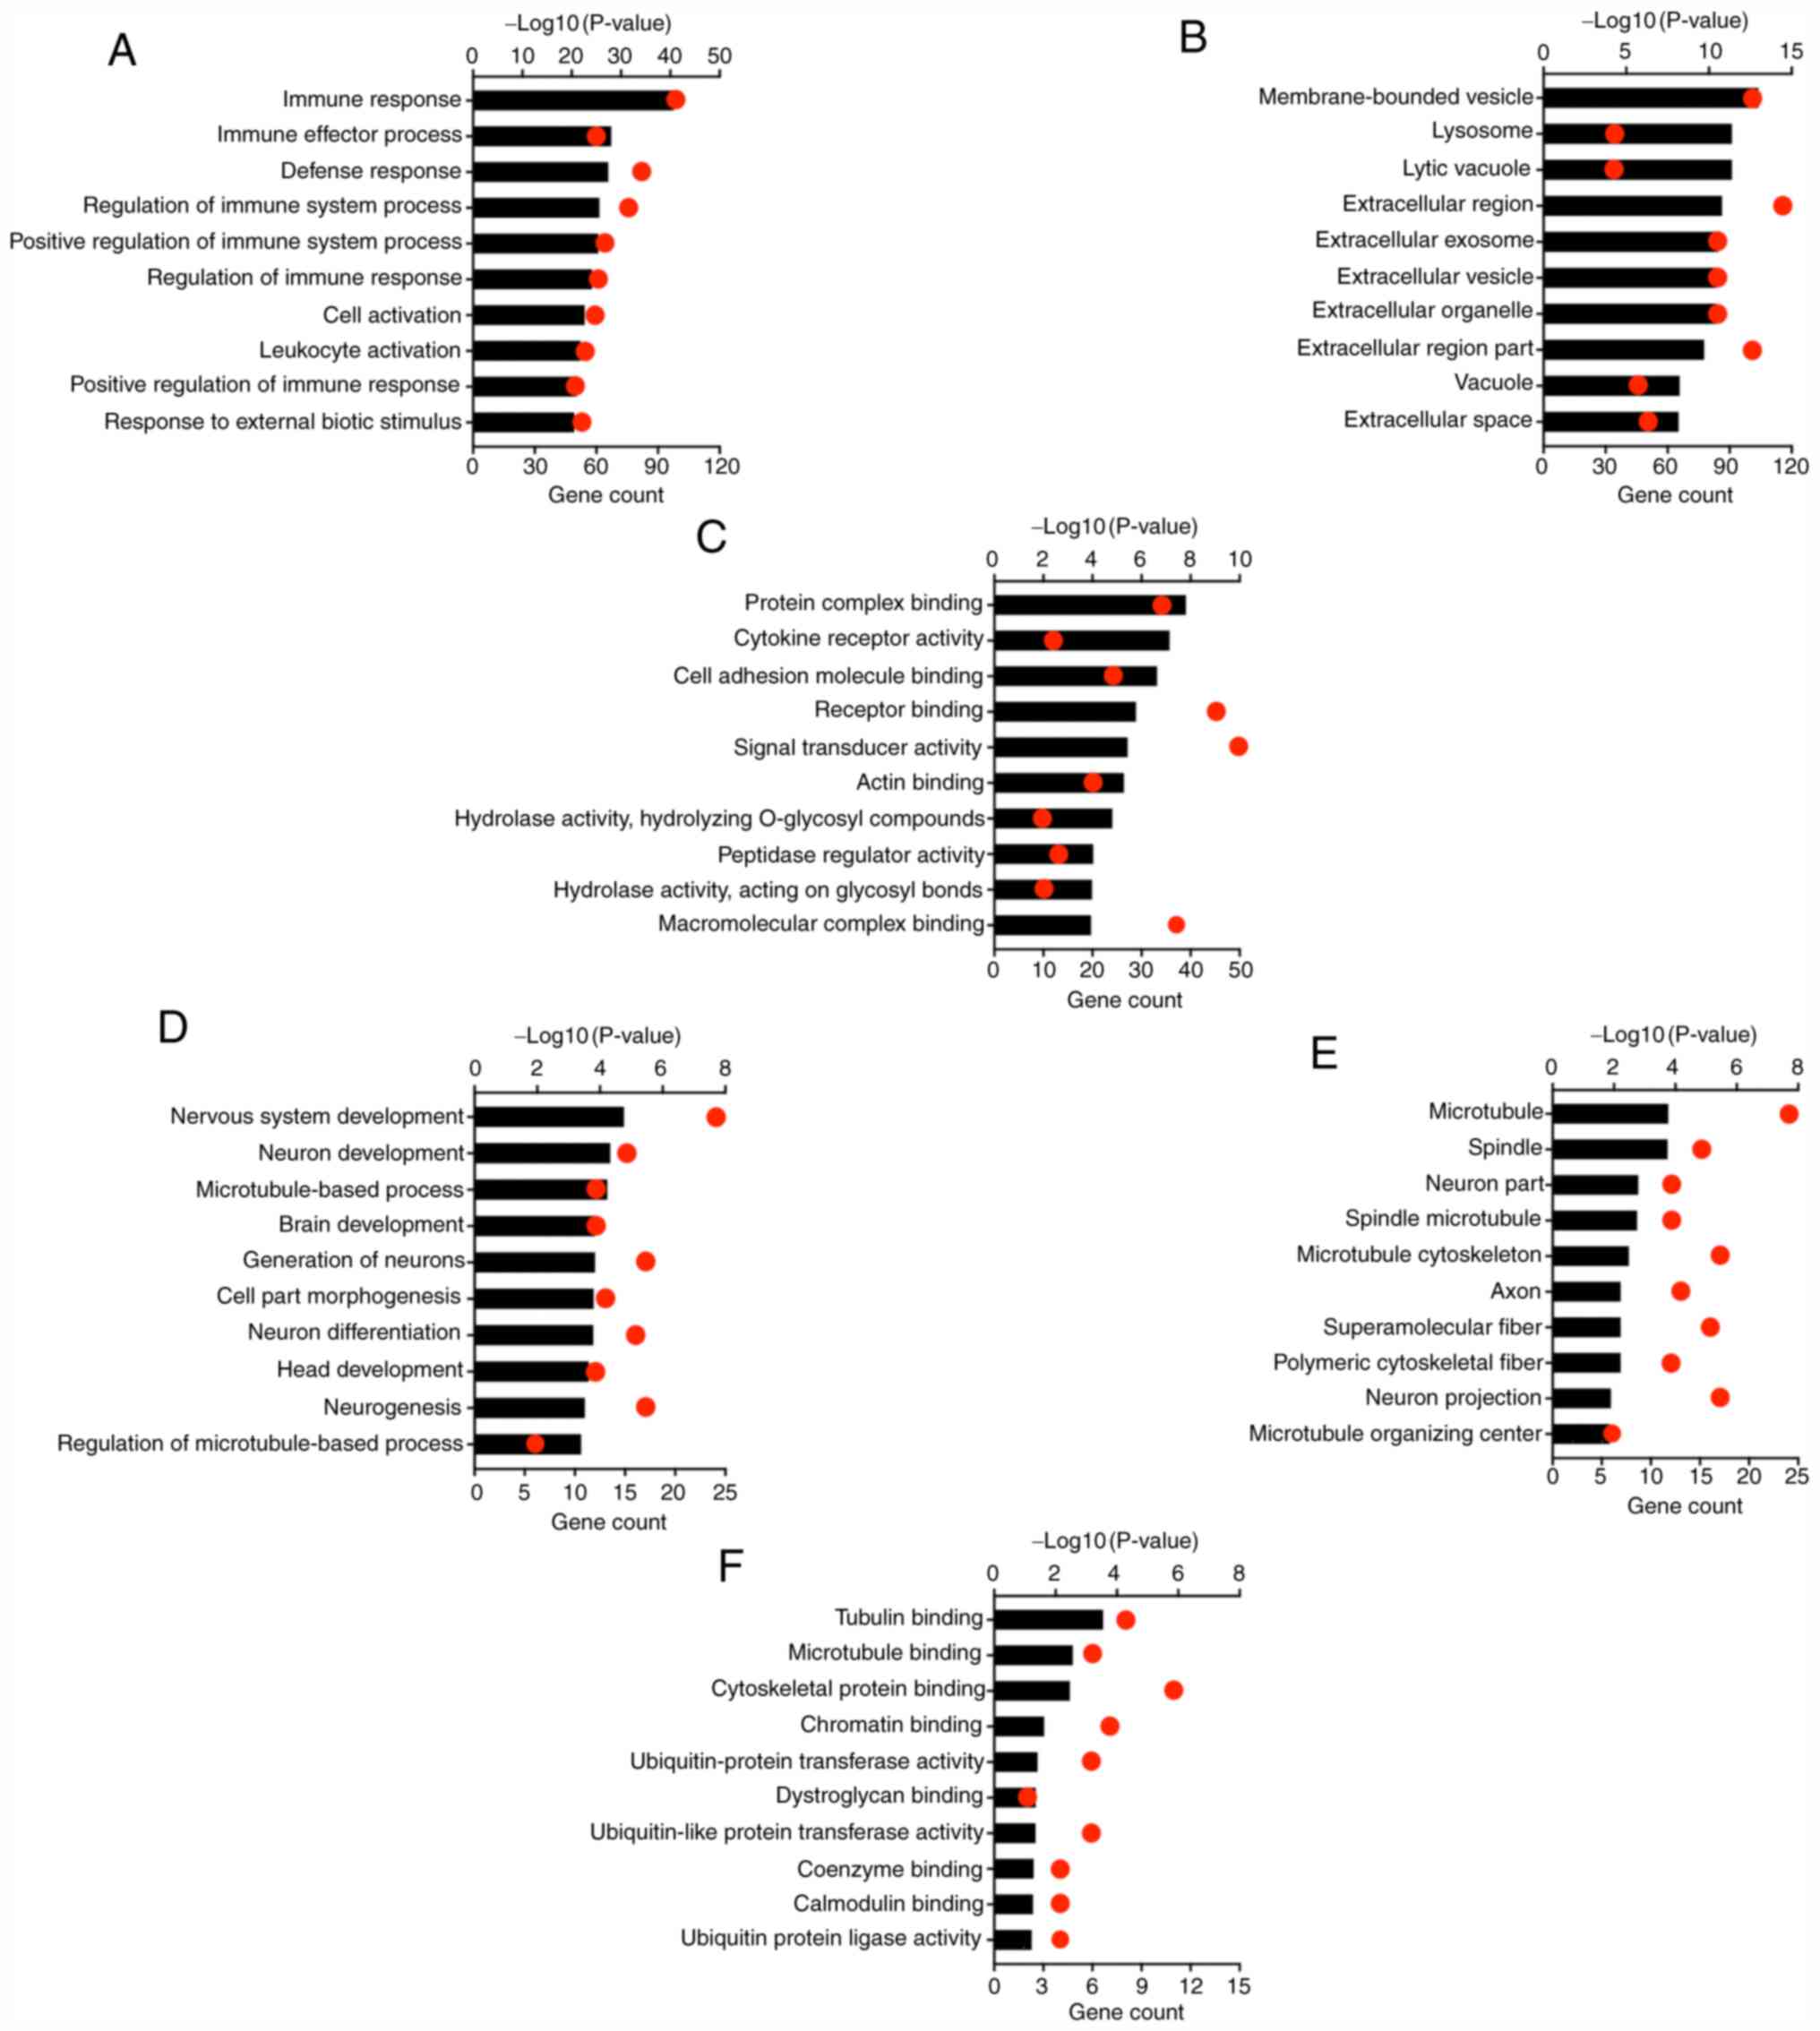
GO analysis of TCIRG1-correlated genes
in GBM
Pearson's correlation coefficient analysis was used
to identify genes that showed strong positive and negative
correlations (correlation ≥0.5) with TCIRG1 in the TCGA-GBM cohort
using the GlioVis portal (17). In
total, there were 244 genes with positive correlations and 76 genes
with negative correlations (Table
SI). Through the R2 platform, 217 genes were negatively
correlated and 716 genes were positively correlated with TCIRG1 in
GBM in the GSE16011 dataset (Table
SII). Then all correlated genes were uploaded to the DAVID
online tool to identify GO categories.
The top 10 items ranked according to the P-value for
the GO categories are presented in Fig.
4. Genes that were positively correlated with TCIRG1 were
mainly involved in the immune response. Regarding the biological
processes category, genes that showed positive correlations with
TCIRG1 were significantly enriched in the ‘immune response’,
‘immune effector process’, ‘defense response’, ‘regulation of the
immune system process’ and ‘positive regulation of the immune
system process’ (Fig. 4A). GO
cellular component analysis revealed that genes that showed
positive correlations with TCIRG1 were highly enriched in
‘membrane-bound vesicles’, ‘lysosomes’, ‘lytic vacuoles’,
‘extracellular region’ and ‘extracellular exosomes’ (Fig. 4B). GO molecular function analysis
indicated that genes that showed positive correlations with TCIRG1
were enriched in ‘protein complex binding’, ‘cytokine receptor
activity’, ‘cell adhesion molecule binding’, ‘receptor binding’ and
‘signal transducer activity’ (Fig.
4C). Moreover, genes that showed negative correlations were
mainly involved in physiological functions, such as ‘nervous system
development’ and ‘neuron development’ (Fig. 4D). For cellular component and
molecular function, negative correlation genes were mainly enriched
in microtuble, spindle, tubulin and microtubule binding (Fig. 4E and F). Similarly, GO category
analyses of GSE16011 showed consistent results with the results for
TCGA-GBM (Fig. S1). These results
indicated that TCIRG1 mainly plays important roles in the host
immune system in GBM.
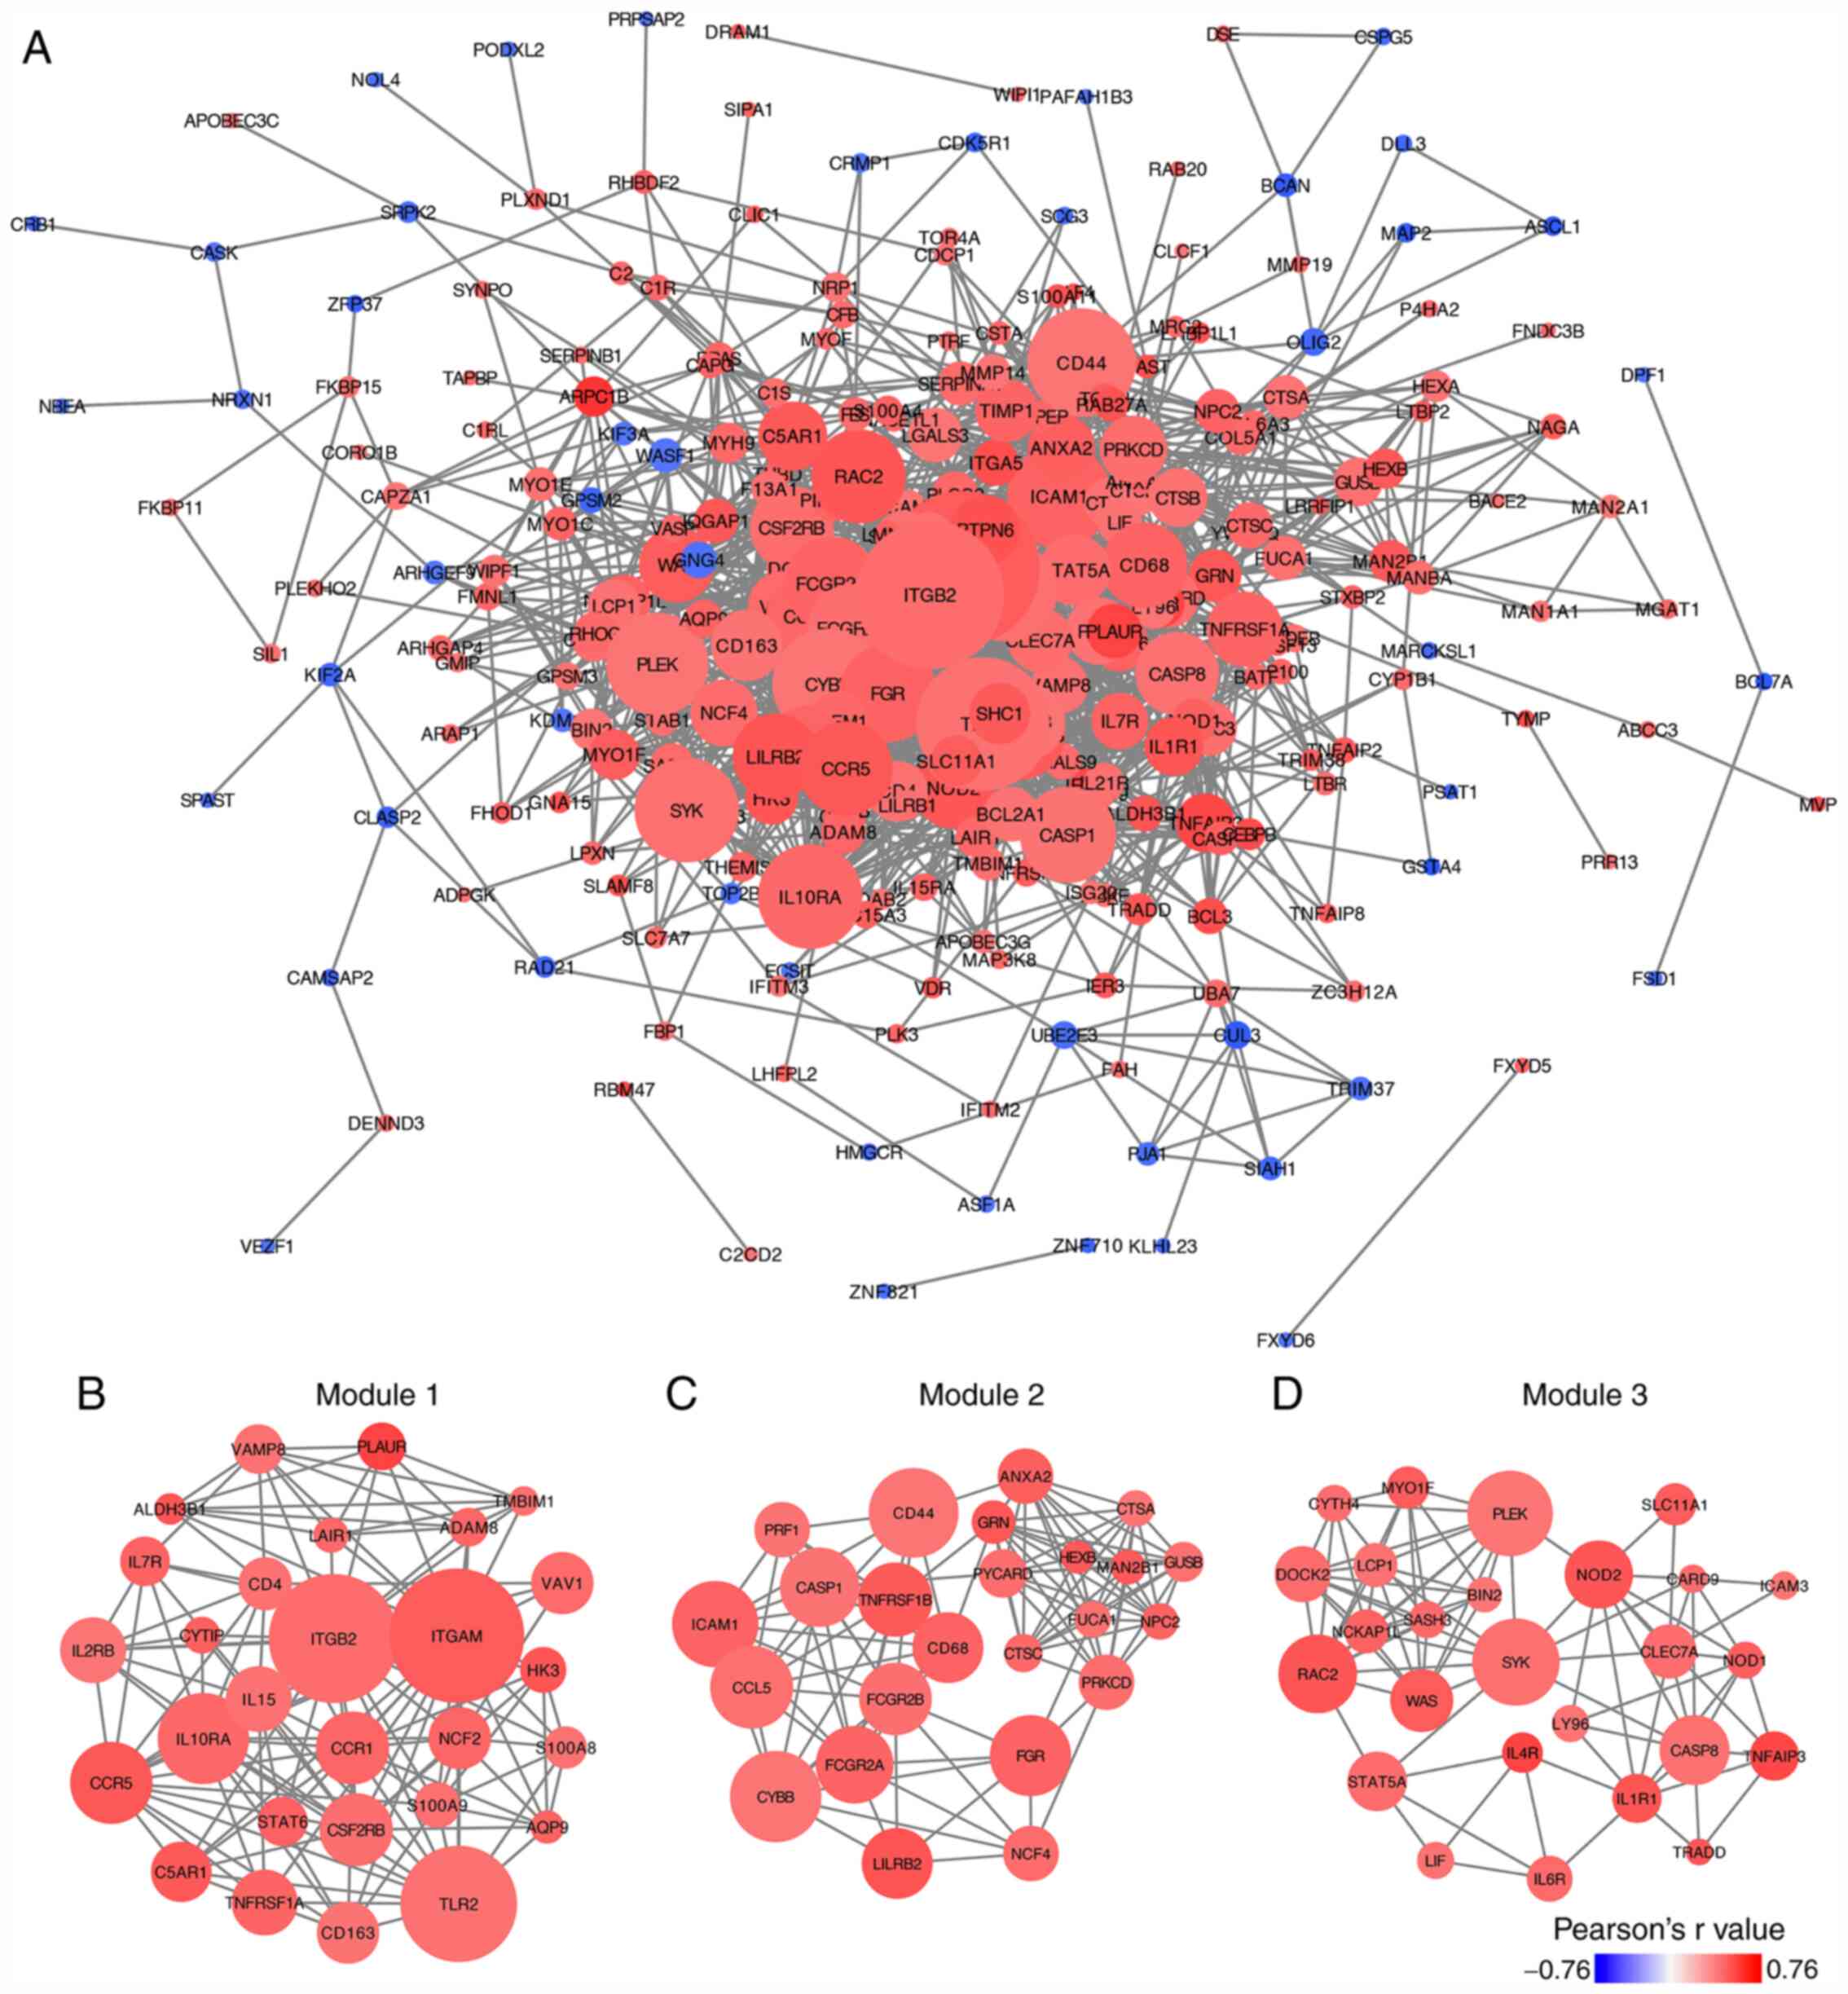
PPI network construction and module
analyses of TCIRG1-associated genes
The correlated genes acquired from TCGA-GBM were
used to create a PPI network. A total of 272 nodes and 1,584 edges
were generated from the PPI network (Fig. 5A). The connectivity degree value of
each node in the PPI network was calculated using the CytoHubba
plugin (Table SIII). The genes in
the PPI network with top 10 degree value were integrin subunit αM
(ITGAM), integrin subunit β2 (ITGB2), toll-like receptor 2 (TLR2),
cytochrome b-245 β chain (CYBB), CD44 molecule (CD44),
intracellular adhesion molecule 1 (ICAM1), interleukin 10 receptor
subunit α (IL10RA), spleen-associated tyrosine kinase (SYK),
pleckstrin (PLEK) and C-C motif chemokine ligand 5 (CCL5). The
MCODE plugin was used to select significant modules in the PPI
network, and three modules were selected as the key modules in the
PPI network (Fig. 5B-D). GO
biological process analyses of these key modules were performed,
and the top 10 items ranked by P-value are listed in Table II, which suggested that genes in the
key modules were significantly associated with the immune
response.
| Table II.GO biological process of key modules
in the protein-protein interaction network. |
Table II.
GO biological process of key modules
in the protein-protein interaction network.
| A, Module 1 |
|---|
|
|---|
| Term | Gene count | P-value |
|---|
| GO:0006955~immune
response | 19 |
5.26×10⁻¹³ |
| GO:0006952~defense
response | 16 |
1.41×10⁻⁹ |
|
GO:0006954~inflammatory response | 12 |
1.76×10⁻⁹ |
|
GO:0031347~regulation of defense
response | 12 |
3.28×10⁻⁹ |
| GO:0032103~positive
regulation of response to external stimulus | 9 |
6.72×10⁻⁹ |
| GO:0031349~positive
regulation of defense response | 10 |
8.13×10⁻⁹ |
|
GO:0030595~leukocyte chemotaxis | 8 |
1.91×10⁻⁸ |
| GO:0050729~positive
regulation of inflammatory response | 7 |
2.78×10⁻⁸ |
| GO:0070887~cellular
response to chemical stimulus | 18 |
4.29×10⁻⁸ |
| GO:0007166~cell
surface receptor signaling pathway | 18 |
4.84×10⁻⁸ |
|
| B, Module
2 |
|
| Term | Gene
count | P-value |
|
| GO:0006955~immune
response | 14 |
8.44×10⁻⁹ |
| GO:0051707~response
to other organism | 10 |
4.98×10⁻⁷ |
| GO:0043207~response
to external biotic stimulus | 10 |
4.98×10⁻⁷ |
| GO:0009607~response
to biotic stimulus | 10 |
7.70×10⁻⁷ |
| GO:0009617~response
to bacterium | 8 |
4.25×10⁻⁶ |
| GO:0006952~defense
response | 11 |
8.94×10⁻⁶ |
| GO:0009605~response
to external stimulus | 12 |
2.05×10⁻⁵ |
| GO:0032496~response
to lipopolysaccharide | 6 |
3.88×10⁻⁵ |
| GO:0071222~cellular
response to lipopolysaccharide | 5 |
3.97×10⁻⁵ |
|
GO:0071219~c10llular response to molecule
of bacterial origin | 5 |
4.64×10⁻⁵ |
|
| C, Module
3 |
|
| Term | Gene
count | P-value |
|
| GO:0002684~positive
regulation of immune system process | 18 |
1.73×10⁻¹⁶ |
| GO:0006955~immune
response | 20 |
6.16×10⁻¹⁶ |
|
GO:0002682~regulation of immune system
process | 19 |
2.53×10⁻¹⁵ |
| GO:0048584~positive
regulation of response to stimulus | 20 |
9.26×10⁻¹⁴ |
| GO:0050778~positive
regulation of immune response | 14 |
1.40×10⁻¹² |
|
GO:0050776~regulation of immune
response | 15 |
2.33×10⁻¹² |
| GO:0016337~single
organismal cell-cell adhesion | 14 |
2.92×10⁻¹² |
| GO:0002252~immune
effector process | 14 |
3.91×10⁻¹² |
| GO:0098602~single
organism cell adhesion | 14 |
7.22×10⁻¹² |
| GO:0070489~T cell
aggregation | 12 |
8.22×10⁻¹² |
TCIRG1 expression is associated with
the level of immune cell infiltration in GBM
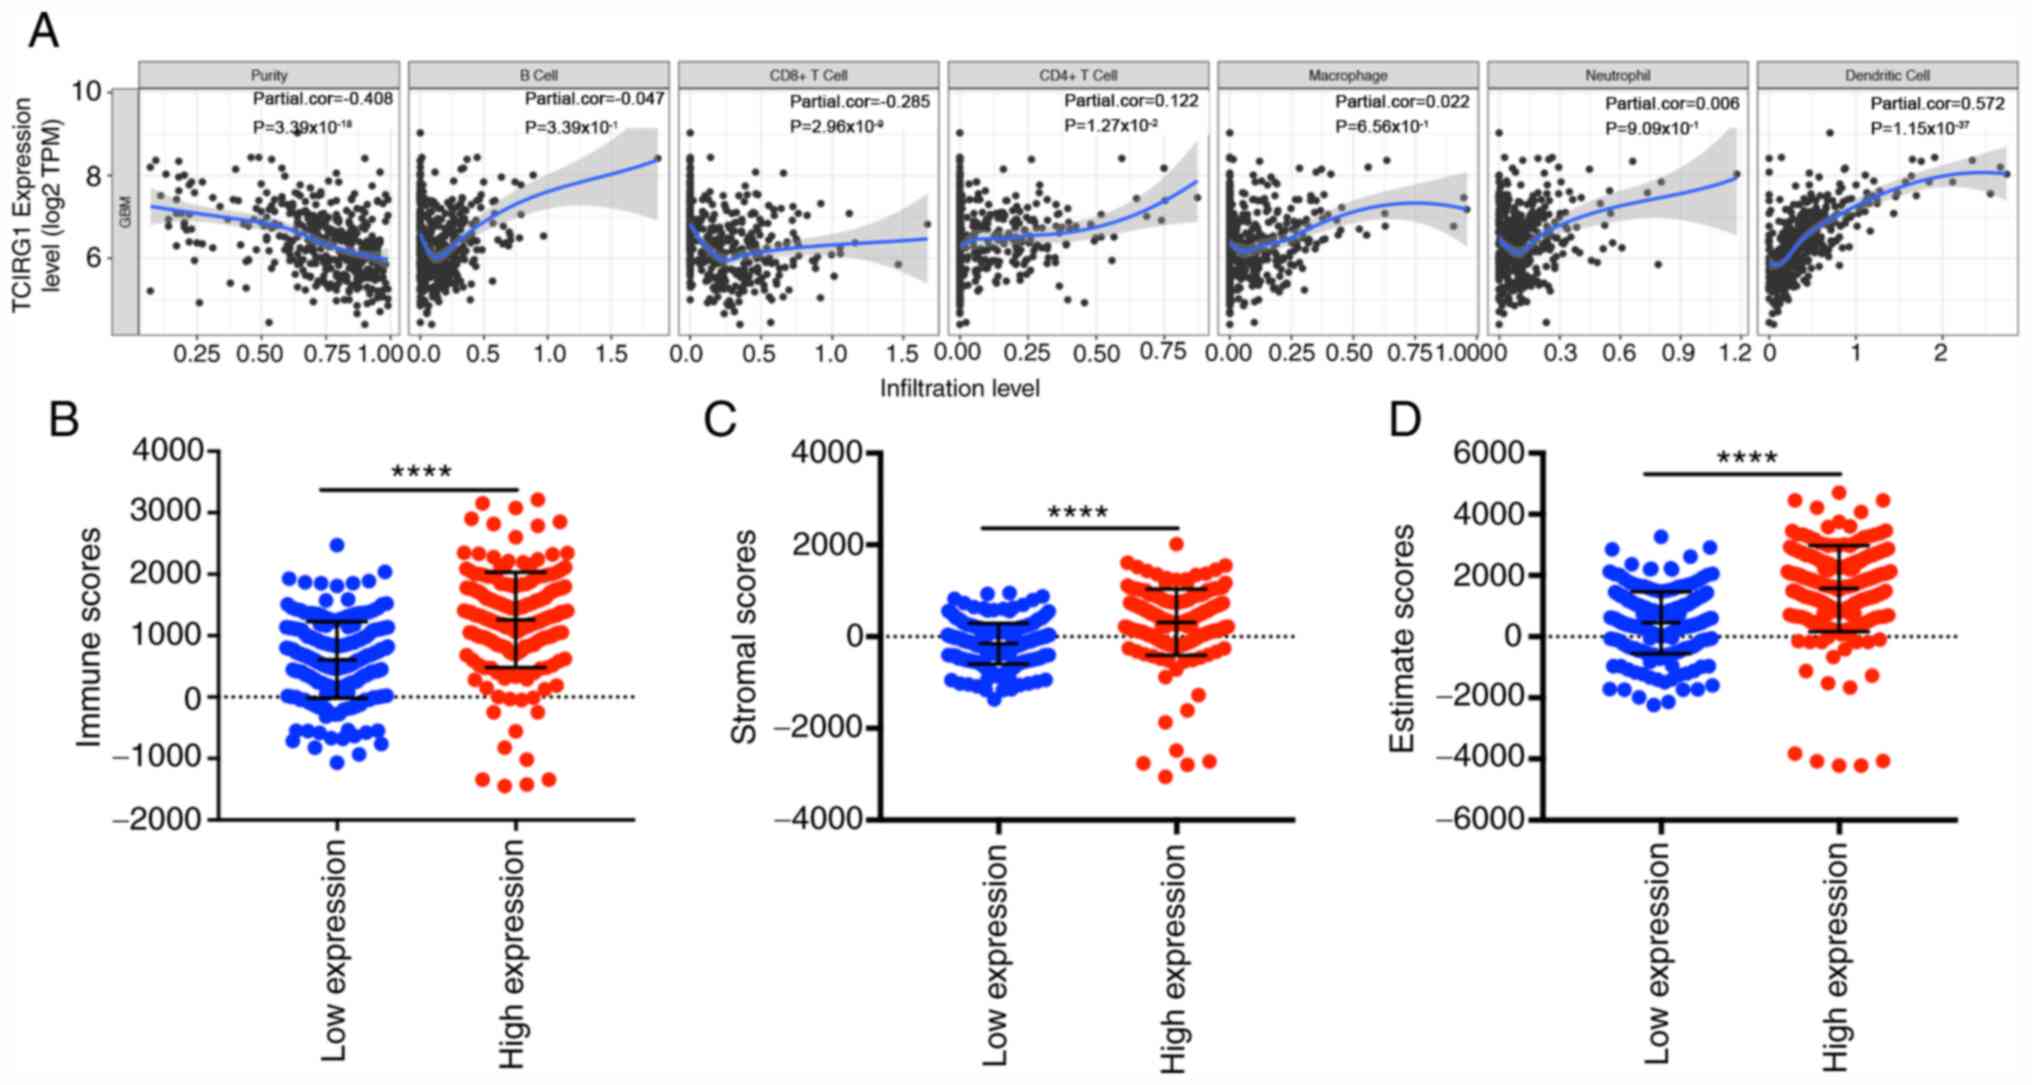
Tumor purity and infiltrating lymphocytes are
important predictors of prognosis in patients with glioma (26). Therefore, whether TCIRG1 expression
was correlated with immune infiltration levels in GBM was
investigated. The correlations among TCIRG1 expression and the
levels of immune infiltration were determined according to data
from the TIMER database (15). The
results showed that TCIRG1 expression was negatively correlated
with tumor purity (coefficient=−0.408, P=3.39×10⁻¹⁸) and
weakly significantly corelated with CD8+ T cell infiltration
(coefficient=−0.285, P=2.96×10⁻⁹) but positively
correlated with the CD4+ T cell (coefficient=0.122, P=0.0127) and
dendritic cell infiltration levels (coefficient=0.572,
P=1.15×10−37) (Fig. 6A).
The correlation coefficients between TCIRG1 expression and CD8+ T
cells (coefficient=−0.285) and CD4+ T cells (coefficient=0.122)
infiltration were weak. No statistical significance was found for B
cells, macrophages or neutrophils. Although some correlation
coefficients were small, the results still indicated that the
TCIRG1 expression level is a potentially valuable factor for the
immune infiltration of GBM, particularly that of CD4+ T cells and
dendritic cells. Immune and stromal scores calculated by the
ESTIMATE algorithm in GBM can predict distinct molecular subtypes
and overall survival (22), and the
relationship between the immune and stromal scores and TCIRG1
expression was further investigated. The results indicated that
there was a significant difference in immune and stromal scores of
patients with GBM with high TCIRG1 compared with low TCIRG1
expression (Fig. 6B-D). These
results showed the potentially important role of TCIRG1 expression
in the local immune response in GBM.
Association between TCIRG1 expression
and distinct immune markers
To clarify the TCIRG1-related immunological
processes in GBM and their association with several types of
infiltrating immune cells, a list of immune markers, including CD8+
T, T and B cells, monocytes, tumor-associated macrophages (TAMs),
M1/M2 macrophages, neutrophils, natural killer cells and DCs, were
selected from the TIMER and GEPIA datasets (15,25). The
roles of T cells with different functions as described by previous
studies (27–29) were also examined, such as T helper
(h)1, Th2, T follicular (f)h, Th17, T regulatory (reg) and
exhausted T cells. Based on TIMER, after adjustment for tumor
purity, the TCIRG1 expression level was significantly correlated
with gene markers of tumor-associated macrophage (CD68,
coefficient=0.573, P=2.4×10⁻¹³), neutrophil (ITGAM,
coefficient=0.692, P=7.76×10⁻²¹), th2 (STAT6, coefficient=0.602,
P=7.40×10⁻¹⁵; STAT5A, coefficient=0.561,
P=1.01×10⁻¹²) and T regulatory cell (TGFB1,
coefficient=0.548, P=4.28×10⁻¹²). in total, 36
positively correlated genes (P<0.05) of 57 immune cell gene
markers were identified in GBM (Table
III).
| Table III.Correlation analysis of TCIRG1
expression with related gene markers in TIMER database. |
Table III.
Correlation analysis of TCIRG1
expression with related gene markers in TIMER database.
| A, CD8+ T cell |
|---|
|
|---|
|
| None | Purity |
|---|
|
|
|
|
|---|
| Gene markers | Cor | P-value | Cor | P-value |
|---|
| CD8A | 0.18 |
3.05×10−02 | 0.09 |
3.00×10⁻¹ |
| CD8B | 0.15 |
6.49×10−02 | 0.03 |
6.96×10⁻¹ |
|
| B, T
cell |
|
|
| None | Purity |
|
|
|
|
| Gene
markers | Cor | P-value | Cor | P-value |
|
| CD3D | 0.23 |
3.62×10−03 | 0.07 |
4.49×10⁻¹ |
| CD3E | 0.40 |
2.95×10−07 | 0.32 |
1.66×10⁻⁴ |
| CD2 | 0.31 |
1.10×10−04 | 0.17 |
4.43×10⁻² |
|
| C, B
cell |
|
|
| None | Purity |
|
|
|
|
| Gene
markers | Cor | P-value | Cor | P-value |
|
| CD19 | 0.18 |
2.53×10−02 | 0.16 |
6.70×10⁻² |
| CD79A | 0.11 |
1.62×10−01 | 0.07 |
4.30×10⁻¹ |
|
| D,
Monocyte |
|
|
| None | Purity |
|
|
|
|
| Gene
markers | Cor | P-value | Cor | P-value |
|
| CD86 | 0.41 |
2.67×10−07 | 0.31 |
1.83×10⁻⁴ |
| CSF1R | 0.53 | 0.00×10° | 0.47 |
9.20×10⁻⁹ |
|
| E,
Tumor-associated macrophage |
|
|
| None | Purity |
|
|
|
|
| Gene
markers | Cor | P-value | Cor | P-value |
|
| CCL2 | 0.37 |
3.37×10−06 | 0.24 |
4.81×10⁻³ |
| CD68 | 0.61 | 0.00×10° | 0.57 |
2.40×10⁻¹³ |
| IL10 | 0.33 |
2.68×10−05 | 0.21 |
1.28×10⁻² |
|
| F, M1
macrophage |
|
|
| None | Purity |
|
|
|
|
| Gene
markers | Cor | P-value | Cor | P-value |
|
| NOS2 | 0.09 |
2.71×10−01 | 0.13 |
1.39×10⁻¹ |
| IRF5 | 0.52 | 0.00×10° | 0.43 |
1.19×10⁻⁷ |
| PTGS2 | 0.39 |
8.71×10−07 | 0.30 |
3.53×10⁻⁴ |
|
| G, M2
macrophage |
|
|
| None | Purity |
|
|
|
|
| Gene
markers | Cor | P-value | Cor | P-value |
|
| CD163 | 0.52 | 0.00×10° | 0.45 |
4.39×10⁻⁸ |
| VSIG4 | 0.43 |
5.81×10−08 | 0.35 |
2.60×10⁻⁵ |
| MS4A4A | 0.38 |
1.38×10−06 | 0.29 |
5.68×10⁻⁴ |
|
| H,
Neutrophil |
|
|
| None | Purity |
|
|
|
|
| Gene
markers | Cor | P-value | Cor | P-value |
|
| CEACAM8 | 0.08 |
3.33×10−01 | 0.01 |
4.15×10⁻¹ |
| ITGAM | 0.70 | 0.00×10° | 0.69 |
7.76×10⁻²¹ |
| CCR7 | 0.36 |
7.49×10−06 | 0.28 |
1.17×10⁻³ |
|
| I, Natural
killer cell |
|
|
| None | Purity |
|
|
|
|
| Gene
markers | Cor | P-value | Cor | P-value |
|
| KIR2DL1 | 0.13 |
1.16×10−01 | 0.11 |
2.12×10⁻¹ |
| KIR2DL3 | 0.12 |
1.42×10−01 | 0.06 |
5.01×10⁻¹ |
| KIR2DL4 | 0.30 |
1.83×10−04 | 0.28 |
8.84×10⁻⁴ |
| KIR3DL1 | 0.13 |
9.79×10−02 | 0.13 |
1.27×10⁻¹ |
| KIR3DL2 | 0.10 |
2.36×10−01 | 0.10 |
2.34×10⁻¹ |
| KIR3DL3 | 0.19 |
1.73×10−02 | 0.19 |
2.30×10⁻² |
| KIR2DS4 | 0.21 |
9.45×10−03 | 0.17 |
4.51×10⁻² |
|
| J, Dendritic
cell |
|
|
| None | Purity |
|
|
|
|
| Gene
markers | Cor | P-value | Cor | P-value |
|
| HLA-DPB1 | 0.42 |
8.08×10−08 | 0.34 |
5.74×10⁻⁵ |
| HLA-DQB1 | 0.22 |
5.50×10−03 | 0.16 |
6.99×10⁻² |
| HLA-DRA | 0.33 |
4.18×10−05 | 0.20 |
1.89×10⁻² |
| HLA-DPA1 | 0.35 |
1.00×10−05 | 0.28 |
1.07×10⁻³ |
| CD1C | 0.14 |
7.59×10−02 | −0.02 |
8.37×10⁻¹ |
| NRP1 | 0.55 | 0.00×10° | 0.52 |
9.65×10⁻¹¹ |
| ITGAX | 0.54 | 0.00×10° | 0.49 |
1.19×10⁻⁹ |
|
| K, T helper
1 |
|
|
| None | Purity |
|
|
|
|
| Gene
markers | Cor | P-value | Cor | P-value |
|
| TBX21 | 0.13 |
1.14×10−01 | 0.16 |
5.98×10⁻² |
| STAT4 | 0.24 |
2.55×10−03 | 0.15 |
8.08×10⁻² |
| STAT1 | 0.18 |
2.56×10−02 | 0.24 |
5.40×10⁻³ |
| IFNG | 0.13 |
1.04×10−01 | 0.09 |
3.12×10⁻¹ |
| TNF | 0.20 |
1.50×10−02 | 0.08 |
3.41×10⁻¹ |
|
| L, T helper
2 |
|
|
| None | Purity |
|
|
|
|
| Gene
markers | Cor | P-value | Cor | P-value |
|
| GATA3 | 0.40 |
3.30×10−07 | 0.38 |
3.88×10⁻⁶ |
| STAT6 | 0.67 | 0.00×10° | 0.60 |
7.40×10⁻¹⁵ |
| STAT5A | 0.61 | 0.00×10° | 0.56 |
1.01×10⁻¹² |
| IL13 | −0.02 |
8.01×10−01 | 0.04 |
6.10×10⁻¹ |
|
| M, T follicular
helper |
|
|
| None | Purity |
|
|
|
|
| Gene
markers | Cor | P-value | Cor | P-value |
|
| BCL6 | 0.28 |
3.86×10−04 | 0.29 |
6.30×10⁻⁴ |
| IL21 | −0.12 |
1.29×10−01 | −0.15 |
9.07×10⁻² |
|
| N, T helper
17 |
|
|
| None | Purity |
|
|
|
|
| Gene
markers | Cor | P-value | Cor | P-value |
|
| STAT3 | 0.33 |
4.30×10−05 | 0.37 |
7.78×10⁻⁶ |
| IL17A | −0.01 |
9.54×10−01 | −0.05 |
6.02×10⁻¹ |
|
| O, T regulatory
cell |
|
|
| None | Purity |
|
|
|
|
| Gene
markers | Cor | P-value | Cor | P-value |
|
| FOXP3 | 0.49 |
1.62×10⁻¹⁰ | 0.48 |
4.51×10⁻⁹ |
| CCR8 | 0.34 |
2.01×10−05 | 0.27 |
1.54×10⁻³ |
| STAT5B | 0.03 |
6.85×10−01 | 0.15 |
6.90×10⁻² |
| TGFB1 | 0.62 | 0.00×10° | 0.55 |
4.28×10⁻¹² |
|
| P, T cell
exhaustion |
|
|
| None | Purity |
|
|
|
|
| Gene
markers | Cor | P-value | Cor | P-value |
|
| PDCD1 | 0.35 |
8.12×10−06 | 0.32 |
1.49×10⁻⁴ |
| CTLA4 | 0.41 |
2.05×10−07 | 0.32 |
1.31×10⁻⁴ |
| LAG3 | 0.24 |
2.86×10−03 | 0.31 |
2.59×10⁻⁴ |
| HAVCR2 | 0.40 |
3.07×10−07 | 0.31 |
1.89×10⁻⁴ |
| GZMB | 0.30 |
1.48×10−04 | 0.18 |
3.27×10⁻² |
It was observed that the levels of expression of the
majority of monocytes, TAMs, M1/M2 macrophages, dendritic cells,
Th2 cells, Tregs and T cell exhaustion immunomarkers were
positively correlated with TCIRG1 expression, which were similar to
the results found in GEPIA, CD68 (coefficient =0.600,
P=3.50×10⁻¹⁷), TGFB1 (coefficient=0.690,
P=4.3×10⁻²⁴), STAT6 (coefficient =0.710,
P=3.80×10⁻²⁷) and STAT5A (coefficient =0.620,
P=5.80×10⁻¹⁹) (Table
IV).
| Table IV.Correlation between TCIRG1 expression
with immune gene markers in GEPIA database. |
Table IV.
Correlation between TCIRG1 expression
with immune gene markers in GEPIA database.
|
|
| Glioblastoma | Normal |
|---|
|
|
|
|
|
|---|
| Immune cells | Gene markers | Cor | P-value | Cor | P-value |
|---|
| M1 macrophage | IFR5 | 0.56 |
9.40×10⁻¹⁵ | 0.50 |
4.30×10⁻⁸ |
|
| PTGS2 | 0.42 |
3.30×10⁻⁸ | 0.33 |
4.90×10⁻⁴ |
| M2 macrophage | CD163 | 0.47 |
3.30×10⁻¹⁰ | 0.58 |
6.10×10⁻¹¹ |
|
| VSIG4 | 0.41 |
7.30×10⁻⁸ | 0.62 |
2.80×10⁻¹² |
|
| MS4A4A | 0.39 |
2.90×10⁻⁷ | 0.59 |
2.50×10⁻¹¹ |
| Tumor-associated
macrophage | CCL2 | 0.39 |
3.40×10⁻⁷ | 0.47 |
5.50×10⁻⁷ |
|
| CD68 | 0.60 |
3.50×10⁻¹⁷ | 0.44 |
3.10×10⁻⁶ |
|
| IL10 | 0.30 |
1.10×10⁻⁴ | 0.34 |
3.20×10⁻⁴ |
| Monocyte | CD86 | 0.39 |
2.00×10⁻⁷ | 0.44 |
2.20×10⁻⁶ |
|
| CSF1R | 0.56 |
7.90×10⁻¹⁵ | 0.44 |
2.70×10⁻⁶ |
| Regulatory T
cells | FOXP3 | 0.54 |
1.10×10⁻¹³ | −0.22 |
2.70×10⁻² |
|
| CCR8 | 0.32 |
2.40×10⁻⁵ | −0.01 | 0.90 |
|
| TGFB1 | 0.69 |
4.30×10⁻²⁴ | 0.82 |
3.50×10⁻²⁶ |
| T cell
exhaustion | PDCD1 | 0.39 |
3.70×10⁻⁷ | 0.37 |
1.20×10⁻⁴ |
|
| CTLA4 | 0.38 |
4.00×10⁻⁷ | 0.10 | 0.32 |
|
| LAG3 | 0.29 |
1.80×10⁻⁴ | 0.21 |
3.50×10⁻² |
|
| HAVCR2 | 0.43 |
1.20×10⁻⁸ | 0.47 |
5.20×10⁻⁷ |
|
| GZMB | 0.33 |
2.20×10⁻⁵ | 0.16 |
9.40×10⁻² |
| Dendritic cell | HLA-DPB1 | 0.42 |
1.70×10⁻⁸ | 0.69 |
6.10×10⁻¹⁶ |
|
| HLA-DRA | 0.32 |
3.70×10⁻⁵ | 0.63 |
4.40×10⁻¹³ |
|
| HLA-DPA1 | 0.37 |
1.30×10⁻⁶ | 0.60 |
1.40×10⁻¹¹ |
|
| NRP1 | 0.57 |
3.20×10⁻¹⁵ | 0.30 |
1.80×10⁻³ |
|
| ITGAX | 0.63 |
4.60×10⁻¹⁹ | 0.40 |
2.20×10⁻⁵ |
| T helper 2 | GATA3 | 0.44 |
3.50×10⁻⁹ | 0.13 | 0.20 |
|
| STAT6 | 0.72 |
3.80×10⁻²⁷ | 0.35 |
2.80×10⁻⁴ |
|
| STAT5A | 0.62 |
5.80×10⁻¹⁹ | 0.70 |
6.70×10⁻¹⁷ |
Furthermore, the GBM cases in the GSE16011 dataset
were used to validate the correlations between TCIRG1 and immune
signatures using Spearman's correlation coefficient through the
GlioVis online tool (17). The
results showed that TCIRG1 expression was significantly correlated
with most immune signatures in the GSE16011 dataset (Table SIV).
High TCIRG1 expression was related to dense DC
infiltration in GBM. The expression of the DC markers HLA-DPB1,
HLA-DRA, HLA-DPA1, NRP1 and ITGAX were significantly correlated
with TCIRG1 expression (Table SIV).
These results further demonstrated the close relationship between
TCIRG1 expression and infiltration of DCs.
In addition, a correlation between TCIRG1 expression
and markers of Tregs and T cell exhaustion was reported. FOXP3,
CCR8, TGFB1, PDCD1, CTLA-4, LAG3, HAVCR2 and GZMB were all
positively correlated with TCIRG1 expression (Table III and IV), which further supports the potential
of TCIRG1 as an important regulator of the immune response and
local immune tolerance in GBM. Hence, these findings suggested that
TCIRG1 expression is significantly related to immune infiltration
in GBM, suggesting that TCIRG1 may play an important role in immune
escape in the GBM microenvironment.
Discussion
GBM is the most highly malignant primary brain tumor
with the shortest 5-year OS rate (1). Tumor-related immune responses and
immunotherapy have been used in the treatment of malignant cancer,
and the successful application of the CTLA-4 and PD1 checkpoints
inhibitor in melanoma and non-small cell lung cancer has generated
interest in glioma immunotherapy (30,31).
However, as a heterogeneous cancer, GBM results in different
prognoses in different patients who receive the same treatment
(2). Therefore, mining data on the
molecular mechanisms in the GBM microenvironment remains
necessary.
V-ATPase is a macromolecular complex that is
overexpressed in cancer cells, and subunit ‘a’ affects the
subcellular localization of V-ATPase (6,7,9,10,14).
TCIRG1 is an a3 subunit of V-ATPase that is normally
expressed in osteoclasts and insulin-containing secretory vesicles
in pancreatic β cells; however, aberrantly overexpressed TCIRG1 in
cancer cells promotes tumor metastasis and migration potential,
indicating that TCIRG1 might be a specific marker for tumor
malignancy (5,7,8).
In hepatocellular carcinoma, melanoma and breast
cancer, overexpression of TCIRG1 has been reported to be correlated
with tumor malignancy (7,9,10).
Increased TCIRG1 expression has been found in highly invasive cell
lines, such as MDA-MB-231 breast cancer cells (7). In contrast, in non-invasive MCF7 breast
cancer cells, TCIRG1 expression is lower compared with that in
MDA-MB-231 cells, and treatment with a V-ATPase inhibitor does not
reduce the invasion potential of MCF7 cells, as found in MDA-MB-231
cells (7,32). In addition, TCIRG1 is aberrantly
overexpressed in the highly metastatic B16-F10 mouse melanoma cell
line compared with the poorly metastatic B16 mouse melanoma cell
line (9). TCIRG1-knockdown or
treatment with a specific inhibitor in B16-F10 cells inhibits
metastasis in an in vivo mouse model (9). However, the expression profile of
TCIRG1 and its function in GBM remain to be fully understood
(13,14,33). In
the present study, by analyzing transcriptional data in public
datasets, it was reported that TCIRG1 was highly expressed in
several types of malignant tumors, which was consistent with
previous studies (6,10). However, in some datasets from the
Oncomine database, the results showed slight differences, as TCIRG1
expression was lower in tumors compared with in adjacent normal
tissues. Discrepancies in TCIRG1 expression may result from data
assembly methods and fundamental mechanisms applicable to distinct
biological characteristics.
In malignant tumors of the central nervous system,
the highest TCIRG1 mRNA expression was found in GBM tissues
compared with LGG and normal brain tissues. Protein level
validation was performed using WB analysis, and although the number
of clinical samples was limited, a significant difference between
normal brain tissues and glioma tissues was observed. Upon further
investigation of the effect of TCIRG1 expression on GBM subtypes
based on Verhaak methods (3), it was
reported that TCIRG1 was highly expressed in the mesenchymal
subtype, which is the most malignant subtype and has the worst
prognosis of all GBM subtypes (3,4).
Therefore, the present study offers novel insight into the function
of TCIRG1 in glioma malignancy evaluation and highlights the
potential of TCIRG1 as a biomarker of mesenchymal GBM.
Kaplan-Meier curve analyses from two independent
datasets (TCGA-GBM and GSE16011) demonstrated the prognostic value
of TCIRG1 expression in GBM. Elevated TCIRG1 expression
significantly reduced OS in patients with GBM from both cohorts.
Notably, after adjusting for IDH-1 status, age, sex, mesenchymal
subtype, chemotherapy and radiation therapy information, TCIRG1
still played an important role in the prognosis of GBM. Therefore,
the present study provides insight into the potential use of TCIRG1
as a prognostic marker in GBM, and TCIRG1 may become a novel marker
in targeted therapy.
To further explore the biological function of TCIRG1
in GBM, genes were selected that showed positive correlations with
TCIRG1 in the TCGA-GBM and GSE16011 datasets by performing
Pearson's correlation coefficient analysis. The GO category
analysis revealed that these genes were enriched in the ‘immune
response’, ‘immune effector process’, ‘defense response’,
‘regulation of the immune system process’ and ‘positive regulation
of the immune system process’. However, this is potentially due to
the tumorigenesis function of TCIRG1 (7,9,10), and the negatively correlated genes
were mainly enriched in physiological functions. Similar results
have also been reported by Wang et al (18), in which programmed cell death 1
ligand 2 is a glioma malignancy-related gene, and its positively
correlated genes are enriched in the immune response. In contrast,
the negatively correlated genes mainly participate in physiological
processes, such as nervous system development and neuron
development. The present study demonstrated that TCIRG1 was
involved in malignant glioma phenotypes and might participate in
processes of the host immune system in glioma. Based on the PPI
network analysis, the biological function of key modules also
supported the aforementioned results.
Another important finding in the present study was
that TCIRG1 expression was correlated with immune infiltration
levels in GBM. As GBM has long been recognized as an
immunosuppressive neoplasm that is characterized by the activation
of various immune escape mechanisms (34), and to clarify the importance of
TCIRG1 in the immune response, the TIMER database (15) and ESTIMATE algorithm (21) were used to compare the expression of
this gene with immune cell infiltration and local immune scores.
The results indicated that TCIRG1 expression was positively
correlated with CD4+ T cells, DC infiltration and high immune
scores but negatively correlated with tumor purity and CD8+ T cell
infiltration. A correlation between the genetic markers of Tregs as
well as T cell exhaustion and TCIRG1 expression was found in the
TIMER database. For other immune cells, TCIRG1 expression was
positively correlated with markers of M2 macrophages, monocytes and
TAMs and some markers in M1 macrophages, Th2 cells, DCs, natural
killer cells and neutrophils. A less significant association was
reported between TCIRG1 expression and Th1, Tfh and Th17 cells.
However, the mechanism of TCIRG1 expression involved in regulating
the GBM local immune response remains to be elucidated.
Tumor cells can influence immune cells by producing
lactic acid to change the local pH in the tumor microenvironment
(11). The main function of V-ATPase
is to transport protons into intracellular compartments, promote
the acidification of endosomes and lysosomes and excrete
intracellular protons into the extracellular space, thus
maintaining H+ homeostasis (5). TCIRG1 regulates V-ATPase localization
and functions in mammalian cells, and promotes acidification and
maturation of cytotoxic granules in cytotoxic T lymphocytes
(12). The effects of V-ATPase on
regulating DC maturation, antigen presentation as well as the
regulation of tumor-associated macrophages have also been reported
(8,35,36).
Therefore, it is reasonable to speculate that local immune
infiltration in GBM may affect TCIRG1-mediated activities in the
tumor microenvironment. The present results indicated the novel
function of TCIRG1 in the immune response in addition to its
function in V-ATPase regulation. Since immune regression in GBM is
an important poor prognostic factor (30), further studies on TCIRG1 regulation
of the local immune response in GBM are required.
Despite the fact that the present study used
transcriptional data across different databases, several
limitations still exist. First, the use of different microarrays
and sequencing data from public databases inevitably introduced
systematic bias (28), and the bias
could be found in Oncomine data mining in the present study.
Second, as a potential prognostic and diagnostic biomarker in GBM,
the molecular mechanisms underlying the function of TCIRG1 in
survival of patients with GBM remain uncertain, and the results did
not conclusively demonstrate that TCIRG1 affects patient survival
through immune infiltration. The roles of TCIRG1 in glioma cell
differentiation, proliferation, invasion and migration have not
been explored. Third, the present study only conducted a
bioinformatics analysis of TCIRG1 expression and immune cell
infiltration and patient survival in distinct public databases, but
functional experiments were not performed. Further testing using
in vivo and in vitro models, such as the effect of
TCIRG1 on glioma cell invasion and proliferation and its effect on
chemotherapy, will therefore be necessary before determining
whether TCIRG1 inhibition could be an effective method for treating
GBM.
In conclusion, TCIRG1 expression is associated with
glioma malignancy and may be a marker of unfavorable prognosis in
patients with GBM, and it could be regarded as a prognostic
biomarker and an indicator of immune infiltration in GBM.
Supplementary Material
Supporting Data
Supporting Data
Supporting Data
Supporting Data
Acknowledgements
Not applicable.
Funding
The current study work was funded by the Liaoning
Province Special Professor Project (grant no. 3110517003).
Availability of data and materials
The datasets used and/or analyzed during the current
study are available from the corresponding author on reasonable
request.
Authors' contributions
CQ and SO were responsible for conception and design
of the study. CQ acquired the data, performed the statistical
analyses and wrote of the manuscript. LL, JH, GW and JL
participated in data collection and helped analyze the data. SO
also analyzed the data. All authors contributed to drafting and
revising the article, gave final approval of the version to be
published and agree to be accountable for all aspects of the
work.
Ethics approval and consent to
participate
The study was approved by The Ethics Committee of
the First Hospital of China Medical University (Shenyang, China).
All patients provided written informed consent.
Patient consent for publication
Not applicable.
Competing interests
The authors declare that they have no competing
interests.
References
|
1
|
Incekara F, Koene S, Vincent AJPE, van den
Bent MJ and Smits M: Association between supratotal glioblastoma
resection and patient survival: A systematic review and
meta-analysis. World Neurosurg. 127:617–624.e2. 2019. View Article : Google Scholar : PubMed/NCBI
|
|
2
|
Louis DN, Perry A, Reifenberger G, von
Deimling A, Figarella-Branger D, Cavenee WK, Ohgaki H, Wiestler OD,
Kleihues P and Ellison DW: The 2016 World Health Organization
classification of tumors of the central nervous system: A summary.
Acta Neuropathol. 131:803–820. 2016. View Article : Google Scholar : PubMed/NCBI
|
|
3
|
Verhaak RG, Hoadley KA, Purdom E, Wang V,
Qi Y, Wilkerson MD, Miller CR, Ding L, Golub T, Mesirov JP, et al:
Integrated genomic analysis identifies clinically relevant subtypes
of glioblastoma characterized by abnormalities in PDGFRA, IDH1,
EGFR, and NF1. Cancer Cell. 17:98–110. 2010. View Article : Google Scholar : PubMed/NCBI
|
|
4
|
Ma X, Shang F, Zhu W and Lin Q: CXCR4
expression varies significantly among different subtypes of
glioblastoma multiforme (GBM) and its low expression or
hypermethylation might predict favorable overall survival. Expert
Rev Neurother. 17:941–946. 2017. View Article : Google Scholar : PubMed/NCBI
|
|
5
|
Whitton B, Okamoto H, Packham G and Crabb
SJ: Vacuolar ATPase as a potential therapeutic target and mediator
of treatment resistance in cancer. Cancer Med. 7:3800–3811. 2018.
View Article : Google Scholar : PubMed/NCBI
|
|
6
|
Cotter K, Liberman R, Sun-Wada G, Wada Y,
Sgroi D, Naber S, Brown D, Breton S and Forgac M: The a3 isoform of
subunit a of the vacuolar ATPase localizes to the plasma membrane
of invasive breast tumor cells and is overexpressed in human breast
cancer. Oncotarget. 7:46142–46157. 2016. View Article : Google Scholar : PubMed/NCBI
|
|
7
|
Hinton A, Sennoune SR, Bond S, Fang M,
Reuveni M, Sahagian GG, Jay D, Martinez-Zaguilan R and Forgac M:
Function of a subunit isoforms of the V-ATPase in pH homeostasis
and in vitro invasion of MDA-MB231 human breast cancer cells. J
Biol Chem. 284:16400–16408. 2009. View Article : Google Scholar : PubMed/NCBI
|
|
8
|
McGuire C, Cotter K, Stransky L and Forgac
M: Regulation of V-ATPase assembly and function of V-ATPases in
tumor cell invasiveness. Biochim Biophys Acta. 1857:1213–1218.
2016. View Article : Google Scholar : PubMed/NCBI
|
|
9
|
Nishisho T, Hata K, Nakanishi M, Morita Y,
Sun-Wada GH, Wada Y, Yasui N and Yoneda T: The a3 isoform vacuolar
type H+-ATPase promotes distant metastasis in the mouse
B16 melanoma cells. Mol Cancer Res. 9:845–855. 2011. View Article : Google Scholar : PubMed/NCBI
|
|
10
|
Yang HD, Eun JW, Lee KB, Shen Q, Kim HS,
Kim SY, Seo DW, Park WS, Lee JY and Nam SW: T-cell immune regulator
1 enhances metastasis in hepatocellular carcinoma. Exp Mol Med.
50:e4202018. View Article : Google Scholar : PubMed/NCBI
|
|
11
|
Colegio OR, Chu NQ, Szabo AL, Chu T,
Rhebergen AM, Jairam V, Cyrus N, Brokowski CE, Eisenbarth SC,
Phillips GM, et al: Functional polarization of tumour-associated
macrophages by tumour-derived lactic acid. Nature. 513:559–563.
2014. View Article : Google Scholar : PubMed/NCBI
|
|
12
|
Chitirala P, Ravichandran K, Schirra C,
Chang HF, Krause E, Kazmaier U, Lauterbach MA and Rettig J: Role of
V-ATPase a3-subunit in mouse CTL function. J Immunol.
204:2818–2828. 2020. View Article : Google Scholar : PubMed/NCBI
|
|
13
|
Di Cristofori A, Ferrero S, Bertolini I,
Gaudioso G, Russo MV, Berno V, Vanini M, Locatelli M, Zavanone M,
Rampini P, et al: The vacuolar H+ ATPase is a novel therapeutic
target for glioblastoma. Oncotarget. 6:17514–17531. 2015.
View Article : Google Scholar : PubMed/NCBI
|
|
14
|
Terrasi A, Bertolini I, Martelli C,
Gaudioso G, Di Cristofori A, Storaci AM, Formica M, Bosari S,
Caroli M, Ottobrini L, et al: Specific V-ATPase expression
sub-classifies IDHwt lower-grade gliomas and impacts glioma growth
in vivo. EBioMedicine. 41:214–224. 2019. View Article : Google Scholar : PubMed/NCBI
|
|
15
|
Li B, Severson E, Pignon JC, Zhao H, Li T,
Novak J, Jiang P, Shen H, Aster JC, Rodig S, et al: Comprehensive
analyses of tumor immunity: Implications for cancer immunotherapy.
Genome Biol. 17:1742016. View Article : Google Scholar : PubMed/NCBI
|
|
16
|
Gravendeel LA, Kouwenhoven MC, Gevaert O,
de Rooi JJ, Stubbs AP, Duijm JE, Daemen A, Bleeker FE, Bralten LB,
Kloosterhof NK, et al: Intrinsic gene expression profiles of
gliomas are a better predictor of survival than histology. Caner
Res. 69:9065–9072. 2009. View Article : Google Scholar
|
|
17
|
Bowman RL, Wang Q, Carro A, Verhaak RG and
Squatrito M: GlioVis data portal for visualization and analysis of
brain tumor expression datasets. Neuro Oncol. 19:139–141. 2017.
View Article : Google Scholar : PubMed/NCBI
|
|
18
|
Wang ZL, Li GZ, Wang QW, Bao ZS, Wang Z,
Zhang CB and Jiang T: PD-L2 expression is correlated with the
molecular and clinical features of glioma, and acts as an
unfavorable prognostic factor. Oncoimmunology. 8:e15415352019.
View Article : Google Scholar : PubMed/NCBI
|
|
19
|
Huang da W, Sherman BT and Lempicki RA:
Systematic and integrative analysis of large gene lists using DAVID
bioinformatics resources. Nat Protoc. 4:44–57. 2009. View Article : Google Scholar : PubMed/NCBI
|
|
20
|
Shannon P, Markiel A, Ozier O, Baliga NS,
Wang JT, Ramage D, Amin N, Schwikowski B and Ideker T: Cytoscape: A
software environment for integrated models of biomolecular
interaction networks. Genome Res. 13:2498–2504. 2003. View Article : Google Scholar : PubMed/NCBI
|
|
21
|
Yoshihara K, Shahmoradgoli M, Martinez E,
Vegesna R, Kim H, Torres-Garcia W, Trevino V, Shen H, Laird PW,
Levine DA, et al: Inferring tumour purity and stromal and immune
cell admixture from expression data. Nat Commun. 4:26122013.
View Article : Google Scholar : PubMed/NCBI
|
|
22
|
Jia D, Li S, Li D, Xue H, Yang D and Liu
Y: Mining TCGA database for genes of prognostic value in
glioblastoma microenvironment. Aging (Albany NY). 10:592–605. 2018.
View Article : Google Scholar : PubMed/NCBI
|
|
23
|
Zhang Y, Ou DH, Zhuang DW, Zheng ZF and
Lin ME: In silico analysis of the immune microenvironment in
bladder cancer. BMC Cancer. 20:2652020. View Article : Google Scholar : PubMed/NCBI
|
|
24
|
Ren Q, Zhu P, Zhang H, Ye T, Liu D, Gong Z
and Xia X: Identification and validation of stromal-tumor
microenvironment-based subtypes tightly associated with PD-1/PD-L1
immunotherapy and outcomes in patients with gastric cancer. Cancer
Cell Int. 20:922020. View Article : Google Scholar : PubMed/NCBI
|
|
25
|
Tang Z, Li C, Kang B, Gao G, Li C and
Zhang Z: GEPIA: A web server for cancer and normal gene expression
profiling and interactive analyses. Nucleic Acids Res. 45:W98–W102.
2017. View Article : Google Scholar : PubMed/NCBI
|
|
26
|
Zhang C, Cheng W, Ren X, Wang Z, Liu X, Li
G, Han S, Jiang T and Wu A: Tumor purity as an underlying key
factor in glioma. Clin Cancer Res. 23:6279–6291. 2017. View Article : Google Scholar : PubMed/NCBI
|
|
27
|
Chen B, Lai J, Dai D, Chen R, Li X and
Liao N: JAK1 as a prognostic marker and its correlation with immune
infiltrates in breast cancer. Aging (Albany NY). 11:11124–11135.
2019. View Article : Google Scholar : PubMed/NCBI
|
|
28
|
Shi S, Ye S, Mao J, Ru Y, Lu Y, Wu X, Xu
M, Zhu T, Wang Y, Chen Y, et al: CMA1 is potent prognostic marker
and associates with immune infiltration in gastric cancer.
Autoimmunity. 53:210–217. 2020. View Article : Google Scholar : PubMed/NCBI
|
|
29
|
Yuan Q, Sun N, Zheng J, Wang Y, Yan X, Mai
W, Liao Y and Chen X: Prognostic and Immunological Role of FUN14
domain containing 1 in pan-cancer: Friend or foe? Front Oncol.
9:15022019. View Article : Google Scholar : PubMed/NCBI
|
|
30
|
Rizvi NA, Mazieres J, Planchard D,
Stinchcombe TE, Dy GK, Antonia SJ, Horn L, Lena H, Minenza E,
Mennecier B, et al: Activity and safety of nivolumab, an anti-PD-1
immune checkpoint inhibitor, for patients with advanced, refractory
squamous non-small-cell lung cancer (CheckMate 063): A phase 2,
single-arm trial. Lancet Oncol. 16:257–265. 2015. View Article : Google Scholar : PubMed/NCBI
|
|
31
|
Hodi FS, O'Day SJ, McDermott DF, Weber RW,
Sosman JA, Haanen JB, Gonzalez R, Robert C, Schadendorf D, Hassel
JC, et al: Improved survival with ipilimumab in patients with
metastatic melanoma. N Engl J Med. 363:711–723. 2010. View Article : Google Scholar : PubMed/NCBI
|
|
32
|
Sennoune SR, Bakunts K, Martinez GM,
Chua-Tuan JL, Kebir Y, Attaya MN and Martinez-Zaguilan R: Vacuolar
H+-ATPase in human breast cancer cells with distinct metastatic
potential: Distribution and functional activity. Am J Physiol Cell
Physiol. 286:C1443–C1452. 2004. View Article : Google Scholar : PubMed/NCBI
|
|
33
|
Gleize V, Boisselier B, Marie Y,
Poea-Guyon S, Sanson M and Morel N: The renal v-ATPase a4 subunit
is expressed in specific subtypes of human gliomas. Glia.
60:1004–1012. 2012. View Article : Google Scholar : PubMed/NCBI
|
|
34
|
Razavi SM, Lee KE, Jin BE, Aujla PS,
Gholamin S and Li G: Immune evasion strategies of glioblastoma.
Front Surg. 3:112016. View Article : Google Scholar : PubMed/NCBI
|
|
35
|
Katara GK, Jaiswal MK, Kulshrestha A,
Kolli B, Gilman-Sachs A and Beaman KD: Tumor-associated vacuolar
ATPase subunit promotes tumorigenic characteristics in macrophages.
Oncogene. 33:5649–5654. 2014. View Article : Google Scholar : PubMed/NCBI
|
|
36
|
Trombetta ES, Ebersold M, Garrett W,
Pypaert M and Mellman I: Activation of lysosomal function during
dendritic cell maturation. Science. 299:1400–1403. 2003. View Article : Google Scholar : PubMed/NCBI
|