Introduction
According to the Global cancer statistics (2018)
(1), which estimated the mortality
rate and the prevalence of major types of cancer in 185 countries
worldwide, the most commonly diagnosed cancer was lung cancer
(11.6% of the 11.8 million new cases), and the most common cause of
cancer-associated death was lung cancer (18.4% of the 9.6 million
new cases). Thus, lung cancer is currently one of the most lethal
cancers. In addition, 87% of all lung cancer cases are diagnosed as
non-small cell lung cancer (NSCLC), which has a poor prognosis and
5-year overall survival (OS) rates are <15% in China (2,3).
Radiation therapy is regarded as one of the main treatment
strategies for NSCLC (1). However,
enhancement of radiosensitivity is a key issue.
Neuropilin 1 (NRP1), a transmembrane receptor, is
primarily found in arterial endothelial cells and plays crucial
roles in tumour growth and metastasis (4–7). It
appears to support the migration, proliferation and invasion of
tumour cells in renal cancer, lung cancer and glioblastoma
multiforme (8,9). Researchers have also shown that NRP1 is
important in radioresistance. Glinka et al (10) reported that overexpression of NRP1
decreases irradiation-induced apoptosis of glioma cells. Our
previous study showed that knockdown of endogenous NRP1 expression
enhances radiosensitivity and inhibits invasion and migration after
irradiation of A549 cells both in vivo and in vitro
(11). Using a bioinformatics
approach based on a luciferase reporter assay, we previously
demonstrated that NRP1, a putative miR-9 target, may be involved in
the promotion of cancer cell migration, invasion and angiogenesis
(12). An improved understanding of
NRP1 signalling may enable the design of therapies to improve the
radiosensitivity of NSCLC cells. Therefore, the present study
mainly investigated the downstream genes regulated by NRP1 and
their role in radiation.
Homeobox genes (HOXs) are developmental genes that
encode homeoproteins that function as critical master regulatory
transcription factors during normal embryogenesis and
anterior-posterior axis formation (13–16).
These genes play an important role in different tissue types and in
the development of tumours (17–19).
Previous research has also demonstrated that some HOXs are
associated with radioresistance (20). Chiba et al (20) proved that HOXB9 can enhance
radioresistance by accelerating DNA damage responses and inducing
epithelial-to-mesenchymal transition. The MLL gene is a
transcriptional regulator that mainly modifies genes by
H3K4-methylation (21). MLL5 is a
recognized oncosuppressor gene that contains SET and PHD domains
and is homologous to Drosophila TRITHORAX and yeast SET3 (22–24).
Located on chromosome 7q22, MLL5 is a nuclear protein that forms
speckled foci, and is also an important regulator of DNA
methylation (25–27). The MLL protein has a positive
regulatory effect on HOX gene expression and is mainly involved in
maintaining HOX gene expression. MLL5 can regulate the cell cycle
and the expression of adenovirus E2 factor-1 through host cell
factor 1. Knockdown of MLL5 expression can suppress HeLa cell
proliferation and arrest the cell cycle in G1 phase
(28). In view of these
characteristics of HOX and MLL, the present study explored their
role in radiation mainly from the perspective of cell cycle
progression and proliferation.
The present study identified the HOXs associated
with NRP1 and radioresistance, evaluated the mechanism by which
NRP1 enhances radioresistance via the HOX-dependent pathway and
verified the relationship of NRP1 with the tumour radiotherapy
response using clinical tissues and a nude mouse model. Thus, the
results may provide valuable information for understanding the
mechanisms of NSCLC pathogenesis and an opportunity to develop more
effective clinical therapies.
Materials and methods
Cell lines and treatment
For transient transfection, A549 cells (The Type
Culture Collection of the Chinese Academy of Sciences) were
transfected with 5 µg of targeted or non-targeting sequence
negative control (NC) short interfering (si)RNA using
Lipofectamine® 3000 according to the manufacturer's
instructions (Invitrogen; Thermo Fisher Scientific, Inc.). siRNAs
were used to interfere with HOXA6, HOXA9 and MLL5 expression and a
negative siRNA was used as the control group named si-NC. At 3 days
following transfection, cells were collected and the transfection
efficiency was analysed. The most efficient siRNA was selected for
the subsequent experiments. The sequences used were as follows:
HOXA6: 5′-CCUUGUUUCUACCAACAGU-3′, HOXA9: 5-CUCCAGUUGAUAGAGAAAA-3′
and MLL5: 5′-GAGACGCACUUAUAGUCAA-3′. For stable transfection, A549
or H1299 (The Type Culture Collection of the Chinese Academy of
Sciences) cells infected with short hairpin (sh)NRP1 or pLNCX2-NRP1
lentivirus were used as stable cell models for NRP1-knockdown or
overexpression called -NRP1low or -NRP1high
cells, respectively. The negative control cells were transfected
with the lentivirus containing the plasmid backbone named
NC-NRP1low or NC-NRP1high. These stably
expressed cells were produced Shanghai GenePharma Co., Ltd.
Irradiated A549 cells (6 Gy each time, a total of five times, once
every two weeks) were used as the radiation-resistant (RR) model
cells, named A549-RR cells. This was termed IR1 after the first
irradiation, IR2 after the second irradiation and up to the fifth
exposure called IR5. Other cells were sham-irradiated or exposed to
10 Gy of ionizing radiation (IR) (A549-IR or H1299-IR). As the
expression levels were similar, wild-type cells were used as the
control instead of NC-NRP1low or NC-NRP1high
when the transfected and irradiated cells were compared.
Irradiation
An X-ray generator (Model X-RAD320; PXi, Inc.) was
used to deliver radiation at a dose rate of 1.00 Gy/min (220 kV; 18
mA) for all cell and animal treatments.
RNA isolation and quantitative
PCR
Total RNA was extracted from tissues of patients or
mice and cells of A549 with different transfection or irradiation
using TRIzol® reagent (Invitrogen; Thermo Fisher
Scientific, Inc.) and reverse transcribed to generate cDNA
according to the manufacturer's instructions (PrimeScript RT-PCR
kit; Takara Bio, Inc.). Quantitative PCR was carried out to detect
gene expression (SYBR® Premix Ex Taq™ II; Takara Bio,
Inc.). GAPDH was used as the internal control. PCRs were performed
as follows: 95°C, Melting under pre-denaturation for 30 sec; 95°C
for additional 5 sec and 60°C for 30 sec (this step was repeated
for 40 cycles). The primer sequences were synthesized by Sangon
Biotech Co., Ltd. and were as follows: NRP1 forward,
5′-CCCCAAACCACTGATAACTCG-3′ and reverse,
5′-AGACACCATACCCAACATTCC-3′; HOXA6 forward,
5′-TTGGATGCAGCGGATGAA-3′ and reverse, 5′-AGCGGTTGAAGTGGAACTC-3′;
HOXA9 forward, 5′-AGACCCTGGAACTGGAGAAA-3′ and reverse,
5′-GGTTCTGGAACCAGATCTTGAC-3′; MLL5 forward,
5′-TTATATACCAGCAGCTCACATCATTCA-3′ and reverse,
5′-CATTTTTGCTAATAAGGACTGATGGA-3′; GAPDH forward,
5′-ACATCGCTCAGACACCATG-3′ and reverse,
5′-TGTAGTTGAGGTCAATGAAGGG-3′. All samples were normalized to the
internal control, and fold-changes were calculated by relative
quantification (2−ΔΔCq) (29).
Western blot analysis and
Co-immunoprecipitation
Total protein was extracted from tissues or cells
and lysed using RIPA lysis buffer supplemented with 1 mM PMSF
(Sigma-Aldrich; Merck KGaA). Total protein was quantified using a
bicinchoninic acid assay and 30 µg protein per lane was separated
via SDS-PAGE on a 10% polyacrylamide gel. Proteins were separated
(Bio-Rad Laboratories, Inc.) and transferred onto polyvinylidene
fluoride membranes (Merck KGaA) and blocked with 5% BSA (B2064;
Sigma-Aldrich; Merck KGaA) in TBS (RP05004V/S, Monad Biotech Co.,
Ltd) with 0.1% Tween-20 (Beijing Solarbio Science & Technology
Co., Ltd.) for 1 h at room temperature. The membranes were
incubated with the designated primary antibodies against HOXA6
(1:1,000; cat. no. ab74064; Abcam), HOXA9 (1:1,000; cat. no.
ab83480; Abcam), MLL5 (1:1,000; cat. no. ab75339; Abcam), NRP1
(1:1,000; cat. no. ab81321; Abcam) and GAPDH (1:1,000; cat. no.
TA802519; OriGene Technologies, Inc.) overnight at 4°C. After being
washed three times in TBST buffer (10 min/wash), membranes were
incubated with the corresponding goat anti-rabbit IgG H&L (HRP)
(1:5,000; cat. no. ab97051; Abcam) for 2 h at room temperature. For
co-immunoprecipitation, cells were lysed in 300 µl RIPA lysis
buffer (R0278; Sigma-Aldrich; Merck KGaA), containing protease
inhibitors (P8340; Sigma-Aldrich; Merck KGaA) for 30 min at 4°C.
Following centrifugation (12,000 × g; 4°C; 10 min), the 1/10 volume
of supernatant was collected as input and analyzed using western
blotting as aforementioned. The other lysates were incubated with 2
µg anti-NRP1 rabbit monoclonal antibody (cat. no. ab81321; Abcam)
or negative control rabbit IgG (ready to use; cat. no. A7016;
Beyotime Institute of Biotechnology) stock solution at 4°C
overnight and then rotated at 4°C with a mixture of protein A/G
sepharose beads (20 µl; cat. no. P2055; Beyotime Institute of
Biotechnology) for 3 h. The beads were then washed three times with
RIPA buffer, and the bound proteins were boiled in 1X Laemmli
buffer (cat. no. P0287; Beyotime Institute of Biotechnology) and
further analysed using western blotting as aforementioned.
Cell viability assay
A549 cells (5,000 cells/well) were plated in 96-well
plates after transfected with siRNAs (A549-siNC, A549-siHOXA6,
A549-siHOXA9, A549-siMLL5). After irradiation, the cells were
cultured for 0, 24 and 48 h at 37°C in a humidified incubator
containing 5% CO2. In order to study whether HOXA6,
HOXA9 and MLL5 affects cells, cell viability was determined by a
MTT assay according to the manufacturer's instructions
(MilliporeSigma; Merck KGaA) and quantified spectrophotometrically
at a test wavelength of 570 nm and a reference wavelength of 630 nm
using a microplate reader.
Cell cycle analysis and Annexin V-FITC
apoptosis detection assay
Cells transfected with control RNA (A549-siNC) or
siRNA (A549-siHOXA6, A549-siHOXA9 or A549-siMLL5) were cultured at
37°C for 24 h and in triplicate in six-well plates. After adherence
to the wall, the cells were irradiated with 10 Gy. For cell cycle
analysis, at 24 h post irradiation, the cells were collected by
trypsinization, washed in PBS and fixed in 70% ethanol for 30 min
at 4°C. The cell cycle distribution was analysed by propidium
iodide staining. The cells were stained using an Annexin V-FITC
Apoptosis Detection kit I (BD Biosciences) according to the
manufacturer's instructions to detect apoptosis. All the cell-cycle
or apoptosis data were analysed using flow cytometry (BD
Bioscience) and Modfit software (version 3.3; Verity House
Software).
Immunohistochemistry
The expression of NRP1 in human patients and mouse
tumour tissues were examined by immunohistochemistry. The samples
were fixed with 4% paraformaldehyde at room temperature overnight,
dehydrated and embedded in paraffin, and cut into 5-mm thick
sections. The sections were incubated at 60°C for 4 h, dewaxed
using xylene and rehydrated using a decreasing ethanol gradient
(100, 95, 75 and 50%, 5 min each time). After washed three times
for 5 min with PBS, sections were incubated in 3% hydrogen peroxide
at room temperature for 10 min to inactivate endogenous peroxidase.
Sections were heated at 95°C for 20 min in EDTA bufer and natural
fall to room warm. The sections were blocked in 5% BSA (B2064;
Sigma-Aldrich; Merck KGaA) and 0.3% Triton X-100 (T8200; Solarbio)
for 30 min. Tissues were incubated with rabbit monoclonal human
primary antibody (1:200; cat. no. ab81321; Abcam) overnight at 4°C
and goat anti-rabbit IgG H&L (Alexa Fluor® 647)
antibody (1:200; cat. no. ab150079; Abcam) for 2 h at room
temperature in dark. The sections were stained in 50 µl DAPI
solution and incubated in dark for 10 min at room temperature. For
each slice, images of five sections were acquired under using a
light microscopy and analysed using cellSens Standard 1.18 (Olympus
Corporation).
Patient and tissue samples
NSCLC, adjacent non-cancerous (2-cm from the lesion)
and normal tissues were collected and retrospectively analysed from
45 patients who underwent curative resection and did not receive
radio- or chemotherapy before surgery, between January 2010 and
December 2011 at the China-Japan Union Hospital of Jilin University
(Changchun, China). Each patient had signed an informed consent
prior to surgery and was informed that tissues would be used for
scientific research at the time of sample collection. This study
was approved by The Ethics Committee of Jilin University
(Changchun, China; approval no. 2017-169).
Animals
In total, 12 severe combined immunodeficiency mice
(Beijing Vital River Laboratory Animal Technology Co., Ltd.) were
maintained in a specific pathogen-free facility and housed in
sterile conditions, with a 12 h light/dark cycle at 20–25°C and a
humidity of 40–70%, sterilized food and water were freely
available. All experimental manipulations were undertaken in
accordance with the institutional guidelines for the care and use
of laboratory animals. In total, 1×10⁶ A549 cells were
directly injected into the right hind legs of mice. The present
study was approved by The Ethics Committee of Jilin University
(approval no. 2018-223). After 14 days, when the tumour volumes
were ~0.6 cm3, the tumours were irradiated with 20 Gy.
After another 14 days, the mice were sacrificed using pentobarbital
sodium (intraperitoneal injection, 200 mg/kg) or if a humane
endpoint was reached; defined as a loss of >15% of body mass, a
tumour volume >1.2 cm3, severe fever, vomiting or
skin problems (wounds or signs of inflammation) or inability to
ambulate or rise for food and water. No animals reached these
endpoints. When the mouse stopped breathing and there was no
heartbeat, the mouse was declared dead. The tumour tissues were
stripped for subsequent detection. The maximum tumour size was ~1.2
cm3 (1×1×1.2 cm).
Statistical analysis
Statistical analysis was performed using SPSS 18.0
(SPSS, Inc.). The results from three independent experiments were
presented as the mean ± standard deviation values. The data of
clinical specimens were expressed as median (interquartile range).
The unpaired independent sample t-test or Mann-Whitney U test was
used for analysis of the difference between two independent
samples. One-way ANOVA, two-way ANOVA or Kruskal-Wallis test was
used to compare the differences between multiple groups and
Student-Newman-Keuls, Tukey's or Dunn's post hoc tests were used.
The Kolmogorov-Smirnov method was used to detect the distribution
of different groups. The relationship between genes and
clinicopathological parameters was analysed using χ2
test or Fisher's exact test. The correlation analysis was performed
using bivariate Spearman's rank correlation tests. A R-value
>0.7 indicates a strong correlation and a R-value <0.4
indicates a weak correlation. P-values were selected from both
sides, and P<0.05 was considered to indicate a statistically
significant difference.
Results
Screening key downstream genes of NRP1
in radioresistant lung cancer cells
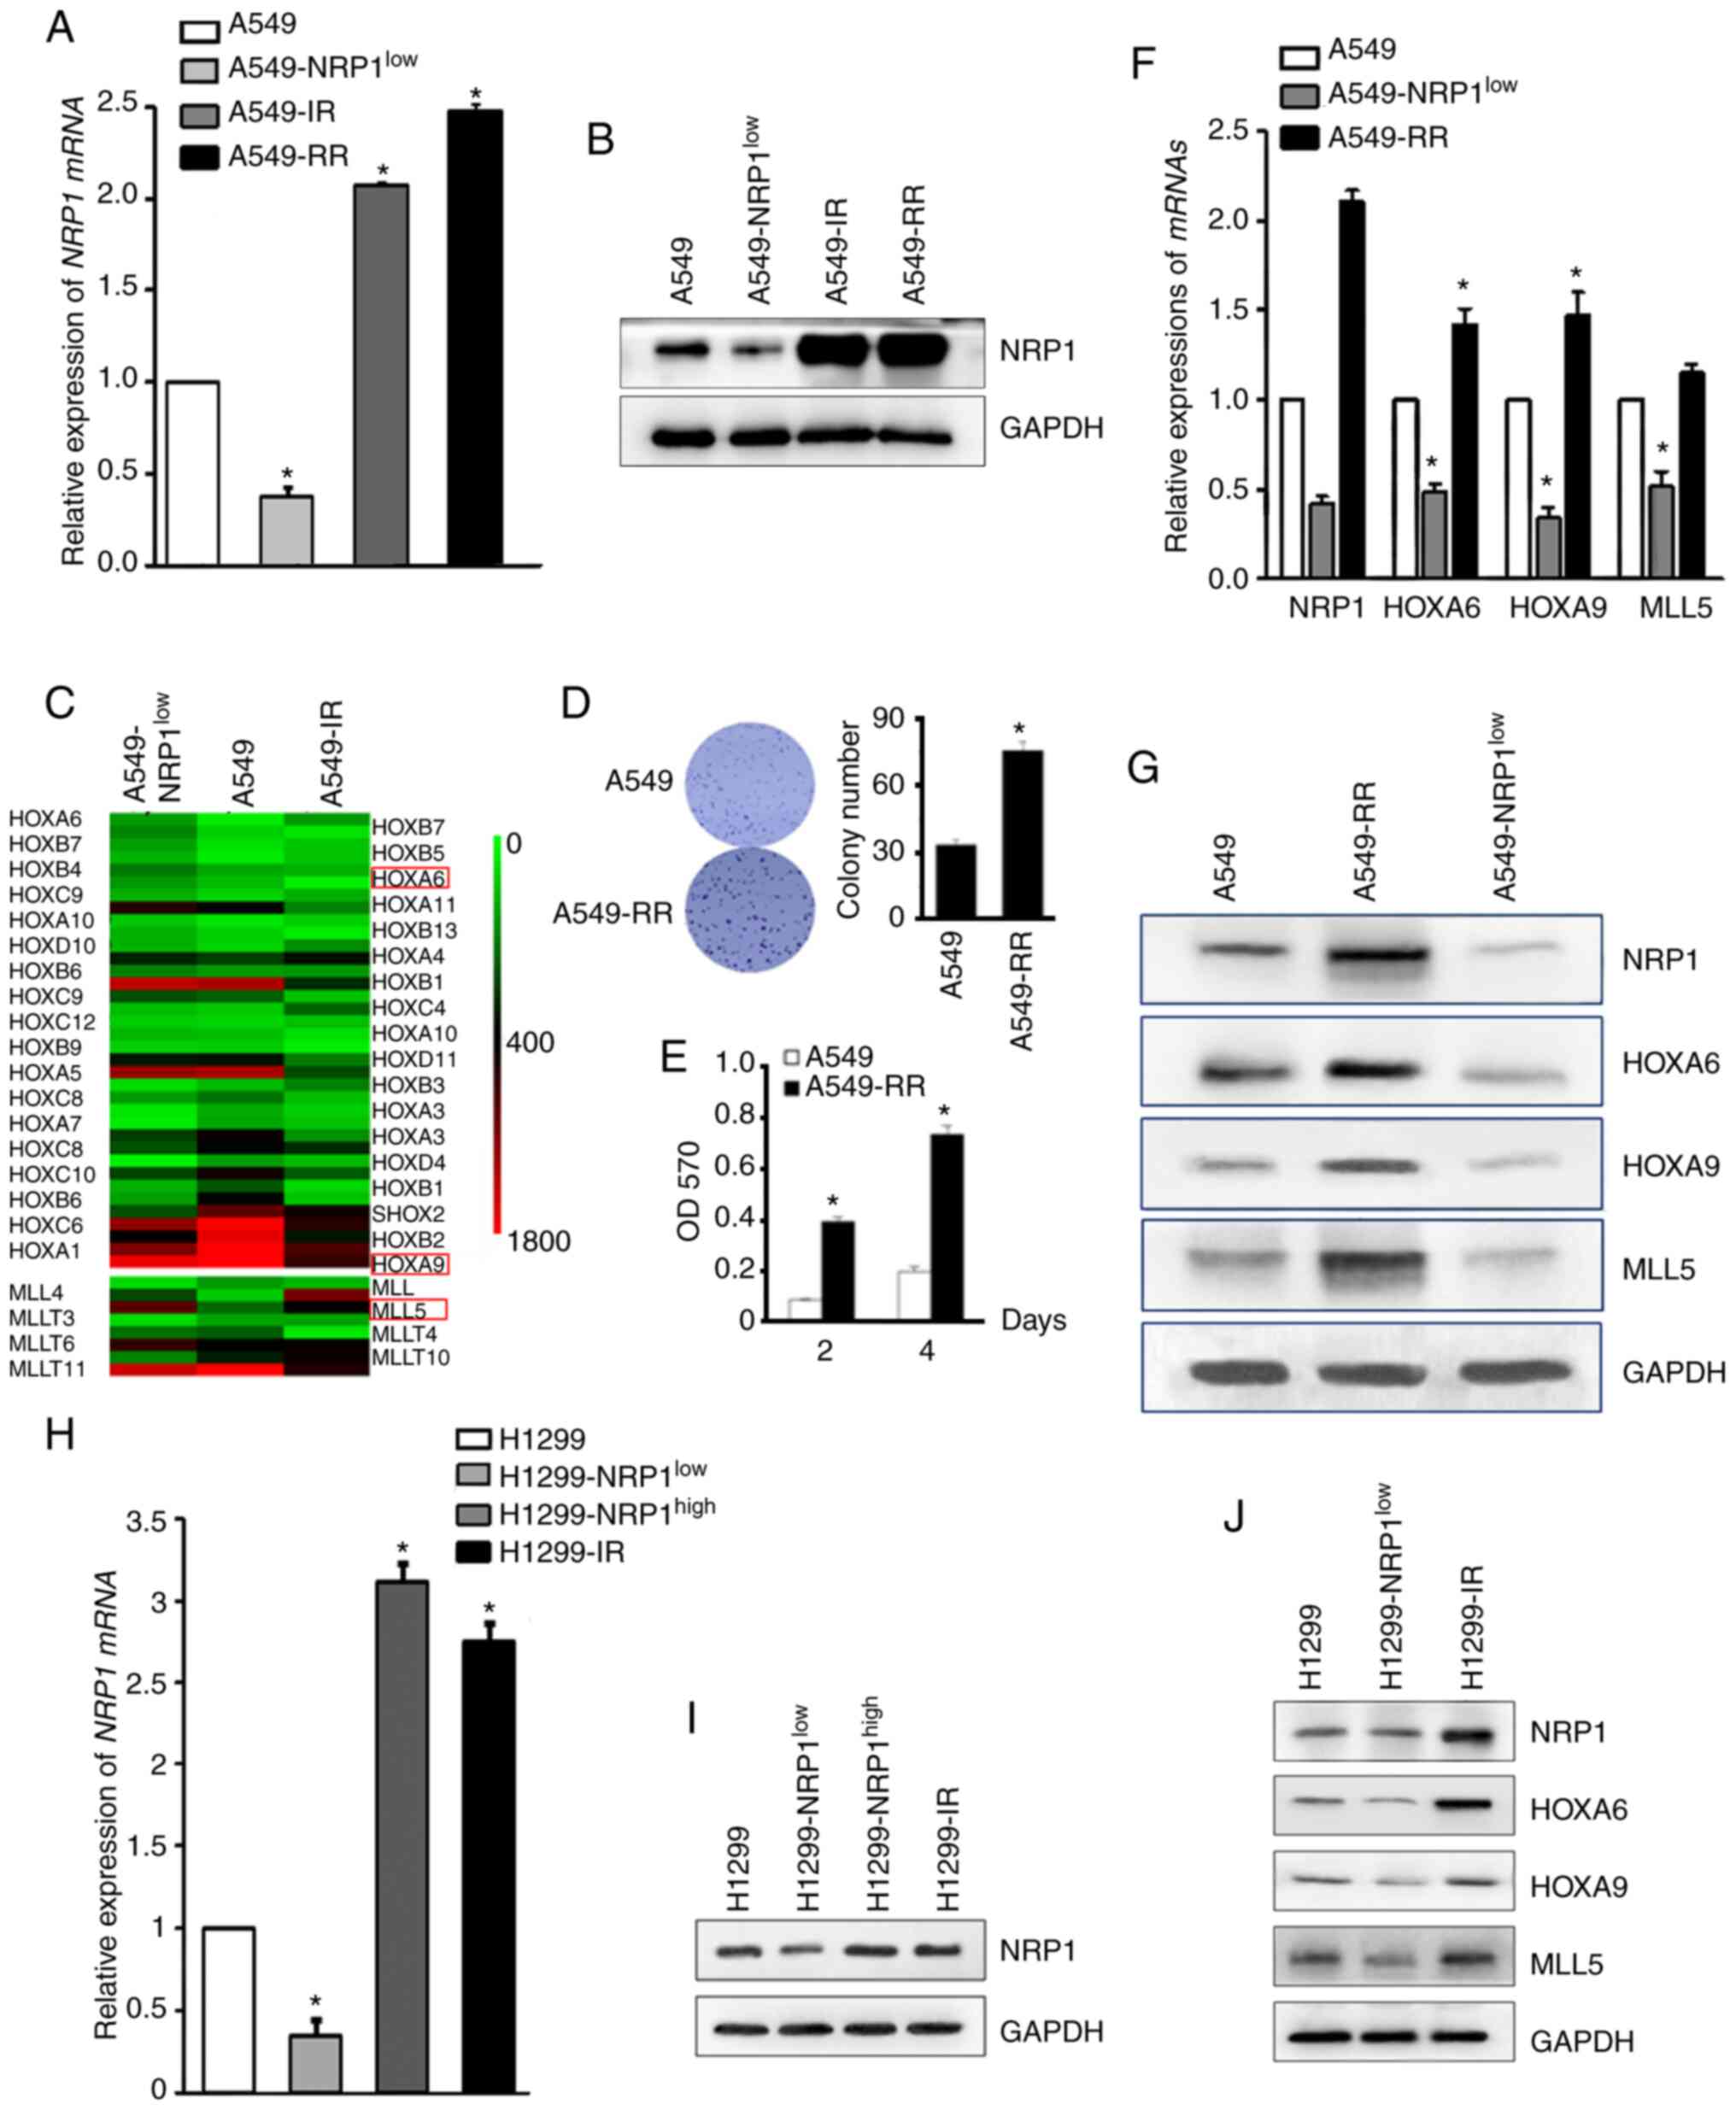
To identify the key genes downstream of NRP1, NRP1
was knocked down in A549 cells (A549-NRP1low) or A549
cells irradiated with 10 Gy (A549-IR) (Fig. 1A and B) and then the two
aforementioned types of cells and parental cells were evaluated
using microarray analysis. All HOX and MLL genes were identified
(Fig. 1C). Based on the literature
search and verification results, HOXA6, HOXA9 and MLL5 were
selected to investigate as the key genes associated with NRP1 and
irradiation. To confirm these results, a radiation-resistant cell
model (A549-RR) was established and on which to perform a colony
formation and MTT assay to verify the success of the model
(Fig. 1D and E). qPCR and western
blotting results showed that the expression of NRP1 in
radiation-resistant A549 cells was higher compared with that in
wild-type A549 and similar to that in A549-IR. The mRNA and protein
expression levels of these four genes are shown in Fig. 1F and G. Preliminary results showed
that HOXA6, HOXA9 and MLL5 increased with the increase of NRP1
caused by irradiation and decreased with the interference of NRP1.
Western blotting was used to analyse the expression of HOXA6, HOXA9
and MLL5 in H1299 cells with knocked down or overexpressed NRP1, or
cells treated with 10 Gy irradiation (Fig. 1H, I and J). The results were similar
to that in A549 cells, indicating that ionizing radiation can
promote the expression of NRP1 and then increase the expression of
HOXA6, HOXA9 and MLL5.
Relationships between NRP1 and its
downstream genes
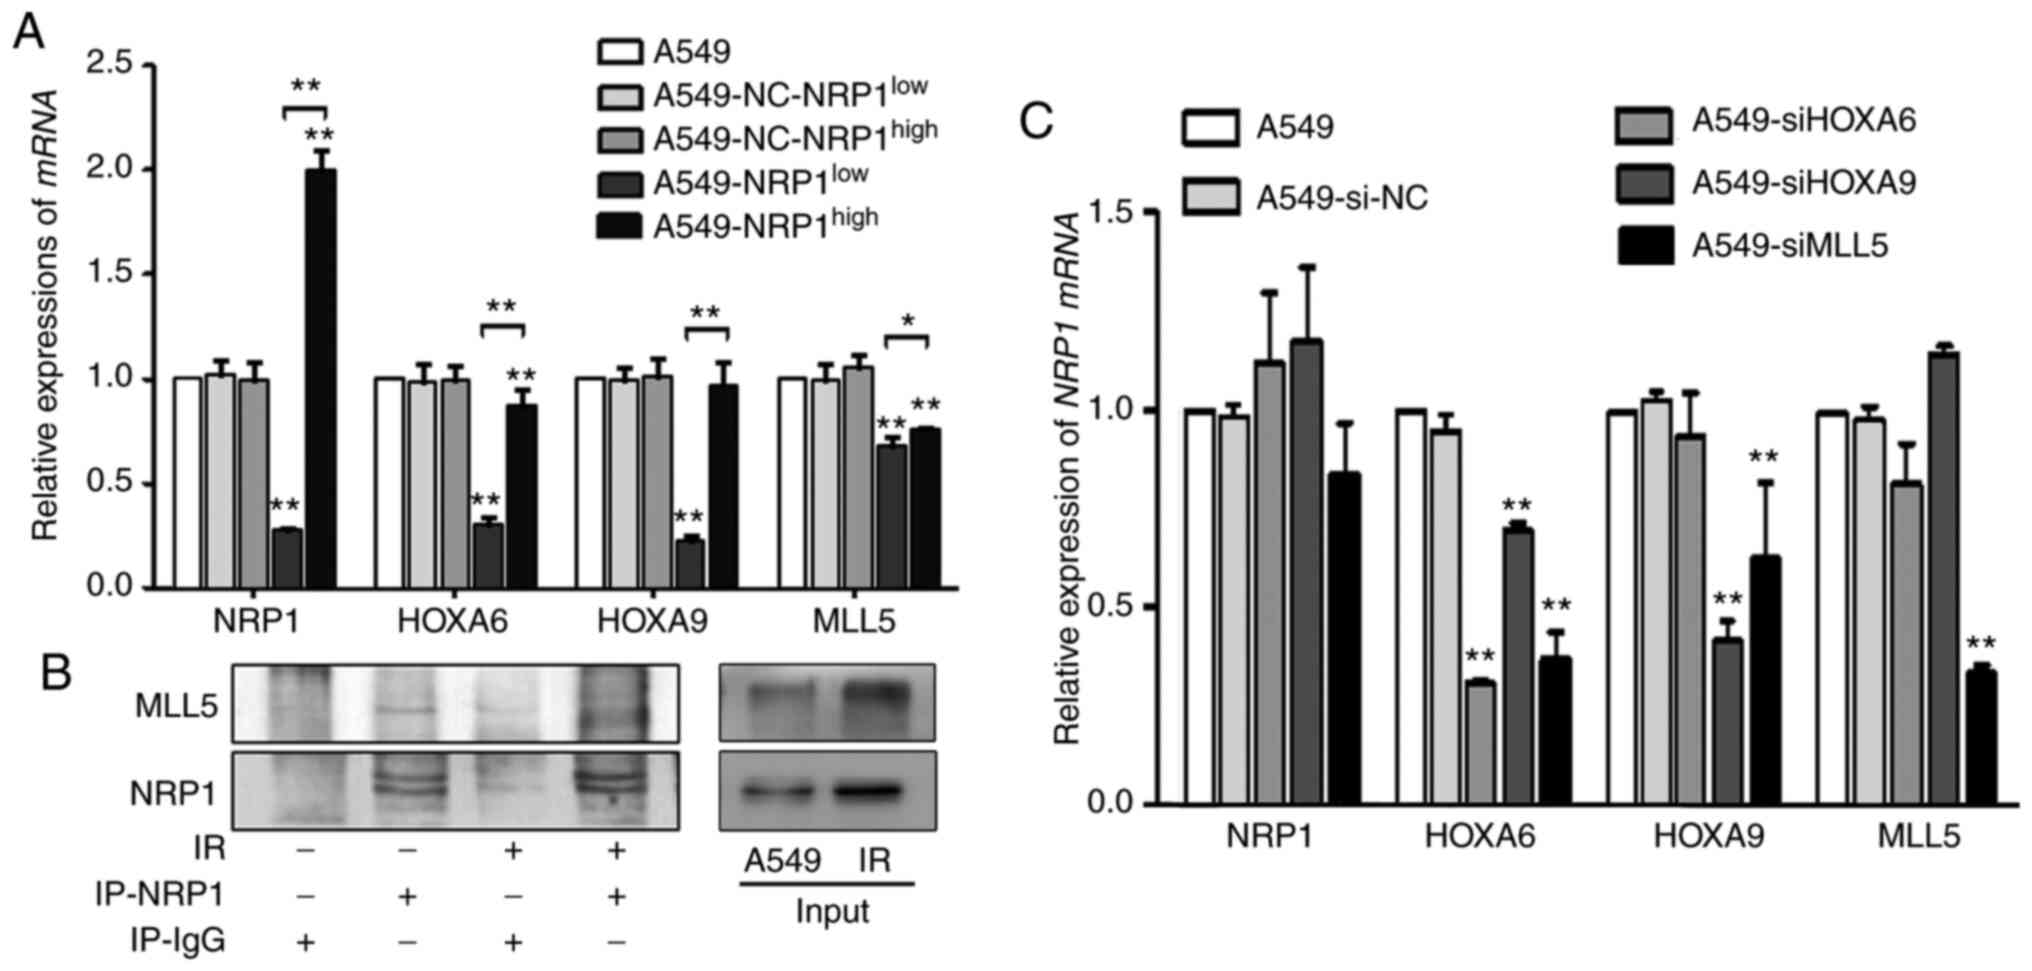
A stable transfection assay was performed to change
the expression NRP1 to determine the interrelationships between
HOXA6, HOXA9, MLL5 and NRP1. Compared with the A549, although the
expression levels of these genes were not increased in
A549-NRP1high cells, they did decrease in
A549-NRP1low cells (Fig.
2A). The immunoprecipitation results showed that irradiation
not only upregulated NRP1 expression but also MLL5 due to their
interaction (Fig. 2B). To study the
interrelationships between the downstream genes and NRP1,
siRNAs were used to interfere with HOXA6, HOXA9 and
MLL5 expression. Compared with the A549, the mRNA expression
of NRP1 showed no significant change in any of the RNA
interference (RNAi) groups, and MLL5 mRNA expression did not
significantly change in the HOXA6 and HOXA9 RNAi
groups. However, after interference with HOXA6, none of the
genes were changed; after interference with HOXA9, only
HOXA6 was significantly reduced; after interference with
MLL5, HOXA6 and HOXA9 expression was significantly
reduced. (Fig. 2C). These results
suggested that the regulatory relationship among these genes may
follow the order of NRP1-MLL5-HOXA9-HOXA6.
Effect of ionizing radiation on NRP1
and its downstream genes
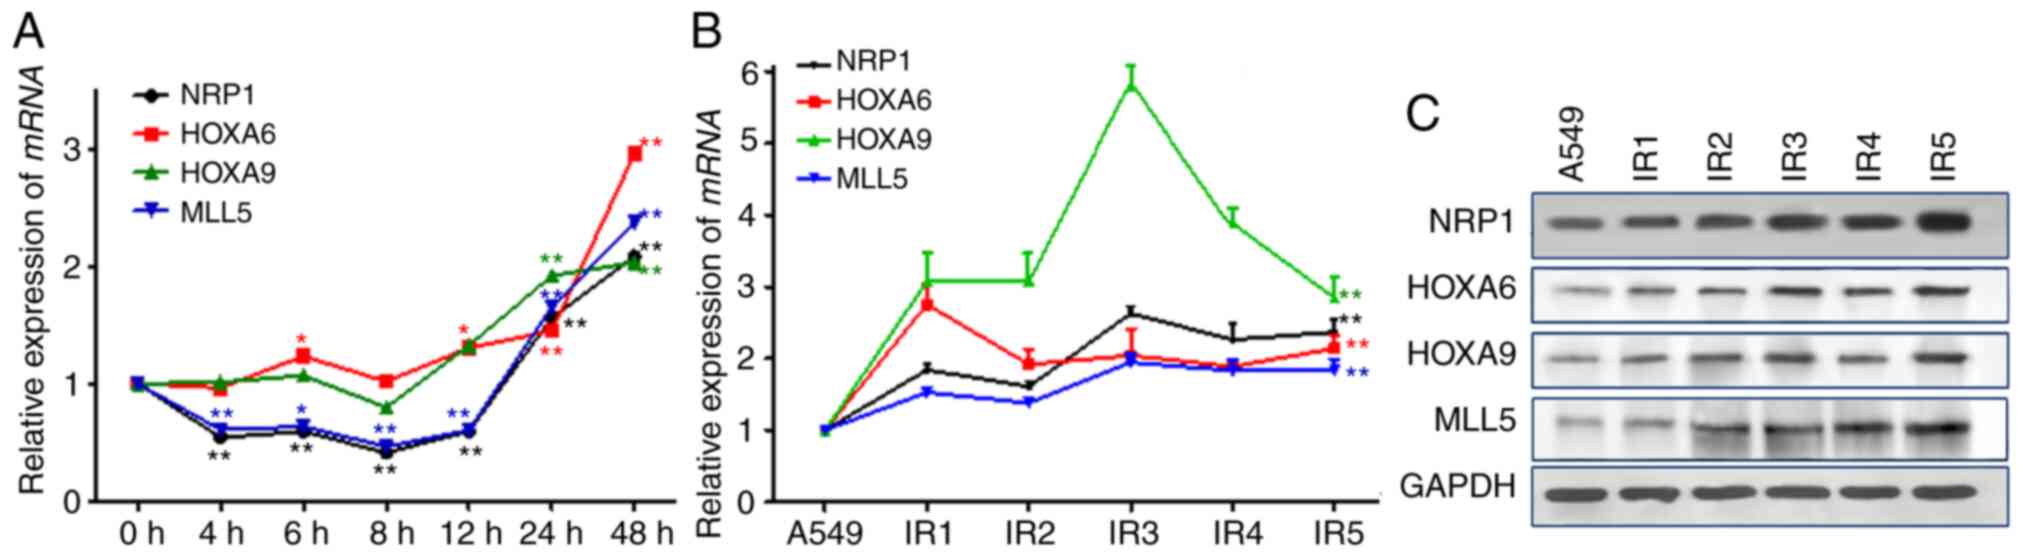
After 10 Gy X-ray irradiation, the mRNA and protein
expression levels of the four genes in were determined in A549
cells. The results showed (Fig. 3A)
that the changes in MLL5 mRNA expression were associated
with those of NRP1, whose expression initially decreased after
irradiation but then gradually increased and was twice the original
level at 48 h post-irradiation. There were no significant changes
in the mRNA and protein expression levels of HOXA9, but HOXA6 and
HOXA9 began to rise 12 h after irradiation. With the
post-irradiation time and total dose increased during the A549-RR
modelling process, the mRNA and protein expression levels of NRP1,
MLL5, HOXA6 and HOXA9 increased significantly (Fig. 3B and C).
Effects of different times and doses
of irradiation on the mRNA and protein expression levels of NRP1
and its downstream genes in A549 cells
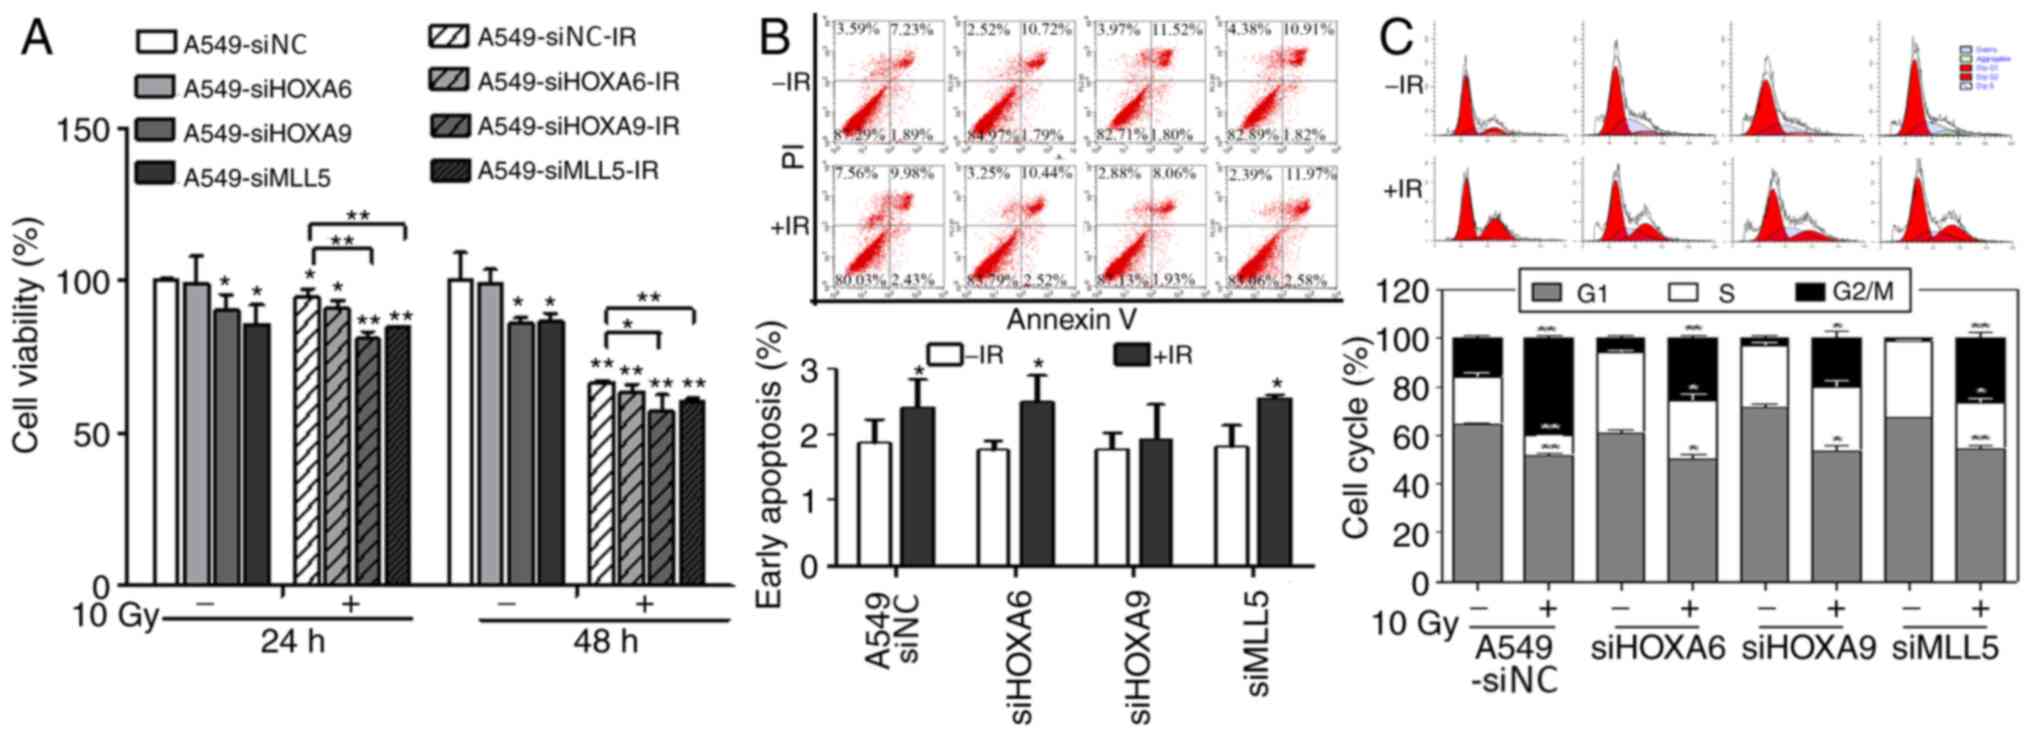
Cell viability in each interference group was
evaluated using an MTT assay after 10 Gy X-ray irradiation
(Fig. 4A). After transfection, cell
viability was reduced in the HOXA9 and MLL5 interference groups but
showed no obvious change in the HOXA6 group. After irradiation,
cell viability in each group decreased and was lower in the HOXA9
and MLL5 groups compared with the other groups. Apoptosis was
detected using flow cytometry (Fig.
4B). siRNA-mediated interference with HOXA6, HOXA9 and MLL5
gene expression did not significantly affect the apoptosis of A549
cells. However, apoptosis was significantly increased after
irradiation at 10 Gy, whereas no significant change was seen in the
HOXA9 interference group. The cell cycle distribution, as shown by
flow cytometry, demonstrated that transfection significantly
decreased the percentage of cells in G2/M phase and
increased the percentage of cells in S phase. After irradiation at
10 Gy, the percentage of cells in G2/M phase
significantly increased and the percentage of cells in
G1 phase decreased in each interference group compared
with that of the control group. However, the percentage of cells in
S phase did not change in the siHOXA9 group but was significantly
decreased in the other groups (Fig.
4C).
Correlations between NRP1 and the
selected genes in clinical samples
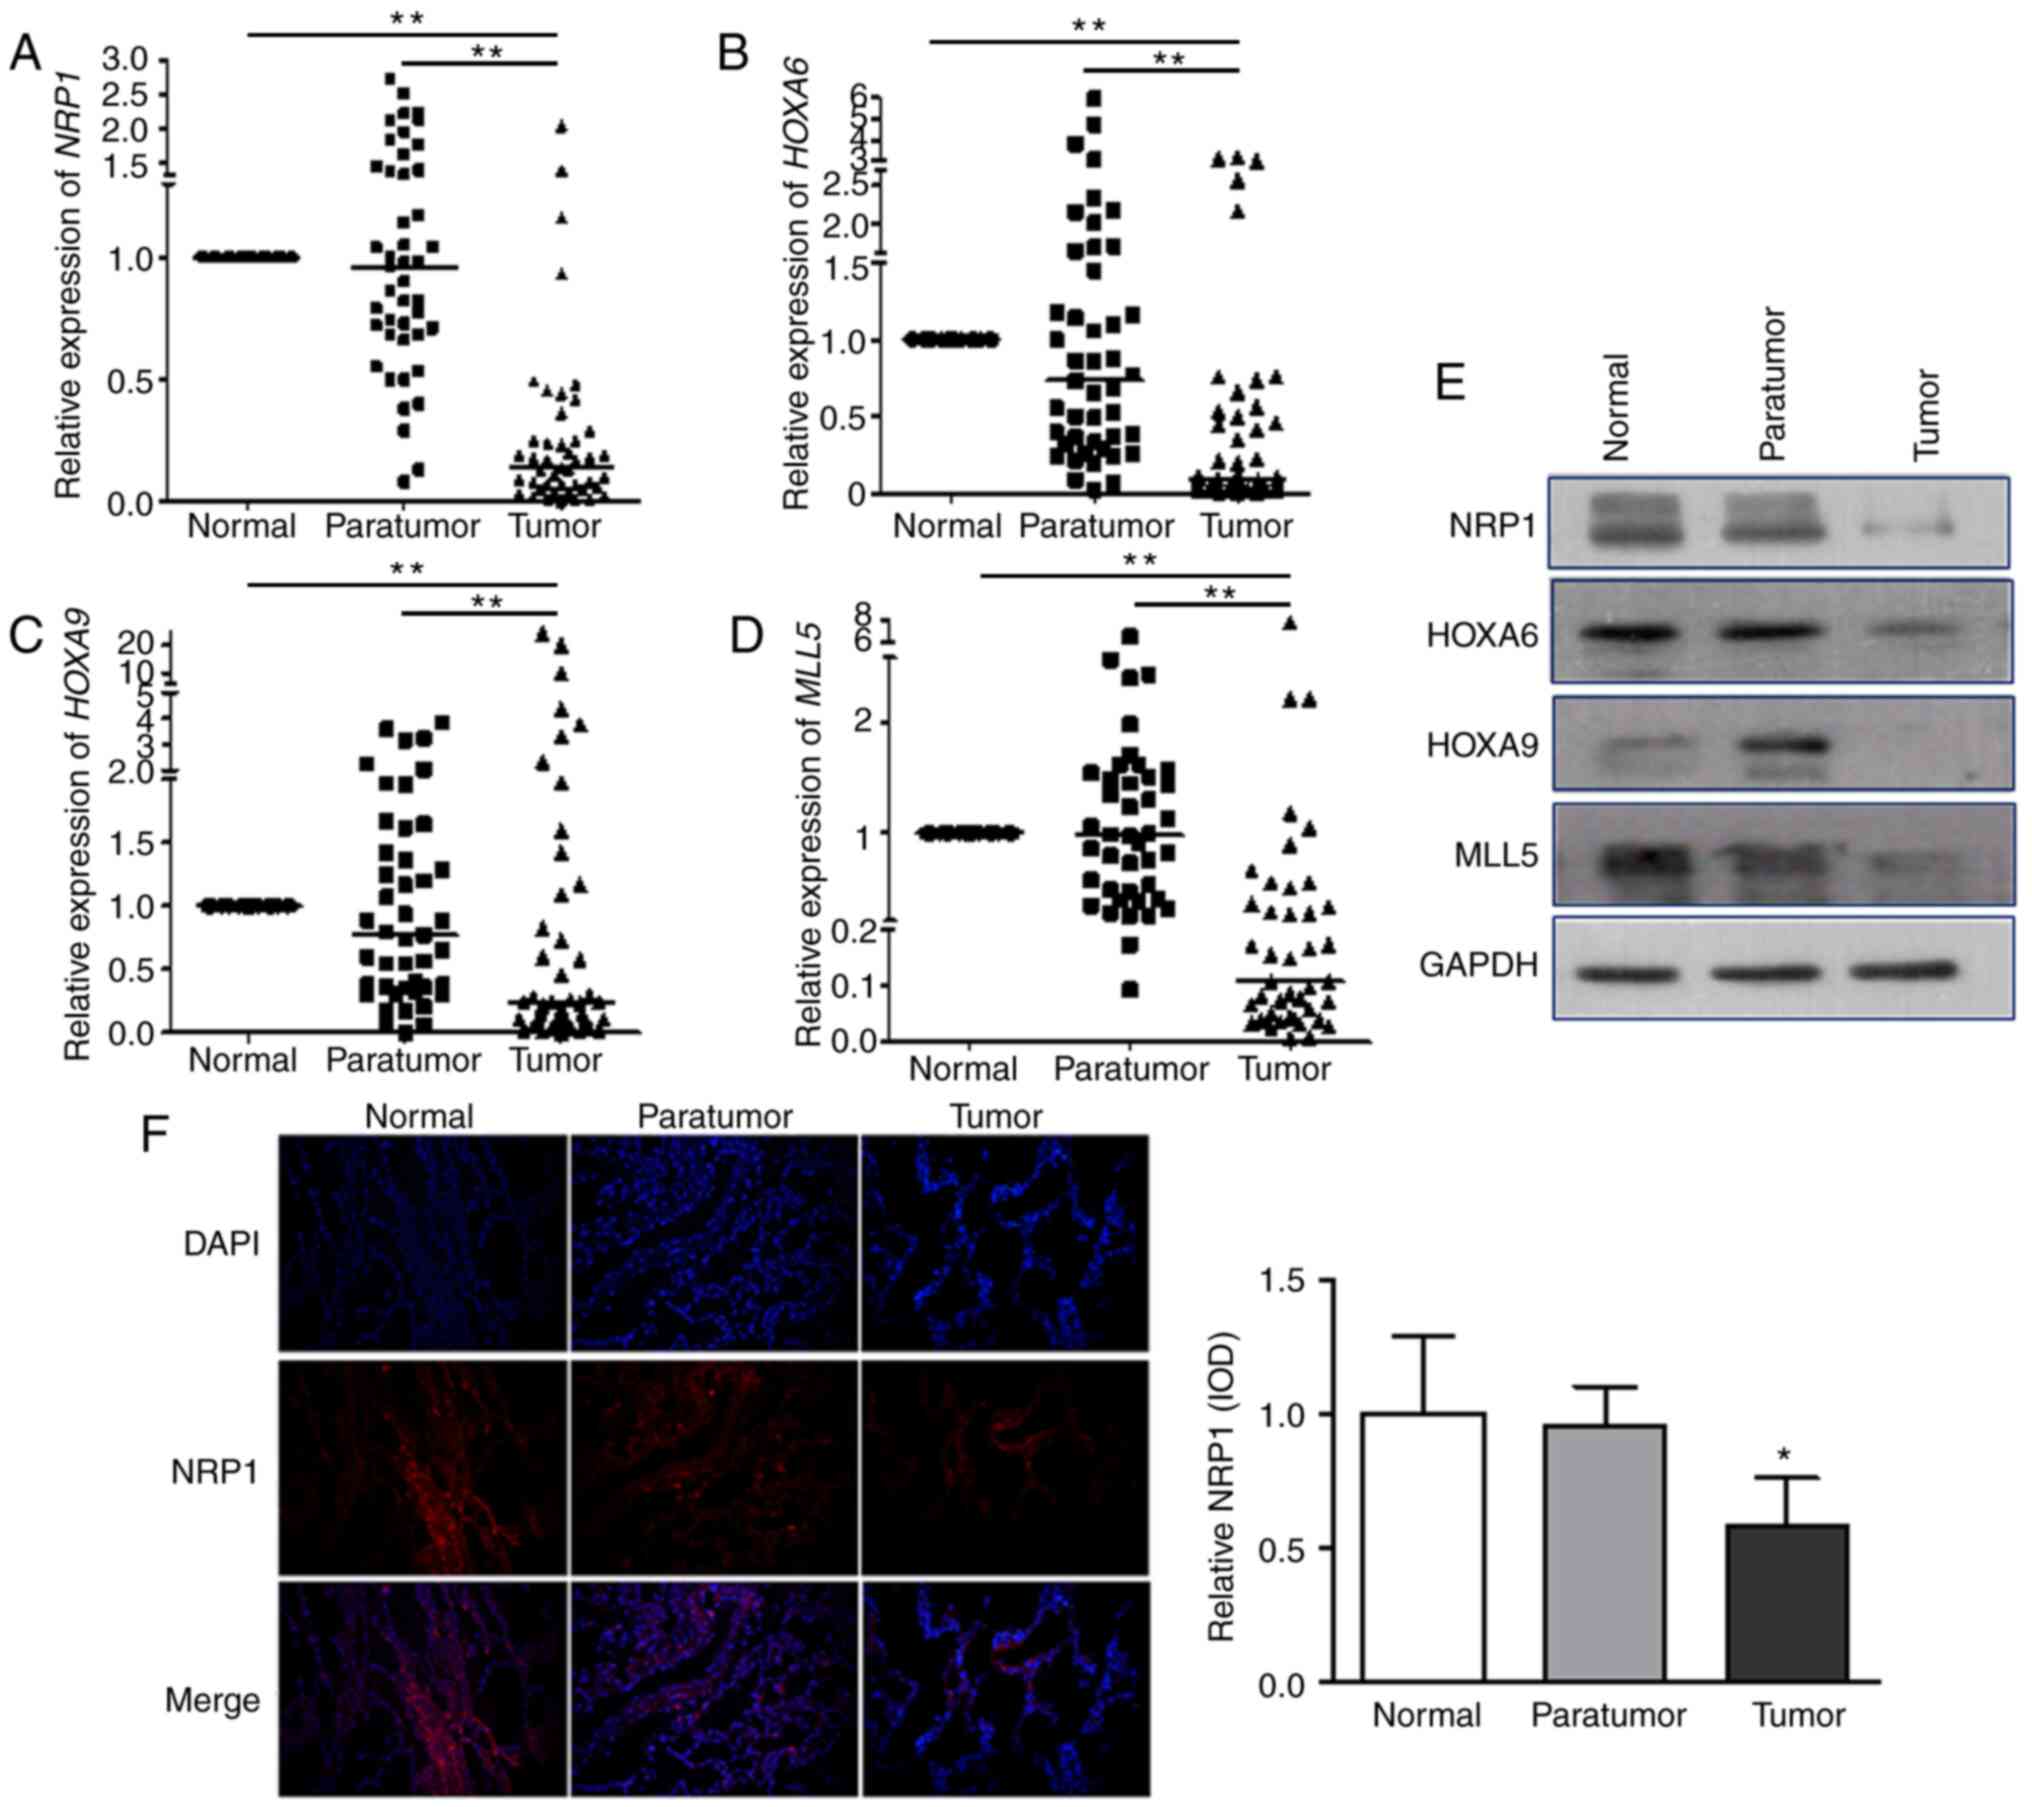
qPCR was used to examine the mRNA levels of
NRP1-MLL5-HOXA6/HOXA9-related genes in 45 patients with NSCLC (each
sample included normal, adjacent non-cancer tissues and tumour
tissues). The results show that median NRP1 expression level
was 0.96 (quartiles: 0.68, 1.41) in the adjacent non-cancer tissues
compared with that in normal lung tissues and was 0.14 (0.06, 0.27)
in tumour tissues. The corresponding median HOXA6 expression
levels were 0.73 (0.32, 1.55) and 0.10 (0.04, 0.52). The
corresponding median HOXA9 expression levels were 0.77
(0.35, 1.52) and 0.24 (0.09, 0.13), and those of MLL5 were
0.95 (0.44, 1.50) and 0.10 (0.04, 0.34). The expression level of
each of the four genes in tumour tissues was significantly lower
(P<0.001) compared with that in normal and adjacent non-cancer
tissues (Fig. 5A-D). Western
blotting was carried out to evaluate the protein expression of
these four mediators (Fig. 5E) and
the results were similar to those observed for mRNA expression that
the four proteins were lower in tumour tissues compared with in
normal and adjacent non-cancer tissues. Immunohistochemical
staining was used to detect NRP1 protein expression in clinical
tissues, and the results showed that NRP1 was significantly lower
in tumour tissues compared with that in normal and adjacent
non-cancer tissues (Fig. 5F). In
conclusion, the expression level of NRP1, MLL5, HOXA6 and HOXA9 in
tumour tissues was significantly lower compared with that in normal
tissues and adjacent tissues.
Correlation analysis was performed according to age,
sex, clinical stage, differentiation and pathological
classification (Tables I and
II), and the results showed that
NRP1 expression was significantly lower in squamous cell carcinoma
compared with adenocarcinoma (P<0.01) and that patients with
high expression of NRP1 and MLL5 were more likely to have lymph
node metastasis compared with patients with low expression of NRP1
and MLL5 (P<0.05). The expression levels of these genes in
para-cancerous tissues and of other genes in tumour tissues were
not significantly correlated with clinicopathological
characteristics.
 | Table I.Expression of NRP1 and the patient
clinicopathological characteristics. |
Table I.
Expression of NRP1 and the patient
clinicopathological characteristics.
| Characteristic | Value, n | NP-NRP1, median
(P25, P75) | P-value | NT-NRP1, median
(P25, P75) | P-value |
|---|
| Age, years |
|
| 0.466a |
| 0.945 |
|
<60 | 27 | 0.98 (0.73,
1.43) |
| 0.14 (0.07,
0.25) |
|
|
≥60 | 18 | 0.89 (0.54,
1.48) |
| 0.15 (0.04,
0.44) |
|
| Sex |
|
| 0.715a |
| 0.825 |
|
Male | 31 | 0.98 (0.72,
1.31) |
| 0.13 (0.07,
0.29) |
|
|
Female | 14 | 0.80 (0.63,
1.84) |
| 0.20 (0.03,
0.60) |
|
| Histological
subtype |
|
| 0.404a |
| 0.008a,b |
|
Squamous cell carcinoma | 22 | 0.84 (0.52,
1.49) |
| 0.08 (0.04,
1.49) |
|
|
Adenocarcinoma | 23 | 1.00 (0.73,
1.43) |
| 0.24 (0.13,
0.49) |
|
|
Differentiation |
|
| 0.378 |
| 0.378 |
|
Low | 13 | 0.90 (0.74,
1.20) |
| 0.13 (0.02,
0.37) |
|
|
Middle | 31 | 0.96 (0.55,
1.75) |
| 0.17 (0.07,
0.36) |
|
|
High | 1 | 2.22c |
| 0.06 |
|
| Lymph node
metastasis |
|
| 0.250a |
| 0.041b |
|
Positive | 26 | 0.88 (0.70,
1.99) |
| 0.18 (0.08,
0.42) |
|
|
Negative | 19 | 0.98 (0.55,
1.17) |
| 0.08 (0.03,
0.19) |
|
| Clinical stage |
|
| 0.541a |
| 0.083 |
| I | 19 | 0.98 (0.55,
1.17) |
| 0.08 (0.03,
0.19) |
|
| II | 15 | 1.04 (0.66,
1.95) |
| 0.17 (0.07,
0.29) |
|
|
III | 11 | 0.86 (0.72,
2.11) |
| 0.25 (0.13,
0.49) |
|
| Table II.Expression of HOXA6, HOXA9 and MLL5
with the clinicopathological characteristics. |
Table II.
Expression of HOXA6, HOXA9 and MLL5
with the clinicopathological characteristics.
|
Characteristics | Value, n | NP-HOXA6, median
(P25, P75) | P-value | NT-HOXA6, median
(P25, P75) | P-value | NP-HOXA9, median
(P25, P75) | P-value | NT-HOXA9, median
(P25, P75) | P-value | NP-MLL5, median
(P25, P75) | P-value | NT-MLL5, median
(P25, P75) | P-value |
|---|
| Age, years |
|
| 0.578 |
| 0.445 |
| 0.755a |
| 0.982 |
| 0.369a |
| 0.647 |
|
<60 | 27 | 0.86 |
| 0.10 |
| 0.79 |
| 0.24 |
| 0.92 |
| 0.11 |
|
|
|
| (0.33, 1.45) |
| (0.02, 0.46) |
| (0.37, 1.36) |
| (0.10, 0.73) |
| (0.43, 1.56) |
| (0.05, 0.31) |
|
|
≥60 | 18 | 0.53 |
| 0.09 |
| 0.70 |
| 0.20 |
| 1.06 |
| 0.14 |
|
|
|
| (0.29, 1.69) |
| (0.04, 0.61) |
| (0.28, 1.96) |
| (0.07, 1.90) |
| (0.44, 1.50) |
| (0.04, 0.71) |
|
| Sex |
|
| 0.616a |
| 0.750 |
| 0.371a |
| 0.186 |
| 0.258a |
| 0.393 |
|
Male | 31 | 0.77 |
| 0.09 |
| 0.88 |
| 0.24 |
| 0.85 |
| 0.16 |
|
|
|
| (0.33, 1.70) |
| (0.03, 0.67) |
| (0.37, 1.62) |
| (0.10, 1.98) |
| (0.43, 1.47) |
| (0.05, 0.35) |
|
|
Female | 14 | 0.54 |
| 0.08 |
| 0.39 |
| 0.16 |
| 0.15 |
| 0.08 |
|
|
|
| (0.25, 1.23) |
| (0.04, 0.29) |
| (0.28, 1.43) |
| (0.04, 0.62) |
| (0.45, 1.62) |
| (0.04, 0.54) |
|
| Histological
subtype |
|
| 0.660a |
| 0.496 |
| 0.280a |
| 0.650 |
| 0.581a |
| 0.092 |
|
Squamous cell | 22 | 0.78 |
| 0.07 |
| 0.91 |
| 0.24 |
| 0.98 |
| 0.08 |
|
|
carcinoma |
| (0.26, 1.52) |
| (0.04, 0.42) |
| (0.34, 1.760 |
| (0.10, 0.97) |
| (0.38, 1.51) |
| (0.04, 0.24) |
|
|
Adenocarcinoma | 23 | 0.73 |
| 0.10 |
| 0.74 |
| 0.21 |
| 0.98 |
| 0.16 |
|
|
|
| (0.39, 1.64) |
| (0.03, 0.76) |
| (0.36, 1.36) |
| (0.04, 1.17) |
| (0.52, 1.56) |
| (0.07, 0.75) |
|
|
Differentiation |
|
| 0.682a |
| 0.264 |
| 0.497a |
| 0.482 |
| 0.717a |
| 0.284 |
|
Low | 13 | 1.10 |
| 0.05 |
| 1.25 |
| 0.11 |
| 1.55 |
| 0.07 |
|
|
|
| (0.44, 2.16) |
| (0.02, 0.15) |
| (0.63, 1.63) |
| (0.04, 0.38) |
| (0.73, 1.71) |
| (0.04, 0.17) |
|
|
Middle | 31 | 0.66 |
| 0.12 |
| 0.54 |
| 0.26 |
| 0.87 |
| 0.16 |
|
|
|
| (0.26, 1.17) |
| (0.04, 0.66) |
| (0.31, 1.28) |
| (0.09, 1.42) |
| (0.37, 1.38) |
| (0.05, 0.51) |
|
|
High | 1 |
|
|
|
|
|
|
|
|
|
|
|
|
| Lymph node
metastasis |
|
| 0.455a |
| 0.662 |
| 0.759a |
| 0.872 |
| 0.7833 |
| 0.027b |
|
Positive | 26 | 0.75 |
| 0.11 |
| 0.69 |
| 0.24 |
| 1.01 |
| 0.17 |
|
|
|
| (0.36, 1.82) |
| (0.03, 1.38) |
| (0.36, 1.38) |
| (0.09, 0.63) |
| (0.54, 1.57) |
| (0.08, 0.46) |
|
|
Negative | 19 | 0.73 |
| 0.07 |
| 0.88 |
| 0.23 |
| 0.91 |
| 0.05 |
|
|
|
| (0.26, 1.17) |
| (0.04, 0.56) |
| (0.32, 1.68) |
| (0.08, 1.60) |
| (0.37, 1.47) |
| (0.03, 0.33) |
|
| Clinical stage |
|
| 0.726a |
| 0.390 |
| 0.692a |
| 0.547 |
| 0.944 |
| 0.079 |
| I | 19 | 0.73 |
| 0.07 |
| 0.88 |
| 0.23 |
| 0.91 |
| 0.05 |
|
|
|
| (0.26, 1.17) |
| (0.04, 0.56) |
| (0.32, 1.68) |
| (0.08, 1.60) |
| (0.37, 1.47) |
| (0.03, 0.33) |
|
| II | 15 | 0.39 |
| 0.05 |
| 0.54 |
| 0.24 |
| 0.88 |
| 0.17 |
|
|
|
| (0.33, 1.70) |
| (0.02, 0.46) |
| (0.30, 1.17) |
| (0.05, 0.46) |
| (0.52, 1.50) |
| (0.07, 0.41) |
|
| II | 11 | 0.86 |
| 0.20 |
| 0.89 |
| 0.30 |
| 1.25 |
| 0.19 |
|
|
|
| (0.53, 2.17) |
| (0.04, 0.76) |
| (0.37, 1.62) |
| (0.11, 1.09) |
| (0.67, 1.62) |
| (0.08, 0.54) |
|
Correlation analysis between NRP1 and HOXA6, HOXA9
or MLL5 in 45 sets of samples (Table
III) showed that HOXA6, HOXA9 and MLL5 were correlated with
NRP1 particularly MLL5 (R=0.792), which was strongly correlated
with NRP1 in both para-cancerous and tumour tissues in patients
with different clinical classifications.
| Table III.Correlation coefficient values
between NRP1 and MLL5-HOXA6/HOXA9. |
Table III.
Correlation coefficient values
between NRP1 and MLL5-HOXA6/HOXA9.
|
|
| Correlation
coefficient |
|---|
|
|
|
|
|---|
|
Characteristics | Value, n | NP-HOXA6 | NT-HOX A6 | NP-HOXA9 | NT-HOXA9 | NP-MLL5 | NT-MLL5 |
|---|
| All dates |
| 0.760 | 0.359 | 0.477 | 0.434 | 0.734 | 0.792 |
| Age, years |
|
<60 | 27 | 0.689 | 0.308 | 0.499 | 0.291 | 0.636 | 0.642 |
|
≥60 | 18 | 0.860 | 0.486 | 0.377 | 0.651 | 0.853 | 0.917 |
| Sex |
|
Male | 31 | 0.749 | 0.454 | 0.500 | 0.436 | 0.729 | 0.839 |
|
Female | 14 | 0.780 | 0.125 | 0.495 | 0.459 | 0.802 | 0.811 |
| Histological
subtype |
|
Squamous cell carcinoma | 22 | 0.915 | 0.352 | 0.647 | 0.401 | 0.798 | 0.731 |
|
Adenocarcinoma | 23 | 0.481 | 0.458 | 0.328 | 0.602 | 0.650 | 0.775 |
|
Differentiation |
|
Low | 13 | 0.709 | 0.088 | 0.462 | 0.319 | 0.773 | 0.645 |
|
Middle | 31 | 0.788 | 0.480 | 0.523 | 0.458 | 0.804 | 0.875 |
|
High | 1 |
|
|
|
|
|
|
| Lymph node
metastasis |
|
Positive | 26 | 0.721 | 0.319 | 0.515 | 0.207 | 0.630 | 0.762 |
|
Negative | 19 | 0.774 | 0.463 | 0.393 | 0.804 | 0.860 | 0.659 |
| Clinical stage |
| I | 19 | 0.774 | 0.463 | 0.393 | 0.804 | 0.860 | 0.659 |
| II | 15 | 0.814 | 0.254 | 0.693 | 0.096 | 0.710 | 0.859 |
|
III | 11 | 0.582 | 0.273 | 0.245 | 0.327 | 0.503 | 0.491 |
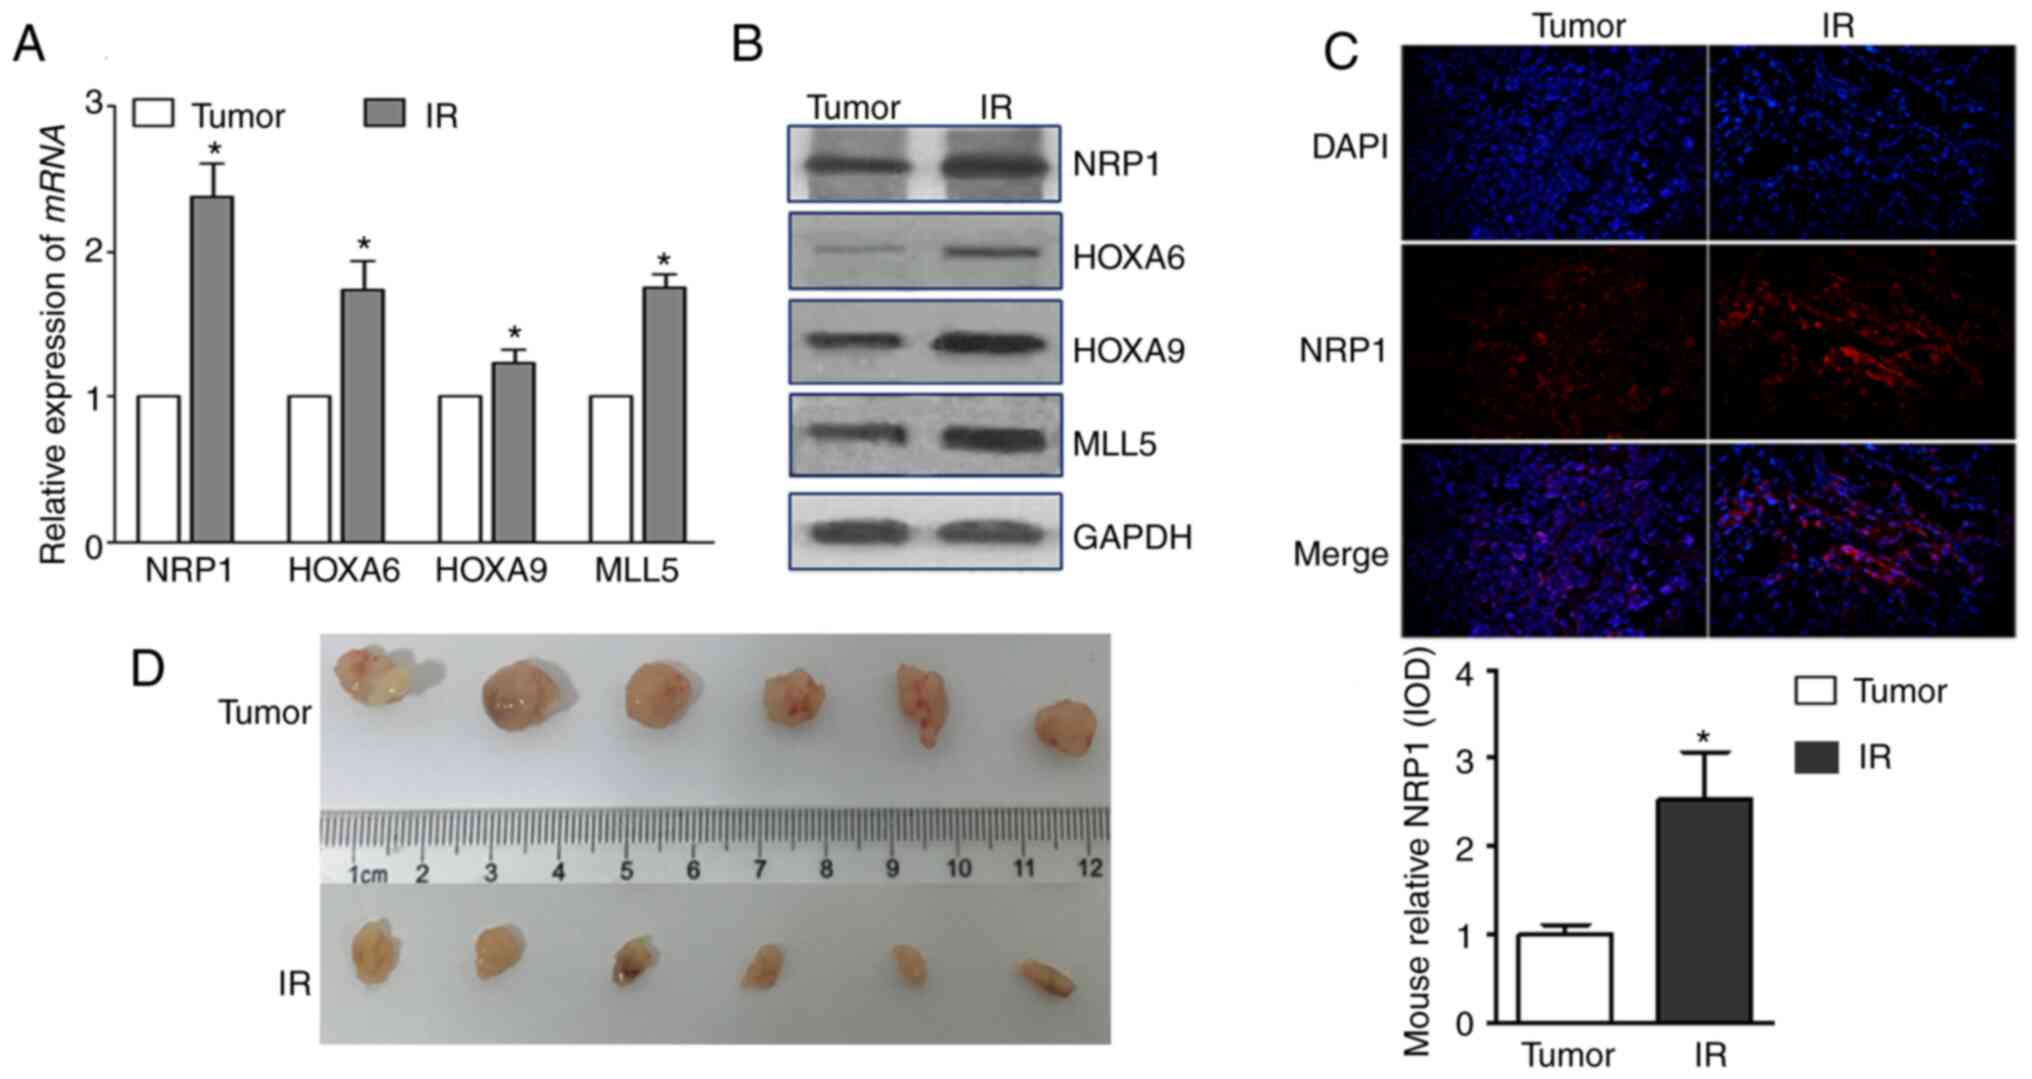
Effect of radiation on NRP1 and its
downstream genes in vivo
Take the tumor tissues of tumor-bearing mice 14 days
after irradiating the tumor site and detected their expressions.
The mRNA and protein expression levels of NRP1, HOXA6, HOXA9 and
MLL5 increased after irradiation, and the tumour volumes decreased
(Fig. 6A and B). The expression of
NRP1 in tumour tissues, detected using immunohistochemistry, also
significantly increased after irradiation.
Discussion
The majority of patients with NSCLC are unsuitable
for surgery when diagnosed and are mainly treated with
radiotherapy-based comprehensive treatment or radiotherapy alone.
The sensitivity of cells to ionizing radiation determines the
efficacy of radiotherapy, and the inherent radioresistant ability
of tumour cells further limits the use of radiotherapy (3). NRP1 can enhance the radiation
resistance of tumours (8,9,30,31).
Previous studies have shown that the expression of NRP1
significantly increases with increasing radiation dose. The
radiosensitivity of A549 cells overexpressing NRP1 is significantly
lower compared with that of cells with NRP1 interference, therefore
targeted inhibition of NRP1 increases the radiosensitivity of A549
cells (10,13). The present study aimed to investigate
how NRP1 enhanced radiation resistance.
To explore the interaction between NRP1 and its
downstream genes, the present study established an A549
radiation-resistant cell model with high expression of NRP1 and an
A549-NRP1low cell model with low expression of NRP1.
Through gene microarray screening and verification using qPCR, the
HOXA6, HOXA9 and MLL5 genes were selected as key downstream genes
of NRP1. The results showed that the expression levels of HOXA6,
HOXA9, and MLL5 were decreased after knockdown of NRP1 and
increased in radiation-resistant cells as well as in
NRP1-overexpressing cells. To explore this relationship, HOXA6,
HOXA9 and MLL5 expressions were interfered with. siMLL5 reduced
HOXA6 and HOXA9 expression, but when HOXA6 and HOXA9 were knocked
down MLL5 expression did not change. Similarly, siHOXA9
transfection downregulated HOXA6, but HOXA9 expression did not
change after siHOXA6 transfection. These results suggested that the
regulatory relationship among these genes may follow the order of
NRP1-MLL5-HOXA9-HOXA6.
To study the regulation of NRP1 and its downstream
genes by ionizing radiation, the genes were examined 48 h after
exposure. The expression of NRP1 and MLL5 initially decreased after
irradiation and then began to rise 24 h post irradiation. During
the course of establishing the radiation-resistant cell model, the
expression levels of each gene gradually increased with irradiation
time and cumulative dose.
Then, the effects of NRP1 and its downstream genes
on the radiation sensitivity of A549 cells was investigated. MTT
analysis showed that the viability significantly decreased after
HOXA9 or MLL5 interference, but no obvious change was observed
after HOXA6 interference. These results demonstrated that the HOXA9
and MLL5 genes have a major impact on cell proliferation. The
apoptosis rate was significantly increased after ionizing radiation
in the wild-type, HOXA6 interference and MLL5 interference groups,
but the apoptosis rate did not significantly change after HOXA9
interference. HOXA9 interference suppressed apoptosis induced by
ionizing radiation, which indicated that HOXA9 may be
radiation-sensitive.
Sensitivity to ionizing radiation is different in
each phase of the cell cycle; the radiosensitivity of cells in S
phase is lower compared with that of cells in G1 phase,
and the sensitivity of cells in G2/M phase is highest.
Ionizing radiation can significantly arrest cells in
G2/M phase (32,33). The results of the present study
showed that the percentage of G2/M phase cells was
significantly decreased after interference with HOXA6, HOXA9 and
MLL5 expression. After irradiation at 10 Gy, the percentages of
G2/M phase cells in these groups increased but were
significantly lower compared with that among wild-type A549 cells.
In addition, the percentage of cells in S phase decreased after
irradiation, but the percentage of S phase cells among
siHOXA9-treated cells did not change, which may be one of the
reasons for the increase in apoptosis after irradiation. The
specific molecular mechanism involved in this process requires
further research. In conclusion, NRP1 can affect radiation
resistance by positively regulating MLL5-HOXA6/HOXA9, and HOXA9 may
affect radiation sensitivity by inducing G2/M phase
arrest.
To study the relationships between NRP1, HOXA6,
HOXA9 and MLL5, the expression levels of these four genes in
normal, para-cancerous, and tumour tissues from 45 patients with
lung cancer were determined. The results showed that the mRNA and
protein expression levels of these four genes in tumour tissues
were significantly lower compared with those in normal and adjacent
tissues. Correlation analysis between gene expression and age, sex,
clinical stage, differentiation and pathological classification
showed that the expression of NRP1 in squamous cell carcinoma was
significantly lower compared with that in adenocarcinoma, patients
with relatively high expression of NRP1 and MLL5 were more prone to
lymph node metastasis compared with those with relatively low
expression, and the expression of HOXA6 and HOXA9 in tumour tissues
and NRP1, HOXA6, HOXA9 and MLL5 in para-cancerous tissues were not
significantly correlated with age, sex, clinical stage,
differentiation degree or pathological type. In correlation
analysis, coefficients with values close to 1 indicate strong
correlations. A R-value >0.7 indicates a strong correlation and
a R-value <0.4 indicates a weak correlation. Correlation
analysis of these four genes in para-cancerous and tumour tissues
showed that NRP1 was associated with the HOXA6, HOXA9 and MLL5
genes, especially with the HOXA6 and MLL5 genes in para-cancerous
tissues and with MLL5 in tumour tissues.
Most patients in the present study underwent
preoperative radiotherapy or chemotherapy, so collection of
histopathological specimens is limited. Therefore, the study used a
nude mouse tumour model to verify changes in the
NRP1-MLL5-HOXA6/HOXA9 pathway after radiotherapy. The mRNA and
protein expression levels of NRP1, MLL5, HOXA6 and HOXA9 were
increased after irradiation, which was consistent with the results
in A549 cells. It was hypothesised that the NRP1-MLL5-HOXA6/HOXA9
pathway plays an important role in lung adenocarcinoma A549 cells
both in vivo and in vitro.
In summary, NRP1 positively regulates the downstream
gene MLL5, thereby affecting the expression of HOXA6 and HOXA9 in
A549 cells in vitro. Ionizing radiation promotes gene
expression in the NRP1-MLL5-HOXA6/HOXA9 pathway in vitro and
in vivo. The expression levels of NRP1, HOXA6, HOXA9 and
MLL5 in patient tumour tissues were significantly lower compared
with those in normal and adjacent tissues. The expression level of
NRP1 in squamous cell carcinoma was lower compared with that in
adenocarcinoma, and patients with high NRP1 and MLL5 expression
levels were more prone to lymph node metastasis compared with those
with low NRP1 and MLL5 expression levels.
Acknowledgements
Not applicable.
Funding
The present study was supported by grants from the
National Natural Science Foundation of China (grant nos. 81573085
and 81872550).
Availability of data and materials
The datasets used and/or analysed during the current
study are available from the corresponding author on reasonable
request.
Authors' contributions
The study was designed by SJ and XC. Experiments
were performed by LS, YZ, XG, ZD and HS. WW, LC and RS analysed and
interpreted the data. LS drafted the manuscript. All authors read
and approved the final manuscript.
Ethics approval and consent to
participate
Each patient had signed an informed consent prior to
surgery and was informed that tissues would be used for scientific
research at the time of sample collection. The patient tissues
study was approved by The Ethics Committee of Jilin University
(approval no. 2017-169). The animal studies were approved by The
Ethics Committee of Jilin University (approval no. 2018-223).
Patient consent for publication
Not applicable.
Competing interests
The authors declare that they have no competing
interests.
References
|
1
|
Bray F, Ferlay J, Soerjomataram I, Siegel
RL, Torre LA and Jemal A: A Global cancer statistics 2018: GLOBOCAN
estimates of incidence and mortality worldwide for 36 cancers in
185 countries. CA Cancer J Clin. 68:394–424. 2018. View Article : Google Scholar : PubMed/NCBI
|
|
2
|
Mou J, Hu T, Wang Z, Chen W, Wang Y and
Zhang W: ATM gene polymorphisms are associated with poor prognosis
of non-small cell lung cancer receiving radiation therapy. Aging
(Albany NY). 12:7465–7479. 2020. View Article : Google Scholar : PubMed/NCBI
|
|
3
|
Zhou R, Xu T, Nguyen QN, Liu Y, Yang J,
Komaki R, Gomez DR and Liao Z: Radiation dose, local disease
progression, and overall survival in patients with inoperable
non-small cell lung cancer after concurrent chemoradiation therapy.
Int J Radiat Oncol Biol Phys. 100:452–461. 2018. View Article : Google Scholar : PubMed/NCBI
|
|
4
|
Nasarre C, Roth M, Jacob L, Roth L,
Koncina E, Thien A, Labourdette G, Poulet P, Hubert P, Crémel G, et
al: Peptide-based interference of the transmembrane domain of
neuropilin-1 inhibits glioma growth in vivo. Oncogene.
29:2381–2392. 2010. View Article : Google Scholar : PubMed/NCBI
|
|
5
|
Roth L, Nasarre C, Dirrig-Grosch S, Aunis
D, Crémel G, Hubert P and Bagnard D: Transmembrane domain
interactions control biological functions of neuropilin-1. Mol Biol
Cell. 19:646–654. 2008. View Article : Google Scholar : PubMed/NCBI
|
|
6
|
Nakamura F and Goshima Y: Structural and
functional relation of neuropilins. Adv Exp Med Biol. 515:55–69.
2002. View Article : Google Scholar : PubMed/NCBI
|
|
7
|
Giordano S, Corso S, Conrotto P, Artigiani
S, Gilestro G, Barberis D, Tamagnone L and Comoglio PM: The
semaphorin 4D receptor controls invasive growth by coupling with
Met. Nat Cell Biol. 4:720–724. 2002. View
Article : Google Scholar : PubMed/NCBI
|
|
8
|
Hong TM, Chen YL, Wu YY, Yuan A, Chao YC,
Chung YC, Wu MH, Yang SC, Pan SH, Shih JY, et al: Targeting
neuropilin 1 as an antitumor strategy in lung cancer. Clin Cancer
Res. 13:4759–4768. 2007. View Article : Google Scholar : PubMed/NCBI
|
|
9
|
Osada H, Tokunaga T, Nishi M, Hatanaka H,
Abe Y, Tsugu A, Kijima H, Yamazaki H, Ueyama Y and Nakamura M:
Overexpression of the neuropilin 1 (NRP1) gene correlated with poor
prognosis in human glioma. Anticancer Res. 24:547–552.
2004.PubMed/NCBI
|
|
10
|
Glinka Y, Mohammed N, Subramaniam V, Jothy
S and Prud'homme GJ: Neuropilin-1 is expressed by breast cancer
stem-like cells and is linked to NF-κB activation and tumor sphere
formation. Biochem Biophys Res Commun. 425:775–780. 2012.
View Article : Google Scholar : PubMed/NCBI
|
|
11
|
Dong JC, Gao H, Zuo SY, Zhang HQ, Zhao G,
Sun SL, Han HL, Jin LL, Shao LH, Wei W and Jin SZ: Neuropilin 1
expression correlates with the radio-resistance of human
non-small-cell lung cancer cells. J Cell Mol Med. 19:2286–2295.
2015. View Article : Google Scholar : PubMed/NCBI
|
|
12
|
Xiong K, Shao LH, Zhang HQ, Jin L, Wei W,
Dong Z, Zhu YQ, Wu N, Jin SZ and Xue LX: MicroRNA-9 functions as a
tumor suppressor and enhances radio-sensitivity in radio-resistant
A549 cells by targeting neuropilin 1. Oncol Lett. 15:2863–2870.
2018.PubMed/NCBI
|
|
13
|
Gorski DH and Walsh K: The role of
homeobox genes in vascular remodeling and angiogenesis. Circ Res.
87:865–872. 2000. View Article : Google Scholar : PubMed/NCBI
|
|
14
|
Kappen C: Developmental patterning as a
quantitative trait: Genetic modulation of the Hoxb6 mutant skeletal
phenotype. PLoS One. 11:e01460192016. View Article : Google Scholar : PubMed/NCBI
|
|
15
|
Denans N, Iimura T and Pourquie O: Hox
genes control vertebrate body elongation by collinear Wnt
repression. Elife. 4:e043792015. View Article : Google Scholar
|
|
16
|
Paço A, Aparecida de Bessa Garcia S,
Leitão Castro J, Costa-Pinto AR and Freitas R: Roles of the HOX
proteins in cancer invasion and metastasis. Cancers (Basel).
13:102020. View Article : Google Scholar
|
|
17
|
Morgan R, Simpson G, Gray S, Gillett C,
Tabi Z, Spicer J, Harrington KJ and Pandha HS: HOX transcription
factors are potential targets and markers in malignant
mesothelioma. BMC Cancer. 16:852016. View Article : Google Scholar : PubMed/NCBI
|
|
18
|
Steger J, Füller E, Garcia-Cuellar MP,
Hetzner K and Slany RK: Insulin-like growth factor 1 is a direct
HOXA9 target important for hematopoietic transformation. Leukemia.
29:901–908. 2015. View Article : Google Scholar : PubMed/NCBI
|
|
19
|
Larsen BM, Hrycaj SM, Newman M, Li Y and
Wellik DM: Mesenchymal Hox6 function is required for mouse
pancreatic endocrine cell differentiation. Development.
142:3859–3868. 2015. View Article : Google Scholar : PubMed/NCBI
|
|
20
|
Chiba N, Comaills V, Shiotani B, Takahashi
F, Shimada T, Tajima K, Winokur D, Hayashida T, Willers H, Brachtel
E, et al: Homeobox B9 induces epithelial-to-mesenchymal
transition-associated radioresistance by accelerating DNA damage
responses. Proc Natl Acad Sci USA. 109:2760–2765. 2012. View Article : Google Scholar : PubMed/NCBI
|
|
21
|
Slany RK: MLL fusion proteins and
transcriptional control. Biochim Biophys Acta Gene Regul Mech.
1863:1945032020. View Article : Google Scholar : PubMed/NCBI
|
|
22
|
Cheng F, Liu J, Zhou SH, Wang XN, Chew JF
and Deng LW: RNA interference against mixed lineage leukemia 5
resulted in cell cycle arrest. Int J Biochem Cell Biol.
40:2472–2481. 2008. View Article : Google Scholar : PubMed/NCBI
|
|
23
|
Emerling BM, Bonifas J, Kratz CP, Donovan
S, Taylor BR, Green ED, Le Beau MM and Shannon KM: MLL5, a homolog
of Drosophila trithorax located within a segment of chromosome band
7q22 implicated in myeloid leukemia. Oncogene. 21:4849–4854. 2002.
View Article : Google Scholar : PubMed/NCBI
|
|
24
|
Lee KH, Kim BC, Jeong CW, Ku JH, Kim HH
and Kwak C: MLL5, a histone modifying enzyme, regulates androgen
receptor activity in prostate cancer cells by recruiting
co-regulators, HCF1 and SET1. BMB Rep. 53:634–639. 2020. View Article : Google Scholar : PubMed/NCBI
|
|
25
|
Madan V, Madan B, Brykczynska U,
Zilbermann F, Hogeveen K, Döhner K, Döhner H, Weber O, Blum C,
Rodewald HR, et al: Impaired function of primitive hematopoietic
cells in mice lacking the Mixed-Lineage-Leukemia homolog MLL5.
Blood. 113:1444–1454. 2009. View Article : Google Scholar : PubMed/NCBI
|
|
26
|
Heuser M, Yap DB, Leung M, de Algara TR,
Tafech A, McKinney S, Dixon J, Thresher R, Colledge B, Carlton M,
et al: Loss of MLL5 results in pleiotropic hematopoietic defects,
reduced neutrophil immune function, and extreme sensitivity to DNA
demethylation. Blood. 113:1432–1443. 2009. View Article : Google Scholar : PubMed/NCBI
|
|
27
|
Milne TA: MLL5 expression as a biomarker
for DNA hypermethylation and sensitivity to epigenetic therapy.
Haematologica. 99:1405–1407. 2014. View Article : Google Scholar : PubMed/NCBI
|
|
28
|
Zhou P, Wang Z, Yuan X, Zhou C, Liu L, Wan
X, Zhang F, Ding X, Wang C, Xiong S, et al: Mixed lineage leukemia
5 (MLL5) protein regulates cell cycle progression and
E2F1-responsive gene expression via association with host cell
factor-1 (HCF-1). J Biol Chem. 288:17532–17543. 2013. View Article : Google Scholar : PubMed/NCBI
|
|
29
|
Livak KJ and Schmittgen TD: Analysis of
relative gene expression data using real-time quantitative PCR and
the 2(-Delta Delta C(T)) method. Methods. 25:402–408. 2001.
View Article : Google Scholar : PubMed/NCBI
|
|
30
|
Yan Y, Greer PM, Cao PT, Kolb RH and Cowan
KH: RAC1 GTPase plays an important role in gamma-irradiation
induced G2/M checkpoint activation. Breast Cancer Res. 14:R602012.
View Article : Google Scholar : PubMed/NCBI
|
|
31
|
Chen Z, Gao H, Dong Z, Shen Y, Wang Z, Wei
W, Yi J, Wang R, Wu N and Jin S: NRP1 regulates radiation-induced
EMT via TGF-β/Smad signaling in lung adenocarcinoma cells. Int J
Radiat Biol. 96:1281–1295. 2020. View Article : Google Scholar : PubMed/NCBI
|
|
32
|
Vanveldhuizen PJ, Zulfiqar M, Banerjee S,
Cherian R, Saxena NK, Rabe A, Thrasher JB and Banerjee SK:
Differential expression of neuropilin-1 in malignant and benign
prostatic stromal tissue. Oncol Rep. 10:1067–1071. 2003.PubMed/NCBI
|
|
33
|
Pawlik TM and Keyomarsi K: Role of cell
cycle in mediating sensitivity to radiotherapy. Int J Radiat Oncol
Biol Phys. 59:928–942. 2004. View Article : Google Scholar : PubMed/NCBI
|