Introduction
Ovarian cancer (OC) is the seventh most common type
of cancer globally, and the third most common type of cancer among
women (1). Worldwide, ~240,000 women
get diagnosed with OC each year, and the 5-year survival rate is
<45% (2). The incidence rates of
OC are alarmingly increasing, even in countries considered to have
a low OC incidence (3,4). A number of risk factors are associated
with epithelial OC, among which the major factors are reproductive
and hormonal parameters (5). The low
survival rate of OC is associated with late diagnosis and also the
probability of disease recurrence in the majority of patients after
primary or first line therapy completion (6).
Among the types of OC, screening studies have
reported that low-grade serous ovarian tumors are more
slow-growing, but more chemoresistant compared with high-grade
serous ovarian tumors (7). OCs
present with high molecular heterogeneity and genetic changes,
which may help translate these morpho-molecular concepts to
therapeutic strategies (8). A number
of first-line therapeutic interventions have been developed for OC
treatment; a nitrogen mustard alkylating agent was the initial
strategy, and the current standard of care includes cyto-reductive
surgery followed by combination taxane-platinum treatment (9). However, it has been observed that ~80%
of the treated individuals experience chemoresistant recurrence
(9,10). Novel non-platinum based
chemotherapeutic drugs and targeted molecular therapies may have a
major impact on the treatment and remission of OC.
Siomycin A is a thiazole compound antibiotic
containing sulfur with specific activity against Gram-positive
bacteria (11). A number of other
thiazole antibiotics have been studied (e.g. thiostrepton,
thiopeptin and sporangiomycin), and the results have demonstrated
that these compounds block translation at the translocation step by
binding to 23S rRNA on the 50S ribosomal subunit (12). Previous studies have attempted to
elucidate the role of Siomycin A as a novel compound for cancer
treatment. Siomycin A has been demonstrated to act as a potent
oncogenic protein forkhead box M1 inhibitor in human lung
adenocarcinoma, glioblastoma, nasopharyngeal carcinoma, melanoma
and acute T cell lymphoma (13). In
addition, Siomycin A may serve a proapoptotic role in epithelial
cancer cells, inducing apoptosis by lysosomal permeabilization
(14); however, to date, the roles
of this compound have not been studied in OC cells. Therefore, the
present study aimed evaluate for the first time the role of
Siomycin A as a potential anticancer drug in OC cells and to
identify the mechanism of action underlying its effects on cell
proliferation, apoptosis and mitochondrial membrane status in PA1
and OVCAR3 cells.
Materials and methods
Cell culture
OC cell lines PA-1 (PA1; (ATCC®
CRL-1572™) and NIH:OVCAR-3 (OVCAR3; ATCC® HTB-161™), and
a normal lung fibroblast cell line WI-38 (ATCC® CCL-75™)
were purchased from ATCC and cultured in Dulbecco's modified
Eagle's medium (DMEM; Gibco; Thermo Fisher Scientific, Inc.)
supplemented with 10% FBS (Gibco; Thermo Fisher Scientific, Inc.),
100 U/ml penicillin and 100 µg/ml streptomycin at 37°C in a
humidified 5% CO2 chamber (HF90; Heal Force Bio-Meditech
Holdings Ltd.). Cells were observed under an inverted phase contrat
microscope (Zeiss Axiovert. A1; magnification, ×20).
Cell viability assay
Cell viability was assessed by MTT assay. PA1 and
OVCAR3 cells were seeded into 96-well plates at a density of
~1×10⁴ cells/well and treated with 0–100 µM Siomycin A
for 24, 48 or 72 h. Subsequently, 20 µl of MTT (Sigma-Aldrich;
Merck KGaA) solution, from the stock of 5 mg/ml in PBS, was added
to each well and incubated for 3 h at 37°C. The purple formazan
crystals were dissolved using 100 µl of DMSO and cell viability was
analyzed at a wavelength of 570 nm, using a MultiskanEX plate
reader (Labsystems Diagnostics Oy) (15). The cytotoxicity of Siomycin A to
normal cells was determined by the same method on cultured WI-38
cells. Cell viability of PA1 and OVCAR3 cells were also assessed
using the anticancer drug cisplatin (Sigma-Aldrich; Merck KGaA;
0–50 µM) (and following co-treatment with the IC50 dose
of cisplatin and Siomycin A for 48 h using MTT assay. All
experiments were performed in triplicate.
Detection of apoptosis by ELISA
Induction of apoptosis in Siomycin A-treated OC
cells was determined by the Cell Death Detection
ELISAPLUS (Sigma-Aldrich; Merck KGaA) according to the
manufacturer's instructions as well as a published protocol
(16). Briefly, PA1 and OVCAR3 cells
(~1×10⁴ cells/ml) of 60 mm plates were treated with 2.5
and 5 µM Siomycin A for 48 h. Following treatment, untreated and
Siomycin A-treated cells were harvested, lysed with RIPA lysis
buffer (Thermo Fischer Scientific, USA) and subjected to
subcellular fractionization using the components of the kit. The
cytoplasmic fraction was collected by centrifugation at 10,000 × g
at 4°C for 15 min, and ~20 µl of the lysate containing 15 µg
protein as assessed by the Bradford assay, was added to the
streptavidin-coated microplate. Subsequently, 80 µl of buffer
mixture containing anti-histone-biotin and anti-DNA peroxidase was
added, and the reaction mixture was incubated for 2 h at room
temperature with continuous shaking. Finally, the chromogenic
substrate 2,2′-azino-di-(3-ethylbenzthiazoline-6-sulfonic acid) was
added to develop the color, and the absorbance was measured at 405
nm using an ELISA reader (Molecular Devices, LLC).
Determination of mitochondrial
membrane potential
PA1 and OVCAR3 cells (~1×10⁴ cells/ml) of
60 mm plates were treated with 2.5 and 5 µM Siomycin A for 48 h.
Following treatment, the cells were incubated with 3 µg/ml JC-1
(5,5′,6,6′-tetrachloro-1,1′,3,3′-tetraethylbenzimidazolcarbocyanine
iodide; Abcam) for 20 min at 37°C (17). The cells were washed with chilled
PBS, and JC1 fluorescence was assessed at 530 and 590 nm using a
Fluoroskan microplate fluorimeter (Thermo Fischer Scientific,
Inc.). The ratio of red/green fluorescence intensity
(aggregate/monomer) was analyzed using the instrument Scanlt 2.0.7
software. All experiments were performed in triplicate.
ROS detection by
2′,7′-dichlorodihydrofluorescein diacetate (DCFDA) assay
Cultured PA1 and OVCAR3 cells (~1×10⁴
cells/ml) of 60 mm plates were treated with Siomycin A in two sets:
i) 5 µM for 6, 12, 24 and 48 h; and ii) 2.5, 5 and 10 µM for 24 h.
Following treatment, the cells were stained with 10 µM DCFDA
(Abcam) for 30 min in the dark at room temperature (18). Subsequently, the cells were washed
twice with cold PBS, and fluorescence was assessed at the
excitation/emission wavelengths of 485/535 nm using a Fluoroskan
microplate fluorimeter. All experiments were performed in
triplicate. For ROS generation-associated assays, the cells were
pretreated with 200 µM N-acetylcysteine (NAC) for 6 h, followed by
the treatment with the putative drug Siomycin A, as
aforementioned.
Estimation of ROS scavenging enzymes
and intracellular GSH content
The PA1 and OVCAR3 cells treated with Siomycin A
were collected and resuspended in 200 µl RIPA lysis buffer (Thermo
Fischer Scientific, Inc.) for lysis and subsequent extraction of
cellular proteins. The cells were sonicated on an ice bath, thrice
for 15 sec each pulse to extract the cellular proteins from the
supernatant, and were used for subsequent antioxidant assays. All
experiments were performed in triplicate.
Catalase (CAT) activity
A total of 20 µl cell extract was added to 100 µl
sample buffer (50 mM potassium phosphate buffer, pH 7.0) and mixed
with 180 µl 30 µM H2O2 (cat. no. 107209;
MilliporeSigma). For blank setup, 20 µl sample buffer was used
instead of the cell extract. The decomposition of
H2O2 to H2O and O2 by
CAT present in the cell lysates was monitored at 240 nm using a
T8001S Double beam UV/Vis spectrophotometer (Shanghai Yoke
Instrument Co., Ltd.). Catalase enzyme activity was calculated as
the number of µmol of H2O2 consumed per min
per 1 mg protein against a standard curve (19).
Superoxide dismutase (SOD)
activity
A total of 2.35 ml buffer A [0.1 mol/l Tris-HCl
(cat. no. 648313; MilliporeSigma) buffer solution with 1 mM EDTA
(MilliporeSigma), pH 8.2] was added to 2.00 ml deionized water;
subsequently, 0.15 ml buffer B (4.5 mmol/l pyrogallol solution in
HCl; cat. no. 100612; MilliporeSigma) was added, and the solution
was vortexed for 2 min at room temperature. Absorbance was measured
at 420 nm in 1-min intervals. The difference in absorbance between
two aliquots, ∆A420 (min −1), indicated the rate of pyrogallol
autoxidation in the blank sample. For all experimental samples, the
same procedure was followed with the addition of sample before
buffer B, and absorbance was recorded using a T8001S Double beam
UV/Vis spectrophotometer. The SOD enzyme activity was based on the
autooxidation rate of pyrogallol and the inhibition of this
autooxidation by SOD, where 50% inhibition corresponded to one unit
of enzyme activity (20).
Glutathione peroxidase (GPx)
activity
A total of 10 µl sample buffer (50 mM potassium
phosphate buffer, pH 7.0) was added to potassium phosphate buffer
(170 µl) with 1 mM EDTA and 2 mM sodium azide (pH 7.0; cat. no.
106688; MilliporeSigma) and used as the blank sample. For all
experimental samples, 10 µl cell extract was added in place of
sample buffer. A total of 90 µl master mix with 30 µl (10 mM)
glutathione (GSH; cat. no. 3541 MilliporeSigma); mixed with 30 µl
(2.4 U/ml) glutathione reductase (cat. no. 359960; MilliporeSigma)
and 30 µl nicotinamide adenine dinucleotide phosphate [1.5 mM NADPH
(cat. no. 481973; MilliporeSigma) in 0.1% sodium bicarbonate (cat.
no. 106329; MilliporeSigma) solution] was added to each sample and
incubated at 37°C for 10 min. A total of 30 µl (2 mM)
H2O2 was added to each sample and the
decomposition of H2O2 was monitored by
observing the rate of NADPH consumption at 340 nm for 10 min in a
T8001S Double beam UV/Vis spectrophotometer. The GPx enzyme
activity was calculated as NADPH (in nM) consumed per min per 1 mg
protein (21).
Glutathione reductase (GR)
activity
A total of 230 µl sample buffer (50 mM potassium
phosphate buffer, pH 7.0) was added to 40 µl potassium phosphate
buffer with 1 mM EDTA and used as the blank sample. A total of 10
µl cell extract and 30 µl (20 mM) glutathione disulfide (cat. no.
3542; MilliporeSigma) was added to the mixture for each
experimental sample. All samples were incubated at 37°C for 3 min,
and the reaction was started by adding 30 µl 1.5 mM NADPH in 0.1%
sodium bicarbonate. The subsequent consumption of NADPH was
monitored at 340 nm for 5 min at 37°C in a T8001S Double beam
UV/Vis spectrophotometer. The GR enzyme activity was calculated as
NADPH (in nM) consumed per min per 1 mg cellular protein (21).
Intracellular GSH content
A total of 200 µl of assay mixture [0.84 mM 5,5′
dithiobis-(2-nitrobenzoic acid) (DTNB; cat. no. 322123;
MilliporeSigma) and 0.28 mM NADPH dissolved in 100 mM sodium
phosphate buffer, pH 7.5, with 5 mM EDTA] was added to 20 µl sample
buffer (50 mM potassium phosphate buffer, pH 7.0) in a quartz
cuvette and incubated at 37°C for 5 min. For the experimental
samples, 20 µl cell extract was added instead of the sample buffer.
The reaction was initiated by adding 40 µl glutathione reductase,
and the reduction of DTNB and formation of TNB was monitored for 10
min at 412 nm using a T8001S Double beam UV/Vis spectrophotometer
(22). The GSH content was
determined with reference to a GSH standard curve using known
concentrations of GSH (0–50 µM).
Preparation of the cytosolic extract
from PA1 and OVCAR3 cells
PA1 and OVCAR3 cells were seeded at a density of
1×10⁴ cells/ml, grown to confluency in 60 mm plates and
treated with 2.5 and 5 µM Siomycin A treatment for 48 h. Following
treatment, the adherent cells were detached using trypsin
(Sigma-Aldrich; Merck KGaA) and subsequently centrifuged in various
buffers to separate the cytosolic phase (supernatant of final step)
from the rest of the cell pellet as previously described (23). The amount of total protein from the
cytosolic extracts of control and treated PA1 and OVCAR3 cells was
estimated using the Bradford reagent (Abcam), and equal amounts (40
µg) of protein were loaded in each well for the detection of
cytochrome c by western blotting. All experiments were
performed in triplicate.
Western blot analysis
PA1 and OVCAR3 cells in 60 mm plates at a
concentration of ~1×10⁴ cells/ml were treated with 2.5
and 5 µM of Siomycin A for 48 h. Following treatment, the cells
were incubated in lysis buffer (Thermo Fischer Scientific, Inc.).
The total protein concentrations were determined by Bradford assay
using a standard curve, and equal amount of proteins (30–50 µg)
were separated by 10–12% SDS-PAGE. Following separation, the
cellular proteins were transferred to nitrocellulose membranes
(MilliporeSigma) and blocked with 5% skimmed milk for 1 h at room
temperature. The membranes were incubated with primary antibodies
(all 1:1,000 dilution) against Bax (cat. no. sc-7480), Bcl2 (cat.
no. sc-492), cleaved caspase −3 (cat. no. CST- 9661), cytochrome
c (cat. no. sc-13156) and β-actin (cat. no. sc-47778) for 16
h at 4°C, followed by incubation with a corresponding horseradish
peroxidase-linked secondary antibody (1:3,000 dilution; goat
anti-mouse-HRP secondary antibody, cat. no. 32430 and goat
anti-rabbit HRP secondary antibody, cat. no. 31460) Invitrogen;
Thermo Fisher Scientific, Inc.)] for 2 h at room temperature and
washed using TBS and TBST buffers (Tris buffer saline; BioRad
Laboratories, Inc.). Bands were developed using the Clarity Western
ECL substrate luminol assay kit (cat. no. 1705060; BioRad
Laboratories, Inc.), and chemiluminescence was recorded in
Chemidoc™ Gel Imaging System (Bio-Rad Laboratories, Inc.). The
densitometric analysis was performed using ImageJ 1.52a software
(National Institutes of Health). All experiments were performed in
triplicate.
Statistical analysis
Data are presented as the mean ± standard error of
the mean of at least three independent experiments. Two-way ANOVA
followed by Sidak's or Bonferroni correction was performed to
analyze the effects of the dose of Siomycin A, NAC treatment and
the interaction between the dose of Siomycin A and NAC. All other
data were analyzed by one-way ANOVA followed by Tukey's test.
GraphPad Prism 5.0 software (GraphPad Software, Inc.) was used for
analysis. P<0.05 was considered to indicate a statistically
significant difference.
Results
Siomycin A inhibits proliferation and
induces cytotoxicity in OC cells
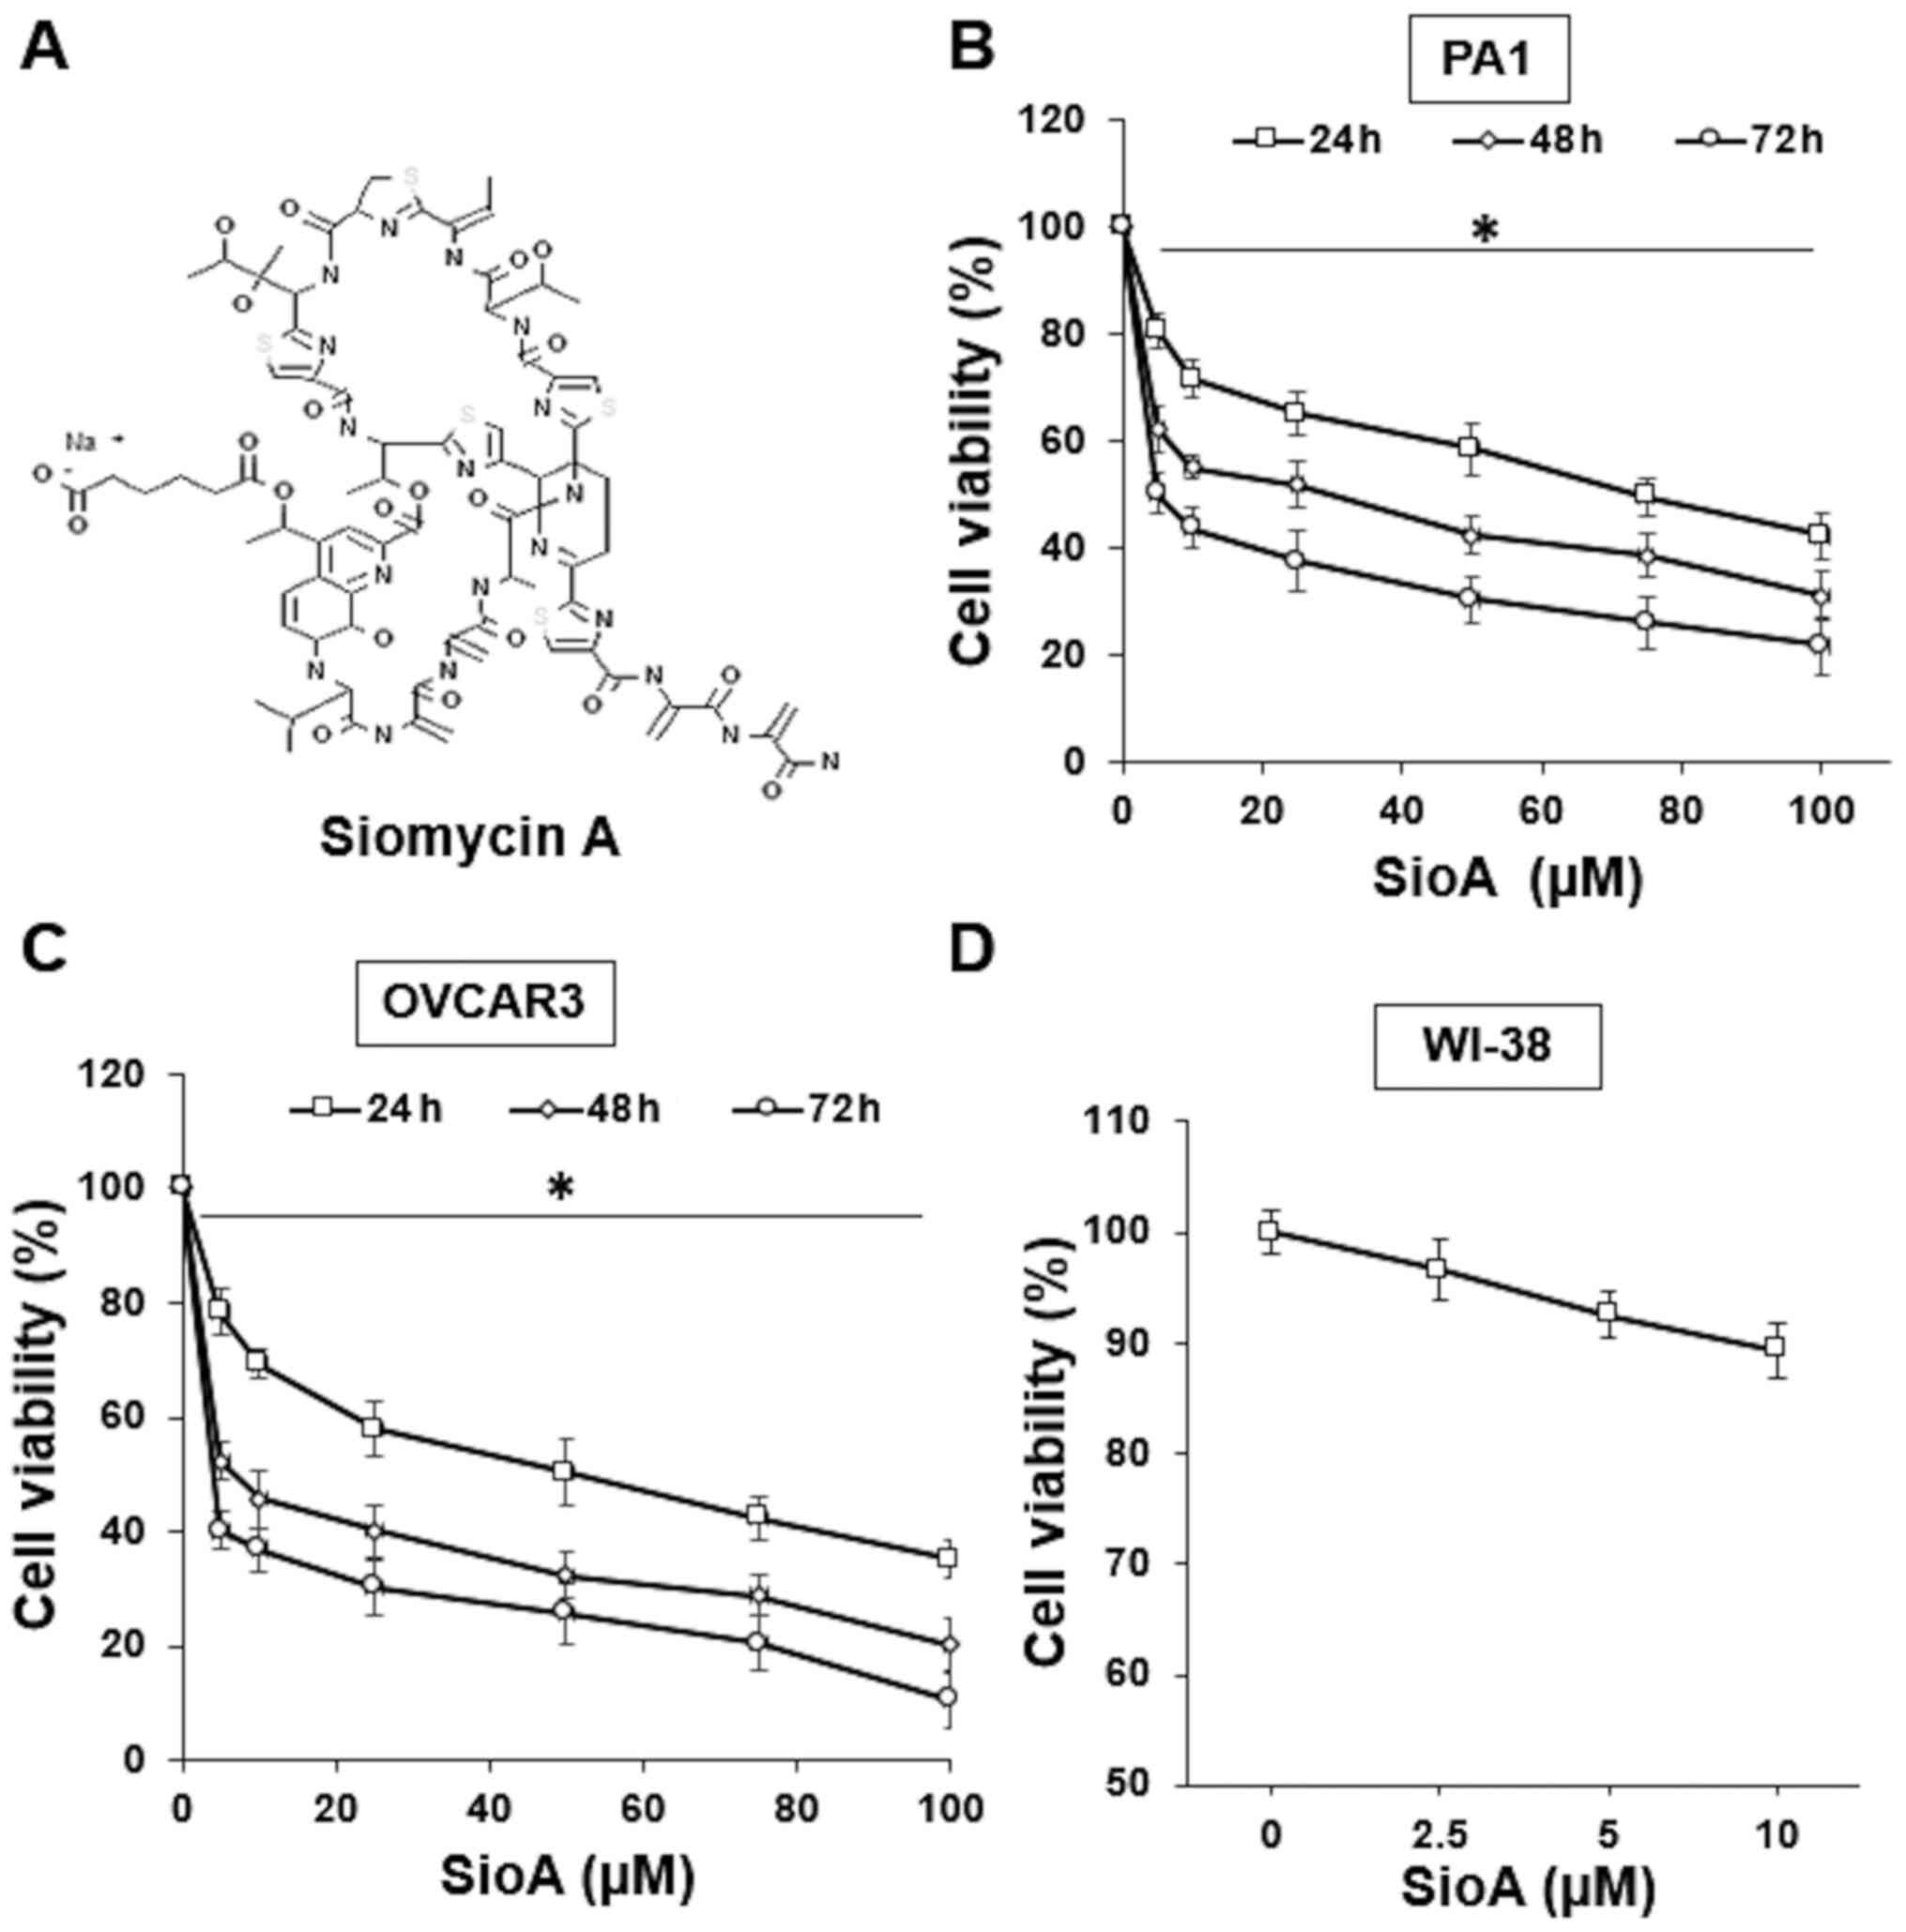
The present study evaluated the antitumor effects of
the thiopeptide antibiotic Siomycin A (Fig. 1A) on OC cells. OC cell lines PA1 and
OVCAR3 were treated with a 0–100 µM Siomycin A for 24, 48 and 72 h.
The results of the MTT assay demonstrated that Siomycin A decreased
the PA1 and OVCAR3 cell viability and the effects appeared to
increase at higher doses and longer incubation times (Fig. 1B and C), with the IC50
values at 5 µM for PA1 cells and 2.5 µM for OVCAR3 cells following
72-h treatment (P<0.05). The cytotoxicity of Siomycin A in
normal cells was also evaluated. Previous studies have used the
human normal lung fibroblast WI-38 cell line to assess the
cytotoxicity of anticancer drugs (10,24,25). In
the present study, WI-38 cells were treated with 0–10 µM Siomycin A
for 72 h, and no significant loss of cell viability was determined
by MTT assay (Fig. 1C). These
results demonstrated that Siomycin A exerted an inhibitory effect
on OC cells, and the low IC50 values indicated that it
may be a potential option for treatment due to limited toxicity on
the surrounding normal cells.
Siomycin A treatment alters morphology
and induces apoptosis in OC cells
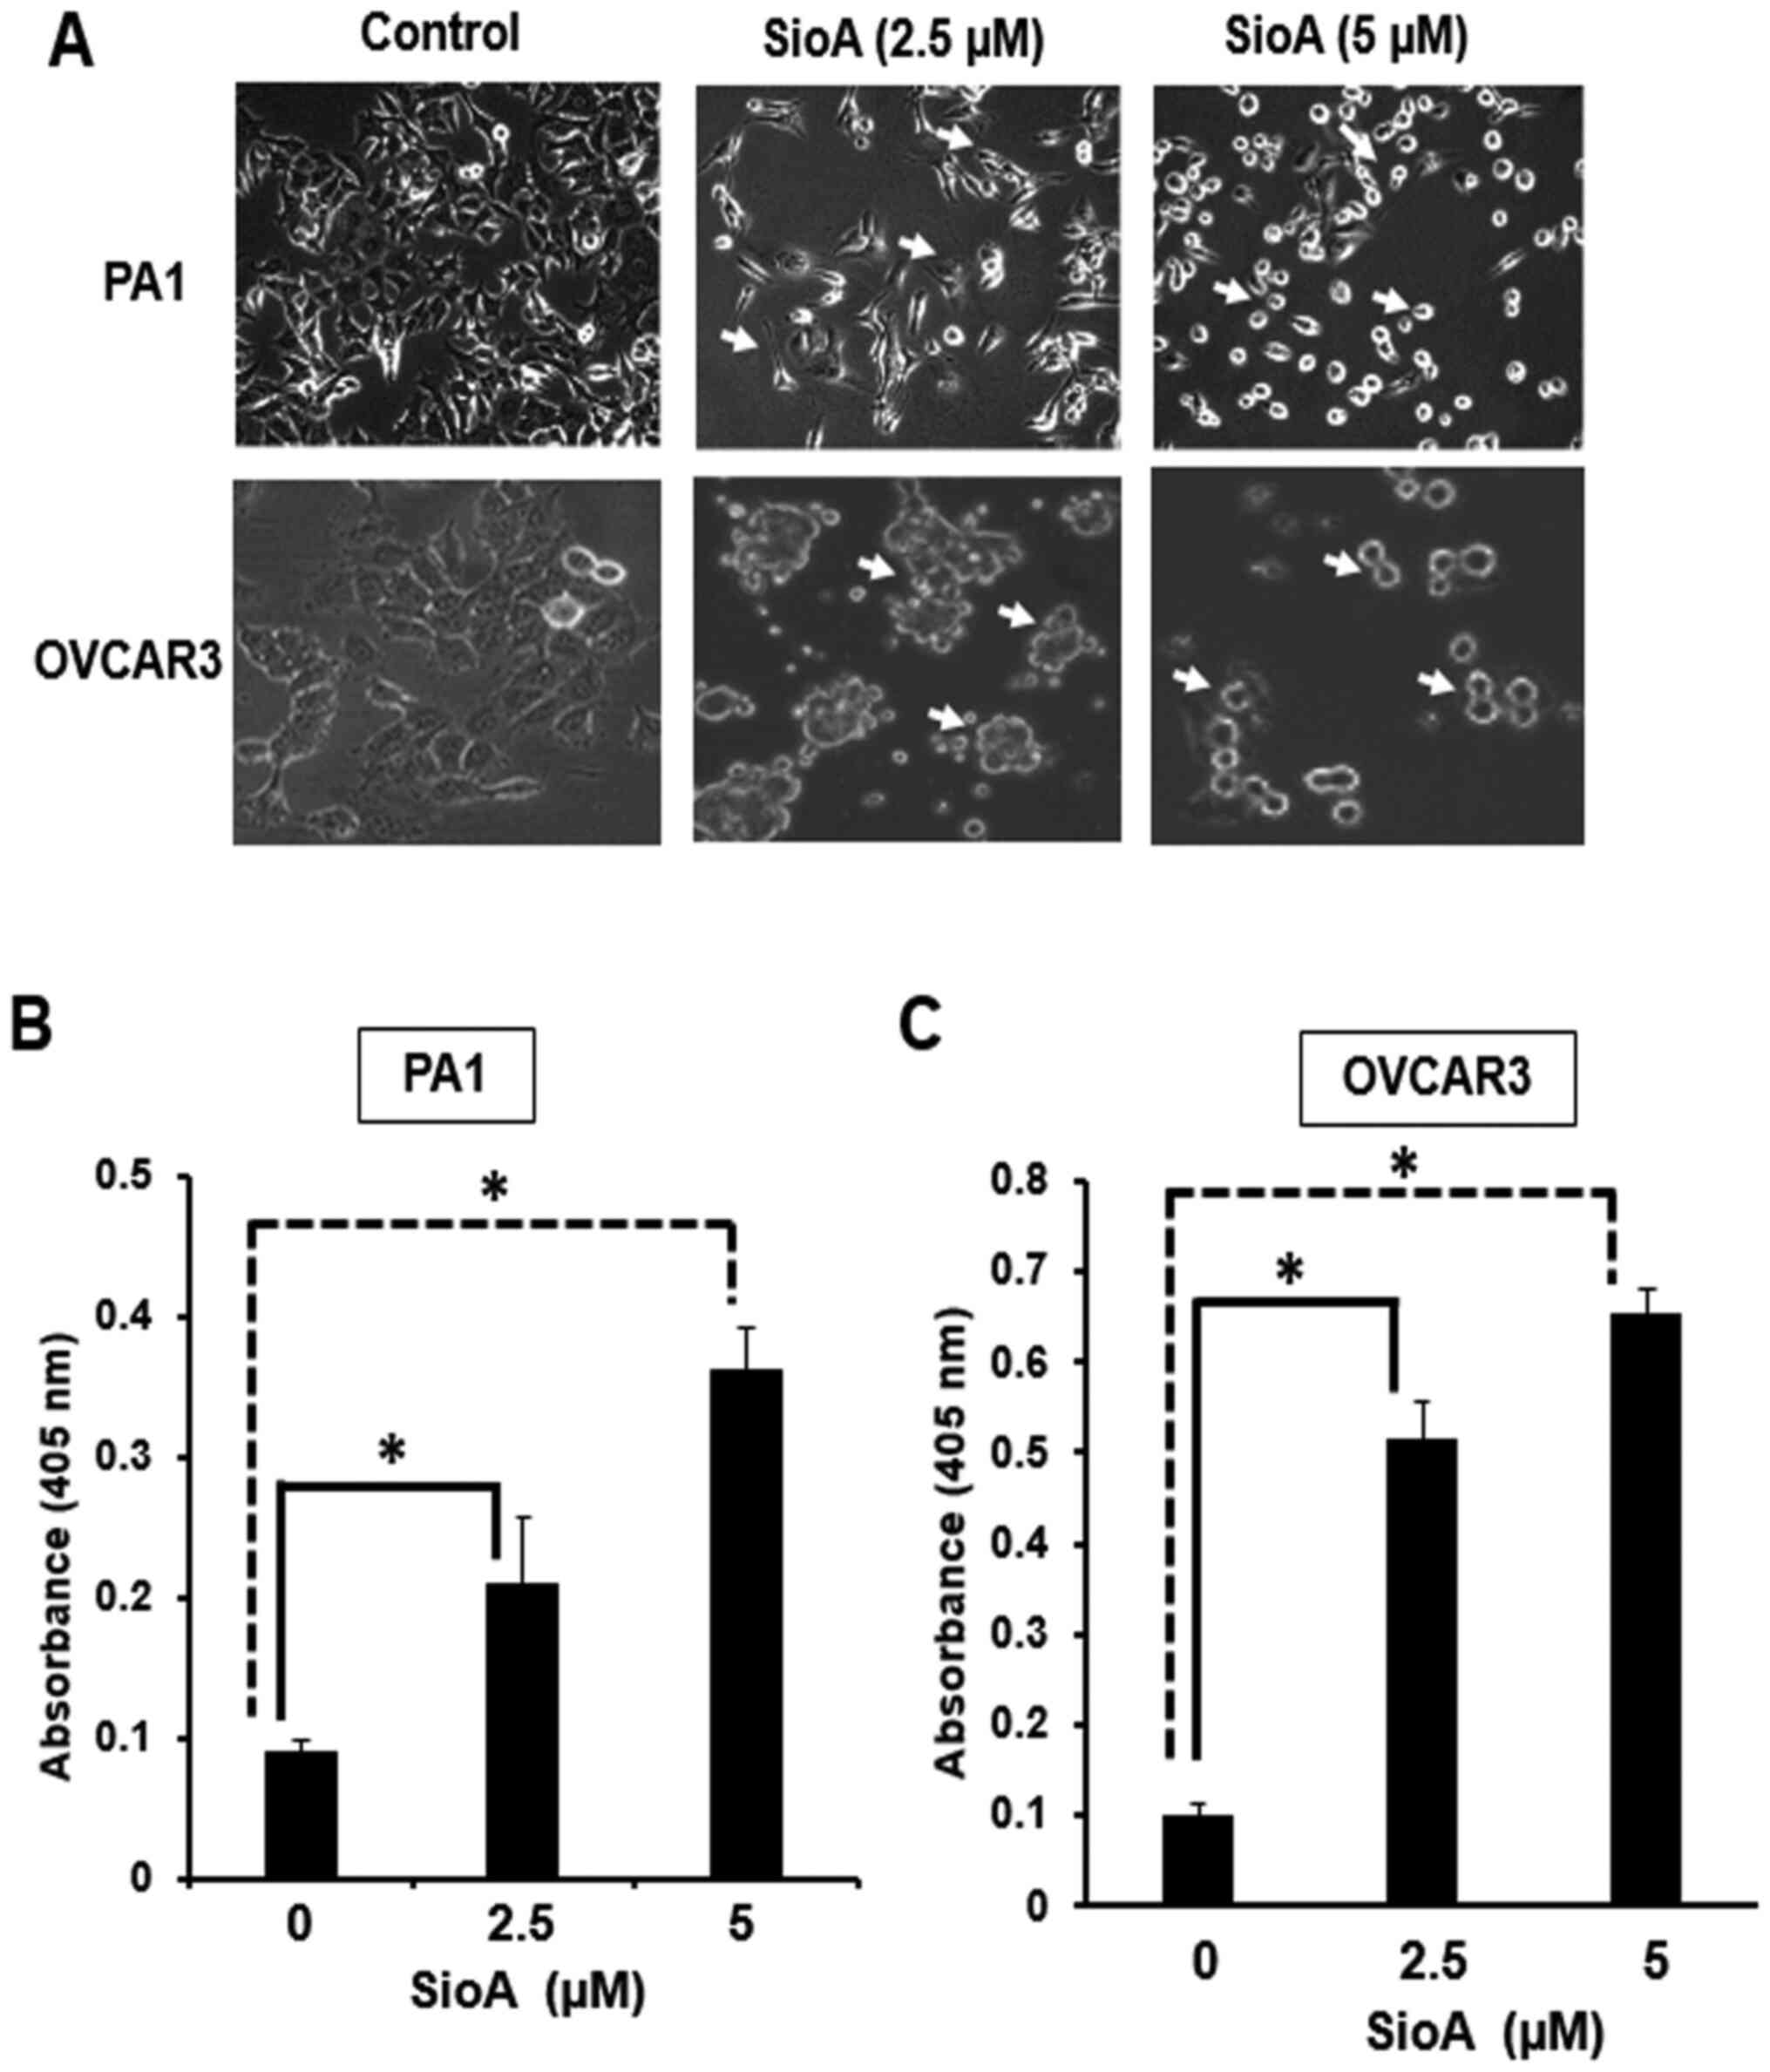
Treatment of PA1 and OVCAR3 cells with 2.5 and 5 µM
Siomycin A resulted in the alteration of the cellular morphology.
The cells began to lose their spindle-shape nature and formed
shrunken spherical structures upon treatment; the change was
moderate for 2.5 µM and more prominent for 5 µM. The cell density
also significantly decreased following treatment with 5 µM Siomycin
A in both cell lines (Fig. 2A).
Siomycin A treatment of PA1 and OVCAR3 cells significantly induced
of apoptosis at 48 h, as determined by ELISA. In the presence of
2.5 µM Siomycin A, the absorbance increased by ~2.3-fold for PA1
and ~5.1-fold for OVCAR3 cells, whereas following treatment with 5
µM Siomycin A, the increase in absorbance was ~4.0-fold for PA1 and
~6.4-fold for OVCAR3 cells (Fig. 2B and
C; P<0.05.
These results demonstrated that Siomycin A exerted
proapoptotic effects on the OC cell lines by initially altering the
cell morphology and changing the adherent defined structures to
rounded shrunken clots. These features, along with the reduced cell
density and decreased viability, were indicative of apoptosis,
which was further confirmed by ELISA to reveal that Siomycin A
induced apoptosis, with high occurrence of cell death at 5 µM for
both PA1 and OVCAR3 cells.
Siomycin A treatment affects OC cell
mitochondrial membrane potential and the levels of pro- and
antiapoptotic markers
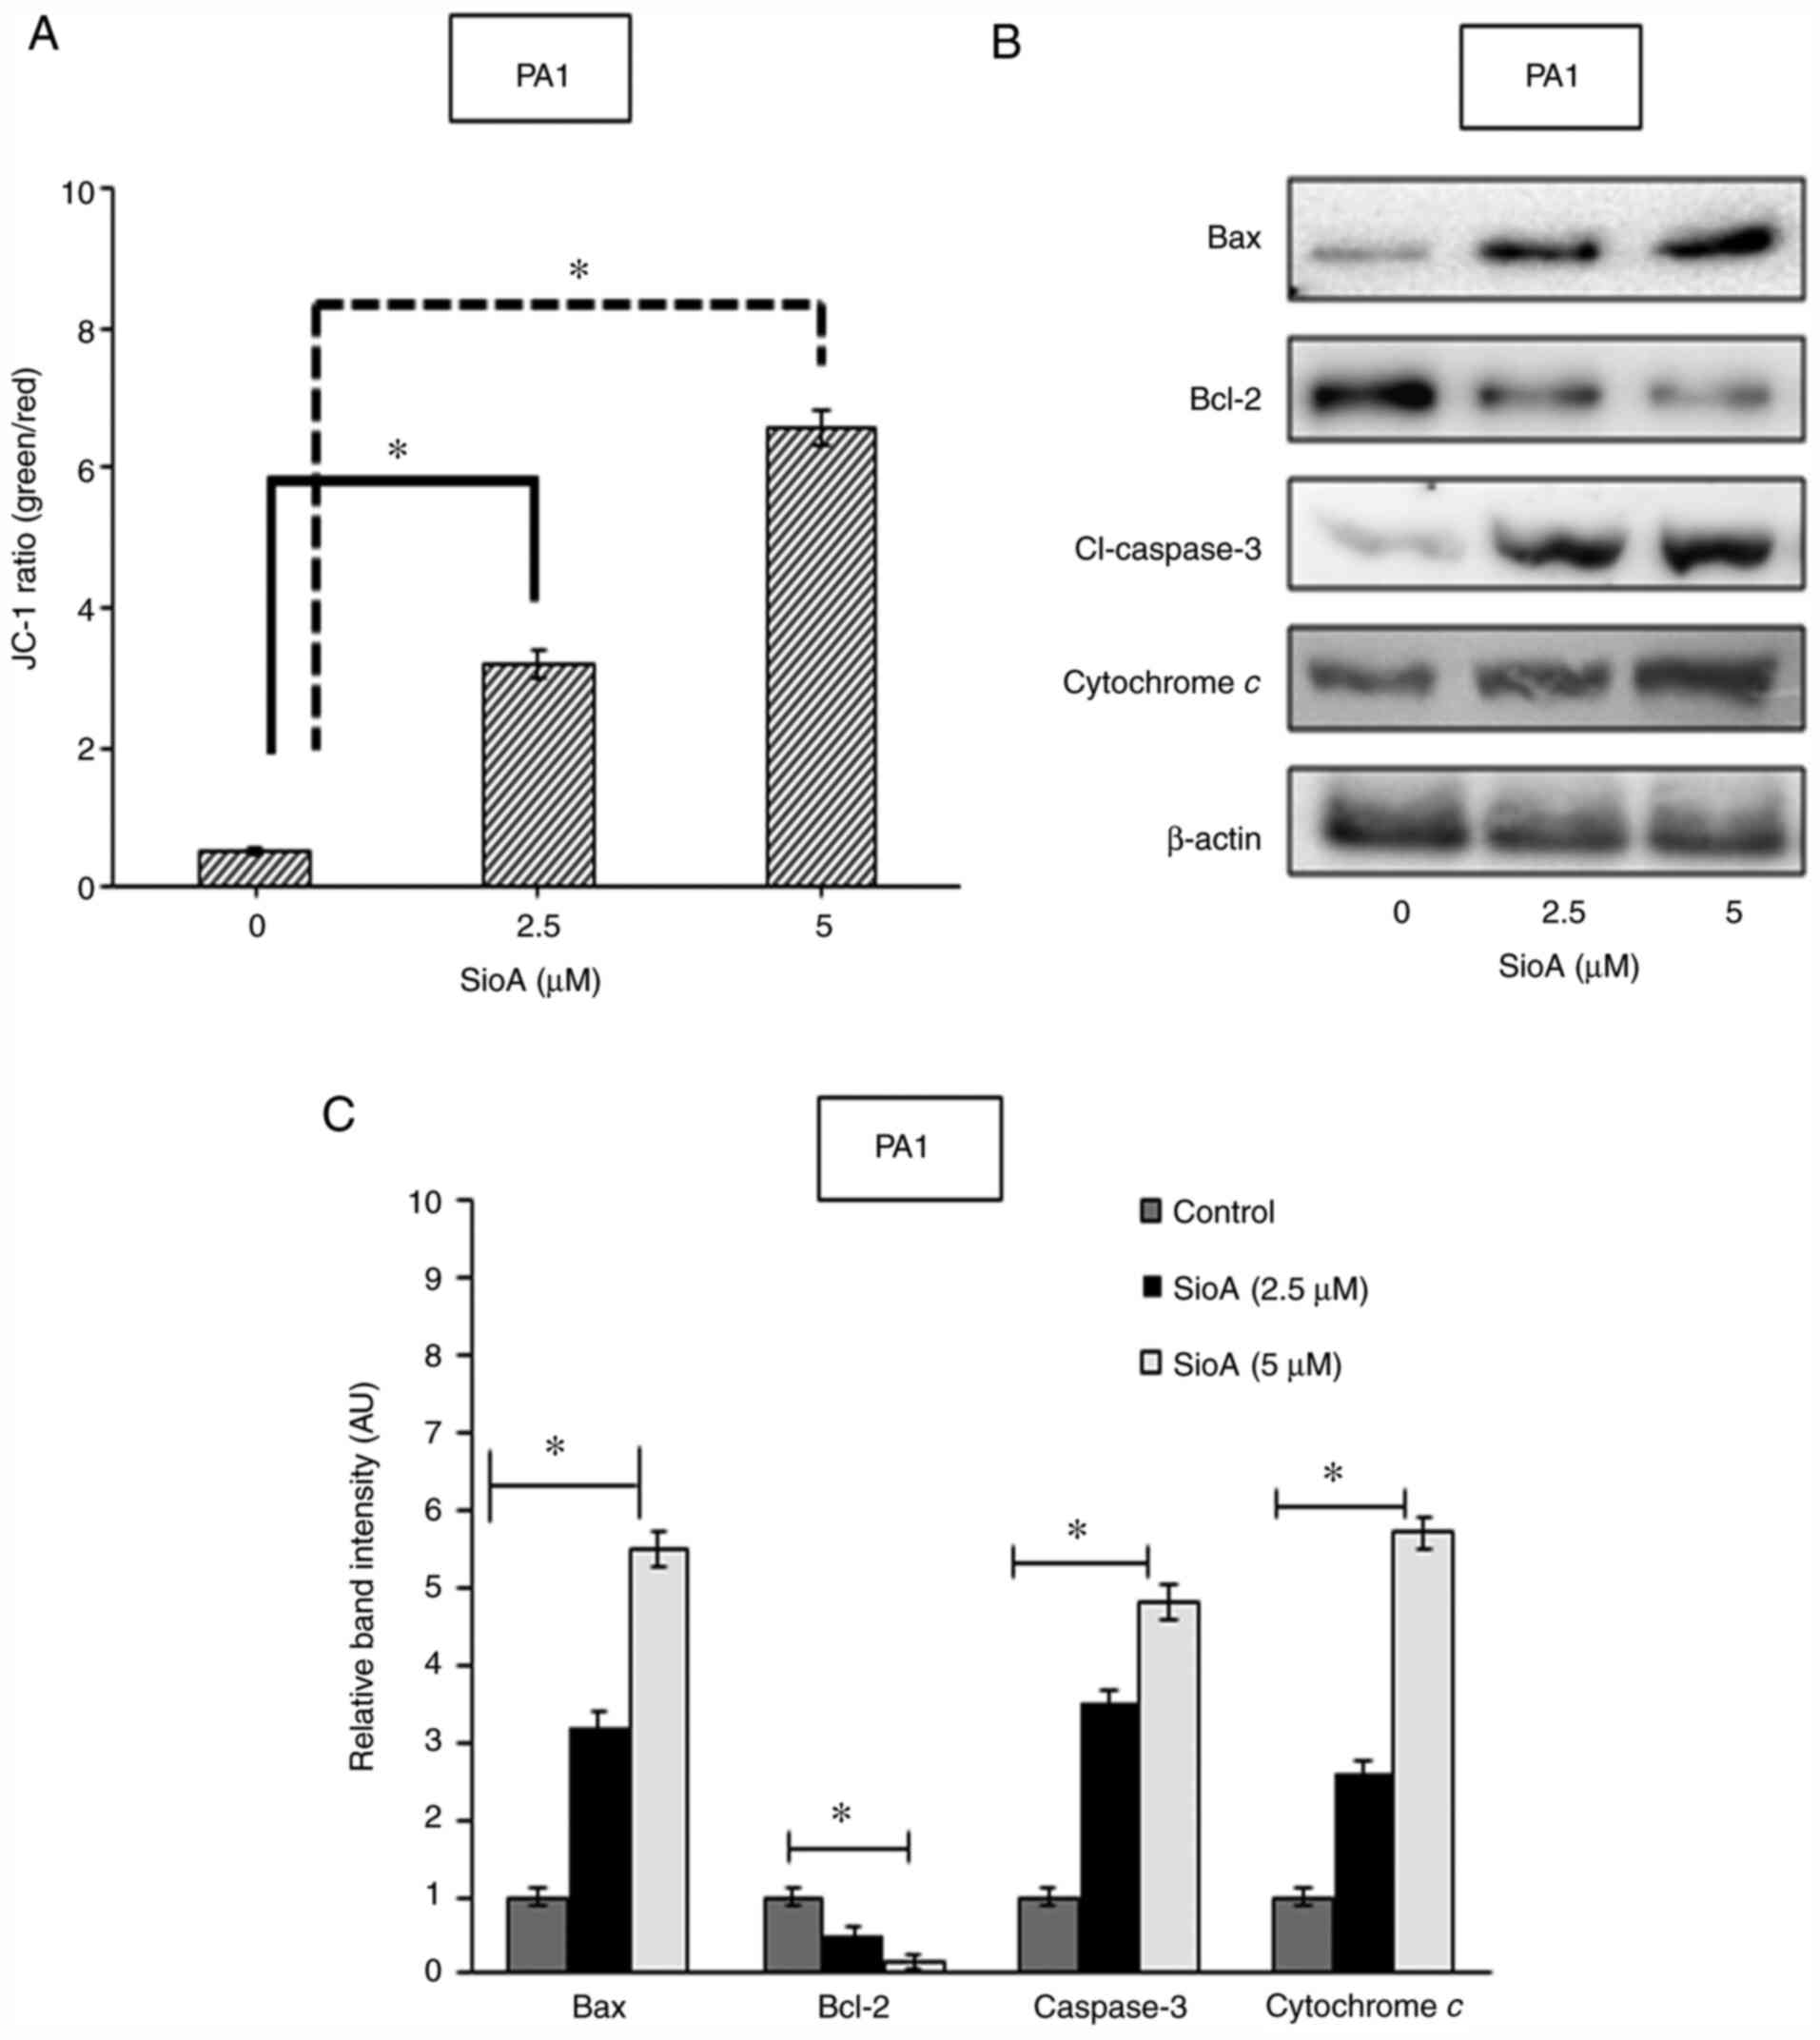
In order to determine the cellular changes that
induce apoptosis in OC cells following Siomycin A treatment, the
roles of mitochondria were examined. The changes in the
mitochondrial membrane potential were analyzed by staining PA1 and
OVCAR3 cells with the mitochondria-specific dye JC-1. Fluorimetric
analysis of the Siomycin A-treated PA1 and OVCAR3 cells revealed a
decrease in the red fluorescence population and a simultaneous
increase in the green fluorescence population, resulting in the
increase in the green/red ratio of 3.2- and 6.6-fold for PA1 cells
following 2.5 and 5 µM Siomycin A treatment, respectively, compared
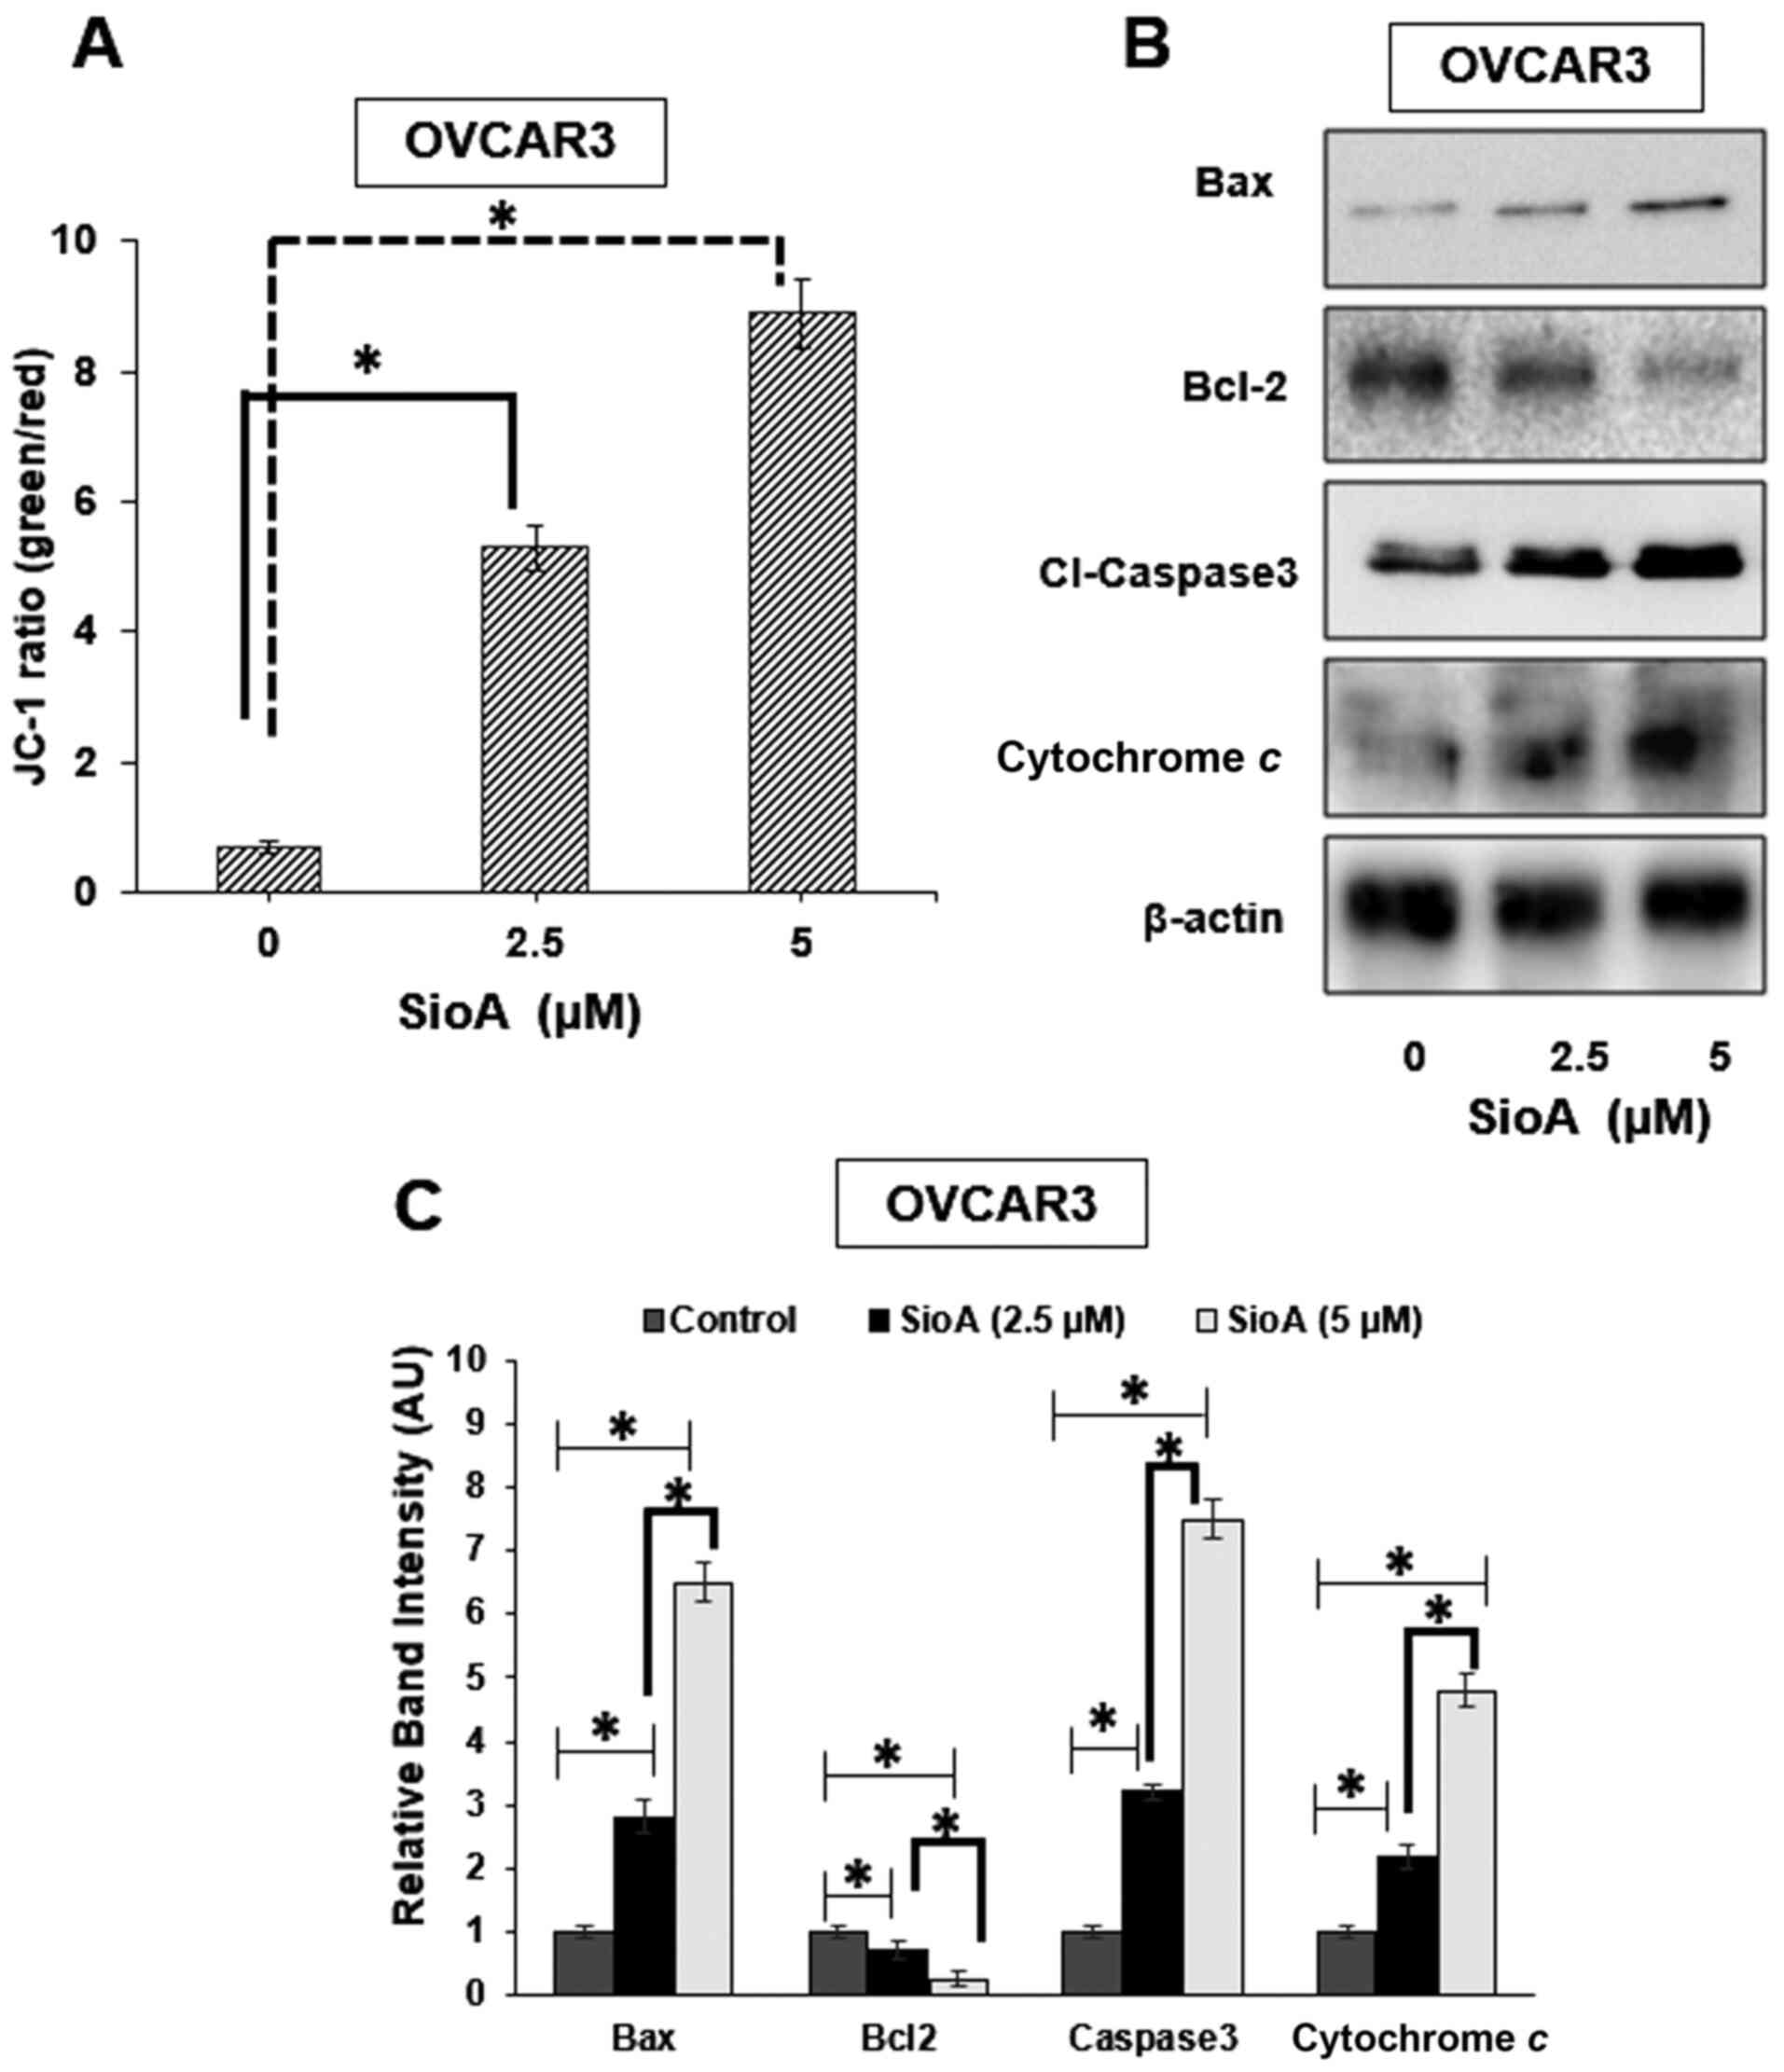
with that in the untreated control group (P<0.05 Fig. 3A), and an increase of 5.3- and
8.9-fold in OVCAR3 cells with the two doses of Siomycin A,
respectively, compared with those in the untreated control group
(P<0.05 Fig. 4A), which indicated
the loss of the mitochondrial membrane potential. The decrease in
the mitochondrial membrane potential is associated with the release
of cytochrome c in the cytosol (26). Thus, the levels of cytochrome
c in the cytosol were determined in the present study by
western blotting (Fig. 3B), and the
results demonstrated that with increasing concentrations of
Siomycin A, the protein levels of cytosolic cytochrome c
increased significantly in PA1 cells (P<0.05 Fig. 3C). Siomycin A treatment also resulted
in the alterations of the expression levels of the proapoptotic
protein Bax and the antiapoptotic protein Bcl-2; the upregulation
of Bax (P<0.05) and the downregulation of Bcl-2 (P<0.05) in
PA1 cells treated with Siomycin A compared with those in the
untreated cells, as demonstrated by western blotting, indicated an
altered Bax/Bcl-2 ratio, suggesting that apoptosis was triggered
(Fig. 3B and C). The activation of
Bax leads to functional translocation of Bax to the mitochondria,
increasing the permeability of the mitochondrial membrane, and thus
facilitating the translocation of mitochondrial cytochrome c
into the cytosol pool (27). This
augmented release of cytochrome c serves a crucial role in
increasing the levels of caspase-3, which leads to apoptosis by
further activating the other caspases (27). In the present study, increased levels
of Bax were observed with increases of cytochrome c in the
cytosol as well as the protein levels of caspase-3 (P<0.05)
following Siomycin A treatment compared with those in the untreated
cells, and the effects were observed in a dose-dependent fashion
(Fig. 3C and D). Similar results
were observed for the pro- and antiapoptotic proteins in OVCAR3
cells where the levels of Bax (P<0.05), cytochrome c
(P<0.05) and cleaved caspase-3 (P<0.05) were increased, and
the levels of Bcl-2 (P<0.05) were reduced significantly
following Siomycin A treatment (Fig. 4B
and C). These results suggested that Siomycin A may target the
mitochondria of OC cells to induce caspase-mediated cell death.
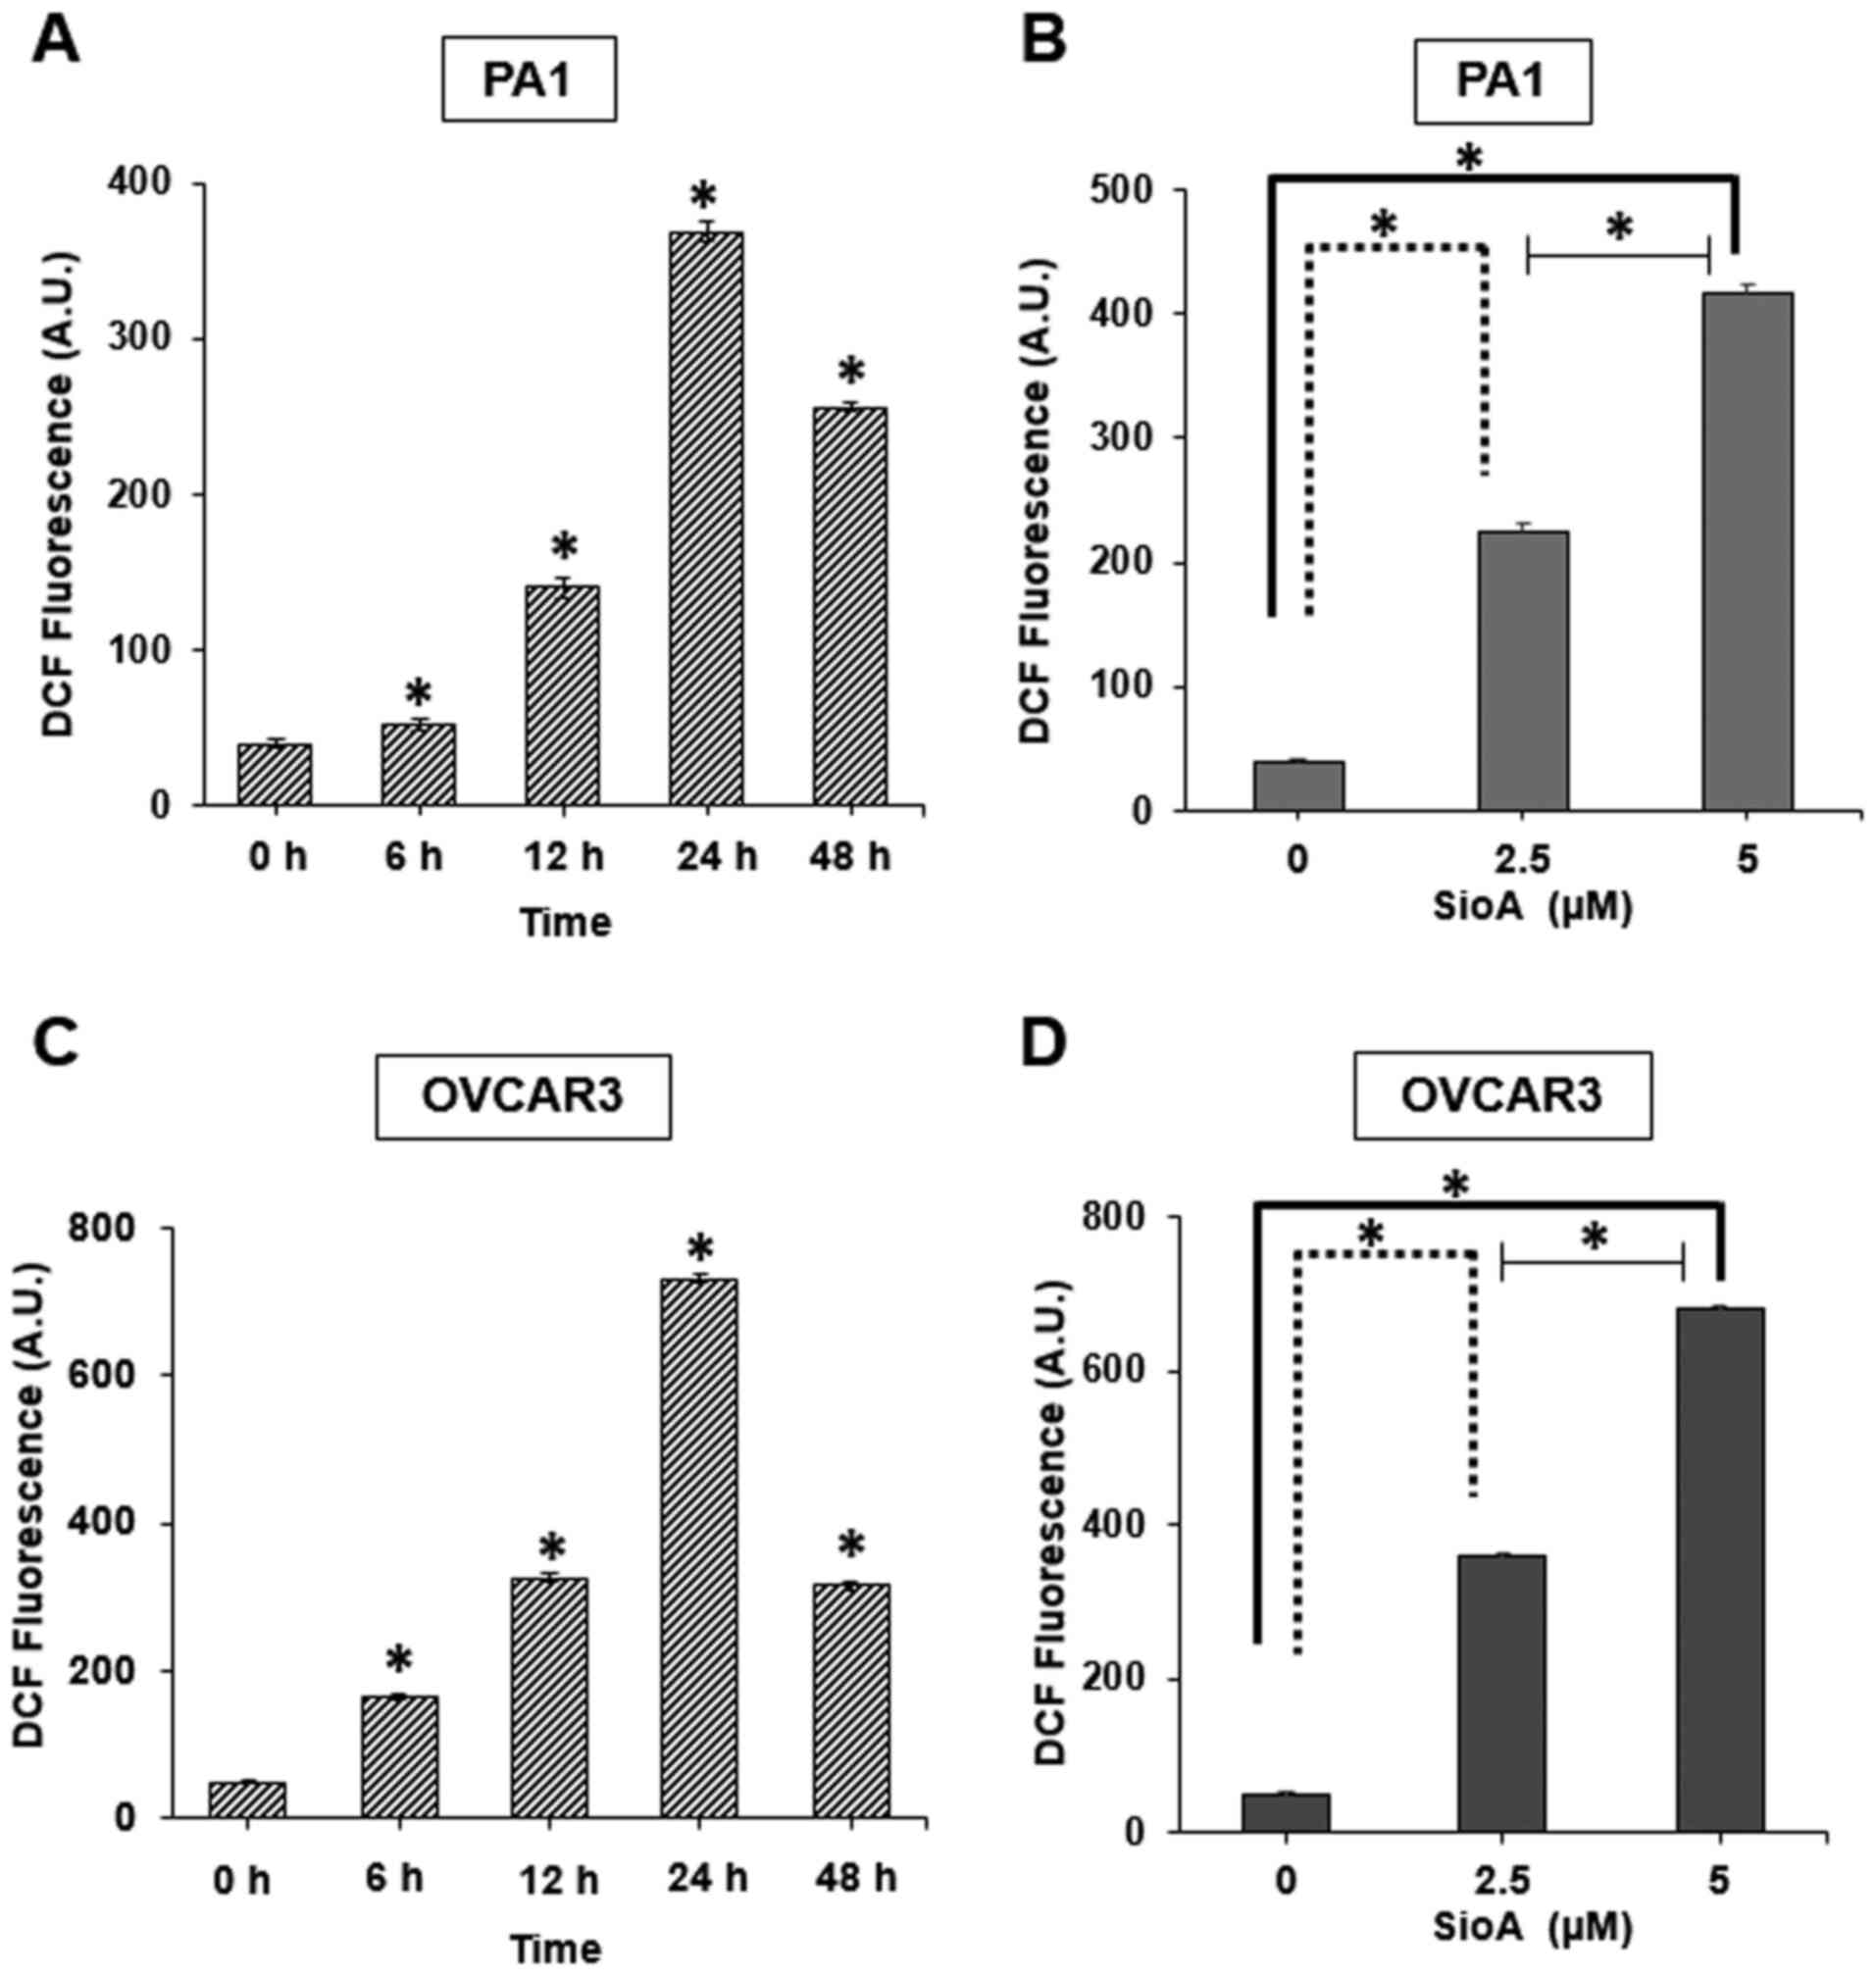
Siomycin A treatment induces ROS
generation in OC cells
Among the limited number of studies that have
reported the activity of Siomycin A on cancer cells, ROS generation
has not been clearly indicated as a mechanism of Siomycin A-induced
cell death. Therefore, the present study investigated whether
Siomycin A enhanced ROS generation in OC cells. The results
demonstrated that DCF fluorescence, which is a standard indicator
of cellular ROS generation, was significantly increased following
Siomycin A treatment in PA1 and OVCAR3 cells (P<0.05 with peak
increases at 24 h (Fig. 5A and C)
and with a 5-µM dose (Fig. 5B and D)
in the two cell lines compared with those in the untreated cells.
The generation of ROS is one of the key mechanisms of anticancer
agents against various types of cancer cells (28), and the results of the present study
demonstrated that Siomycin A is may be a potent ROS generator in OC
cells, disrupting the cellular homeostasis in these cells and
eventually leading to cell death.
Siomycin A treatment reduces
antioxidant enzyme activity and GSH content in OC cells
Since the production of antioxidant enzymes is a key
regulator of oxidative stress response (29), the present study evaluated the levels
of major antioxidant enzymes that may be effective in
detoxification of electrophilic and oxidative species in Siomycin
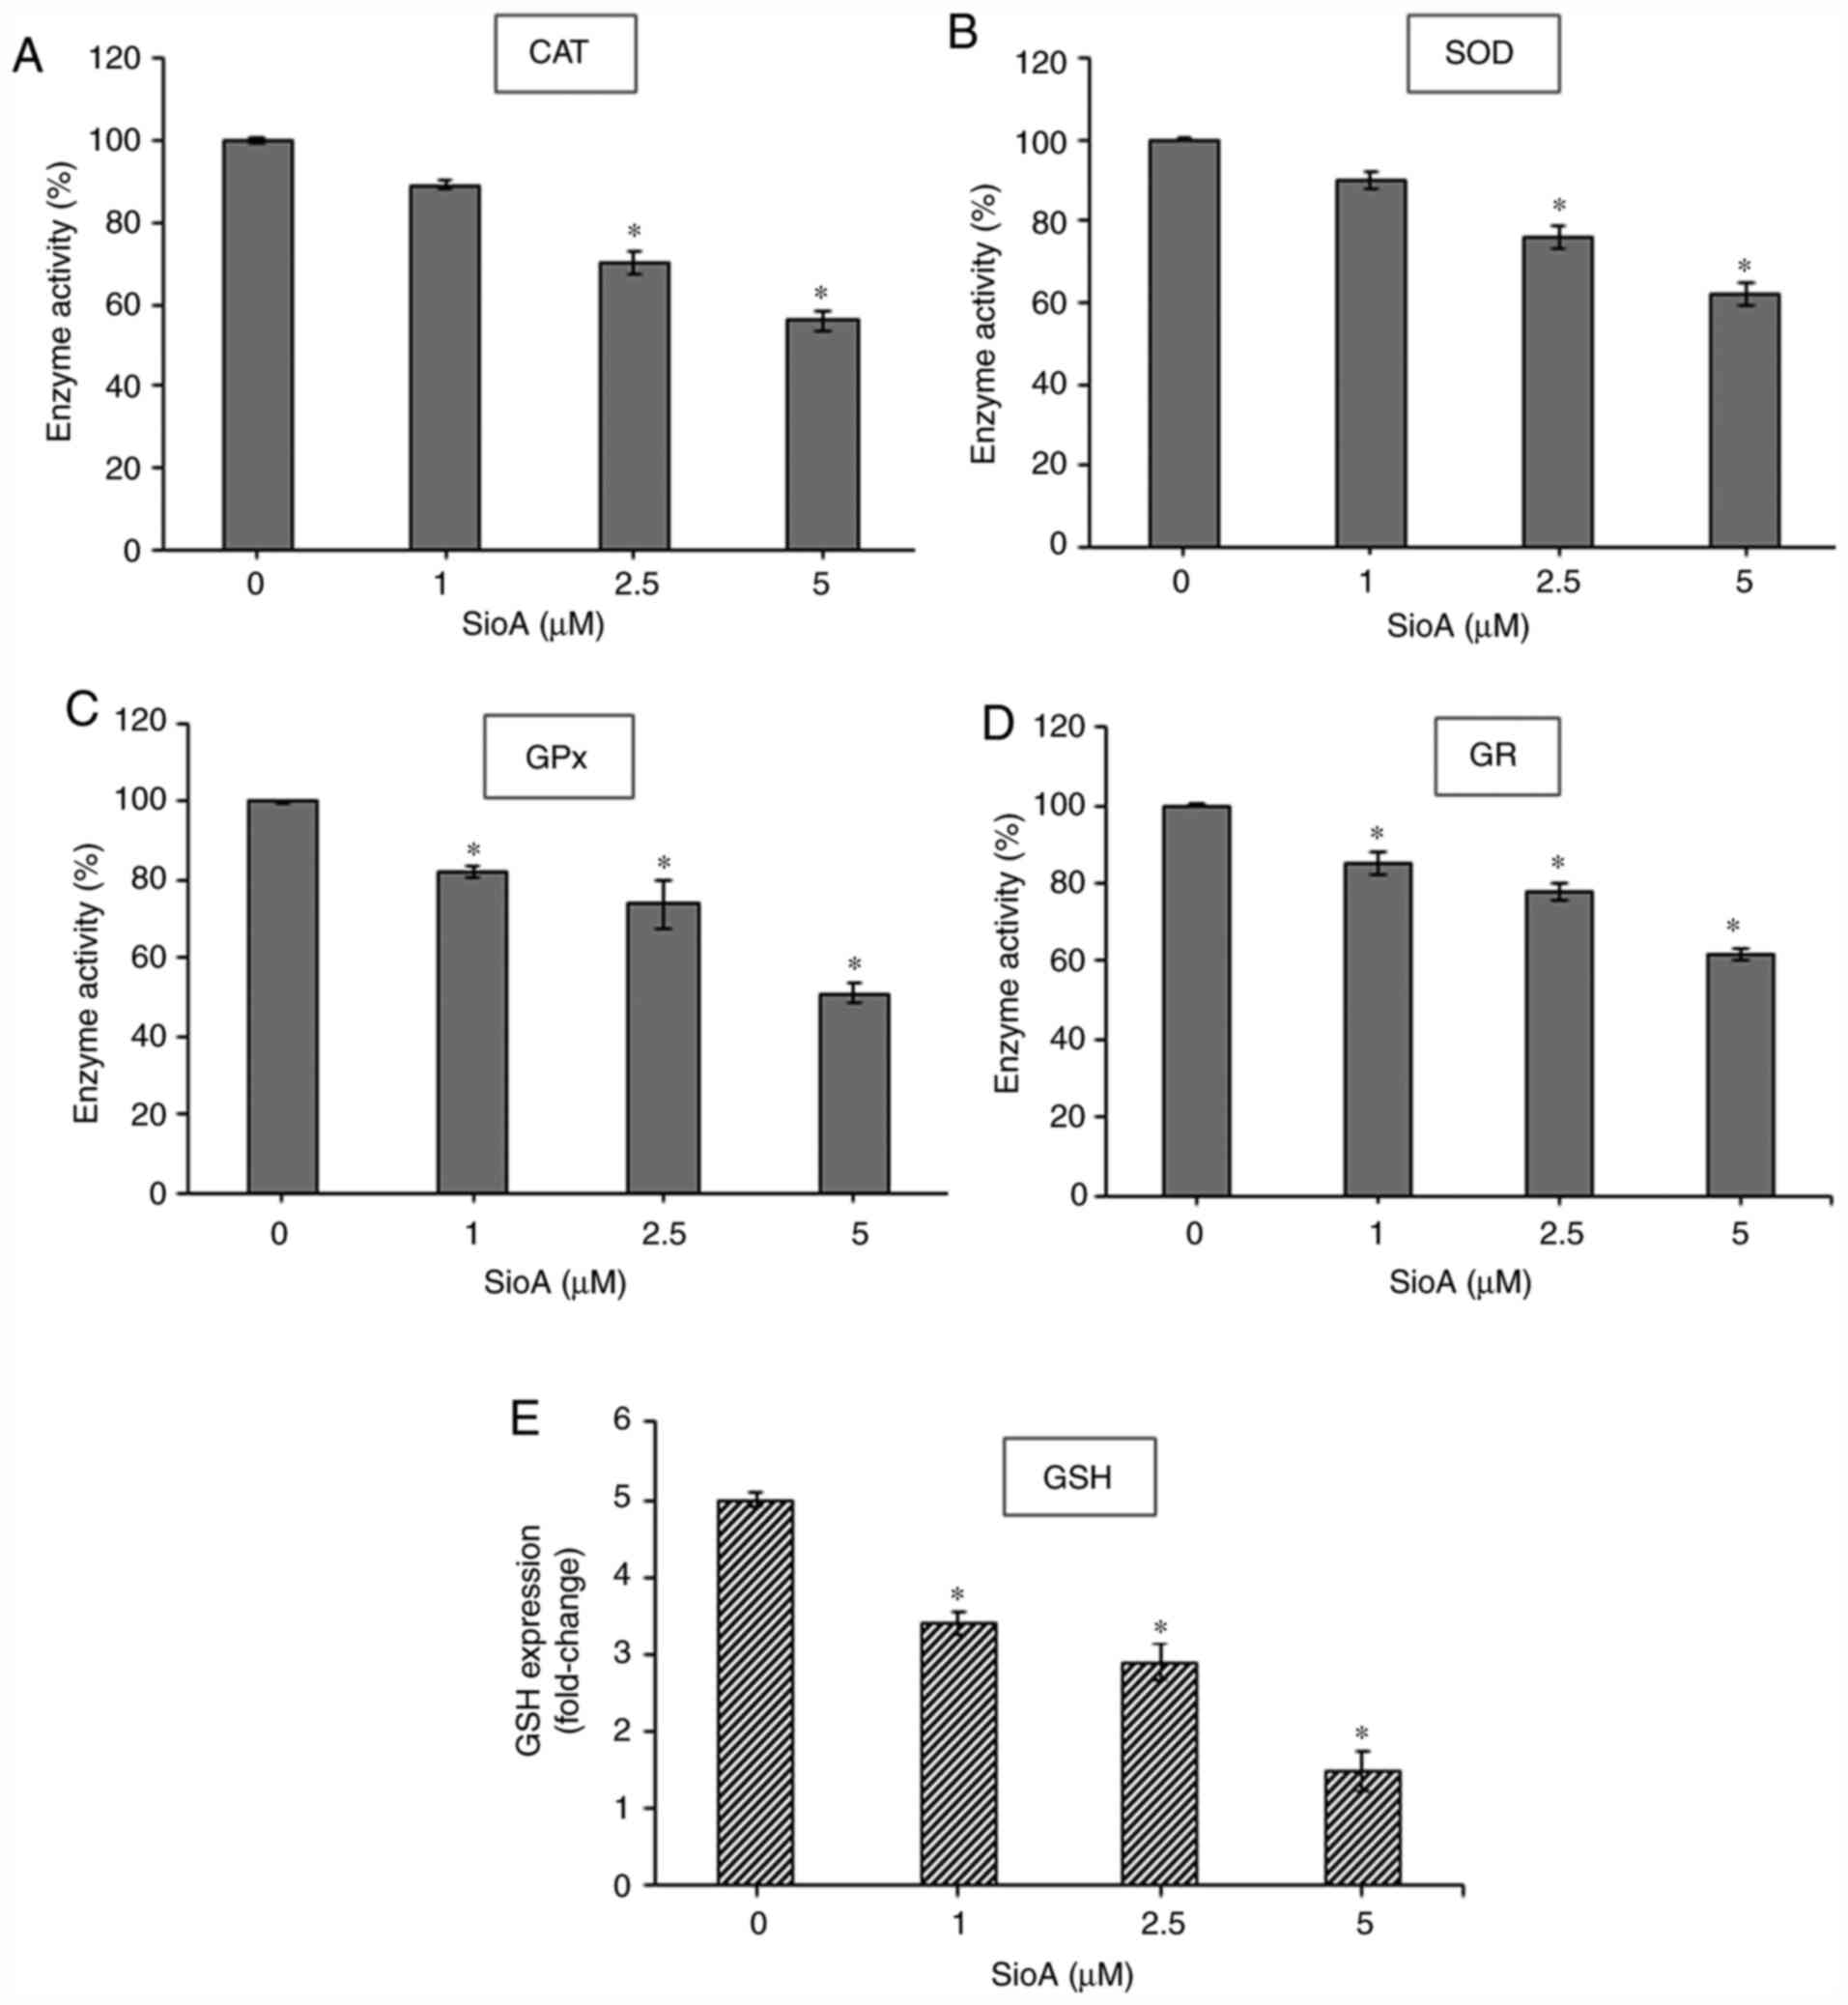
A-treated OC cells. Treatment of PA1 and OVCAR3 cells (Figs. 6 and 7, respectively) with 1, 2.5 and 5 µM
Siomycin A for 24 h significantly reduced the levels of the
antioxidant enzymes CAT (P<0.05; Fig.
6A; P<0.05; Fig. 7A), SOD
(P<0.05; Fig. 6B; P<0.05;
Fig. 7B), GPx (P<0.05; Fig. 6C; P<0.05; Fig. 7C) and GR (P<0.05; Fig. 6D and 7D) compared with those in the untreated
control cells. Combined with the aforementioned increases of ROS
levels, these results indicated that Siomycin A may inactivate the
antioxidant machinery in OC cells, leading to an uninhibited
increase of ROS that causes the loss of cell viability and cell
death.
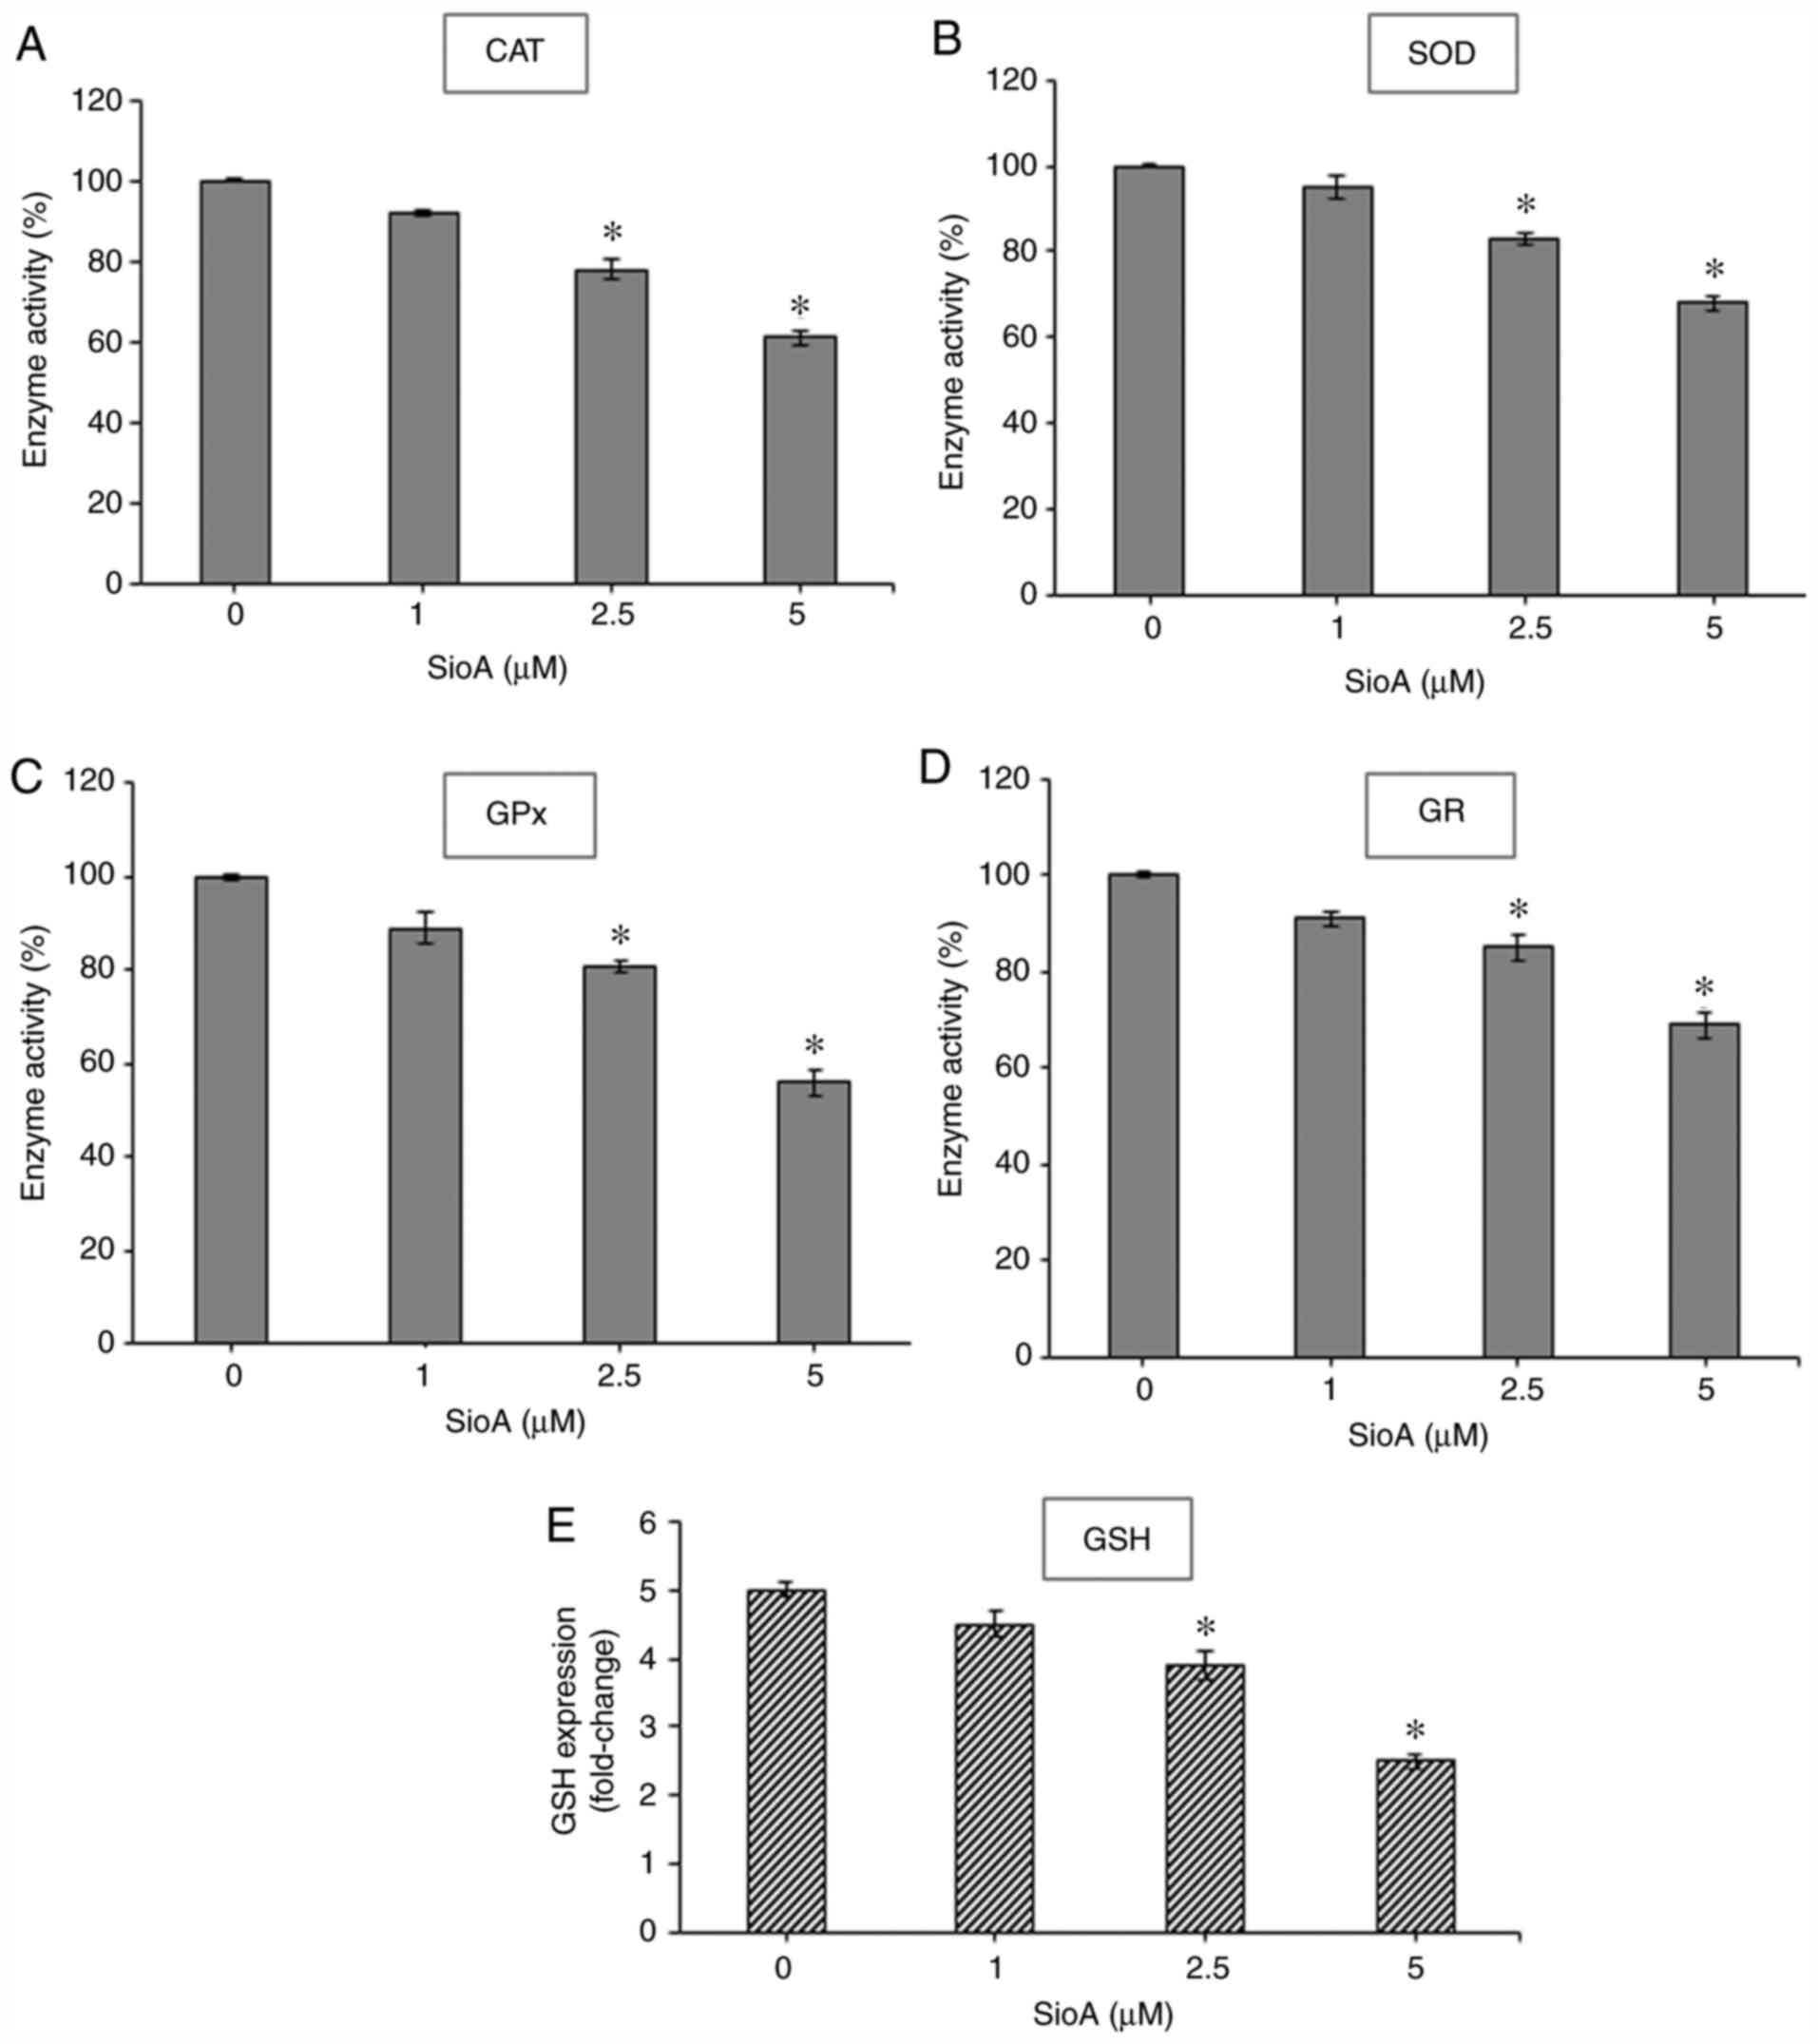 | Figure 6.SioA suppresses antioxidant enzyme
activity and intracellular GSH content of PA1 cells. (A-E) PA1
cells were incubated with 1, 2.5 and 5 µM SioA for 24 h, and
antioxidant enzyme activities from cell extracts were
spectrophotometrically assessed for (A) CAT, (B) SOD, (C) GPx, (D)
GR and (E) GSH. n=3. *P<0.05 vs. 0 µM SioA. SioA, Siomycin A;
CAT, catalase; SOD, superoxide dismutase; GPx. glutathione
peroxidase; GR, glutathione reductase; GSH, glutathione. |
 | Figure 7.SioA suppresses antioxidant enzyme
activity and intracellular GSH content of OVCAR3 cells. (A-E)
OVCAR3 cells were incubated with 1, 2.5 and 5 µM SioA for 24 h, and
antioxidant enzyme activities from cell extracts were
spectrophotometrically assessed for (A) CAT, (B) SOD, (C) GPx, (D)
GR and (E) GSH. n=3. *P<0.05 vs. 0 µM SioA. SioA, Siomycin A;
CAT, catalase; SOD, superoxide dismutase; GPx. glutathione
peroxidase; GR, glutathione reductase; GSH, glutathione. |
The antioxidant enzymes GPx and GR form a
well-regulated system to maintain the intracellular levels of GSH,
which is the major non-protein thiol that acts as an antioxidant
and a redox regulator in cells (30). Thus, the present study estimated the
intracellular GSH levels and demonstrated that treatment with
Siomycin A significantly decreased GSH levels in PA1 (P<0.05;
Fig. 6E) and OVCAR3 (P<0.05;
Fig. 7E) cells compared with the
untreated control sets. Therefore, Siomycin A may be as a
redox-active compound that alters the levels of intracellular GSH
to regulate redox signaling. High ROS levels cannot be balanced by
the decreasing antioxidant enzyme status in the Siomycin A-treated
OC cells, creating an imbalance in redox homeostasis and promoting
cancer cell death.
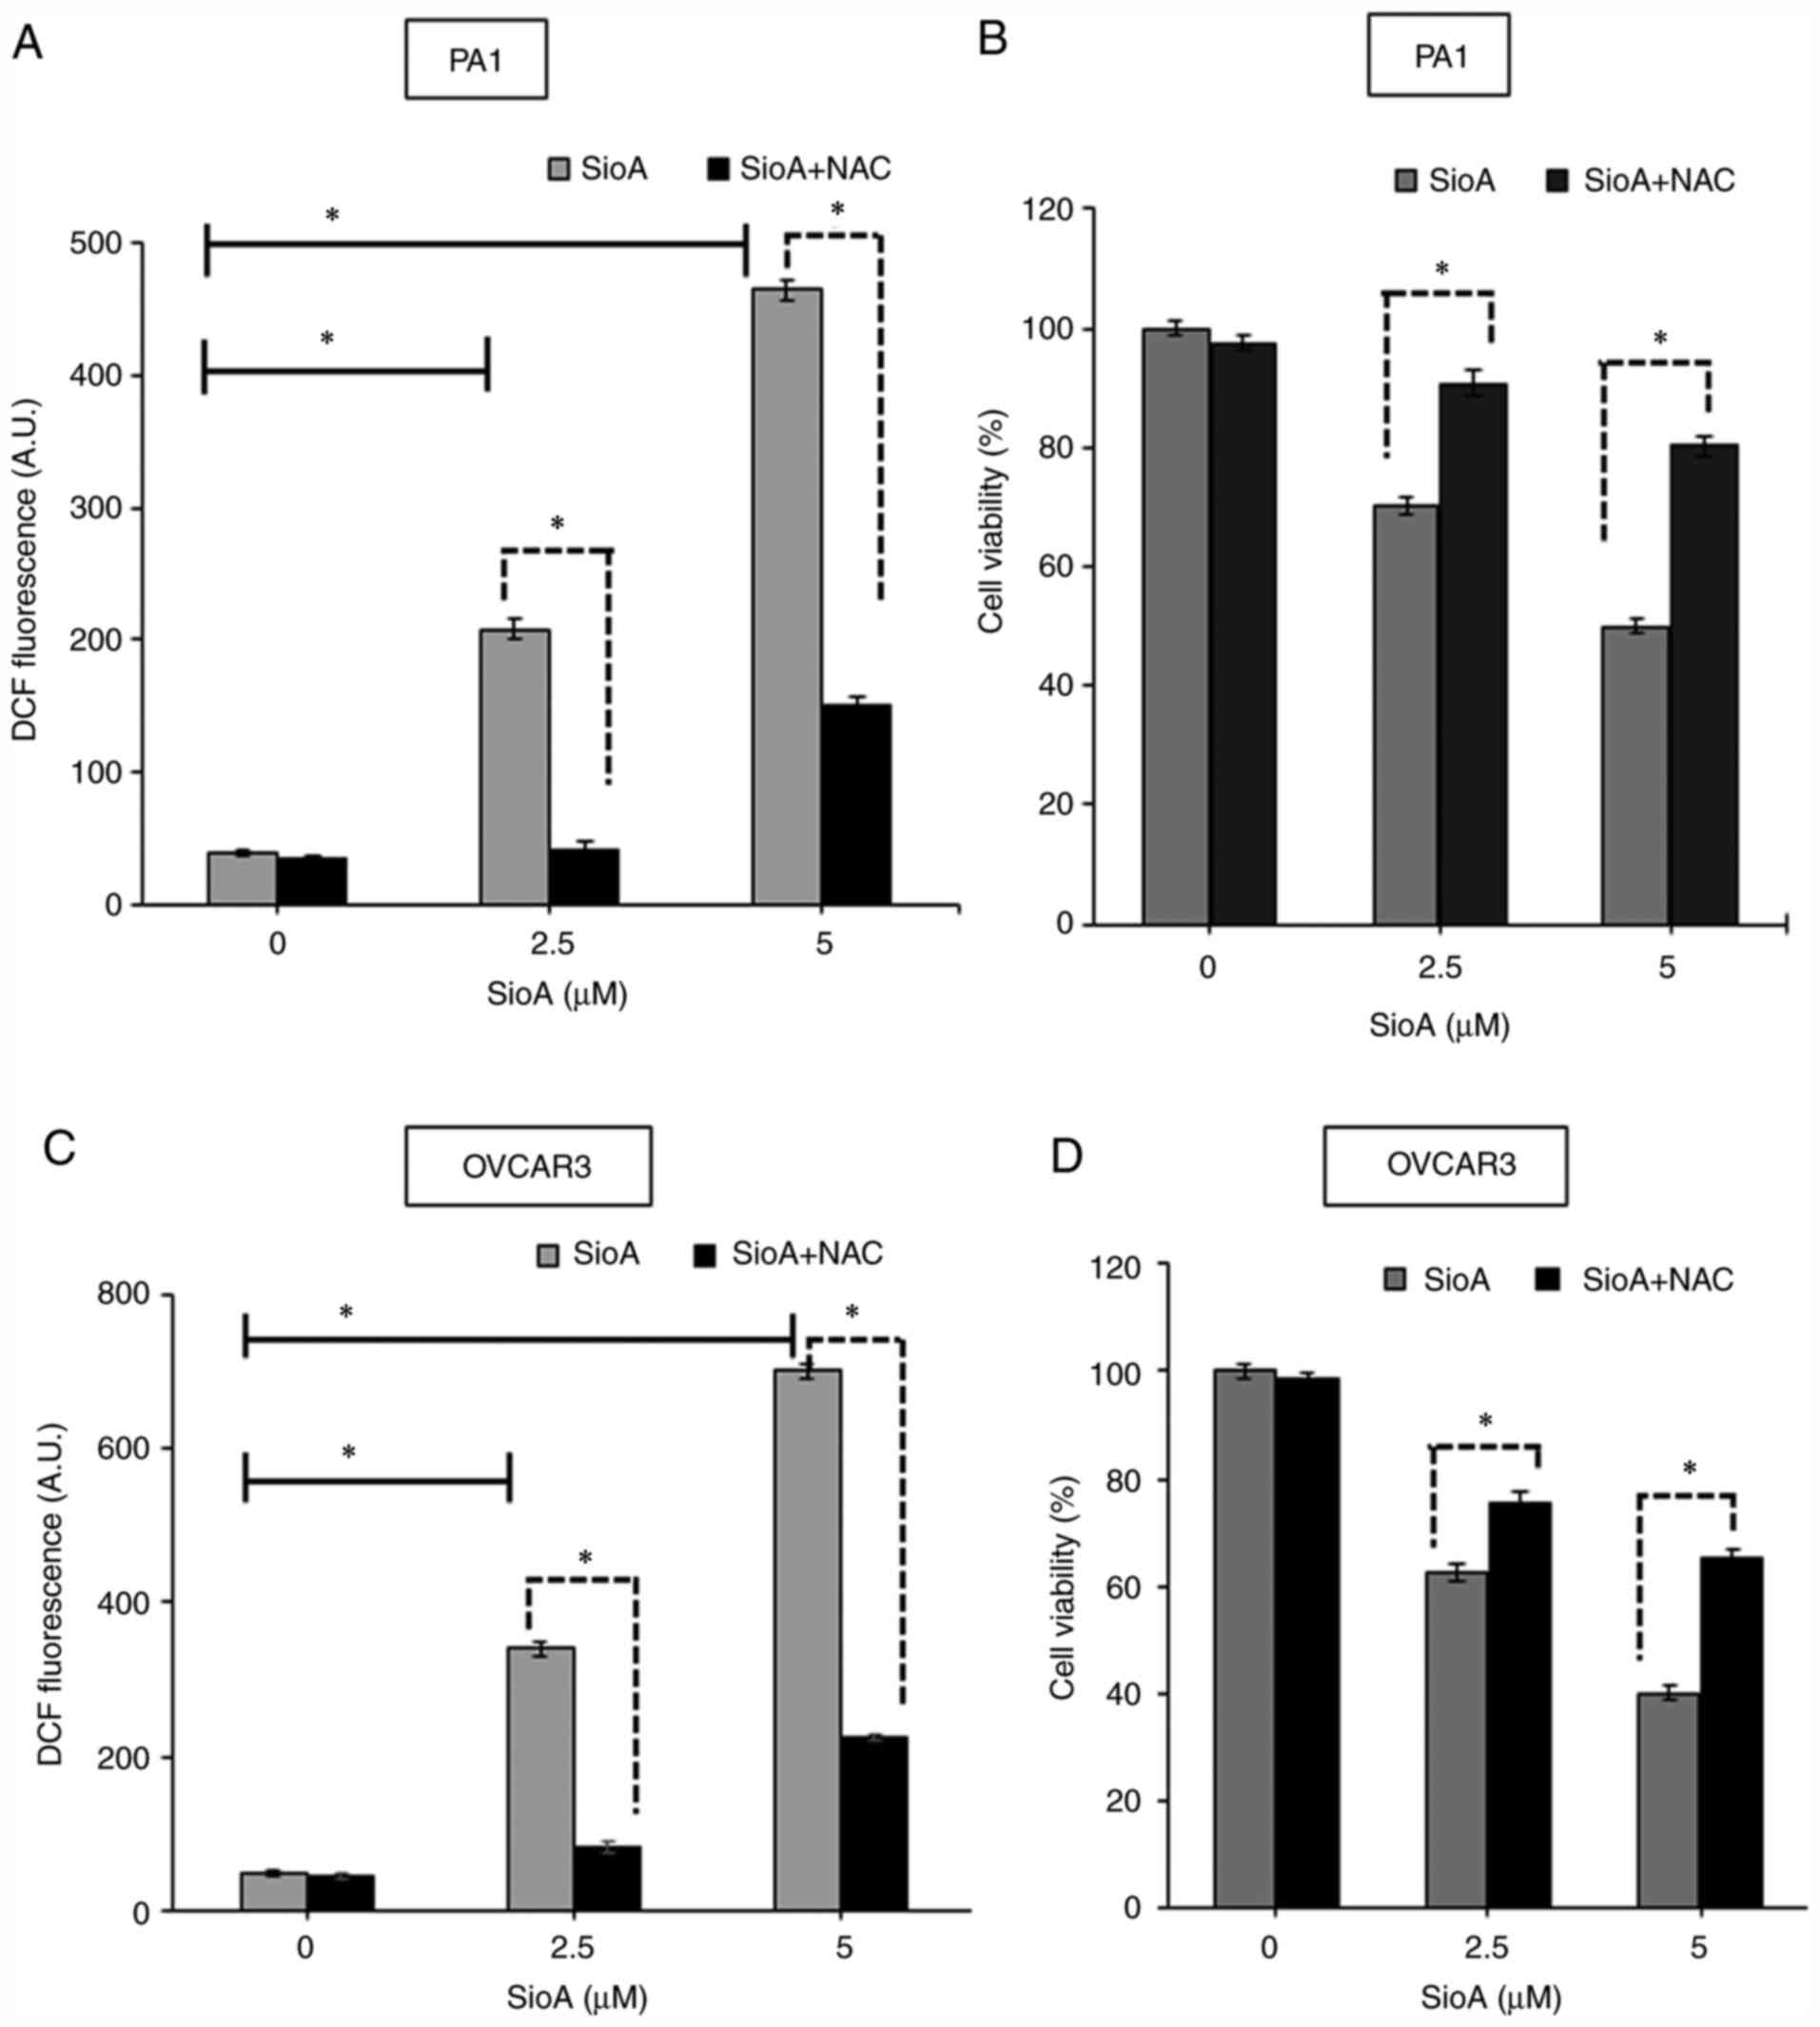
NAC attenuates Siomycin A-mediated
cytotoxicity in OC cells
To determine whether ROS generation may be a potent
cytotoxic mechanism in Siomycin A-treated OC cells, pretreatment
with the standard antioxidant 200 µM NAC for 6 h was performed
prior to treatment with Siomycin A. The results demonstrated that
treatment of PA1 cells with NAC + Siomycin A significantly reduced
the ROS levels by 4.24-fold in the NAC + 2.5 µM (P<0.05 and
9.4-fold in the NAC + 5 µM (P<0.05) Siomycin A groups relative
to Siomycin A treatment at the corresponding doses alone, as
indicated by the DCF fluorescence measurement (Fig. 8A). In addition, the MTT assay
revealed that pretreatment with NAC restored the viability of
Siomycin A-treated PA1 cells by 2.5 fold in the NAC + 2.5 µM
(P<0.05) and 4.2 fold in the NAC + 5 µM (P<0.05) Siomycin A
groups compared with Siomycin A treatment alone at both doses
(Fig. 8B). Similarly, in OVCAR3
cells, NAC + Siomycin A significantly reduced the ROS levels by
~5-fold in the NAC + 2.5 µM (P<0.05) and ~10-fold in the NAC + 5
µM (P<0.05) Siomycin A groups relative to Siomycin A treatment
alone at both concentrations (Fig.
8C). Pretreatment with NAC restored the viability of Siomycin
A-treated OVCAR3 cells, as demonstrated by MTT assay, by ~13% in
the NAC + 2.5 µM (P<0.05) and ~25% in the NAC + 5 µM (P<0.05)
Siomycin A groups compared with that in cells treated with Siomycin
A alone at both doses (Fig. 8D).
Therefore, ROS may serve a key role in Siomycin A-mediated
cytotoxicity of OC cells, and administration of the antioxidant NAC
abrogated this process and reversed the loss of cell viability.
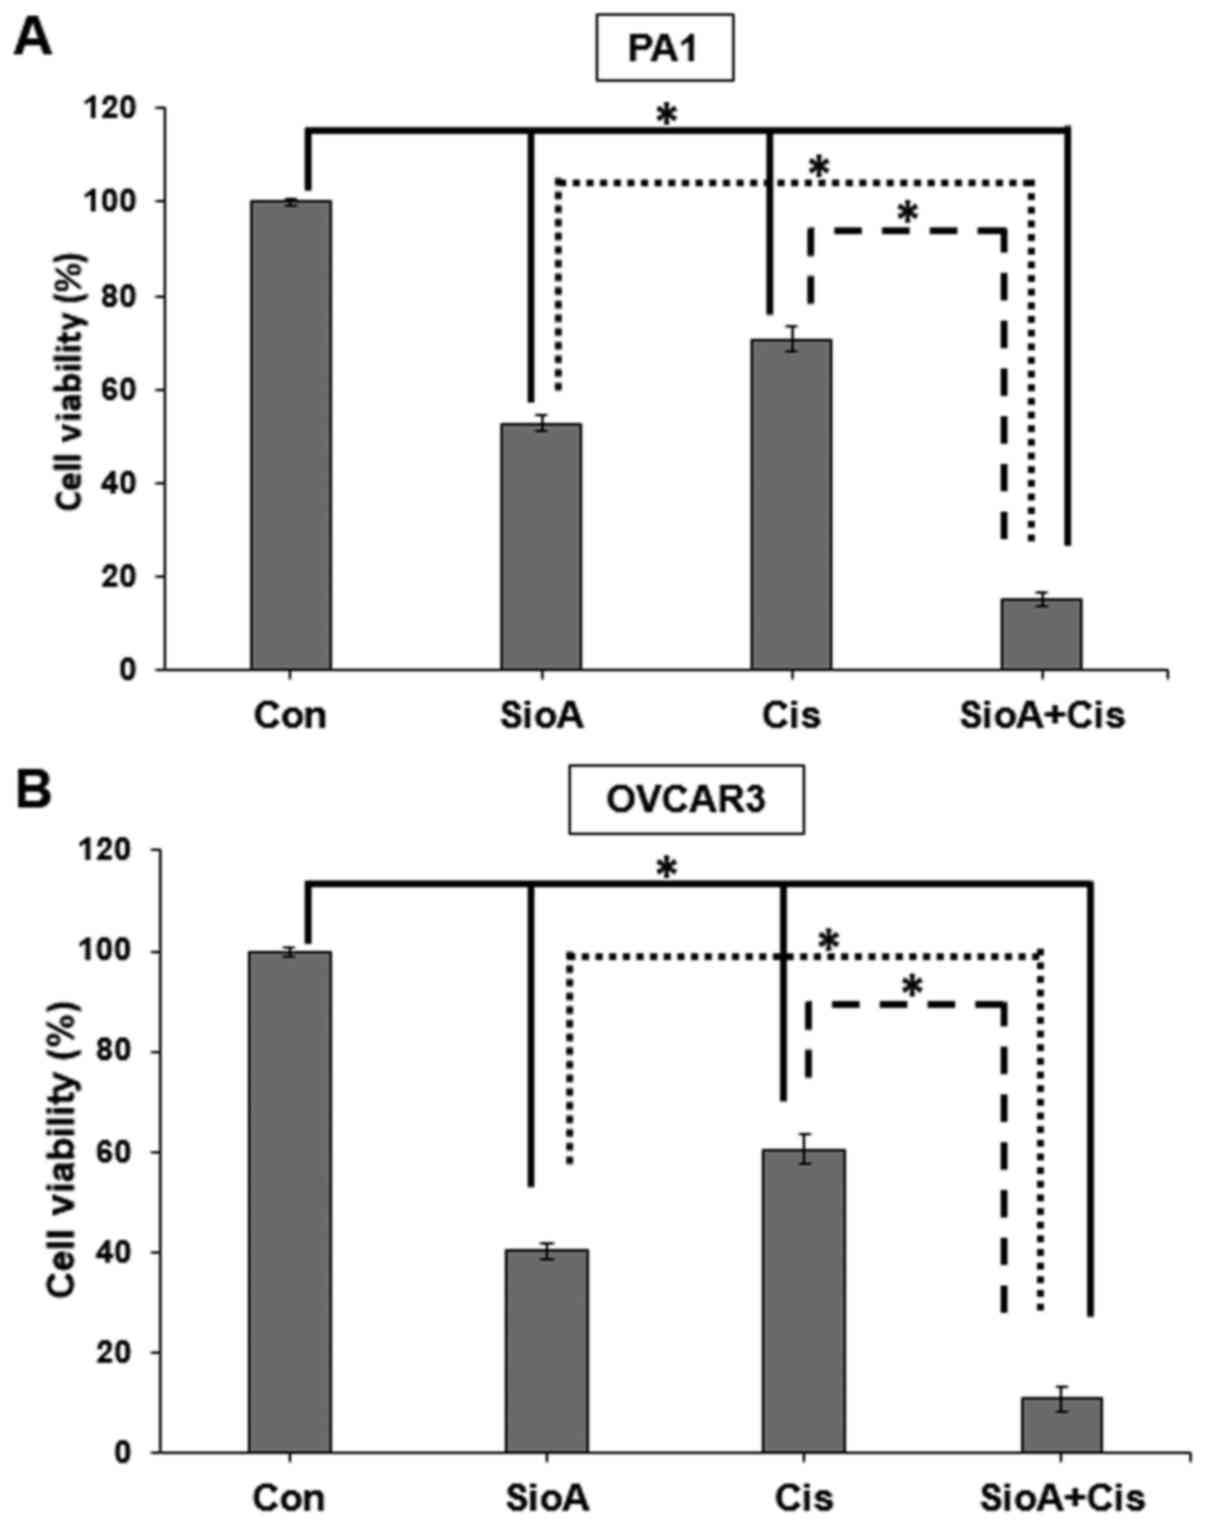
Siomycin A and cisplatin inhibit the
proliferation in OC cells in combination
Since a number of novel drug candidates act
synergistically with existing anticancer drugs to increase their
efficacy in targeting cancer cells, the present study further aimed
to determine whether Siomycin A may be paired with cisplatin, a
drug used in OC treatment that may lead to tumors acquiring
platinum resistance and result in a poor prognosis (31). We hypothesized that Siomycin A may
sensitize OC cells to cisplatin therapy, therefore decreasing their
chances of survival in a tumor. The results of the present study
demonstrated that when PA1 cells were co-treated with 5 µM Siomycin
A and 15 µM cisplatin, the cell viability was reduced to 15% of
that in the control group (P<0.05, which was lower compared with
Siomycin A (52%; P<0.05) or cisplatin (70%; P<0.05) treatment
alone (Fig. 9A). OVCAR3 cells were
highly susceptible to the co-treatment, as their viability was
reduced to 10% of that in the control group by co-treatment with 5
µM Siomycin A and 10 µM cisplatin (IC50 for OVCAR3; data
not shown) (P<0.05), which was lower compared with Siomycin A
(40%; P<0.05) and cisplatin (60%; P<0.05) alone (Fig. 9B).
For the combination study, single doses of Siomycin
A and cisplatin were selected against OC cells. Given that it is
not possible to determine whether the effect is additive or
synergistic from a single dose-combination, more doses of these two
drugs need to be included in prospective studies to determine the
combination index. Thus, these results demonstrated that
co-treatment with Siomycin A and cisplatin significantly increased
the viability inhibition in OC cells compared with monotherapy.
Discussion
Siomycin A is a thiazole-based antibiotic, isolated
from an endophytic Actinomycin sp, derived from the
medicinal plant Acanthopanax senticosus (32), which is effective against several
malignancies, such as pancreatic cancer, glioblastoma and melanoma
(32–35). The anticancer role of Siomycin A
against various cancer cells is well documented. The IC50 of
Syomyicn A was between 0.5 −2 µM against the cancer cell lines,
such as K562 cells (leukemia), MiaPaca-2 cells (pancreatic cancer),
MCF-7 cells (breast cancer) and A549 cells (lung adenocarcinoma)
(32,33). However, the anticancer property of
siomycin A against ovarian cancer and its underlying molecular
mechanism have not yet been investigated. Thus, the present study
aimed to investigate the effect of Siomycin A on two ovarian cancer
cell lines, PA1 and OVCAR3, and determine its underlying molecular
mechanism. Treatment of PA1 and OVCAR3 cells with Siomycin A for 72
h resulted in the drastic reduction of cell viability, and the IC50
values were observed at 5 and 2.5 µM doses of Siomycin A,
respectively. Notably, Siomycin A effectively inhibited the
viability and proliferation of OC cells, with limited toxicity on
lung fibroblast WI 38 cells. Furthermore, Siomycin A induced
apoptosis in OC cells by targeting the mitochondria, which resulted
in the decline of mitochondrial membrane potential and release of
cytochrome c into the cytosol. In addition, the expression
levels of pro-apoptotic proteins, such as Bax and caspase-3,
significantly increased in OC cells treated with Siomycin A.
Treatment with Siomycin A increased ROS production
in dose- and time-dependent manners, accompanied by inhibition of
the cellular antioxidant machinery. The cellular toxicity of
Siomycin A was enhanced in combination with cisplatin, suggesting
that this drug combination may act as a potent redox-directed
anticancer chemotherapy in targeting OC cells.
The present study is not without limitations. For
example, animal studies were not performed to prove the anticancer
effect of Siomycin A in in vivo conditions. However, based
on the significant effects of Siomycin A on OC cells in the present
study, it can be speculated that Siomycin A may be used as a
candidate drug against OC.
Acknowledgements
Not applicable.
Funding
No funding was received.
Availability of data and materials
The datasets used and/or analyzed during the present
study are available from the corresponding author upon reasonable
request.
Authors' contributions
XS performed the experiments, analyzed the data and
drafted the initial manuscript. FZ and XG performed the
experiements and analyzed the data. FX conceptualized the project
and drafted the initial manuscript. XS and FX confirmed the
authenticity of all the raw data. All authors have read and
approved the final manuscript.
Ethics approval and consent to
participate
Not applicable.
Patient consent for publication
Not applicable.
Competing interests
The authors declare that they have no competing
interests.
References
|
1
|
Zhang Y, Luo G, Li M, Guo P, Xiao Y, Ji H
and Hao Y: Global patterns and trends in ovarian cancer incidence:
Age, period and birth cohort analysis. BMC Cancer. 19:9842019.
View Article : Google Scholar : PubMed/NCBI
|
|
2
|
Reid BM, Permuth JB and Sellers TA:
Epidemiology of ovarian cancer: A review. Cancer Biol Med. 14:9–32.
2017. View Article : Google Scholar : PubMed/NCBI
|
|
3
|
Webb PM and Jordan SJ: Epidemiology of
epithelial ovarian cancer. Best Pract Res Clin Obstet Gynaecol.
41:3–14. 2017. View Article : Google Scholar : PubMed/NCBI
|
|
4
|
Pavlik EJ, Smith C, Dennis TS, Harvey E,
Huang B, Chen Q, Piecoro DW, Burgess BT, McDowell A, Gorski J, et
al: Disease-specific survival of type I and type II epithelial
ovarian cancers-stage challenges categorical assignments of
indolence & aggressiveness. Diagnostics (Basel). 10:E562020.
View Article : Google Scholar : PubMed/NCBI
|
|
5
|
Momenimovahed Z, Tiznobaik A, Taheri S and
Salehiniya H: Ovarian cancer in the world: Epidemiology and risk
factors. Int J Womens Health. 11:287–299. 2019. View Article : Google Scholar : PubMed/NCBI
|
|
6
|
Ottevanger PB: Ovarian cancer stem cells
more questions than answers. Semin Cancer Biol. 44:67–71. 2017.
View Article : Google Scholar : PubMed/NCBI
|
|
7
|
Cornelison R, Llaneza DC and Landen CN:
Emerging therapeutics to overcome chemoresistance in epithelial
ovarian cancer: A mini-review. Int J Mol Sci. 18:21712017.
View Article : Google Scholar
|
|
8
|
Bast RC Jr, Hennessy B and Mills GB: The
biology of ovarian cancer: New opportunities for translation. Nat
Rev Cancer. 9:415–428. 2009. View
Article : Google Scholar : PubMed/NCBI
|
|
9
|
Nakano I, Joshi K, Visnyei K, Hu B,
Watanabe M, Lam D, Wexler E, Saigusa K, Nakamura Y, Laks DR, et al:
Siomycin A targets brain tumor stem cells partially through a
MELK-mediated pathway. Neuro Oncol. 13:622–634. 2011. View Article : Google Scholar : PubMed/NCBI
|
|
10
|
Koh B, Jeon H, Kim D, Kang D and Kim KR:
Effect of fibroblast co-culture on the proliferation, viability and
drug response of colon cancer cells. Oncol Lett. 17:2409–2417.
2019.PubMed/NCBI
|
|
11
|
Shen X, Mustafa M, Chen Y, Cao Y and Gao
J: Natural thiopeptides as a privileged scaffold for drug discovery
and therapeutic development. Med Chem Res. 28:1063–1098. 2019.
View Article : Google Scholar
|
|
12
|
Tüfekçi Ö, Yandım MK, Ören H, İrken G and
Baran Y: Targeting FoxM1 transcription factor in T-cell acute
lymphoblastic leukemia cell line. Leuk Res. 39:342–347. 2015.
View Article : Google Scholar : PubMed/NCBI
|
|
13
|
Hou Y, Zhu Q, Li Z, Peng Y, Yu X, Yuan B,
Liu Y, Liu Y, Yin L, Peng Y, et al: The FOXM1-ABCC5 axis
contributes to paclitaxel resistance in nasopharyngeal carcinoma
cells. Cell Death Dis. 8:e26592017. View Article : Google Scholar : PubMed/NCBI
|
|
14
|
Gartel AL: A new target for proteasome
inhibitors: FoxM1. Expert Opin Investig Drugs. 19:235–242. 2010.
View Article : Google Scholar : PubMed/NCBI
|
|
15
|
Nowak A, Zakłos-Szyda M, Żyżelewicz D,
Koszucka A and Motyl I: Acrylamide decreases cell viability, and
provides oxidative stress, DNA damage, and apoptosis in human colon
adenocarcinoma cell line caco-2. Molecules. 25:3682020. View Article : Google Scholar
|
|
16
|
Maity G, De A, Das A, Banerjee S, Sarkar S
and Banerjee SK: Aspirin blocks growth of breast tumor cells and
tumor-initiating cells and induces reprogramming factors of
mesenchymal to epithelial transition. Lab Invest. 95:702–717. 2015.
View Article : Google Scholar : PubMed/NCBI
|
|
17
|
Harshkova D, Zielińska E and Aksmann A:
Optimization of a microplate reader method for the analysis of
changes in mitochondrial membrane potential in Chlamydomonas
reinhardtii cells using the fluorochrome JC-1. J Appl Phycol.
31:3691–3697. 2019. View Article : Google Scholar
|
|
18
|
Halliwell B and Whiteman M: Measuring
reactive species and oxidative damage in vivo and in cell culture:
How should you do it and what do the results mean? Br J Pharmacol.
142:231–255. 2004. View Article : Google Scholar : PubMed/NCBI
|
|
19
|
Beers RF Jr and Sizer IW: A
spectrophotometric method for measuring the breakdown of hydrogen
peroxide by catalase. J Biol Chem. 195:133–140. 1952. View Article : Google Scholar : PubMed/NCBI
|
|
20
|
Marklund S and Marklund G: Involvement of
superoxide anion radical in the autoxidation of pyrogallol and a
convenient assay for superoxide dismutase. Eur J Biochem.
47:469–474. 1974. View Article : Google Scholar : PubMed/NCBI
|
|
21
|
Zhu H, Zhang L, Itoh K, Yamamoto M, Ross
D, Trush MA, Zweier JL and Li Y: Nrf2 controls bone marrow stromal
cell susceptibility to oxidative and electrophilic stress. Free
Radic Biol Med. 41:132–143. 2006. View Article : Google Scholar : PubMed/NCBI
|
|
22
|
Forman HJ, Zhang H and Rinna A:
Glutathione: Overview of its protective roles, measurement, and
biosynthesis. Mol Aspects Med. 30:1–12. 2009. View Article : Google Scholar : PubMed/NCBI
|
|
23
|
Das A, Chakrabarty S, Choudhury D and
Chakrabarti G: 1, 4-Benzoquinone (PBQ) induced toxicity in lung
epithelial cells is mediated by the disruption of the microtubule
network and activation of caspase-3. Chem Res Toxicol.
23:1054–1066. 2010. View Article : Google Scholar : PubMed/NCBI
|
|
24
|
Ishiguro T, Ishiguro M, Ishiguro R and
Iwai S: Cotreatment with dichloroacetate and omeprazole exhibits a
synergistic antiproliferative effect on malignant tumors. Oncol
Lett. 3:726–728. 2012. View Article : Google Scholar : PubMed/NCBI
|
|
25
|
Tipgomut C, Wongprommoon A, Takeo E,
Ittiudomrak T, Puthong S and Chanchao C: Melittin induced g1 cell
cycle arrest and apoptosis in chago-k1 human bronchogenic carcinoma
cells and inhibited the differentiation of THP-1 cells into
tumour-associated macrophages. Asian Pac J Cancer Prev.
19:3427–3434. 2018. View Article : Google Scholar : PubMed/NCBI
|
|
26
|
Bustamante J, Caldas Lopes E, Garcia M, Di
Libero E, Alvarez E and Hajos SE: Disruption of mitochondrial
membrane potential during apoptosis induced by PSC 833 and CsA in
multidrug-resistant lymphoid leukemia. Toxicol Appl Pharmacol.
199:44–51. 2004. View Article : Google Scholar : PubMed/NCBI
|
|
27
|
Finucane DM, Bossy-Wetzel E, Waterhouse
NJ, Cotter TG and Green DR: Bax-induced caspase activation and
apoptosis via cytochromec release from mitochondria is inhibitable
by Bcl-xL. J Biol Chem. 274:2225–2233. 1999. View Article : Google Scholar : PubMed/NCBI
|
|
28
|
Liou GY and Storz P: Reactive oxygen
species in cancer. Free Radic Res. 44:479–496. 2010. View Article : Google Scholar : PubMed/NCBI
|
|
29
|
Valko M, Rhodes CJ, Moncol J, Izakovic M
and Mazur M: Free radicals, metals and antioxidants in oxidative
stress-induced cancer. Chem Biol Interact. 160:1–40. 2006.
View Article : Google Scholar : PubMed/NCBI
|
|
30
|
Filomeni G, Rotilio G and Ciriolo MR: Cell
signalling and the glutathione redox system. Biochem Pharmacol.
64:1057–1064. 2002. View Article : Google Scholar : PubMed/NCBI
|
|
31
|
Helm CW and States JC: Enhancing the
efficacy of cisplatin in ovarian cancer treatment-could arsenic
have a role. J Ovarian Res. 2:22009. View Article : Google Scholar : PubMed/NCBI
|
|
32
|
Wang B, Wang W, Meng HY, Chen J and Yuan
LJ: Effects and mechanism of siomycin A on the growth and apoptosis
of MiaPaCa-2 cancer cells. Oncol Lett. 18:2869–2876.
2019.PubMed/NCBI
|
|
33
|
Guo X, Liu A, Hua H, Lu H, Zhang D, Lin Y,
Sun Q, Zhu X, Yan G and Zhao F: Siomycin a induces apoptosis in
human lung adenocarcinoma A549 cells by suppressing the expression
of foxm1. Nat Prod Commun. 10:1603–1606. 2015.PubMed/NCBI
|
|
34
|
Radhakrishnan SK, Bhat UG, Hughes DE, Wang
IC, Costa RH and Gartel AL: Identification of a chemical inhibitor
of the oncogenic transcription factor forkhead box M1. Cancer Res.
66:9731–9735. 2006. View Article : Google Scholar : PubMed/NCBI
|
|
35
|
Lee VS, McRobb LS, Moutrie V, Santos ED
and Siu TL: Effects of FOXM1 inhibition and ionizing radiation on
melanoma cells. Oncol Lett. 16:6822–6830. 2018.PubMed/NCBI
|