Introduction
Bone and soft-tissue sarcomas are rare and highly
heterogeneous mesenchymal malignancies, encompassing more than 70
distinct histological subtypes with various clinical features. They
include liposarcoma, leiomyosarcoma, synovial sarcoma,
angiosarcoma, malignant peripheral nerve sheath tumors,
osteosarcoma, Ewing sarcoma, chondrosarcoma, and many others
(1,2). Soft-tissue sarcomas account for only 1%
of all malignancies (3), and bone
sarcomas are even 8–10 times less common than soft-tissue sarcomas
(4).
Chemotherapy is the main treatment modality used in
unresectable sarcomas. This modality includes conventional
cytotoxic drugs, such as doxorubicin, ifosfamide, dacarbazine,
epirubicin, gemcitabine, temolozomide, docetaxel, trabectedin, and
eribulin (5–7). Moreover, the multi-target tyrosine
kinase inhibitor pazopanib, which inhibits vascular endothelial
growth factor receptors (VEGFRs), platelet-derived growth factor
receptors, KIT, and other receptor tyrosine kinases, has recently
been adopted in the treatment of soft-tissue sarcomas (8). However, for many sarcomas, no standard
pathological or molecular biomarker exists that can predict the
clinical outcomes of patients on different drug therapies, and
these drugs have limited effects. Because sarcomas are rare, it is
challenging to collect clinical data from prospective clinical
trials with patients with specific histological subtypes of
sarcomas. Therefore, the diagnoses and treatment of sarcoma needs
to be further developed.
In recent years, long non-coding RNA (lncRNA) has
attracted great attention as a potential diagnostic, prognostic,
and predictive biomarkers in the treatment of various cancers.
lncRNAs are transcripts composed of more than 200 nucleotides that
do not encode proteins (9). The
number of known human lncRNAs is gradually on the rise, with about
96,000 currently described, according to the NONCODEV5 database
(10). Accumulating evidence has
demonstrated an association between the altered expression of some
lncRNAs with various cancer types. These include GAS5,
LINC-PINT, MEG3, HOTAIR and MALAT1, which are involved
in various cellular functions such as proliferation, survival,
metastasis, and genomic stability (11). Moreover, some of these lncRNAs may be
used as prognostic biomarkers, such as HOTAIR in breast
cancer (12) and gastrointestinal
cancers (13), and MALAT1 in
lung cancer (14). Likewise, in
osteosarcoma, some lncRNAs have been reported as prognostic
biomarkers (15–17). In addition to detecting lncRNA
expression levels in tumor tissues, detecting lncRNA in the plasma
might be useful in the diagnosis and to develop treatment
strategies for patients with cancer (18). Thus, the clinical application of
lncRNAs as biomarkers in the treatment of patients with cancer is
currently researched. However, few reports have identified the
biological roles of lncRNAs or their clinical utility in sarcomas,
particularly soft-tissue sarcomas.
In this study, we screened for lncRNAs that are
specifically dysregulated in bone and soft-tissue sarcoma cell
lines and patients, by using a multiplex polymerase chain reaction
(qPCR) assay and genome-wide RNA expression analysis. Furthermore,
using knockdown systems, we sought to clarify whether lncRNAs play
a role in drug sensitivity to pazopanib in sarcoma cell lines. We
identified a lncRNA highly accelerated region 1B
(HAR1B), which is highly expressed in cell lines sensitive
to pazopanib and in patients with sarcoma who benefited from
pazopanib therapy, and found that its suppression led to an
increased resistance to pazopanib in sarcoma cell lines.
Materials and methods
Cell lines
A total of 16 bone or soft-tissue sarcoma cell lines
were used in this study. These include SW872 (liposarcoma), HT1080
(fibrosarcoma), SK-LMS-1 (leiomyosarcoma), A204 (rhabdomyosarcoma),
RD (rhabdomyosarcoma), ISO-HAS-B (angiosarcoma), HS-sch2 (malignant
peripheral nerve sheath tumor, MPNST), FMS-1 (MPNST), SFT8611
(MPNST), SFT9817 (MPNST), YST-1 (MPNST), S462 (NF-1 associated
MPNST), HS-SY-II (synovial sarcoma), Yamato-SS (synovial sarcoma),
SaOs2 (osteosarcoma), and MG63 (osteosarcoma). SW872, HT1080,
SK-LMS-1, A204, and RD were purchased from the American Type
Culture Collection. HS-sch2, HS-SY-II and Yamato-SS were purchased
from the Riken Bioresource Center (Ibaraki, Japan). YST-1, SaOs2,
and MG63 were purchased from Tohoku University Cell Resource Center
for Biomedical Research Cell Bank (Miyagi, Japan). FMS-1 (19) was provided by Dr Michiyuki Hakozaki
from the First Department of Pathology, Fukushima Medical
University School of Medicine (Fukushima, Japan). SFT8611 and
SFT9817 (20) were kindly provided
by Dr Mikiko Aoki and Dr Kazuki Nabeshima at the Department of
Pathology, Fukuoka University School of Medicine (Fukuoka, Japan).
S462 (21) was provided by Dr Lan
Kluwe from the Department of Oral and Maxillofacial Surgery, the
University Medical Center Hamburg-Eppendorf (Hamburg, Germany).
ISO-HAS-B (22) was provided by Dr
Mikio Masuzawa from the School of Allied Health Science, Kitasato
University (Kanagawa, Japan). The cell lines were regularly
authentificated by short tandem repeat analysis. SW872, SK-LMS-1,
RD, ISO-HAS-B, HS-sch2, S462, HS-SY-II, Yamato-SS, and MG63 were
maintained in Dulbecco's modified Eagle's medium (DMEM) with high
glucose. HT1080, A204, FMS-1, YST-1 and SaOs2 were maintained in an
RPMI-1640 medium. SFT8611 and SFT 9817 were maintained in a
DMEM/F12 medium. These media included 10% fetal bovine serum. The
cells were grown at 37°C under 5% CO2.
MTT assay
Pazopanib was purchased from Adooq Bioscience
(GW-786034). Pazopanib was diluted in dimethyl sulfoxide to 10 mM
and the required concentrations were added to the respective
media.
Using a 96-well plate, the following cell numbers of
each sarcoma cell line were seeded in individuals wells: 2,500 of
SW872, 500 of HT1080, 3,000 of SK-LMS-1, 2,000 of A204, 2,500 of
RD, 2,000 of ISO-HAS-B, 1,000 of S462, 2,000 of FMS-1, 1,000 of
SFT8611, 2,500 of SFT9817, 2,500 of HS-sch2, 3,000 of YST-1, 2,000
of HS-SY-II, 3,000 of Yamato-SS, 2,000 of SaOs2, and 1,000 of
MG-63. To calculate the pazopanib inhibitory potency
(IC50) for the 16 sarcoma cell lines, at least seven
different doses of pazopanib were used. Cells were treated with
pazopanib and were seeded 24 h after onto the plates. The cell
viability was measured after 72 h using the Cell Counting Kit-8
(Dojindo Laboratories), according to the manufacturer's protocol.
Cell viability (%) was calculated by dividing the median value for
each pazopanib dose (conducted at least in triplicates) by the
value of untreated cells. IC50 values were calculated
using the dosages from the two-cell viability values surrounding
50%. From the results obtained from three or more independent
experiments, we calculated the IC50 data.
lncRNA expression profiles in sarcoma
cell lines analyzed by multiplex real-time RT-PCR
The total RNA obtained from the 16 sarcoma cell
lines was extracted using RNeasy Mini kit (Qiagen) and quantified
by NanoDrop-1000 v3.8.1 (Thermo Fisher Scientific, Inc.). The
LncProfiler qPCR Array Kit (System Bioscience) recognizes 90
cancer-related or stem cell-related lncRNAs, and was used to
analyze lncRNA expression profiles in the 16 sarcoma cell lines,
according to the manufacturer's protocol. In brief, cDNA was
synthesized using the GeneAmp PCR system 9700 (Thermo Fisher
Scientific, Inc.). The 90 cancer-related or stem cell-related
lncRNAs and 5 control RNAs for normalization (composed of 18S
rRNA, RNU43, GAPDH, LAMIN A/C, and U6) were quantified
by real-time PCR using CFX96 (Bio-Rad). The thermal cycling was
programmed for 2 min at 50°C and 10 min at 95°C, followed by 40
cycles of 15 sec at 95°C and 1 min at 60°C. The geometric mean
values for the expression of the four control RNAs, except 18S
rRNA whose expressions was inconsistent among the cell lines,
were used to normalize the relative expression values of each
lncRNA. Expression data are expressed as mean values from the
results obtained from at least two independent experiments in each
cell line. When the fold change (FC) in mean lncRNA expression
levels of the sensitive cells versus those of the resistant cells
was >1.5 or <0.67, with P<0.10, the lncRNAs were
considered to be candidates for factors that affect cellular
sensitivity to pazopanib.
Patients
We recruited 39 patients with bone or soft-tissue
sarcoma who were on pazopanib therapy between December 2012 and
June 2018 in the Tohoku University Hospital. Patients were regarded
eligible if they were aged 20 years or older; had histologically
confirmed unresectable, recurrent, or metastatic bone or
soft-tissue sarcoma of extremity, trunk, retroperitoneal, or any
organs; formalin-fixed paraffin-embedded (FFPE) tissues were
available. Pathological diagnosis was performed by a pathologist
(M.M.). Tumor tissues were generally resected with at least 5-mm
margin from normal tissues. DNA and RNA were extracted from the
macro-dissected tumor cells. Written informed consent was obtained
from all patients. Their records were retrospectively reviewed for
information on the clinical characteristics of the patients and
tumors, changes in tumor size, overall response rate,
progression-free survival (PFS) after the initiation of drug
therapies, and overall survival (OS). The change in tumor size of
one or two measurable lesions, overall response rate, and PFS were
calculated based on Response Evaluation Criteria in Solid Tumor
ver1.1 (23).
Global gene and lncRNA expression
analyzed by microarrays
Total RNA from FFPE sarcoma tissues were extracted
using the RNeasy FFPE kit (Qiagen). The levels of RNA degradation
were analyzed with a Bioanalyzer-2100 (Agilent Technologies), and
the RNA quality was confirmed based on the manufacturer's protocol
(Agilent Technologies, http://www.agilent.com/). The genome-wide gene and
lncRNA expression levels of the 23 bone or soft-tissue sarcoma
tissues were analyzed using SurePrint G3 Hyman Gene Expression
8×60K ver. 3.0 microarray (Agilent Technologies), which covers
58,341 probes including 26,083 coding genes and 30,606 lncRNAs. To
analyze the gene and lncRNA expressions of the 16 sarcoma cell
lines, we performed microarray analyses using SurePrint G3 Hyman
Gene Expression 8×60K ver. 3.0, according to the manufacturer's
protocol (Agilent Technologies). The microarray data were extracted
and analyzed using the Feature Extraction ver. 10.7 (Agilent
Technologies; http://www.agilent.com/cs/library/usermanuals/public/G4460-90026_FE_Reference.pdf)
and the GeneSpring ver. 14.5 (Agilent Technologies). We classified
the differentially expressed probes between responders and
non-responders, either with FC >1.5 or <0.67 (P<0.1), as
the lncRNAs that might be related to pazopanib sensitivity.
Knockdown of HAR1B by siRNA and its
influence on cellular sensitivity to pazopanib
HS-SY-II and Yamato-SS cells were used in the
HAR1B knockdown assay to determine whether alterations in
HAR1B expression affected cellular sensitivity to pazopanib
treatment. The cells were transfected with si-HAR1B (Mission siRNA
HAR1B, #SASI_Hs02_00378868_AS; Sigma-Aldrich; Merck KGaA) or
si-negative control (MISSION siRNA Universal Negative Control#1,
#SIC001) at a final concentration of 5.7 nM using Lipofectamine
2000 (#11668019; Invitrogen; Thermo Fisher Scientific, Inc.),
according to the manufacturer's protocol.
Total RNA was extracted from the cells using the
RNeasy Mini kit (Qiagen). cDNA was prepared using the 5×
PrimeScript RT Master Mix (Takara), 48 and 72 h after transfection
in HS-SY-II and Yamato-SS cells, respectively. Real-time PCR
primers for HAR1B (VC00026) were purchased from
Sigma-Aldrich; Merck KGaA. HAR1B expression levels were
normalized by GAPDH expression detected by primers for
GAPDH (forward: ACCCAGAAGACTGTGGATGG, reverse:
CAGTGAGCTTCCCGTTCAG). The PowerUp SYBR-Green Master Mix (Applied
Biosystems) was used for real-time PCR. The thermal cycling was
programmed for 2 min at 50°C and 10 min at 95°C, followed by 40
cycles of 15 sec at 95°C and 1 min at 60°C. Each sample was
amplified in triplicate and the mean expression values were
obtained from at least three independent experiments.
Twenty-four hours after transfection, 0, 1, 2, and 4
µM of pazopanib for HS-SY-II cells, and 0, 1, 2, and 5 µM for
Yamato-SS cells, were respectively added to the medium, and cell
viability was measured by the MTT assay, as described above, after
48 h for HS-SY-II cells, or 72 h for Yamato-SS cells. Each sample
was amplified in triplicate during each run, and the mean viability
values were obtained from at least four independent experiments in
each cell line.
Statistical analyses
Significance analyses of gene expression and cell
viability assays were conducted using unpaired or paired t-tests.
Hierarchical clustering and heat-map generation were performed
using R (version 3.6.1, R Development Core Team, http://www.R-project.org/) in multiplex lncRNA
real-time RT-PCR analysis, and GeneSpringGX 14.5 (Agilent
Technologies, http://www.agilent.com/cs/library/usermanuals/public/GeneSpring_manual.pdf)
in microarray analyses. Survival analyses was performed using JMP
Pro ver.14.2.0 (SAS Institute Inc.). Kaplan-Meier analyses were
used to estimate the distributions of PFS or OS, and a log-rank
test was used to analyze the statistical differences in
survival.
Gene enrichment analysis and functional annotation
clustering were performed using the David analysis (24), according to the instruction (ver.
6.8, http://david.ncicrf.gov). In brief, we
uploaded a list of each Entrez Gene ID of our 306 genes into the
DAVID webpage. The threshold for the number of genes was 2. The
gene enrichment was quantitatively measured by modified Fisher's
exact test. There were 65 annotation terms with P-value <0.01.
For functional annotation clustering, an enrichment score of 1.30
or higher is considered statistically significant.
Results
Sensitivity to pazopanib in 16 sarcoma
cell lines
To elucidate cellular sensitivity to pazopanib, we
first performed MTT assays and calculated the IC50
values of the 16 bone or soft-tissue sarcoma cell lines. The most
sensitive cell line was A204 (IC50 value of 0.08 µM),
and the most resistant cell line was SFT8611 (IC50 value
of 141 µM) (Fig. 1A). Preclinical
models showed that pazopanib activity depended on reaching a
steady-state concentration of >40 µM (25), and a phase I clinical trial showed
that in most patients, 800 mg pazopanib once daily as a current
standard clinical dose helped achieve a plasma concentrations of
>34 µM pazopanib after 24 h (26). Based on these previous data, we
categorized the cell lines as ‘sensitive’ cell lines with regard to
pazopanib (IC50 values <20 µM: A204, HS-SY-II,
Yamato-SS, and YST-1) and ‘resistant’ (the other 12 cell lines)
(Fig. 1A).
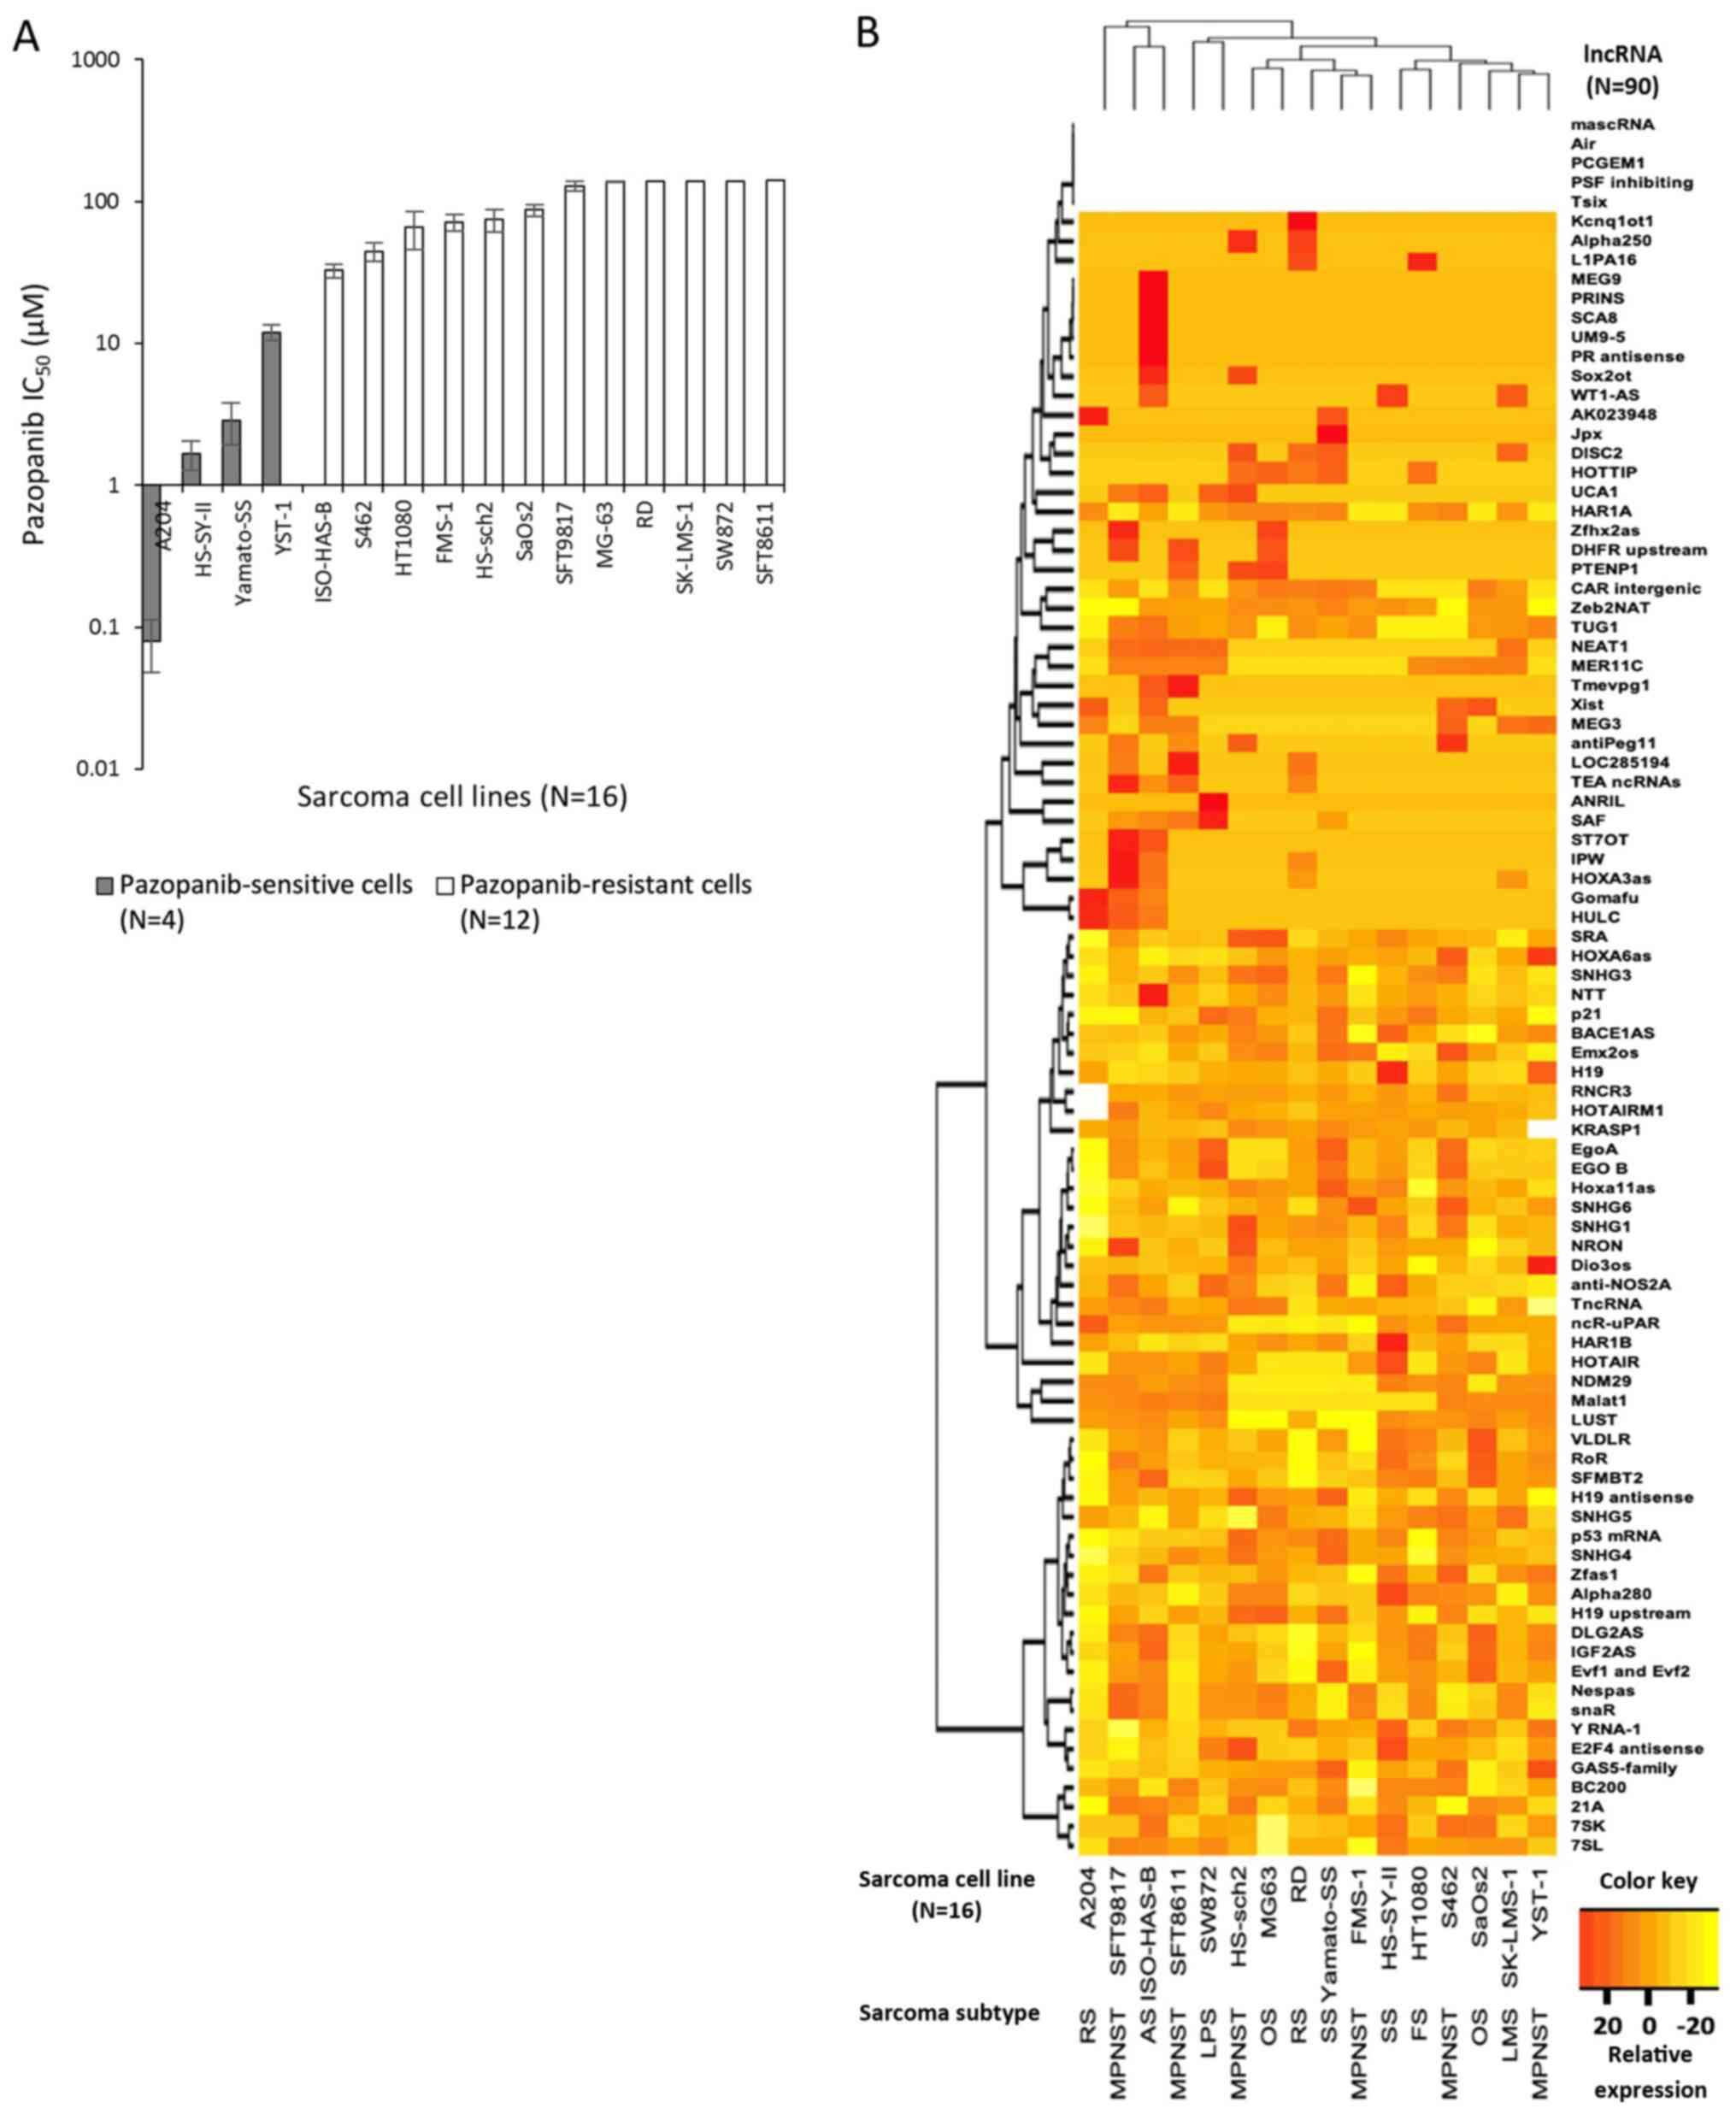 | Figure 1.Sensitivity to pazopanib and lncRNA
expression in 16 bone or soft-tissue sarcoma cell lines. (A)
IC50 values of 16 sarcoma cell lines treated with
pazopanib were analyzed by an MTT assay. Four sarcoma cell lines
with IC50 values <20 µM were classified as
pazopanib-sensitive cell lines, while the other 12 cell lines were
categorized as pazopanib-resistant cell lines. Data are presented
as the logarithmic value of the mean ± SEM. (B) Expression of 90
lncRNAs in 16 sarcoma cell lines analyzed by multiplex qPCR
analysis. Clustering analysis using the complete method revealed
that clustering did not depend on the histological subtype. Each
lncRNA expression value was normalized to a geometric mean value of
four normalization genes, RNU43, GAPDH, LAMIN A/C and
U6. Five lncRNAs were not detected in any of the 16 sarcoma
cell lines. Data are shown as relative expression mean values.
lncRNA, long non-coding RNA; RS, rhabdomyosarcoma; MPNST, malignant
peripheral nerve sheath tumor; AS, angiosarcoma; LPS, liposarcoma;
OS, osteosarcoma; SS, synovial sarcoma; FS, fibrosarcoma; LMS,
leiomyosarcoma. |
Screening for candidate lncRNAs
differentially expressed between pazopanib-sensitive and
pazopanib-resistant cell lines
We then analyzed the expression profiles of 90
lncRNAs among the 16 cell lines using multiplex real-time RT-PCR.
As shown in Fig. 1B, each of the 16
cell lines had distinct lncRNA expression profiles. The expression
profiles did not seem to depend solely on histological subtype,
although the number of cell lines was too small to draw a firm
conclusion.
We next tried to identify lncRNAs differentially
expressed between the sensitive and resistant cell lines. The
expression of each lncRNA expression was compared between the
sensitive and resistant cells using unpaired t-tests (Table SI). When the FC in mean lncRNA
expression levels of the sensitive cells versus those of the
resistant cells was >1.5 or <0.67, with P<0.10, we
hypothesized that the lncRNAs were candidates for factors that
affect cellular sensitivity to pazopanib. A total of 12 lncRNAs
including BACE1AS, MER11C, H19, GAS5-family, Dio3os, Y RNA-1,
AK023948, HAR1B, Jpx, Gomafu, HULC, and HOTAIR,
fulfilled this criteria (Table SI).
The expression of all lncRNAs except MER11C was upregulated
in the sensitive cell lines.
Patients with bone or soft-tissue
sarcomas were divided into responders and non-responders
In a phase III study, PALETTE, the median PFS of
patients with soft-tissue sarcomas was 4.6 months (8). Considering the PALETTE data, we defined
the 39 patients with at least 6 months of PFS and/or with at most
0% of the maximum change in tumor size as ‘responders’. The other
patients were defined as ‘non-responders’. The 39 patients with
bone or soft-tissue sarcoma who received pazopanib therapy were
categorized into 16 responders and 23 non-responders.
Microarray analyses to validate
candidate lncRNAs that might be related to pazopanib
sensitivity
We tried to determine whether there were also
differentially expressed lncRNAs between responders and
non-responders who received pazopanib. Among the 39 patients,
samples from 23 patients with a sufficient quantity and quality of
RNA were analyzed using microarray analyses (Table I). Seven patients showed tumor
shrinkage, and PR was observed in three patients among the 18 with
measurable lesions (Fig. 2A). The
median PFS of responders and non-responders was 10.2 months [95%
confidence interval (95% CI), 5.6–21.0 months] and 1.9 months (95%
CI 1.1–2.8 months), as shown in Fig.
2B. The median OS of responders and non-responders was 22.0
months (95% CI, 6.6–55.8 months) and 5.6 months (95% CI 1.3–11.0
months), as shown in Fig. 2C.
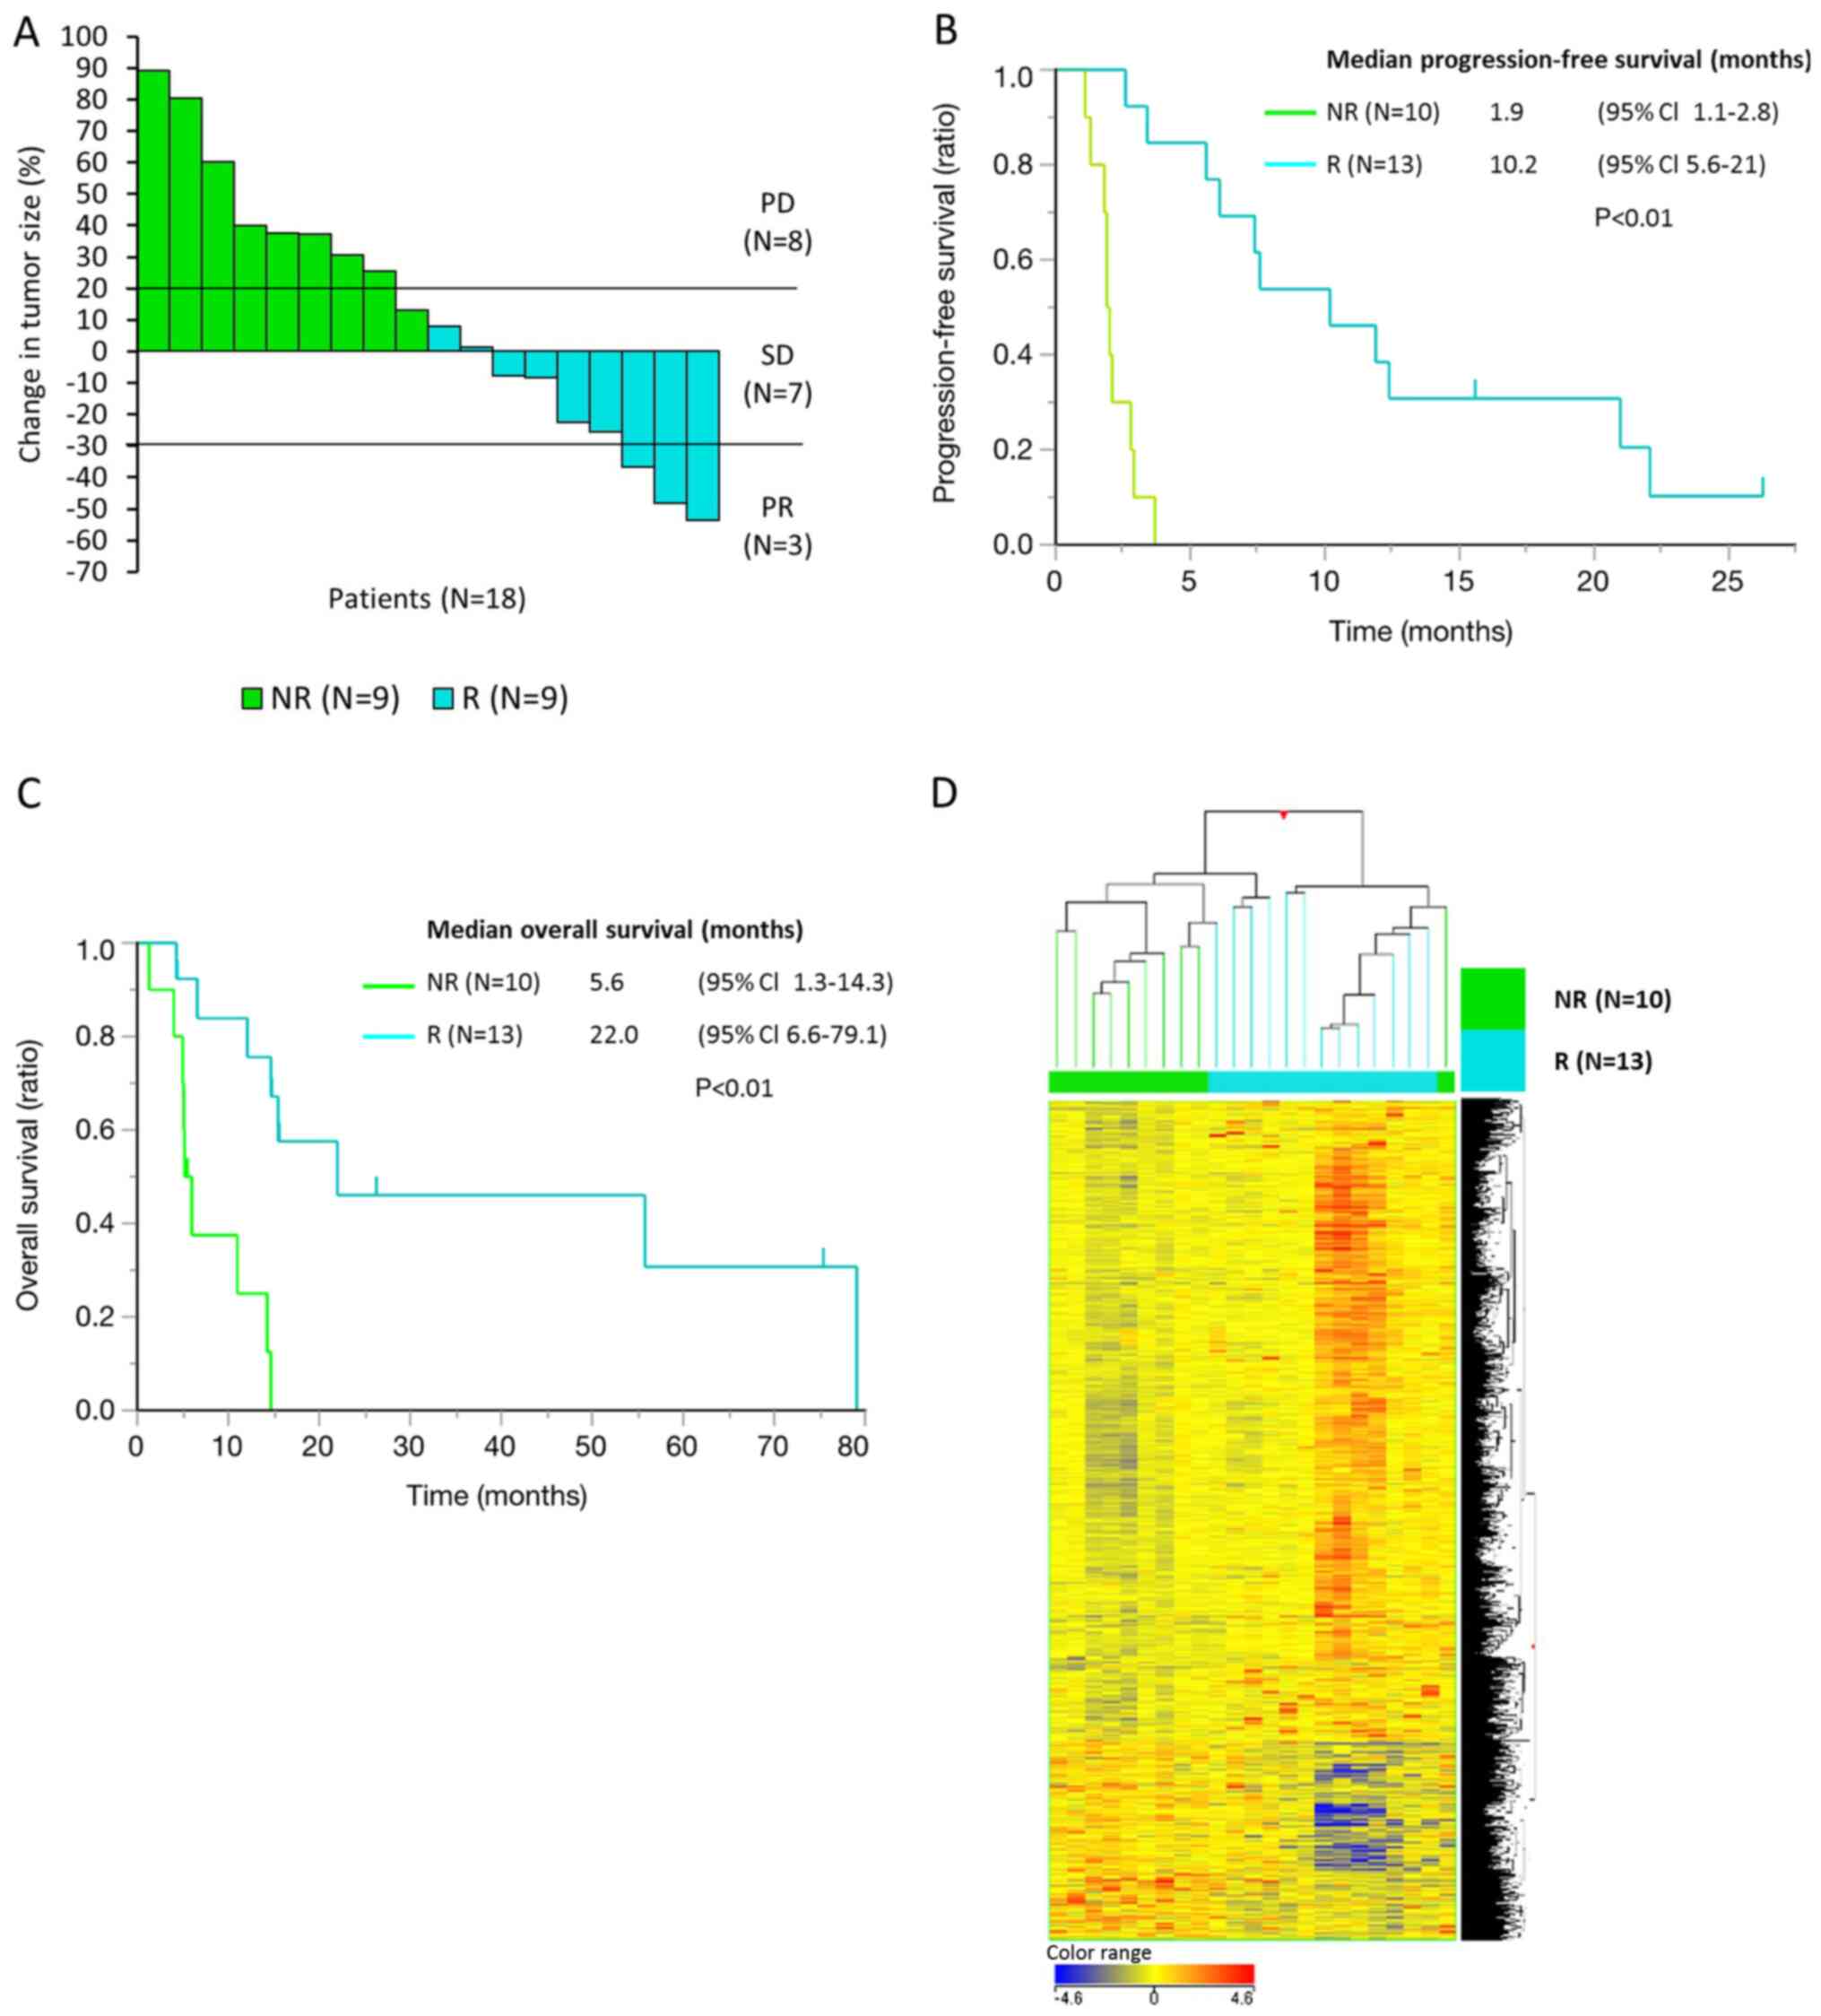 | Figure 2.Clinical outcomes in 23 responders
and non-responders among patients with bone or soft-tissue sarcoma
who received pazopanib treatment. The gene and lncRNA expression
profiles differed between responders and non-responders. (A) Change
in tumor size (%) and tumor response by pazopanib treatment in 18
patients with measurable tumor lesions. A total of 9 patients were
categorized as responders, with ≤0% change in tumor size and/or ≥6
months of PFS, while the others were categorized as non-responders.
(B) Progression-free survival and (C) overall survival of 23
patients for whom whole genome gene/lncRNA expression profiles were
analyzed by microarrays. (D) A total of 2,417 lncRNAs (probes)
differentially expressed genes (fold change >1.5 or <0.67
with P<0.1) between responders (n=13) and non-responders (n=10)
were detected in the microarray analysis. Data are presented as
normalized intensity values. Hierarchical clustering analysis
divided the patients into two groups, responders and
non-responders, except for one non-responder. lncRNA, long
non-coding RNA; PD, progressive disease; SD, stable disease; PR,
partial response; NR, non-responder; R, responder; CI, confidence
interval. |
 | Table I.Summary of patient/tumor
characteristics and treatment outcomes for 23 patients/tumors
analyzed via microarray analyses. |
Table I.
Summary of patient/tumor
characteristics and treatment outcomes for 23 patients/tumors
analyzed via microarray analyses.
| Factors | Total, n (%)
(n=23) | Responder, n (%)
(n=13) | Non-Responder, n
(%) (n=10) |
|---|
| Sex |
|
Male | 14 (61) | 7 (54) | 7 (70) |
|
Female | 9
(39) | 6 (46) | 3 (30) |
| Age (years) |
|
Median | 65 | 65 | 62 |
|
Range | 20–76 | 20–76 | 31–76 |
| ECOG Performance
Status |
| 0 | 9 (39) | 7 (54) | 2 (20) |
| 1 | 13 (57) | 5 (38) | 8 (80) |
| 2 | 1 (4) | 1 (8) | 0 |
|
>2 | 0 (0) | 0 (0) | 0 (0) |
| Treatment line |
| 1st
line | 1 (4) | 1 (8) | 0 (0) |
| 2nd
line | 12 (52) | 7 (54) | 5 (50) |
| 3rd
line | 7 (30) | 3 (23) | 4 (40) |
| 4th
line | 3 (13) | 2 (15) | 1 (10) |
|
Pathology | 5 (22) | 2 (15) | 3 (30) |
| Myxoid LPS |
|
LMS | 3 (13) | 2 (15) | 1 (10) |
|
UPS | 3 (13) | 2 (15) | 1 (10) |
|
SFT | 2 (9) | 1 (8) | 1 (10) |
| OS | 2 (9) | 1 (8) | 1 (10) |
|
ASPS | 2 (9) | 2 (15) | 0 (0) |
| US | 1 (4) | 1 (8) | 0 (0) |
| AS | 1 (4) | 1 (8) | 0 (0) |
| ES | 1 (4) | 1 (8) | 0 (0) |
|
ESFT | 2 (9) | 0 (0) | 2 (20) |
|
CCS | 1 (4) | 0 (0) | 1 (10) |
| Primary site | 12 (52) | 8 (62) | 4 (40) |
|
Extremity |
|
Trunk | 2 (9) | 1 (8) | 1 (10) |
|
Retroperitneum | 1 (4) | 1 (8) | 0 (0) |
|
Thoracic cavity | 1 (4) | 1 (8) | 0 (0) |
|
Liver | 1 (4) | 1 (8) | 0 (0) |
|
Pancreas | 1 (4) | 1 (8) | 0 (0) |
|
Abdominal cavity | 1 (4) | 0 (0) | 1 (10) |
|
Oral | 1 (4) | 0 (0) | 1 (10) |
|
Pelvis | 1 (4) | 0 (0) | 1 (10) |
|
Sternum | 1 (4) | 0 (0) | 1 (10) |
|
Eye | 1 (4) | 0 (0) | 1 (10) |
In microarray analyses using SurePrint G3 Hyman Gene
Expression 8×60K microarrays, we classified the differentially
expressed probes between responders and non-responders, either with
FC >1.5 or <0.67 (P<0.1), as the lncRNAs that might be
related to pazopanib sensitivity. Among 14,661 probes of the
lncRNAs analyzed, 2,417 probes (2,417/14,661, 16%) fulfilled these
criteria (Fig. 2D). The results
showed that some proportion of lncRNAs was differentially expressed
between responders and non-responders, and that at least some
lncRNAs might be involved in sensitivity to pazopanib in patients
with bone or soft-tissue sarcomas.
We next attempted to validate whether the lncRNAs
differentially expressed between the pazopanib-sensitive and
pazopanib-resistant cell lines were also differentially expressed
between responders and non-responders with bone or soft-tissue
sarcomas who received pazopanib. Among 90 lncRNAs analyzed by
multiplex real-time RT-PCR, 32 lncRNAs were detected in the
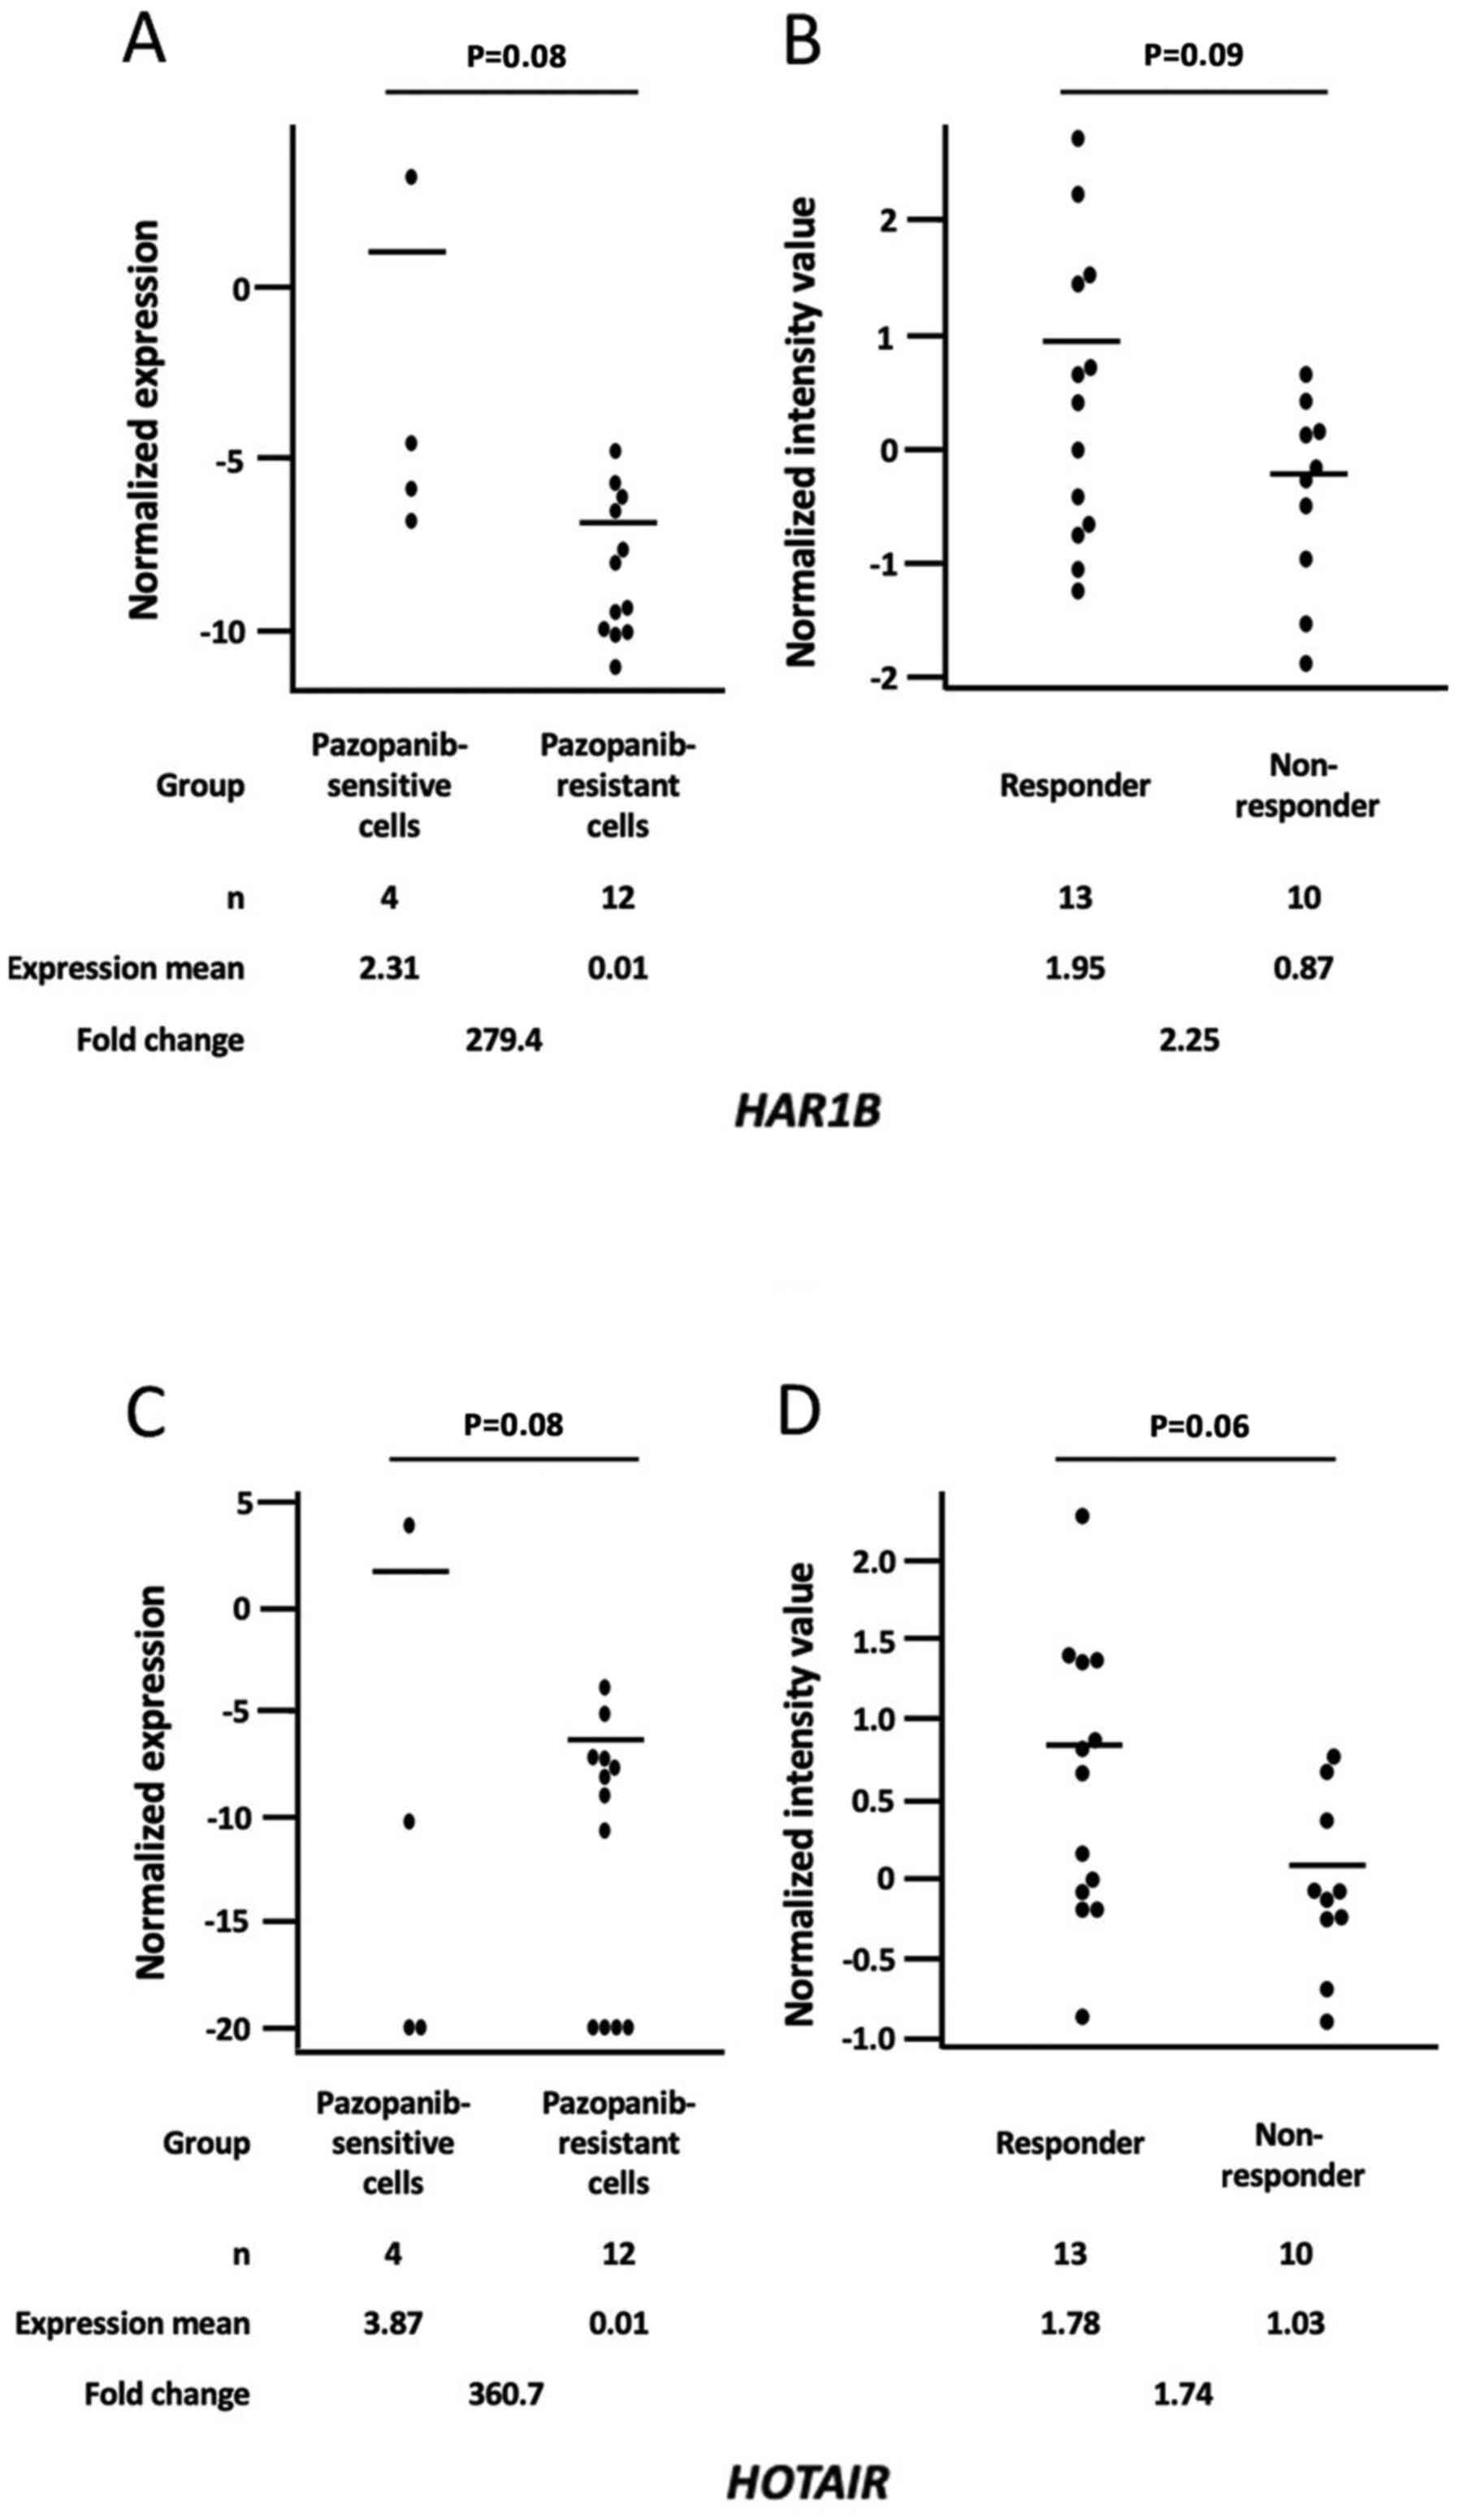
microarray analyses. Among them, HAR1B and HOTAIR
fulfilled the criteria of FC >1.5 or <0.67, with P<0.1
(Fig. 3, Table II). HAR1B expression levels
in sensitive cells were higher than in resistant cells, with 279 of
FC and P=0.08 (Fig. 3A), and higher
in responders than those in non-responders with 2.25 of FC and
P=0.09 (Fig. 3B). HOTAIR
expression levels in sensitive cells were higher than in resistant
cells with 360 of FC and P=0.08 (Fig.
3C), and higher in responders than those in non-responders with
1.74 of FC and P=0.06 (Fig. 3D).
| Table II.Differentially expressed lncRNAs
between responders and non-responders. |
Table II.
Differentially expressed lncRNAs
between responders and non-responders.
|
| Expression in
sarcoma cella | Expression in
sarcoma tissueb |
|---|
|
|
|
|
|---|
| lncRNA | Mean fold change
(sensitive/resistant) |
P-valuec | Mean fold change
(responders/non-responders) |
P-valuec |
|---|
| HAR1B | 279.41 | 0.08 | 2.25 | 0.09 |
| NEAT1 | 0.00 | 0.16 | 2.01 | 0.01 |
| NEAT1 |
|
| 1.48 | 0.14 |
| NEAT1 |
|
| 1.41 | 0.06 |
| UCA1 | 0.00 | 0.44 | 1.98 | 0.07 |
| UCA1 |
|
| 1.70 | 0.13 |
| TSIX | 1.00 | d | 1.80 | 0.12 |
| TSIX |
|
| 1.12 | 0.39 |
| TSIX |
|
| 0.97 | 0.95 |
| TSIX |
|
| 0.79 | 0.18 |
|
HOTAIRM1 | 0.48 | 0.37 | 1.74 | 0.02 |
|
HOTAIRM1 |
|
| 1.15 | 0.70 |
|
HOTAIRM1 |
|
| 1.06 | 0.15 |
| SNHG4 | 1.00 | 0.99 | 1.74 | 0.02 |
| SNHG4 |
|
| 1.51 | 0.48 |
| HOTAIR | 360.69 | 0.08 | 1.74 | 0.06 |
| HOTAIR |
|
| 1.35 | 0.28 |
| HOTAIR |
|
| 1.30 | 0.12 |
| HOTAIR |
|
| 1.26 | 0.73 |
| HOTAIR |
|
| 1.08 | 0.94 |
| JPX | 301.29 | 0.08 | 1.60 | 0.83 |
| JPX |
|
| 0.75 | 0.22 |
| JPX |
|
| 0.38 | <0.01 |
| HAR1A | 1.15 | 0.82 | 1.49 | 0.17 |
| HAR1A |
|
| 1.02 | 0.58 |
| EMX2OS | 0.82 | 0.57 | 1.44 | 0.52 |
| EMX2OS |
|
| 1.18 | 0.10 |
| SOX2-OT | 0.01 | 0.50 | 1.44 | 0.46 |
| SOX2-OT |
|
| 0.96 | 0.86 |
| SOX2-OT |
|
| 0.81 | 0.64 |
|
LINC-ROR | 1.15 | 0.77 | 1.40 | 0.04 |
| IGF2-AS | 0.99 | 0.99 | 1.36 | 0.02 |
| TUG1 | 0.39 | 0.55 | 1.31 | 0.60 |
| TUG1 |
|
| 1.04 | 0.33 |
| TUG1 |
|
| 0.85 | 0.24 |
| TUG1 |
|
| 0.55 | 0.06 |
| MEG3 | 1.23 | 0.87 | 1.26 | 0.27 |
| MEG3 |
|
| 1.12 | 0.33 |
| MEG3 |
|
| 0.88 | 0.55 |
| MEG3 |
|
| 0.85 | 0.97 |
| MEG3 |
|
| 0.82 | 0.69 |
| MEG3 |
|
| 0.60 | 0.20 |
|
HOXA11-AS | 1.28 | 0.42 | 1.25 | 0.01 |
| PCGEM1 | 1.00 | d | 1.13 | 0.31 |
|
BACE1-AS | 1.62 | 0.02 | 1.08 | 0.92 |
| MALAT1 | 0.40 | 0.40 | 1.06 | 0.98 |
| MALAT1 |
|
| 0.93 | 0.43 |
| MALAT1 |
|
| 0.92 | 0.56 |
| MALAT1 |
|
| 0.79 | 0.05 |
| HOTTIP | 1.29 | 0.80 | 1.05 | 0.65 |
| WT1-AS | 6.07 | 0.16 | 0.92 | 0.80 |
| GAS5 | 1.84 | 0.04 | 0.90 | 0.63 |
| GAS5 |
|
| 0.48 | 0.17 |
| SNHG5 | 0.68 | 0.52 | 0.87 | 0.64 |
| SNHG5 |
|
| 0.77 | 0.39 |
| SNHG5 |
|
| 0.53 | 0.02 |
| SNHG5 |
|
| 0.38 | 0.03 |
| SNHG6 | 0.86 | 0.76 | 0.83 | 0.54 |
| SNHG6 |
|
| 0.63 | 0.14 |
| SNHG3 | 0.83 | 0.54 | 0.77 | 0.16 |
| H19 | 32.79 | 0.04 | 0.75 | 0.43 |
| H19 |
|
| 0.61 | 0.25 |
| IPW | 0.00 | 0.58 | 0.73 | 0.30 |
| DISC2 | 1.00 | 1.00 | 0.71 | 0.17 |
|
KCNQ1OT1 | 0.03 | 0.58 | 0.67 | 0.13 |
|
KCNQ1OT1 |
|
| 0.64 | 0.02 |
| XIST | 1.33 | 0.82 | 0.64 | 0.79 |
| ZFAS1 | 1.25 | 0.55 | 0.54 | 0.06 |
| DIO3OS | 4.40 | 0.07 | 0.30 | 0.09 |
Knockdown of HAR1B results in
increased pazopanib resistance in sarcoma cell lines
Based on the above results, we hypothesized that the
two lncRNAs, HAR1B and HOTAIR, might be related to
pazopanib sensitivity in sarcomas. We thus attempted to elucidate
whether forced alteration of the lncRNA expression levels would
affect pazopanib sensitivity in sarcoma cells. For this purpose, we
decided to focus on HAR1B rather than HOTAIR, because
the FC of HAR1B was slightly higher than that of
HOTAIR in responders (FC 2.25 vs. 1.74), and the functional
significance of HAR1B in tumorigenesis remains unclear.
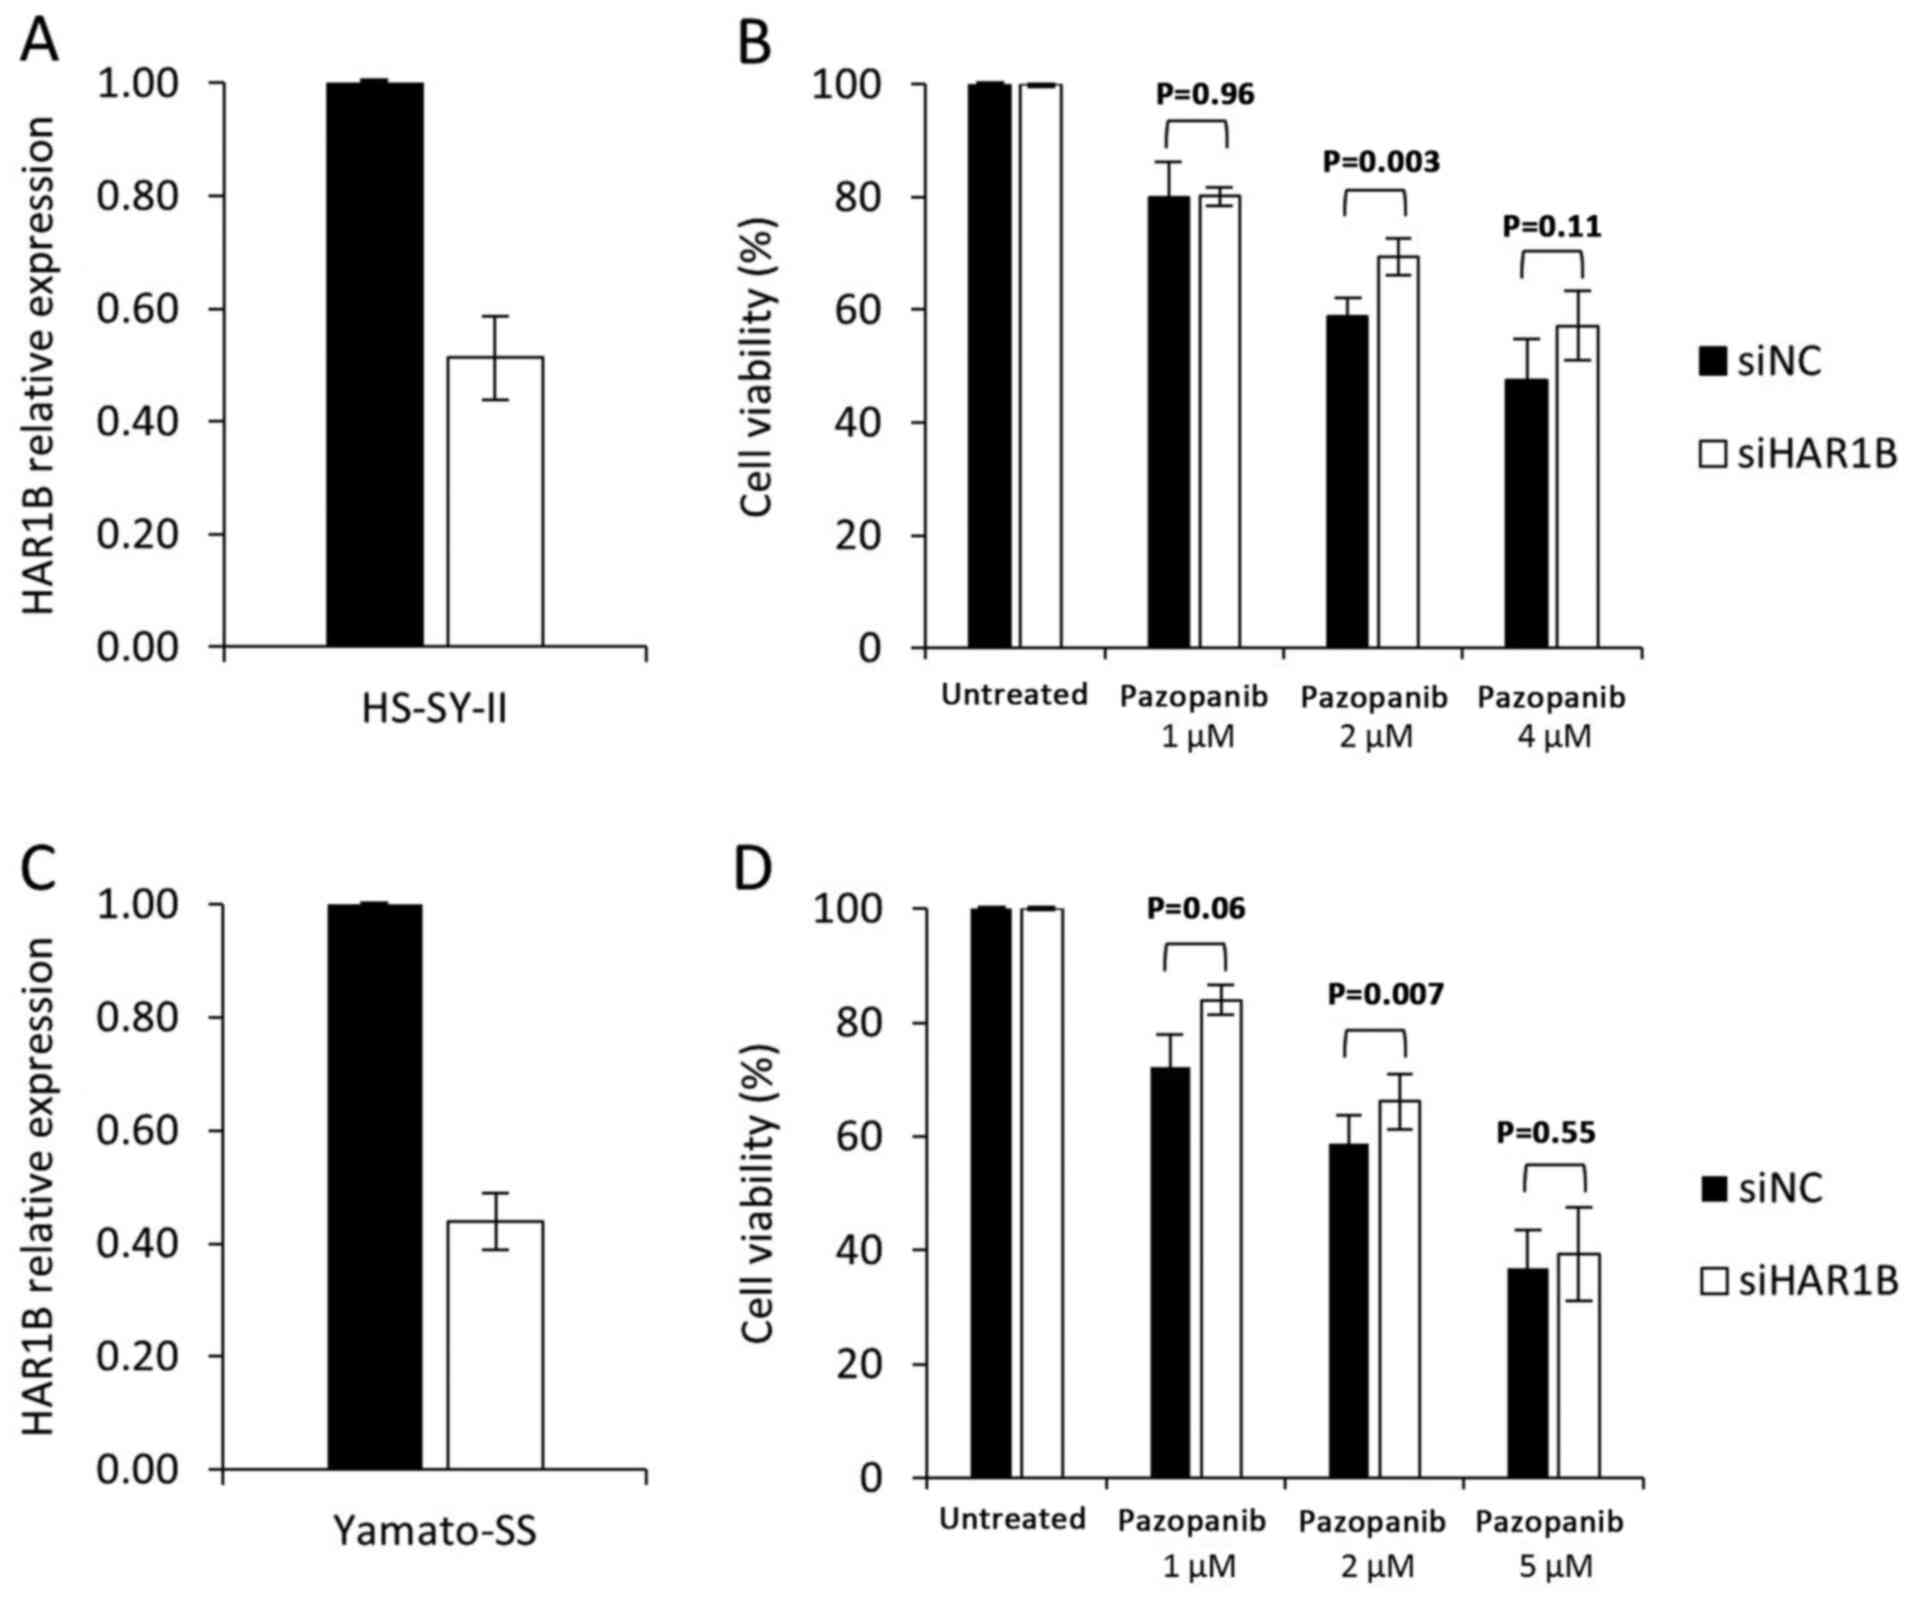
Transfection of siRNA against HAR1B led to a
42% decrease in the expression level in pazopanib-sensitive
HS-SY-II cells (Fig. 4A). This level
of HAR1B knockdown led to a modest but statistically
significant increase in the viability of cells treated with 2-µM
pazopanib (69 vs. 59%, P=0.003, Fig.
4B). In another sensitive cell line Yamato-SS, knockdown of
HAR1B also led to a modest but statistically significant
increase in the viability of cells treated with 2-µM pazopanib (68
vs. 62%, P=0.005, Fig. 4C and D). In
contrast, in the pazopanib-resistant cell line SW872, HAR1B
knockdown did not affect pazopanib sensitivity (data not
shown).
Gene enrichment and functional
annotation clustering analyses reveal that some functional
pathways, including a von-Willebrand factor-related pathway,
correlate with pazopanib-sensitivity-related expression
profiles
Our findings suggest that HAR1B might be
related, even partially, to pazopanib sensitivity in sarcoma cells,
and that a certain threshold of HAR1B expression might be
required for pazopanib efficacy. However, the precise molecular
mechanisms of how HAR1B is involved in pazopanib sensitivity
remain to be elucidated. To address this issue, we next attempted
to elucidate how whole genome-wide gene and lncRNA expression
profiles including HAR1B expression differ between sensitive
and resistant cells and between responders and non-responders.
In microarray analyses using SurePrint G3 Hyman Gene
Expression 8×60K microarrays of 16 bone or soft-tissue sarcoma cell
lines, 4,962 probes (4,538 genes/lncRNAs) were upregulated in
sensitive cells (FC >1.5 with P<0.1). In microarray analyses
including 23 bone or soft-tissue sarcoma tissues, 3,733 probes
(3,652 genes/lncRNAs) were upregulated in responders (FC >1.5
with P<0.1); 351 genes and 109 lncRNAs, including HAR1B,
upregulated in both sensitive cell lines and responders. Using the
306 genes/lncRNAs with NCBI Entrez Gene IDs, we performed gene
enrichment analysis, which revealed 65 significant annotation terms
(P<0.01) (Table SII). Many of
them included terms related to the ‘von Willebrand factor’
(Table SII). The most statistically
significant term was ‘VWC out,’ which includes five genes-MUC2,
MUC5B, MUC6, NELL1, and VWCE. We next performed
functional annotation analysis using the result of the gene
enrichment analysis and detected seven statistically significant
clusters with enrichment scores >1.3 (Table III). The functional clusters
included von-Willebrand factor-related, cell membrane-related,
EGF-related, receptor-related, and neurogenesis-related
clusters.
| Table III.Functional clusters identified by
functional annotation clustering. |
Table III.
Functional clusters identified by
functional annotation clustering.
| A, Cluster number
1, 6 annotation terms included, enrichment score of 1 |
|---|
|
|---|
| Top 5 categorized
annotation term of each clustera |
P-valueb | Source
databasec | Accession no. |
|---|
| VWC_out | <0.01 | SMART | SM00215 |
| VWFC domain | <0.01 | InterPro | IPR001007 |
| domain:VWFC 1 | <0.01 | UniProt | None |
| domain:VWFC 2 | <0.01 | UniProt | None |
| VWC | <0.01 | SMART | SM00214 |
|
| B, Cluster
number 1, 18 annotation terms included, enrichment score of
2.11 |
|
| Top 5
categorized annotation term of each clustera |
P-valueb | Source
databasec | Accession
no. |
|
| Cell membrane | <0.01 | UniProt | KW-1003 |
| Signal peptide | <0.01 | UniProt | None |
| Signal | <0.01 | UniProt | KW-0732 |
| Glycoprotein | <0.01 | UniProt | KW-0325 |
| Disulfide bond | <0.01 | UniProt | None |
|
| C, Cluster
number 3, 19 annotation terms included, enrichment score of
1.89 |
|
| Top 5
categorized annotation term of each clustera |
P-valueb | Source
databasec | Accession
no. |
|
| EGF-like, conserved
site | <0.01 | InterPro | IPR013032 |
| EGF-like
calcium-binding domain | <0.01 | InterPro | IPR001881 |
| EGF-like
domain | <0.01 | InterPro | IPR000742 |
| EGF_CA | <0.01 | SMART | SM00179 |
| domain:EGF-like
4 | <0.01 | UniProt | None |
|
| D, Cluster
number 4, 27 annotation terms included, enrichment score of
1.56 |
|
| Top 5
categorized annotation term of each clustera |
P-valueb | Source
databasec | Accession
no. |
|
| VWC_out | <0.01 | SMART | SM00215 |
| VWFC domain | <0.01 | INTERPRO | IPR001007 |
| domain:TIL | <0.01 | UniProt | None |
| domain:VWFD 3 | <0.01 | UniProt | None |
| domain:VWFD 2 | <0.01 | UniProt | None |
|
| E, Cluster
number 5, 17 annotation terms included, enrichment score of
1.50 |
|
| Top 5
categorized annotation term of each clustera |
P-valueb | Source
databasec | Accession
no. |
|
| Signaling receptor
activity | <0.01 | Gene Ontology | GO:0038023 |
| Molecular
transducer activity | <0.01 | Gene Ontology | GO:0060089 |
| Glycoprotein | <0.01 | UniProt | KW-0325 |
| Topological domain:
Extracellular | <0.01 | Gene Ontology | None |
| Intrinsic component
of plasma membrane | <0.01 | Gene Ontology | GO:0031226 |
|
| F, Cluster
number 6, 23 annotation terms included, enrichment score of
1.40 |
|
| Top 5
categorized annotation term of each clustera |
P-valueb | Source
databasec | Accession
no. |
|
| Neurogenesis | <0.01 | Gene Ontology | GO:0022008 |
| Neuron
differentiation | <0.01 | Gene Ontology | GO:0030182 |
| Generation of
neurons | <0.01 | Gene Ontology | GO:0048699 |
| Cell projection
organization | <0.01 | Gene Ontology | GO:0030030 |
| Axon
development |
0.02 | Gene Ontology | GO:0061564 |
|
| G, Cluster
number 7, 12 annotation terms included, enrichment score of
1.833 |
|
| Top 5
categorized annotation term of each clustera |
P-valueb | Source
databasec | Accession
no. |
|
| Inositol phosphate
metabolic process | <0.01 | Gene Ontology | GO:0043647 |
| Polyol metabolic
process | <0.01 | Gene Ontology | GO:0019751 |
| Alcohol metabolic
process | <0.01 | Gene Ontology | GO:0006066 |
| Organic hydroxy
compound metabolic process |
0.01 | Gene Ontology | GO:1901615 |
| Carbohydrate
metabolic process |
0.04 | Gene Ontology | GO:0005975 |
Discussion
This study is the first to demonstrate that lncRNAs
may serve as molecular biomarkers to predict the clinical outcomes
of patients with sarcomas who receive molecularly targeted therapy.
We made the following observations: (1) Multiplex qPCR analysis identified 12
lncRNAs that were differentially expressed between
pazopanib-sensitive and pazopanib-resistant cells; (2) comprehensive gene and lncRNA expression
analyses revealed that HAR1B and HOTAIR were also
differentially expressed between responders and non-responders who
received pazopanib therapy; (3) we
clarified the functional role HAR1B through knockdown by
siRNA, which led to an increased pazopanib resistance in sarcoma
cell lines; and (4) gene expression
profiles related to pazopanib sensitivity include various cellular
molecular pathways, including von-Willebrand factor-related
signaling. These results suggest that lncRNA HAR1B is
involved, even partially, in sensitivity to pazopanib through some
mechanisms, which might be related to the regulation of
angiogenesis, and that HAR1B may be effective as a
predictive biomarker for patients with bone or soft-tissue sarcomas
who received pazopanib therapy.
Growing evidence suggests that lncRNAs exert
oncogenic or tumor-suppressive effects in various cancers (11,27–30).
Some lncRNAs are also involved in drug sensitivity, exemplified by
H19 for paclitaxel, NEAT1 for 5-FU, and ARA
for anthracycline in breast cancer (31). However, the biological roles of
lncRNAs and their clinical significance in sarcomas, particularly
in soft-tissue sarcomas, remains to be elucidated.
We have shown in our study that HAR1B is
upregulated in pazopanib-sensitive cells and in responders, and the
HAR1B knockdown confers resistance to pazopanib, but the exact
mechanisms underlying this altered expression are unknown.
HAR1B is a 6,827-bp lncRNA, located in 20q13.33.
HAR1B is a pair of HAR1A, overlapping oppositely
transcribed genes, and has three exons (32). A ‘highly accelerated region’ was
found as a specifically evolved region in humans, and HAR1A
was found to be expressed specifically in the Cajal-Retzius neurons
in the developing human neocortex, suggesting that HAR1A,
and possibly HAR1B, plays a role in neurogenesis (32). However, details of the functions of
HAR1A and HAR1B, particularly their molecular
functions and clinical significance in tumorigenesis, have not been
well studied. Liu et al reported that HAR1A is
upregulated in about 3% of breast cancers, and that the
upregulation of nine lncRNAs, including HAR1A, correlated
with an increased risk of recurrence (33). In contrast, Ma et al reported
that in thyroid cancer, HAR1A downregulation correlated with
an increase in risk of recurrence (34). Compared to HAR1A, HAR1B is a
less studied lncRNA, but Shi et al have recently shown that
the downregulation of HAR1A and HAR1B correlated with
worse OS in hepatocellular carcinoma (35). These findings suggest that altered
expressions of HAR1A and HAR1B are somehow involved
in the tumorigenesis of various cancers, and that their clinical
significance depends differentially on cancer type.
In our gene enrichment and functional clustering
analyses, genes whose expression levels were related to pazopanib
sensitivity included cellular molecular pathways, such as
von-Willebrand factor-related, cell membrane-related, EGF-related,
receptor-related, and neurogenesis-related pathways. Von-Willebrand
factor, which is expressed in endothelial cells, plays an essential
role in hemostasis, and has also been shown to regulate
angiogenesis through the control of VEGFR-2 signaling (36). Gel-forming mucin protein MUC2 shares
N- and C-terminal domains with the von Willebrand factor (37). MUC5B and MUC6 are the other
gel-forming mucin proteins (37).
NELL1 and, VWCE, or WWC1, also contain von Willebrand factor type C
domains (38,39). Our functional clustering analysis
revealed that their transcriptional upregulation correlated well
with pazopanib sensitivity, suggesting that von Willebrand factor
domain-containing proteins are involved in pazopanib sensitivity in
sarcomas. Our functional clustering analysis also revealed that
neurogenesis-related pathways are linked to pazopanib sensitivity,
which seems consistent with the finding that HAR1B is
possibly involved in human neurogenesis (32).
This study has several limitations. First, the
number of patients with bone and soft-tissue sarcomas was limited.
A larger cohort of patients will be required to validate our
results. Second, although our findings suggest that HAR1B
affects sensitivity to pazopanib in sarcoma cell lines and patients
with sarcoma, the precise molecular mechanisms by which this occurs
remain to be elucidated.
In conclusion, our study demonstrates that lncRNA
HAR1B expression affects cellular sensitivity to pazopanib
in sarcoma cell lines and in patients with sarcoma. Further studies
are warranted to validate the clinical utility of HAR1B as a
predictive biomarker for the treatment of patients with sarcomas,
and to clarify the molecular mechanisms by which HAR1B is
involved in pazopanib sensitivity. Such studies could lead to the
development of more efficient molecular diagnostics and molecularly
targeted therapies in bone and soft-tissue sarcomas.
Supplementary Material
Supporting Data
Acknowledgements
The authors would like to thank Ms Hiromi Nakano, Ms
Noriko Takenaga and Ms Nobuko Saeki (Institute of Development,
Aging and Cancer, Tohoku University) for their technical
assistance. The authors would also like to thank Dr Mikio Masuzawa
(School of Allied Health Science, Kitasato University) and Dr Lan
Kluwe (Laboratory for Tumor Genetics, University Medical Center
Hamburg-Eppendorf) for providing the cell lines.
Funding
The present study was supported by grants from the
Ministry of Education, Science, Sports and Culture of Japan (grant
nos. 18K07993 and 19H03508).
Availability of data and materials
The microarray data that support the findings of
this study are openly available in the GEO database at https://www.ncbi.nlm.nih.gov/geo/, reference
number (GSE156344). The other datasets used and/or analyzed during
the current study are available from the corresponding author on
reasonable request.
Authors' contributions
HY, MT, MuW, MiW, KK and CI conceived and designed
the experiments. HY and MT confirmed authenticity of all the raw
data. MT and CI wrote the manuscript. HY, MT, KS and SH performed
experiments. HY and MT analyzed the data. MuW and MiW obtained
tissues. HY and MuW obtained informed consent from patients. All
authors read and approved the final manuscript.
Ethics approval and consent to
participate
The current study was approved by the Ethics
Committee of Tohoku University (approval no. 2019-1-993). Written
informed consent was obtained from all patients prior to
enrolment.
Patient consent for publication
Patient consent for publication was obtained.
Competing interests
CI received research funding from the Tokyo
Cooperative Oncology Group. CI also received contributions from
Chugai Pharmaceutical, Asahi Kasei Pharma Corporation, Ono
Pharmaceutical, MSD, Pfizer, AstraZeneca, Bristol-Myers Squibb,
Janssen Pharmaceutical, Taiho Pharmaceutical, Eisai Pharmaceutical,
Daiichi Sankyo Company, Limited and Takeda Pharmaceutical. MT
received research funding from Ono Pharmaceutical Company. CI is a
representative of the Tohoku Clinical Oncology Research and
Education Society, a specified nonprofit corporation. The remaining
authors declare that they have no competing interests.
References
|
1
|
Jo VY and Fletcher CD: WHO classification
of soft tissue tumours: An update based on the 2013 (4th) edition.
Pathology. 46:95–104. 2014. View Article : Google Scholar : PubMed/NCBI
|
|
2
|
Taylor BS, Barretina J, Maki RG, Antonescu
CR, Singer S and Ladanyi M: Advances in sarcoma genomics and new
therapeutic targets. Nat Rev Cancer. 11:541–557. 2011. View Article : Google Scholar : PubMed/NCBI
|
|
3
|
Linch M, Miah AB, Thway K, Judson IR and
Benson C: Systemic treatment of soft-tissue sarcoma-gold standard
and novel therapies. Nat Rev Clin Oncol. 11:187–202. 2014.
View Article : Google Scholar : PubMed/NCBI
|
|
4
|
Whelan JS and Davis LE: Osteosarcoma,
chondrosarcoma, and chordoma. J Clin Oncol. 36:188–193. 2018.
View Article : Google Scholar : PubMed/NCBI
|
|
5
|
Takahashi M, Komine K, Imai H, Okada Y,
Saijo K, Takahashi M, Shirota H, Ohori H, Takahashi S, Chiba N, et
al: Efficacy and safety of gemcitabine plus docetaxel in Japanese
patients with unresectable or recurrent bone and soft tissue
sarcoma: Results from a single-institutional analysis. PLoS One.
12:e01769722017. View Article : Google Scholar : PubMed/NCBI
|
|
6
|
Kawai A, Araki N, Sugiura H, Ueda T,
Yonemoto T, Takahashi M, Morioka H, Hiraga H, Hiruma T, Kunisada T,
et al: Trabectedin monotherapy after standard chemotherapy versus
best supportive care in patients with advanced,
translocation-related sarcoma: A randomised, open-label, phase 2
study. Lancet Oncol. 16:406–416. 2015. View Article : Google Scholar : PubMed/NCBI
|
|
7
|
Schoffski P, Chawla S, Maki RG, Italiano
A, Gelderblom H, Choy E, Grignani G, Camargo V, Bauer S, Rha SY, et
al: Eribulin versus dacarbazine in previously treated patients with
advanced liposarcoma or leiomyosarcoma: A randomised, open-label,
multicentre, phase 3 trial. Lancet. 387:1629–1637. 2016. View Article : Google Scholar : PubMed/NCBI
|
|
8
|
van der Graaf WT, Blay JY, Chawla SP, Kim
DW, Bui-Nguyen B, Casali PG, Schöffski P, Aglietta M, Staddon AP,
Beppu Y, et al: Pazopanib for metastatic soft-tissue sarcoma
(PALETTE): A randomised, double-blind, placebo-controlled phase 3
trial. Lancet. 379:1879–1886. 2012. View Article : Google Scholar : PubMed/NCBI
|
|
9
|
Uszczynska-Ratajczak B, Lagarde J,
Frankish A, Guigó R and Johnson R: Towards a complete map of the
human long non-coding RNA transcriptome. Nat Rev Genet. 19:535–548.
2018. View Article : Google Scholar : PubMed/NCBI
|
|
10
|
Fang S, Zhang L, Guo J, Niu Y, Wu Y, Li H,
Zhao L, Li X, Teng X, Sun X, et al: NONCODEV5: A comprehensive
annotation database for long non-coding RNAs. Nucleic Acids Res.
46(D1): D308–D314. 2018. View Article : Google Scholar
|
|
11
|
Huarte M: The emerging role of lncRNAs in
cancer. Nat Med. 21:1253–1261. 2015. View Article : Google Scholar : PubMed/NCBI
|
|
12
|
Sørensen KP, Thomassen M, Tan Q, Bak M,
Cold S, Burton M, Larsen MJ and Kruse TA: Long non-coding RNA
HOTAIR is an independent prognostic marker of metastasis in
estrogen receptor-positive primary breast cancer. Breast Cancer Res
Treat. 142:529–536. 2013. View Article : Google Scholar
|
|
13
|
Abdeahad H, Avan A, Pashirzad M, Khazaei
M, Soleimanpour S, Ferns GA, Fiuji H, Ryzhikov M, Bahrami A and
Hassanian SM: The prognostic potential of long noncoding RNA HOTAIR
expression in human digestive system carcinomas: A meta-analysis. J
Cell Physiol. 234:10926–10933. 2019. View Article : Google Scholar : PubMed/NCBI
|
|
14
|
Ji P, Diederichs S, Wang W, Böing S,
Metzger R, Schneider PM, Tidow N, Brandt B, Buerger H, Bulk E, et
al: MALAT-1, a novel noncoding RNA, and thymosin beta4 predict
metastasis and survival in early-stage non-small cell lung cancer.
Oncogene. 22:8031–8041. 2003. View Article : Google Scholar : PubMed/NCBI
|
|
15
|
Sun XH, Yang LB, Geng XL, Wang R and Zhang
ZC: Increased expression of lncRNA HULC indicates a poor prognosis
and promotes cell metastasis in osteosarcoma. Int J Clin Exp
Pathol. 8:2994–3000. 2015.PubMed/NCBI
|
|
16
|
Tian ZZ, Guo XJ, Zhao YM and Fang Y:
Decreased expression of long non-coding RNA MEG3 acts as a
potential predictor biomarker in progression and poor prognosis of
osteosarcoma. Int J Clin Exp Pathol. 8:15138–15142. 2015.PubMed/NCBI
|
|
17
|
Li Z, Dou P, Liu T and He S: Application
of long noncoding RNAs in osteosarcoma: Biomarkers and therapeutic
targets. Cell Physiol Biochem. 42:1407–1419. 2017. View Article : Google Scholar : PubMed/NCBI
|
|
18
|
Matsuzaki J and Ochiya T: Circulating
microRNAs and extracellular vesicles as potential cancer
biomarkers: A systematic review. Int J Clin Oncol. 22:413–420.
2017. View Article : Google Scholar : PubMed/NCBI
|
|
19
|
Hakozaki M, Hojo H, Sato M, Tajino T,
Yamada H, Kikuchi S and Abe M: Establishment and characterization
of a novel human malignant peripheral nerve sheath tumor cell line,
FMS-1, that overexpresses epidermal growth factor receptor and
cyclooxygenase-2. Virchows Arch. 455:517–526. 2009. View Article : Google Scholar : PubMed/NCBI
|
|
20
|
Aoki M, Nabeshima K, Nishio J, Ishiguro M,
Fujita C, Koga K, Hamasaki M, Kaneko Y and Iwasaki H: Establishment
of three malignant peripheral nerve sheath tumor cell lines,
FU-SFT8611, 8710 and 9817: Conventional and molecular cytogenetic
characterization. Int J Oncol. 29:1421–1428. 2006.PubMed/NCBI
|
|
21
|
Frahm S, Mautner VF, Brems H, Legius E,
Debiec-Rychter M, Friedrich RE, Knöfel WT, Peiper M and Kluwe L:
Genetic and phenotypic characterization of tumor cells derived from
malignant peripheral nerve sheath tumors of neurofibromatosis type
1 patients. Neurobiol Dis. 16:85–91. 2004. View Article : Google Scholar : PubMed/NCBI
|
|
22
|
Masuzawa M, Fujimura T, Hamada Y, Fujita
Y, Hara H, Nishiyama S, Katsuoka K, Tamauchi H and Sakurai Y:
Establishment of a human hemangiosarcoma cell line (ISO-HAS). Int J
Cancer. 81:305–308. 1999. View Article : Google Scholar : PubMed/NCBI
|
|
23
|
Eisenhauer EA, Therasse P, Bogaerts J,
Schwartz LH, Sargent D, Ford R, Dancey J, Arbuck S, Gwyther S,
Mooney M, et al: New response evaluation criteria in solid tumours:
Revised RECIST guideline (version 1.1). Eur J Cancer. 45:228–247.
2009. View Article : Google Scholar : PubMed/NCBI
|
|
24
|
Huang da W, Sherman BT and Lempicki RA:
Systematic and integrative analysis of large gene lists using DAVID
bioinformatics resources. Nat Protoc. 4:44–57. 2009. View Article : Google Scholar : PubMed/NCBI
|
|
25
|
Kumar R, Knick VB, Rudolph SK, Johnson JH,
Crosby RM, Crouthamel MC, Hopper TM, Miller CG, Harrington LE,
Onori JA, et al: Pharmacokinetic-pharmacodynamic correlation from
mouse to human with pazopanib, a multikinase angiogenesis inhibitor
with potent antitumor and antiangiogenic activity. Mol Cancer Ther.
6:2012–2021. 2007. View Article : Google Scholar : PubMed/NCBI
|
|
26
|
Hurwitz HI, Dowlati A, Saini S, Savage S,
Suttle AB, Gibson DM, Hodge JP, Merkle EM and Pandite L: Phase I
trial of pazopanib in patients with advanced cancer. Clin Cancer
Res. 15:4220–4227. 2009. View Article : Google Scholar : PubMed/NCBI
|
|
27
|
Li ZX, Zhu QN, Zhang HB, Hu Y, Wang G and
Zhu YS: MALAT1: A potential biomarker in cancer. Cancer Manag Res.
10:6757–6768. 2018. View Article : Google Scholar : PubMed/NCBI
|
|
28
|
Qu X, Alsager S, Zhuo Y and Shan B: HOX
transcript antisense RNA (HOTAIR) in cancer. Cancer Lett.
454:90–97. 2019. View Article : Google Scholar : PubMed/NCBI
|
|
29
|
Marín-Béjar O, Marchese FP, Athie A,
Sánchez Y, González J, Segura V, Huang L, Moreno I, Navarro A,
Monzó M, et al: Pint lincRNA connects the p53 pathway with
epigenetic silencing by the Polycomb repressive complex 2. Genome
Biol. 14:R1042013. View Article : Google Scholar
|
|
30
|
Sánchez Y, Segura V, Marín-Béjar O, Athie
A, Marchese FP, González J, Bujanda L, Guo S, Matheu A and Huarte
M: Genome-wide analysis of the human p53 transcriptional network
unveils a lncRNA tumour suppressor signature. Nat Commun.
5:58122014. View Article : Google Scholar
|
|
31
|
Campos-Parra AD, López-Urrutia E, Orozco
Moreno LT, López-Camarillo C, Meza-Menchaca T, Figueroa González G,
Bustamante Montes LP and Pérez-Plasencia C: Long non-coding RNAs as
new master regulators of resistance to systemic treatments in
breast cancer. Int J Mol Sci. 19:27112018. View Article : Google Scholar : PubMed/NCBI
|
|
32
|
Pollard KS, Salama SR, Lambert N, Lambot
MA, Coppens S, Pedersen JS, Katzman S, King B, Onodera C, Siepel A,
et al: An RNA gene expressed during cortical development evolved
rapidly in humans. Nature. 443:167–172. 2006. View Article : Google Scholar : PubMed/NCBI
|
|
33
|
Liu H, Li J, Koirala P, Ding X, Chen B,
Wang Y, Wang Z, Wang C, Zhang X and Mo YY: Long non-coding RNAs as
prognostic markers in human breast cancer. Oncotarget.
7:20584–20596. 2016. View Article : Google Scholar : PubMed/NCBI
|
|
34
|
Ma B, Liao T, Wen D, Dong C, Zhou L, Yang
S, Wang Y and Ji Q: Long intergenic non-coding RNA 271 is
predictive of a poorer prognosis of papillary thyroid cancer. Sci
Rep. 6:369732016. View Article : Google Scholar : PubMed/NCBI
|
|
35
|
Shi Z, Luo Y, Zhu M, Zhou Y, Zheng B, Wu
D, Wang S, Xie X, Lin H and Yu X: Expression analysis of long
non-coding RNA HAR1A and HAR1B in HBV-induced hepatocullular
carcinoma in Chinese patients. Lab Med. 50:150–157. 2019.
View Article : Google Scholar : PubMed/NCBI
|
|
36
|
Starke RD, Ferraro F, Paschalaki KE,
Dryden NH, McKinnon TA, Sutton RE, Payne EM, Haskard DO, Hughes AD,
Cutler DF, et al: Endothelial von Willebrand factor regulates
angiogenesis. Blood. 117:1071–1080. 2011. View Article : Google Scholar : PubMed/NCBI
|
|
37
|
Nilsson HE, Ambort D, Backstrom M,
Thomsson E, Koeck PJ, Hansson GC and Hebert H: Intestinal MUC2
mucin supramolecular topology by packing and release resting on D3
domain assembly. J Mol Biol. 426:2567–2579. 2014. View Article : Google Scholar : PubMed/NCBI
|
|
38
|
Nakamura Y, Hasebe A, Takahashi K, Iijima
M, Yoshimoto N, Maturana AD, Ting K, Kuroda S and Niimi T:
Oligomerization-induced conformational change in the C-terminal
region of Nel-like molecule 1 (NELL1) protein is necessary for the
efficient mediation of murine MC3T3-E1 cell adhesion and spreading.
J Biol Chem. 289:9781–9794. 2014. View Article : Google Scholar : PubMed/NCBI
|
|
39
|
Xu ER, Blythe EE, Fischer G and Hyvönen M:
Structural analyses of von Willebrand factor C domains of collagen
2A and CCN3 reveal an alternative mode of binding to bone
morphogenetic protein-2. J Biol Chem. 292:12516–12527. 2017.
View Article : Google Scholar : PubMed/NCBI
|