Introduction
Matrix stiffness, resulting from abundant matrix
protein deposition and crosslinking, as one of the important
biomechanical factors, plays important roles in tumor progression,
including epithelial-mesenchymal transition (EMT), motility,
distribution, invasion, metastasis and stemness in tumors (1,2). For
example, melanoma cells could migrate towards higher extracellular
matrix (ECM) densities or stiffer areas of the substratum. The
increased matrix stiffness, following thermal ablation, could
promote the progression of residual hepatocellular carcinoma by a
stiffness-dependent regulation of ERK phosphorylation (3). The inhibition of the ECM stiffness in
the mouse mammary gland caused tumor cells to revert to a normal
epithelial phenotype, which could be characterized by reduced
invasion and proliferation (4).
Thyroid cancer is responsible for 586,000 cases
worldwide, ranking in 9th place for incidence in 2020 (5). Papillary thyroid carcinoma (PTC) is one
of the most common endocrine malignancies in worldwide, research
has demonstrated a continuous increase in the global incidence of
thyroid cancer over the past two decades (6). Despite a number of studies on the
biochemical alterations in PTC (7,8), the
developmental processes of PTC remain to be fully determined. To
the best of our knowledge, reports on the biomechanical influence
and genetic alterations in PTC are limited. Very recently, Jasim
et al (9) found that thyroid
nodule location was an independent risk factor in predicting the
risk of thyroid cancer. Normally, isthmic nodules carry the highest
risk of cancer diagnosis and lower lobe nodules carry the lowest
risk. Naturally, the isthmus is closely attached to the trachea
with a relative stiffness. Furthermore, a number of studies have
demonstrated that the trachea is the most common site of invasion,
with an incidence rate of 35–60% in patients with PTC and tumor
invasion, followed by the larynx and esophagus (10,11); the
incidence rate per site was as follows: 77% for recurrent laryngeal
nerve, 55% for the trachea, 4% for the larynx and 15% for the
esophagus (12), while <4% of
patients exhibited vein and soft tissue invasion. All these results
indicated that PTCs occur more frequently around the trachea where
the tissue stiffness is higher; however, the association between
tissue stiffness and tumor distribution remains unclear. It is
thus, crucial to investigate the effect of trachea stiffness on PTC
distribution and to determine its association with tumor
prevention, diagnosis and treatment.
The present study constructed trachea stiffness
analysis technology and quantitatively evaluated the genetic
performance of PTC, with adjacent normal tissue as a control to
identify the association between trachea stiffness and PTC
distribution to provide novel diagnostic and treatment markers for
PTC. Combining in vitro and in vivo analyses,
elucidating the association between trachea stiffness and PTC
distribution may provide new insight into PTC development and lead
to the design of new treatment strategies.
Materials and methods
Identification of PTMC tissue
stiffness using nanoindentation technology
This was detected using a nanoindentation instrument
(Hysitron TI980 TriboIndenter, Bruker Corporation) and its
association between the displacement and the experimental load was
analyzed.
Cell experiments on a substrate with
different stiffness levels
The TPC-1 and KTC-1 cell lines, both derived from
humans, were purchased from the Cell Bank of the Chinese Academy of
Sciences. Both the cell lines were maintained in RPMI-1640 medium
(Invitrogen; Thermo Fisher Scientific, Inc.) supplemented with 10%
fetal bovine serum (Invitrogen; Thermo Fisher Scientific, Inc.),
100 IU/ml penicillin (Gibco; Thermo Fisher Scientific, Inc.) and
100 µg/ml streptomycin (Gibco; Thermo Fisher Scientific, Inc.), at
37°C in a humidified incubator with 5% CO2.
The cells were then seeded in a 6-well plate, at a
concentration of 1×10⁵ cells/well with 10, 40 and 60 kPa
substrate for 12 h, in which the substrate was prepared according
to a previous report (13).
Subsequently, the cells were scratched vertically with a 100-µl
pipette tip the following day. At 48 h, the cells were counted
under an inverted phase-contrast microscope in 5 random fields,
after washing twice with PBS and placed in serum-free culture
medium.
The cells of 1×10⁵/ml were seeded in
six-well culture plates with different substrate stiffness. The 10
kPa stiffness group was served as the control. After 24-h cell
culture, cells were trypsinized for cell counting using Coulter
counter every 12 h, then re-suspended and reseeded in dishes till
72 h. The above experiments were repeated three times for each
group.
Finite element analysis (FEA) for the
thyroid and its surrounding tissue
Construction of the 3D volume
model
Computed tomography (CT) data of the neck was
collected from 7 patients with PTC for FEA (Department of
Maxillofacial and Ear Nose and Throat Oncology, Tianjin Medical
University Cancer Institute and Hospital). The 3D image data of the
patients with PTC were captured using CT technology
(ScanXmate-E090; Comscantecno Co., Ltd.). Following air
calibration, X-ray exposure in the neck of each patient was
performed with a view field of 25×25 cm and an axial scan, at a
thickness of 2.5×2.5 mm interval. The CT data was used to construct
the 3D polygonal stereolithography (STL) model of the neck in each
case. A part of the STL model, with ~2.5 mm anterior-posterior
thickness, was retrieved from the whole model to obtain a segment
representing the region of interest, including the loading site.
This segmented STL model was converted into computer-aided design
software (Catia V5R18; Dassault Systems) to analyze the model in
detail and examine minute irregularities. Finally, the 3D volume
model was constructed using Ansys finite element software (Ansys
version 11.0; ANSYS, Inc.), which was meshed by 10-nodes quadratic
tetrahedral element with 3 degrees of freedom.
Definition of material parameters
The thyroid gland was set as viscoelastic and
isotropic material, with an initial Young's modulus of 34.85 MPa
and Poisson's ratio of 0.49 (14).
The trachea was defined as isotropic elastic material with a
Young's modulus of 3.33 MPa and Poisson's ratio of 0.49 (15). The density of the thyroid was set as
1,150 kg/m3, and the trachea was considered as cartilage
only with a density of 1,400 kg/m3, which was obtained
using the density measurement function of Mimics version 8.1
software (Materialise; http://www.materialise.com/).
Papillary thyroid microcarcinoma
(PTMC) distribution in the thyroid and its clinical
information
The present clinical study included 998 patients who
were diagnosed with PTMC by a pathologist following surgery at the
Tianjin Medical University Cancer Hospital (TJMUCH) between 1st
June 2016 and 1st December 2016; 709 patients had a single tumor
and 289 patients had multifocal disease. The mean age was 48.2±11.3
years and there were 261 males and 737 females. The present study
was conducted according to the principles outlined in the Helsinki
Declaration and was approved by the Research Ethics Committee at
TJMUCH (no. 2018090). Written informed consent was provided by all
the patients. The clinicopathological data, including sex, age and
the presence of thyroiditis, were also collected. All the patients
were subjected to total thyroidectomy or unilateral thyroidectomy
according to the National Comprehensive Cancer Network guidelines
(version 2016) (16,17); cases in which the tumor was close to
the tracheal region were marked as ‘interior’, and those with
tumors 2–4 cm away from the trachea were marked as ‘lateral’.
RNA extraction, sequencing and
preprocessing
A total of 33 samples, each containing PTMC located
in interior regions and adjacent normal tissue, were collected for
RNA-seq analysis (3 samples) and RT-qPCR (30 samples). A total of
10 samples, including multifocal PTMC located in the interior and
lateral regions, were collected for RT-qPCR for comparing
differences in gene expression between PTMC located in different
regions of the trachea. All tissue samples were obtained by
thyroidectomy and stored at −80°C until further use. RNA sequencing
(RNA-seq) and subsequent analysis was performed by the BGI-Shenzhen
Company (http://www.genomics.cn/en/).
Identification of differentially
expressed genes (DEGs) using RNA-seq analysis
Gene expression levels of the transcripts were
measured using the reads per kilobase of transcript, per million
mapped reads method. Subsequently, the edgeR package (edgeR 3.14.0)
(18) tool was utilized to identify
the DEGs between the PTMC and adjacent normal tissue from 3 samples
of PTMC. During the differential analysis, the negative binomial
model was used to calculate the significance of the differentially
expressed mRNAs, followed by the adjustment of P-values using the
Benjamini Hochberg method (19). The
cut-off values of the DEG selection was a false discovery rate
adjusted P<0.05 and |log2 fold change |≥1. These
results were determined based on the comparison with The Cancer
Genome Atlas (TCGA). Venn diagram analysis was performed using
online software at the following URL: http://bioinformatics.psb.ugent.be/webtools/Venn/.
Functional enrichment analysis and
construction of the protein-protein interaction (PPI) network using
TCGA
To further investigate the functions and pathways of
the DEGs, Gene Ontology (GO; http://www.geneontology.org/) and Kyoto Encyclopedia
of Genes and Genomes (KEGG) (www.kegg.jp)
pathway enrichment analyses were performed using ‘Term Finder’
(https://yeastgenome.org/goTermFinder), with a
threshold corrected P≤0.05 for the identification of significant GO
terms and pathways using default settings. Furthermore, Search Tool
for the Retrieval of Interacting Genes/Proteins (http://string-db.org/) was used to further investigate
the associations in the DEGs, at the protein level (20). The criterion for the construction of
the PPI network was based on the confidence score ≥0.90. The
Cfinder software (version 2.0.6, http://www.cfinder.org/) was used to extract the
functional modules of the PPI network with default parameters
(21).
RT-qPCR
30 samples tissues, including PTMC and adjacent
normal tissue, were selected for RT-PCR test. Three biomechanical
genes, which were overexpressed from RNA-seq analysis were analyzed
using RT-qPCR for validation and the TransStart Top Green qPCR
SuperMix (Beijing Transgen Biotech Co., Ltd.). The PCR was
performed using the ABI7500 Real-Time qPCR System (Applied
Biosystems; Thermo Fisher Scientific, Inc.) and the following
thermocycling conditions: Initial denaturation at 95°C for 20 sec,
followed by 40 cycles of 95°C for 15 sec, annealing at 60°C for 30
sec and extension at 70°C for 90 sec. The specificity of RT-qPCR
was examined using the dissociation curve and the relative
expression of the selected DEGs was normalized with the 18S rRNA
gene. The cycle threshold (Cq) 2−∆∆Cq method was used to
calculate the relative expression level (22). All the gene specific primers used are
listed in Table SI.
Statistical analysis
All the data are presented as the mean ± SEM. Gene
expression analysis was based on sex, age or thyroiditis. For the
data from the patients with PTC, the categorical variables were
analyzed using a χ2 or Fisher's exact test. Continuous
variables were analyzed using a paired and unpaired Student's
t-tests as appropriate. Comparisons of >2 groups were performed
using ANOVA followed by Bonferroni's post hoc test. P<0.05 was
considered to indicate a statistically significant difference.
ImageJ software (version 1.42; National Institutes of Health) was
used for wound healing analysis. Origin software (version 9.0;
OriginLab Corporation) was used for all other data analysis.
Results
PTMC stiffness
Thyroid images were captured and used to construct
thyroid model (Fig. S1). When the
load reaches the maximum value (hmax), the displacement also
reaches the maximum value (Pmax), that is the maximum indentation
depth. After unloading, the displacement finally returns to a fixed
value (S). At this time, the depth is called the residual
indentation depth (hr), that is the permanent plastic deformation
left by the indenter on the sample (Fig. S2A). As the load reaches the maximum
value of 0.743 mN, the displacement reached the maximum indentation
depth of 984.63 nm; after unloading, the displacement finally
returned to the residual indentation depth of 881.36 nm (Fig. S2C). The results showed that PTMC
tissue stiffness ranged from 20–70 kPa due to calcification or
fibrosis (Fig. S2D).
Characterizations of the cell
migratory and proliferative abilities on different substrates
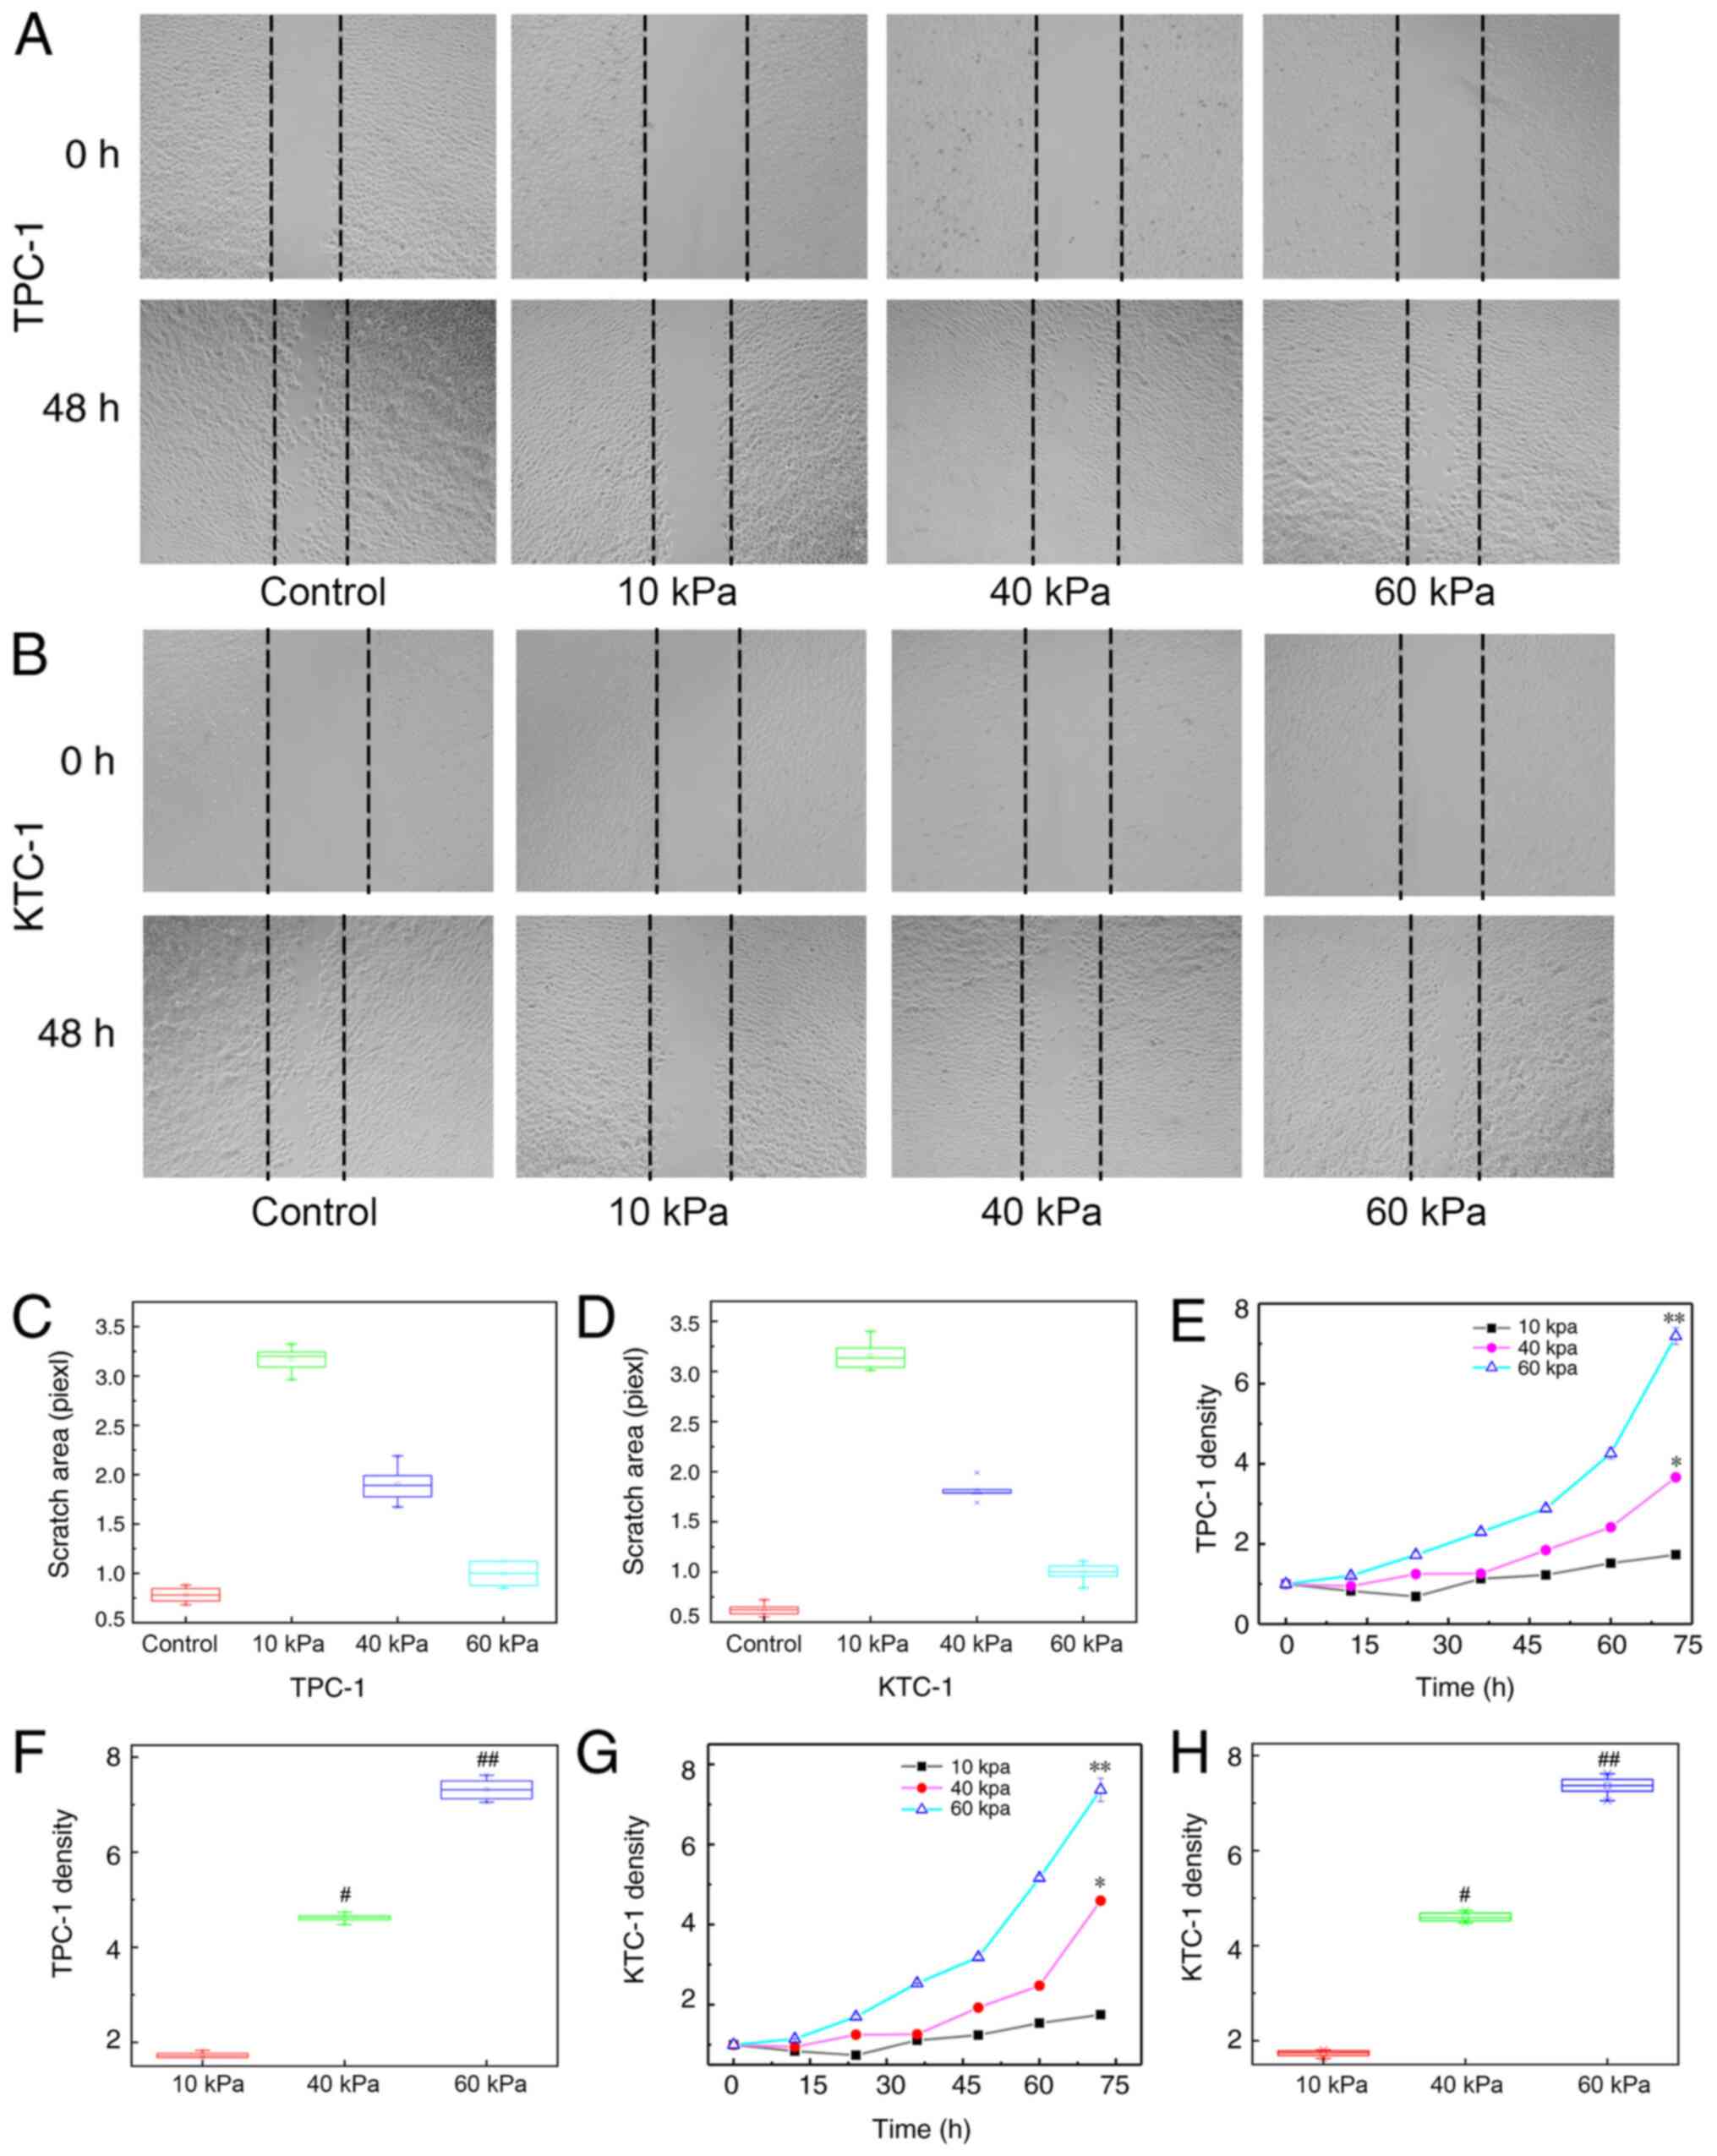
To evaluate the migratory and proliferative
abilities of the PTC cells on different substrates, these
characteristics were analyzed using different experiments. As shown
in Fig. 1, the scratch areas in the
control and 60 kPa groups were significantly narrower compared with
that in the 10 and 40 kPa groups for the TPC-1 (Fig. 1A) and KTC-1 (Fig. 1B) cell lines, suggesting a stronger
migratory ability of these cells on the stiffer substrate compared
with that on the softer substrate (P<0.001; Fig. 1C and D). Furthermore, the density of
the TPC-1 cells on the 60 kPa substrate following 72 h of culture
was 7.19±0.2×10⁵/ml. However, the cell densities were
2.88±0.06×10⁵/ml and 1.2±0.03×10⁵/ml on the
40 and 10 kPa substrates, respectively (Fig. 1E). It was notably different among the
different stiffness groups compared with 10 kPa groups,
(P<0.001; Fig. 1F). For the KTC-1
cell line, similar results were obtained, with densities of
7.36±0.29×10⁵/ml, 4.59±0.11×10⁵/ml and
1.75±0.05×10⁵/ml on the 60, 40 and 10 kPa substrates,
respectively (Fig. 1G). A
statistically significant difference was observed among these
groups (P<0.001; Fig. 1H), which
indicated a stronger proliferation ability of the cells on the
stiffer substrate compared with that on the softer substrate.
Uneven stress distribution between the
thyroid section close to and away from the trachea
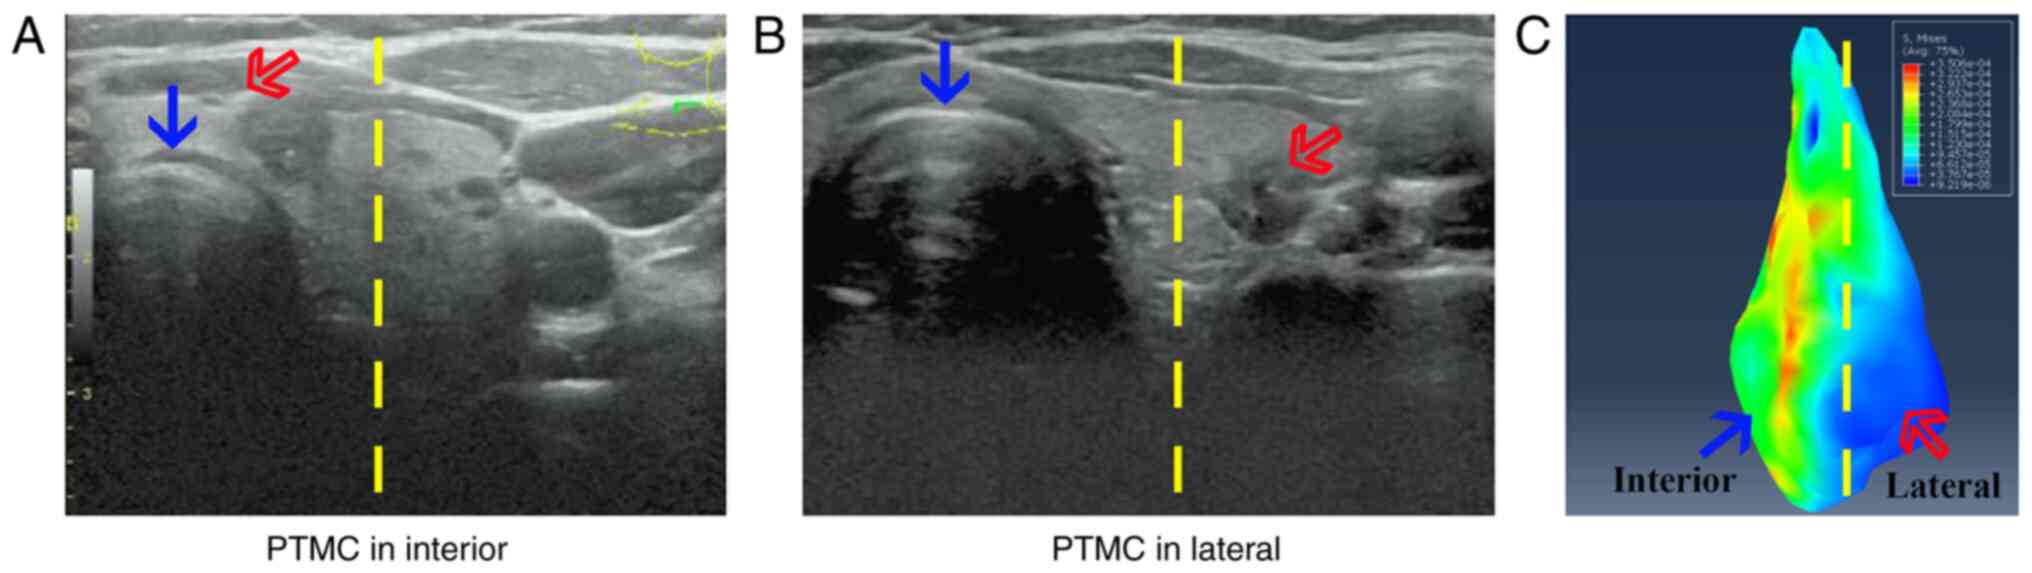
Von Mises stress, an equivalent stress, was selected
to reveal the distribution of elastic stress in the biological
tissue. As shown in Fig. 2C, the von
Mises stress in the thyroid was mainly produced by stiffness and
the deformation of the trachea, which was significantly higher in
the ‘interior’ compared with that in the ‘lateral’ regions
(10.18±3.35 vs. 7.71±2.89 kPa, respectively; P<0.05).
Characterizations of PTMC distribution
on different regions
As shown in Table I,
the percentages of PTMC distribution in the ‘interior’ and
‘lateral’ sections were 68.58 and 31.42% in males, and 66.22 and
33.78% in females, respectively. There were no statistically
significant differences in the parameters of sex, age or
thyroiditis (P>0.05). The number of PTMC cases in the ‘interior’
and ‘lateral’ sections was 916 and 458, respectively, suggesting a
possible association between PTMC distribution and Von Mises stress
in the thyroid.
 | Table I.PTMC distribution in thyroid. |
Table I.
PTMC distribution in thyroid.
| Characteristic | Interior, n
(%) | Lateral, n (%) | P-value |
|---|
| Sex |
|
|
|
|
Male | 179 (68.58) | 82 (31.42) | P>0.05 |
|
Female | 737 (66.22) | 376 (33.78) |
|
| Age, years |
|
|
|
|
≥50 | 403 (66.50) | 203 (33.50) | P>0.05 |
|
≤50 | 513 (66.79) | 255 (33.21) |
|
| Thyroiditis |
|
|
|
|
Yes | 227 (68.58) | 104 (31.42) | P>0.05 |
| No | 689 (66.06) | 354 (33.94) |
|
Biomechanical gene expression in PTMC
and adjacent normal tissues
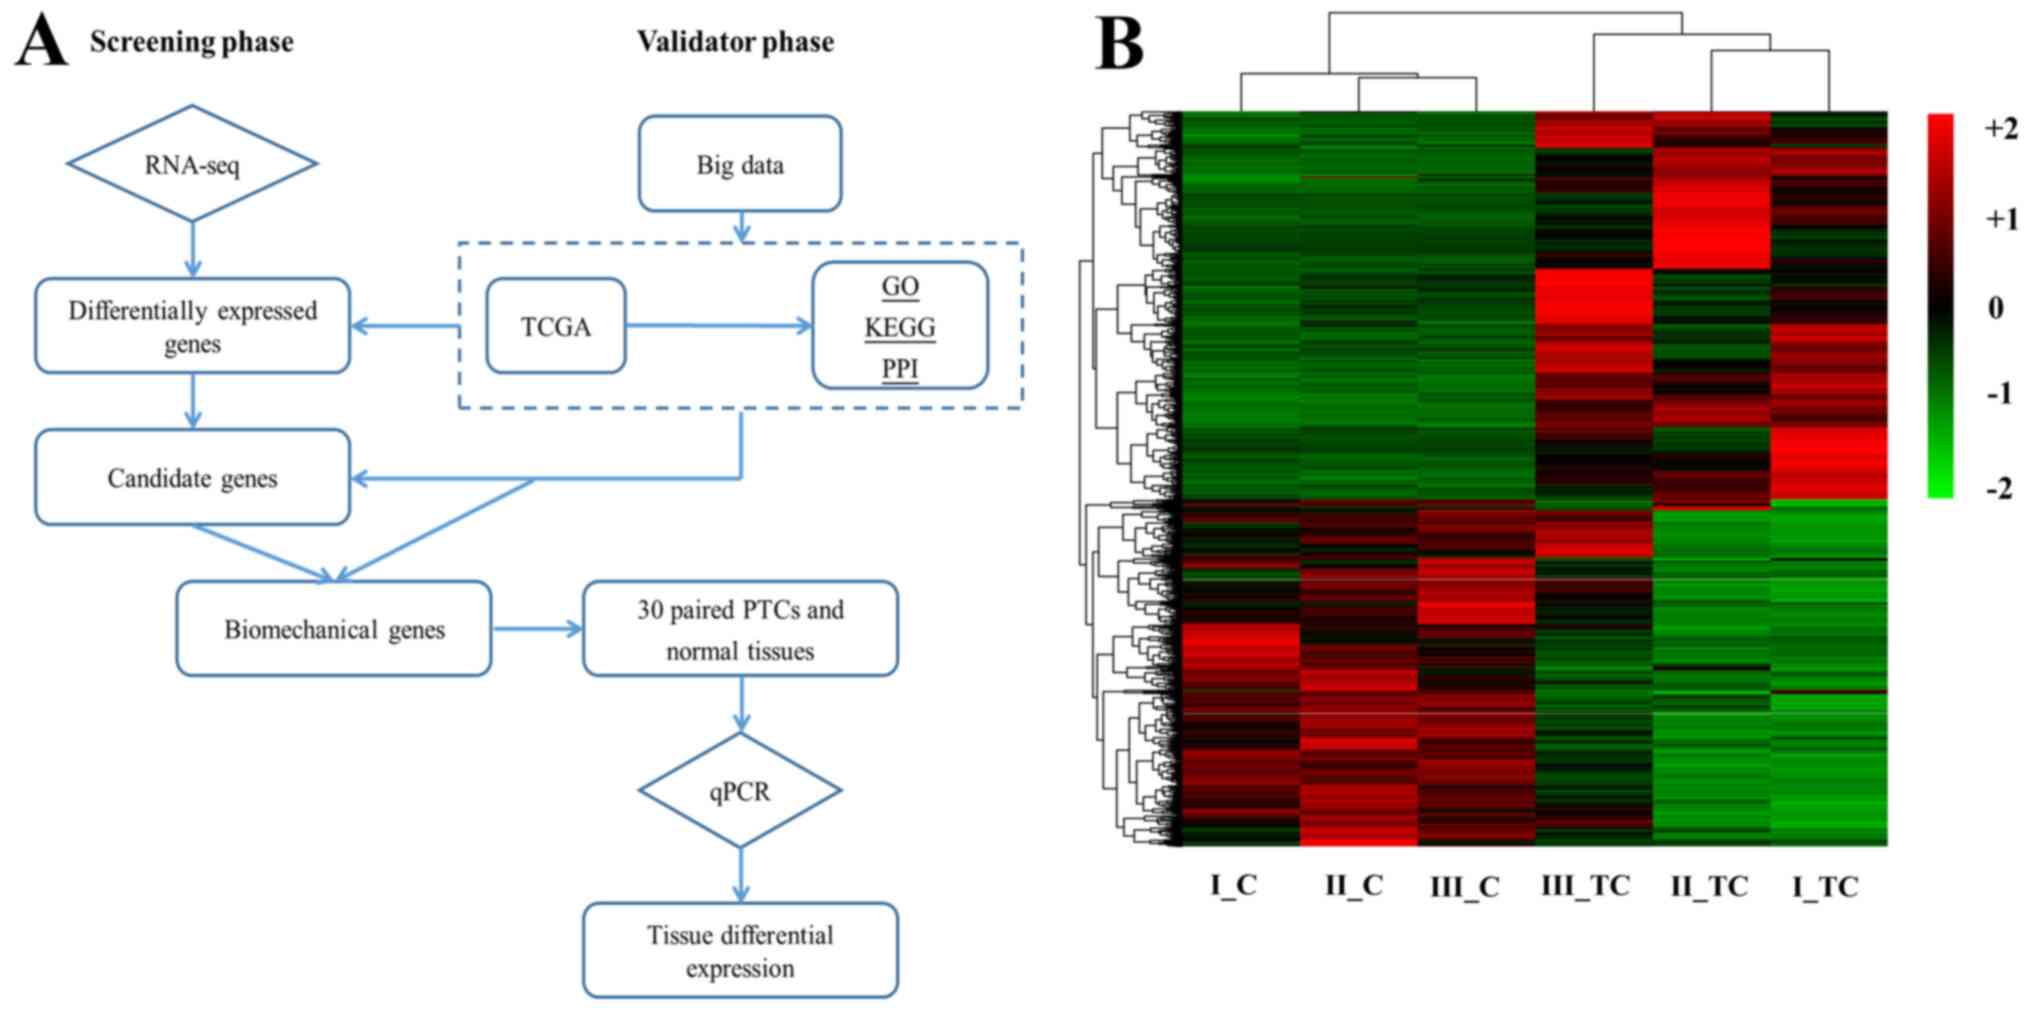
To evaluate biomechanical gene expression in
different tissues, including PTMC and adjacent normal tissue, a
total of 18,154 genes were detected from gene expression profiling.
Flow diagram analysis of all the expressed genes indicated that
15,743 (86.7%) were expressed in all 3 samples for RNA-seq
(Fig. 3B). The heatmap revealed the
relative gene expression level in different samples (Fig. 3B). Based on the criteria, 1,504 genes
were identified as DEGs between the PTC and adjacent normal
tissues, of which 794 were upregulated and 710 were downregulated
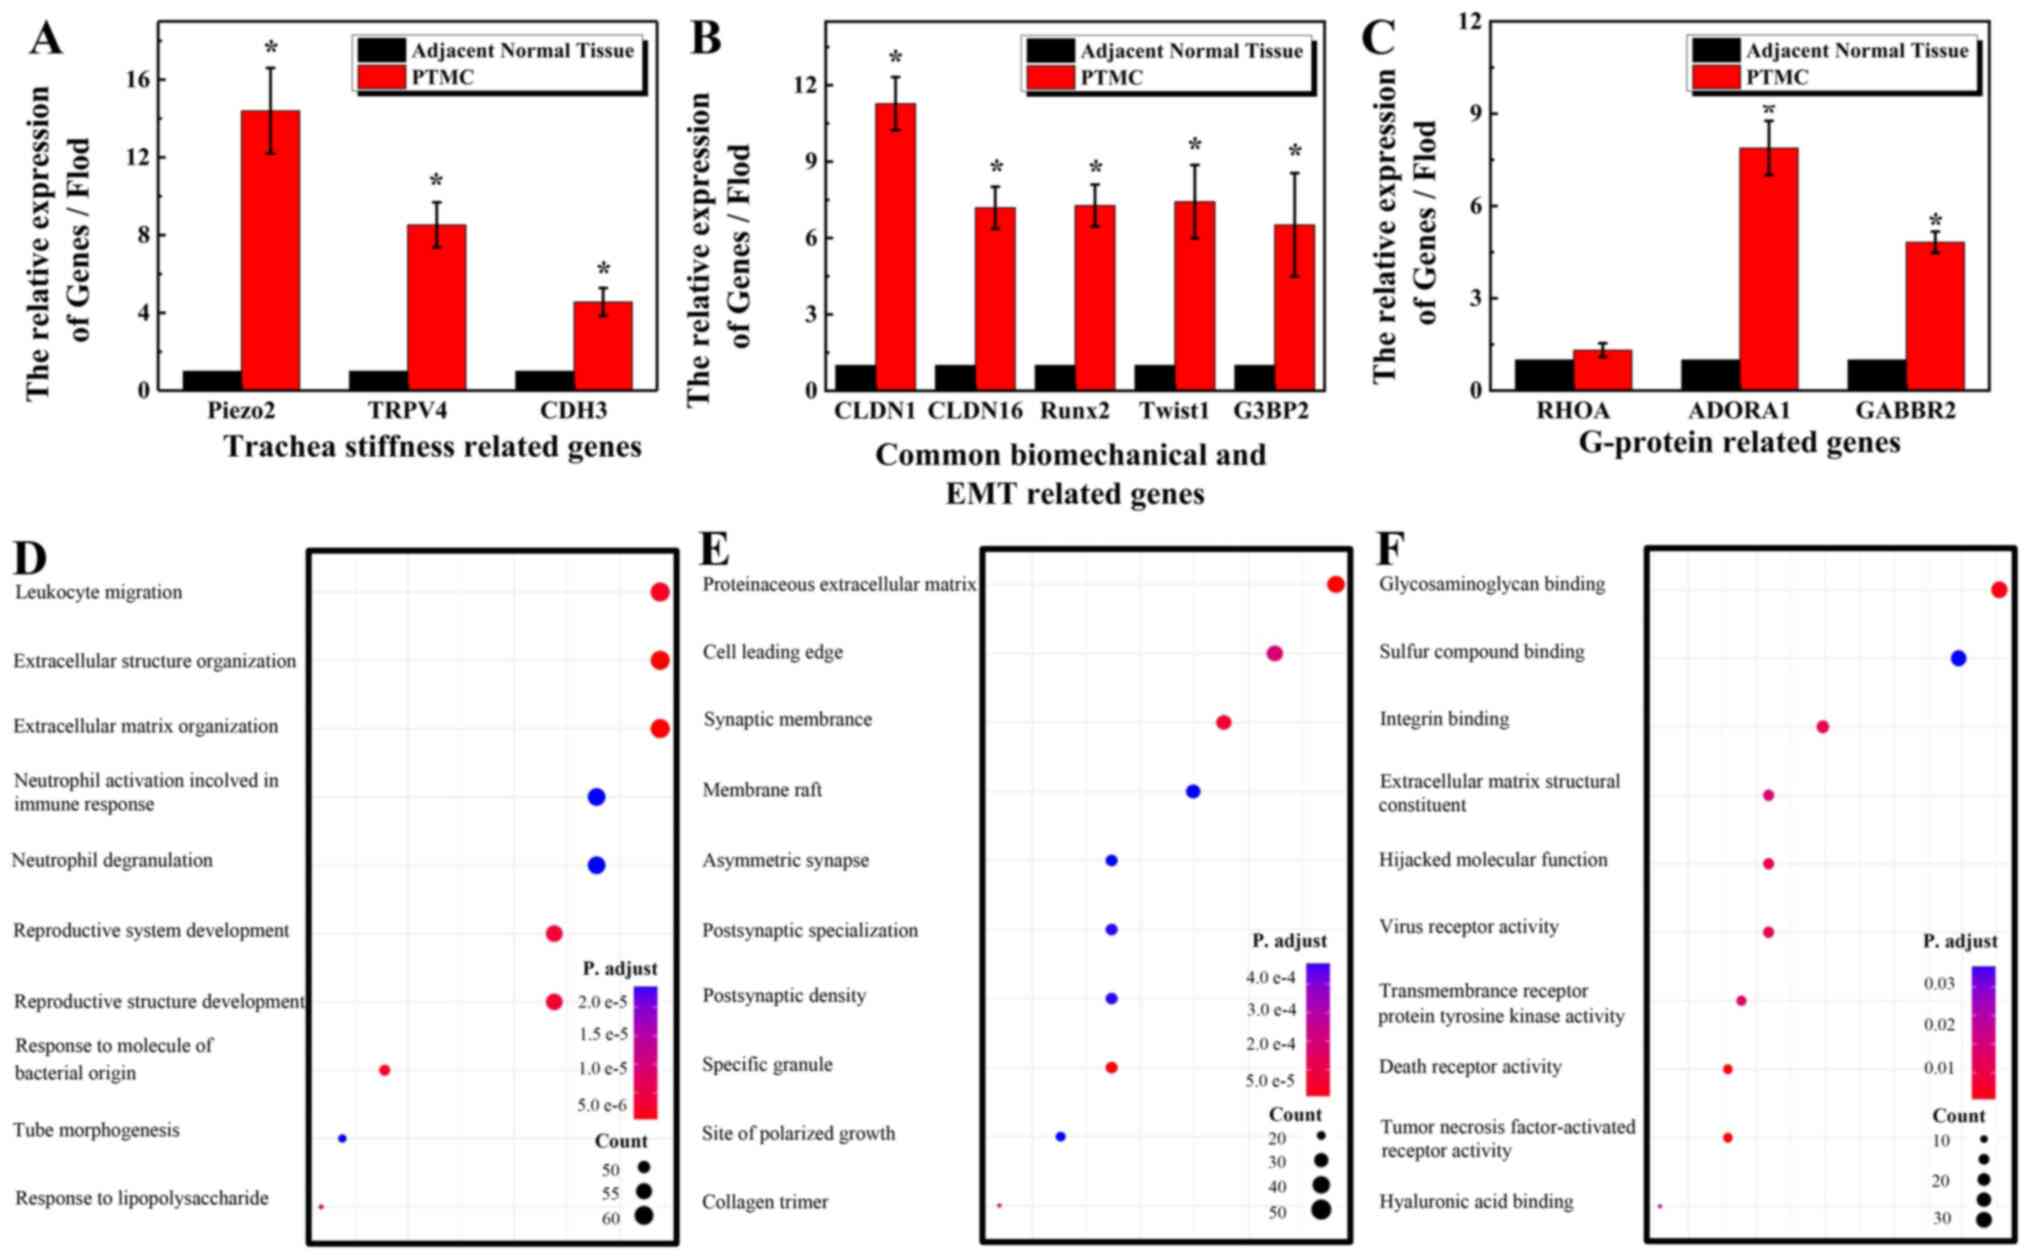
(Fig. S4A). In addition, the
results of RT-qPCR indicated that the overexpressed genes in PTC
were biomechanical sensors, including Piezo2, TRPV4 and
CDH3 (Fig. 4A), ECM stiffness
and EMT related genes, including CLDN1, CLDN16, Runx2, Twist
and G3BP3 (Fig. 4B) compared
with that in the lateral normal tissues. However, some of the
G-protein-related genes, including ADORA1 and GABBR2,
exhibited a higher expression in PTC compared with that in adjacent
normal tissues; however, there was no notable difference in the
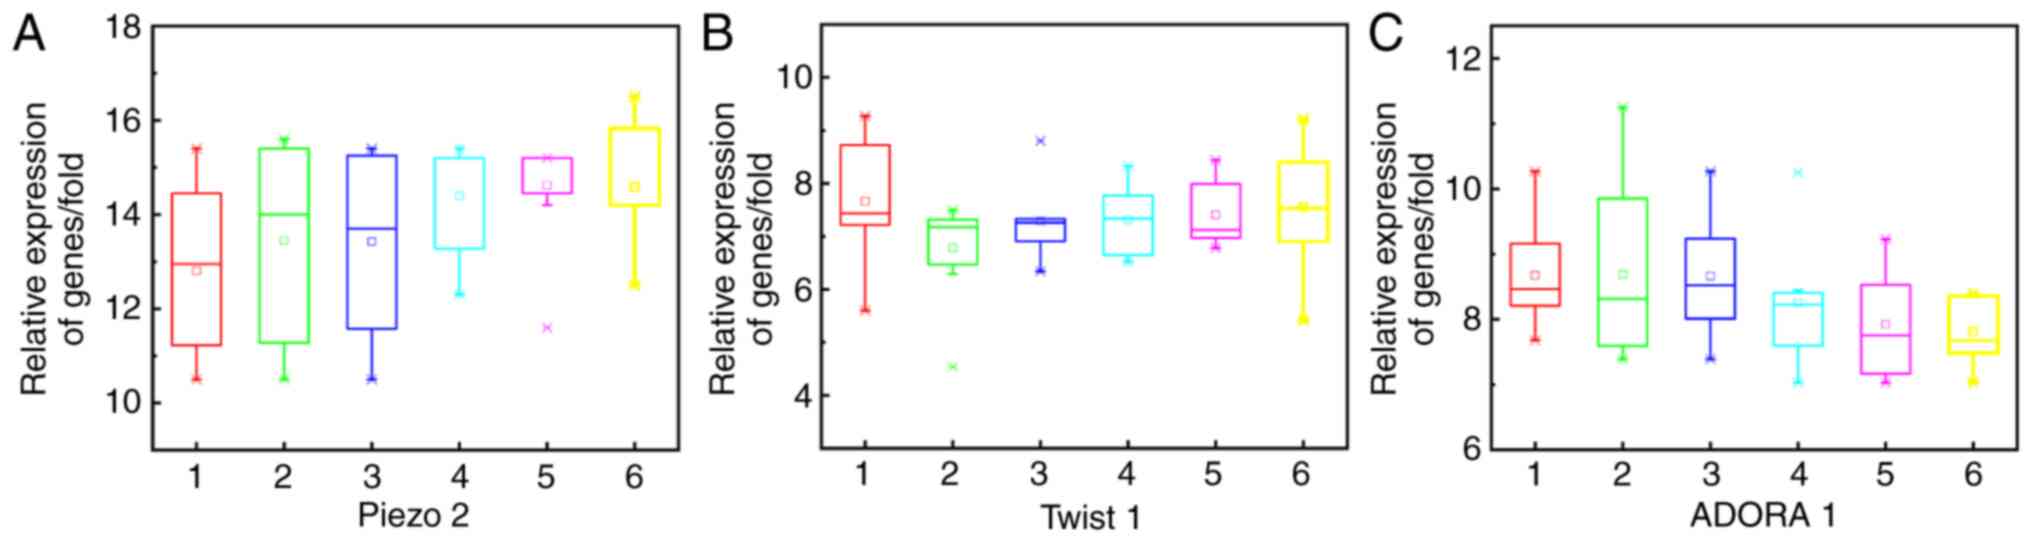
expression of RHOA among the groups (Fig. 4C). The expression level of these
genes did not exhibit any significant difference by sex, age or
thyroiditis, as shown in Fig. 5.
With respect to the Piezo2, CHD3, Runx2 and
Twist1 genes, the expression levels in PTMC, located in the
interior section were notably higher compared with that in the
lateral regions (Fig. S3).
Characterizations of the biomechanical
functions and pathways in PTC
GO functional enrichment analysis in PTC, in
comparison with TCGA, revealed the top 10 GO enrichment terms for
tumors for ‘biological processes’ (BP) (Fig. 4D), ‘cellular component’ (CC)
(Fig. 4E) and ‘molecular function’
(MF) (Fig. 4F).
The upregulated genes were significantly enriched in
‘cell adhesion’ (GO: 0007155), ‘immune system process’ (GO:
0002376), ‘ECM organization’ (GO: 0030198), ‘osteoclast formation’,
‘anatomical structure development’ (GO: 0048856), ‘single-organism
cellular process’ (GO: 0044763), ‘response to stress’ (GO:
0006950), ‘cell proliferation’ (GO: 0008283) (Fig. S4).
The most notable BP terms of the downregulated genes
were ‘anatomical structure development’ (GO: 0048856),
‘single-organism developmental process’ (GO: 0044767), ‘cell
differentiation’ (GO: 0030154), ‘cellular developmental process’
(GO: 0048869), ‘extracellular matrix organization’ (GO: 0030198),
‘cell morphogenesis’ (GO: 0000902), ‘cell adhesion’ (GO: 0007155)
(Fig. S4C). KEGG pathway annotation
revealed that signal transduction and immune system-related genes
mainly participated in PTMC (Fig.
S4D).
Discussion
Similar to other types of endothelial cancer, PTC
cells exhibit a stronger migratory ability and favor growth on a
stiffness substrate in vitro (23–26). As
shown in the direct performance of this feature in the thyroid,
>60% of PTMC cases are located close to the trachea, which is a
relatively stiff organ. Jasim et al (9) reported that thyroid tumors located on
the isthmus exhibited the highest possibility of malignancy,
followed by upper and middle thyroid nodules. In the present study,
from the FEA of the thyroid, the von Mises stress values of the
isthmus and upper section close to the trachea were higher compared
with that away from the trachea (Fig.
2C). Therefore, there may be an association between PTC
distribution and stiffness, indicating a related differential gene
expression in PTC.
RNA-seq and RT-qPCR determined that three
biomechanical genes exhibited up- or downregulated expression in
PTC compared with that in adjacent normal tissue, and the related
signaling pathways were enriched. For example, Piezo2 is
commonly recognized as an important mechanotransduction channel
participating in proprioception (27,28),
pain (29) and lung airway
stretching (30). It also serves as
a novel regulator of glioma angiogenesis and hyperpermeability;
knocking down the expression of Piezo2 using small
interfering RNA significantly inhibited the growth of glioma in
both in vivo and in vitro experiments (31). The overexpression of Piezo2
was detected in PTC, but not in adjacent normal tissue (Fig. 4A), which warrants further
investigation.
E-cadherin, as an important marker regulated by
cadherin 3 (CDH3) in epithelial cells, is overexpressed
during thyroid development (32).
CDH3 is involved in various cellular activities, including
cell adhesion, motility, invasion and the signaling of tumor cells
and organ development (33). In
breast cancer, CDH3 has been found to be overexpressed in
high-grade tumors and is a well-established indicator of aggressive
tumor behavior (34). The results of
the present study demonstrated that CDH3 was overexpressed
in PTC (Fig. 4A). Furthermore, its
expression in PTMC located close to the trachea was notably higher
compared with that in regions further away from the trachea; its
function warrants further exploration. In addition, other trachea
stiffness-related genes, such as Piezo2, and biomechanical
and EMT-related genes, including Runx2 and Twist1,
also showed higher expression in PTMC located interiorly than
laterally. Due to the important function of these genes in tumor
metabolism, their effects on PTMC located in different locations
requires further investigation. TRPV4, a calcium influx and
stress sensor channel, was also found to be overexpressed in PTC
and the G-protein related signaling pathways were enriched in
PTC.
Stress-related signaling pathways were found to be
highly enriched in PTC compared with that in adjacent normal
tissue, including cell adhesion (GO: 0007155), ECM organization
(GO: 0030198), anatomical structure development (GO: 0048856),
single-organism cellular process (GO: 0044763), response to stress
(GO: 0006950) and cell proliferation (GO: 0008283). Although these
pathways play important roles in several other types of tumors
(23,25); however, reports on their functions in
PTC are limited. The present study provided a novel method with
which to identify the factors affecting PTC distribution and its
association with invasiveness.
In conclusion, the findings of the present study
indicated that tracheal stiffness may exert a biomechanical effect
on the thyroid; thus, may effect PTC distribution, providing a
novel molecular mechanism and fundamental basis for the prediction
and the development of possible novel treatment strategies for
PTC.
Supplementary Material
Supporting Data
Acknowledgements
Not applicable.
Funding
This study was support by Excellent Young Talents
Fund Program of TJMUCH (grant no. 2019-1-11) and National Natural
Science Foundation of China (grant nos. 31400801 and 11572043).
Availability of data and materials
The datasets generated and/or analyzed during the
current study are not publicly available, due to local legislation
prohibiting data sharing in public databases, but are available
from the corresponding author on reasonable request.
Authors' contributions
PL, RJ and BH designed the experiments, proposed the
study, conducted the experiments, analyzed the data, wrote and
edited the manuscript. HZ collected the clinical data from patients
and the laboratory. TL and QL conducted the finite element
analysis. XD conducted the RNA-sequencing and reverse
transcription-quantitative PCR experiments and analyzed the data.
All authors read and approved the final manuscript and agree to be
accountable for all aspects of the research in ensuring that the
accuracy or integrity of any part of the work are appropriately
investigated and resolved. PL and RJ confirm the authenticity of
all the raw data.
Ethics approval and consent to
participate
The present study was approved by The Research
Ethics Committee at Tianjin Medical University Cancer Hospital
(Tianjin, China; approval no. 2018090). Written informed consent
was provided by all the patients.
Patient consent for publication
Not applicable.
Competing interests
The authors declare that they have no competing
interests.
References
|
1
|
Brooks SA, Lomax-Browne HJ, Carter TM,
Kinch CE and Hall DM: Molecular interactions in cancer cell
metastasis. Acta Histochem. 112:3–25. 2010. View Article : Google Scholar : PubMed/NCBI
|
|
2
|
Kausch I and Böhle A: Molecular aspects of
bladder cancer III. Prognostic markers of bladder cancer. Eur Urol.
41:15–29. 2002. View Article : Google Scholar : PubMed/NCBI
|
|
3
|
Zhang R, Ma M, Dong G, Yao RR, Li JH,
Zheng QD, Dong YY, Ma H, Gao DM, Cui JF, et al: Increased matrix
stiffness promotes tumor progression of residual hepatocellular
carcinoma after insufficient heat treatment. Cancer Sci.
108:1778–1786. 2017. View Article : Google Scholar : PubMed/NCBI
|
|
4
|
Levental KR, Yu H, Kass L, Lakins JN,
Egeblad M, Erler JT, Fong SF, Csiszar K, Giaccia A, Weninger W, et
al: Matrix crosslinking forces tumor progression by enhancing
integrin signaling. Cell. 139:891–906. 2009. View Article : Google Scholar : PubMed/NCBI
|
|
5
|
Sung H, Ferlay J, Siegel RL, Laversanne M,
Soerjomataram I, Jemal A and Bray F: Global cancer statistics 2020:
GLOBOCAN estimates of incidence and mortality worldwide for 36
cancers in 185 countries. CA Cancer J Clin. Feb 4–2021.(Epub ahead
of print). View Article : Google Scholar : PubMed/NCBI
|
|
6
|
La Vecchia C, Malvezzi M, Bosetti C,
Garavello W, Bertuccio P, Levi F and Negri E: Thyroid cancer
mortality and incidence: A global overview. Int J Cancer.
136:2187–2195. 2015. View Article : Google Scholar : PubMed/NCBI
|
|
7
|
Liang W and Sun F: Identification of key
genes of papillary thyroid cancer using integrated bioinformatics
analysis. J Endocrinol Invest. 41:1237–1245. 2018. View Article : Google Scholar : PubMed/NCBI
|
|
8
|
Cui D, Zhao Y and Xu J: Activated
CXCL5-CXCR2 axis promotes the migration, invasion and EMT of
papillary thyroid carcinoma cells via modulation of β-catenin
pathway. Biochimie. 148:1–11. 2018. View Article : Google Scholar : PubMed/NCBI
|
|
9
|
Jasim S, Baranski TJ, Teefey SA and
Middleton WD: Investigating the effect of thyroid nodule location
on the risk of thyroid cancer. Thyroid. 30:401–407. 2020.
View Article : Google Scholar : PubMed/NCBI
|
|
10
|
Brauckhoff M and Dralle H: Cervicovisceral
resection in invasive thyroid tumors. Chirurg. 80:88–98. 2009.(In
German). View Article : Google Scholar : PubMed/NCBI
|
|
11
|
Machens A, Hinze R and Dralle H: Surgery
on the cervicovisceral axis for invasive thyroid cancer.
Langenbecks Arch Surg. 386:318–323. 2001. View Article : Google Scholar : PubMed/NCBI
|
|
12
|
Kim JW, Roh JL, Gong G, Cho KJ, Choi SH,
Nam SY and Kim SY: Treatment outcomes and risk factors for
recurrence after definitive surgery of locally invasive
well-differentiated papillary thyroid carcinoma. Thyroid.
26:262–270. 2016. View Article : Google Scholar : PubMed/NCBI
|
|
13
|
He S, Liu C, Li X, Ma S, Huo B and Ji B:
Dissecting collective cell behavior in polarization and alignment
on micropatterned substrates. Biophys J. 109:489–500. 2015.
View Article : Google Scholar : PubMed/NCBI
|
|
14
|
Yao P and Xin WH: Experimental study on
the goiter's effect on the stress relaxation of thyroid. Chin J
Control Endemic Dis. 19:79–80. 2004.PubMed/NCBI
|
|
15
|
Trabelsi O, del Palomar AP,
López-Villalobos JL, Ginel A and Doblaré M: Experimental
characterization and constitutive modeling of the mechanical
behavior of the human trachea. Med Eng Phys. 32:76–82. 2010.
View Article : Google Scholar : PubMed/NCBI
|
|
16
|
Haddad RI, Nasr C, Bischoff L, Busaidy NL,
Byrd D, Callender G, Dickson P, Duh QY, Ehya H, Goldner W, et al:
NCCN guidelines insights: Thyroid carcinoma, version 2.2018. J Natl
Compr Canc Netw. 16:1429–1440. 2018. View Article : Google Scholar : PubMed/NCBI
|
|
17
|
Cabanillas ME, McFadden DG and Durante C:
Thyroid cancer. Lancet. 388:2783–2795. 2016. View Article : Google Scholar : PubMed/NCBI
|
|
18
|
Robinson MD, Mccarthy DJ and Smyth GK:
edgeR: A bioconductor package for differential expression analysis
of digital gene expression data. Bioinformatics. 26:139–140. 2010.
View Article : Google Scholar : PubMed/NCBI
|
|
19
|
Benjamini Y and Hochberg Y: Controlling
the false discovery rate: A practical and powerful approach to
multiple testing. J R Statist Soc B. 57:289–300. 1995.
|
|
20
|
Szklarczyk D, Franceschini A, Kuhn M,
Simonovic M, Roth A, Minguez P, Doerks T, Stark M, Muller J, Bork
P, et al: The STRING database in 2011: Functional interaction
networks of proteins, globally integrated and scored. Nucleic Acids
Res. 39((Database Issue)): D561–D568. 2011. View Article : Google Scholar : PubMed/NCBI
|
|
21
|
Adamcsek B, Palla G, Farkas IJ, Derényi I
and Vicsek T: CFinder: Locating cliques and overlapping modules in
biological networks. Bioinformatics. 22:1021–1023. 2006. View Article : Google Scholar : PubMed/NCBI
|
|
22
|
Livak KJ and Schmittgen TD: Analysis of
relative gene expression data using real-time quantitative PCR and
the 2(-Delta Delta C(T)) method. Methods. 25:402–408. 2001.
View Article : Google Scholar : PubMed/NCBI
|
|
23
|
Peng Y, Chen Y, Qin X, Li S and Liu Y:
Unveiling the mechanotransduction mechanism of substrate
stiffness-modulated cancer cell motility via ROCK1 and ROCK2
differentially regulated manner. FASEB J. 33:644.42019.PubMed/NCBI
|
|
24
|
Liang J, Zhang XL, Yuan JW, Zhang HR, Liu
D, Hao J, Ji W, Wu XZ and Chen D: Cucurbitacin B inhibits the
migration and invasion of breast cancer cells by altering the
biomechanical properties of cells. Phytother Res. 33:618–630.
2019.PubMed/NCBI
|
|
25
|
Pardo-Pastor C, Rubio-Moscardo F,
Vogel-González M, Serra SA, Afthinos A, Mrkonjic S, Destaing O,
Abenza JF, Fernández-Fernández JM, Trepat X, et al: Piezo2 channel
regulates RhoA and actin cytoskeleton to promote cell
mechanobiological responses. Proc Natl Acad Sci USA. 115:1925–1930.
2018. View Article : Google Scholar : PubMed/NCBI
|
|
26
|
McKenzie AJ, Hicks SR, Svec KV, Naughton
H, Edmunds ZL and Howe AK: The mechanical microenvironment
regulates ovarian cancer cell morphology, migration, and spheroid
disaggregation. Sci Rep. 8:72282018. View Article : Google Scholar : PubMed/NCBI
|
|
27
|
Woo SH, Lukacs V, de Nooij JC, Zaytseva D,
Criddle CR, Francisco A, Jessell TM, Wilkinson KA and Patapoutian
A: Piezo2 is the principal mechanotransduction channel for
proprioception. Nat Neurosci. 18:1756–1762. 2015. View Article : Google Scholar : PubMed/NCBI
|
|
28
|
Coste B, Mathur J, Schmidt M, Earley TJ,
Ranade S, Petrus MJ, Dubin AE and Patapoutian A: Piezo1 and Piezo2
are essential components of distinct mechanically activated cation
channels. Science. 330:55–60. 2010. View Article : Google Scholar : PubMed/NCBI
|
|
29
|
Ferrari LF, Bogen O, Green P and Levine
JD: Contribution of Piezo2 to endothelium-dependent pain. Mol Pain.
11:652015. View Article : Google Scholar : PubMed/NCBI
|
|
30
|
Nonomura K, Woo SH, Chang RB, Gillich A,
Qiu Z, Francisco AG, Ranade SS, Liberles SD and Patapoutian A:
Piezo2 senses airway stretch and mediates lung inflation-induced
apnoea. Nature. 541:176–181. 2017. View Article : Google Scholar : PubMed/NCBI
|
|
31
|
Yang H, Liu C, Zhou RM, Yao J, Li XM, Shen
Y, Cheng H, Yuan J, Yan B and Jiang Q: Piezo2 protein: A novel
regulator of tumor angiogenesis and hyperpermeability. Oncotarget.
7:44630–44643. 2016. View Article : Google Scholar : PubMed/NCBI
|
|
32
|
Kameda Y, Nishimaki T, Chisaka O, Iseki S
and Sucov HM: Expression of the epithelial marker E-cadherin by
thyroid C cells and their precursors during murine development. J
Histochem Cytochem. 55:1075–1088. 2007. View Article : Google Scholar : PubMed/NCBI
|
|
33
|
Taniuchi K, Nakagawa H, Hosokawa M,
Nakamura T, Eguchi H, Ohigashi H, Ishikawa O, Katagiri T and
Nakamura Y: Overexpressed P-cadherin/CDH3 promotes motility of
pancreatic cancer cells by interacting with p120ctn and activating
rho-family GTPases. Cancer Res. 65:3092–3099. 2005. View Article : Google Scholar : PubMed/NCBI
|
|
34
|
Albergaria A, Resende C, Nobre AR, Ribeiro
AS, Sousa B, Machado JC, Seruca R, Paredes J and Schmitt F:
CCAAT/enhancer binding protein β (C/EBPβ) isoforms as
transcriptional regulators of the pro-invasive CDH3/P-cadherin gene
in human breast cancer cells. PLoS One. 8:e557492013. View Article : Google Scholar : PubMed/NCBI
|