Introduction
Immune-oncology therapeutics represent a novel
approach to cancer therapy that has been demonstrated to
significantly improve outcomes and quality of life of patients with
different types of cancer. Several immune checkpoint inhibitors
(ICIs) have already been approved for clinical practice or are in
advanced phases of clinical experimentation; however, only a small
proportion of patients achieve a long-lasting response to treatment
with ICIs (1–3). Therefore, numerous efforts are being
made to identify robust biomarkers to correctly select patients who
may benefit from this therapy in order to decrease side effects and
cost.
At present, the expression levels of PD-L1 and
microsatellite instability (MSI) are the only predictive biomarkers
approved for patient selection, but responses are also registered
in certain patients with low PD-L1 expression or microsatellite
stability (MSS) (4–6). Results from several studies have
suggested that tumor mutation burden (TMB) may be an additional
biomarker of response to ICIs in different tumor types (6–15).
TMB is defined as the total number of somatic
mutations per coding area of a tumor genome. The rationale of its
use as a biomarker is based on the fact that somatic mutations may
lead to the formation of tumor-specific neoantigens, which are able
to trigger T-cell activation against tumor cells (16–19).
There is a large variability in mutation burden among and within
tumor types, ranging from just a few to thousands of mutations
(20–22). Results from several studies have
demonstrated that subsets of patients with high TMB exist across
almost all cancer types (12,14).
TMB and PD-L1 expression only partially overlap.
Therefore, TMB may be complementary to PD-L1. Notably, the
co-expression of the two biomarkers (high TMB/PD-L1 >50%) has
previously been used to identify a subgroup of patients with the
highest response rate (8,23). Similarly, patients with high TMB and
high expression levels of genes associated with a T-cell inflamed
state have been reported to exhibit the best outcome when treated
with ICIs (24). Notably, TMB is
also emerging as a prognostic marker that may aid in better
stratifying patients with colon or lung cancer (25,26).
In this scenario, the possible use of TMB as a
predictive and/or prognostic biomarker is challenged by the methods
required for its evaluation. Whole-exome sequencing (WES) is the
standard for TMB measurement, since it is able to identify all the
possible somatic mutations in the entire tumor genome that may lead
to the expression of neoantigens. However, this approach is clearly
difficult to be translated into clinical practice, due to cost,
amount of material required, complexity of output data and
turnaround time. Therefore, the possible use of targeted
next-generation sequencing (NGS) panels has been investigated as an
alternative to WES. Panels that cover just a few hundred genes and
at least ~1 megabase (Mb) of the human coding genome have been
reported to correlate efficiently with TMB calculated by WES, in
terms of TMB values and clinical responses observed in patients
(11,27–30).
Nevertheless, the panels used in these previous studies, as well as
the assays that will enter the market in the future, may vary
substantially in terms of genes covered, cut-offs used to
discriminate samples with high or low TMB, and bioinformatics
pipelines used for data analysis. Standardization and harmonization
of these approaches are needed in order to provide a robust and
reproducible biomarker.
Bioinformatics serve a relevant role in the analysis
of targeted sequencing data and its standardization is essential in
order to deliver a reliable test for use in clinical practice. In
addition, the definition of TMB and, in particular, of the type of
mutations (both synonymous and non-synonymous versus only
non-synonymous) that should be included in the estimation of TMB
have changed over the time. In this respect, the aim of the present
study was to describe the results obtained with the first
commercially available panel for TMB measurement, i.e. the
Oncomine™ Tumor Mutational Load (OTML) assay, and the work
undertaken to develop an appropriate bioinformatics analytical
pipeline.
Materials and methods
Samples and DNA extraction
Cultured cell lines and formalin-fixed
paraffin-embedded (FFPE) samples were obtained from two different
sources. The following human tumor cell lines were obtained from
American Type Culture Collection: Colorectal carcinoma Colo320,
RKO, LoVo, HCT116, HT29, SW1116 and LS174T cell lines, and the lung
carcinoma NCI-H1650 and NCI-H1975 cell lines. Cultured cell lines
were maintained in a humidified atmosphere at 37°C and 5%
CO2. Colo320, NCI-H1650 and NCI-H1975 cells were grown
in RPMI 1640 medium with GlutaMAX supplemented with 10% fetal
bovine serum (FBS) (all from Thermo Fisher Scientific, Inc.). RKO
and LS174T cells were cultured in Eagle's Minimum Essential Medium
with GlutaMAX (Gibco; Thermo Fisher Scientific, Inc.) and 10% FBS.
Lovo cells were maintained in F-12K medium with GlutaMAX (Gibco;
Thermo Fisher Scientific, Inc.) and 10% FBS. HCT116 and HT29 cells
were grown in McCoy's 5a medium (Gibco; Thermo Fisher Scientific,
Inc.) modified plus GlutaMAX and 10% FBS. SW1116 cells were
cultured in Leibovitz's L-15 medium with GlutaMAX (Gibco; Thermo
Fisher Scientific, Inc.) containing 10% FBS.
The following cell lines were provided as FFPE
samples from AccuRef Diagnostics: Lung carcinoma A549 and H2228
cell lines, the colorectal carcinoma HCC2998 cell line, the
melanoma SK-MEL-2 cell line, and the breast cancer MCF7 and T47D
cell lines. Genomic DNA (gDNA) was isolated from the cultured cell
lines using the DNeasy Blood & Tissue kit (Qiagen) and from
FFPE cell lines using the RecoverAll Total Nucleic Acid Isolation
kit (Invitrogen; Thermo Fisher Scientific, Inc.), according to the
manufacturers' protocols. The gDNA was quantified using the dsDNA
HS assay kit on the Qubit 2.0 Fluorometer (Thermo Fisher
Scientific, Inc.). The MSI status and POLE/POLD1 mutational status
for the 15 cell lines, as derived from public data (31,32) are
reported in Table I.
 | Table I.List of cell lines. |
Table I.
List of cell lines.
| Cell line | MSI status/other
relevant alteration | Tumor location,
histology | Type of sample |
|---|
| Colo320 | MSS | Large intestine,
carcinoma, adenocarcinoma | Cultured cells |
| H1650 | MSS | Lung carcinoma,
non-small cell carcinoma | Cultured cells |
| H1975 | MSS | Lung, carcinoma,
adenocarcinoma | Cultured cells |
| HT29 | MSS | Large intestine,
carcinoma, NS | Cultured cells |
| SW1116 | MSS | Large intestine,
carcinoma, adenocarcinoma | Cultured cells |
| HCT116 | MSI | Large intestine,
carcinoma, NS | Cultured cells |
| LoVo | MSI/POLD1 | Large intestine,
carcinoma, adenocarcinoma | Cultured cells |
| LS174T | MSI | Large intestine,
carcinoma, adenocarcinoma | Cultured cells |
| RKO | MSI | Large intestine,
carcinoma, NS | Cultured cells |
| A549 | MSS | Lung, carcinoma,
NS | FFPE cells |
| H2228 | MSS | Lung, carcinoma,
non-small cell carcinoma | FFPE cells |
| HCC2998 | MSS/POLE | Large intestine,
carcinoma, adenocarcinoma | FFPE cells |
| MCF7 | MSS | Breast, carcinoma,
NS | FFPE cells |
| T47D | MSS | Breast, carcinoma,
ductal carcinoma | FFPE cells |
| SK-MEL-2 | MSI | Skin, malignant
melanoma, NS | FFPE cells |
OTML assay
The OTML assay (Thermo Fisher Scientific, Inc.) is a
targeted NGS panel that covers 409 genes with known cancer
associations. Libraries were prepared using Ion AmpliSeq library
kit plus (Thermo Fisher Scientific, Inc.) starting from 10 ng gDNA
for each pool. Each library (50 pmol) was multiplexed and then
clonally amplified by emulsion PCR and enriched on the Ion Chef
instrument for automated template preparation using the Ion 540™
Chef kit, according to the manufacturer's protocol (Thermo Fisher
Scientific, Inc.). Finally, the template was loaded on an Ion 540™
chip and sequenced on an Ion S5XL sequencer (Thermo Fisher
Scientific, Inc.) according to the manufacturer's protocols (each
sequenced chip contained eight samples).
TMB data analysis
The NGS results were analyzed using the default
setting of two versions of the integrated pipelines, OTML v1.2 DNA
Single Sample on Ion Reporter software v.5.6 and OTML v2.0 DNA
Single Sample, available on the Ion Reporter software v.5.10
(Thermo Fisher Scientific, Inc.), which will be referred to as
version A and B, respectively.
In both versions of the analysis workflow, the
sequenced reads are aligned to human reference genome hg19 and the
resulting BAM files are transferred to Ion Reporter software for
variant calling. Several parameters of NGS analysis were used to
consider a sample suitable for the inclusion in the comparison
analysis with the two pipelines: Number of mapped reads,
>5,000,000×; mean read depth, >300×; percentage of reads on
target, >90%; target base coverage at 100×, >95%; uniformity,
>80%. TMB calculation does not require matched normal samples.
After the variant calling, a filter chain was applied to remove
germline variants using population databases (1000 Genome Project,
https://www.internationalgenome.org/data/; NHLBI GO
Exome Sequencing Project https://esp.gs.washington.edu/drupal/node/1; and ExAC,
http://bigd.big.ac.cn/databasecommons/database/id/3774),
and to select somatic variants which have a minimum depth of base
coverage above 60× to be used for TMB calculation without
generating noise. In version A, TMB is calculated by counting
synonymous and non-synonymous somatic single-base substitutions
(SNVs), at or above 5% allelic frequency (AF), from the full panel,
which is 1.2 Mb exonic and 0.45 Mb intronic. In version B, only the
non-synonymous SNVs and short insertion-deletion mutations (InDels)
with ≥5% AF are considered, derived from the 1.2-Mb exonic region.
The number of mutations counted is divided by the number of bases
with sufficient coverage, to normalize the TMB values. The variant
calling in version A is optimized only for the TMB calculation and
not for variant detection, whereas the workflow in version B is
also able to call clinically relevant variants in a specific
predefined set of genes with a limit of detection (LOD) of 5% AF.
Finally, following application of the filter chain, workflow B
applies calibration to bring the TMB values closer to WES-based
TMB. The calibration factor was calculated through linear modelling
on The Cancer Genome Atlas database (https://www.cancer.gov/about-nci/organization/ccg/research/structural-genomics/tcga).
Workflow A does not apply calibration.
At the end of each analysis, a report was provided
that included the normalized mutation load, defined as the number
of somatic mutations per Mb of genome with an average coverage not
less than 300×. In addition, the report summarized other
information on the samples, including coverage, variants called,
mutation signatures of the somatic variants, mutations consistent
with deamination, UV and tobacco smoke damage.
Statistical analysis
Pearson's correlation test was used to evaluate the
correlation between the mutation load/Mb obtained with workflow A
and workflow B on 13/15 cell lines and the mutation count obtained
with the massively parallel sequencing available on cBioPortal
(https://www.cbioportal.org/). The
correlation between TMB scores and the MSI status was assessed in
14 out of the 15 cell lines included in the present study.
Mann-Whitney ranked sum test was used for subgroup comparisons (MSS
vs. MSI groups). The Kruskal-Wallis test was used to compare the
mean TMB value of the two workflows in all types of cell lines and
in the selected MSS- and MSI-colorectal cell lines. Dunn's multiple
comparison test was used as post-hoc analysis. All the statistical
analyses were performed using the GraphPad PRISM version 5 for
windows (GraphPad Software, Inc.). P<0.05 was considered to
indicate a statistically significant difference.
Results
Targeted sequencing analysis with OTML
assay on cultured and FFPE cell lines
A total of 15 tumor cell lines, including nine
cultured and six FFPE cell lines, were analyzed using the OTML
assay. The panel included five MSI-high cell lines, nine MSS cell
lines and one MSS/POLE mutated cell line (Table I), as defined according to the
literature and public databases (31–33). The
raw data underwent bioinformatics analysis with the integrated
workflows. The obtained results were compared with each other and
to the expected data from the literature and public databases
(31–33).
To begin with, the obtained results on the entire
cohort of cell lines were comprehensively analyzed using the
bioinformatics workflows A and B, as aforementioned. The median TMB
values were 15.87 (range, 4.98–179.2) and 8.38 (range, 2.56–176.5)
with version A and B, respectively. The MSS cell line, HCC2998,
which carries the POLE p.P286R (c.857C>G) mutation, had the
highest TMB score among all the analyzed samples, with a TMB of
179.2 with workflow A and 176.5 with workflow B (Table II).
| Table II.TMB results with version A and B of
the Oncomine™ Tumor Mutation Load bioinformatics pipeline. Cell
lines are listed from the highest TMB value to the lowest according
to version A. |
Table II.
TMB results with version A and B of
the Oncomine™ Tumor Mutation Load bioinformatics pipeline. Cell
lines are listed from the highest TMB value to the lowest according
to version A.
| Cell line | Mutation load per
MB, version A | Mutation load per
MB, version B | Estimated SNP
proportion consistent with deamination, version A | Estimated SNP
proportion consistent with deamination, version B | Mutation
counta |
|---|
| HCC2998 | 179.17 | 176.5 | 0 | 3 | NA |
| RKO | 100.77 | 102.45 | 0 | 4 | 382 |
| LoVo | 77.61 | 74.27 | 1 | 13 | 267 |
| HCT116 | 74.62 | 63.35 | 0 | 2 | 227 |
| LS174T | 54.26 | 58.19 | 0 | 1 | NA |
| SK-MEL-2 | 33.83 | 18.72 | 0 | 4 | 90 |
| HT29 | 15.89 | 10.9 | 0 | 2 | 64 |
| SW1116 | 15.87 | 8.38 | 0 | 1 | 40 |
| H1975 | 10.37 | 6.69 | 0 | 1 | 54 |
| Colo320 | 9.78 | 5.88 | 0 | 1 | 23 |
| H2228 | 8.69 | 6.81 | 0 | 1 | 37 |
| H1650 | 6.74 | 5.04 | 0 | 2 | 25 |
| A549 | 6.25 | 7.57 | 0 | 1 | 34 |
| MCF7 | 6.16 | 3.39 | 0 | 0 | 19 |
| T47D | 4.98 | 2.56 | 0 | 2 | 21 |
The bioinformatics pipeline is also able to identify
mutations consistent with hydrolytic deamination of cytosine that
generates uracil, a mechanism that is generally caused by formalin
fixation. This phenomenon results in sequencing artifacts, which
may cause an overestimation of TMB values. In particular, the
workflows of analysis report as probable deamination mutations all
the C:G>T:A variants detected below an AF of 15%. Since the
parameters for variant calling are less stringent in workflow B, in
order to improve sensitivity to call the variants, more deamination
variants may be included in TMB calculation. In fact, when
comparing the results obtained with the two workflows, it was
revealed that the number of variants compatible with deamination
increased with version B, irrespective of the type of sample
analyzed (Table II). In particular,
the estimated number of possible deamination mutations ranged
between 0 and 4 with version B, with the exception of the LoVo cell
line, which had 13 mutations consistent with deamination. The LoVo
cell line was also the only sample in which a deamination event was
identified with version A. Notably, the TMB value in this specific
sample was not affected by the presence of deamination mutations
(Table II), possibly because
workflow B considers only non-synonymous alterations, thereby
including only a fraction of deamination mutations for TMB
calculation.
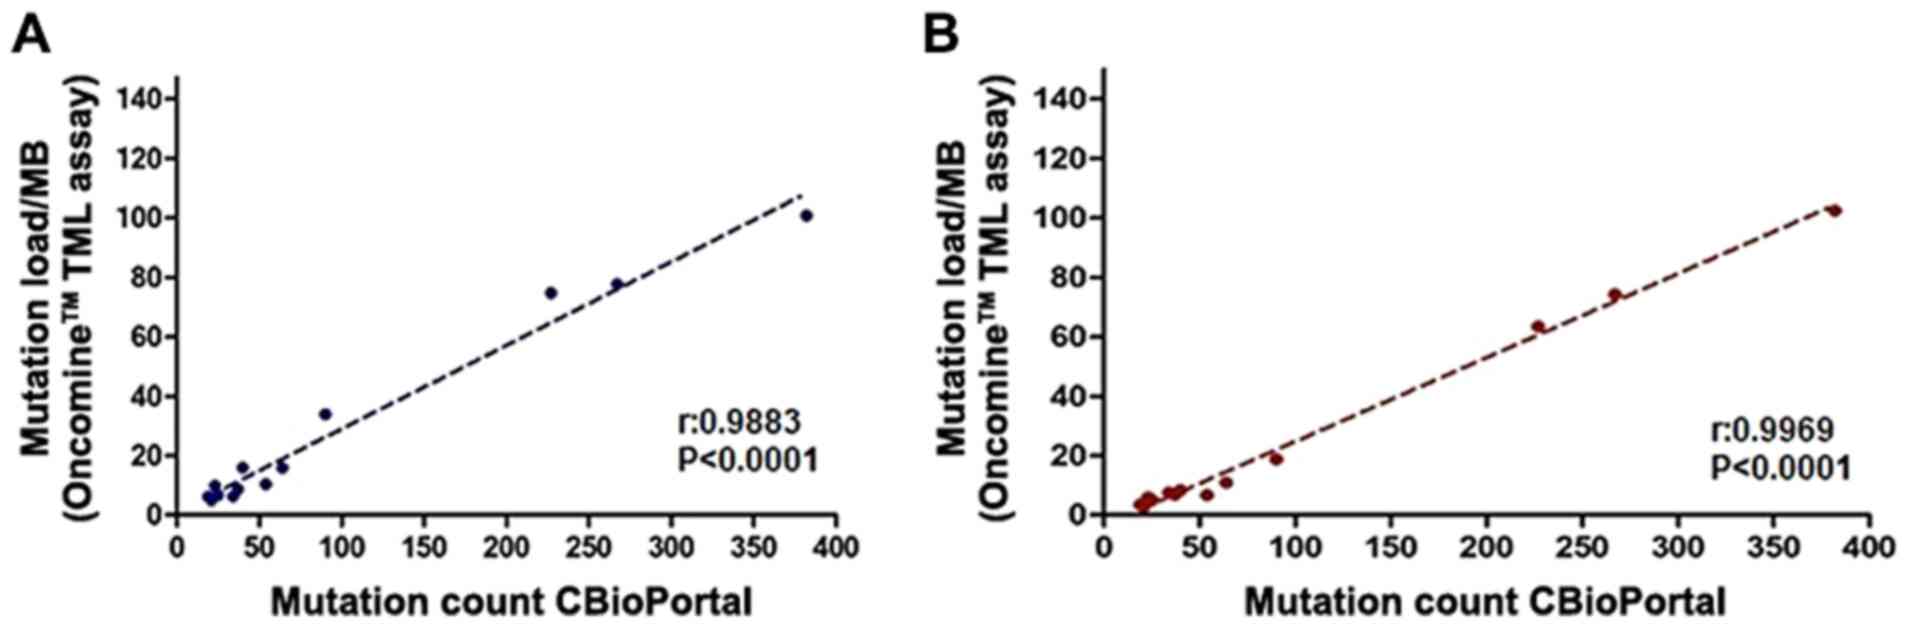
Correlation of TMB data
In order to investigate the ability of this targeted
panel to infer TMB, the TMB values were compared with the parallel
sequencing data from >1,600 genes for the same cell lines
available on cBioPortal and described in a study by Barretina et
al (34). This analysis was
performed on 13 out of 15 cell lines. The LS174T and HCC2998 cell
lines were excluded, since both cell lines were not sequenced by
Barretina et al (34). A
significant correlation was observed between the results of the
OTML assay and the mutations detected by wide genetic profiling
(version A: P<0.0001 and r=0.9883; version B: P<0.0001 and
r=0.9969; Fig. 1), with workflow B
resulting in a stronger correlation. When the type of material used
(FFPE vs. cultured) was taken into consideration, the correlation
in FFPE samples was slightly lower than in cultured samples (data
not shown). These data suggested that, despite the deamination
mutation, the TMB may be robustly calculated using the OTML panel,
both on cultured and FFPE cell lines. Finally, the bioinformatics
pipeline called all the genetic alterations reported in Cellosaurus
for the HT-29 cell line (https://web.expasy.org/cellosaurus/CVCL_0320), apart
from the PIK3CA mutation p.(Pro449Thr), which is not covered by the
amplicons included in the panel (data not shown).
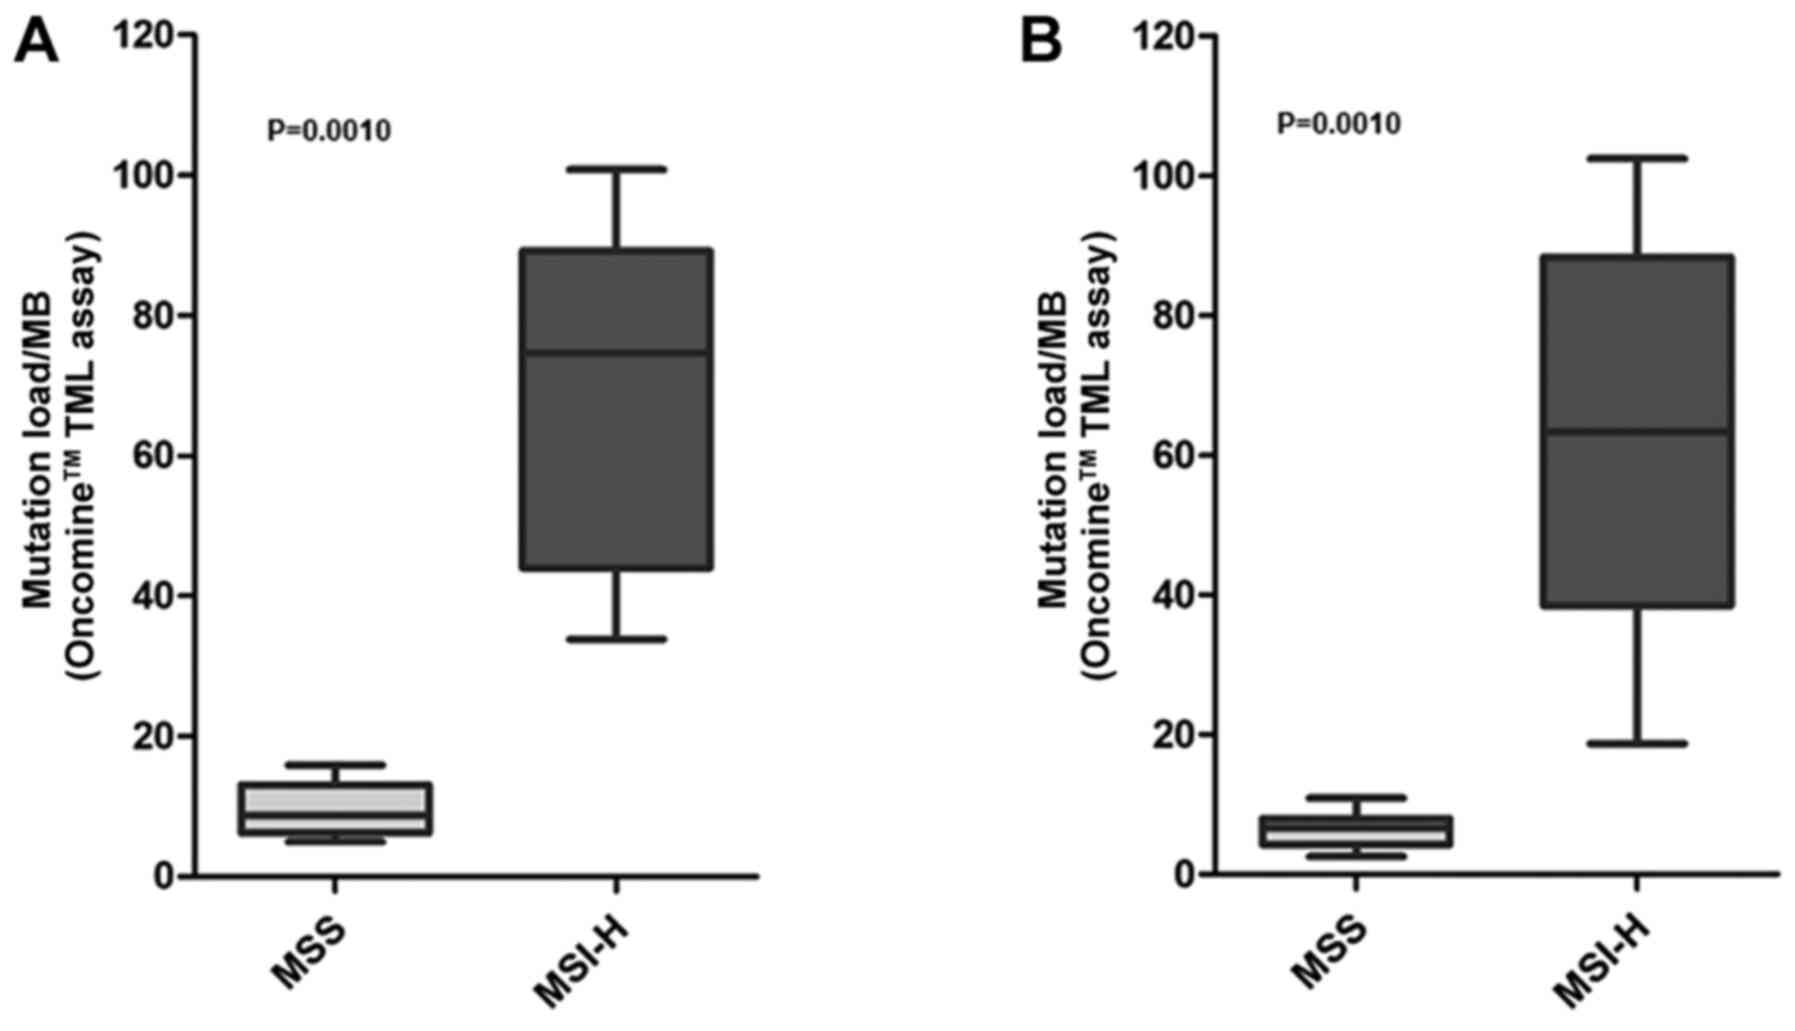
The TMB scores were compared with the MSI status, to
observe whether an association was present between these two
biomarkers, as expected. Since a mechanism of mutation accumulation
independent from the MSI status is known to be present in the
HCC2998 cell line (i.e. a POLE mutation), this sample was excluded
from the comparisons. The median TMB value was revealed to be
significantly increased in MSI- versus MSS-cell lines with the two
workflows (Mann Whitney test, P=0.0010; Fig. 2), confirming an association between
high mutation burden and MSI. The mean values of the MSS and MSI
groups of the two workflows were comprehensively compared,
revealing a significant difference in the observed means
(Kruskal-Wallis test, P=0.0002) (data not shown). Post-hoc analysis
with Dunn's multiple comparison test highlighted a significant
association (P<0.05) in the following subgroups: MSS vs. MSI-H
in both versions A and B; MSS v.B vs. MSI-H v.A was also
significantly different (data not shown). Additionally, a
significant difference was observed when the TMB values in the MSS-
and MSI-colorectal cell lines only were compared (13.85 vs. 76.82
version A, P=0.0027; 8.39 vs. 74.56 version B, P=0.0024) (data not
shown).
Discussion
Although TMB is emerging as a relevant biomarker for
ICI treatment in different tumor types, the optimal method for its
calculation remains to be established. The use of targeted panels
has demonstrated its efficacy in TMB measurement within clinical
trials (13,23). However, the use of panels poses
different considerations, starting from the coverage of the exome
that should be ≥1 Mb (27), to the
bioinformatics pipelines that are used to select the alterations to
be counted for the TMB estimation (19,35).
There is no consensus on the most appropriate approach for its
calculation since the definitions of TMB are multiple and based on
different assumptions (19,35). This lack of harmonization leads to
TMB values that change depending on the panels used and thus are
difficult to compare.
The panel used within the present study covers 1.7
Mb of genomic area and 1.2 Mb of exome area, and it has been
demonstrated to be sufficient to estimate TMB accurately (36,37).
However, within the same panel, adjustments to the analysis
workflow have been done since its launch on the market and some of
them substantially changed the way TMB is measured. Version A
included only single-base substitutions, considering both
synonymous and non-synonymous variants. Version B, despite
including only non-synonymous alterations, also counts short InDels
together with SNVs. The latter workflow is based on the correct
assumption that only non-synonymous alterations may lead to the
expression of neoantigens, which are responsible for the antitumor
immune response. However, the presence of random alterations is
anyway suggestive of a tumor that may accumulate a high number of
mutations, thus having a higher probability of presenting
neoantigens. As the genomic region from which the TMB value is
inferred is generally limited when using gene panels, the inclusion
of non-coding regions and non-synonymous alterations may aid in the
estimate of the TMB. Another aspect to consider is the different
impact of SNVs and InDels on the potential generation of
immunogenic antigens. Indeed, InDels alterations that cause a
frameshift may produce neoantigenic peptides highly different from
self, leading to a higher activation of T cells and an increased
immune response (38,39). In this regard, the presence of
frameshift InDels was significantly associated with response to
checkpoint inhibitors in datasets of patients with melanoma
(38). In another recent paper, an
increased progression-free survival was associated with the
presence of frameshift InDel burden in patients treated with ICIs
(40). In addition, significantly
different overall response rates and disease control rates were
observed between patients with and without frameshift InDels
(40). However, the data available
on the role of InDels and the different possible impact on response
to ICI are limited and further evaluation is required. At present,
the identification of the most appropriate TMB calculation remains
controversial and thus opened to different interpretations.
Another issue is associated with the material used.
FFPE-derived DNA may be difficult to use within NGS approaches due
to possible artifacts. Analysis pipelines should take into
consideration this problem and should provide information on the
quality of the DNA tested. The Ion Reporter analysis workflow
provides an estimation of the DNA quality, reporting the number of
possible deamination artifacts. In the event of a case with a high
number of artifacts, the data analysis with a LOD set at 10% could
be able to cut out the variants consistent with deamination, which
generally are present below 10–15% AF. This workflow, however, may
cause the loss of information on TMB, since certain alterations
that are present below 10% AF may be excluded from the TMB
calculation.
In the present study, the TMB panel used was able to
infer the TMB values as deducted from massive parallel sequencing
analyses of a higher number of genes compared with the OTML panel
(>1,600 vs. 409 genes), independently from the type of material
used, thus suggesting that it is a robust method for TMB
evaluation. However, there are certain limitations to the present
study. For example, it is focused on a small cohort of cell lines
and thus it is based on the use of artificial samples. On the other
hand, the use of standardized samples has several advantages when
describing the differences between two different bioinformatics
pipelines. In particular, the use of a well-characterized set of
samples, including cell lines, allows the comparison of these
results with data from literature and public databases, and may be
used to set the most suitable analysis approach to be transferred
later in clinical samples. Therefore, the present study is a
preliminary evaluation of the challenges and difficulties in
harmonizing TMB data. In addition, to the best of our knowledge,
the present study was the first to address the influence of the
different bioinformatics pipelines on the TMB value. Given the lack
of standardization of TMB testing and the recent FDA approval of
TMB as a diagnostic biomarker for solid tumors, the results of the
present study may be of high interest for the scientific community.
However, further analyses are required to collect information on
FFPE samples from patients, and also to retrieve clinical data from
patients treated with immunotherapy, to confirm the consistency of
the results.
In conclusion, the present data suggest that the two
bioinformatics pipelines used in the present study for data
analysis are able to correctly infer the TMB. Nevertheless, version
B exhibited a slightly better correlation with TMB assessed by wide
genomic profiling and it reflects the current definition of TMB,
which includes only non-synonymous variants. As the present study
was limited to cell lines, additional validation of the
bioinformatics pipelines in clinical samples is required.
Acknowledgements
Not applicable.
Funding
The present study was supported by grants from the
Ministero della Salute to N. Normanno (Ricerca Corrente; grant no.
M4/10) and to F. Fenizia (Ricerca Finalizzata; grant no.
GR-2018-12366829).
Availability of data and materials
The datasets used and/or analyzed during the current
study are available from the corresponding author on reasonable
request.
Authors' contributions
NN designed the study. FF, RP and CR performed the
experiments. FF, RP, REA and CR validated the results of the study.
FF, RP, REA, FB, ML and CR performed formal analysis. FB, FF and RP
collected and organized the data. FF and RC prepared the original
draft. NN reviewed and edited the manuscript. CA, RC and FH
verified the data and supported data analysis. NN supervised the
study. NN and FF acquired the funding. All authors read and
approved the final manuscript. FF and RP confirmed the authenticity
of all the raw data.
Ethics approval and consent to
participate
Not applicable.
Patient consent for publication
Not applicable.
Competing interests
NN has received speaker's fee and is on the advisory
boards of the following companies: Astra-Zeneca, Bayer, Illumina,
Incyte, MSD, Merck KgA, J&J, Qiagen, Roche, Thermo Fisher
Scientific, Inc. CA, FH and RC are Thermo Fisher Scientific, Inc.
employees. Thermo Fisher Scientific, Inc. is the supplier of the
Oncomine Tumor Mutation Load assay used within the study. The other
authors declare no competing interests.
References
|
1
|
Robert C, Long GV, Brady B, Dutriaux C,
Maio M, Mortier L, Hassel JC, Rutkowski P, McNeil C,
Kalinka-Warzocha E, et al: Nivolumab in previously untreated
melanoma without BRAF mutation. N Engl J Med. 372:320–330. 2015.
View Article : Google Scholar : PubMed/NCBI
|
|
2
|
Garon EB, Rizvi NA, Hui R, Leighl N,
Balmanoukian AS, Eder JP, Patnaik A, Aggarwal C, Gubens M, Horn L,
et al KEYNOTE-001 investigators, : Pembrolizumab for the treatment
of non-small-cell lung cancer. N Engl J Med. 372:2018–2028. 2015.
View Article : Google Scholar : PubMed/NCBI
|
|
3
|
Brahmer J, Reckamp KL, Baas P, Crinò L,
Eberhardt WE, Poddubskaya E, Antonia S, Pluzanski A, Vokes EE,
Holgado E, et al: Nivolumab versus docetaxel in advanced
squamous-cell non-small-cell lung cancer. N Engl J Med.
373:123–135. 2015. View Article : Google Scholar : PubMed/NCBI
|
|
4
|
Patel SP and Kurzrock R: Pd-l1 expression
as a predictive biomarker in cancer immunotherapy. Mol Cancer Ther.
14:847–856. 2015. View Article : Google Scholar : PubMed/NCBI
|
|
5
|
Reck M, Rodríguez-Abreu D, Robinson AG,
Hui R, Csőszi T, Fülöp A, Gottfried M, Peled N, Tafreshi A, Cuffe
S, et al KEYNOTE-024 Investigators, : Pembrolizumab versus
chemotherapy for pd-l1-positive non-small-cell lung cancer. N Engl
J Med. 375:1823–1833. 2016. View Article : Google Scholar : PubMed/NCBI
|
|
6
|
Le DT, Uram JN, Wang H, Bartlett BR,
Kemberling H, Eyring AD, Skora AD, Luber BS, Azad NS, Laheru D, et
al: Pd-1 blockade in tumors with mismatch-repair deficiency. N Engl
J Med. 372:2509–2520. 2015. View Article : Google Scholar : PubMed/NCBI
|
|
7
|
Snyder A, Makarov V, Merghoub T, Yuan J,
Zaretsky JM, Desrichard A, Walsh LA, Postow MA, Wong P, Ho TS, et
al: Genetic basis for clinical response to CTLA-4 blockade in
melanoma. N Engl J Med. 371:2189–2199. 2014. View Article : Google Scholar : PubMed/NCBI
|
|
8
|
Carbone DP, Reck M, Paz-Ares L, Creelan B,
Horn L, Steins M, Felip E, van den Heuvel MM, Ciuleanu TE, Badin F,
et al CheckMate 026 investigators, : First-line nivolumab in stage
iv or recurrent non-small-cell lung cancer. N Engl J Med.
376:2415–2426. 2017. View Article : Google Scholar : PubMed/NCBI
|
|
9
|
Van Allen EM, Miao D, Schilling B, Shukla
SA, Blank C, Zimmer L, Sucker A, Hillen U, Foppen MHG, Goldinger
SM, et al: Genomic correlates of response to CTLA-4 blockade in
metastatic melanoma. Science. 350:207–211. 2015. View Article : Google Scholar : PubMed/NCBI
|
|
10
|
Rizvi NA, Hellmann MD, Snyder A, Kvistborg
P, Makarov V, Havel JJ, Lee W, Yuan J, Wong P, Ho TS, et al: Cancer
immunology. Mutational landscape determines sensitivity to PD-1
blockade in non-small cell lung cancer. Science. 348:124–128. 2015.
View Article : Google Scholar : PubMed/NCBI
|
|
11
|
Rizvi H, Sanchez-Vega F, La K, Chatila W,
Jonsson P, Halpenny D, Plodkowski A, Long N, Sauter JL, Rekhtman N,
et al: Molecular determinants of response to anti-programmed cell
death (pd)-1 and anti-programmed death-ligand 1 (pd-l1) blockade in
patients with non-small-cell lung cancer profiled with targeted
next-generation sequencing. J Clin Oncol. 36:633–641. 2018.
View Article : Google Scholar : PubMed/NCBI
|
|
12
|
Samstein RM, Lee CH, Shoushtari AN,
Hellmann MD, Shen R, Janjigian YY, Barron DA, Zehir A, Jordan EJ,
Omuro A, et al: Tumor mutational load predicts survival after
immunotherapy across multiple cancer types. Nat Genet. 51:202–206.
2019. View Article : Google Scholar : PubMed/NCBI
|
|
13
|
Hellmann MD, Ciuleanu TE, Pluzanski A, Lee
JS, Otterson GA, Audigier-Valette C, Minenza E, Linardou H, Burgers
S, Salman P, et al: Nivolumab plus ipilimumab in lung cancer with a
high tumor mutational burden. N Engl J Med. 378:2093–2104. 2018.
View Article : Google Scholar : PubMed/NCBI
|
|
14
|
Yarchoan M, Hopkins A and Jaffee EM: Tumor
mutational burden and response rate to pd-1 inhibition. N Engl J
Med. 377:2500–2501. 2017. View Article : Google Scholar : PubMed/NCBI
|
|
15
|
Rosenberg JE, Hoffman-Censits J, Powles T,
van der Heijden MS, Balar AV, Necchi A, Dawson N, O'Donnell PH,
Balmanoukian A, Loriot Y, et al: Atezolizumab in patients with
locally advanced and metastatic urothelial carcinoma who have
progressed following treatment with platinum-based chemotherapy: A
single-arm, multicentre, phase 2 trial. Lancet. 387:1909–1920.
2016. View Article : Google Scholar : PubMed/NCBI
|
|
16
|
Brown SD, Warren RL, Gibb EA, Martin SD,
Spinelli JJ, Nelson BH and Holt RA: Neo-antigens predicted by tumor
genome meta-analysis correlate with increased patient survival.
Genome Res. 24:743–750. 2014. View Article : Google Scholar : PubMed/NCBI
|
|
17
|
Schumacher TN and Schreiber RD:
Neoantigens in cancer immunotherapy. Science. 348:69–74. 2015.
View Article : Google Scholar : PubMed/NCBI
|
|
18
|
Anagnostou V, Smith KN, Forde PM, Niknafs
N, Bhattacharya R, White J, Zhang T, Adleff V, Phallen J, Wali N,
et al: Evolution of neoantigen landscape during immune checkpoint
blockade in non-small cell lung cancer. Cancer Discov. 7:264–276.
2017. View Article : Google Scholar : PubMed/NCBI
|
|
19
|
Büttner R, Longshore JW, López-Ríos F,
Merkelbach-Bruse S, Normanno N, Rouleau E and Penault-Llorca F:
Implementing TMB measurement in clinical practice: Considerations
on assay requirements. ESMO Open. 4:e0004422019. View Article : Google Scholar
|
|
20
|
Alexandrov LB, Nik-Zainal S, Wedge DC,
Aparicio SA, Behjati S, Biankin AV, Bignell GR, Bolli N, Borg A,
Børresen-Dale AL, et al Australian Pancreatic Cancer Genome
Initiative; ICGC Breast Cancer Consortium; ICGC MMML-Seq
Consortium; ICGC PedBrain, : Signatures of mutational processes in
human cancer. Nature. 500:415–421. 2013. View Article : Google Scholar : PubMed/NCBI
|
|
21
|
Lawrence MS, Stojanov P, Polak P, Kryukov
GV, Cibulskis K, Sivachenko A, Carter SL, Stewart C, Mermel CH,
Roberts SA, et al: Mutational heterogeneity in cancer and the
search for new cancer-associated genes. Nature. 499:214–218. 2013.
View Article : Google Scholar : PubMed/NCBI
|
|
22
|
Vogelstein B, Papadopoulos N, Velculescu
VE, Zhou S, Diaz LA Jr and Kinzler KW: Cancer genome landscapes.
Science. 339:1546–1558. 2013. View Article : Google Scholar : PubMed/NCBI
|
|
23
|
Ready N, Hellmann MD, Awad MM, Otterson
GA, Gutierrez M, Gainor JF, Borghaei H, Jolivet J, Horn L, Mates M,
et al: First-line nivolumab plus ipilimumab in advanced
non-small-cell lung cancer (checkmate 568): Outcomes by programmed
death ligand 1 and tumor mutational burden as biomarkers. J Clin
Oncol. 37:992–1000. 2019. View Article : Google Scholar : PubMed/NCBI
|
|
24
|
Cristescu R, Mogg R, Ayers M, Albright A,
Murphy E, Yearley J, Sher X, Liu XQ, Lu H, Nebozhyn M, et al:
Pan-tumor genomic biomarkers for PD-1 checkpoint blockade-based
immunotherapy. Science. 362:3622018. View Article : Google Scholar : PubMed/NCBI
|
|
25
|
Innocenti F, Ou FS, Qu X, Zemla TJ,
Niedzwiecki D, Tam R, Mahajan S, Goldberg RM, Bertagnolli MM,
Blanke CD, et al: Mutational analysis of patients with colorectal
cancer in calgb/swog 80405 identifies new roles of microsatellite
instability and tumor mutational burden for patient outcome. J Clin
Oncol. 37:1217–1227. 2019. View Article : Google Scholar : PubMed/NCBI
|
|
26
|
Owada-Ozaki Y, Muto S, Takagi H, Inoue T,
Watanabe Y, Fukuhara M, Yamaura T, Okabe N, Matsumura Y, Hasegawa
T, et al: Prognostic impact of tumor mutation burden in patients
with completely resected non-small cell lung cancer: Brief report.
J Thorac Oncol. 13:1217–1221. 2018. View Article : Google Scholar : PubMed/NCBI
|
|
27
|
Chalmers ZR, Connelly CF, Fabrizio D, Gay
L, Ali SM, Ennis R, Schrock A, Campbell B, Shlien A, Chmielecki J,
et al: Analysis of 100,000 human cancer genomes reveals the
landscape of tumor mutational burden. Genome Med. 9:342017.
View Article : Google Scholar : PubMed/NCBI
|
|
28
|
Frampton GM, Fichtenholtz A, Otto GA, Wang
K, Downing SR, He J, Schnall-Levin M, White J, Sanford EM, An P, et
al: Development and validation of a clinical cancer genomic
profiling test based on massively parallel DNA sequencing. Nat
Biotechnol. 31:1023–1031. 2013. View
Article : Google Scholar : PubMed/NCBI
|
|
29
|
Roszik J, Haydu LE, Hess KR, Oba J, Joon
AY, Siroy AE, Karpinets TV, Stingo FC, Baladandayuthapani V,
Tetzlaff MT, et al: Novel algorithmic approach predicts tumor
mutation load and correlates with immunotherapy clinical outcomes
using a defined gene mutation set. BMC Med. 14:1682016. View Article : Google Scholar : PubMed/NCBI
|
|
30
|
Campesato LF, Barroso-Sousa R, Jimenez L,
Correa BR, Sabbaga J, Hoff PM, Reis LF, Galante PA and Camargo AA:
Comprehensive cancer-gene panels can be used to estimate mutational
load and predict clinical benefit to PD-1 blockade in clinical
practice. Oncotarget. 6:34221–34227. 2015. View Article : Google Scholar : PubMed/NCBI
|
|
31
|
Berg KCG, Eide PW, Eilertsen IA,
Johannessen B, Bruun J, Danielsen SA, Bjørnslett M, Meza-Zepeda LA,
Eknaes M, Lind GE, et al: Multi-omics of 34 colorectal cancer cell
lines - a resource for biomedical studies. Mol Cancer. 16:1162017.
View Article : Google Scholar : PubMed/NCBI
|
|
32
|
Catalogue Of Somatic Mutations In Cancer
(COSMI), . Cell Lines Project v92, released 27-AUG-20. Available
from. https://cancer.sanger.ac.uk/cell_linesAugust
28–2019
|
|
33
|
Gupta A, Connelly C, Frampton G,
Chmielecki J, Ali S, Suh J, Schrock A, Ross J, Stephens P and
Miller V: The druggable mutation landscape of lung adenocarcinoma.
J Thorac Oncol. 12:9772017. View Article : Google Scholar
|
|
34
|
Barretina J, Caponigro G, Stransky N,
Venkatesan K, Margolin AA, Kim S, Wilson CJ, Lehár J, Kryukov GV,
Sonkin D, et al: The Cancer Cell Line Encyclopedia enables
predictive modelling of anticancer drug sensitivity. Nature.
483:603–607. 2012. View Article : Google Scholar : PubMed/NCBI
|
|
35
|
Fenizia F, Pasquale R, Roma C, Bergantino
F, Iannaccone A and Normanno N: Measuring tumor mutation burden in
non-small cell lung cancer: Tissue versus liquid biopsy. Transl
Lung Cancer Res. 7:668–677. 2018. View Article : Google Scholar : PubMed/NCBI
|
|
36
|
Chaudhary R, Quagliata L, Martin JP,
Alborelli I, Cyanam D, Mittal V, Tom W, Au-Young J, Sadis S and
Hyland F: A scalable solution for tumor mutational burden from
formalin-fixed, paraffin-embedded samples using the Oncomine Tumor
Mutation Load Assay. Transl Lung Cancer Res. 7:616–630. 2018.
View Article : Google Scholar : PubMed/NCBI
|
|
37
|
Endris V, Buchhalter I, Allgäuer M, Rempel
E, Lier A, Volckmar AL, Kirchner M, von Winterfeld M, Leichsenring
J, Neumann O, et al: Measurement of tumor mutational burden (TMB)
in routine molecular diagnostics: In silico and real-life analysis
of three larger gene panels. Int J Cancer. 144:2303–2312.
2019.PubMed/NCBI
|
|
38
|
Turajlic S, Litchfield K, Xu H, Rosenthal
R, McGranahan N, Reading JL, Wong YNS, Rowan A, Kanu N, Al Bakir M,
et al: Insertion-and-deletion-derived tumour-specific neoantigens
and the immunogenic phenotype: A pan-cancer analysis. Lancet Oncol.
18:1009–1021. 2017. View Article : Google Scholar : PubMed/NCBI
|
|
39
|
Mandal R, Samstein RM, Lee KW, Havel JJ,
Wang H, Krishna C, Sabio EY, Makarov V, Kuo F, Blecua P, et al:
Genetic diversity of tumors with mismatch repair deficiency
influences anti-PD-1 immunotherapy response. Science. 364:485–491.
2019. View Article : Google Scholar : PubMed/NCBI
|
|
40
|
Chae YK, Viveiros P, Lopes G, Sukhadia B,
Sheikh MM, Saravia D, Florou V, Sokol ES, Frampton GM, Chalmers ZR,
et al: Clinical and immunological implications of frameshift
mutations in lung cancer. J Thorac Oncol. 14:1807–1817. 2019.
View Article : Google Scholar : PubMed/NCBI
|