Introduction
Nasopharyngeal carcinoma (NPC) is a malignant tumor
of the nasopharynx, which is commonly observed in Southeast Asia
and Southern China (1,2). NPC is radiosensitive; thus radiotherapy
is one of the primary methods of treatment (3). NPC arises from the epithelium of the
nasopharyngeal mucosa (4,5). Patients with early-stage NPC that are
treated with intensity-modulated radiotherapy have a 5-year overall
survival rate >90% (6). However,
patients with locally advanced NPC have a poor prognosis, with a
5-year overall survival rate of 40–70%, due to a high incidence of
metastases to distant organs and the development of a
radioresistant tumor (7,8). Thus, it is important to understand the
mechanism by which NPC rapidly progresses to improve the survival
of patients with NPC.
Tenascin-C (TNC) is a large extracellular matrix
(ECM) glycoprotein composed of a six-armed quaternary and
multi-module structure (9). TNC
contributes to several functions, such as cell adhesion, tissue
remodeling, and tumor cell migration and invasion owing to the
presence of alternatively spliced isoforms and the various domains
present (10). In adults, its
expression is physiologically low, and abnormally high TNC
expression is associated with several diseases, including
atherosclerosis, thrombosis, heart failure and cancer (11,12). TNC
has been widely reported in the tumor stroma of most epithelial
malignancies with increased deposition, including ovary, stomach,
colon, mouth and larynx cancer (10,13). In
addition, TNC plays a key role in tumor progression in several
types of cancer, including breast cancer, glioma, colorectal cancer
and glioblastoma (14–17). Several studies have demonstrated that
TNC promotes epithelial-to-mesenchymal transition (EMT),
facilitates cell adhesion and accelerates cell invasion in tumors
(16,18–20). To
the best of our knowledge, the role of TNC in NPC has not yet been
determined; however, it is hypothesized that TNC may be involved in
NPC progression, which was investigated in the present study.
The weighted gene co-expression network analysis
(WGCNA) method was established by Langfelder and Horvath in 2008
(21), and it has proved to be a
useful method to characterize the patterns of gene association in
microarray data and to determine modules or co-expression networks
based on related genes (22). Thus,
WGCNA was performed in the present study to identify significant
module highly synergistic with TNC expression in NPC.
The present study aimed to investigate TNC
expression in NPC samples and its association with malignant
progression of NPC via immunohistochemistry (IHC) analysis. Gene
expression in Gene Expression Omnibus (GEO) datasets was analyzed
via WGCNA to identify TNC co-expressed genes in NPC. TNC knockdown
NPC cells were constructed and the effect of TNC on the biological
functions of NPC cells was investigated both in vitro and
in vivo. Furthermore, the potential molecular mechanism of
TNC in NPC was predicted via gene enrichment analysis and verified
via western blotting.
Materials and methods
TNC expression in NPC tissues
The raw data of TNC expression in NPC tissues and
normal nasopharyngeal tissues were downloaded from the GEO database
(ncbi.nlm.nih.gov/geo), including two
datasets, GSE53819 (23) and
GSE13597 (24). In addition, the
GSE103611 dataset (25) was
downloaded from the GEO database, which included data of gene
expression between 24 NPC non-metastatic tissues and 24 NPC
metastatic tissues. An NPC tissue microarray (TMA) was purchased
from Guilin Fanpu Biotech (http://www.fanpu.com/aboutus/aboutus.htm). There were
150 patients in the TMA, including 115 NPC cases and 35
nasopharyngitis (NPG) cases. The inclusion and exclusion criteria
were as follows: i) None of the patients had received antitumor
therapy prior to biopsy; ii) the pathological data of patients with
NPC were complete. Among the patients with NPC, there were 78 men
and 37 women. The median age of patients with NPC was 48.3 years
(age range, 24–78 years), and the average age was 49.47±7.32 years.
The present study was approved by the Clinical Research Ethics
Committee of Renmin Hospital of Wuhan University [Wuhan, China;
approval no. 2020(421)] and written informed consent was provided
by all patients prior to the study start.
IHC
TNC expression was detected in patients in the TMA
via IHC analysis. The TMA was dewaxed and hydrated after heating in
a thermostat at 60°C for 20 min. For antigen retrieval, the TMA was
placed in sodium citrate buffer (10 M, pH 6.0) and heated at 95°C
for 10–15 min. Normal goat serum blocking solution (cat. no. C0265;
Beyotime Institute of Biotechnology) was added dropwise to the TMA
at room temperature for 20 min to block the endogenous enzymes and
antibodies in the tissue. The TMA was incubated with anti-TNC at
37°C for 30 min (1:100; cat. no. YT6187; ImmunoWay Biotechnology
Company) to detect TNC expression. A non-immune IgG antibody
(1:500; cat. no. C0265; Beyotime Institute of Biotechnology) was
used as the negative control. Tissues stained with the
fluorescently labeled antibodies were observed under a fluorescent
microscope (magnifications, ×100 and ×400).
The percentage of TNC positive cells was calculated
and scored as follows: 1, 0–9; 2, 10–50 and 3, >50%. The
immunoreactive scores of TNC were scored as follows: 0, negative;
1, weak; 2, moderate and 3, strong. The scores were multiplied and
graded as follows: -, 0; +, 1–3; ++, 4–6 and +++, 7–9. Tissues
graded as ‘−’ and ‘+’ were considered as the low expression TNC
group, while ‘++’ and ‘+++’ were considered as the high TNC
expression group (26).
Construction of WGCNA
The WGCNA R package 1.69 (Bioconductor) was used to
construct the WGCNA on the GSE53819 dataset, which consisted of 18
patients with NPC and 18 healthy individuals (21). Genes with an expression >0.1 were
screened in GSE53819 and used for the construction. Samples were
clustered using hierarchical clustering by the average method to
detect outliers before an appropriate soft threshold power was
selected to finish standard scale-free networks. Subsequently, gene
dendrogram and module identification were performed through the
construction of adjacency and topological overlap matrix (TOM).
Highly similar modules were merged by implementing the clustering
of modular eigengenes, and the association between each module
eigengene and TNC was calculated. The internal connectivity and
module membership of each gene in the module that was most highly
associated with TNC was used to screen for hub genes meeting the
following criteria: Gene and specified module significance >0.2,
modular membership value >0.8 and q<0.01.
Biological function and pathway
enrichment analyses
Gene Ontology (GO) and Kyoto Encyclopedia of Genes
and Genomes (KEGG) pathway enrichment analyses (https://www.genome.jp/kegg) of hub genes were
performed using the Molecular Signatures Database (gsea-msigdb.org/gsea/msigdb/annotate.jsp)
(27). In addition, gene set
enrichment analysis (GSEA) for the differentially expressed genes
between the high and low TNC expression groups was performed using
the same database.
Cell culture and lentiviral short
hairpin RNA (shRNA) transfection
The human NPC cell lines, 5–8F and 6-10B, were
purchased from the Laboratory of Molecular Tumor Pathology,
Southern Medical University (Guanagzhou). Cells were maintained in
DMEM (Thermo Fisher Scientific, Inc.) supplemented with 10% fetal
bovine serum (FBS, Gibco; Thermo Fisher Scientific, Inc.), at 37°C
with 5% CO2.
Lentivirus transduction particles (Shanghai GeneChem
Co., Ltd.) containing small interfering RNA (siRNA) targeting TNC
and negative control siRNA were transduced into 5-8F and 6-10B
cells. A total of 5×10⁴ cells/ml cell suspension with
complete medium (90% RPMI1640 media + 10% Gibco Fetal Bovine Serum)
was prepared and 2 ml cell suspension/well was inoculated into
6-well plates. Cells were incubated at 37°C for 16–24 h until they
reached 20–30% confluence. During transduction, 1 ml of medium was
discarded, and 40 µl of HiTransG infection solution (Shanghai
GeneChem Co., Ltd.) and 40 µl of lentivirus solution (The MOI was
20 according to the pre-infection experiment and the virus titer
was 1×10⁸ TU/ml) were added, and cells were cultured at
37°C. After 16 h, the medium was replaced with fresh medium.
Transduction efficiency was observed via light and fluorescence
microscopy (magnification, ×100 times) after 72 h. The successfully
transduced cells had red fluorescence as there were GFP labels in
the lentivirus particles. The stable cells were screened using
puromycin (2 µg/ml) (Zhejiang Genom Co., Ltd.) for 14 days.
Cell proliferation assay
Cell proliferation was assessed via the Cell
Counting Kit-8 (CCK-8) assay (Dojindo Molecular Technologies, Inc.)
and the EdU cell proliferation assay (cat. no. C10310-1; Guangzhou
RiboBio Co., Ltd.).
For the CCK-8 assay, 5-8F and 6-10B cells were
seeded into 96-well plates at a density of 4×10³
cells/well. Cell proliferation was assessed after 0, 24, 48 and 72
h. A total of 100 µl reagent, containing 10 µl CCK-8 solution and
90 µl serum-free media, was added to each well and the plates were
incubated for 1 h. The absorbance values were measured at a
wavelength of 450 nm, using a microplate reader (PerkinElmer,
Inc.), and the proliferation curve was plotted.
For the EdU cell proliferation assay, 5-8F and 6-10B
cells were seeded into 6-well plates at a density of
1×10⁵ cells/well and cultured until they reached 80-90%
confluence. Cells were subsequently labeled using Cell-Light™ EdU
Apollo® 567 (Guangzhou RiboBio Co., Ltd.), according to
the manufacturer's protocol, and observed under an automatic
fluorescence microscope (magnification, ×100).
Wound healing assay
For the wound healing assay, 5–8F and 6-10 B cells
were seeded into 6-well plates. When the cells confluence reached
80–90%, the cell monolayers were scratched using a 100 ul sterile
pipette tip, washed twice with PBS and incubated with FBS-free
medium for 24 h at 37°C. Cells were observed in five randomly
selected fields using an optical microscope (magnification, ×100).
The distance between the two cell edges was measured and compared
with the original distance of the gap using ImageJ 1.8.0 software
(National Institutes of Health), and this was considered the wound
healing rate.
Migration and invasion assays
50,000 5-8F or 6–10 B cells in 200 µl FBS-free media
were plated in the upper chambers of Transwell plates (Corning,
Inc.), which were pre-coated with Matrigel for the invasion assay
for 2 h at 37°C (10 mg/ml), but not the migration assay. A total of
600 µl supplemented media was added to the lower chambers.
Following incubation for 24 h at 37°C, the migratory and invasive
cells were stained with 0.1% purple crystal for 60 min at room
temperature and counted in five randomly selected fields using a
light microscope (magnification, ×200 times).
Reverse transcription-quantitative
(RT-q)PCR
Total RNA was extracted using TRIzol®
reagent (Invitrogen; Thermo Fisher Scientific, Inc.) from 5-8F or
6–10 B cells and reverse transcribed (RT) into cDNA using the Super
RT Reverse Transcriptase reagent kit (CoWin Biosciences). In RT
process, reaction system including RNA was incubated at 42°C for 60
min to synthesize cDNA, then incubated at 80°C for 10 min to
inactivate the reverse transcriptase and terminate the RT reaction.
qPCR was subsequently performed using SYBR® Green
MasterMix (Thermo Fisher Scientific, Inc.) on a 7500 Fast Real-Time
PCR system (Applied Biosystems; Thermo Fisher Scientific, Inc.),
according to the manufacturer's instructions. The thermocycling
conditions for qPCR were as follows: Thermal denaturation for 3–5
min at 95°C; amplification program for 30 sec at 95°C, 60°C for 30
sec, cycle number was 40; final extension at 72°C for 5–10 min;
after all PCR reactions are completed, the temperature was
maintained at 4–12°C. The following primer sequences were used for
qPCR: TNC forward, 5′-ACTGACTCAGAAGCCTTGG-3′ and reverse,
3′-ATTTCTGGCACTTTCTCGC-5′; cadherin 1 (CDH1) forward,
5′-AGCACCTTCCATGACAGACCC-3′ and reverse,
5′-AGAACGCATTGCCACATACAC-3′; CDH2 forward,
5′-CATCATCATCCTGCTTATCCTTGT-3′ and reverse,
5′-GGTCTTCTTCTCCTCCACCTTCTT-3′; vimentin (VIM) forward,
5′-ATCGTGATGCTGAGAAGTTTCG-3′ and reverse,
5′-TCTGGATTCACTCCCTCTGGTT-3′; snail family transcriptional
repressor 2 forward, 5′-TTTTGCACTGGTATTTCTTTACATC-3′ and reverse,
5′-CCCTGGTTGCTTCAAGGACAC-3′; and GAPDH forward,
5′-TGACTTCAACAGCGACACCCA-3′ and reverse,
5′-CACCCTGTTGCTGTAGCCAAA-3′. Relative expression levels were
calculated using the 2−ΔΔCq method (28) and normalized to the internal
reference gene GAPDH.
Western blotting
5-8F and 6–10 B cells were collected and lysed using
RIPA lysis buffer (Thermo Fisher Scientific, Inc.) containing
protease and phosphatase inhibitors (Roche Applied Science). The
supernatants were collected via centrifugation at 14,000 × g for 20
min at 4°C. Total protein was quantified using the BCA protein
assay kit. Proteins were resolved using 10% SDS-PAGE, transferred
onto PVDF membranes (mass of protein loaded was 20 ug/lane) and
blocked with 5% skimmed milk for 1 h at room temperature. The
membranes were incubated with primary antibodies (all dilutions
1:1,000) against TNC (cat. no. YT6187; ImmunoWay Biotechnology
Company), E-cadherin (cat. no. 14472; Cell Signaling Technology,
Inc.), N-cadherin (cat. no. 13116; Cell Signaling Technology,
Inc.), VIM (cat. no. 5741; Cell Signaling Technology, Inc.), Slug
(cat. no. 9585; Cell Signaling Technology, Inc.), protein kinase B
(Akt; cat. no. 4691; Cell Signaling Technology, Inc.),
phospho-(p)-Akt (cat. no. 4060; Cell Signaling Technology, Inc.),
70 kDa ribosomal protein S6 kinase 1 (P70S6K, cat. no. 2708; Cell
Signaling Technology, Inc.), p-P70S6K (cat. no. 9204; Cell
Signaling Technology, Inc.) and β-actin (cat. no. 4970; Cell
Signaling Technology, Inc.) overnight at 4°C. Following the primary
incubation, membranes were incubated with secondary antibodies
(dilution 1:20,000; cat. no. 926-32211; LI-COR Biosciences) for 1 h
at room temperature. The membranes were scanned using an Odyssey
infrared imaging system (LI-COR Biosciences), and semi-quantitative
analysis was performed using ImageJ 1.8.0 software (National
Institutes of Health).
Xenograft mouse model of NPC
Male BALB/c nude mice (n=16; 5 weeks old; 16–18 g)
were purchased from Beijing Weitonglihua Laboratory Animal
Technology Co., Ltd (https://www.vitalriver.com). Mice were fed under
specific pathogen-free conditions at constant temperature (20–25°C)
and humidity (40–70%), with ad libitum access to water and
food and a 12 h light/dark cycle. A total of 16 mice were randomly
divided into four groups (shTNC 5-8F, shNC 5-8F, shTNC 6-10B and
shNC 6-10B). Mice were anesthetized using isoflurane (Shenzhen
biomart lifescience Co., Ltd, http://cdmocmo.ribobio.com/en/contact-us) with an
induction concentration of 4-5% and a maintenance concentration of
1–3% after 1 week of acclimatization. The right forelimb of nude
mice was subcutaneously inoculated with TNC knockdown 5–8F cells,
control 5-8F cells, TNC knockdown 6-10B cells and control 6-10B
cells. A total of 3.0×10⁶ cells were injected per mouse,
which was suspended in 200 µl normal saline. Tumor grew on the
fifth day, and the weight, tumor length (L) and width (W) were
measured every other day. The maximum tumor size reached 15 mm 21
days after cell injection. The maximum tumor volume was 0.755
mm3. Mice were sacrificed via cervical dislocation
following anesthesia using 4–5% isoflurane. The tumors were
surgically removed, and tumor volumes were calculated using the
following equation: Tumor volume=0.52×LxW2. All animal
experiments were approved by the Ethics Committee of Animal
Experiments of Renmin Hospital of Wuhan University [Wuhan, China;
approval no. 2020(421)], and performed in compliance with the
laboratory animal management and guidelines.
Statistical analysis
Statistical analysis was performed using GraphPad
Prism version 7.0 (GraphPad Software, Inc.). All experiments were
performed in triplicate and data are presented as the mean ±
standard deviation. A two-tailed unpaired Student's t-test was used
to compare differences between two groups, while one-way ANOVA
followed by Tukey's post hoc test were used to compare difference
between multiple groups. Fisher's exact two-tailed test was used to
analyze TNC protein level difference between NPG and NPC tissues
and its association with clinicopathological characteristics of NPC
tissues. Pearson's correlation analysis was performed to analyze
the correlation between genes. P<0.05 was considered to indicate
a statistically significant difference.
Results
TNC is upregulated in NPC tissues
To assess the transcriptional and expression levels
of TNC in NPC, NPC gene datasets were downloaded from the GEO
database. As presented in Fig. 1A,
TNC transcription levels were significantly higher in the NPC
tissues compared with the normal nasopharyngeal tissues, based on
the GSE53819 (P=0.006) and GSE13597 (P=0.01) gene expression
profiles. Fig. 1B presents TNC
expression in 24 NPC metastasis tissues and 24 NPC non-metastasis
tissues. The results demonstrated that TNC mRNA levels were
significantly higher in NPC metastasis tissues compared with
non-metastasis tissues (P=0.033). The distribution of TNC mRNA
levels in NPC gene chip is presented in Table I. Representative images of TNC
staining in NPC and NPG tissues with classification of ‘−’, ‘+’,
‘++’ and ‘+++’ are presented in Fig.
1C. Tissues graded as ‘−’ was considered as the negative
expression TNC group, while ‘+’, ‘++’ and ‘+++’ were considered as
the positive TNC expression group. The results demonstrated that
87.8% of NPC tissues and 12.9% of NPG tissues positively expressed
TNC (P<0.0001; Table II).
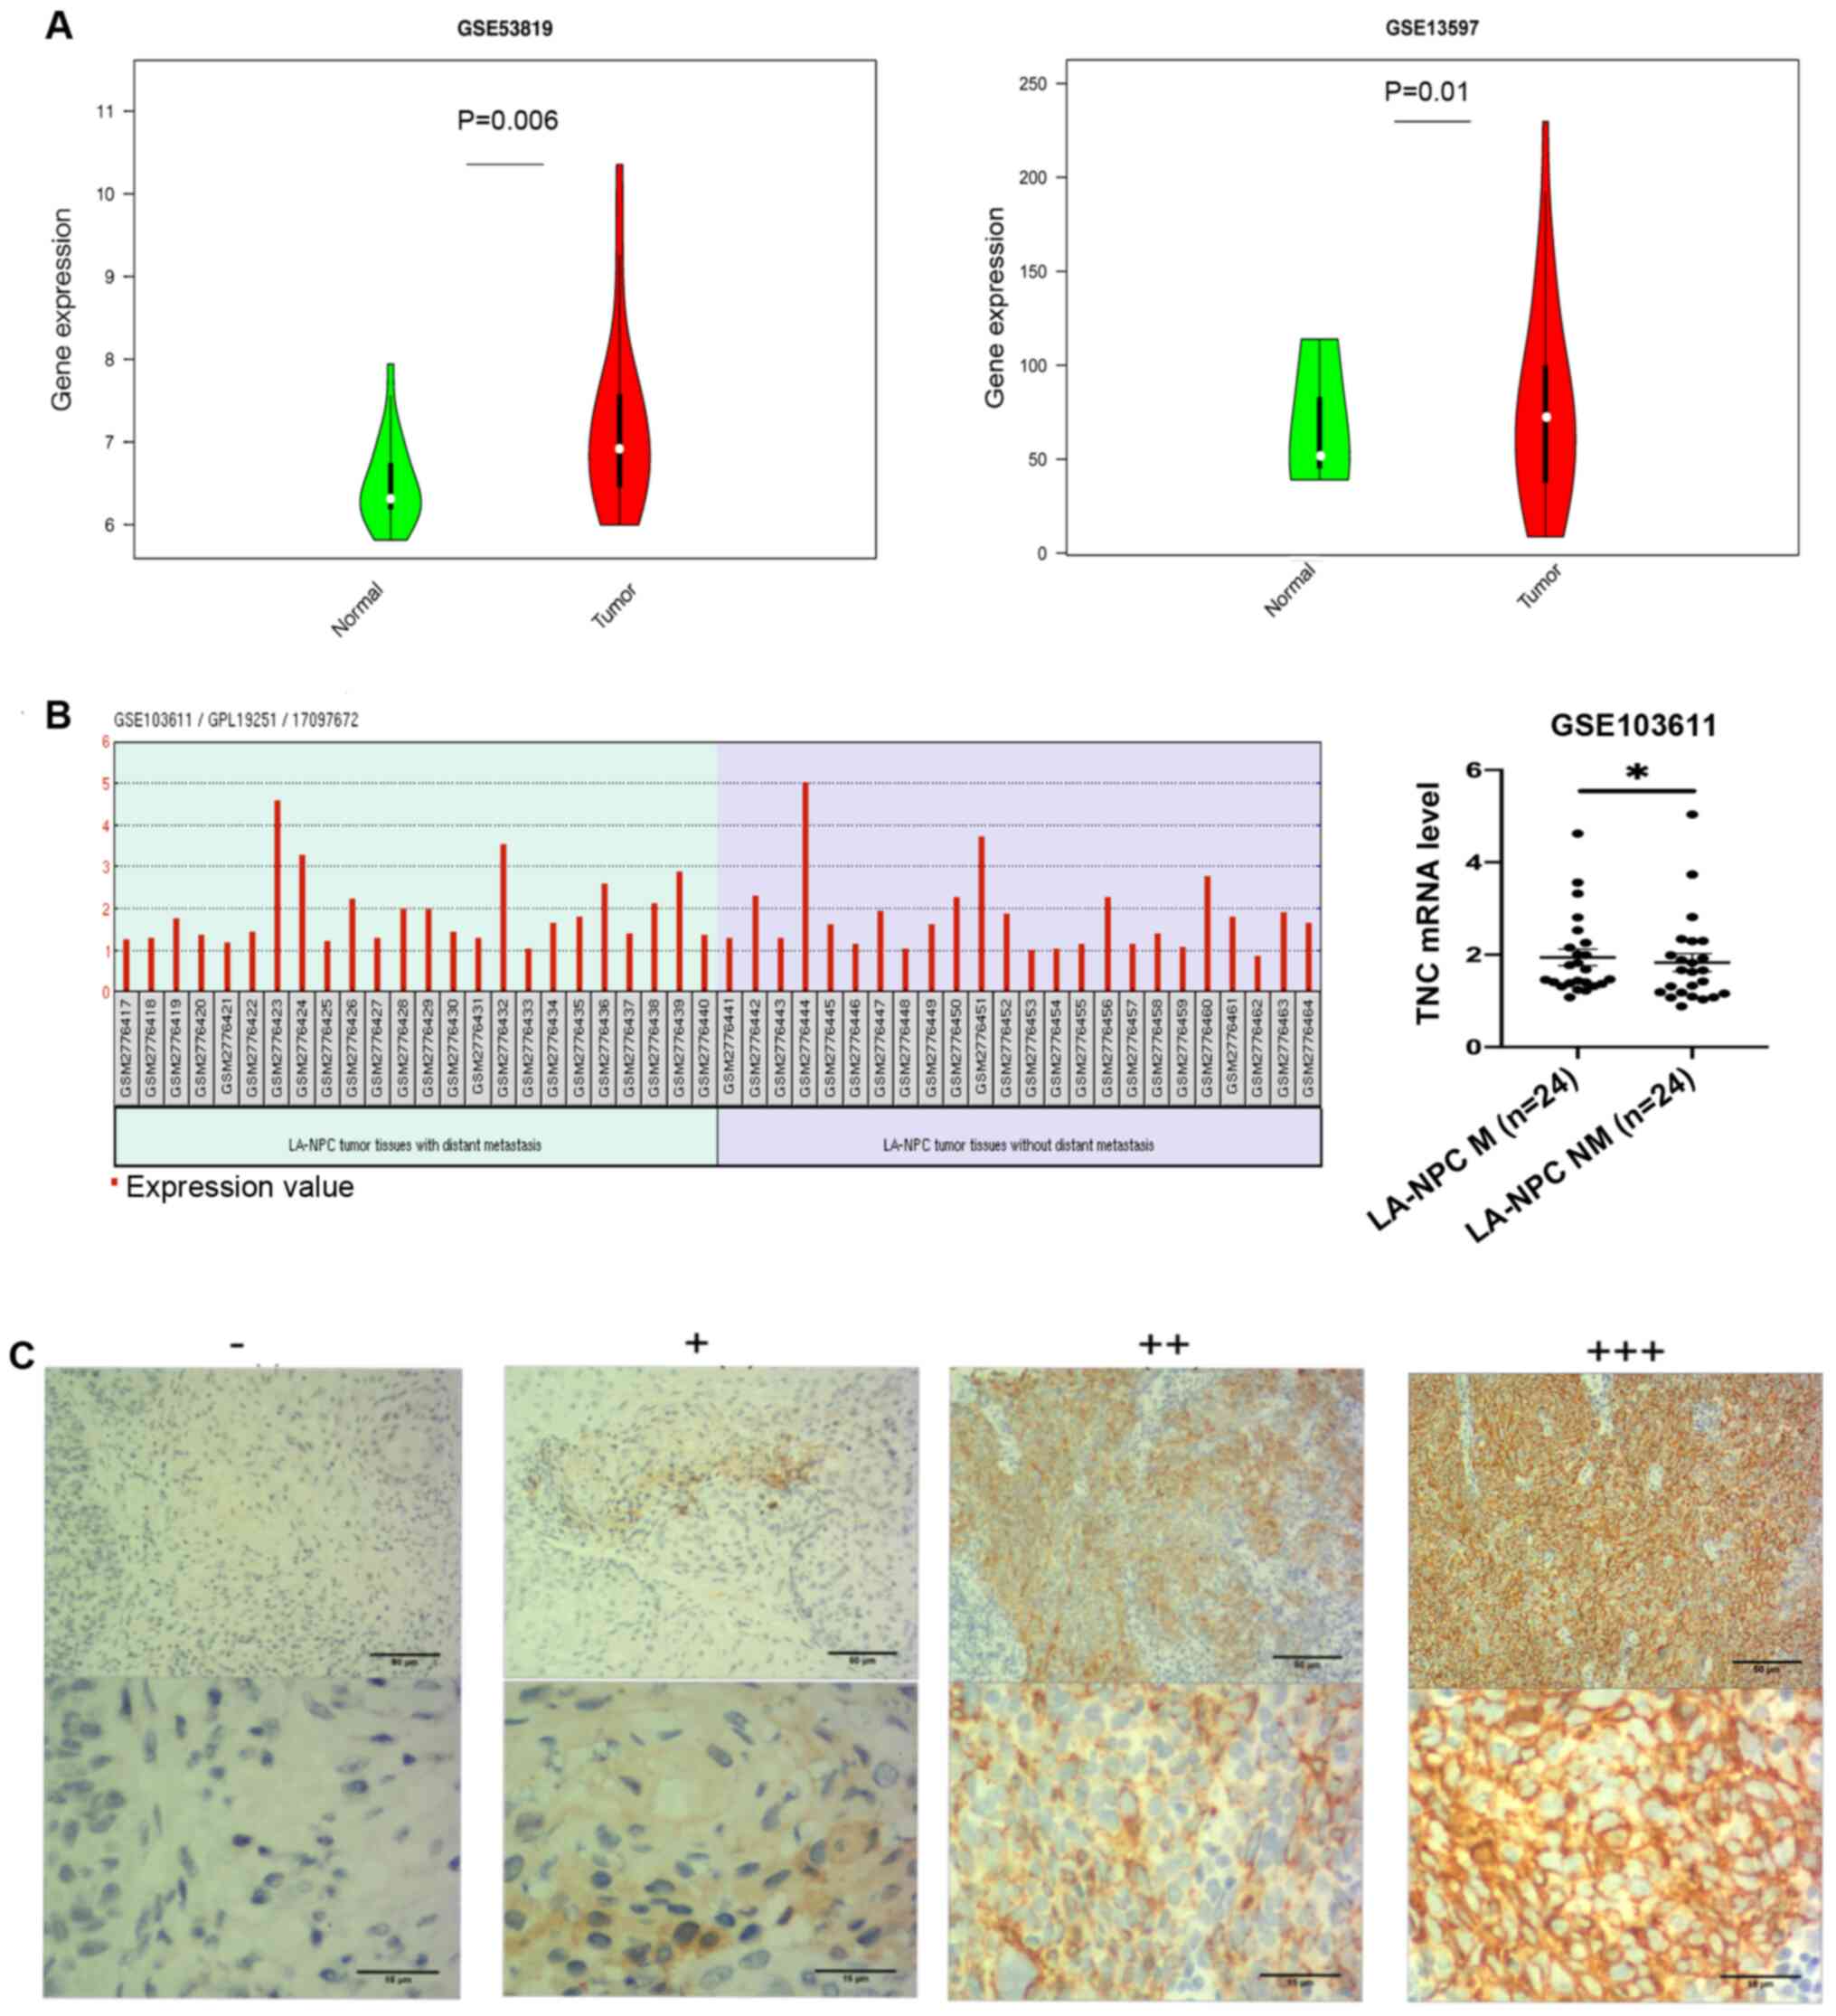 | Figure 1.TNC expression is upregulated in NPC
tissues. (A) Transcription levels of TNC in NPC tissues and normal
nasopharyngeal tissues in the GSE13597 and GSE53819 datasets. (B)
Transcription levels of TNC in tissues of the GSE103611 dataset.
(C) Immunohistochemical staining of TNC in clinical NPC and NPG
tissues. Tissues were classified as −, +, ++ and +++. Brown
staining represents TNC protein expression, while blue staining
represents the nuclei. TNC, tenascin-C; NPC, nasopharyngeal
carcinoma; NPG, nasopharyngitis. LA-NPC, locally advanced
nasopharyngeal carcinoma; ‘−’, negative expression of TNC; ‘+’,
‘++’ and ‘+++’, positive expression of TNC; ‘−’, ‘+’, low
expression of TNC; ‘++’ and ‘+++’, high expression of TNC.
*P<0.05. |
 | Table I.Distribution of TNC mRNA expression
in nasopharyngeal carcinoma gene chip. |
Table I.
Distribution of TNC mRNA expression
in nasopharyngeal carcinoma gene chip.
| Dataset | Number of
samples | TNC mRNA
expression | P-value |
|---|
| GSE53819 |
|
| 0.006b |
| NPC
tissue | 18 | 7.082 |
|
| Normal
tissue | 18 | 6.347 |
|
| GSE13597 |
|
| 0.010b |
| NPC
tissue | 25 | 6.867 |
|
| Normal
tissue | 3 | 5.258 |
|
| GSE103611 |
|
| 0.033a |
| NPC M
tissue | 24 | 1.943 |
|
| NPC NM
tissue | 24 | 1.826 |
|
| Table II.Statistical analysis of TNC
expression in NPC tissues (tissue microarray). |
Table II.
Statistical analysis of TNC
expression in NPC tissues (tissue microarray).
|
| TNC expression
(n) |
|
|
|
|---|
|
|
|
|
|
|
|---|
|
| Negative | Positive | Total |
|
|
|---|
|
|
|
|
|
|
|
|---|
| Group | – | + | ++ | +++ | 150 | Positive rate,
% | P-value |
|---|
| NPG tissue | 31 | 4 | 0 | 0 | 35 | 12.9 | <0.0001 |
| NPC tissue | 14 | 29 | 46 | 26 | 115 | 87.8 |
|
To further investigate the clinicopathological
significance of TNC in NPC, the association between TNC expression
and the clinicopathological characteristics of patients with NPC
was analyzed. As presented in Table
III, TNC protein expression was not significantly associated
with age and sex of patients with NPC (P>0.05). However, TNC
expression was significantly associated with T staging and N
staging. The results demonstrated that patients at T3-T4 stages had
higher TNC protein expression levels than those at T1-T2 stages
(P=0.001). In addition, patients at N2-N3 stages had higher TNC
protein expression levels than those at N0-N1 stages (P<0.0001).
T staging represents the size and scope of invasion of NPC, while N
staging refers to the involvement of regional lymph nodes (29). Taken together, these results suggest
that TNC is associated with the malignant progression of NPC.
| Table III.Association between TNC expression
and the clinicopathological characteristics of patients with
NPC. |
Table III.
Association between TNC expression
and the clinicopathological characteristics of patients with
NPC.
|
| Number of
patients | TNC expression
(n) |
|
|
|---|
|
|
|
|
|
|
|---|
| Characteristic | Total, 115 | Low | High | High expression
rate, % | P-value |
|---|
| Age, years |
|
|
|
| 0.703 |
|
<50 | 51 | 18 | 33 | 64.7 |
|
|
>50 | 64 | 25 | 39 | 60.9 |
|
| Sex |
|
|
|
|
|
|
Male | 78 | 29 | 47 | 60.3 | 0.842 |
|
Female | 37 | 14 | 25 | 67.6 |
|
| T stage |
|
|
|
| 0.001a |
|
T1-T2 | 39 | 23 | 16 | 41.0 |
|
|
T3-T4 | 76 | 20 | 56 | 73.7 |
|
| N stage |
|
|
|
|
<0.0001b |
|
N0-N1 | 52 | 32 | 20 | 38.5 |
|
|
N2-N3 | 63 | 11 | 52 | 82.5 |
|
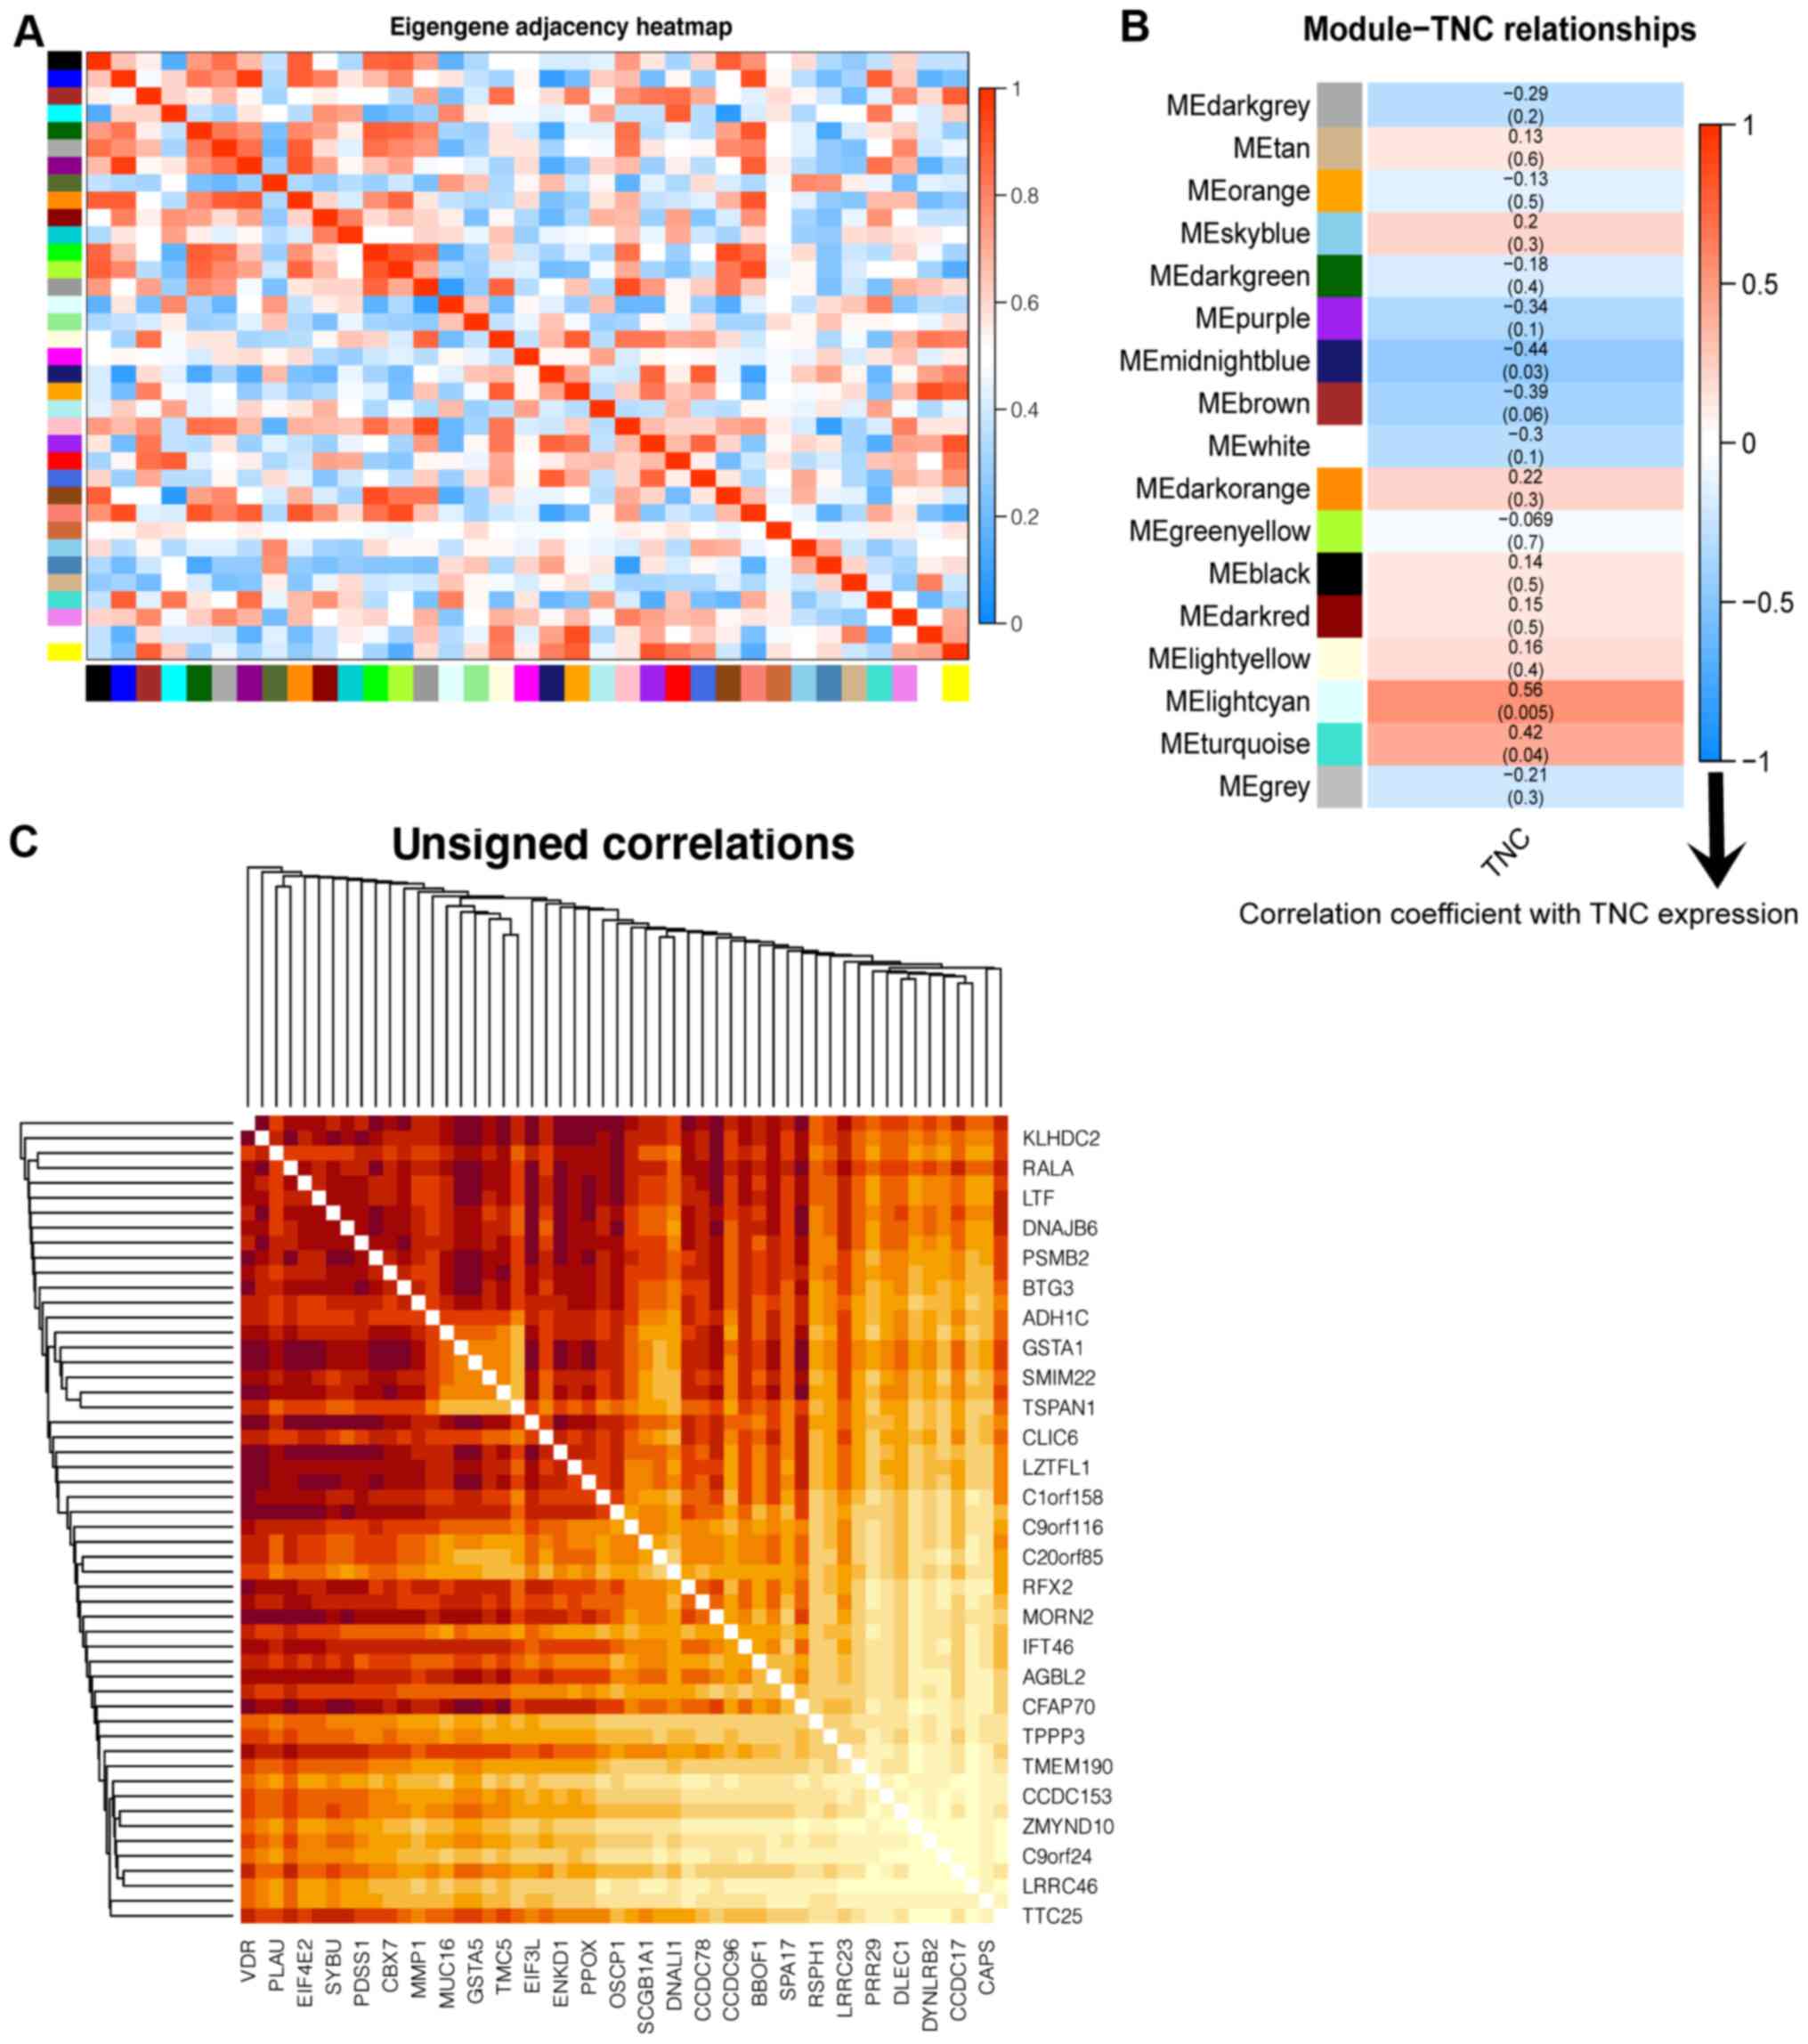
WGCNA and determination of the
co-expression module of TNC
WGCNA is based on two hypotheses: i) Genes with
similar expression patterns may be functionally relates,
co-regulated or in the same pathway and ii) gene networks conform
to a scale-free distribution (22).
Based on these two points, the gene network can be divided into
different modules according to the similarity of expression to find
the key genes (30–32). Gene expression data were analyzed to
remove outliers, and no samples were excluded. A total of 36
samples were included in the WGCNA (Fig. S1). The samples were grouped into
different clusters in the sample dendrogram and the trait heatmap
is presented in Fig. S2A. The scale
R2 value and power value (β) decide the independence and
average connectivity (22). Fig. S2B and C demonstrate that when β=7,
the scale was R2=0.89. Therefore, soft thresholding with
β=7 was used to achieve and analyze recognizable co-expression gene
modules in datasets. As a result, 15 gene co-expression modules
were identified in different colors based on a TOM-based
dissimilarity measure (Fig. S2D).
The interactions of these co-expression modules were analyzed via
Pearson's correlation coefficient, and every module was independent
of each other (Fig. S2E). A higher
degree of module correlation is indicated by a darker background.
The first principal component gene in each module was identified as
the feature vector gene representing the overall gene expression
level (Fig. 2A). Red squares along
the diagonal represent the meta-modules. Module eigengenes were
clustered in the dendrogram (Fig.
S3A). Modules below the red line indicate that the correlation
was >0.8, and these were merged. Fig.
2B presents the association between the module eigengenes and
TNC expression. The light cyan module was closely associated with
TNC expression (r=0.56; P=0.005). Fig.
S3B presents the heatmap of the expression volume of the light
cyan module and the histogram of the feature vector gene. The
expression of the feature vector gene was highly correlated with
the expression of genes in the entire module. The internal
connectivity was calculated, and the module membership of each gene
was used to identify hub genes that were highly correlated with TNC
expression. The internal connectivity measures the position of the
gene in the module, and the module membership indicates which
module the gene belongs to. The intermodular connectivity was
significantly correlated with the module membership (P=0.00001)
(Fig. S4). There were three
criteria to screen for hub genes, including a gene and specified
module significance of >0.2, modular membership value of >0.8
and q<0.01. A total of 52 genes that met the above criteria were
identified. Fig. 2C presents the
overlapping topological heatmap of these hub genes. In the heatmap,
the darker the color, the higher the degree of topological
overlap.
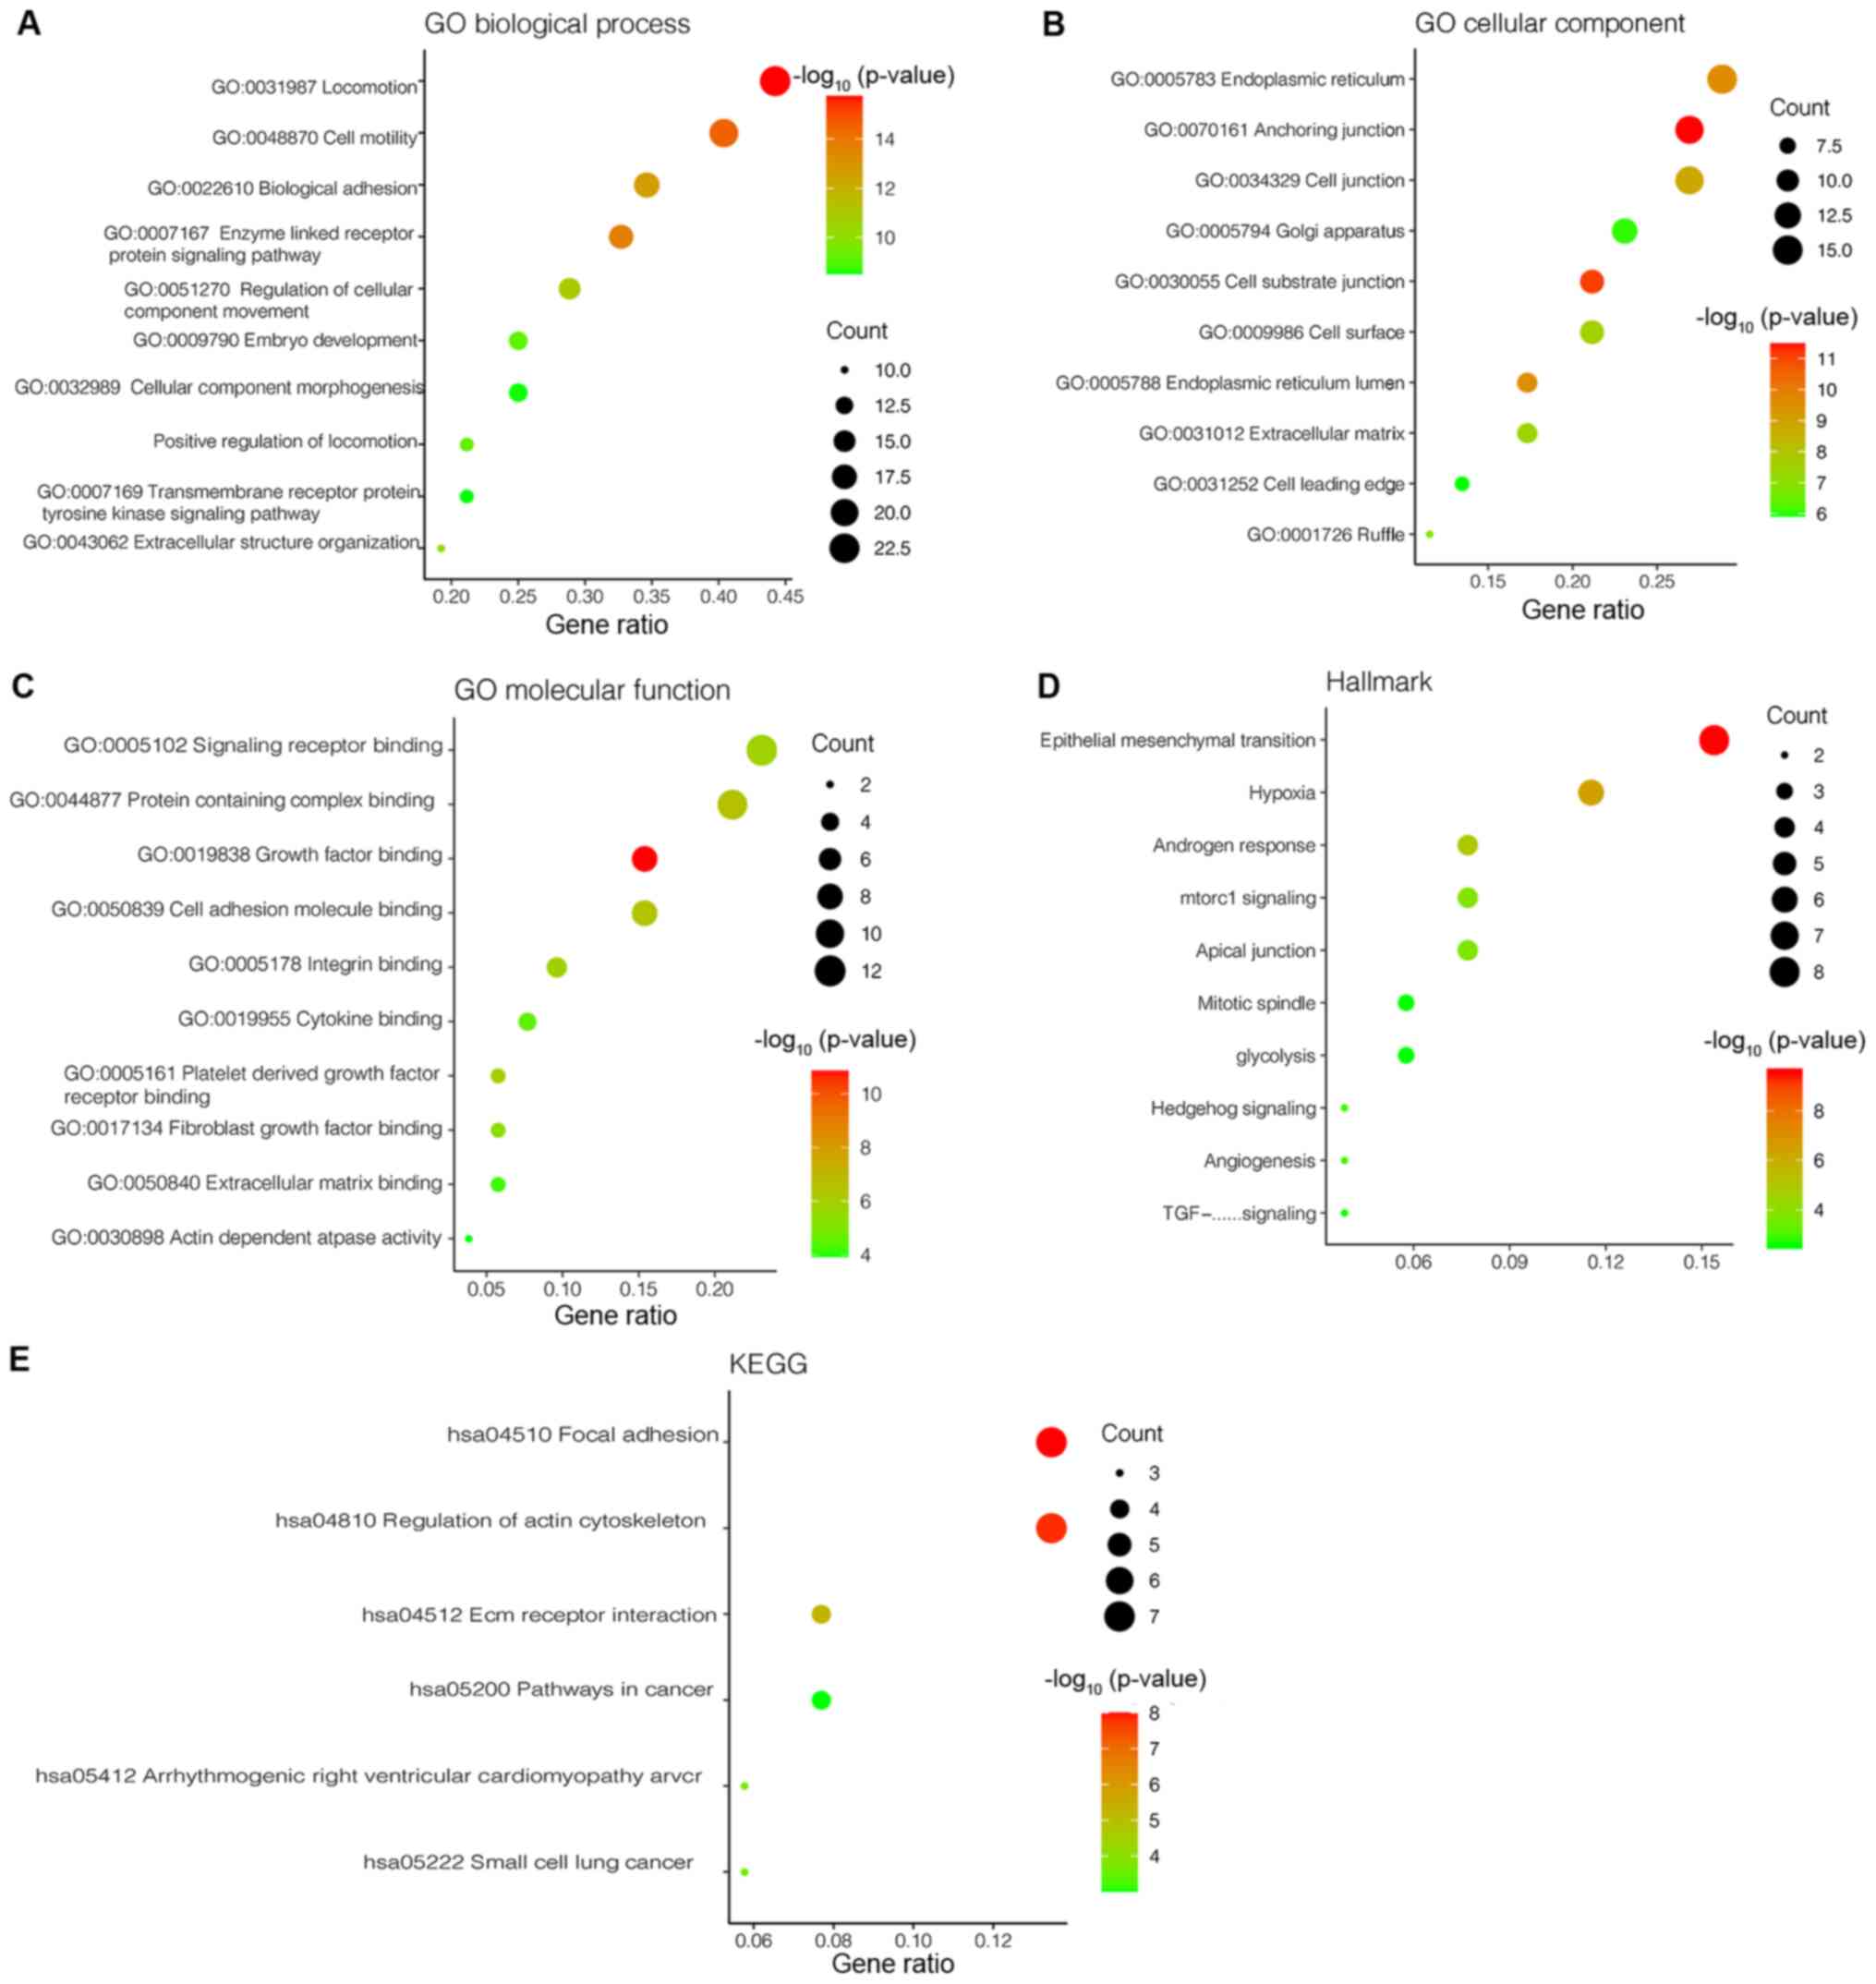
GO and KEGG enrichment analyses for
the hub genes in the light cyan module
To demonstrate the functions of hub genes in the
light cyan module, GO and KEGG enrichment analyses in the Molecular
Signatures Database were performed. The top 10 terms of biological
process (BP), cellular component (CC) and molecular function (MF)
in GO analysis are presented in Fig.
3A-C. Hub genes were primarily enriched in the ‘locomotion’,
‘cell motility’, ‘biological adhesion’, ‘enzyme-linked receptor
protein signaling pathway’, ‘regulation of cellular component
movement’, ‘embryo development’, ‘cellular component
morphogenesis’, ‘positive regulation of locomotion’, ‘transmembrane
receptor protein tyrosine kinase signaling pathway’ and
‘extracellular structure organization’ in BP (Fig. 3A). In CC, the terms that hub genes
were primarily enriched in included ‘endoplasmic reticulum’,
‘anchoring junction’, ‘cell junction’, ‘Golgi apparatus’,
‘cell-substrate junction’, ‘cell surface’, ‘endoplasmic reticulum
lumen’, ‘extracellular matrix’, ‘cell leading edge’ and ‘ruffle’
(Fig. 3B). In MF, hub genes were
primarily enriched in the terms ‘signaling receptor binding’,
‘protein-containing complex binding’, ‘growth factor binding’,
‘cell adhesion molecular binding’, ‘integrin binding’, ‘cytokine
binding’, ‘platelet-derived growth factor receptor binding’,
‘fibroblast growth factor binding’, ‘extracellular matrix binding’
and ‘actin dependent ATPase activity’ (Fig. 3C). The hub genes were enriched in the
KEGG pathway of ‘focal adhesion’, ‘regulation of actin
cytoskeleton’, ‘ECM receptor interaction’, ‘pathways in cancer’,
‘arrhythmogenic right ventricular cardiomyopathy arch’ and ‘small
cell lung cancer’ (Fig. 3E). Also,
the hub genes in the light cyan module were enriched for Hallmark
gene sets using the Molecular Signatures database. There were 31
Hallmark gene sets enriched, and the top 10 are presented in
Fig. 3D, amongst which EMT was the
most enriched.
TNC regulates EMT progression in NPC
cells
Based on the results of WGCNA and the hallmark
enrichment analysis, it is suggested that TNC may activate EMT to
promote NPC malignant progression by altering the components of the
ECM and influencing cell adhesion. Consequently, stable TNC
knockdown in NPC cells was established, which was verified via
western blot and RT-qPCR analyses (Fig.
4A and B). The expression levels of the EMT-related markers,
VIM, CDH2, Slug and CDH1 were detected in the knockdown and control
cells via western blot and RT-qPCR analyses (Fig. 4C and D). The results demonstrated a
negative association between TNC expression and the epithelial
phenotype, and a positive association between TNC expression and
the mesenchymal phenotype. Collectively, these results suggest that
suppression of TNC inhibits EMT progression of NPC cells.
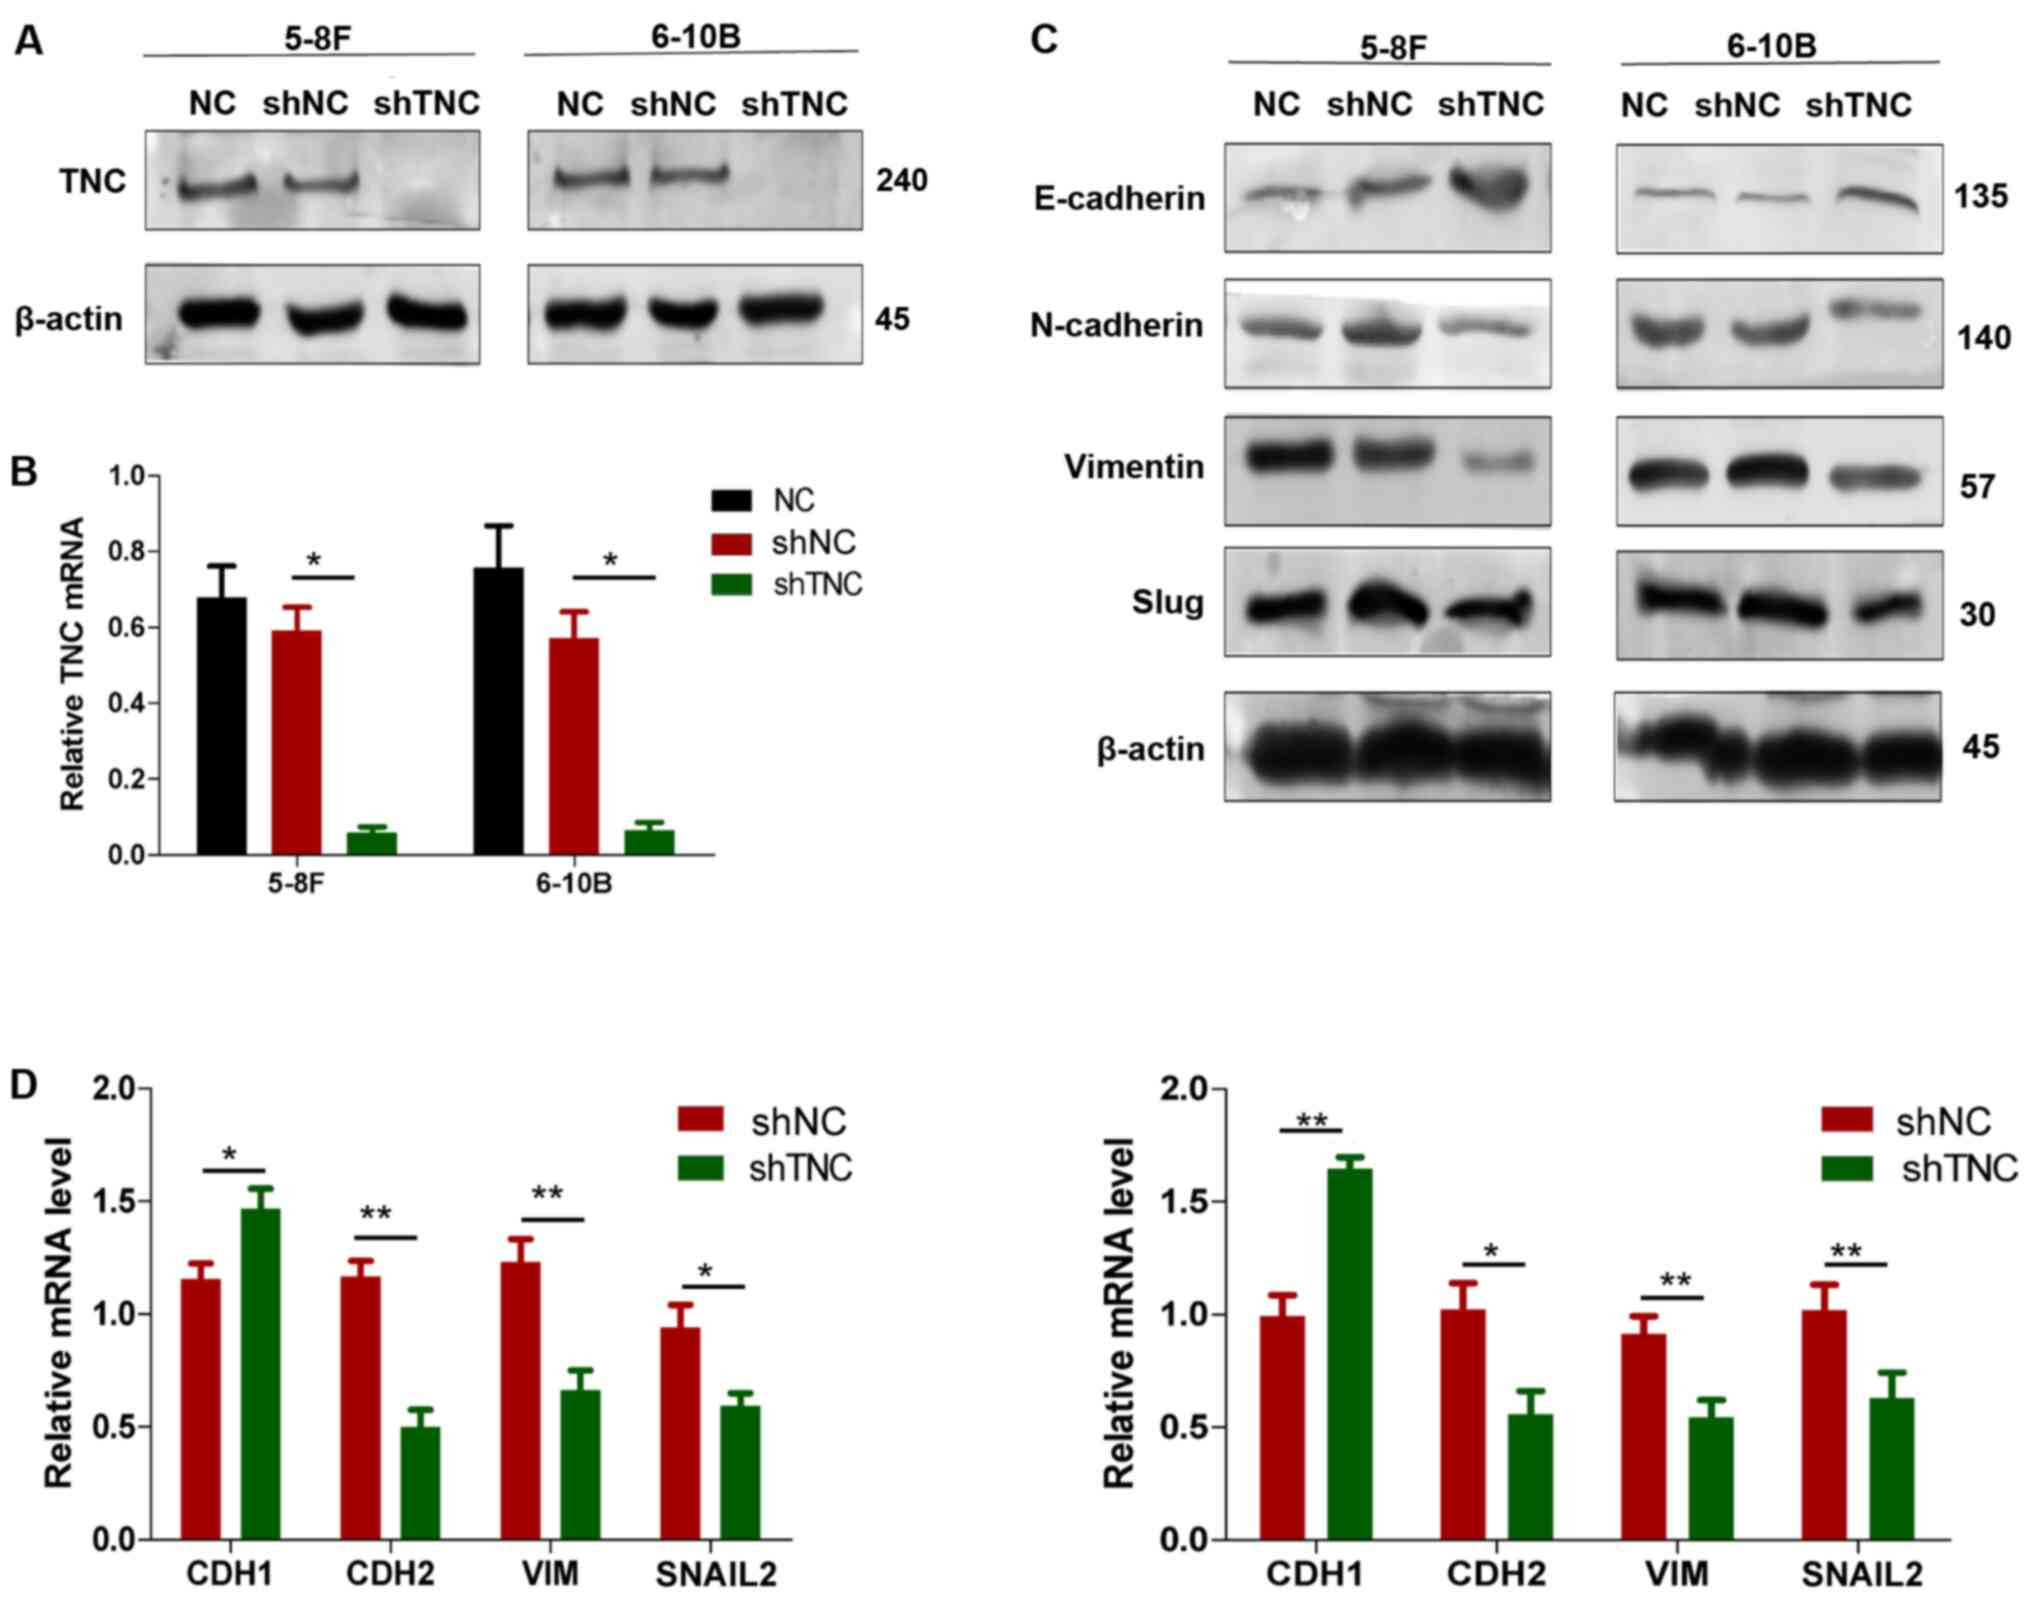 | Figure 4.TNC promotes malignant progression of
NPC by inducing EMT. (A) Western blot and (B) RT-qPCR analyses were
performed to detect the expression levels of TNC in 5-8F and 6-10B
cells following lentiviral transfection. (C) Western blot and (D)
RT-qPCR analyses were performed to detect the expression levels of
the EMT-related markers in stable TNC-knockdown 5-8F and 6-10B
cells. Data are presented as the mean ± standard deviation (n=3).
*P<0.05; **P<0.01. TNC, tenascin-C; NPC, nasopharyngeal
carcinoma; EMT, epithelial-to-mesenchymal transition; RT-qPCR,
reverse transcription-quantitative PCR; NC, negative control; sh,
short hairpin; CDH, cadherin; VIM, vimentin; SNAIL2, snail family
transcriptional repressor 2; NC, negative control. |
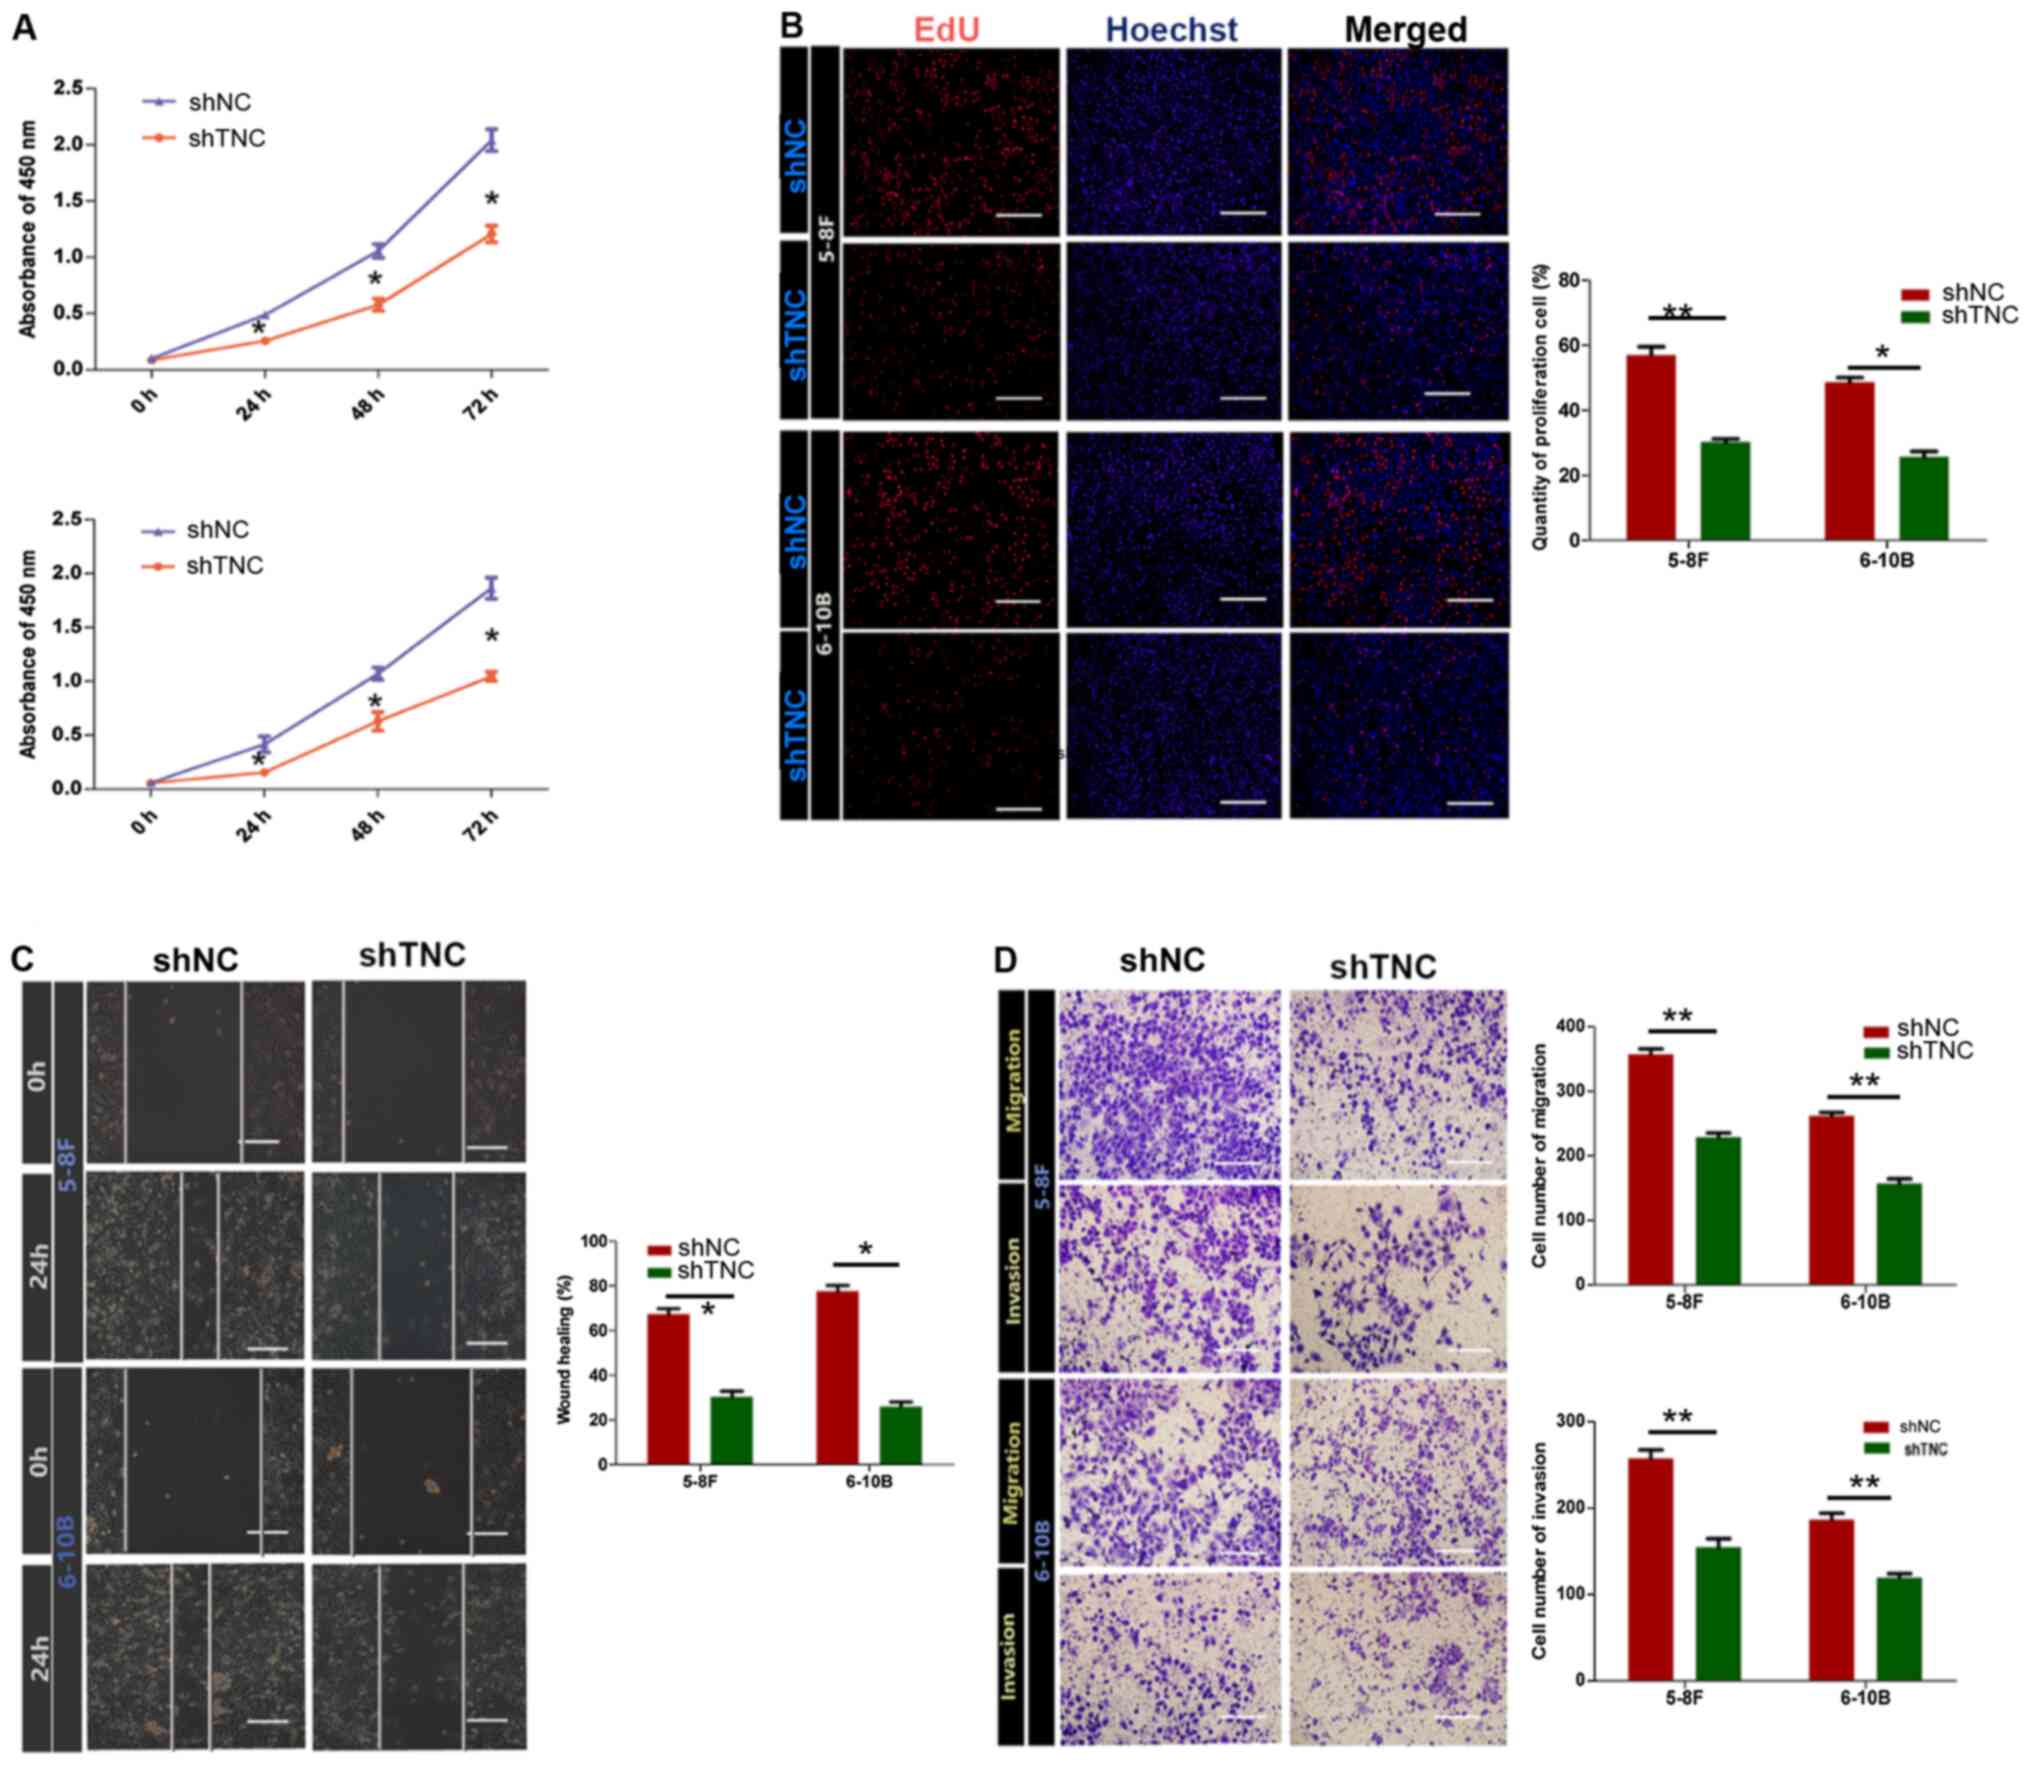
TNC knockdown inhibits proliferation,
migration and invasion of NPC cells
The role of TNC in the proliferation and metastasis
of NPC cells was assessed. The CCK-8 and EdU assays were performed
to assess cell proliferation. The results of the CCK-8 assay
demonstrated that TNC knockdown significantly decreased the
proliferation of both 5-8F and 6-10B cells (P<0.05) (Fig. 5A). In the EdU assay, TNC knockdown
suppressed cell proliferation, with lower proportions of
EdU-positive cells in both cell lines (Fig. 5B).
The effect of TNC on NPC cell migration and invasion
was determined via the wound healing and Transwell invasion and
migration assays. As presented in Fig.
5C, wound closure was notably higher in the control group
compared with the TNC knockdown group, which suggests that TNC
knockdown inhibited cell migration. In the Transwell migration
assay, TNC knockdown significantly decreased the number of
migratory cells compared with the control group (P<0.05;
Fig. 5D). Similarly, in the invasion
assay, TNC knockdown decreased the number of invasive cells in the
experimental group compared with the control group. Taken together,
these results suggest that TNC knockdown inhibits the
proliferation, migration and invasion of NPC cells.
TNC knockdown inhibits the mTOR
signaling pathway in NPC cells
To investigate the potential mechanism by which TNC
expression promotes EMT and cell proliferation in NPC cells, the
expression of proteins associated with the mTOR signaling pathway
was detected via western blot analysis in NPC cells transfected
with shNC or shTNC. The results demonstrated that TNC knockdown
significantly decreased the expression levels of p-P70S6K and p-AKT
in both 5-8F and 6-10B cells (P<0.05; Fig. 6A and B). Collectively, these results
suggest that TNC promotes EMT, at least partially via the mTOR
signaling pathway.
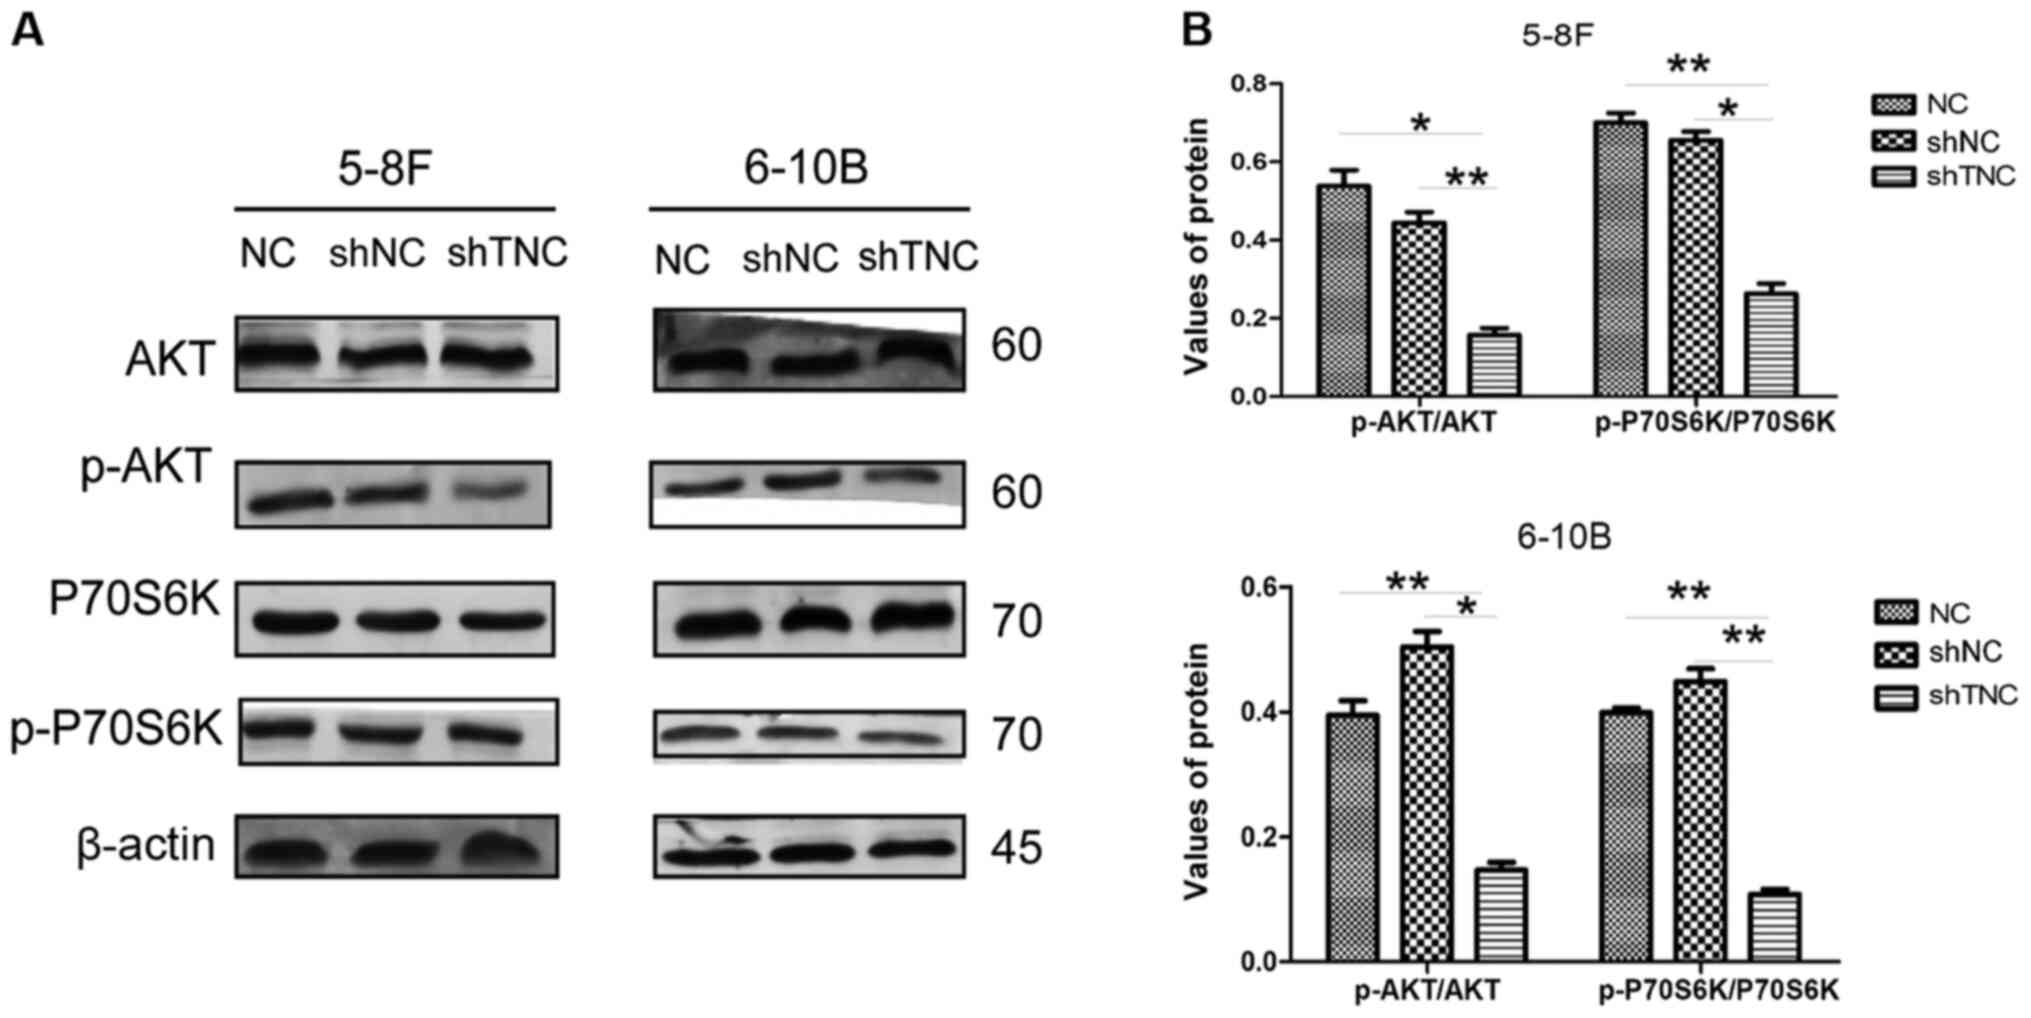 | Figure 6.TNC knockdown inhibits the mTOR
signaling pathway in NPC cells. (A) The expression levels of AKT,
p-AKT, P70S6K, p-P70S6K in TNC-knockdown cells. (B) Densitometry
analysis of the p-AKT/AKT and p-P70S6K/P70S6K ratios were
semi-quantified and are presented as the mean ± standard deviation.
*P<0.05; **P<0.01. TNC, tenascin-C; NPC, nasopharyngeal
carcinoma; p-, phospho; P70S6K, 70 kDa ribosomal protein S6 kinase
1; NC, negative control; sh, short hairpin; NC, negative
control. |
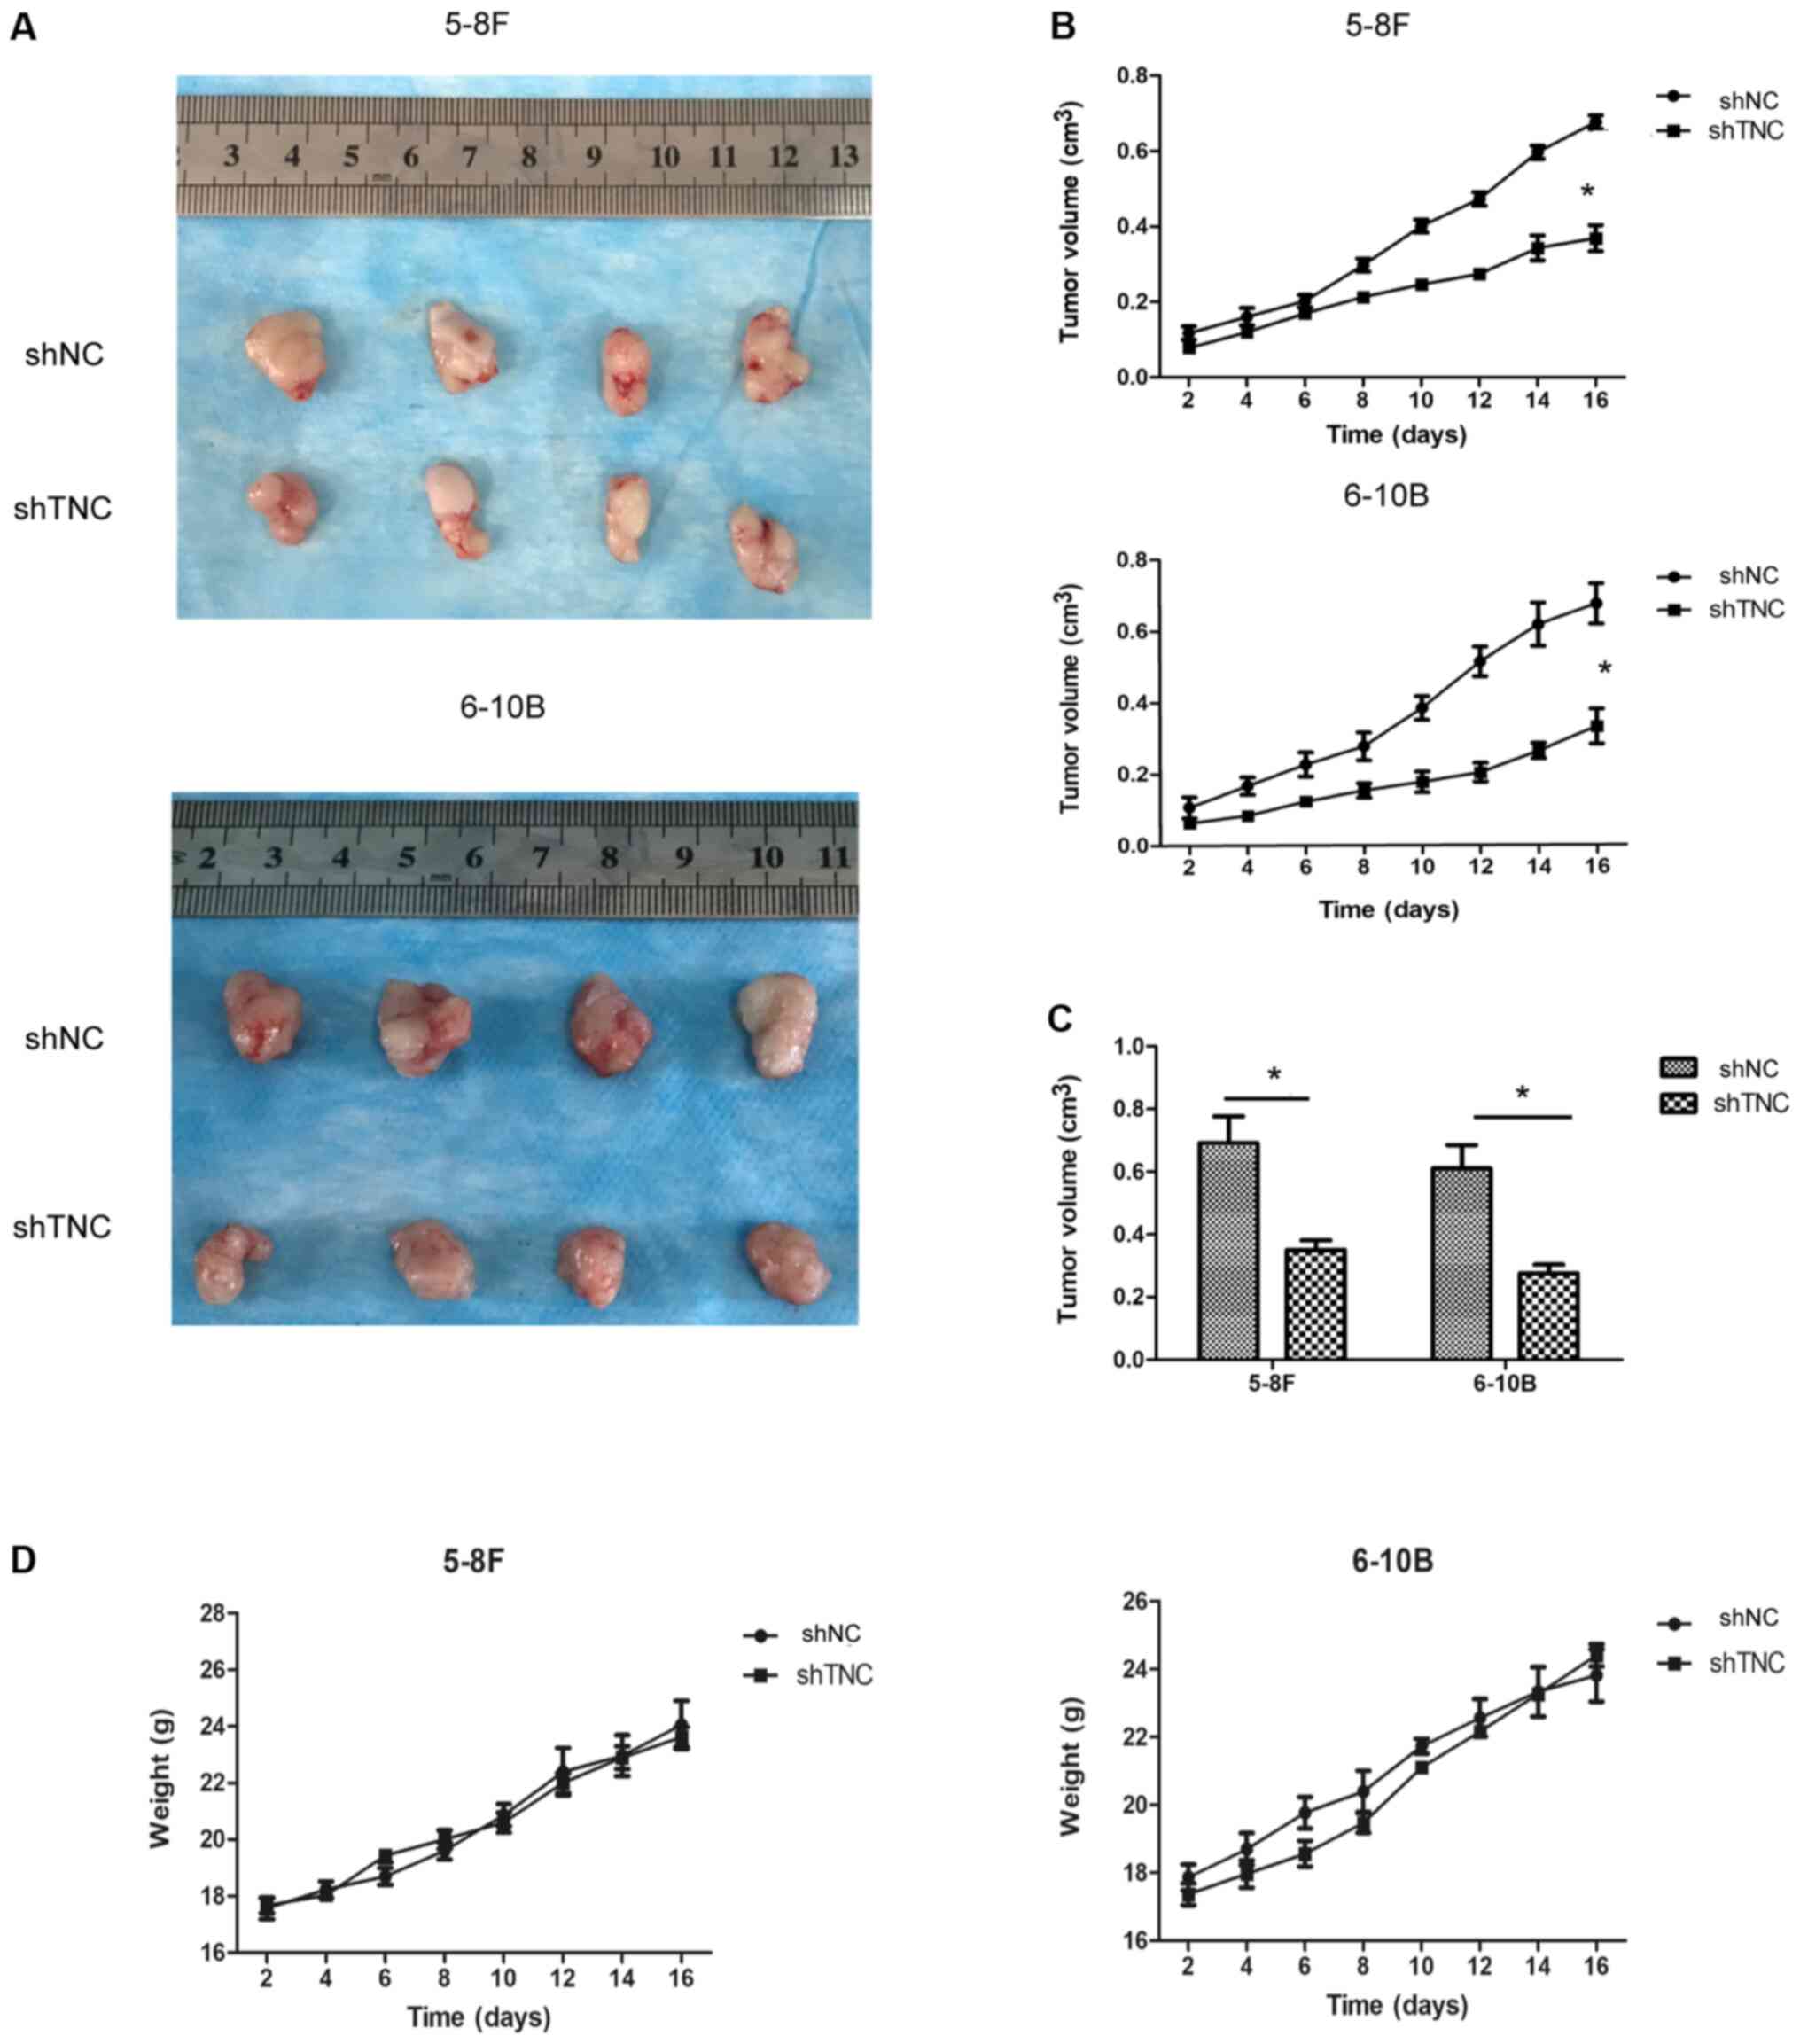
Effect of TNC expression on
tumorigenesis in vivo
To determine whether TNC expression affected tumor
growth in vivo, a xenograft mouse model was established by
injecting shTNC or shNC NPC cells into nude mice. The results
demonstrated that injection of cells in which TNC expression was
knocked down reduced tumor growth in the xenograft mouse model
compared with mice injected with shNC-transfected 5-8F and 6-10B
cells (Fig. 7A-C). In addition,
there were no significant differences in the weight of mice between
the different groups (Fig. 7D).
Taken together, these findings suggest that TNC expression
regulates tumor growth in vivo.
Discussion
The results of the present study demonstrated that
TNC was upregulated in NPC tissues. In addition, TNC knockdown
inhibited proliferation, migration, invasion and EMT of NPC cells,
suggesting that TNC may promote cell proliferation and EMT,
resulting in the malignant progression of NPC. Furthermore, the
expression of proteins associated with the mTOR signaling pathway
decreased in TNC-knockdown NPC cells compared with the control
group. Taken together, these results suggest that TNC promotes EMT
progression and mTOR signaling in NPC.
TNC expression is associated with neoplasia of
different organs, as well as the development of fetal tissue, which
may serve as a biomarker or predictor of tumor invasion and
metastasis in different types of cancer (13,33–36).
However, to the best of our knowledge, there are no studies
investigating the role of TNC in NPC. In the present study, TNC
gene transcription levels in NPC datasets obtained from GEO were
assessed, and the results demonstrated that TNC expression was
significantly higher in NPC tissues compared with normal tissues
(P<0.05). In addition, TNC expression was significantly higher
in NPC metastasis tissues compared with non-metastasis tissues
(P<0.05). To verify these results, TNC expression levels in NPC
tissues were assessed via IHC analysis in a TMA. The results
demonstrated that TNC gene expression was higher in NPC tissues
compared with NPG tissues. In addition, TNC expression was
associated with T staging and N staging of patients with NPC.
Collectively, these results suggest that TNC plays an important
role in NPC progression and metastasis.
The effect of TNC expression on the biological
functions of NPC cells were assessed both in vitro and in
vivo. TNC knockdown inhibited proliferation, migration and
invasion of NPC cells. In addition, TNC knockdown inhibited tumor
growth in vivo. These results suggest that TNC promotes NPC
cell proliferation. To further investigate the potential mechanism
by which TNC promotes NPC cell proliferation, WGCNA was performed
followed by GSEA to identify the gene sets associated with TNC
expression in the microarray data from the GEO datasets. KEGG and
GO enrichment analyses demonstrated that the hub genes in the key
modules were primarily associated with ‘ECM’ and ‘cell adhesion’.
GSEA demonstrated that there were more EMT-associated gene sets
upregulated in the TNC high expression group compared with the TNC
low expression group. The expression of key proteins associated
with EMT was assessed via RT-qPCR and western blot analyses.
Consistent with the findings of GSEA, TNC knockdown decreased the
expression of EMT-related markers. In addition, the mTOR complex
(mTORC)1 signaling pathway was enriched in the Hallmark results.
The PI3K/Akt/mTOR signaling pathway is a critical pathway involved
in tumorigenesis (37). It has been
reported that mTOR regulates cell motility, proliferation and
metabolism (38). The mTOR pathway
includes the mTORC1 and mTORC2 complexes, which are intricately
associated with tumor cell proliferation and tumor survival
(39). P-P70S6K and p-Akt expression
are the downstream effectors of mTORC1 and mTORC2, respectively
(40). In addition, the
PI3K/Akt/mTOR signaling pathway serves an important role in EMT
(41,42). β-catenin is a crucial regulator of
EMT (43). p-Akt can phosphorylate
GSK-3β at Ser9, inhibiting its kinase activity, which downregulates
both N-β-catenin and T-β-catenin expression (44). Thus, p-P70S6K and p-Akt expression
were detected in NPC cells. The results of the present study
demonstrated that TNC knockdown inhibited p-P70S6K and p-Akt
expression. Taken together, these results suggest that TNC gene
expression promotes EMT and the mTOR signaling pathway in NPC
cells.
In conclusion, the results of the present study
demonstrated that TNC expression was upregulated in NPC tissues
compared with normal tissues. In addition, TNC knockdown in NPC
cells inhibited NPC cancer cell proliferation, migration, invasion
and EMT. Furthermore, TNC knockdown inhibited tumor growth in
vivo. TNC knockdown also downregulated the mTOR pathway. Taken
together, these results suggest that TNC promotes cell
proliferation, EMT and the mTOR signaling pathway in NPC. Thus, TNC
may function as an oncogene in NPC cells, and TNC suppression may
be an innovative angle for the clinical treatment of NPC.
There were two main novelties of the present study.
On one hand, bioinformatics analysis was combined with basic
experiments as experimental methods. The transcription level of TNC
in NPC and its association with metastasis of NPC cells were
investigated via bioinformatics analysis, and these results were
verified via IHC analysis. Similarly, the function and mechanism of
TNC in NPC cells were predicted via WGCNA and GSEA, and these
results were verified via cell experiments. Combining
bioinformatics analysis and basic experiments made the research
more efficient and cost-effective. To the best of our knowledge,
the present study was the first to investigate the role of TNC in
NPC. In the present study, IHC analysis and in vivo and
in vitro experiments were performed to determine TNC
expression in NPC and its biological function, which provides a
basis for further investigation on the role of TNC in the treatment
of NPC.
However, the present study is not without
limitations. For example, the extent of involvement of the mTOR
pathway was not determined. This will be assessed in prospective
studies to further determine how TNC regulates the mTOR signaling
pathway in NPC.
Supplementary Material
Supporting Data
Acknowledgements
Not applicable.
Funding
The present study was supported by the National
Natural Science Foundation of China (grant nos. 81372880) and the
Guidance fund of the Renmin Hospital of Wuhan University (grant no.
RMYD2018Z12).
Availability of data and materials
The datasets used and/or analyzed during the current
study are available from the corresponding author upon reasonable
request.
Authors' contributions
XC, FL and ZZT conceived and designed the present
study. XC performed the experiments and analyzed the data. XC
drafted the initial manuscript. FL and ZZT revised the manuscript.
XC and FL confirmed the authenticity of all the raw data. All
authors have read and approved the final manuscript.
Ethics approval and consent to
participate
The present study was approved by the Clinical
Research Ethics Committee of Renmin Hospital of Wuhan University
[Wuhan, China; approval no. 2020(358)] and written informed consent
was provided by all patients prior to the study start. All animal
experiments were approved by the Ethics Committee of Animal
Experiments of Renmin Hospital of Wuhan University [Wuhan, China;
approval no. 2020(421)], and performed in compliance with the
laboratory animal management and guidelines.
Patient consent for publication
Not applicable.
Competing interests
The authors declare that they have no competing
interests.
References
|
1
|
Bray F, Ferlay J, Soerjomataram I, Siegel
RL, Torre LA and Jemal A: Global cancer statistics 2018: GLOBOCAN
estimates of incidence and mortality worldwide for 36 cancers in
185 countries. CA Cancer J Clin. 68:394–424. 2018. View Article : Google Scholar : PubMed/NCBI
|
|
2
|
Adham M, Kurniawan AN, Muhtadi AI, Roezin
A, Hermani B, Gondhowiardjo S, Tan IB and Middeldorp JM:
Nasopharyngeal carcinoma in Indonesia: Epidemiology, incidence,
signs, and symptoms at presentation. Chin J Cancer. 31:185–196.
2012. View Article : Google Scholar : PubMed/NCBI
|
|
3
|
Sun XS, Li XY, Chen QY, Tang LQ and Mai
HQ: Future of radiotherapy in nasopharyngeal carcinoma. Br J
Radiol. 92:201902092019. View Article : Google Scholar : PubMed/NCBI
|
|
4
|
Kimura Y, Suzuki D, Tokunaga T,
Takabayashi T, Yamada T, Wakisaka N, Yoshizaki T, Murata H, Miwa K,
Shoujaku H, et al: Epidemiological analysis of nasopharyngeal
carcinoma in the central region of Japan during the period from
1996 to 2005. Auris Nasus Larynx. 38:244–249. 2011. View Article : Google Scholar : PubMed/NCBI
|
|
5
|
Qiu S, Lin S, Tham IWK, Pan J, Lu J and Lu
JJ: Intensity-modulated radiation therapy in the salvage of locally
recurrent nasopharyngeal carcinoma. Int J Radiat Oncol Biol Phys.
83:676–683. 2012. View Article : Google Scholar : PubMed/NCBI
|
|
6
|
Co J, Mejia MB and Dizon JM: Evidence on
effectiveness of intensity-modulated radiotherapy versus
2-dimensional radiotherapy in the treatment of nasopharyngeal
carcinoma: Meta-analysis and a systematic review of the literature.
Head Neck. 38 (Suppl 1):E2130–E2142. 2016. View Article : Google Scholar : PubMed/NCBI
|
|
7
|
Xu ZJ, Zheng RS, Zhang SW, Zou XN and Chen
WQ: Nasopharyngeal carcinoma incidence and mortality in China in
2009. Chin J Cancer. 32:453–460. 2013. View Article : Google Scholar : PubMed/NCBI
|
|
8
|
Colaco RJ, Betts G, Donne A, Swindell R,
Yap BK, Sykes AJ, Slevin NJ, Homer JJ and Lee LW: Nasopharyngeal
carcinoma: A retrospective review of demographics, treatment and
patient outcome in a single Centre. Clin Oncol (R Coll Radiol).
25:171–177. 2013. View Article : Google Scholar : PubMed/NCBI
|
|
9
|
Jones FS and Jones PL: The tenascin family
of ECM glycoproteins: Structure, function, and regulation during
embryonic development and tissue remodeling. Dev Dyn An.
218:235–259. 2000. View Article : Google Scholar : PubMed/NCBI
|
|
10
|
Midwood KS, Chiquet M, Tucker RP and Orend
G: Tenascin-C at a glance. J Cell Sci. 129:4321–4327.
2016.PubMed/NCBI
|
|
11
|
Van Obberghen-Schilling E, Tucker RP,
Saupe F, Gasser I, Cseh B and Orend G: Fibronectin and Tenascin-C:
Accomplices in vascular morphogenesis during development and tumor
growth. Int J Dev Biol. 55:511–525. 2011. View Article : Google Scholar : PubMed/NCBI
|
|
12
|
Midwood KS, Hussenet T, Langlois B and
Orend G: Advances in Tenascin-C biology. Cell Mol Life Sci.
68:3175–3199. 2011. View Article : Google Scholar : PubMed/NCBI
|
|
13
|
Yoshida T, Akatsuka T and Imanaka-Yoshida
K: Tenascin-C and integrins in cancer. Cell Adh Migr. 9:96–104.
2015. View Article : Google Scholar : PubMed/NCBI
|
|
14
|
Lange K, Kammerer M, Saupe F, Hegi ME,
Grotegut S, Fluri E and Orend G: Combined lysophosphatidic
acid/platelet-derived growth factor signaling triggers glioma cell
migration in a Tenascin-C microenvironment. Cancer Res.
68:6942–6952. 2008. View Article : Google Scholar : PubMed/NCBI
|
|
15
|
Huang W, Chiquet-Ehrismann R, Moyano JV,
Garcia-Pardo A and Orend G: Interference of Tenascin-C with
syndecan-4 binding to fibronectin blocks cell adhesion and
stimulates tumor cell proliferation. Cancer Res. 61:8586–8594.
2001.PubMed/NCBI
|
|
16
|
Oskarsson T, Acharyya S, Zhang XH,
Vanharanta S, Tavazoie SF, Morris PG, Downey RJ, Manova-Todorova K,
Brogi E and Massagué J: Breast cancer cells produce Tenascin C as a
metastatic niche component to colonize the lungs. Nat Med.
17:867–874. 2011. View
Article : Google Scholar : PubMed/NCBI
|
|
17
|
Beiter K, Hiendlmeyer E, Brabletz T,
Hlubek F, Haynl A, Knoll C, Kirchner T and Jung A: Beta-Catenin
regulates the expression of Tenascin-C in human colorectal tumors.
Oncogene. 24:8200–8204. 2005. View Article : Google Scholar : PubMed/NCBI
|
|
18
|
Lowy CM and Oskarsson T: Tenascin C in
metastasis: A view from the invasive front. Cell Adh Migr.
9:112–124. 2015. View Article : Google Scholar : PubMed/NCBI
|
|
19
|
Yoneura N, Takano S, Yoshitomi H, Nakata
Y, Shimazaki R, Kagawa S, Furukawa K, Takayashiki T, Kuboki S,
Miyazaki M and Ohtsuka M: Expression of annexin II and stromal
tenascin C promotes epithelial to mesenchymal transition and
correlates with distant metastasis in pancreatic cancer. Int J Mol
Med. 42:821–830. 2018.PubMed/NCBI
|
|
20
|
Nagaharu K, Zhang X, Yoshida T, Katoh D,
Hanamura N, Kozuka Y, Ogawa T, Shiraishi T and Imanaka-Yoshida K:
Tenascin C induces epithelial-mesenchymal transition-like change
accompanied by SRC activation and focal adhesion kinase
phosphorylation in human breast cancer cells. Am J Pathol.
178:754–763. 2011. View Article : Google Scholar : PubMed/NCBI
|
|
21
|
Langfelder P and Horvath S: WGCNA: An R
package for weighted correlation network analysis. BMC
Bioinformatics. 9:5592008. View Article : Google Scholar : PubMed/NCBI
|
|
22
|
Wan Q, Tang J, Han Y and Wang D:
Co-expression modules construction by WGCNA and identify potential
prognostic markers of uveal melanoma. Exp Eye Res. 166:13–20. 2018.
View Article : Google Scholar : PubMed/NCBI
|
|
23
|
Bao YN, Cao X, Luo DH, Sun R, Peng LX,
Wang L, Yan YP, Zheng LS, Xie P, Cao Y, et al: Urokinase-type
plasminogen activator receptor signaling is critical in
nasopharyngeal carcinoma cell growth and metastasis. Cell Cycle.
13:1958–1969. 2014. View
Article : Google Scholar : PubMed/NCBI
|
|
24
|
Bose S, Yap LF, Fung M, Starzcynski J,
Saleh A, Morgan S, Dawson C, Chukwuma MB, Maina E, Buettner M, et
al: The ATM tumour suppressor gene is down-regulated in
EBV-associated nasopharyngeal carcinoma. J Pathol. 217:345–352.
2009. View Article : Google Scholar : PubMed/NCBI
|
|
25
|
Tang XR, Li YQ, Liang SB, Jiang W, Liu F,
Ge WX, Tang LL, Mao YP, He QM, Yang XJ, et al: Development and
validation of a gene expression-based signature to predict distant
metastasis in locoregionally advanced nasopharyngeal carcinoma: A
retrospective, multicentre, cohort study. Lancet Oncol. 19:382–393.
2018. View Article : Google Scholar : PubMed/NCBI
|
|
26
|
Torlakovic EE, Nielsen S, Vyberg M and
Taylor CR: Getting controls under control: The time is now for
immunohistochemistry. J Clin Pathol. 68:879–882. 2015. View Article : Google Scholar : PubMed/NCBI
|
|
27
|
Liberzon A, Birger C, Thorvaldsdóttir H,
Ghandi M, Mesirov JP and Tamayo P: The molecular signatures
database (MSigDB) hallmark gene set collection. Cell Syst.
1:417–425. 2015. View Article : Google Scholar : PubMed/NCBI
|
|
28
|
Livak KJ and Schmittgen TD: Analysis of
relative gene expression data using real-time quantitative PCR and
the 2(-Delta Delta C(T)) method. Methods. 25:402–408. 2001.
View Article : Google Scholar : PubMed/NCBI
|
|
29
|
Huang SH and O'Sullivan B: Overview of the
8th edition TNM classification for head and neck cancer. Curr Treat
Options Oncol. 18:402017. View Article : Google Scholar : PubMed/NCBI
|
|
30
|
Beckerman P, Qiu C, Park J, Ledo N, Ko YA,
Park AD, Han SY, Choi P, Palmer M and Susztak K: Human kidney
tubule-specific gene expression based dissection of chronic kidney
disease traits. EBioMedicine. 24:267–276. 2017. View Article : Google Scholar : PubMed/NCBI
|
|
31
|
Tang J, Kong D, Cui Q, Wang K, Zhang D,
Gong Y and Wu G: Prognostic genes of breast cancer identified by
gene Co-expression network analysis. Front Oncol. 8:3742018.
View Article : Google Scholar : PubMed/NCBI
|
|
32
|
Rosen EY, Wexler EM, Versano R, Coppola G,
Gao F, Winden KD, Oldham MC, Martens LH, Zhou P, Farese RV Jr and
Geschwind DH: Functional genomic analyses identify pathways
dysregulated by progranulin deficiency, implicating Wnt signaling.
Neuron. 71:1030–1042. 2011. View Article : Google Scholar : PubMed/NCBI
|
|
33
|
Akabani G, Reardon DA, Coleman RE, Wong
TZ, Metzler SD, Bowsher JE, Barboriak DP, Provenzale JM, Greer KL,
DeLong D, et al: Dosimetry and radiographic analysis of
131I-labeled anti-tenascin 81C6 murine monoclonal antibody in newly
diagnosed patients with malignant gliomas: A phase II study. J Nucl
Med. 46:1042–1051. 2005.PubMed/NCBI
|
|
34
|
Reardon DA, Akabani G, Coleman RE,
Friedman AH, Friedman HS, Herndon JE II, Cokgor I, McLendon RE,
Pegram CN, Provenzale JM, et al: Phase II trial of murine
(131)I-labeled antitenascin monoclonal antibody 81C6 administered
into surgically created resection cavities of patients with newly
diagnosed malignant gliomas. J Clin Oncol. 20:1389–1397. 2002.
View Article : Google Scholar : PubMed/NCBI
|
|
35
|
Cokgor I, Akabani G, Kuan CT, Friedman HS,
Friedman AH, Coleman RE, McLendon RE, Bigner SH, Zhao XG,
Garcia-Turner AM, et al: Phase I trial results of
iodine-131-labeled antitenascin monoclonal antibody 81C6 treatment
of patients with newly diagnosed malignant gliomas. J Clin Oncol.
18:3862–3872. 2000. View Article : Google Scholar : PubMed/NCBI
|
|
36
|
Sarli B, Topsakal R, Kaya EG, Akpek M, Lam
YY and Kaya MG: Tenascin-C as predictor of left ventricular
remodeling and mortality in patients with dilated cardiomyopathy. J
Investig Med. 61:728–732. 2013. View Article : Google Scholar : PubMed/NCBI
|
|
37
|
Aoki M and Fujishita T: Oncogenic roles of
the PI3K/AKT/mTOR axis. Current Topics in Microbiology and
Immunology. 407. Springer Verlag; pp. 153–189. 2017, PubMed/NCBI
|
|
38
|
Jhanwar-Uniyal M, Amin AG, Cooper JB, Das
K, Schmidt MH and Murali R: Discrete signaling mechanisms of mTORC1
and mTORC2: Connected yet apart in cellular and molecular aspects.
Adv Biol Regul. 64:39–48. 2017. View Article : Google Scholar : PubMed/NCBI
|
|
39
|
Kim LC, Cook RS and Chen J: MTORC1 and
mTORC2 in cancer and the tumor microenvironment. Oncogene.
36:2191–2201. 2017. View Article : Google Scholar : PubMed/NCBI
|
|
40
|
Wang F, Meng M, Mo B, Yang Y, Ji Y, Huang
P, Lai W, Pan X, You T, Luo H, et al: Crosstalks between mTORC1 and
mTORC2 variagate cytokine signaling to control NK maturation and
effector function. Nat Commun. 9:48742018. View Article : Google Scholar : PubMed/NCBI
|
|
41
|
Lee YJ and Han HJ: Troglitazone
ameliorates high glucose-induced EMT and dysfunction of SGLTs
through PI3K/Akt, GSK-3β, Snail1, and β-catenin in renal proximal
tubule cells. Am J Physiol Renal Physiol. 298:F1263–F1275. 2010.
View Article : Google Scholar : PubMed/NCBI
|
|
42
|
Byers LA, Diao L, Wang J, Saintigny P,
Girard L, Peyton M, Shen L, Fan Y, Giri U, Tumula PK, et al: An
epithelial-mesenchymal transition gene signature predicts
resistance to EGFR and PI3K inhibitors and identifies Axl as a
therapeutic target for overcoming EGFR inhibitor resistance. Clin
Cancer Res. 19:279–290. 2013. View Article : Google Scholar : PubMed/NCBI
|
|
43
|
Zhao YR, Wang JL, Xu C, Li YM, Sun B and
Yang LY: HEG1 indicates poor prognosis and promotes hepatocellular
carcinoma invasion, metastasis, and EMT by activating Wnt/β-catenin
signaling. Clin Sci. 133:1645–1662. 2019. View Article : Google Scholar : PubMed/NCBI
|
|
44
|
Xu W, Wang Z, Zhang W, Qian K, Li H, Kong
D, Li Y and Tang Y: Mutated K-ras activates CDK8 to stimulate the
epithelial-to-mesenchymal transition in pancreatic cancer in part
via the Wnt/β-catenin signaling pathway. Cancer Lett. 356:613–627.
2015. View Article : Google Scholar : PubMed/NCBI
|