Introduction
Endometrial cancer (EC) is one of the most common
gynecological malignancies in the United States, and the incidence
of this disease is increasing (1,2).
Epidemiological studies have estimated that 66,570 uterine corpus
cancer cases and 12,904 deaths will occur in 2021 (2). The upward trend in the incidence of EC
may be attributed to the increasing rate of obesity in most part of
the world (3). Although EC is often
diagnosed at an early stage, high-grade lesions account for a large
proportion of deaths (4). Hamilton
et al demonstrated that high-grade EC accounts for only 28%
of all new diagnoses, but 74% of all EC deaths (5). The main treatment for stage I and II EC
is a total hysterectomy and bilateral salpingo-oophorectomy, which
is often effective (6,7). However, advanced disease is not curable
and chemotherapy remains the main therapy (8,9). These
factors reflect a lack of advances in treatment for patients with
high-grade EC. Therefore, identifying EC-related genes and
developing an improved understanding of their biological function
may promote novel breakthroughs for EC treatment.
Obg-like ATPase 1 (OLA1) is ubiquitously expressed
in a majority of organisms, including bacteria, plants and humans,
and it belongs to the Obg family of P-loop GTPases (10–12).
OLA1 is essential to the cellular stress response, heat shock, cell
adhesion and the antioxidant response (13–16).
Heat shock protein 70 (HSP70) is a key molecule in different types
of cancer, and high expression of HSP70 is associated with poor
tumor progression. OLA1 regulates HSP70 protein stability to
inhibit shock-induced cell death (14,15). In
addition, OLA1 downregulates SOD2 by driving the ubiquitin
proteasome pathway in persistent pulmonary hypertension of the
newborn of lambs (16). Further,
OLA1 affects lung cancer growth by binding to GSK3β to suppress its
expression (17). In breast cancer,
OLA1 promotes tumor invasion and metastasis by inhibiting the
production of reactive oxygen species (18). Moreover, OLA1 enhances chemotherapy
resistance by inhibiting the epithelial-mesenchymal transition
process via the TGF-β/Smad pathway in breast cancer cells (19). OLA1 also interacts with BRCA1 and
BRCA1-associated RING domain protein 1, which affects centrosome
function and is suspected to lead to carcinogenesis in hereditary
breast and ovarian cancer (20–22).
These features clearly indicate that OLA1 is an influential gene in
different types of adenocarcinoma, yet the biological function of
OLA1 in EC has been poorly characterized. Therefore, the present
study hypothesized that abnormal OLA1 expression is one of the
factors influencing the occurrence and development of EC. To test
this proposal, the current study used clinical samples and The
Cancer Genome Atlas (TCGA) database to explore the potential
biological role and prognostic value of OLA1 in EC, and validated
the results using in vitro experiments.
Materials and methods
TCGA database
The clinical and transcriptome profiling data for
uterine corpus endometrial cancer were downloaded from the official
TCGA website (https://portal.gdc.cancer.gov) (23). This provided 552 EC samples and 35
non-cancerous samples that were profiled for the differences
between non-cancerous tissues and EC tissues, and 23 pairs of
matched samples were profiled for the same purpose. In total,
discarding the missing data, 510 tumor cases with clinical
information were profiled for class discovery and survival
analysis. The patients ranged in age from 31–90 years. The complete
description of the clinical data is summarized in Table I. Gene Set Enrichment Analysis (GSEA)
was used to detect signaling pathways in which genes may be
involved in EC. In addition, GSEA (http://www.gsea-msigdb.org/gsea/index.jsp) was used to
analyze biological processes and signaling pathways in the
transcriptomes of the OLA1 expression samples from TCGA. The gene
set database used was c2.cp.kegg.v.6.2.symbols.gmt.
 | Table I.TCGA characteristics of 510 patients
with endometrial cancer. |
Table I.
TCGA characteristics of 510 patients
with endometrial cancer.
| Clinical
characteristics | Value | n, % |
|---|
| Median age at
diagnosis, years (range) | 66 (31–90) |
|
| Clinical stage
(FIGO), n |
|
|
| I | 314 | 61.57 |
| II | 48 | 9.41 |
|
III | 120 | 23.53 |
| IV | 28 | 5.49 |
| Histological grade,
n |
|
|
| G1 | 92 | 18.04 |
| G2 | 116 | 22.75 |
| G3 | 291 | 57.06 |
|
High-grade | 11 | 2.16 |
| Histological type,
n |
|
|
|
Endometrioid endometrial
adenocarcinoma | 383 | 75.10 |
| Serous
endometrial adenocarcinoma | 105 | 20.59 |
| Mixed
serous and endometrioid | 22 | 4.31 |
| Cancer status,
n |
|
|
|
Tumor-free | 412 | 84.08 |
| With
tumor | 78 | 15.92 |
| Menopause status,
n |
|
|
|
Pre | 34 | 7.33 |
|
Peri | 17 | 3.66 |
|
Post | 413 | 89.01 |
| Body mass index,
n |
|
|
|
≥29.9 | 294 | 60.74 |
|
<29.9 | 190 | 39.26 |
| Surgical approach,
n |
|
|
|
Open | 296 | 60.66 |
|
Minimally invasive | 192 | 39.34 |
| Lymph nodes, n |
|
|
|
Negative | 270 | 79.89 |
|
Positive | 68 | 20.11 |
| Distant metastasis,
n |
|
|
|
Negative | 482 | 94.51 |
|
Positive | 28 | 5.49 |
Cell culture
The EC cell lines were purchased from The Cell Bank
of Type Culture Collection of The Chinese Academy of Sciences. The
cell lines were Ishikawa, RL95-2, HEC-1A and HEC-1B. The Ishikawa
cells were maintained in RPMI 1640 medium (Biological Industries),
while the others were cultured in DMEM (HyClone; Cytiva). Both were
supplemented with 10% fetal calf serum (Biological Industries).
Cells were incubated at a temperature of 37°C and a humidified
atmosphere of 5% CO2.
Clinical sample collection
EC and corresponding adjacent endometrial tissue
microarrays (cat. no. EMC1351) were purchased from Superbiotek
(http://www.superbiotek.com). OLA1
expression was determined by immunohistochemical staining in 135
cases including 118 EC cancer tissues and 17 adjacent tissues.
Immunohistochemistry (IHC) and
evaluation of staining
The tissue microarrays were used for
immunohistochemistry analysis to evaluate OLA1 protein expression
levels in EC. IHC was performed as per our previous study (24). The sections (3 µm-thick) were
deparaffinized in 100% xylene and rehydrated in a descending
ethanol series (100, 90, 80 and 70% ethanol) and antigen retrieval
was performed in citrate buffer for 5 min at 100°C. The tissue
section was incubated with 3% H2O2 at 37°C
for 10 min to block and inactivate endogenous peroxidase. In order
to block non-specific binding sites, the section was incubated with
goat serum (ZSGB-Bio Technologies) for 15 min. Subsequently, the
section was stained with primary antibody against OLA1 (Table SI) at 4°C overnight. In the next
day, the section was incubated with a biotin-labeled secondary
antibody for 30 min after re-warming at 37°C for 45 min.
Horseradish peroxidase-labeled streptomycin avidin working solution
was added to the section and incubated for 30 min.
DAB/H2O2 staining reaction was performed for
color development, then the section was counterstained with
hematoxylin. The images were captured using a bright field light
microscope (magnifications, ×40 and ×200). For IHC assays, the
staining intensity and percentage of positive cells were analyzed.
The OLA1 stain index was the product of the intensity (0, negative;
1, weak; 2, moderate; and 3, strong) and stain-positive cells (0,
<5; 1, 5–25; 2, 26–50; 3, 51–75; and 4, >75%) (25). Two pathologists scored the sections
while blinded to the patients' information. After scoring, the
samples were grouped according to International Federation of
Gynecology and Obstetrics (FIGO) stages and then statistical
analysis was performed (6).
Cell transfection
Guangzhou RiboBio Co., Ltd. designed and synthesized
the small interfering RNA (siRNA) for the OLA1 gene (siOLA1)
and for the scrambled negative control (NC). The sequences are
listed in Table II. OLA1
plasmid (ov-OLA1) and empty mock (ov-mock) plasmid were purchased
in OBiO Technology (Shanghai) Corp. (https://www.obiosh.com). Transfection was performed as
per our previous study (26). RL95-2
and HEC-1B cells were cultured in six-well plates (Corning, Inc.)
at 30–50% confluence for 24 h before transfection. Subsequently, 5
µl Lipofectamine® 2000 transfection reagent (Invitrogen;
Thermo Fisher Scientific, Inc.) was used to transfect the siRNA (10
µl) or plasmid (2 µl) into cells at a working concentration of 100
nM. Cells were collected for further experiments after 48–72 h.
Efficiency of the transfection was quantitatively assessed using
reverse transcription-quantitative (RT-q)PCR at 48 h after
transfection, and assessed by western blot at 72 h after
transfection.
| Table II.Target sequences of siRNA used in
this study. |
Table II.
Target sequences of siRNA used in
this study.
| siRNA | Sequence,
5′-3′ |
|---|
| siOLA1-1 |
GTGCTTTGGTCATTCCTTT |
| siOLA1-2 |
GTTCGCTTCTATCATGATT |
| siOLA1-3 |
CTACTTGGTTAATCTTTCT |
RNA isolation, RT-qPCR and
primers
RNAiso Plus reagent (Takara Bio, Inc.) was used to
extract total RNA from the RL95-2 and HEC-1B cells. Then, total RNA
(1 µg) was reverse transcribed into complementary DNA, according to
the manufacturer's protocol. The reverse transcription reagent kit
was purchased from Takara Bio, Inc. The mRNA expression levels were
measured using ChamQ Universal SYBR qPCR master mix kit (Vazyme
Biotech Co., Ltd.) according to the manufacturer's protocol. The
amplification conditions were as follows: 1 cycle of 95°C 30 sec;
40 cycles of 95°C 5 sec, 60°C 30 sec; and 95°C for 15 sec. Relative
mRNA expression levels were calculated using the 2−ΔΔCq
method (27) and normalized to the
internal reference gene GAPDH. Specific primer sequences for OLA1
were designed as follows: Sense, 5′-AAAGGTGGCTGTGAGAGGAGGAG-3′ and
antisense, 5′-TGTGTCATGTTCGCTTCCAGATACTTC-3′. GAPDH was used as the
internal control. Specific primer sequences for GAPDH were designed
as follows: Sense, 5′-CGCTGAGTACGTCGTGGAGTC-3′; antisense,
5′-GCTGATGATCTTGAGGCTGTTGTC-3′.
Cell proliferation analysis
Cell Counting Kit-8 (CCK-8) assay is widely used in
cell proliferation detection, and it is based on WST-8, a compound
similar to MTT. When WST-8 is present in
1-methoxy-5-methylphenazinium dimethyl sulfate, it can be reduced
into formazan, a highly water-soluble product that is yellow. The
color turns darker when the proliferation rate increases. Namely,
the color depth is proportional to the number of living cells.
Thus, this characteristic makes it a good choice for analyzing
cells proliferation. RL95-2 and HEC-1B cells transfected with siNC,
siOLA1-1 and siOLA1-3 were seeded at 1,000 cells per well in
96-well microplates (Corning, Inc.). CCK-8 (Dojindo Molecular
Technologies, Inc.) was used to measure cell viability. The cells
were cultured for 1–3 or 4 days before detection. The OD value was
measured at a wavelength of 450 nm, using a microplate reader
(BioTek Instruments, Inc.). All assays were repeated three
times.
5-Ethynyl-2′-deoxyuridine (EdU)
incorporation
EdU, an analogue of thymidine, can take the replace
of thymine (T) in the DNA during cell proliferation. In other
words, when the cell cycle changes from the G phase to S phase, EdU
can be used as a substitute for T to incorporate DNA. Based on the
incorporation of EdU and Apollo® fluorescence, it can
detect the DNA replication activity of cells can quickly and
accurately. The Cell-Light™ EdU Apollo® 567 in
vitro imaging kit (cat. no. C10310-1, Guangzhou RiboBio Co.,
Ltd.) was used to examine proliferating cells. RL95-2 and HEC-1B
cells transfected with siNC, siOLA1-1 and siOLA1-3 were cultured at
2,000 cells per well in 96-well microplates for 12 h. When the
cells were in the logarithmic proliferation phase, the medium was
changed to a prepared EdU medium (cat. no. C10310-1, Guangzhou
RiboBio Co., Ltd.) and incubated for 2 h. To preserve the cellular
structure, the cells were incubated 4% paraformaldehyde at room
temperature for 30 min. After decolorization for 5 min with 2 mg/ml
of glycine and PBS solution, the cells were permeabilized in 0.5%
Triton X-100 for 10 min at 25°C. Finally, all the cells were
stained with Apollo® 567 dye solution for 30 min and 5
µg/ml of DAPI for 10 min at 25°C in dark. PBS was used to wash the
cells.
Wound healing assay
RL95-2 and HEC-1B cells were inoculated in six-well
plates for overnight adherence until they were 90% confluent, and
they were scratched by scraping the confluent cell monolayers with
a pipette tip. The cells were washed with PBS three times and
incubated in serum-free medium. Images of cell migration images
were captured using a light microscope at different time points (0,
24, 48 and 72 h). Scratch widths were recorded to compare the
healing rate. The experiments and assays were repeated at least
three times.
Migration and invasion assays
The migration and invasion of tumor cells were
detected by Transwell and Boyden experiments utilizing a Transwell
apparatus (Corning, Inc.). A total of 100 µl of 1×10⁵
cells mixed with serum-free DMEM medium (HyClone; Cytiva). were
seeded in the wetted top chamber. Then, 500 µl of DMEM containing
10% FBS in the bottom chamber attracted cellular migration and
invasion. For the Boyden assay, Matrigel (R&D Systems, Inc.)
was precoated for 6 h in the top chamber at 37°C. After incubation
at 37°C in 5% CO2 for 10 h (for the Transwell assay) or
20 h (for the Boyden assay), the cells were stained with crystal
violet solution at 25°C for 5 min, and the non-migrated cells were
removed with a cotton swab. Images of five fields were randomly
captured under a light microscope (magnification, ×100).
Western blot analysis
Western blot analysis was performed as previously
described (26). Antibodies used
included anti-OLA1, GAPDH, Smad 3, Smad 4, p-GSK3β and β-catenin.
The antibodies, dilutions and suppliers are listed in Table SI. The secondary antibody used was
horseradish peroxidase-conjugated anti-mouse and anti-rabbit
immunoglobulin-G antibody (both 1:3,000 dilution; CoWin
Biosciences). GAPDH was considered a loading control. Blots were
detected using enhanced chemiluminescence reagents (Pierce; Thermo
Fisher Scientific, Inc.). Protein expression levels were quantified
using ImageJ software (version 1.51; National Institutes of
Health).
Statistical analysis
R software (version 3.6.1) with the edgeR, glmnet,
survivalROC and gplot packages were used to analyze the data from
TCGA database (28). GraphPad Prism
version 8.1.1 (GraphPad Software, Inc.) software was used for
statistical analysis. P<0.05 was considered to indicate a
statistically significant difference. 510 EC samples with both OLA1
mRNA expression and clinical information were downloaded from TCGA
in January 2020. The high and low expression OLA1 level groups were
bounded by the median expression value of OLA1. Wilcoxon rank sum
and Wilcoxon signed-rank tests were used to analyze the differences
in OLA1 expression levels. Kaplan-Meier analysis was performed to
analyze the association between overall survival of patients and
OLA1 expression. In addition, the area under the curve (AUC) values
of the receiver operating characteristic (ROC) curves were
calculated using time-dependent ROC analysis. Univariate logistic
regression was used to analyze the association between OLA1
expression and clinicopathological characteristics. Univariate and
multivariate Cox regression analyses were performed to analyze the
association between clinicopathological characteristics and overall
survival of patients. Data are presented as the mean ± standard
deviation (unless otherwise shown). Comparisons between the two
groups were performed using unpaired Student's t-tests, while
one-way ANOVA was used for multiple groups. Dunnett's and Tukey's
post hoc tests were used following ANOVA as appropriate.
Results
OLA1 expression in EC samples and
non-cancerous samples
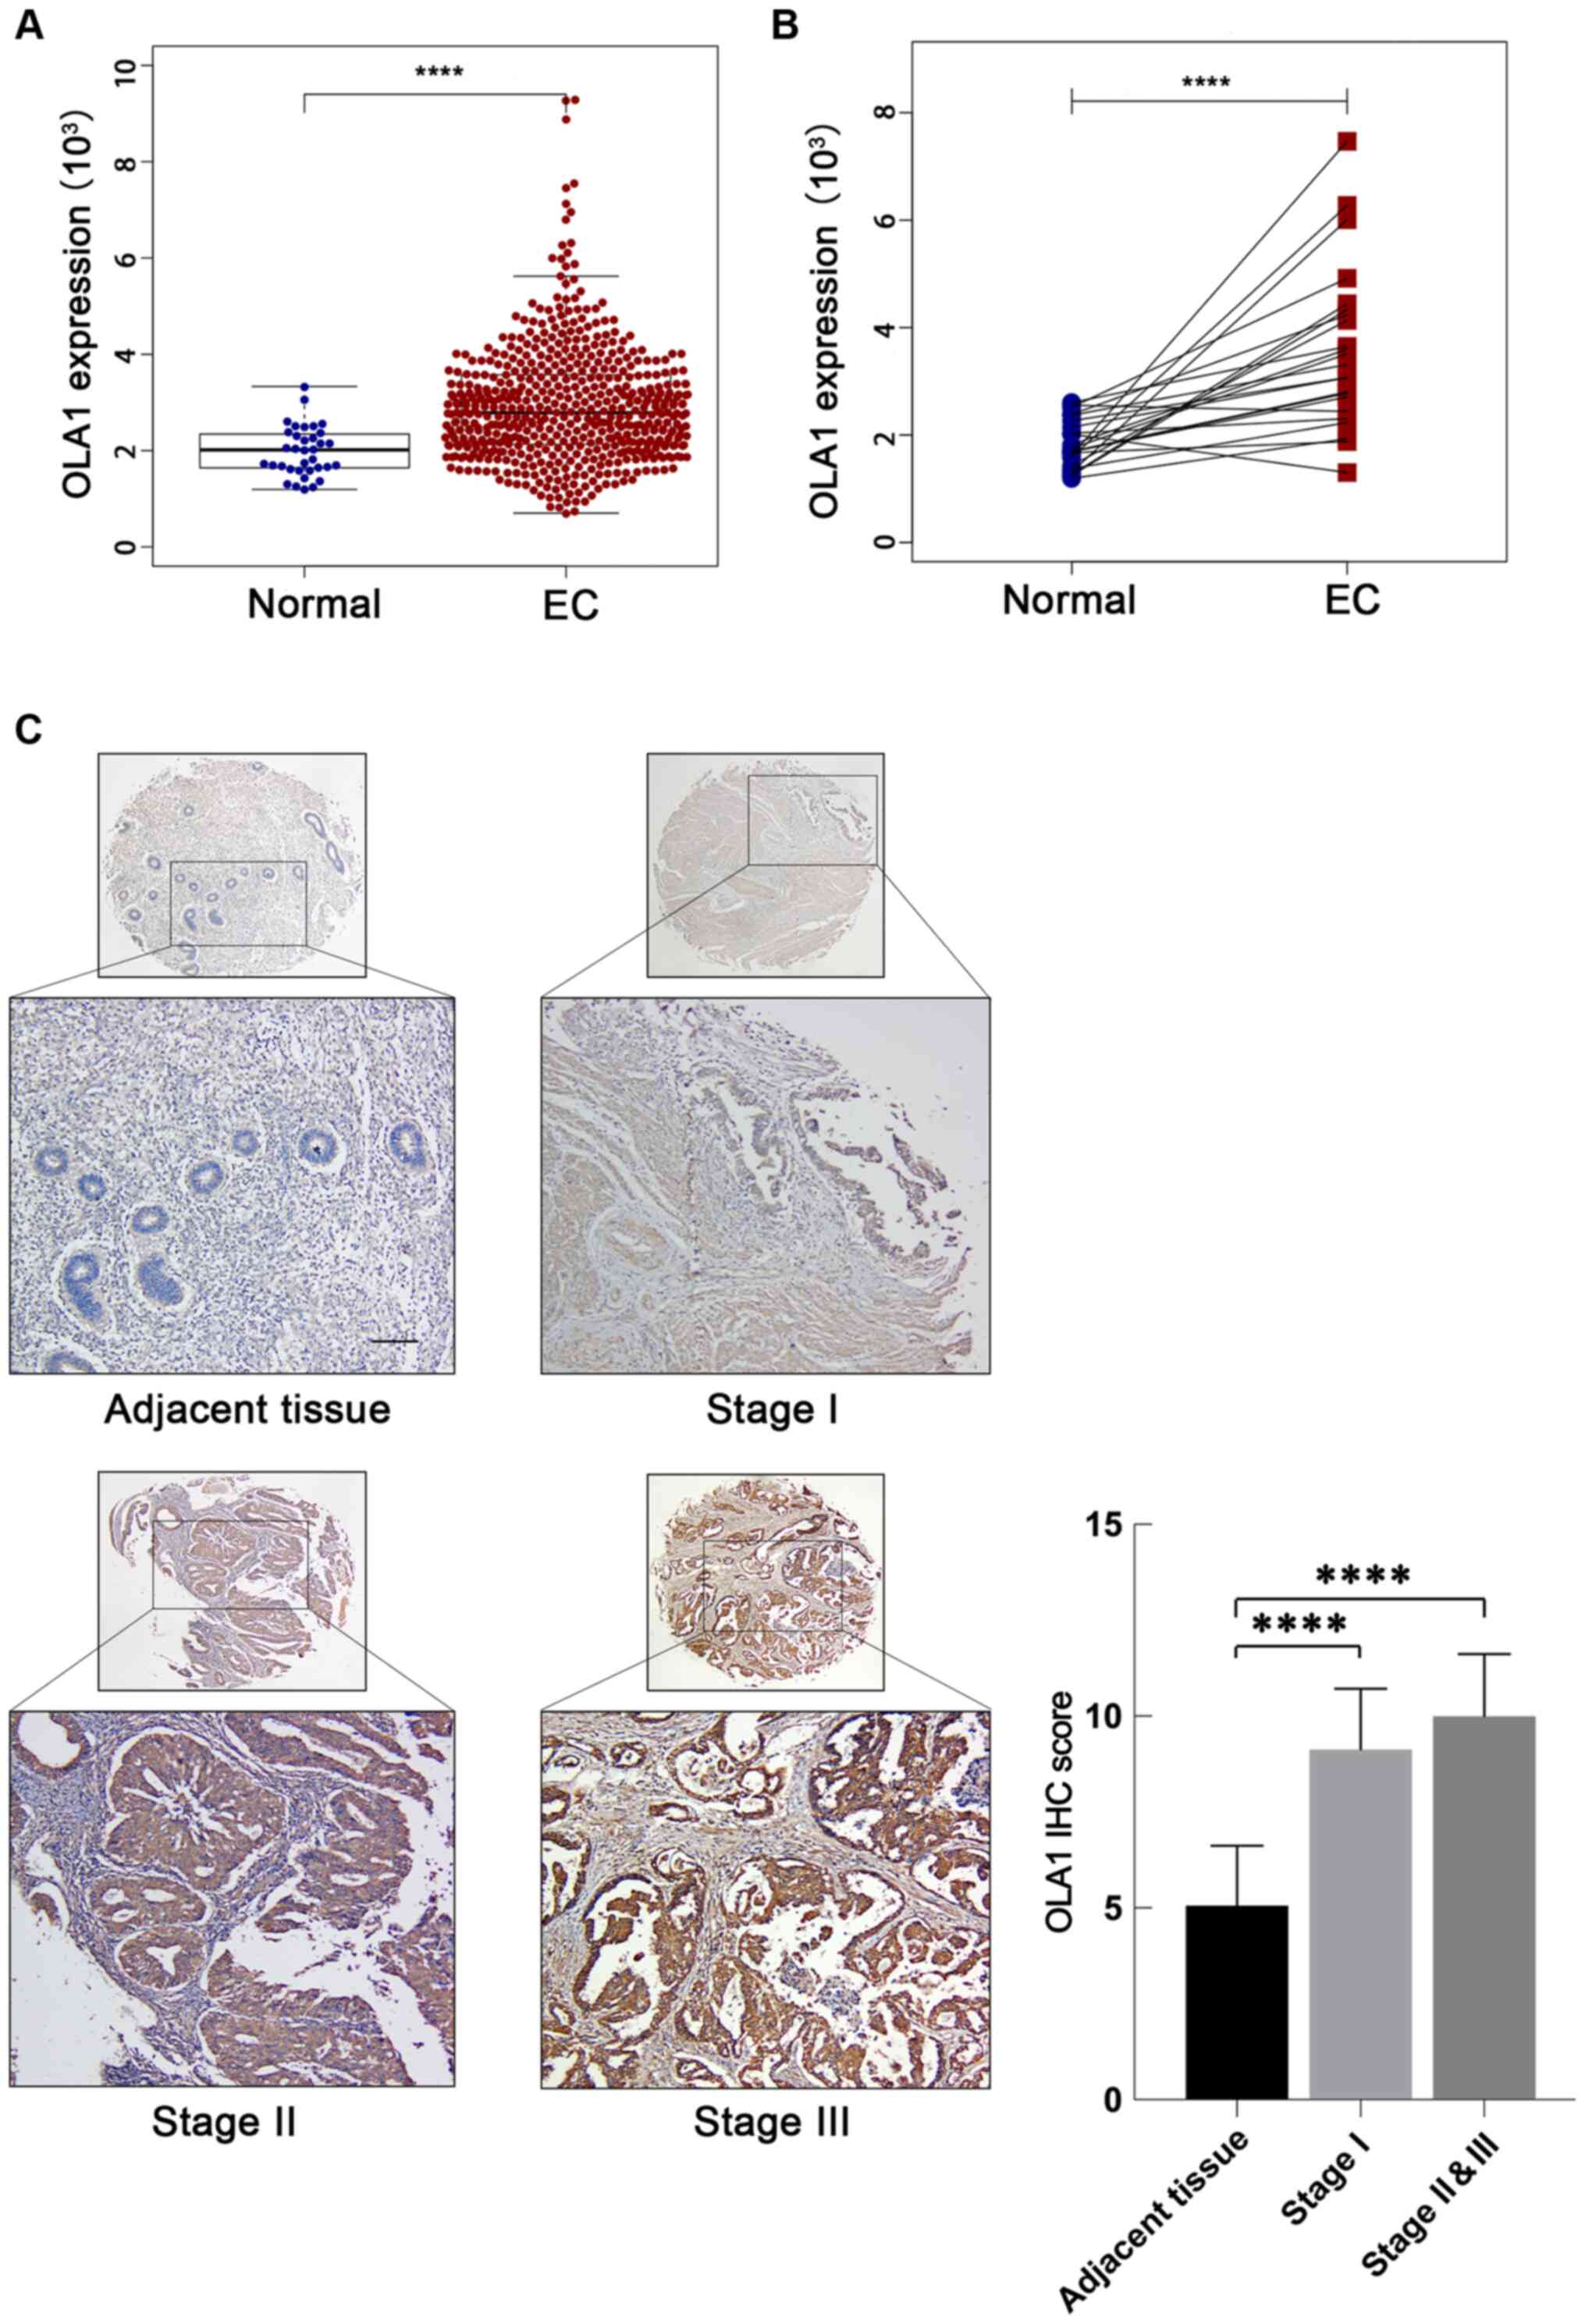
To investigate whether OLA1 expression is associated
with EC progression, publicly available data was downloaded from
TCGA database and analyzed. Significant OLA1-upregulation was found
in 552 EC samples compared with 35 non-cancerous samples
(P<0.001; Fig. 1A). Furthermore,
among the matched samples, OLA1 expression levels were also
significantly upregulated (P<0.001; Fig. 1B). OLA1 expression levels were
further examined by immunostaining human EC and normal adjacent
tissues to verify the results. It was found that OLA1 protein
expression levels were markedly higher in stage I (n=98), stage II
(n=12) and stage III (n=8) tissues compared with that of normal
adjacent tissues (n=13) (all, P<0.001; Fig. 1C). Taken together, these results
suggest that OLA1 expression is strongly associated with EC
progression.
Associations between clinical
characteristics and OLA1 expression in the TCGA cohort
In TCGA cohort, the median age at the time of
diagnosis was 66 years (range, 31–90 years). The median follow-up
time was 33.01 months, and 87 patients died during the follow-up
period. Clinical stage, histological grade, histological type,
cancer status, body mass index (BMI), surgical approach, lymph node
metastasis, menopause status and distant metastasis data in the
cohort are shown in Table II. In
the cohort, the histological grade included G1 (18%; n=92), G2
(22.7%; n=116), G3 (57.1%; n=291) and high-grade (2.2%; n=11). FIGO
stage included stage I (61.6%; n=314), stage II (9.4%; n=48), stage
III (23.5%; n=120) and stage IV (5.5%; n=28). Of the histological
types in the cohort, endometrioid endometrial adenocarcinoma was
found to be the most common (75.1%; n=383), and other types
included mixed serous and endometrioid adenocarcinoma (4.3%; n=22)
and serous endometrial adenocarcinoma (20.6%; n=105). Menopause
status included 413 (89%) post-menopause (prior bilateral
ovariectomy or >12 months since last menstrual period with no
prior hysterectomy), 17 (3.7%) peri-menopause (6–12 months since
last menstrual period) and 34 (7.3%) pre-menopause (<6 months
since last menstrual period and no prior bilateral ovariectomy nor
estrogen replacement). Cancer status included 412 patients who were
tumor-free (84.3%) and 78 patients with tumors (15.7%). There were
60.7% who adopted an open surgical approach and 39.3% who adopted a
minimally invasive surgical approach. Of 338 cases, 68 (20.1%) had
lymph node metastasis and 28 (5.5%) had distant metastasis.
Upregulated OLA1 expression levels were found to be associated with
FIGO stage, histological type, histological grade, menopause
status, distant metastasis and cancer status (all P<0.05;
Fig. 2A-F). Univariate logistic
regression showed that high OLA1 expression levels were associated
with clinical stage (I vs. II, I vs. IV), histological grade (G1
vs. G2, G1 vs. G3), histological type (EEA vs. SEA), cancer status,
lymph node metastasis and distant metastasis in EC (Table III). Collectively, these results
suggest that OLA1 expression is associated with clinical
characteristics in TCGA cohort.
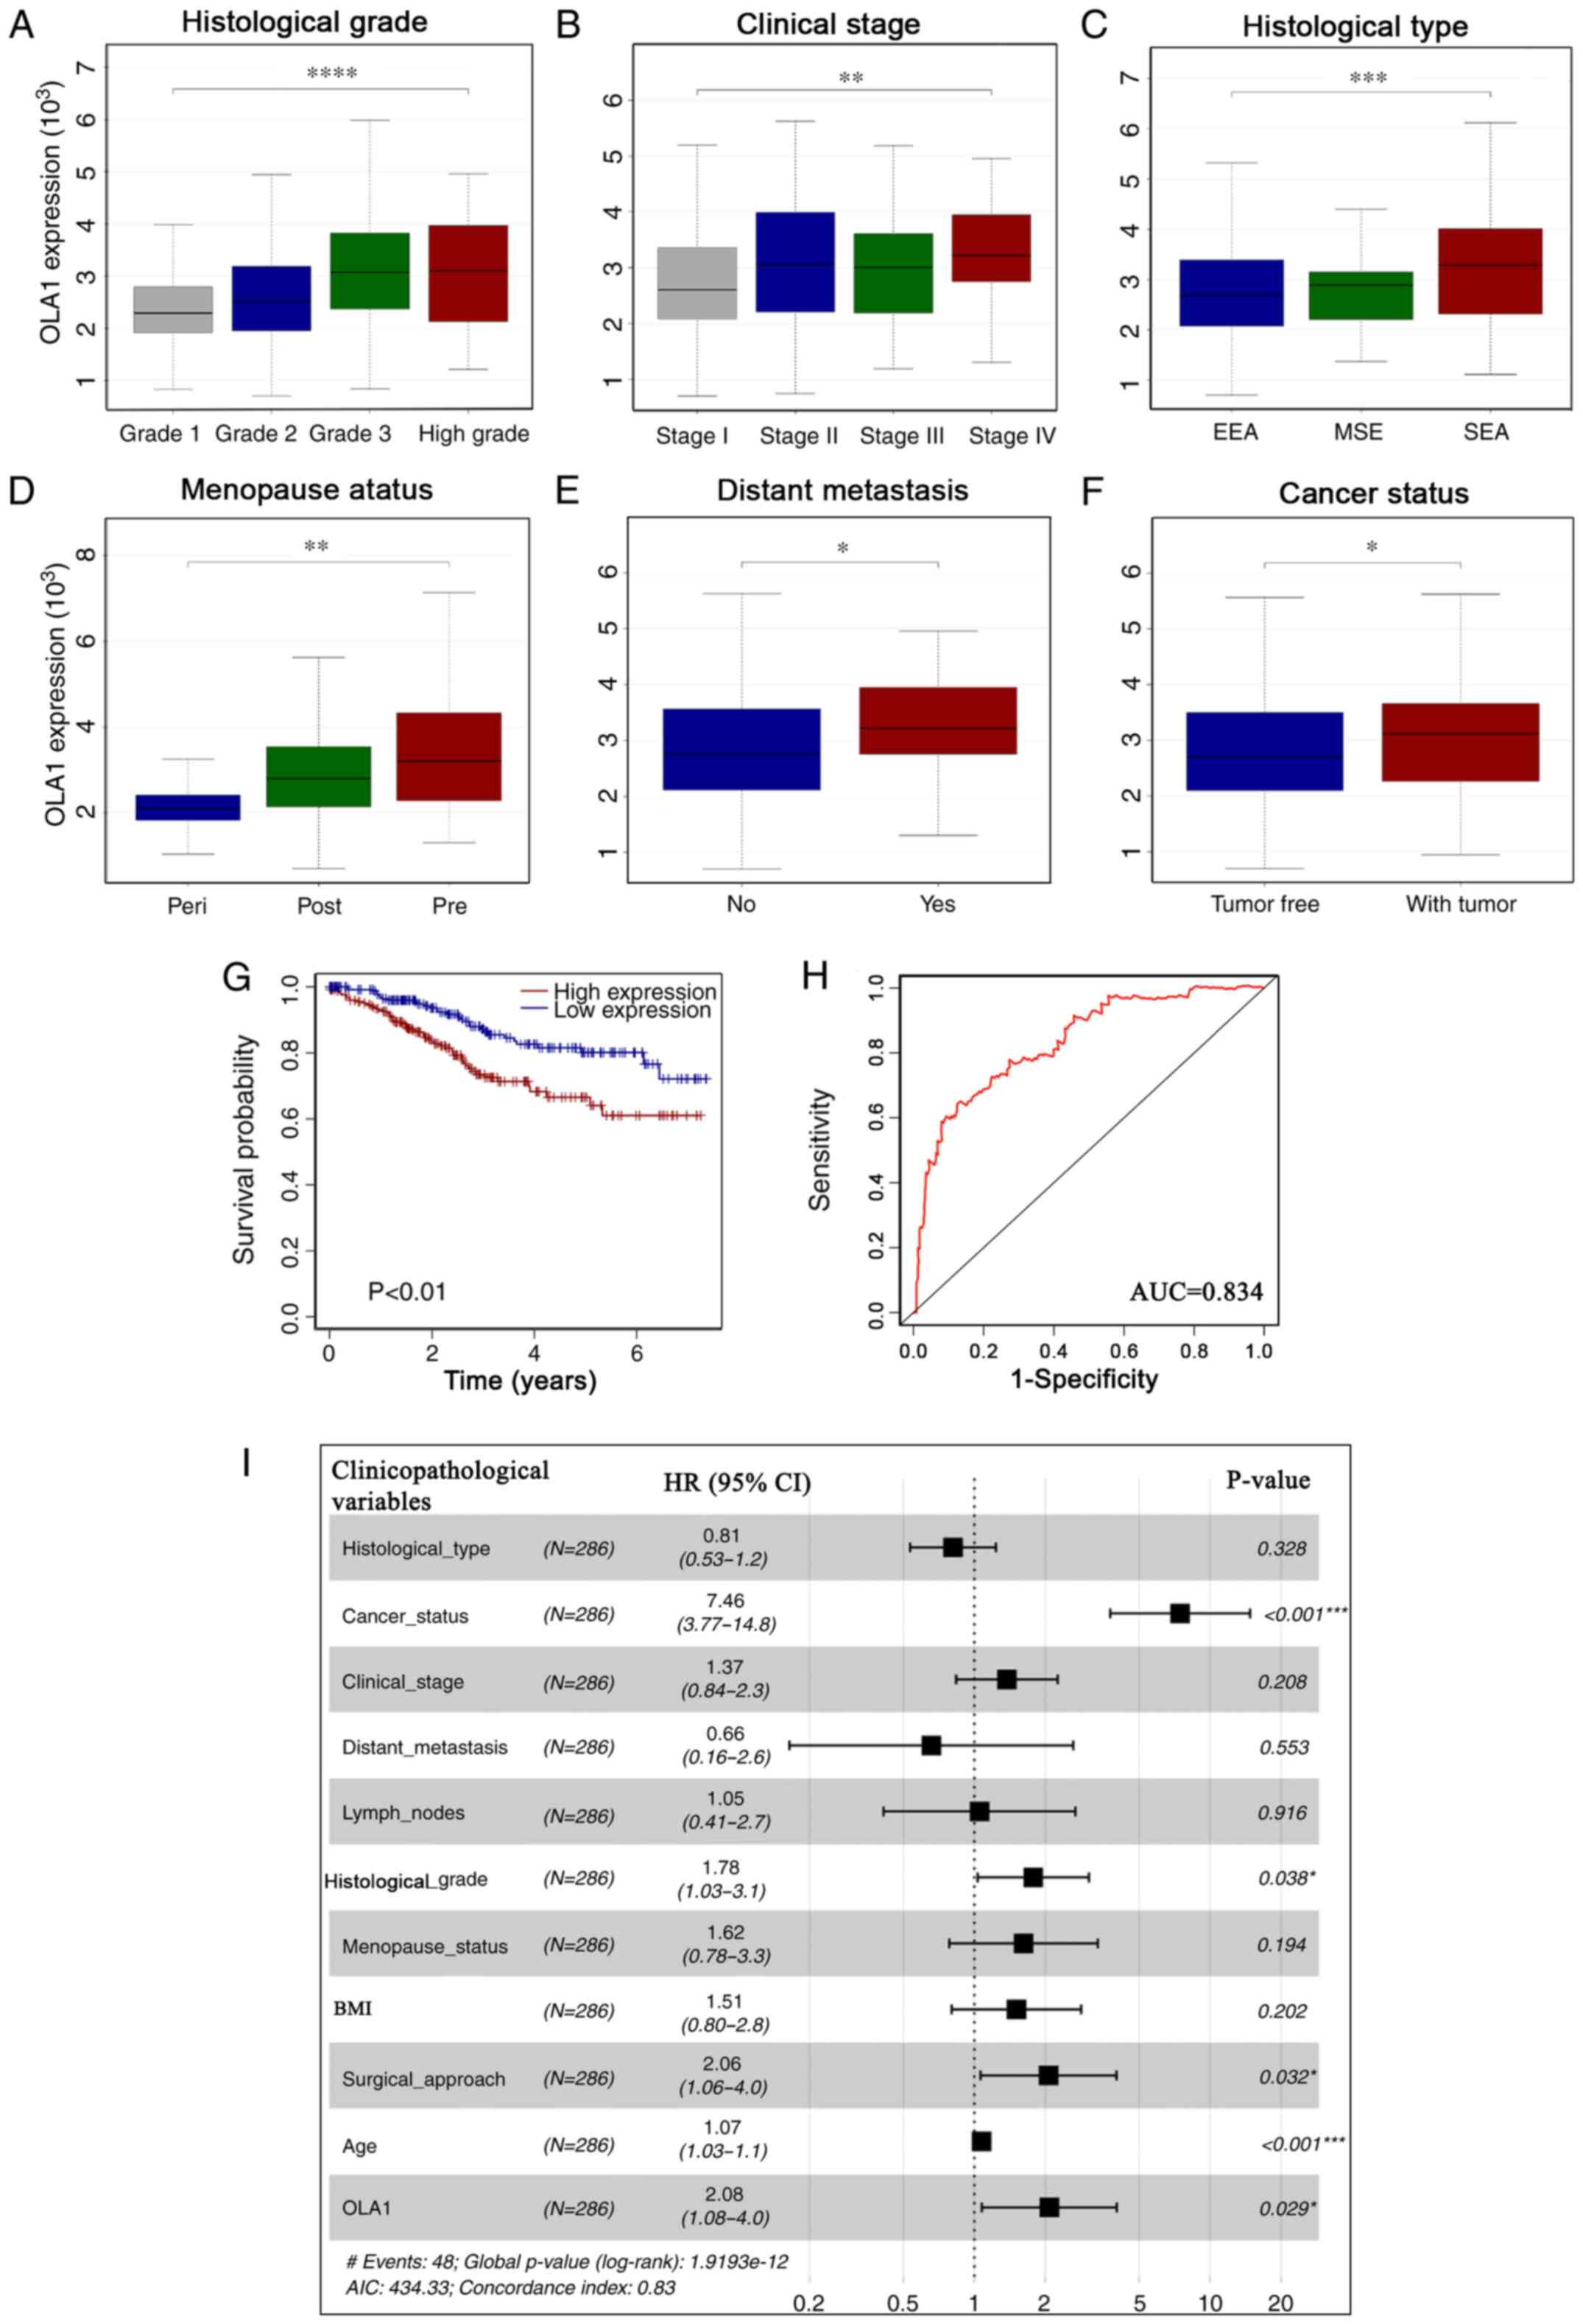 | Figure 2.Clinicopathological features of OLA1
expression. OLA1 expression upregulation was associated with
clinicopathological characteristics, including (A) histological
grade, (B) clinical stage, (C) histological type, (D) menopause
status, (E) distant metastasis and (F) cancer status. (G)
Kaplan-Meier survival analysis of patients with endometrial cancer
from The Cancer Genome Atlas cohort based on OLA1 expression. (H)
Receiver operating characteristic curves for Cox analysis.
Variables included histological grade, clinical stage, histological
type, menopause status, distant metastasis, body mass index,
surgical approach and OLA1 expression. (I) Multivariate survival
analysis of the clinicopathological characteristics of patients
with EC. *P<0.05, **P<0.01, ***P<0.001 and
****P<0.0001. OLA1, Obg-like ATPase 1; EC, endometrial cancer;
AUC, area under the curve; BMI, body mass index. |
| Table III.OLA1 expression associated with
clinicopathological characteristics (logistic regression). |
Table III.
OLA1 expression associated with
clinicopathological characteristics (logistic regression).
| Clinical
characteristics | Total, n | Odds ratio in OLA1
expression (95% CI) | P-value |
|---|
| Age,
continuous | 509 | 1.01
(0.99–1.02) | 0.479 |
| Clinical stage
(FIGO) |
|
|
|
| I vs.
II | 362 | 2.1
(1.13–3.99) | 0.020 |
| I vs.
III | 434 | 1.49
(0.98–2.28) | 0.065 |
| I vs.
IV | 342 | 3.78
(1.63–9.82) | 0.003 |
| Histological
grade |
|
|
|
| G1 vs.
G2 | 208 | 2.19
(1.22–4.04) | 0.010 |
| G1 vs.
G3 | 383 | 4.66
(2.79–8.03) | <0.001 |
| G1 vs.
high-grade | 103 | 3.60
(1.00–13.58) | 0.493 |
| Histological
type |
|
|
|
| EEA vs.
MSE | 405 | 1.79
(0.75–4.43) | 0.191 |
| EEA vs.
SEA | 488 | 2.59
(1.65–4.12) | <0.001 |
| Cancer
status, tumor-free vs. with tumor | 490 | 1.99
(1.21–3.32) | 0.007 |
| Menopause
status |
|
|
|
| Post
vs. Peri | 430 | 0.21
(0.05–0.66) | 0.016 |
| Post
vs. Pre | 447 | 1.59
(0.79–3.34) | 0.204 |
| Body mass index,
<29.9 vs. ≥29.9 | 484 | 1.47
(1.02–2.11) | 0.041 |
| Surgical approach,
open vs. mini-invasive | 488 | 1.46
(1.02–2.11) | 0.042 |
| Lymph nodes,
negative vs. positive | 338 | 1.82
(1.06–3.17) | 0.031 |
| Distant metastasis,
negative vs. positive | 510 | 3.18
(1.39–8.20) | 0.009 |
Prognostic significance of OLA1
expression
To evaluate the prognostic significance of OLA1 in
EC, the relationship between OLA1 expression and survival time was
analyzed. Kaplan-Meier analysis showed that high OLA1 expression
had poorer overall survival (OS) time compared with the low OLA1
expression group (P<0.001; Fig.
2G). Univariate Cox regression analysis showed that age, OLA1
expression, distant metastasis, lymph node metastasis, cancer
status, histological grade, histological type and clinical stage
were associated with EC prognosis in terms of OS time (all
P<0.05; Table IV). Moreover,
multivariate analysis revealed that OLA1 expression remained
independently associated with OS time (hazard ratio=2.08;
P<0.05; Fig. 2I), along with
cancer status, histological grade and surgical approach (all,
P<0.05; Fig. 2I; Table IV). The AUC was 0.834, reflecting
that the prognostic marker model had high sensitivity and
specificity in predicting patient survival status (Fig. 2H). Taken together, these results
suggest that high OLA1 expression can predict poor survival of
patients.
| Table IV.Associations with overall survival
and clinicopathological characteristics in patients from The Cancer
Genome Atlas using univariate and multivariate cox regression
analysis. |
Table IV.
Associations with overall survival
and clinicopathological characteristics in patients from The Cancer
Genome Atlas using univariate and multivariate cox regression
analysis.
|
| Univariate
analysis | Multivariate
analysis |
|---|
|
|
|
|
|---|
| Clinicopathological
variables | HR (95% CI) | P-value | HR (95% CI) | P-value |
|---|
| Body mass index,
<29.9 vs. ≥29.9 | 0.98
(0.56–1.74) | 0.951 |
|
|
| Clinical stage
(FIGO), I vs. II vs. III vs. IV | 1.82
(1.41–2.35) | <0.001 |
|
|
| Histological
type | 1.68
(1.25–2.28) | 0.001 |
|
|
| Menopause status,
post vs. peri vs. pre | 0.83
(0.47–1.48) | 0.535 |
|
|
| Distant metastasis,
negative vs. positive | 3.33
(1.42–7.85) | 0.006 |
|
|
| Lymph nodes,
negative vs. positive | 3.17
(1.76–5.70) | <0.001 |
|
|
| Surgical approach,
open vs. mini invasive | 1.20
(0.67–2.16) | 0.543 |
|
|
| Age,
continuous | 1.04
(1.01–1.07) | 0.005 |
|
|
| Cancer status,
tumor free vs. with tumor | 7.13
(4.03–12.62) | <0.001 | 7.46
(3.77–14.77) | <0.001 |
| Histological grade,
G1 vs. G2 vs. G3 vs. high-grade | 2.46
(1.58–3.85) | <0.001 | 1.78
(1.03–3.06) | 0.038 |
| OLA1 expression,
low vs. high | 2.32
(1.27–4.23) | 0.006 | 2.08
(1.08–4.02) | 0.029 |
Knockdown of OLA1 expression
suppresses cell proliferation in EC
To explore the expression level of OLA1 in EC cells,
the RL95-2, Ishikawa, HEC-1B and HEC-1A cell lines were cultured,
then endogenous OLA1 expression levels were analyzed using RT-qPCR
and western blotting. The results suggested that the levels of OLA1
expression were higher in the RL95-2 and HEC-1B lines compared with
the Ishikawa and HEC-1A. Therefore, HEC-1B and RL95-2 lines were
selected for subsequent experiments (Fig. 3A and B). To characterize the effect
of OLA1 expression on EC cells, three siRNAs were designed to
specifically target OLA1 (siOLA1) to knockdown OLA1 expression. The
cells transfected with siOLA1-1 and siOLA1-3 were selected for
subsequent experiments due to their more efficient transfections
(Fig. 3C and D).
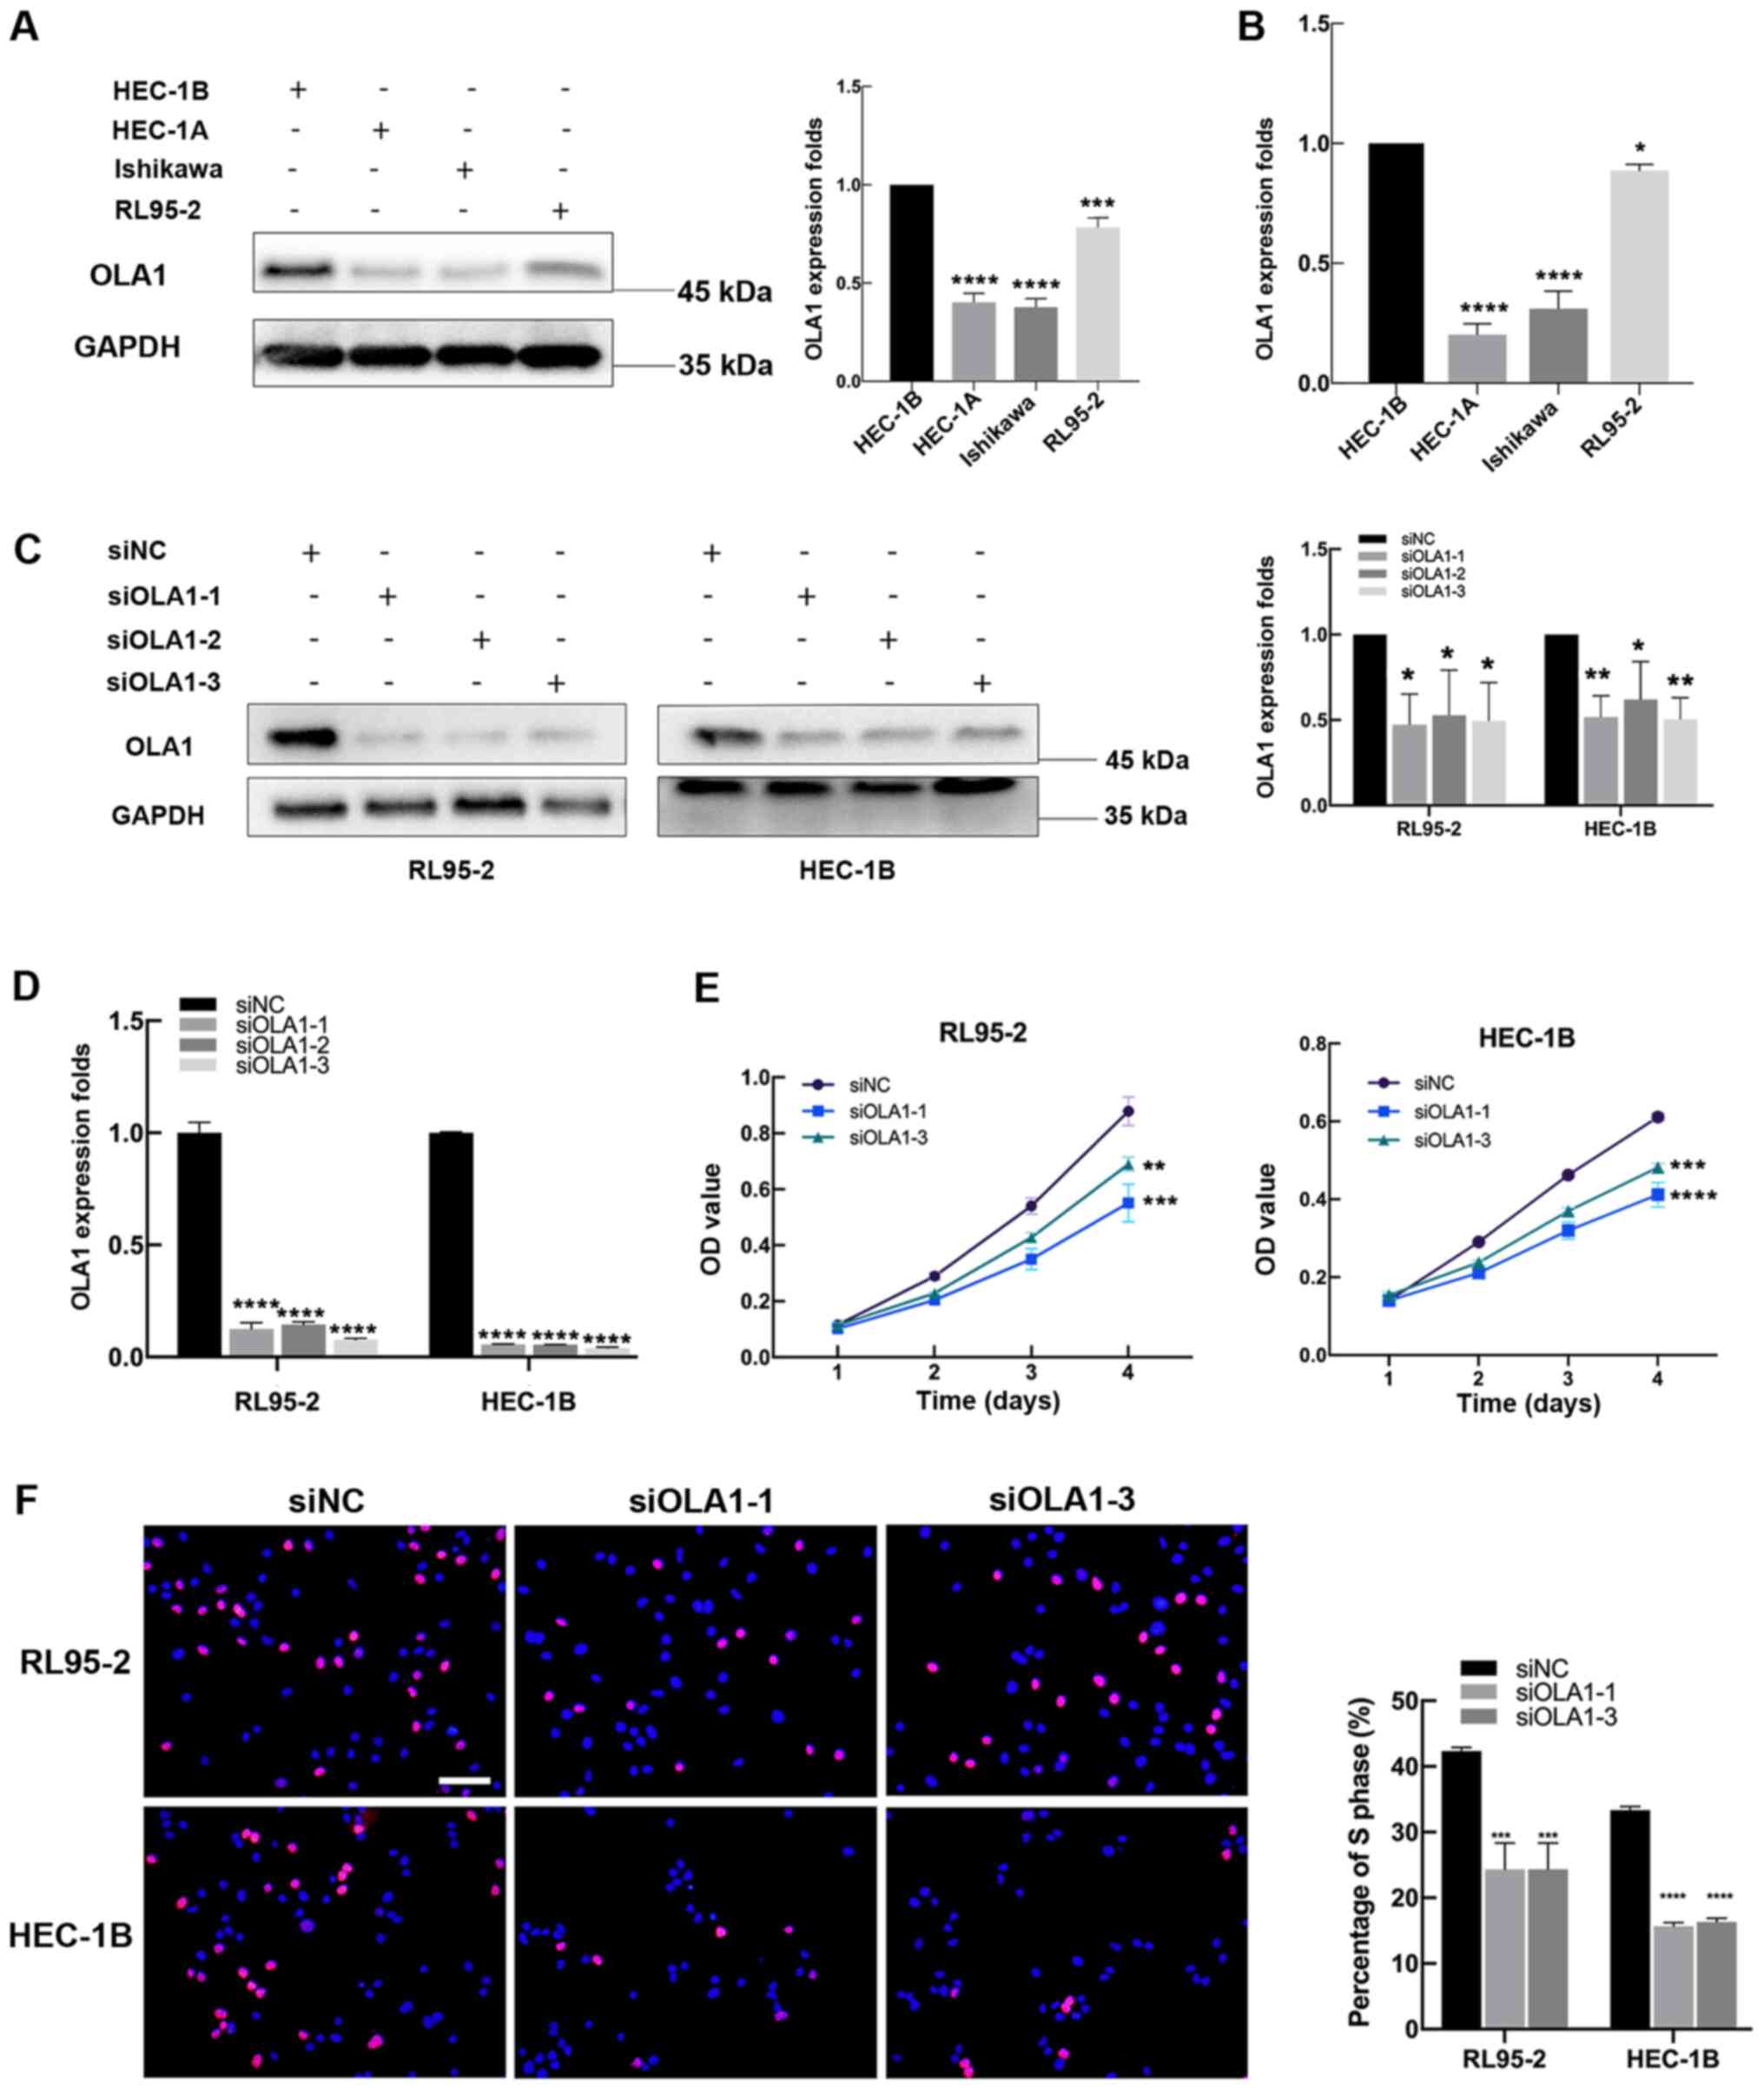 | Figure 3.Decreased OLA1 expression inhibits
endometrial cancer cell proliferation. (A) Western blot analysis
and (B) RT-qPCR showed that OLA1 was highly expressed in the RL95-2
and HEC-1B cell lines. RL95-2 and HEC-1B cells were transfected
with siNC, siOLA1-1, siOLA1-2 and siOLA1-3 for 48 h or 72 h and
then analyzed by (C) western blot analysis (left panel),
densitometry analysis (right panel) and (D) RT-qPCR. (E) Cell
Counting Kit-8 assays and (F) 5-ethynyl-2′-deoxyuridine
incorporation assays of RL95-2 and HEC-1B cells were performed
after transfection with siNC, siOLA1-1 and siOLA1-3 (scale bar, 400
µm). *P<0.05, **P<0.01, ***P<0.001 and ****P<0.0001
compared with HEC-1B or siNC. OLA1, Obg-like ATPase 1; RT-qPCR,
reverse transcription-quantitative PCR; si-, short interfering; NC,
negative control. |
CCK-8 assays showed that cells transfected with
siOLA1-1 and siOLA1-3 had a significantly decreased proliferative
capacity (P<0.01; Fig. 3E), while
OLA1-overexpression enhanced cell proliferation (P<0.01;
Fig. S1). EdU incorporation assays
revealed that there were fewer cells that had been transfected with
OLA1 siRNAs in the S phase compared with cells transfected with the
siNC, suggesting that endogenous OLA1 promotes EC cell
proliferation (Fig. 3F).
Collectively, these results suggest that low OLA1 expression
suppresses EC cell proliferation.
Decreased OLA1 expression inhibits
tumor migration and invasion in EC
To identify the effect of OLA1 on the migration and
invasion of EC cells, wound healing, Transwell and Boyden assays
were performed. Wound healing ability was significantly reduced in
the siOLA1-1 and siOLA1-3 groups compared with the siNC group in
both the RL95-2 and HEC-1B lines (all P<0.05 Fig. 4A). In addition, the Transwell and
Boyden assays showed that cell migration and invasion ability was
reduced in the siOLA1 groups compared with the siNC cells (all
P<0.05 Fig. 4B and C). The
results suggested that knockdown of endogenous OLA1 inhibited EC
cell migration and invasion. The findings above decreased OLA1
expression inhibits tumor migration and invasion in EC.
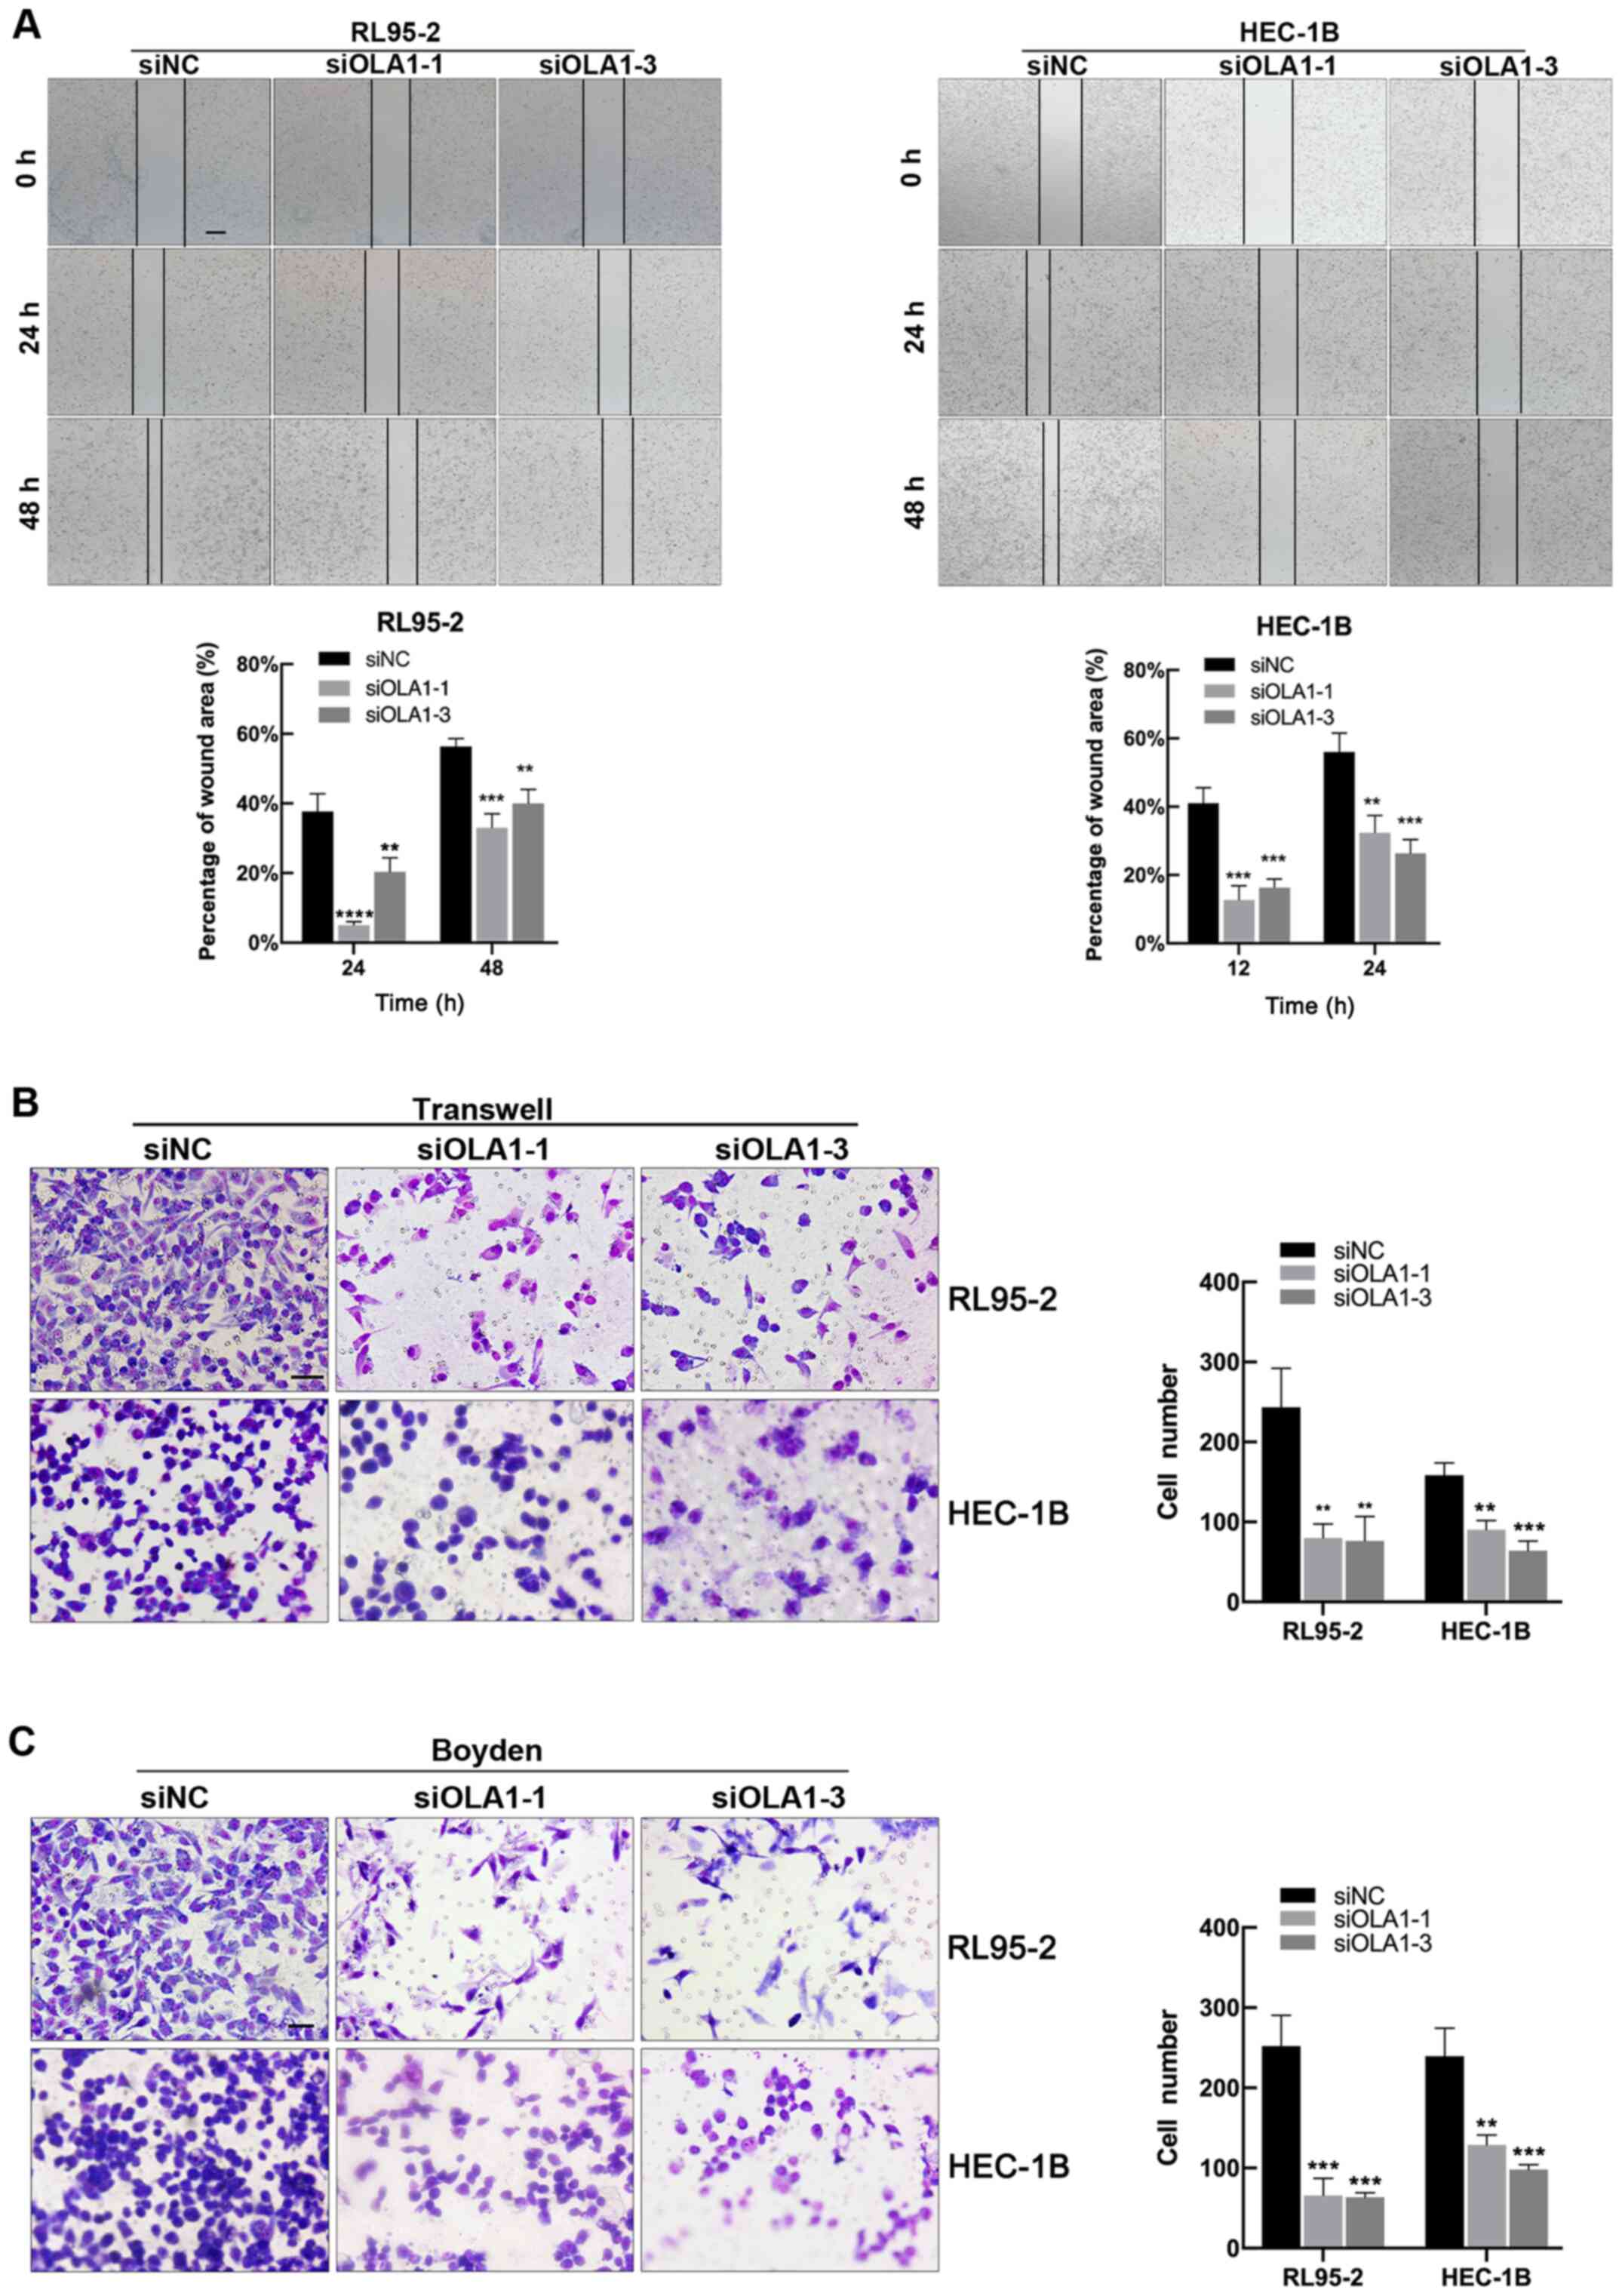 | Figure 4.Knockdown of OLA1 expression
suppresses endometrial cancer cell migration and invasion. (A)
wound healing assays (scale bar, 500 µm), (B) Migration assays
(scale bar in RL95-2, 800 µm; scale bar in HEC-1B, 400 µm) and (C)
invasion assays (scale bar in RL95-2, 800 µm; scale bar in HEC-1B,
400 µm) of the RL95-2 and HEC-1B cell lines were performed after
transfection with siNC, siOLA1-1 and siOLA1-3. **P<0.01,
***P<0.001 and ****P<0.0001 compared with siNC. OLA1,
Obg-like ATPase 1; si-, short interfering; NC, negative
control. |
Identification of OLA1-related
pathways in EC
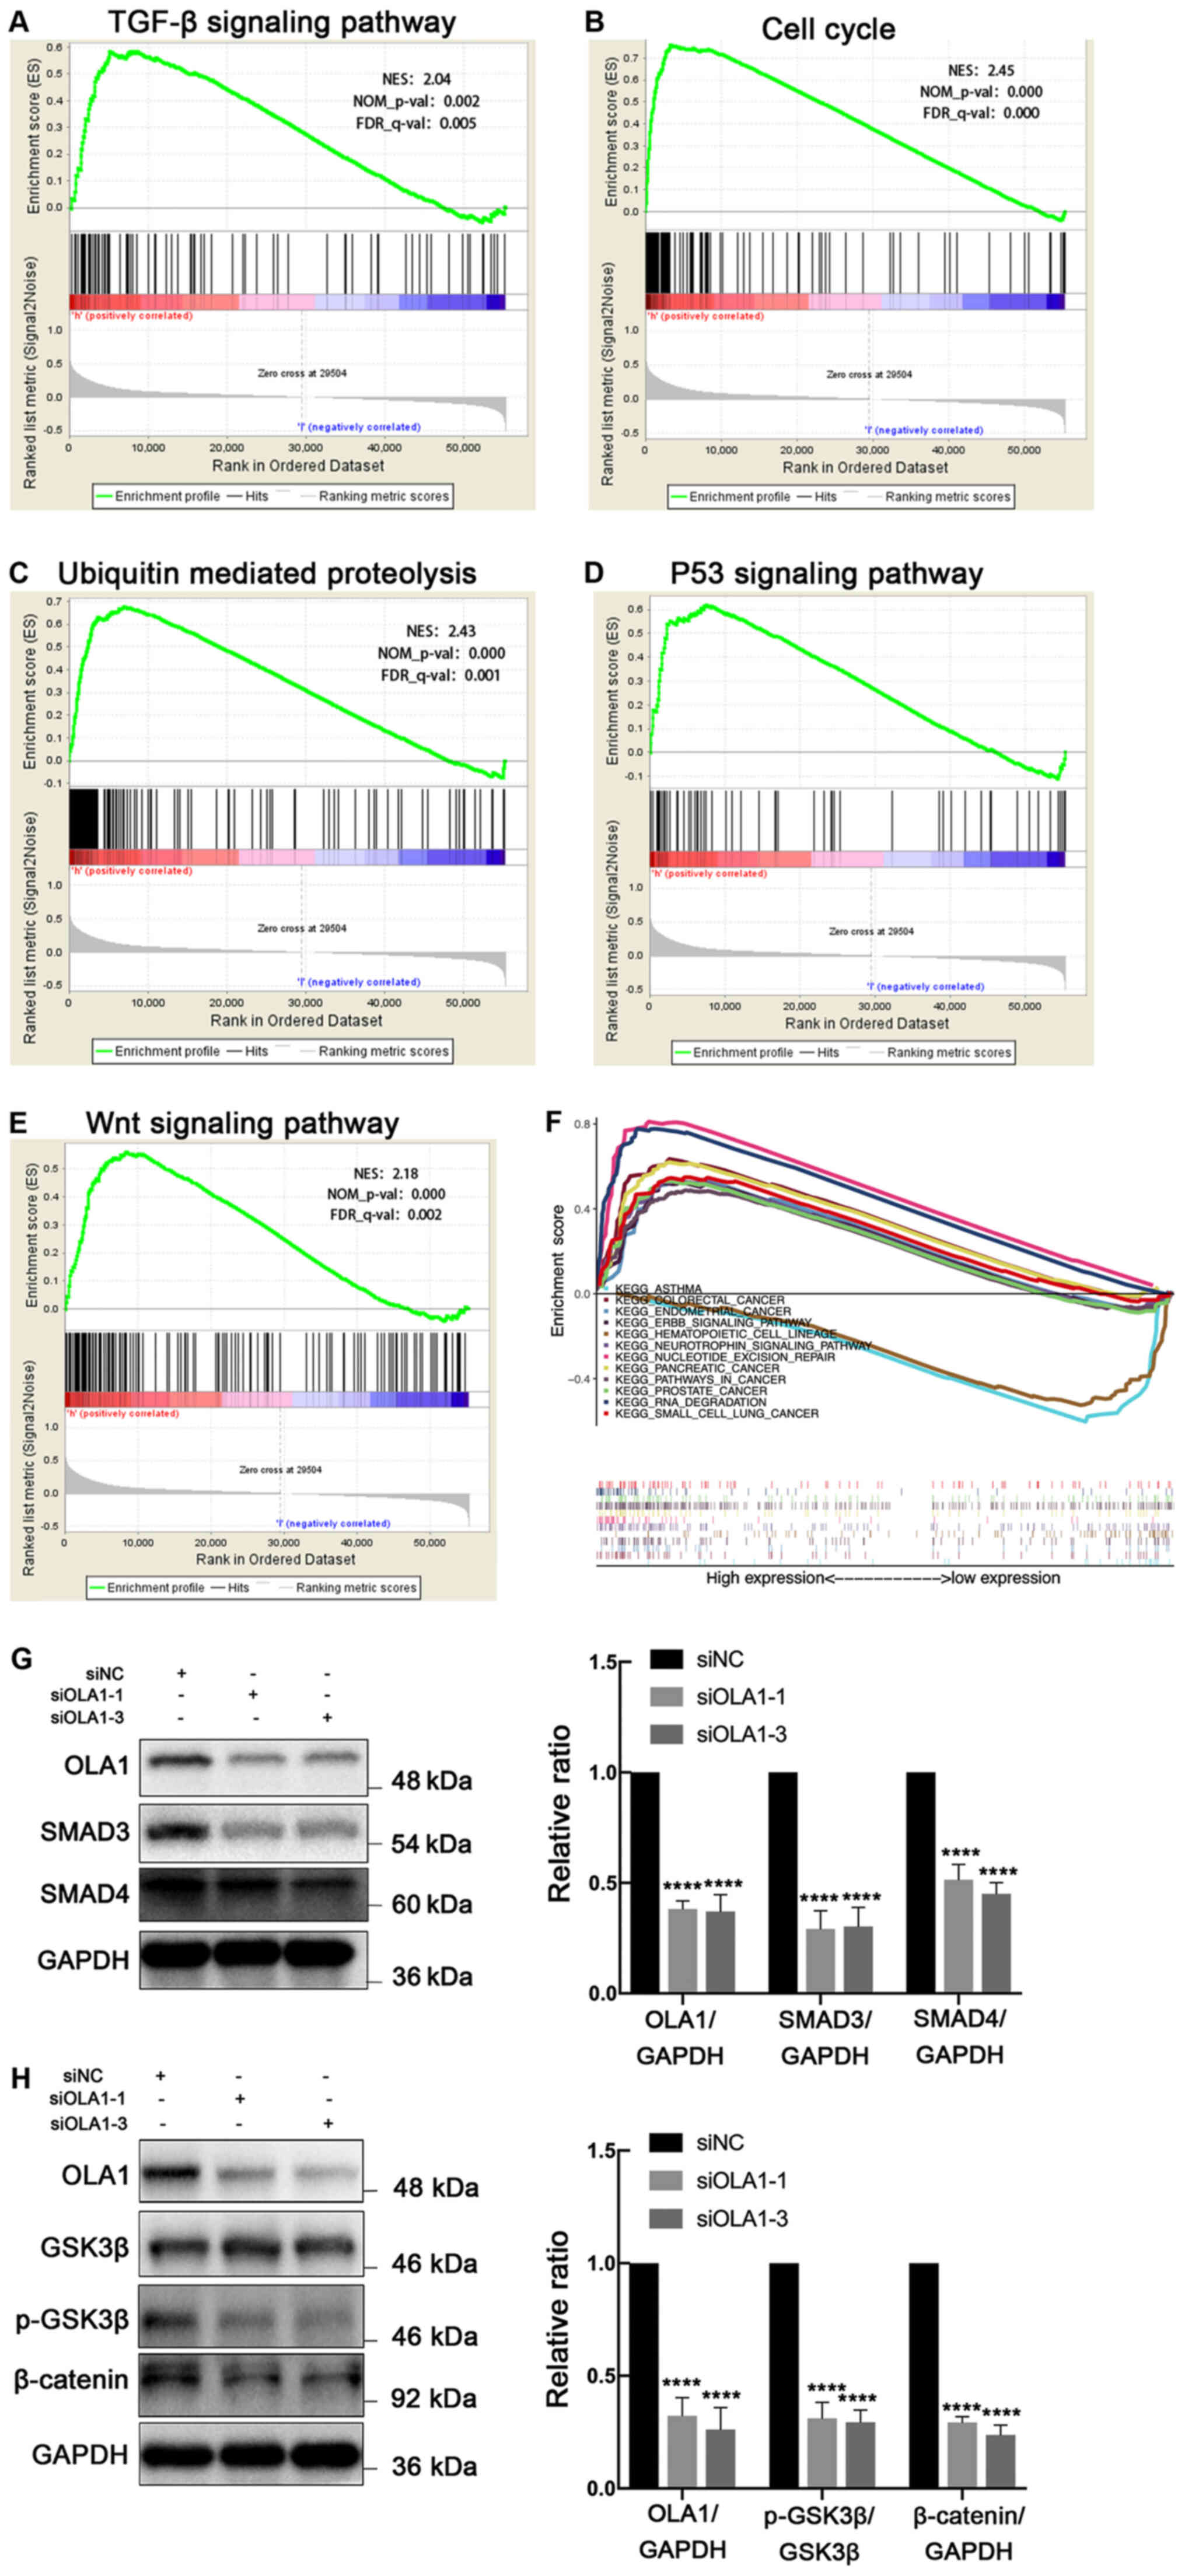
To investigate the potential OLA1-related mechanisms
in EC, GSEA was conducted between low and high OLA1 expression
datasets. GSEA suggested that high expression of OLA1 may be
involved in the ‘TGF-β signaling pathway’ (Fig. 5A), the ‘cell cycle; (Fig. 5B), ‘ubiquitin-mediated proteolysis’
(Fig. 5C), the ‘p53 signaling
pathway’ (Fig. 5D), the ‘Wnt
signaling pathway’ (Fig. 5E) and
other cancer-related pathways (Fig.
5F). Furthermore, it was found that knockdown of OLA1
significantly suppressed TGF-β signaling pathway marker proteins
(Smad 3 and 4), and Wnt/β-catenin signaling pathway marker
protenins (GSK3β, phosporylated-GSK3β and β-catenin) (Fig. 5G and H). Taken together, these
results suggest that the TGF-β and Wnt/β-catenin signaling pathways
may be important pathways regulated by OLA1 in EC.
Discussion
P-loop NTPases mediate numerous cellular processes,
such as signal translation, cell motility and cell proliferation
regulation (29,30). As a member of the Obg-related family,
OLA1 is overexpressed in multiple types of primary human cancer,
including cancer of the colon, rectum, ovary, lung, stomach and
uterus (21,22). In addition, OLA1 is implicated in the
regulation of tumor progression in numerous types of cancer,
including breast, lung and hepatocellular cancer (17,19,20).
However, the association between OLA1 expression and EC prognosis
remains elusive. Therefore, the present study aimed to
systematically elucidate the role played by OLA1 in EC progression
and whether OLA1 upregulation predicted poor prognosis.
The findings of the present study suggested that
OLA1 was upregulated in EC samples compared with normal samples in
the transcriptome profiling data from TCGA. Similarly,
immunohistochemical staining indicated that the expression levels
of OLA1 protein in EC tissues were significantly upregulated.
Furthermore, OLA1 expression levels were determined to be
associated with clinical features, including: i) Clinical stage;
ii) histological grade; iii) histological type; iv) menopause
status; v) distant metastasis; and vi) cancer status. Moreover, it
was found that OLA1-overexpression in patients with EC was
associated with poor OS time, and OLA1 served as an independent
prognostic factor. Additionally, it was determined that OLA1
promoted EC cell proliferation, migration and invasion. Taken
together, these results suggested that OLA1 functioned as a
potential oncogenic gene in EC and that OLA1 overexpression was a
predictor of poor prognosis.
The incidence of EC is highest in developed
countries, and its increasing mortality and incidence make it an
essential consideration in the field of women's health (31). Almost all risk stratification systems
for EC utilize a composite of clinical stage, histological type and
grade (32). In the present study,
univariate Cox regression analysis of TCGA data revealed that not
only were age, histological grade, histological type and clinical
stage associated with the OS time of patients with EC, but also
distant metastasis, lymph node metastasis and cancer status.
Collectively, these findings suggested that OLA1 may serve as a
potential therapeutic target in EC.
The results of the current study indicated that OLA1
was significantly involved in EC-related signaling pathways, such
as the ‘cell cycle’, the ‘Wnt signaling pathway’, the ‘p53
signaling pathway’, the ‘TGF-β signaling pathway and
‘ubiquitin-mediated proteolysis’. Ding et al (11) utilized a OLA1-knockout mouse model to
demonstrate that the lack of OLA1 in mouse embryos decreased cell
cycle progression, which is caused by p53 and p21 accumulation.
Consistent with these findings, the present study found that OLA1
may influence cell cycle progression in EC. Previous reports have
established the Wnt signaling pathway as a fundamental molecular
pathway, in addition to a cause of multiple tumor progression and
cell function regulation (32–34).
Furthermore, a previous study confirmed that in EC with catenin β-1
mutations, Wnt/β-catenin signaling activity was enhanced (35). The current study suggests that OLA1
may regulate EC progression via the Wnt signaling pathway.
Mutations in TGF-β signaling promotes tumor emergence, including
colorectal cancer, melanoma and hepatocellular carcinoma (36–38). The
findings of the present study supported the evidence that OLA1 may
regulate TGF-β signaling in EC.
The ubiquitin-mediated proteolysis pathway consists
of ubiquitin, ubiquitination target intracellular proteins, a
three-enzyme ubiquitination complex and proteasomes, which are
degradation organelles (39,40). A variety of oncogenes are the targets
of ubiquitination, and then regulate cancer progression (32,33). In
a recent study, OLA1 was recognized as a modular chaperone, binding
with HSP70 to protect it from c-terminus of Hsp70-interacting
protein-mediated ubiquitination and thereby inhibiting the
proteolytic degradation of HSP70 (14). The findings of the present study
showed that the ubiquitin-mediated proteolysis pathway may have a
key role in EC progression. Further studies to explore the
association between OLA1 expression and ubiquitination machinery in
EC are needed.
In conclusion, the present study revealed that OLA1
acted as an oncogene in EC. Notably, it was found that high OLA1
expression levels were associated with a poorer prognosis compared
with low OLA1 expression levels. Moreover, OLA1 overexpression
promoted EC cell proliferation, migration and invasion, while the
TGF-β, Wnt and ubiquitin-mediated proteolysis pathways may be the
key pathways. This evidence suggested that OLA1 expression levels
may be a potential prognostic marker in EC cases and that OLA1 may
serve as a promising therapeutic target for EC treatment.
Supplementary Material
Supporting Data
Acknowledgements
Not applicable.
Funding
The present study was funded by The Nature Science
Fund of Guangdong Province (grant no. 2015A030313240) and The
Medical Research Fund of Guangdong Province (grant no.
A2015467).
Availability of data and materials
The datasets used and/or analyzed during the current
study are available from the corresponding author upon reasonable
request.
Authors' contributions
YD, AY and CX performed the experiments. HJ, WW, QW
and SG designed the present study. YD, CX and AY performed the
statistical analysis. YD, CX, LC and SG drafted the initial
manuscript. YD and SG confirmed the authenticity of all the raw
data. SG supervised the present study. All authors have read and
approved the final manuscript.
Ethics approval and consent to
participate
Not applicable.
Patient consent for publication
Not applicable.
Competing interests
The authors declare that they have no competing
interests.
References
|
1
|
Siegel RL, Miller KD and Jemal A: Cancer
statistics, 2020. CA Cancer J Clin. 70:7–30. 2020. View Article : Google Scholar : PubMed/NCBI
|
|
2
|
Siegel RL, Miller KD, Fuchs HE and Jemal
A: Cancer statistics, 2021. CA Cancer J Clin. 71:7–33. 2021.
View Article : Google Scholar : PubMed/NCBI
|
|
3
|
Lortet-Tieulent J, Ferlay J, Bray F and
Jemal A: International patterns and trends in endometrial cancer
incidence, 1978–2013. J Natl Cancer Inst. 110:354–361. 2018.
View Article : Google Scholar : PubMed/NCBI
|
|
4
|
Connor EV and Rose PG: Management
strategies for recurrent endometrial cancer. Expert Rev Anticancer
Ther. 18:873–885. 2018. View Article : Google Scholar : PubMed/NCBI
|
|
5
|
Hamilton CA, Cheung MK, Osann K, Chen L,
Teng NN, Longacre TA, Powell MA, Hendrickson MR, Kapp DS and Chan
JK: Uterine papillary serous and clear cell carcinomas predict for
poorer survival compared to grade 3 endometrioid corpus cancers. Br
J Cancer. 94:642–646. 2006. View Article : Google Scholar : PubMed/NCBI
|
|
6
|
Morice P, Leary A, Creutzberg C,
Abu-Rustum N and Darai E: Endometrial cancer. Lancet.
387:1094–1108. 2016. View Article : Google Scholar : PubMed/NCBI
|
|
7
|
Janda M, Gebski V, Brand A, Hogg R,
Jobling TW, Land R, Manolitsas T, McCartney A, Nascimento M,
Neesham D, et al: Quality of life after total laparoscopic
hysterectomy versus total abdominal hysterectomy for stage I
endometrial cancer (LACE): A randomised trial. Lancet Oncol.
11:772–780. 2010. View Article : Google Scholar : PubMed/NCBI
|
|
8
|
Neri M, Peiretti M, Melis GB, Piras B,
Vallerino V, Paoletti AM, Madeddu C, Scartozzi M and Mais V:
Systemic therapy for the treatment of endometrial cancer. Expert
Opin Pharmacother. 20:2019–2032. 2019. View Article : Google Scholar : PubMed/NCBI
|
|
9
|
Brooks RA, Fleming GF, Lastra RR, Lee NK,
Moroney JW, Son CH, Tatebe K and Veneris JL: Current
recommendations and recent progress in endometrial cancer. CA
Cancer J Clin. 69:258–279. 2019.PubMed/NCBI
|
|
10
|
Leipe DD, Koonin EV and Aravind L:
Evolution and classification of P-loop kinases and related
proteins. J Mol Biol. 333:781–815. 2003. View Article : Google Scholar : PubMed/NCBI
|
|
11
|
Ding Z, Liu Y, Rubio V, He J, Minze LJ and
Shi ZZ: OLA1, a translational regulator of p21, maintains optimal
cell proliferation necessary for developmental progression. Mol
Cell Biol. 36:2568–2582. 2016. View Article : Google Scholar : PubMed/NCBI
|
|
12
|
Zhang J, Rubio V, Lieberman MW and Shi ZZ:
OLA1, an Obg-like ATPase, suppresses antioxidant response via
nontranscriptional mechanisms. Proc Natl Acad Sci USA.
106:15356–15361. 2009. View Article : Google Scholar : PubMed/NCBI
|
|
13
|
Jeyabal PV, Rubio V, Chen H, Zhang J and
Shi ZZ: Regulation of cell-matrix adhesion by OLA1, the Obg-like
ATPase 1. Biochem Biophys Res Commun. 444:568–574. 2014. View Article : Google Scholar : PubMed/NCBI
|
|
14
|
Mao RF, Rubio V, Chen H, Bai L, Mansour OC
and Shi ZZ: OLA1 protects cells in heat shock by stabilizing HSP70.
Cell Death Dis. 4:e4912013. View Article : Google Scholar : PubMed/NCBI
|
|
15
|
Rosenzweig R, Nillegoda NB, Mayer MP and
Bukau B: The Hsp70 chaperone network. Nat Rev Mol Cell Biol.
20:665–680. 2019. View Article : Google Scholar : PubMed/NCBI
|
|
16
|
Schultz A, Olorundami OA, Teng RJ,
Jarzembowski J, Shi ZZ, Kumar SN, Pritchard K Jr, Konduri GG and
Afolayan AJ: Decreased OLA1 (Obg-Like ATPase-1) expression drives
ubiquitin-proteasome pathways to downregulate mitochondrial SOD2
(superoxide dismutase) in persistent pulmonary hypertension of the
newborn. Hypertension. 74:957–966. 2019. View Article : Google Scholar : PubMed/NCBI
|
|
17
|
Bai L, Yu Z, Zhang J, Yuan S, Liao C,
Jeyabal PV, Rubio V, Chen H, Li Y and Shi ZZ: OLA1 contributes to
epithelial-mesenchymal transition in lung cancer by modulating the
GSK3β/snail/E-cadherin signaling. Oncotarget. 7:10402–10413. 2016.
View Article : Google Scholar : PubMed/NCBI
|
|
18
|
Zhang JW, Rubio V, Zheng S and Shi ZZ:
Knockdown of OLA1, a regulator of oxidative stress response,
inhibits motility and invasion of breast cancer cells. J Zhejiang
Univ Sci B. 10:796–804. 2009. View Article : Google Scholar : PubMed/NCBI
|
|
19
|
Liu J, Miao X, Xiao B, Huang J, Tao X,
Zhang J, Zhao H, Pan Y, Wang H, Gao G and Xiao GG: Obg-like ATPase
1 enhances chemoresistance of breast cancer via activation of
TGF-β/Smad axis cascades. Front Pharmacol. 11:6662020. View Article : Google Scholar : PubMed/NCBI
|
|
20
|
Yoshino Y, Qi H, Fujita H, Shirota M, Abe
S, Komiyama Y, Shindo K, Nakayama M, Matsuzawa A, Kobayashi A, et
al: BRCA1-interacting protein OLA1 requires interaction with BARD1
to regulate centrosome number. Mol Cancer Res. 16:1499–1511. 2018.
View Article : Google Scholar : PubMed/NCBI
|
|
21
|
Matsuzawa A, Kanno S, Nakayama M,
Mochiduki H, Wei L, Shimaoka T, Furukawa Y, Kato K, Shibata S,
Yasui A, et al: The BRCA1/BARD1-interacting protein OLA1 functions
in centrosome regulation. Mol Cell. 53:101–114. 2014. View Article : Google Scholar : PubMed/NCBI
|
|
22
|
Takahashi M, Chiba N, Shimodaira H,
Yoshino Y, Mori T, Sumii M, Nomizu T and Ishioka C: OLA1 gene
sequencing in patients with BRCA1/2 mutation-negative suspected
hereditary breast and ovarian cancer. Breast Cancer. 24:336–340.
2017. View Article : Google Scholar : PubMed/NCBI
|
|
23
|
Li Y, Liang L, Dai W, Cai G, Xu Y, Li X,
Li Q and Cai S: Prognostic impact of programed cell death-1 (PD-1)
and PD-ligand 1 (PD-L1) expression in cancer cells and tumor
infiltrating lymphocytes in colorectal cancer. Mol Cancer.
15:552016. View Article : Google Scholar : PubMed/NCBI
|
|
24
|
Guo S, Xiao Y, Li D, Jiang Q, Zhu L, Lin
D, Jiang H, Chen W, Wang L, Liu C, et al: PGK1 and GRP78
overexpression correlates with clinical significance and poor
prognosis in Chinese endometrial cancer patients. Oncotarget.
9:680–690. 2017. View Article : Google Scholar : PubMed/NCBI
|
|
25
|
Zhang YF, Xu QX, Liao LD, Xu XE, Wu JY,
Shen J, Wu ZY, Shen JH, Li EM and Xu LY: κ-Opioid receptor in the
nucleus is a novel prognostic factor of esophageal squamous cell
carcinoma. Hum Pathol. 44:1756–1765. 2013. View Article : Google Scholar : PubMed/NCBI
|
|
26
|
Xiao YY, Lin L, Li YH, Jiang HP, Zhu LT,
Deng YR, Lin D, Chen W, Zeng CY, Wang LJ, et al: ZEB1 promotes
invasion and metastasis of endometrial cancer by interacting with
HDGF and inducing its transcription. Am J Cancer Res. 9:2314–2330.
2019.PubMed/NCBI
|
|
27
|
Livak KJ and Schmittgen TD: Analysis of
relative gene expression data using real-time quantitative PCR and
the 2(-Delta Delta C(T)) method. Methods. 25:402–408. 2001.
View Article : Google Scholar : PubMed/NCBI
|
|
28
|
R Core Team: R: A language and environment
for statistical computing. R Foundation for Statistical Computing;
Vienna, Austria: 2012
|
|
29
|
Chigri F, Sippel C, Kolb M and Vothknecht
UC: Arabidopsis OBG-like GTPase (AtOBGL) is localized in
chloroplasts and has an essential function in embryo development.
Mol Plant. 2:1373–1383. 2009. View Article : Google Scholar : PubMed/NCBI
|
|
30
|
Maiti P, Kim HJ, Tu YT and Barrientos A:
Human GTPBP10 is required for mitoribosome maturation. Nucleic
Acids Res. 46:11423–11437. 2018.PubMed/NCBI
|
|
31
|
Urick ME and Bell DW: Clinical
actionability of molecular targets in endometrial cancer. Nat Rev
Cancer. 19:510–521. 2019. View Article : Google Scholar : PubMed/NCBI
|
|
32
|
de Boer SM, Powell ME, Mileshkin L,
Katsaros D, Bessette P, Haie-Meder C, Ottevanger PB, Ledermann JA,
Khaw P, Colombo A, et al: Adjuvant chemoradiotherapy versus
radiotherapy alone for women with high-risk endometrial cancer
(PORTEC-3): Final results of an international, open-label,
multicentre, randomised, phase 3 trial. Lancet Oncol. 19:295–309.
2018. View Article : Google Scholar : PubMed/NCBI
|
|
33
|
Flanagan DJ, Vincan E and Phesse TJ: Wnt
signaling in cancer: Not a binary ON:OFF switch. Cancer Res.
79:5901–5906. 2019. View Article : Google Scholar : PubMed/NCBI
|
|
34
|
Kaemmerer E, Jeon MK, Berndt A, Liedtke C
and Gassler N: Targeting Wnt signaling via notch in intestinal
carcinogenesis. Cancers (Basel). 11:5552019. View Article : Google Scholar : PubMed/NCBI
|
|
35
|
Nusse R and Clevers H: Wnt/β-catenin
signaling, disease, and emerging therapeutic modalities. Cell.
169:985–999. 2017. View Article : Google Scholar : PubMed/NCBI
|
|
36
|
Wang HX, Sharma C, Knoblich K, Granter SR
and Hemler ME: EWI-2 negatively regulates TGF-β signaling leading
to altered melanoma growth and metastasis. Cell Res. 25:370–385.
2015. View Article : Google Scholar : PubMed/NCBI
|
|
37
|
Batlle E and Massagué J: Transforming
growth factor-β signaling in immunity and cancer. Immunity.
50:924–940. 2019. View Article : Google Scholar : PubMed/NCBI
|
|
38
|
Jung B, Staudacher JJ and Beauchamp D:
Transforming growth factor β superfamily signaling in development
of colorectal cancer. Gastroenterology. 152:36–52. 2017. View Article : Google Scholar : PubMed/NCBI
|
|
39
|
Hu C, Ni Z, Li BS, Yong X, Yang X, Zhang
JW, Zhang D, Qin Y, Jie MM, Dong H, et al: hTERT promotes the
invasion of gastric cancer cells by enhancing FOXO3a ubiquitination
and subsequent ITGB1 upregulation. Gut. 66:31–42. 2017. View Article : Google Scholar : PubMed/NCBI
|
|
40
|
Mani A and Gelmann EP: The
ubiquitin-proteasome pathway and its role in cancer. J Clin Oncol.
23:4776–4789. 2005. View Article : Google Scholar : PubMed/NCBI
|