Introduction
Glioma, the most common primary malignant brain
tumor in the central nervous system, is characterized by a high
degree of angiogenesis (1). Among
gliomas, glioblastoma (GBM) is the most malignant type, with a
median survival time of only 12–15 months (2,3).
Considerable heterogeneity exists among tumor cells, and the cell
types, gene expression patterns and cell proliferation potential
can vary (4). One type of tumor
cells, known as cancer stem cells, have the characteristics of stem
cells, which can proliferate indefinitely, produce tumor cells and
drive tumor progression, as well as having important effects on
tumor recurrence, metastasis and chemoradiotherapy resistance
(5). These cells in GBM are called
glioma stem cells (GSCs). GSCs have the potential for self-renewal
and multidirectional differentiation, and also promote tumor
angiogenesis, trigger immune escape and drive the occurrence and
development of GBM (6). These cells
are at the root of the continuous cell proliferation, high
invasion, infiltration, metastasis and treatment resistance
observed in GBM (7). Therefore,
therapies targeting GSCs have shown great potential and have been
at the forefront of GBM research. At present, although many
GSC-associated markers, such as CD133 and A2B5, and the signaling
pathways regulating the stemness of GSCs have been revealed
(8), the mechanism underlying the
continuous conversion of GSCs to GBM cells remains unclear.
The present study selected two gene microarrays from
the Gene Expression Omnibus (GEO) database to detect the mRNA
expression levels in GSCs and GBM cells and to analyze the
overlapping differentially expressed genes (DEGs) between the two
types of cells. Subsequently, the genes that may play an essential
role in the malignant progression of human GBM were obtained
through bioinformatics analysis. Next, several experiments were
performed to verify the effects of the selected gene on the
proliferation and migration of GBM cells. The current findings may
provide new insights for studying the association between GSCs and
GBM cells.
Materials and methods
Microarray data information
To analyze the differences between GSCs and GBM
cells, gene microarray data were obtained from GSE74304 (9) and GSE124145 (10) in the NCBI GEO database (http://www.ncbi.nlm.nih.gov/geo/). Both gene
profiles were from the GPL570 platform [(HG-U133_Plus_2) Affymetrix
Human Genome U133 Plus 2.0 Array], a typical array for detecting
mRNA expression levels. GSE74304 contained data from two
patient-derived GSC lines and corresponding GBM cell lines, and
GSE124145 contained data from two human GSC lines (X01 and X03),
one human GBM tissue and the GBM U251 cell line. Each sample
contained two or three replicates. Thus, a total of 10 GSC samples
and 12 GBM samples were available for experiments. Profiles filter
criteria were as follows: GPL570 platform, publication date between
2015 and 2019, no previous drug treatment and ≥500 DEGs.
Acquisition of DEGs
DEGs were identified using the GEO2R online tools
(https://www.ncbi.nlm.nih.gov/geo/geo2r) between two
GSC lines and two GBM cell lines in GSE74304, and two GSC lines and
GBM tissue or cell lines in GSE124145 with an adjusted P<0.05
and ǀlog (fold-change) FCǀ >2. Overlapping genes were obtained
by uploading the DEGs from the two datasets to Venn software online
(http://bioinformatics.psb.ugent.be/webtools/Venn/).
The DEGs with log FC >0 were considered as upregulated genes and
those with log FC <0 were considered as downregulated genes in
GSCs compared with in GBM cells.
Gene Ontology (GO) and Kyoto
Encyclopedia of Genes and Genomes (KEGG) pathway analysis
GO and KEGG pathway analysis was performed via the
DAVID website (https://david.ncifcrf.gov/) to identify significantly
enriched molecular functions, cellular components, biological
processes and biological pathways [P<0.05; enrichment score =
-lg (P-value)]
Protein-protein interaction (PPI) and
module analysis
PPI analysis among overlapping DEGs was performed
using the STRING database (https://string-db.org/), and network diagrams were
constructed via Cytoscape software (v3.6.1; http://www.cytoscape.org/) (maximum number of
interactors =0; confidence score ≥0.4). The hub genes were obtained
by module analysis with the Molecular Complex Detection (MCODE)
plugin in Cytoscape according to the following criteria: Node score
cut-off, 0.2; degree cut-off, 2; k-core, 2; MCODE scores, ≥5; and
maximum depth, 100.
Survival analysis
To validate the hub genes through survival analysis,
the GEPIA2 website (http://gepia2.cancer-pku.cn/#index) was used, an
online database for analysis of RNA expression levels, based on the
Genotype-Tissue Expression Projects and The Cancer Genome Atlas
(11). Kaplan-Meier survival curves
were analyzed using the log-rank test. Log-rank P-value, hazard
ratio (HR) and HR P-value are displayed in the figures.
Cell culture and transient
transfection
The U87 cell line (glioblastoma of unknown origin)
was purchased from the American Type Culture Collection
(ATCC® HTB14™). U87 cells were maintained in DMEM/F12
(Corning, Inc.) supplemented with 10% FBS (Gibco; Thermo Fisher
Scientific, Inc.) and 1% penicillin/streptomycin (Gibco; Thermo
Fisher Scientific, Inc.) and cultured at 37°C with 5%
CO2. GSCs were maintained in stem cell medium as
previously described (9,12,13).
After being cultured at 37°C in a humidified 5% CO2
incubator for 12 h, U87 cells were infected with negative control
lentivirus (GV341; empty vector) or prolyl 4-hydroxylase subunit α2
(P4HA2) overexpression lentivirus at a multiplicity of infection of
5 for 12–16 h. The virus was purchased from Shanghai GeneChem Co.,
Ltd. P4HA2 siRNA-1 (sense, 5′-GAACCAAGUACCAGGCAAUTT-3′ and
antisense, 5′-AUUGCCUGGUACUUGGUUCTT-3′), siRNA-2 (sense,
5′-GCAGCAUAUCACAGGGUUATT-3′ and antisense,
5′-UAACCCUGUGAUAUGCUGCTT-3′), siRNA-3 (sense,
5′-GCAAGUGGGUCUCCAAUAATT-3′ and antisense,
5′-UUAUUGGAGACCCACUUGCTT-3′) and scrambled negative control (sense,
5′-UUCUCCGAACGUGUCACGUTT-3′ and antisense,
5′-ACGUGACACGUUCGGAGAATT-3′) were synthesized by OBiO Technology
(Shanghai) Corp., Ltd. After being cultured at 37°C in a humidified
5% CO2 incubator for 12 h, U87 cells were transfected
with siRNAs (50 nM) using Lipofectamine® 3000 (Thermo
Fisher Scientific, Inc.) according to the manufacturer's protocol
for 12 h at 37°C. Subsequent experiments were performed 48 h after
lentivirus infection or 24 h after siRNA transfection.
RNA extraction and reverse
transcription-quantitative (RT-q)PCR
Total RNA was extracted using TRIzol®
reagent (Thermo Fisher Scientific, Inc.), cDNA synthesis was
performed with a RevertAid First Strand cDNA Synthesis kit (Thermo
Fisher Scientific, Inc.) according to the manufacturer's protocol
and qPCR was performed with Universal SYBR Green Master Mix (Roche
Diagnostics) according to the manufacturer's protocol using the
following PCR conditions: 95°C for 10 min, followed by 40 cycles of
95°C for 30 sec, 60°C for 30 sec and 72°C for 40 sec, followed by a
final elongation step of 10 min at 72°C. P4HA2 expression was
normalized to GAPDH expression calculated using the 2-ΔΔCq method
(14). The primer sequences were as
follows: P4HA2 forward, 5′-GCCAAAGCCCTGATGAGACT-3′ and reverse,
5′-GCTCCATCCACAACACCGTA-3′; and GAPDH forward,
5′-TCATCATCTCTGCCCCCTCT-3′ and reverse,
5′-GTGATGGCATGGACTGTGGT-3′.
EdU incorporation
For EdU incorporation, a Cell-Light EdU Apollo567
In Vitro kit (Guangzhou RiboBio Co., Ltd.) was used for EdU
and Hoechst staining according to the manufacturer's instructions.
EdU-positive cells were analyzed under a fluorescence microscope
(Axio Scope. A1; Zeiss AG) using ×20 magnification.
Cell cycle analysis
U87 cells were harvested 48 h after infection or 24
h after transfection and then fixed with ice-cold 75% ethanol at
−20°C for 24 h. After fixation, cells were stained with PI/RNase
Staining Buffer (BD Biosciences) and incubated for 30 min at room
temperature. Cell cycle analysis was analyzed using the BD
FACSCalibur system (BD Biosciences) with ModFit LT v3.3.11 software
(Verity Software House, Inc.).
Cell Counting Kit-8 (CCK8) assay
A total of 1,000 U87 cells were plated in 96-well
plates and cultured at 37°C with virus infection or siRNA
transfection. After culture for 0, 1, 2, 3 and 4 days, 10 µl CCK8
reagent (Dalian Meilun Biology Technology Co., Ltd.) was added into
each well and incubated at 37°C for 2 h. The optical density (OD)
was examined at a wavelength of 450 nm (OD 450 nm).
Wound healing assay
Infected or transfected cells were seeded in 6-well
plates and incubated for 24 h until reaching 90% confluence. The
monolayer was scratched with a 1-ml pipette tip and washed with PBS
to remove cell debris. Cells were then cultured in DMEM/F12
supplemented with 2% FBS. The wound closure was measured using
ImageJ software (v1.52a; National Institutes of Health) in
photographs taken using a light microscope (Nikon Corporation) at
×10 magnification at the time of wounding (0 h), and then 24 and 48
h after wounding.
Transwell assay
For migration assays, 3×10⁴ infected or
transfected cells in DMEM/F12 were plated in the upper chambers of
24-well Transwell plates (pore size, 8 µm; Corning, Inc.), and the
lower chambers were filled with 600 µl DMEM/F12 with 10% FBS. After
being cultured at 37°C for 24 h, the non-migrating cells on the
upper surface were removed with a cotton swab, and the migrated
cells were fixed with 4% formaldehyde at room temperature for 20
min and then stained with 0.2% crystal violet at room temperature
for 45 min. The pictures were taken using the AMAFD1000-EVOS™ FL
Auto Imaging System (Thermo Fisher Scientific, Inc.) at ×20
magnification.
Statistical analysis
The data were presented as the mean ± SEM.
Statistical analysis of the data was performed using GraphPad Prism
8.0 (GraphPad Software, Inc.) on at least three independent samples
for each experiment. Two-tailed unpaired Student's t-test was used
for comparison between two groups, and two-way ANOVA followed by
Sidak's post-hoc test was used for comparing multiple groups.
P<0.05 was considered to indicate a statistically significant
difference.
Results
Identification of DEGs between GSCs
and GBM cells
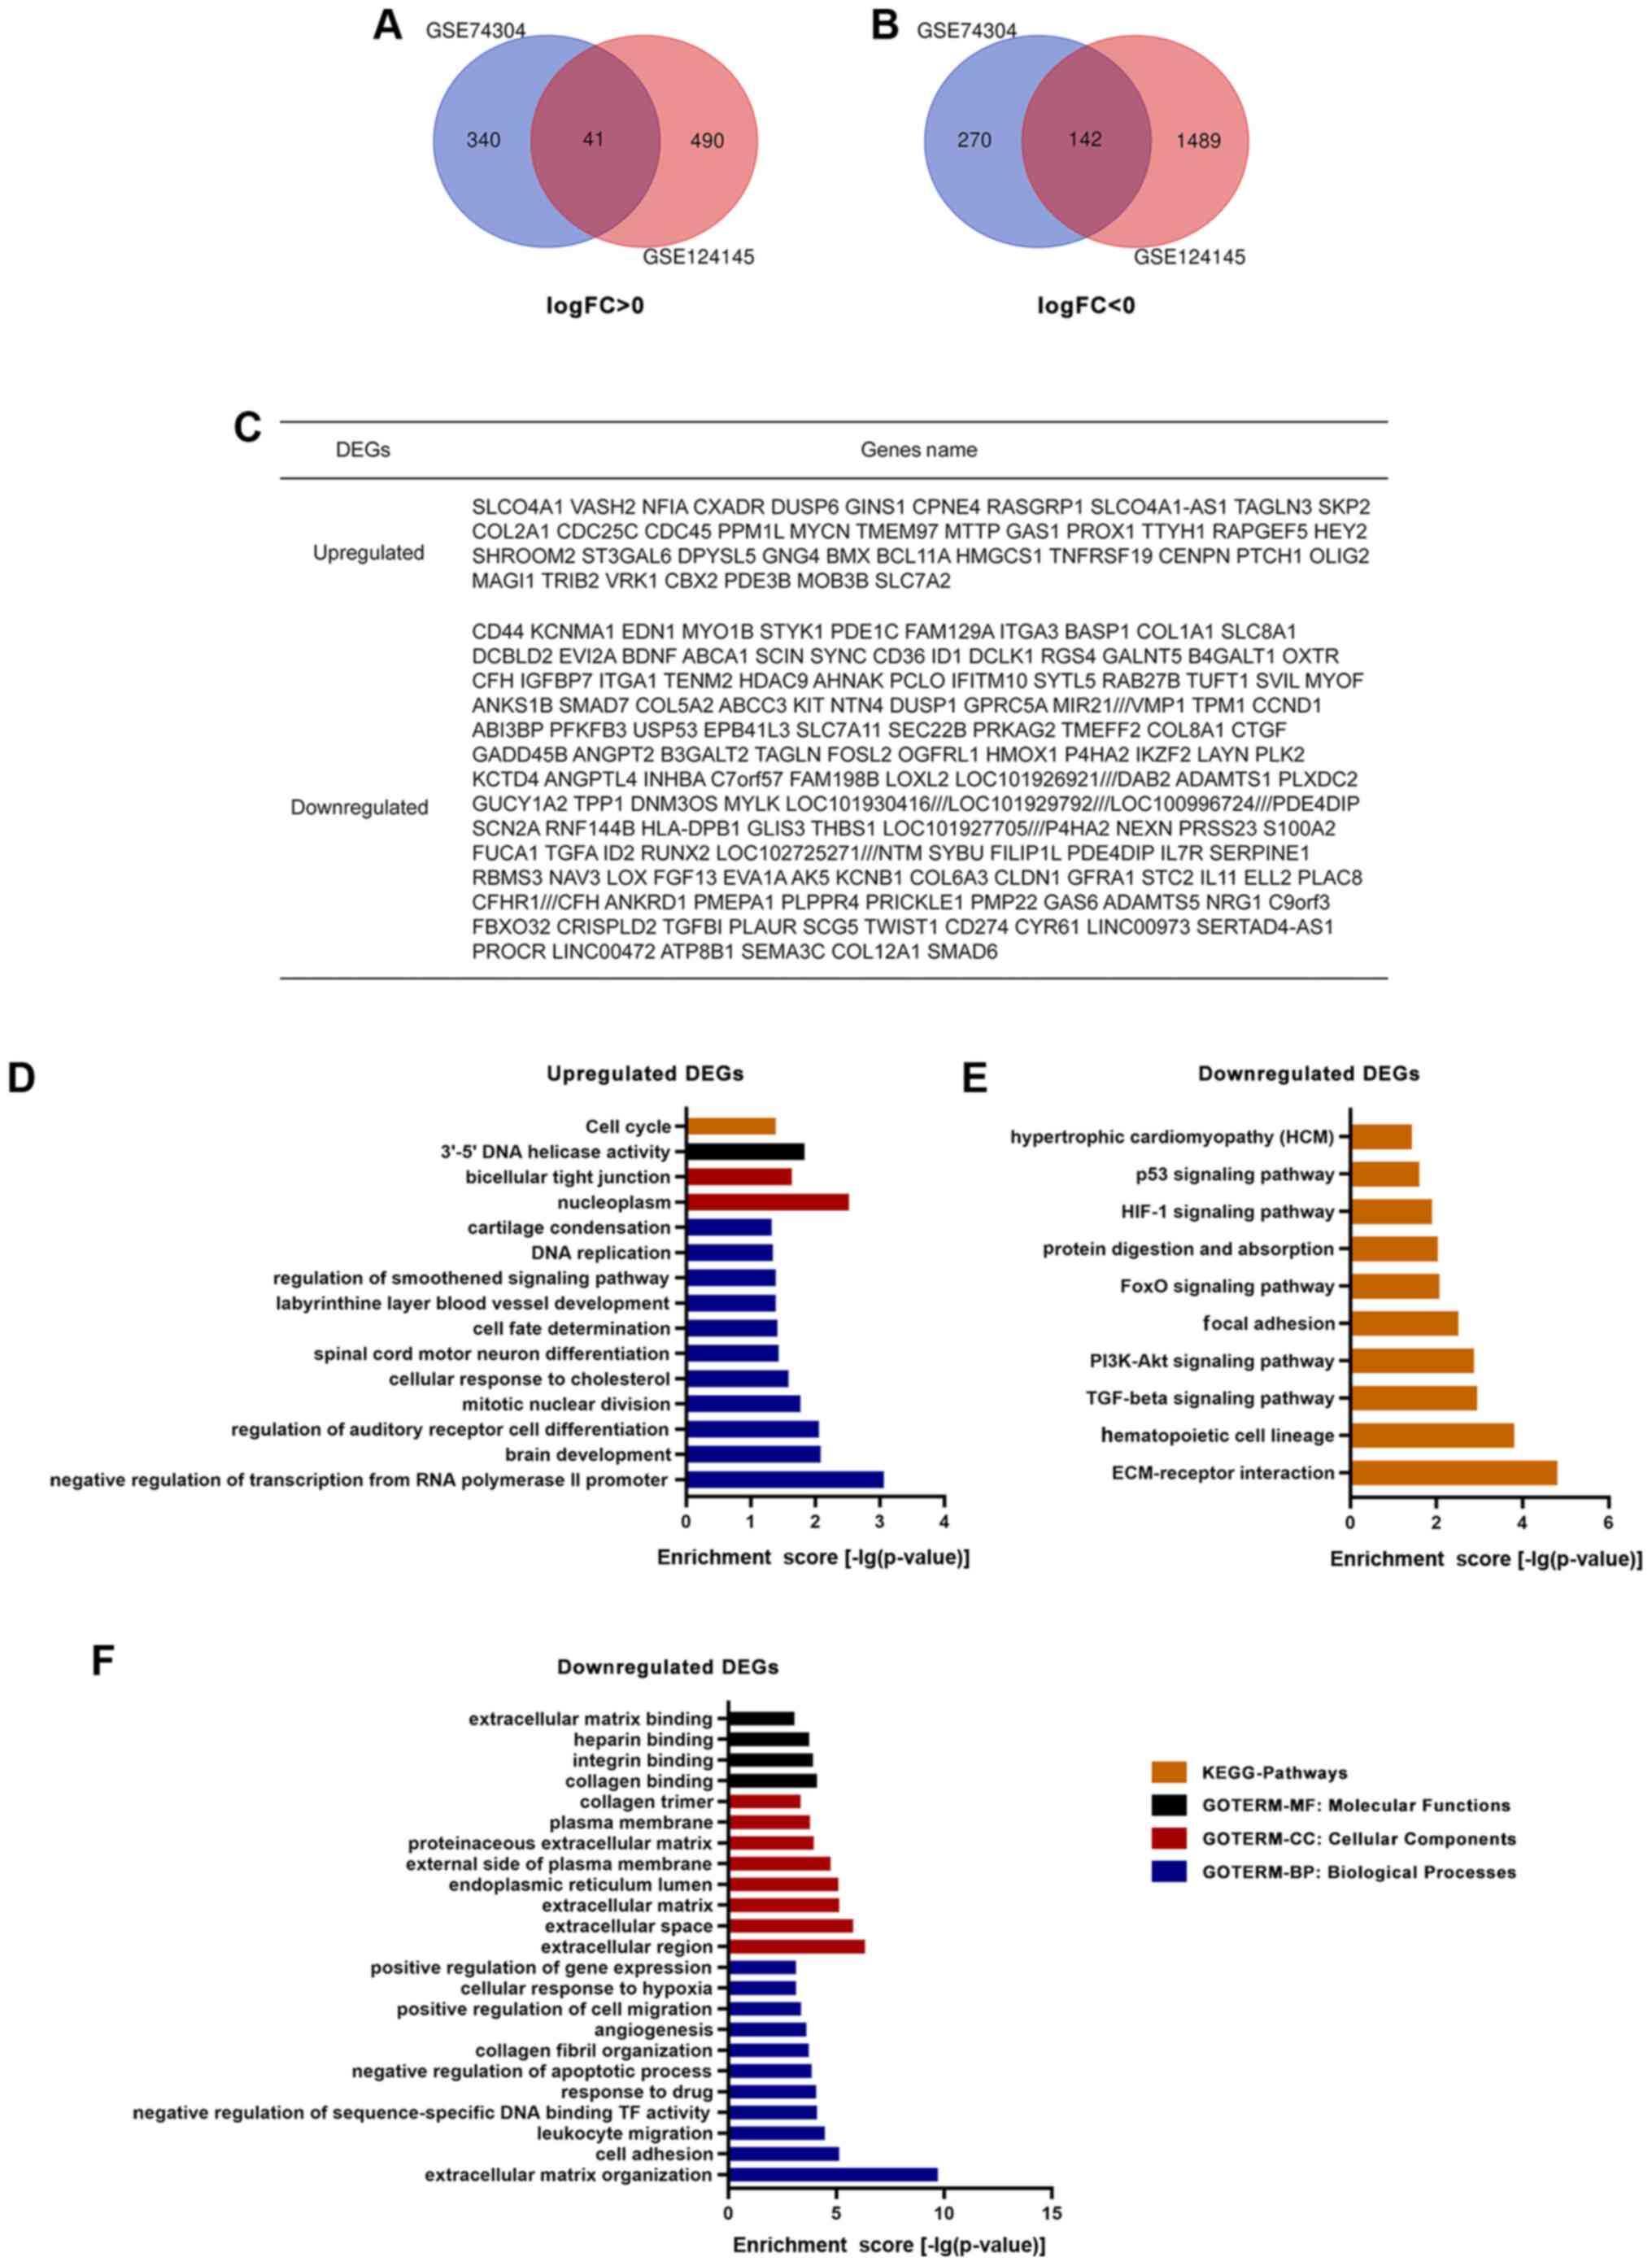
A total of 10 GSC samples and 12 GBM samples were
used in the present study. Through GEO2R online tools, 793 DEGs
were extracted from GSE74304, with 381 upregulated genes and 412
downregulated genes, and 2,162 DEGs from GSE124145, with 531
upregulated genes and 1,631 downregulated genes in GSCs compared
with in GBM cells. Overlapping genes were obtained with Venn
software online. A total of 183 DEGs were screened, including 41
upregulated genes (log FC >0) and 142 downregulated genes (log
FC <0) in GSCs compared with in GBM cells (Fig. 1A-C).
GO and KEGG pathway analysis
A total of 41 upregulated and 142 downregulated DEGs
were analyzed via the DAVID website with the screening criteria of
P<0.05 for upregulated genes, and both P<0.05 and enrichment
score >3 for downregulated genes. The results of GO analysis
revealed that: i) For molecular functions, upregulated DEGs were
particularly enriched in the term ‘3′-5′ DNA helicase activity’,
and downregulated DEGs were particularly enriched in the terms
‘collagen binding’, ‘integrin binding’, ‘heparin binding’ and
‘extracellular matrix binding’; ii) for cellular components,
upregulated DEGs were enriched in the terms ‘nucleoplasm’ and
‘bicellular tight junction’, whereas downregulated DEGs were
enriched in the terms ‘extracellular region’, ‘extracellular
space’, ‘extracellular matrix’, ‘endoplasmic reticulum lumen’,
‘external side of plasma membrane’, ‘proteinaceous extracellular
matrix’, ‘plasma membrane’ and ‘collagen trimer’; iii) for
biological processes, upregulated DEGs were significantly enriched
in the terms ‘negative regulation of transcription from RNA
polymerase II promoter’, ‘brain development’, ‘regulation of
auditory receptor cell differentiation’, ‘mitotic nuclear
division’, ‘cellular response to cholesterol’, ‘spinal cord motor
neuron differentiation’, ‘cell fate determination’, ‘labyrinthine
layer blood vessel development’, ‘regulation of smoothened
signaling pathway’, ‘DNA replication and cartilage condensation’,
and downregulated DEGs were enriched in the terms ‘extracellular
matrix organization’, ‘cell adhesion’, ‘leukocyte migration’,
‘negative regulation of sequence-specific DNA binding TF activity’,
‘response to drug’, ‘negative regulation of apoptotic process’,
‘collagen fibril organization’, ‘angiogenesis’, ‘positive
regulation of cell migration’, ‘cellular response to hypoxia’ and
‘positive regulation of gene expression’ (Fig. 1D and F). KEGG analysis results
demonstrated that upregulated DEGs were particularly enriched in
the term ‘cell cycle’, whereas downregulated DEGs were particularly
enriched in the terms ‘ECM-receptor interaction’, ‘hematopoietic
cell lineage’, ‘TGF-β signaling pathway’, ‘PI3K-Akt signaling
pathway’, ‘focal adhesion’, ‘FoxO signaling pathway’, ‘protein
digestion and absorption’, ‘HIF-1 signaling pathway’, ‘p53
signaling pathway’ and ‘hypertrophic cardiomyopathy’ (Fig. 1D and E).
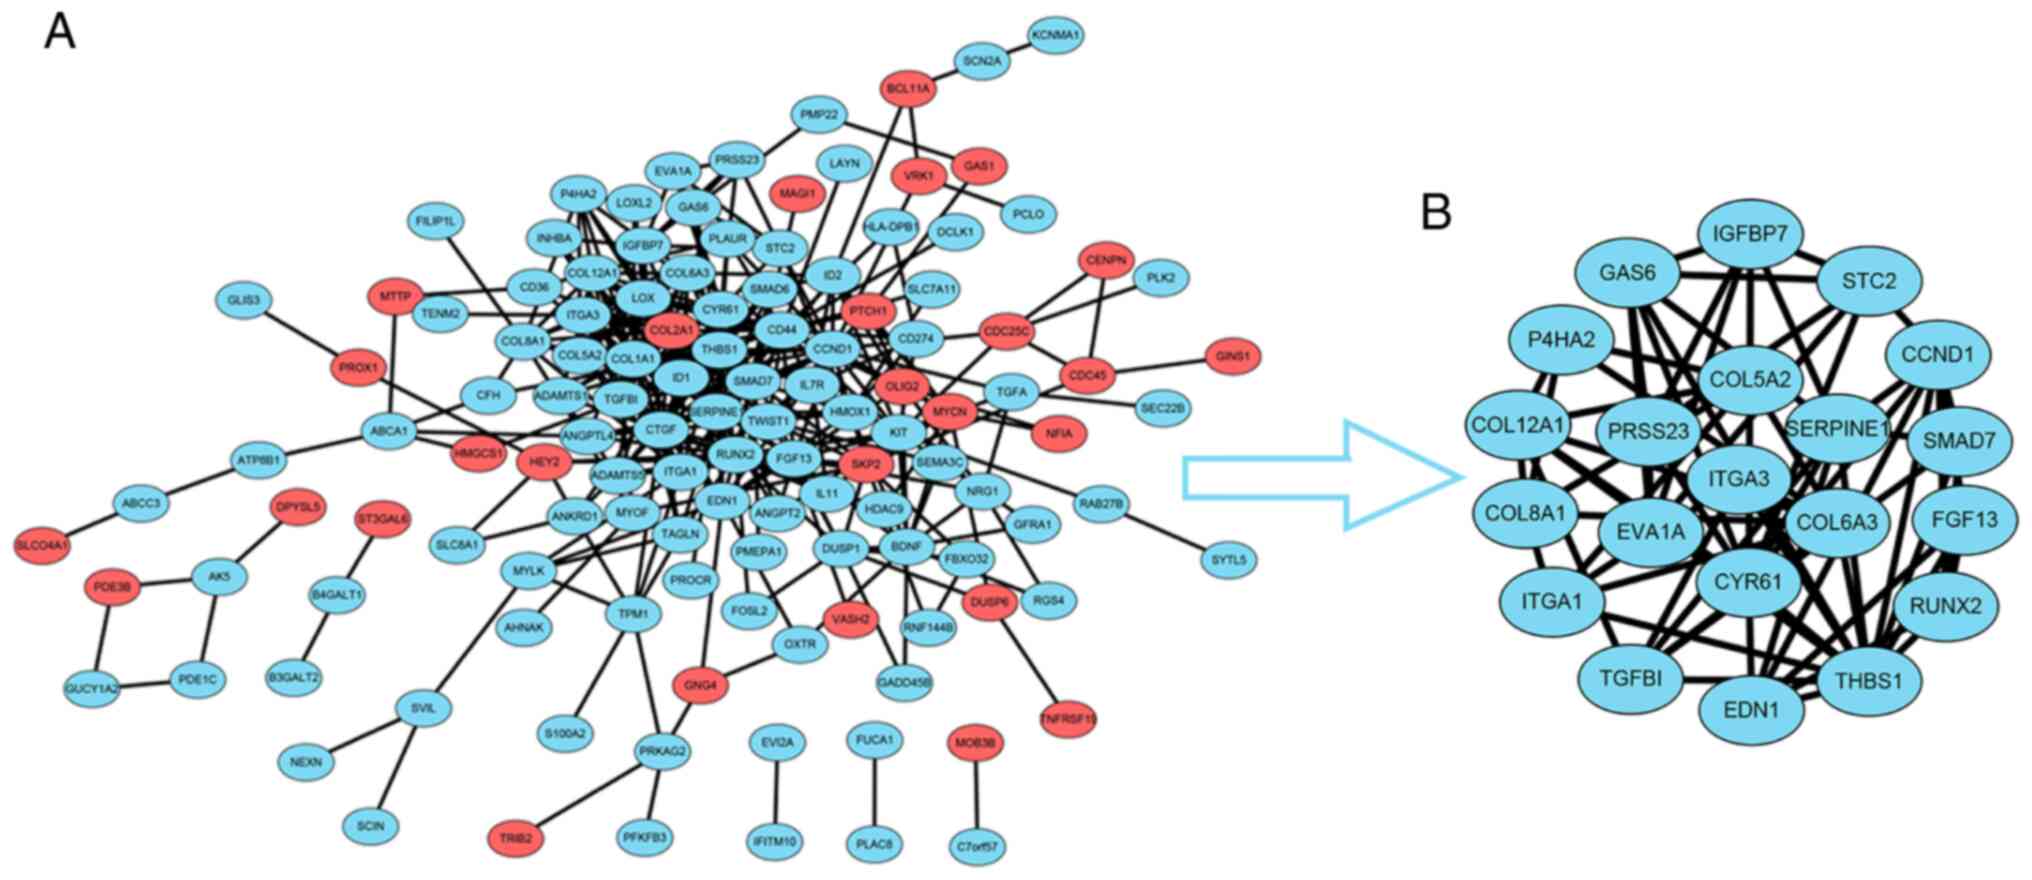
PPI and survival analysis
To construct the PPI network, the data for the 183
overlapping DEGs obtained from the STRING database were imported
into Cytoscape software. The interaction network contained 41
upregulated genes and 142 downregulated genes (Fig. 2A). For further analysis of the key
genes among them, the Cytoscape MCODE plugin was applied, and 21
hub genes were obtained, all of which were downregulated DEGs
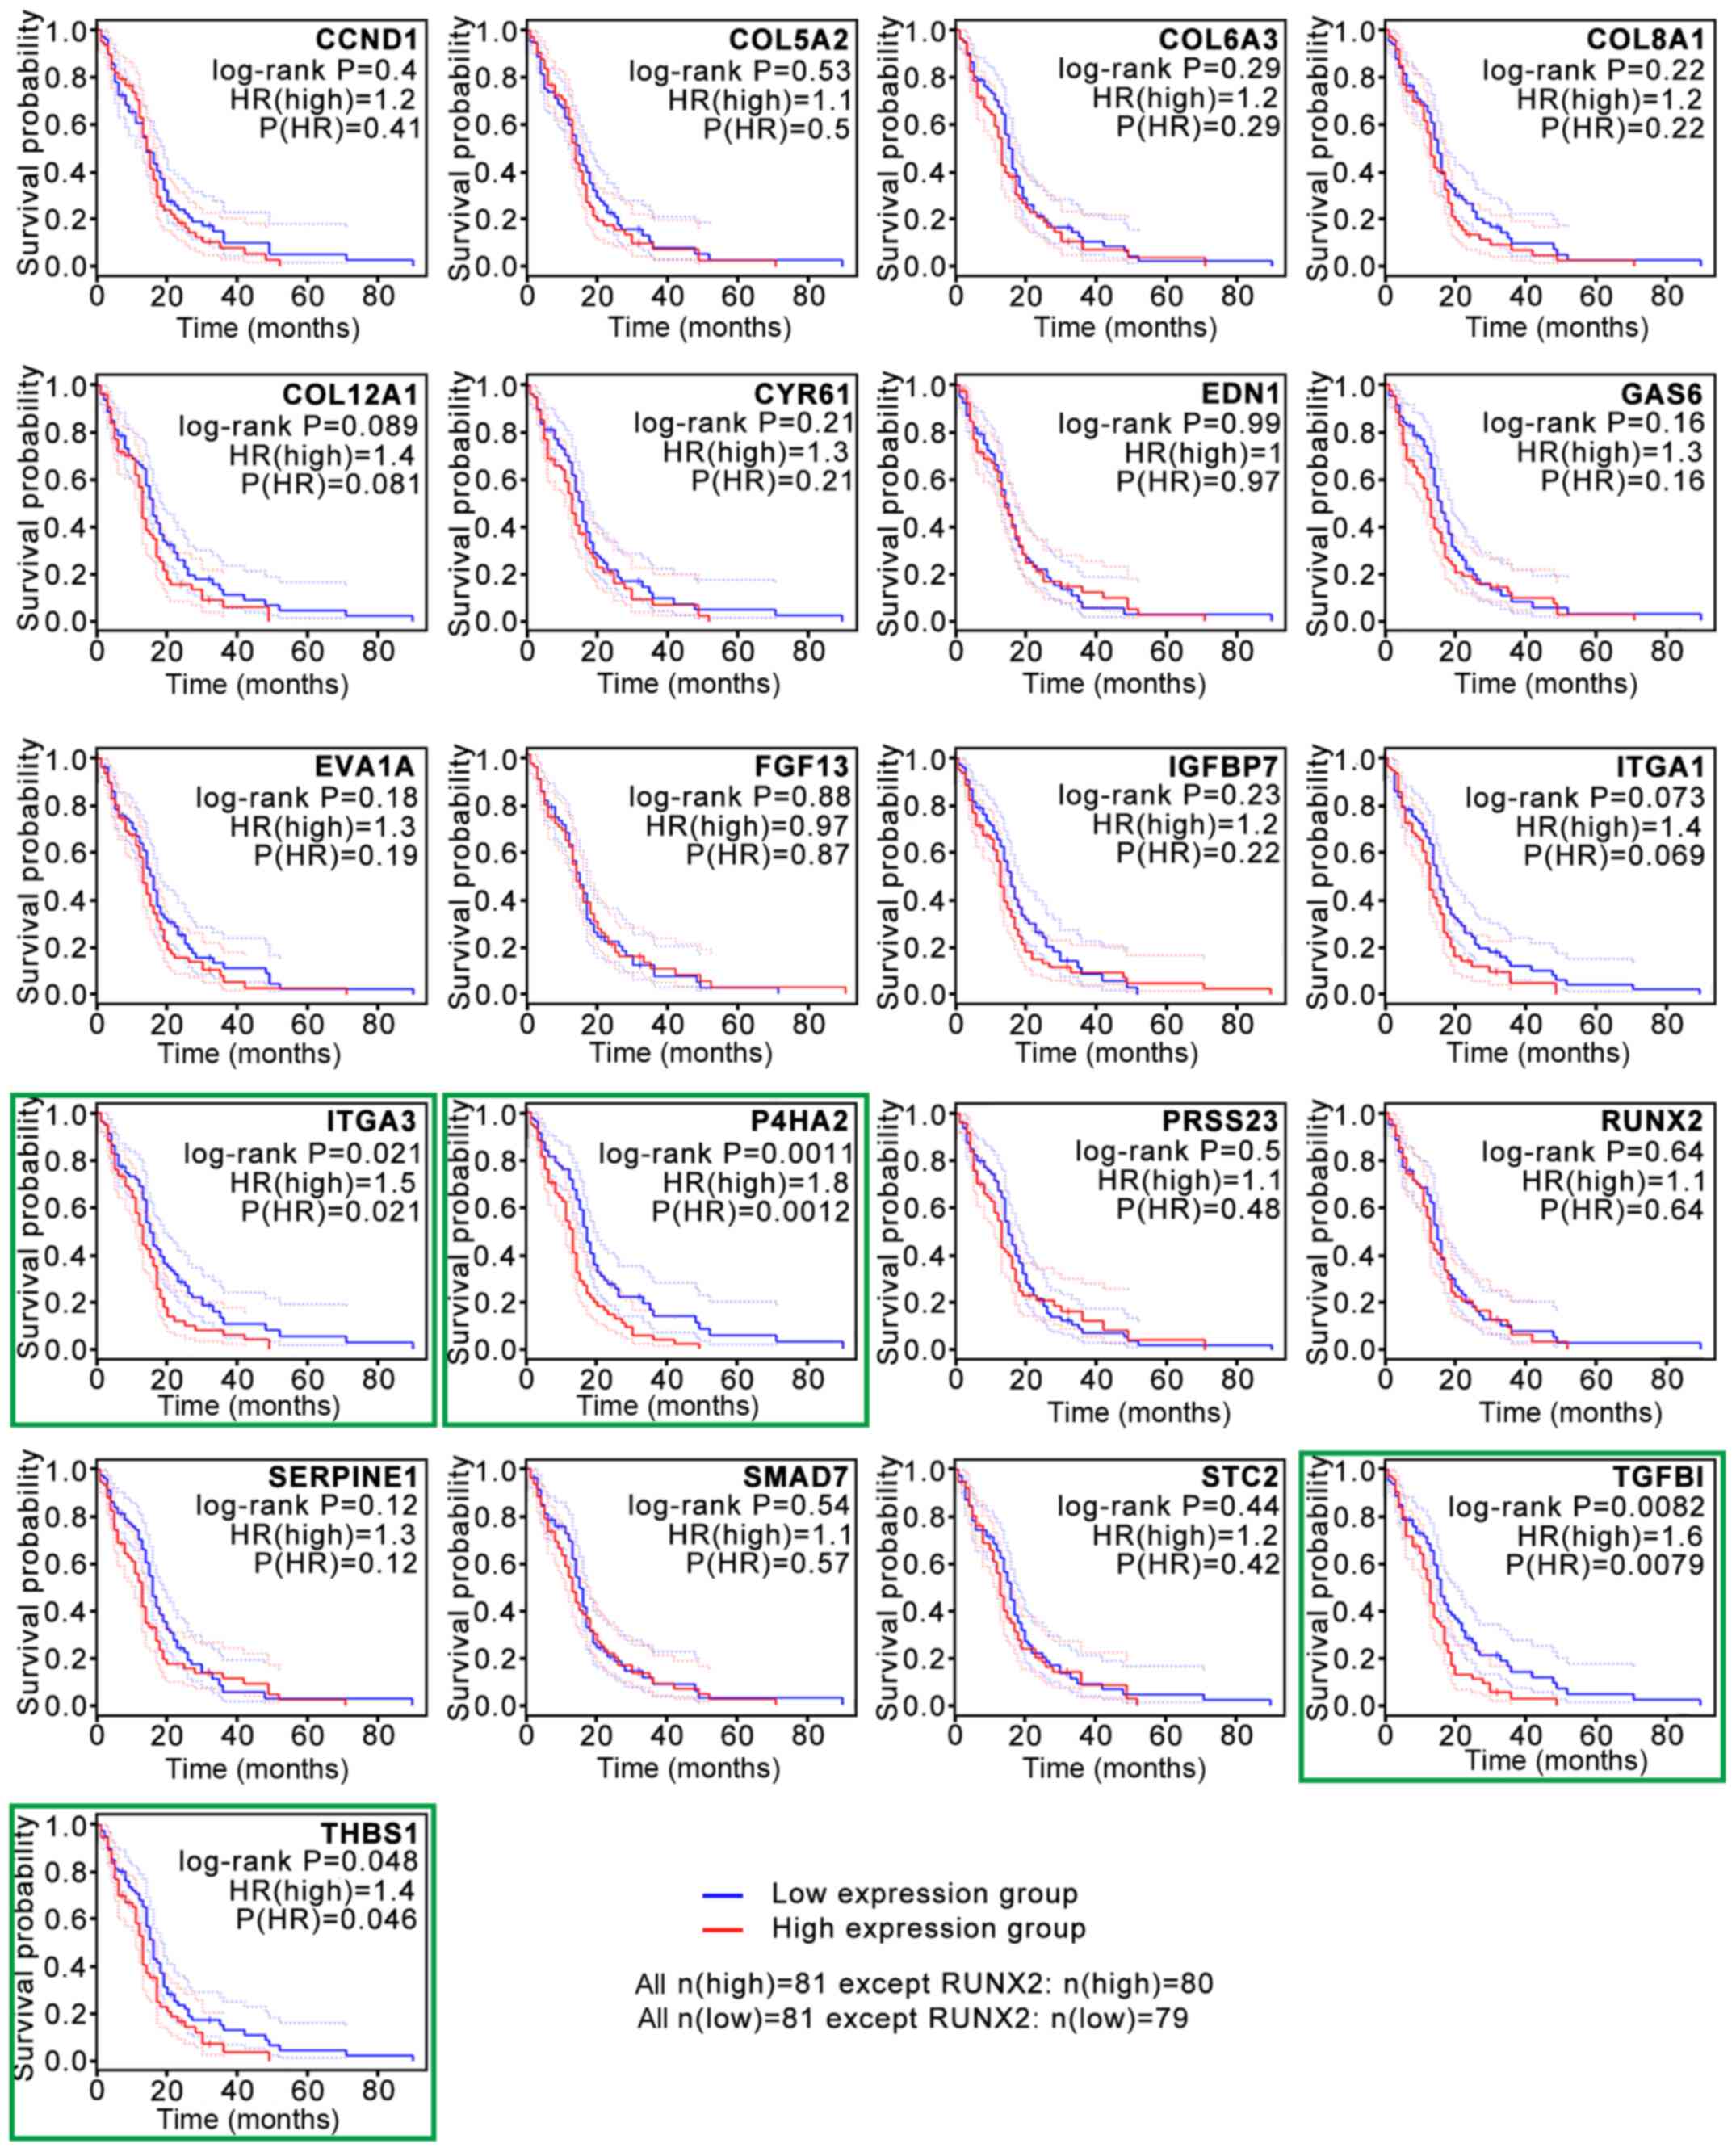
(Fig. 2B). Subsequently, the
association between the expression levels of these genes and
survival time in patients with GBM was validated with GEPIA2
analysis (Fig. 3). The survival
curves revealed that low expression levels of four hub genes, P4HA2
[log-rank P=0.0011; P(HR)=0.0012], TGF-β induced [TGFBI; log-rank
P=0.0082; P(HR)=0.0079], integrin subunit α3 [ITGA3; log-rank
P=0.021; P(HR)=0.021] and thrombospondin 1 [THBS1; log-rank
P=0.048; P(HR)=0.046], were associated with significantly prolonged
survival time in patients with GBM (Fig.
3). The present study then focused on P4HA2 since it had the
smallest P-value.
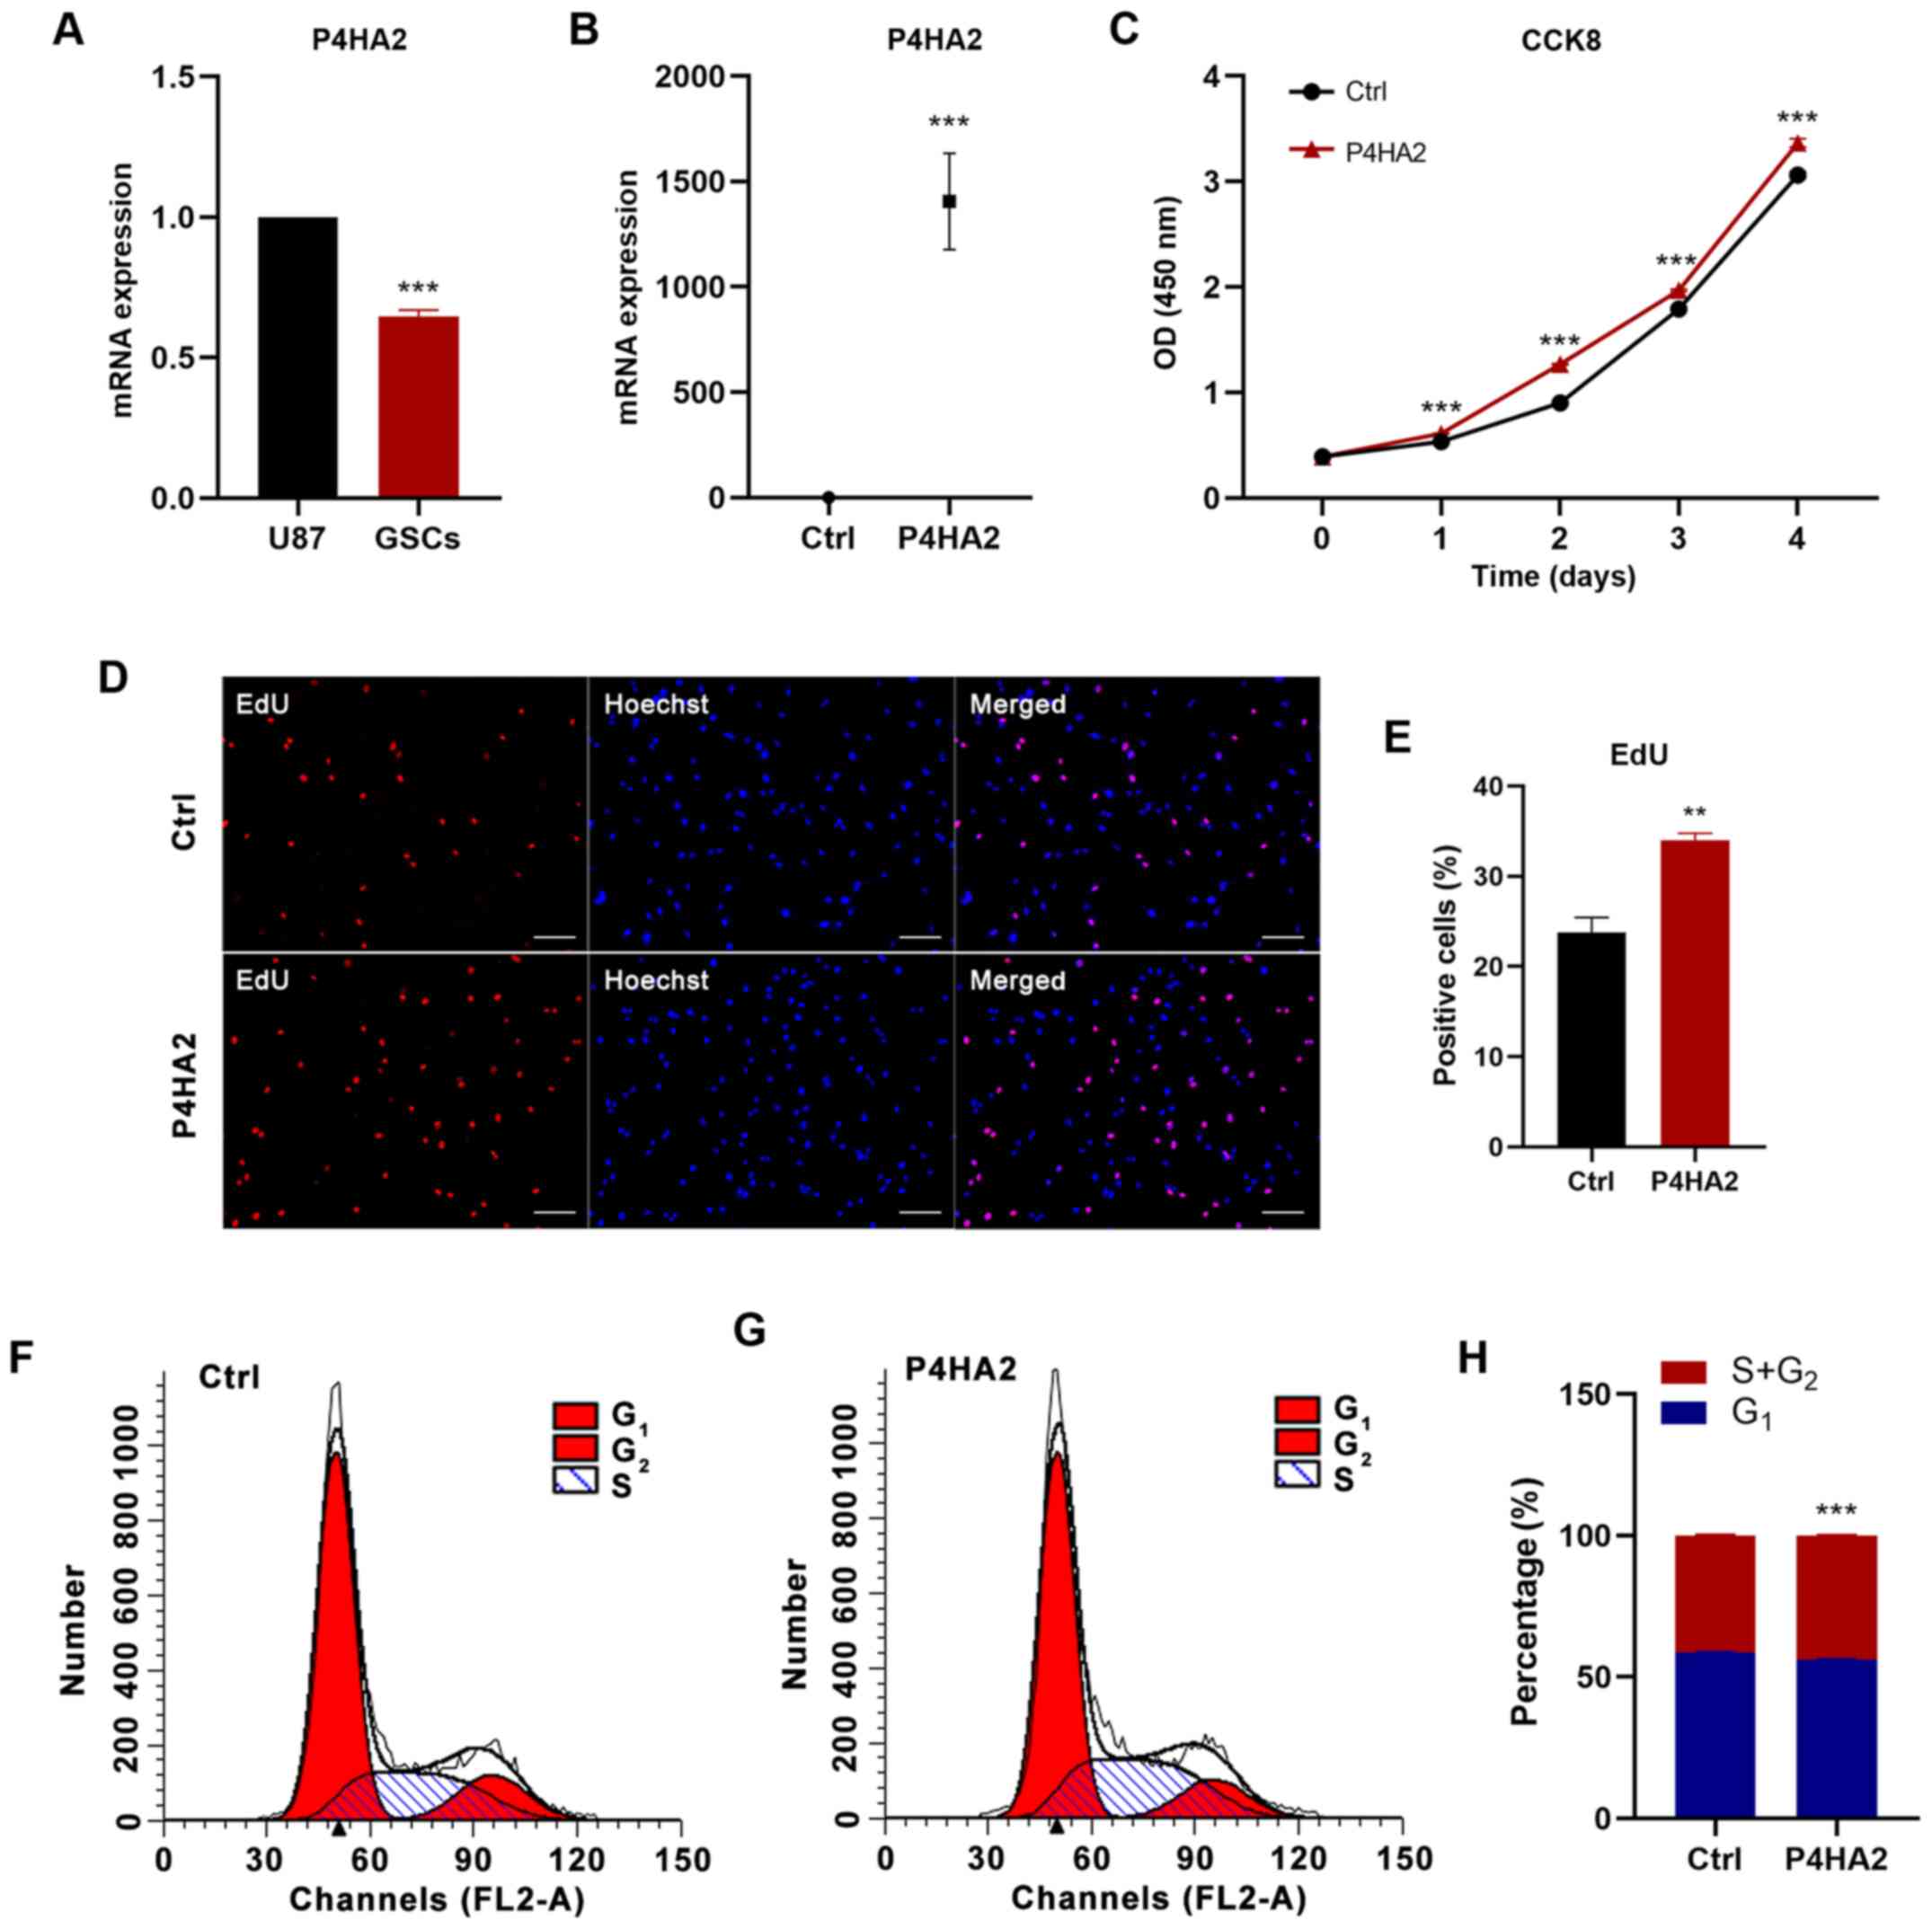
P4HA2 promotes the proliferation of
GBM cells
GSCs were generated from the U87 cell line, a human
malignant glioblastoma cell line, as previously described (9,12,13).
RT-qPCR was used to detect P4HA2 expression. In agreement with the
bioinformatics analysis results, P4HA2 expression was significantly
higher in U87 cells than in GSCs (Fig.
4A). Subsequently, U87 cells were infected with empty vector
(Ctrl) or P4HA2 vector (P4HA2) expression lentiviruses. The RT-qPCR
results revealed that P4HA2 mRNA expression was significantly
increased after P4HA2 overexpression (Fig. 4B). To explore the effects on GBM cell
proliferation, CCK8, EdU incorporation and cell cycle analyses were
performed. As shown in Fig. 4C, the
overexpression of P4HA2, compared with the control, induced
significant increases in cell proliferation from day 1. The
EdU-positive cells also significantly increased after P4HA2 viral
transfection (Fig. 4D and E). Cell
cycle analysis by flow cytometry aims to calculate the proportion
of cells at different stages of mitosis based on the DNA content,
so as to evaluate the proliferative ability of cells. Therefore,
this method was used to further confirm the effect of P4HA2 on U87
cell proliferation. According to the amount of DNA, the whole cell
cycle can be divided into G0/G1, S and
G2/M phases (15). DNA in
the G0/G1 phase is diploid, while it is
tetraploid in the G2/M phase and in between in S phase
(16,17). The ratio of cells in S phase and
G2/M phase is usually used as an index to assess the
cell proliferation state (15,17). As
shown in Fig. 4F-H, P4HA2
overexpression promoted the entry of cells into S phase and
significantly increased the proportion of cells in S+G2 phase, thus
explaining the robust proliferation of U87 cells. Overall, the
present results demonstrated that P4HA2 increased the proliferation
of GBM cells.
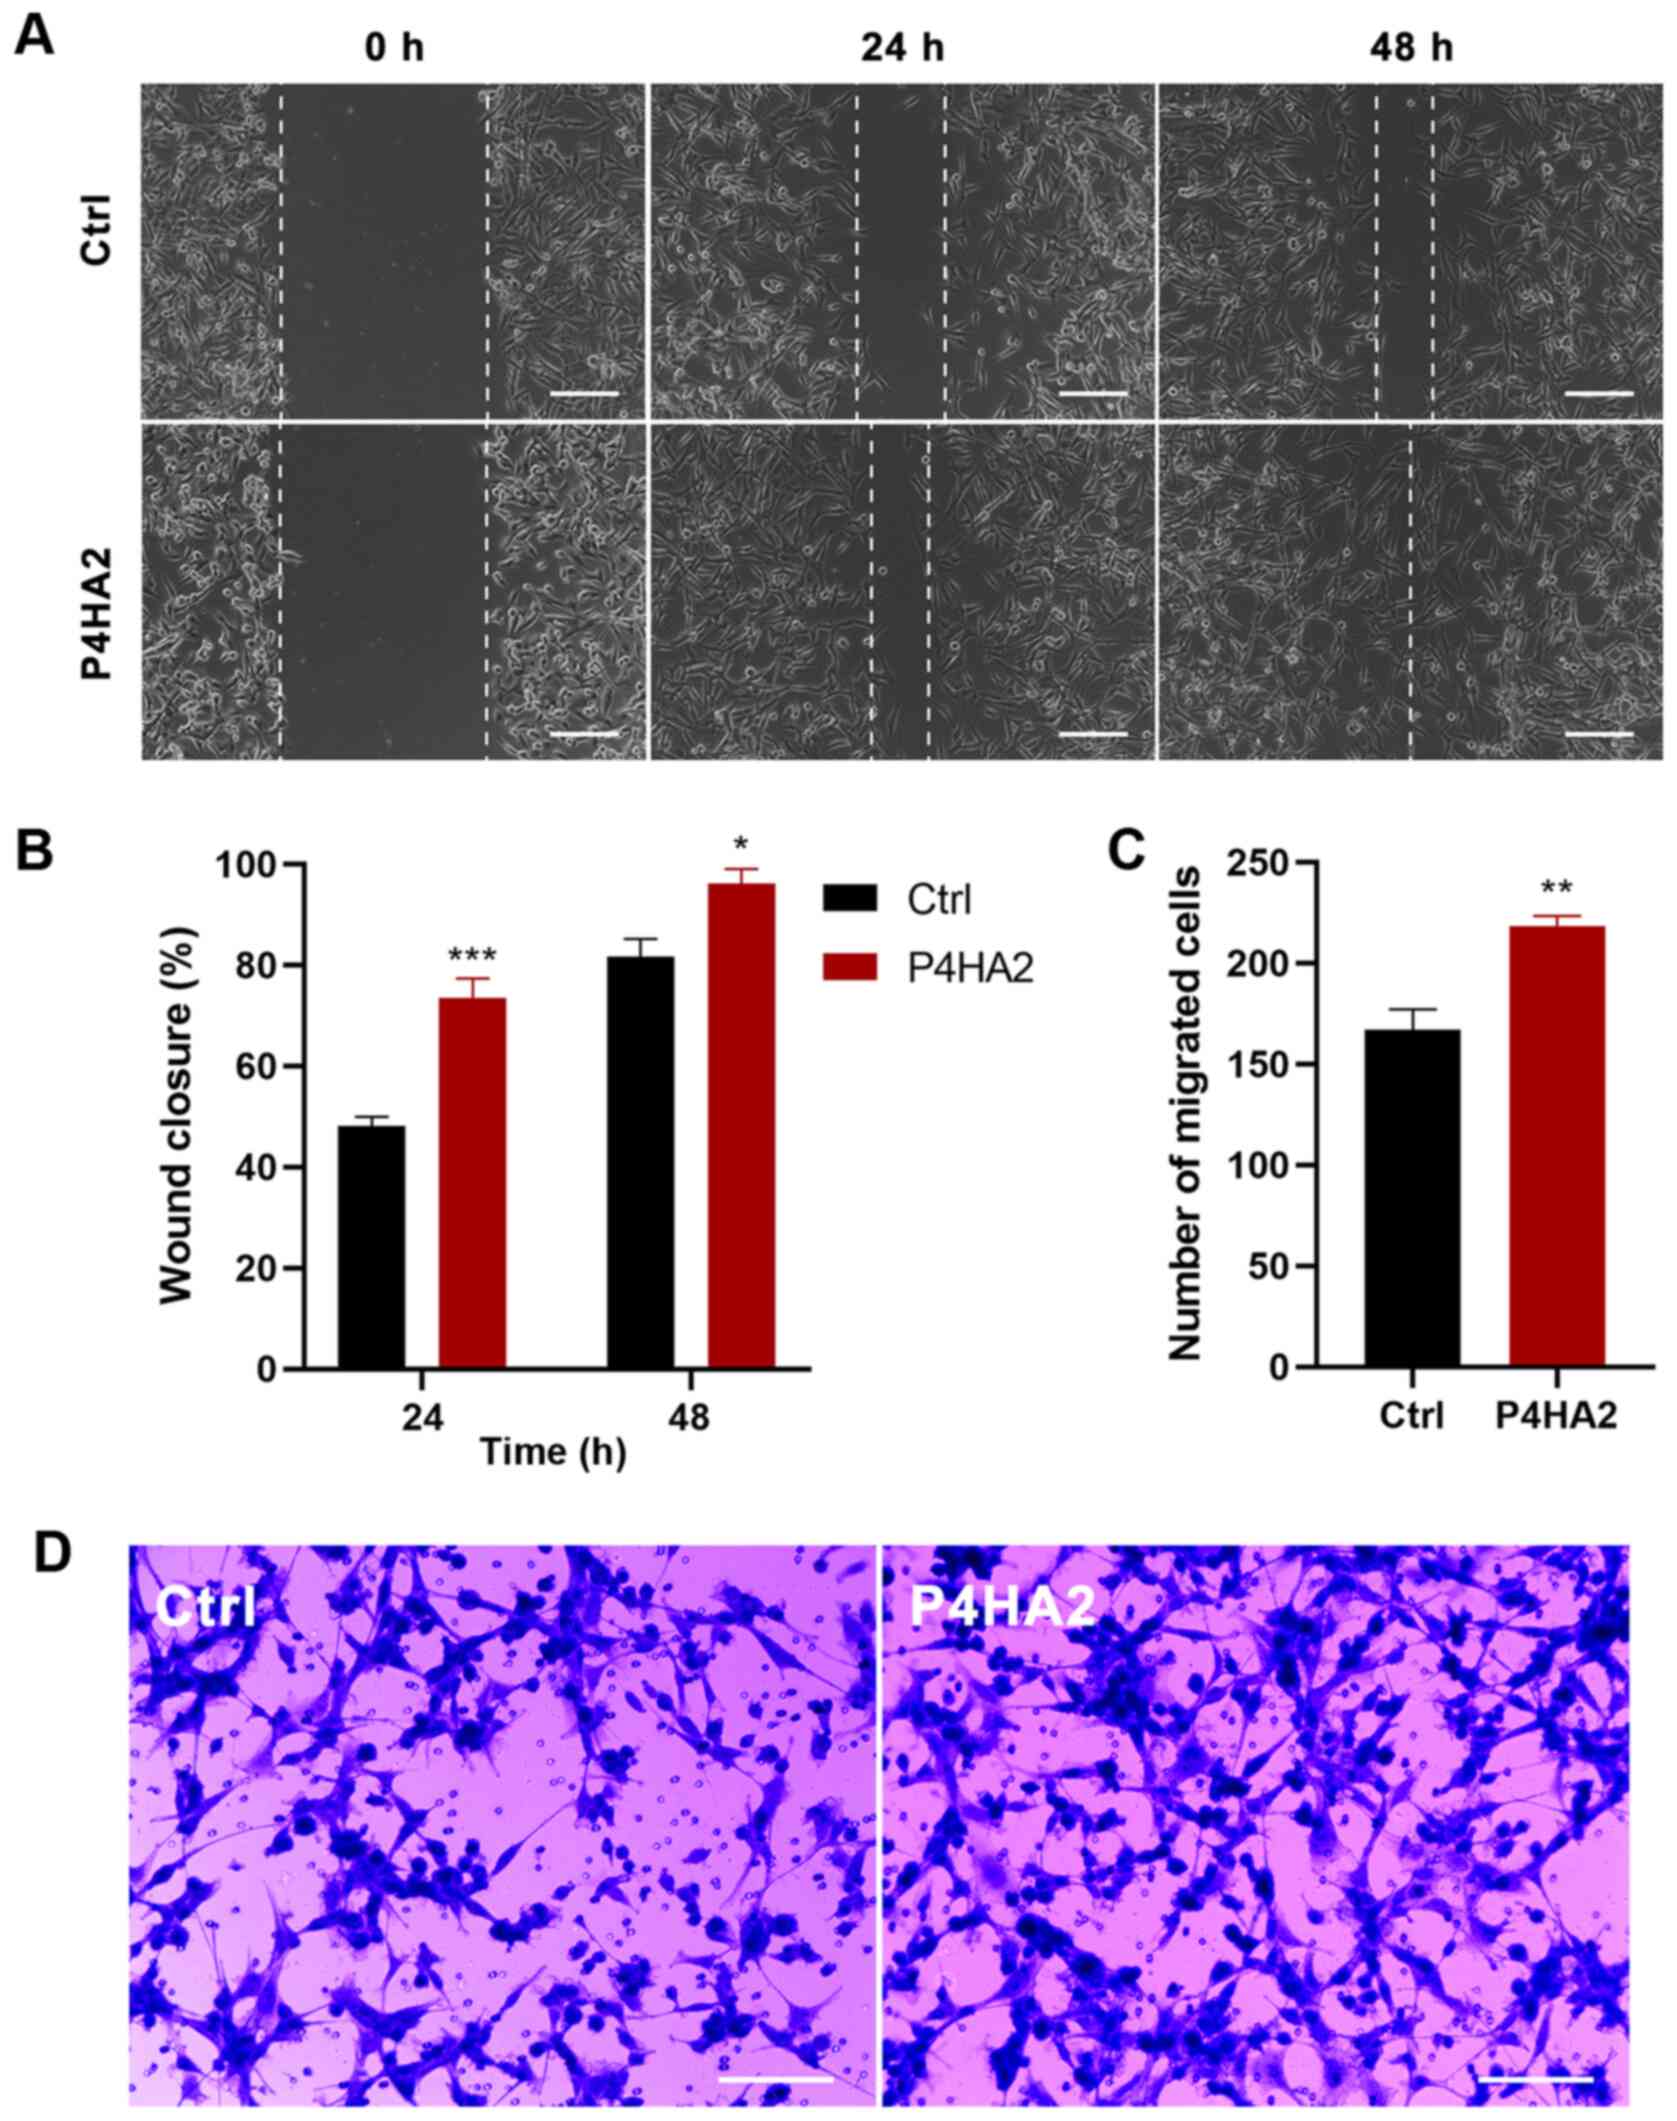
P4HA2 promotes the migration of GBM
cells
Since metastasis is the main malignant
characteristic of GBM, wound healing and Transwell assays were
conducted to investigate the effect of P4HA2 on U87 cell migration.
In the wound healing assays, the scratch width narrowed
significantly in the P4HA2 group from 24 h after transfection,
thereby indicating that cells with P4HA2 overexpression exhibited
increased migratory ability (Fig. 5A and
B). In agreement with this finding, Transwell assays also
demonstrated that the overexpression of P4HA2 promoted the
migration of U87 cells compared with cells in the control group
(Fig. 5C and D).
Knockdown of P4HA2 inhibits GBM cell
proliferation and migration
To further determine the function of P4HA2 in GBM,
P4HA2 was knocked down in U87 cells with siRNA transfection. First,
three siRNAs were designed targeting P4HA2; siRNA-1 (hereafter
called siRNA) was selected for further experiments, since it
exhibited the highest knockdown efficiency, as verified by RT-qPCR
(Fig. 6A). To investigate the
influence of P4HA2-knockdown on GBM, CCK8, EdU incorporation and
cell cycle analyses were performed to examine cell proliferation,
and wound healing and Transwell assays were performed to examine
cell migration. As shown in Fig. 6B,
P4HA2-knockdown induced significant decreases in cell proliferation
from day 2, compared with the control group. The EdU-positive cells
also significantly decreased after siRNA transfection (Fig. 6C and D). The results of cell cycle
analysis by flow cytometry indicated that P4HA2-knockdown promoted
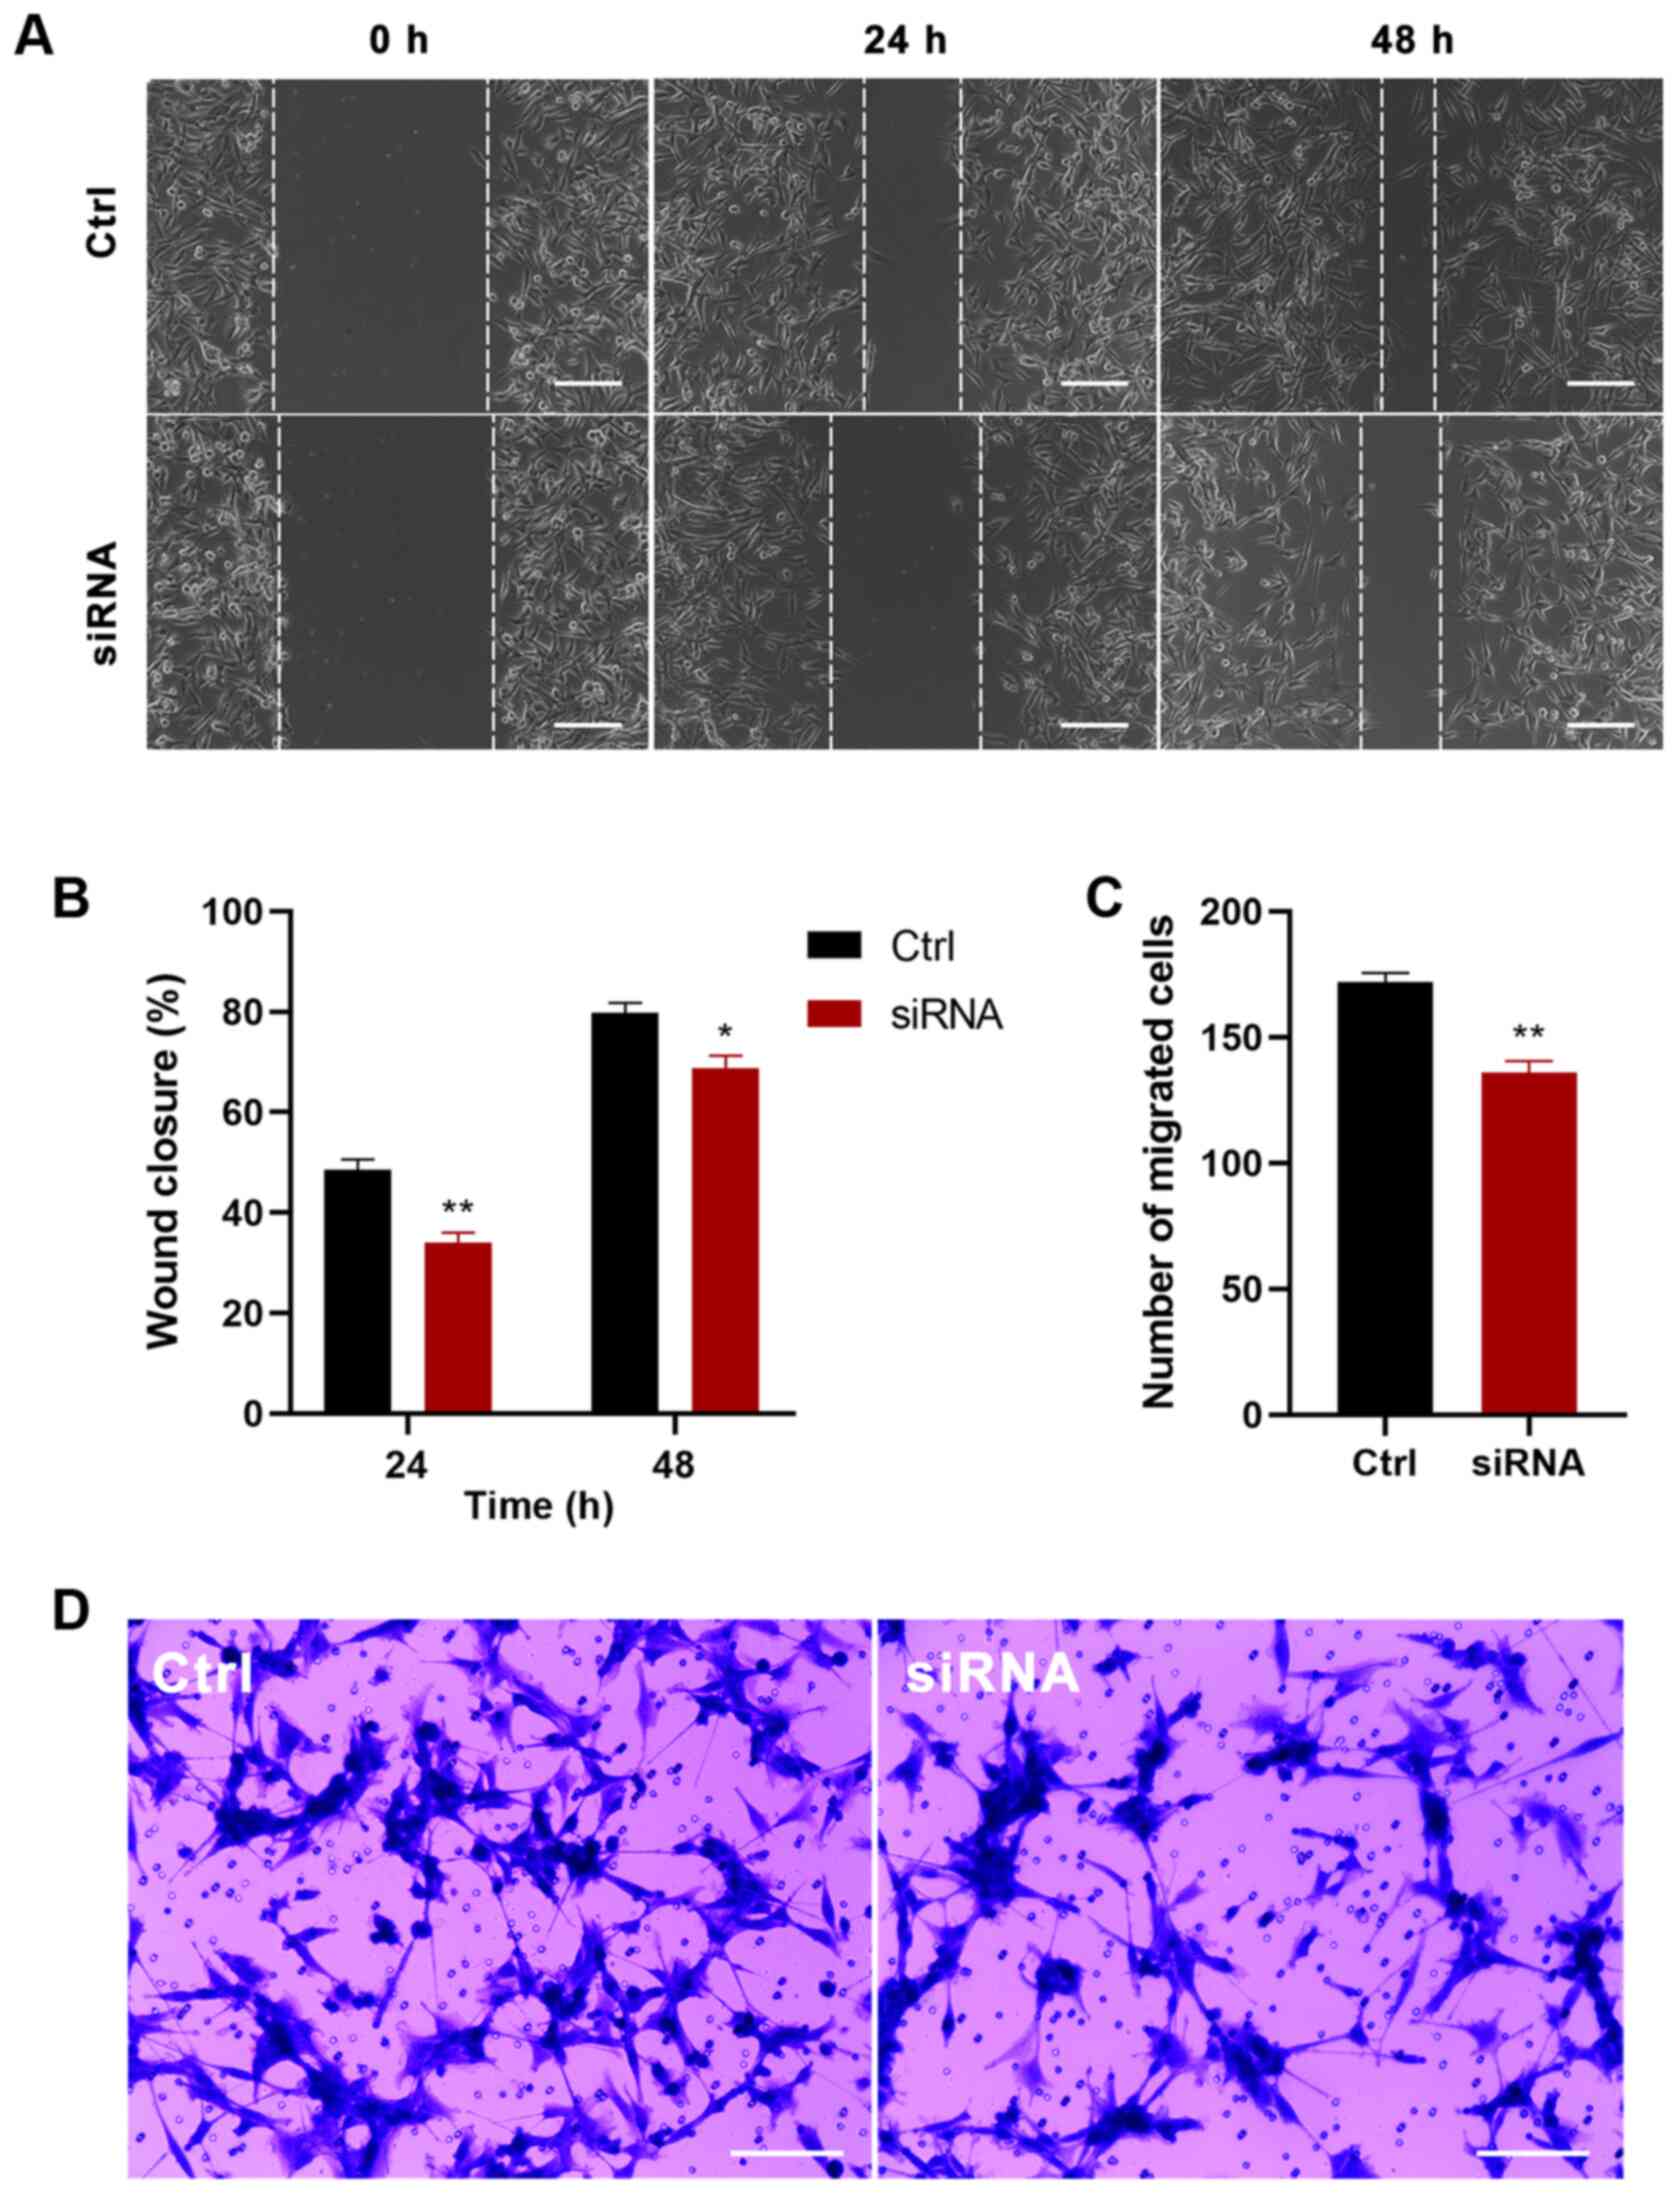
G1 phase arrest and delayed entry into S phase (Fig. 6E-G). Moreover, both the wound healing
(Fig. 7A and B) and Transwell assays
(Fig. 7C and D) revealed that
P4HA2-knockdown significantly suppressed the migratory ability of
U87 cells. Thus, P2HA2 overexpression promoted the proliferation
and migration of GBM cells, while P4HA2-knockdown inhibited these
processes.
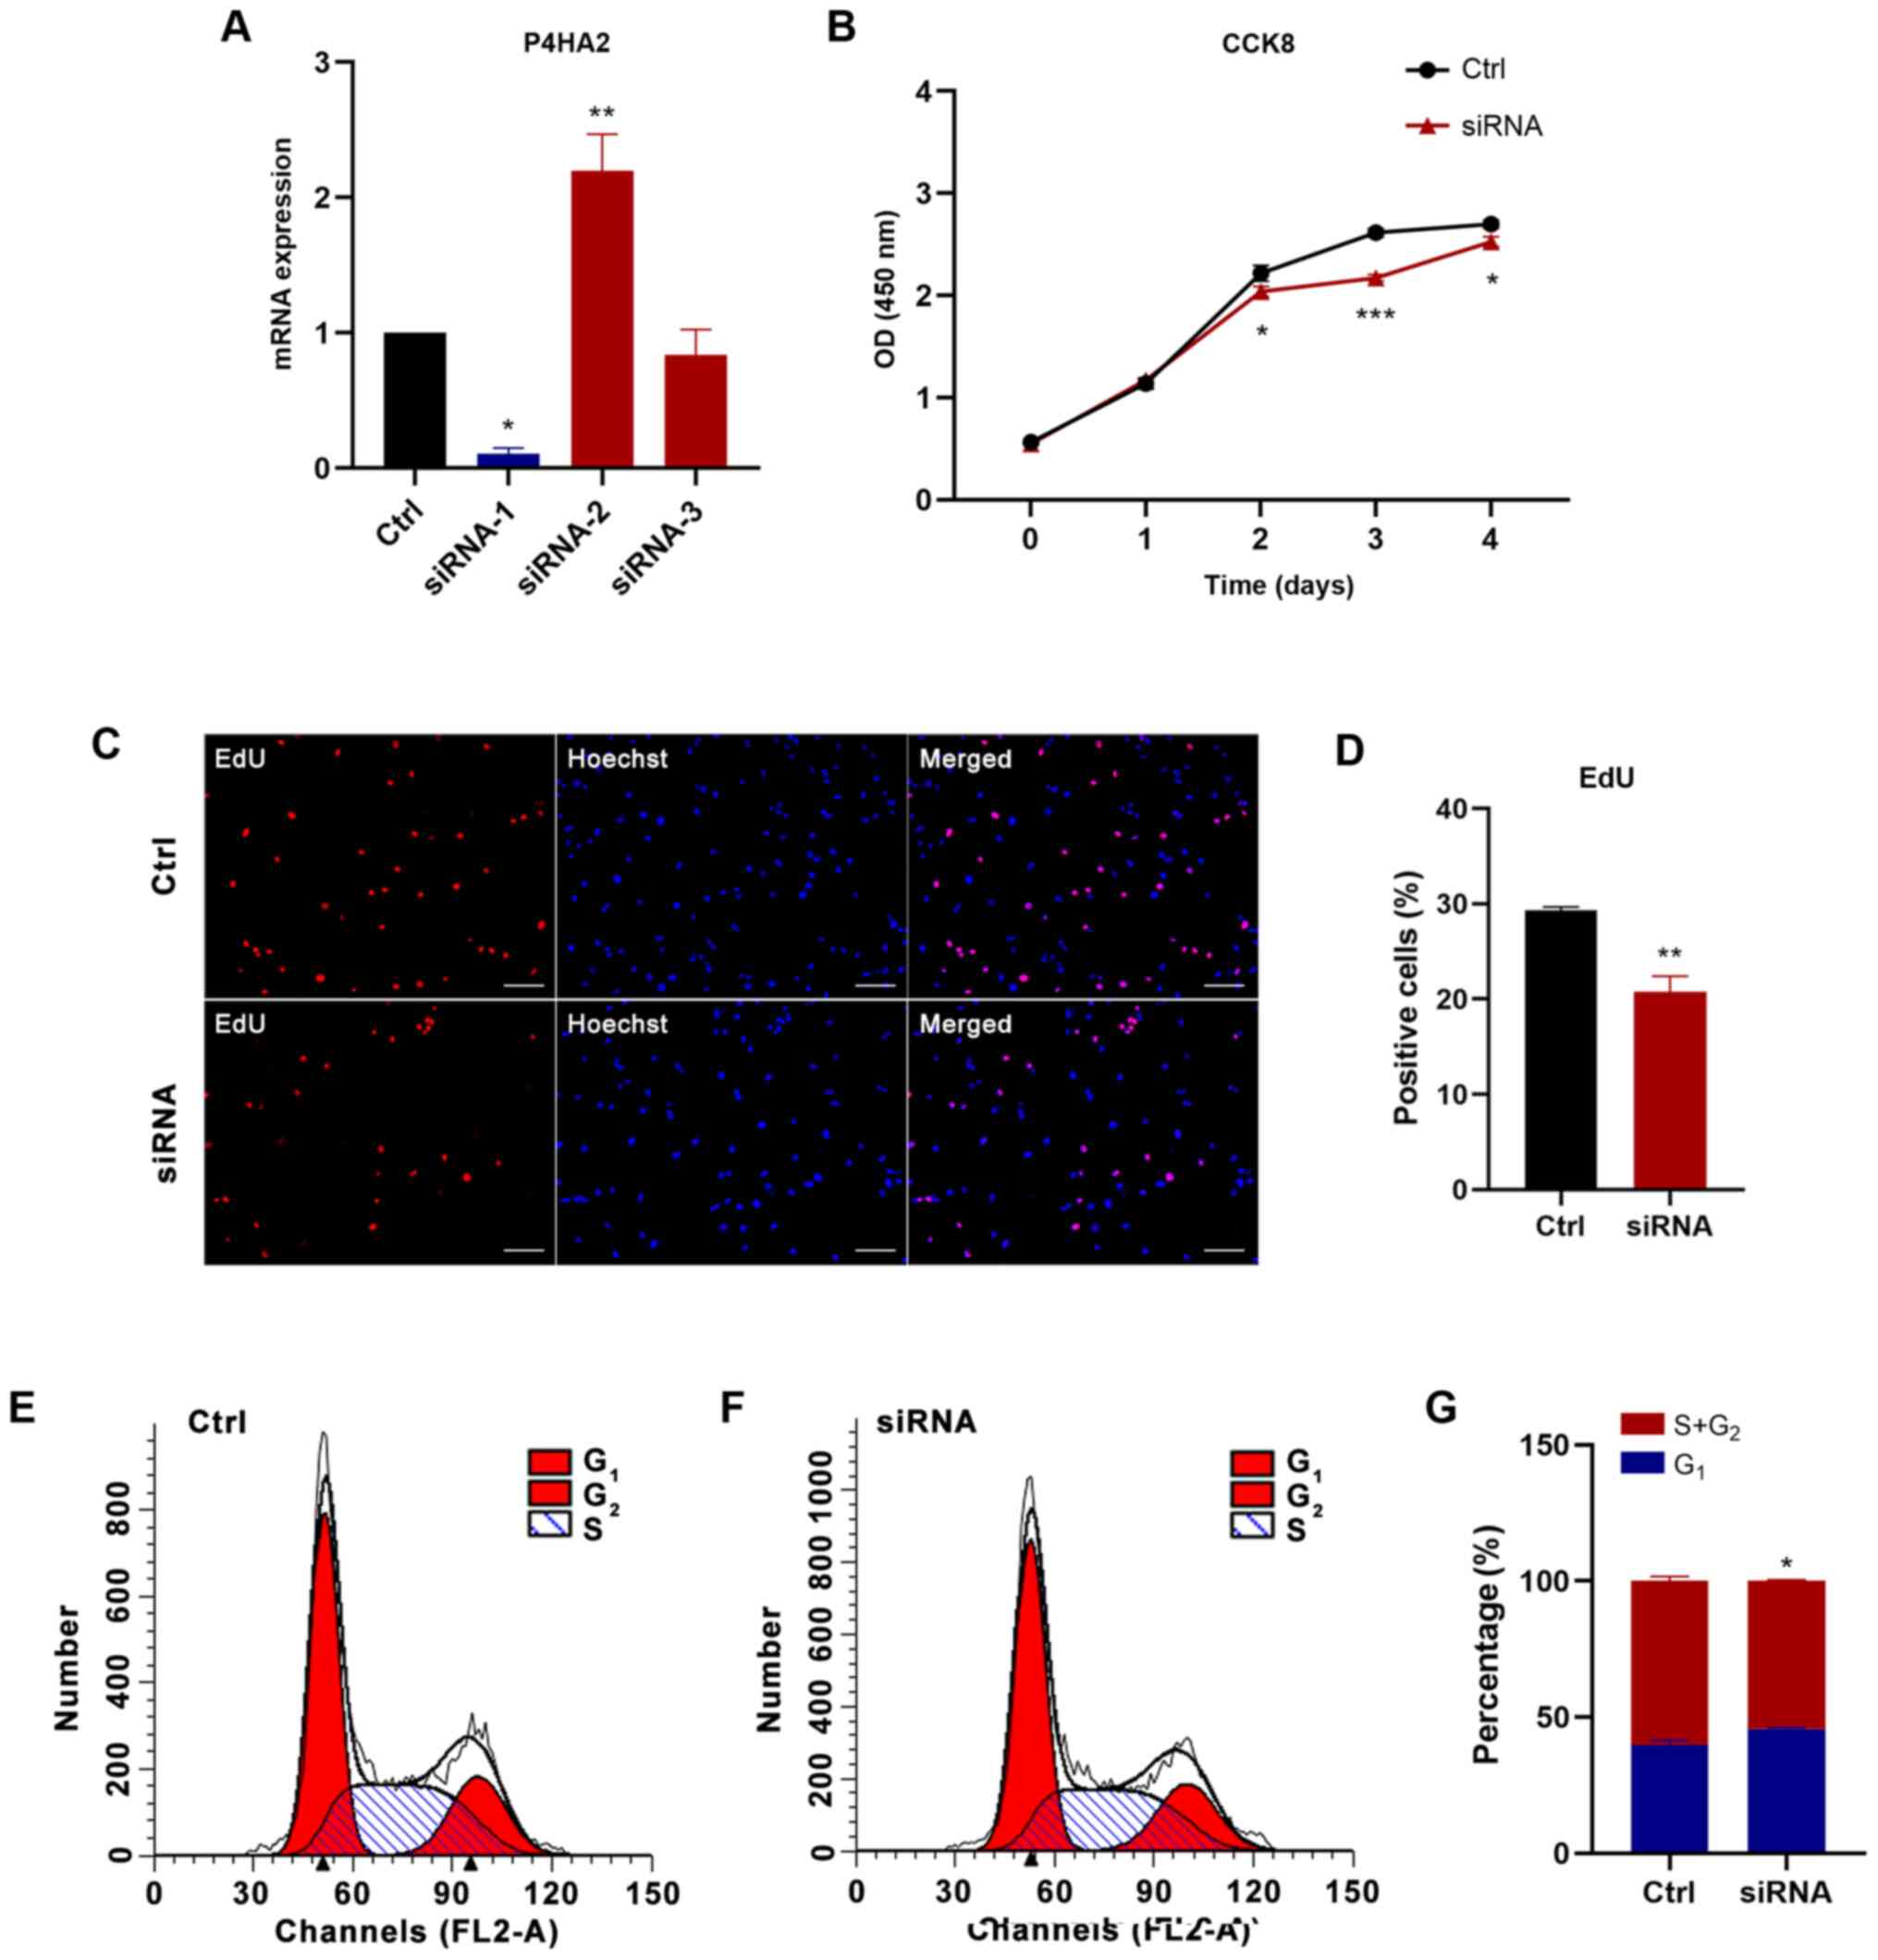 | Figure 6.P4HA2-knockdown inhibits the
proliferation of glioblastoma cells. (A) Reverse
transcription-quantitative PCR assay revealed that siRNA-1
exhibited the highest P4HA2-knockdown efficiency. (B) CCK8 assay
performed on day 0, 1, 2, 3 and 4 after transfection showed that
P4HA2-knockdown suppressed U87 cell proliferation. (C and D)
EdU-positive cells were decreased after siRNA transfection. Scale
bar, 50 µm. (E and F) Cell cycle analysis indicated that the
percentage of P4HA2-knockdown cells at S+G2 phase was decreased
compared with cells in the control group. (G) Statistical analysis
of flow cytometry plots. Data were presented as the mean ± SEM.
*P<0.05, **P<0.01 and ***P<0.001 vs. Ctrl. Ctrl, control;
OD, optical density; CCK8, Cell Counting Kit-8; P4HA2, prolyl
4-hydroxylase subunit α2; siRNA, small interfering RNA. |
Discussion
GBM, a primary malignant tumor of the central
nervous system, is characterized by high infiltration and
angiogenesis in the brain parenchyma (1). Its 5-year survival rate is <10%, and
it has high recurrence and metastasis rates (18). The treatment of GBM remains a major
challenge, owing to the poor efficacy of current therapeutics,
including surgery, radiotherapy and drugs (19). Therefore, new therapeutic targets for
GBM are urgently needed. Increasing studies have indicated that the
main reason for the high malignancy of GBM involves GSCs, a
heterogeneous cell type existing among GBM cells, which have the
potential for self-renewal and differentiation into tumor cells
(4–6). GSCs are involved in the immune escape
of tumor cells, which is the most important reason underlying GBM
recurrence and metastasis, as well as resistance to
chemoradiotherapy (6,7). Therefore, exploring the GSC-specific
surface markers and conversion mechanisms from GSCs to GBM cells
has become a research hotspot in recent years.
To analyze the differences in gene expression levels
between GSCs and GBM cells, mRNA microarray data were obtained from
accession codes GSE74304 and GSE124145 from the GPL570 platform in
the GEO database. A total of 183 DEGs were identified, of which 41
were upregulated and 142 were downregulated in GSCs compared with
in GBM cells. PPI analysis of these genes revealed 21 key genes,
denoted hub genes. Notably, these 21 hub genes were all
downregulated in GSCs. GO and KEGG pathway analysis indicated that
the downregulated genes were likely to be involved in numerous
biological processes, such as construction of the extracellular
matrix and collagen binding. Subsequent survival analysis of the 21
hub genes revealed that low expression levels of four hub genes,
P4HA2, TGFBI, ITGA3 and THBS1, were significantly associated with
longer survival time, with P4HA2 exhibiting the most significant
differential expression.
The P4HA2 gene encodes prolyl 4-hydroxylase (P4H)
subunit α2, one of several different types of α subunits of P4H, an
enzyme composed of two identical α subunits and two β subunits
(20,21). P4H catalyzes proline hydroxylation to
4-hydroxyproline, an important post-translational modification that
frequently occurs in the Gly-3Hyp-4Hyp sequence of collagen, and is
as a crucial factor in the structural stability of collagen
(20,22). Collagen is an important component of
the extracellular matrix, which can regulate cell proliferation,
migration and invasion (23). P4HA2
is essential for the proper and stable three-dimensional folding of
newly synthesized procollagen chains, and it is involved in several
biological processes, such as collagen maturation,
epithelial-mesenchymal transition, abnormal construction of the
extracellular matrix in tumor progression and amyloid-β peptide
deposition in Alzheimer's disease (24–28).
P4HA2 is a risk gene for high myopia, owing to structural and
quantitative alterations of collagen, which cause myopic axial
elongation of the eyeball (29–32).
Additionally, high P4HA2 expression is associated with the poor
prognosis of some malignant tumors, such as hepatocellular
carcinoma (27,33), gastric cancer (34), lung cancer (35), breast cancer (36–38),
pancreatic cancer (39), cervical
cancer (26,40), oral squamous cell carcinoma (41), melanoma (23) and B-cell lymphoma (42). A previous study has suggested that
P53, a tumor suppressor gene, activates P4HA2 expression, thereby
exerting anti-angiogenic effects and inhibiting tumor growth
(43). By contrast, another study
has indicated that although P53 can upregulate the mRNA expression
levels of P4HA2 in GBM, it does not lead to an increase in the
expression levels of P4HA2 protein or anti-angiogenic endostatin
(44). Therefore, the role of P4HA2
in GBM is unclear. Given its effects on numerous diseases, P4HA2
may also play a vital role in the occurrence and development of
GBM.
As aforementioned, GSCs promote the malignant
progression of GBM (5,6). The present study originally sought to
analyze the differences in gene expression levels between GSCs and
GBM cells to identify genes with high expression in GSCs that
significantly affected the prognosis of GBM for further research.
However, through bioinformatics analysis, it was revealed that all
the hub genes were downregulated in GSCs, and although the
expression levels of the gene with the most statistically
significant difference, P4HA2, were lower in GSCs than in GBM
cells, survival curve analysis indicated that lower expression
levels of P4HA2 corresponded to longer survival times.
Subsequently, CCK8, EdU incorporation, cell cycle, wound healing
and Transwell analyses were performed, demonstrating that P4HA2
promoted the proliferation and migration of U87 cells, and the
effect of promoting migration was more pronounced than that of
promoting proliferation, which was consistent with a previous study
(23). However, there are some
limitations in the present study. First, although as many samples
as possible were searched on the GPL570 platform, the sample size
was not large enough. Thus, future studies should attempt to
directly analyze the clinical tissue samples of patients with GBM
in order to obtain more definite conclusions. Additionally, the
mechanism by which P4HA2 may promote GBM progression is unclear,
which is undoubtedly an obstacle for clinical application. It is
well known that GSCs promote the progression of GBM, and P4HA2 has
a cancer-promoting effect. Therefore, low P4HA2 expression in GSCs
may be responsible for longer survival times in patients with GBM.
In addition, the present study hypothesized that P4HA2 may possibly
act as a switch mediating the transition from GSCs to GBM.
According to this hypothesis, in GSCs, when P4HA2 expression is
low, the switch is off, but after a stimulus increases P4HA2
expression, P4HA2 may induce GSCs to transform into GBM cells.
P4HA2, together with the changed extracellular matrix, may then
promote the continuous proliferation, migration and invasion of GBM
cells. Further investigation will be necessary to verify this
hypothesis in future studies. There have been similar studies
comparing GSCs and GBM samples to find specific biomarkers
(45–48), but few studies have focused on the
switch that transforms GSCs into GBM cells (49). The current findings may provide a new
therapeutic target for blocking the conversion of GSCs to GBM cells
and preventing GSCs from promoting the malignant progression of
GBM.
In conclusion, the present study identified that
P4HA2 expression in U87 cells was higher than in GSCs, and P4HA2
promoted U87 cell proliferation and migration via both
bioinformatics analysis and experimental verification. The current
results may provide new insights for further studies on the
transition from GSCs to GBM cells.
Acknowledgements
Not applicable.
Funding
The present study was supported by the National
Natural Science Foundation of China (grant no. 31171038), Jiangsu
Natural Science Foundation (grant no. BK2011385), Jiangsu ‘333’
program funding (grant no. BRA2016450), Application Research
Project of Nantong City (grant no. MS12017015-3) and the Training
Program of Innovation and Entrepreneurship for Undergraduates of
Xinglin College (grant no. 201813993007Y).
Availability of data and materials
The datasets used and/or analyzed during the current
study are available from the corresponding author on reasonable
request. The datasets generated and/or analyzed during the current
study are available in the Gene Expression Omnibus repository
(http://www.ncbi.nlm.nih.gov/geo/).
Authors' contributions
XHZ conceived and designed the study. YW collected
and analyzed the data, performed the experiments and drafted the
paper. XRZ, JW and RJ helped with experiments and preparing
figures. LZ and JQ helped with the data analysis and manuscript
revising. MT and GJ analyzed the data and revised the final paper.
XHZ and YW confirm the authenticity of the data. All authors have
read and approved the final manuscript.
Ethics approval and consent to
participate
Not applicable.
Patient consent for publication
Not applicable.
Competing interests
The authors declare that they have no competing
interests.
References
|
1
|
Camelo-Piragua S and Kesari S: Further
understanding of the pathology of glioma: Implications for the
clinic. Expert Rev Neurother. 16:1055–1065. 2016. View Article : Google Scholar : PubMed/NCBI
|
|
2
|
Stupp R, Hegi ME, Mason WP, van den Bent
MJ, Taphoorn MJ, Janzer RC, Ludwin SK, Allgeier A, Fisher B,
Belanger K, et al European Organisation for Research and Treatment
of Cancer Brain Tumour and Radiation Oncology Groups; National
Cancer Institute of Canada Clinical Trials Group, : Effects of
radiotherapy with concomitant and adjuvant temozolomide versus
radiotherapy alone on survival in glioblastoma in a randomised
phase III study: 5-year analysis of the EORTC-NCIC trial. Lancet
Oncol. 10:459–466. 2009. View Article : Google Scholar : PubMed/NCBI
|
|
3
|
Davis ME: Glioblastoma: Overview of
disease and treatment. Clin J Oncol Nurs. 20 (Suppl 5):S2–S8. 2016.
View Article : Google Scholar : PubMed/NCBI
|
|
4
|
De Sousa E, Melo F, Vermeulen L, Fessler E
and Medema JP: Cancer heterogeneity - a multifaceted view. EMBO
Rep. 14:686–695. 2013. View Article : Google Scholar : PubMed/NCBI
|
|
5
|
Yoshida GJ and Saya H: Therapeutic
strategies targeting cancer stem cells. Cancer Sci. 107:5–11. 2016.
View Article : Google Scholar : PubMed/NCBI
|
|
6
|
Lathia JD, Mack SC, Mulkearns-Hubert EE,
Valentim CL and Rich JN: Cancer stem cells in glioblastoma. Genes
Dev. 29:1203–1217. 2015. View Article : Google Scholar : PubMed/NCBI
|
|
7
|
Morgan MA and Canman CE: Replication
stress: An Achilles heel of glioma cancer stem-like cells. Cancer
Res. 78:6713–6716. 2018. View Article : Google Scholar : PubMed/NCBI
|
|
8
|
Ludwig K and Kornblum HI: Molecular
markers in glioma. J Neurooncol. 134:505–512. 2017. View Article : Google Scholar : PubMed/NCBI
|
|
9
|
Ouchi R, Okabe S, Migita T, Nakano I and
Seimiya H: Senescence from glioma stem cell differentiation
promotes tumor growth. Biochem Biophys Res Commun. 470:275–281.
2016. View Article : Google Scholar : PubMed/NCBI
|
|
10
|
Sakamoto D, Takagi T, Fujita M, Omura S,
Yoshida Y, Iida T and Yoshimura S: Basic gene expression
characteristics of glioma stem cells and human glioblastoma.
Anticancer Res. 39:597–607. 2019. View Article : Google Scholar : PubMed/NCBI
|
|
11
|
Tang Z, Li C, Kang B, Gao G, Li C and
Zhang Z: GEPIA: A web server for cancer and normal gene expression
profiling and interactive analyses. Nucleic Acids Res. 45:W98–W102.
2017. View Article : Google Scholar : PubMed/NCBI
|
|
12
|
Nakano I, Joshi K, Visnyei K, Hu B,
Watanabe M, Lam D, Wexler E, Saigusa K, Nakamura Y, Laks DR, et al:
Siomycin A targets brain tumor stem cells partially through a
MELK-mediated pathway. Neuro-oncol. 13:622–634. 2011. View Article : Google Scholar : PubMed/NCBI
|
|
13
|
Nakano I, Masterman-Smith M, Saigusa K,
Paucar AA, Horvath S, Shoemaker L, Watanabe M, Negro A, Bajpai R,
Howes A, et al: Maternal embryonic leucine zipper kinase is a key
regulator of the proliferation of malignant brain tumors, including
brain tumor stem cells. J Neurosci Res. 86:48–60. 2008. View Article : Google Scholar : PubMed/NCBI
|
|
14
|
Livak KJ and Schmittgen TD: Analysis of
relative gene expression data using real-time quantitative PCR and
the 2(-Delta Delta C(T)) method. Methods. 25:402–408. 2001.
View Article : Google Scholar : PubMed/NCBI
|
|
15
|
Xu L, Wang Y, Liu J, Zhu W and Mao S:
Morphological adaptation of sheep's rumen epithelium to high-grain
diet entails alteration in the expression of genes involved in cell
cycle regulation, cell proliferation and apoptosis. J Anim Sci
Biotechnol. 9:322018. View Article : Google Scholar : PubMed/NCBI
|
|
16
|
Luo Y, El Agha E, Turcatel G, Chen H, Chiu
J, Warburton D, Bellusci S, Qian BP, Menke DB and Shi W:
Mesenchymal adenomatous polyposis coli plays critical and diverse
roles in regulating lung development. BMC Biol. 13:422015.
View Article : Google Scholar : PubMed/NCBI
|
|
17
|
Liu W, Hahn H, Odze RD and Goyal RK:
Metaplastic esophageal columnar epithelium without goblet cells
shows DNA content abnormalities similar to goblet cell-containing
epithelium. Am J Gastroenterol. 104:816–824. 2009. View Article : Google Scholar : PubMed/NCBI
|
|
18
|
Wesseling P and Capper D: WHO 2016
Classification of gliomas. Neuropathol Appl Neurobiol. 44:139–150.
2018. View Article : Google Scholar : PubMed/NCBI
|
|
19
|
Chen R, Smith-Cohn M, Cohen AL and Colman
H: Glioma subclassifications and their clinical significance.
Neurotherapeutics. 14:284–297. 2017. View Article : Google Scholar : PubMed/NCBI
|
|
20
|
Hatzimichael E, Lo Nigro C, Lattanzio L,
Syed N, Shah R, Dasoula A, Janczar K, Vivenza D, Monteverde M,
Merlano M, et al: The collagen prolyl hydroxylases are novel
transcriptionally silenced genes in lymphoma. Br J Cancer.
107:1423–1432. 2012. View Article : Google Scholar : PubMed/NCBI
|
|
21
|
Aro E, Salo AM, Khatri R, Finnilä M,
Miinalainen I, Sormunen R, Pakkanen O, Holster T, Soininen R, Prein
C, et al: Severe extracellular matrix abnormalities and
chondrodysplasia in mice lacking collagen prolyl 4-hydroxylase
isoenzyme II in combination with a reduced amount of isoenzyme I. J
Biol Chem. 290:16964–16978. 2015. View Article : Google Scholar : PubMed/NCBI
|
|
22
|
Martini D, Giannaccini M, Guadagni V,
Marracci S, Giudetti G and Andreazzoli M: Comparative analysis of
p4ha1 and p4ha2 expression during Xenopus laevis development. Int J
Dev Biol. 63:311–316. 2019. View Article : Google Scholar : PubMed/NCBI
|
|
23
|
Atkinson A, Renziehausen A, Wang H, Lo
Nigro C, Lattanzio L, Merlano M, Rao B, Weir L, Evans A, Matin R,
et al: Collagen prolyl hydroxylases are bifunctional growth
regulators in melanoma. J Invest Dermatol. 139:1118–1126. 2019.
View Article : Google Scholar : PubMed/NCBI
|
|
24
|
Nokelainen M, Nissi R, Kukkola L,
Helaakoski T and Myllyharju J: Characterization of the human and
mouse genes for the alpha subunit of type II prolyl 4-hydroxylase.
Identification of a previously unknown alternatively spliced exon
and its expression in various tissues. Eur J Biochem.
268:5300–5309. 2001. View Article : Google Scholar : PubMed/NCBI
|
|
25
|
Shi R, Gao S, Smith AH, Li H, Shao M,
Shangguan J, Zhang J, Xu J, Ye J, Graham LM, et al:
Superoxide-induced Type I collagen secretion depends on prolyl
4-hydroxylases. Biochem Biophys Res Commun. 529:1011–1017. 2020.
View Article : Google Scholar : PubMed/NCBI
|
|
26
|
Cao Y, Han Q, Li J, Jia Y, Zhang R and Shi
H: P4HA2 contributes to cervical cancer progression via inducing
epithelial-mesenchymal transition. J Cancer. 11:2788–2799. 2020.
View Article : Google Scholar : PubMed/NCBI
|
|
27
|
Wang T, Fu X, Jin T, Zhang L, Liu B, Wu Y,
Xu F, Wang X, Ye K, Zhang W, et al: Aspirin targets P4HA2 through
inhibiting NF-κB and LMCD1-AS1/let-7g to inhibit tumour growth and
collagen deposition in hepatocellular carcinoma. EBioMedicine.
45:168–180. 2019. View Article : Google Scholar : PubMed/NCBI
|
|
28
|
Wang C, Saar V, Leung KL, Chen L and Wong
G: Human amyloid β peptide and tau co-expression impairs behavior
and causes specific gene expression changes in Caenorhabditis
elegans. Neurobiol Dis. 109:88–101. 2018. View Article : Google Scholar : PubMed/NCBI
|
|
29
|
Napolitano F, Di Iorio V, Testa F, Tirozzi
A, Reccia MG, Lombardi L, Farina O, Simonelli F, Gianfrancesco F,
Di Iorio G, et al: Autosomal-dominant myopia associated to a novel
P4HA2 missense variant and defective collagen hydroxylation. Clin
Genet. 93:982–991. 2018. View Article : Google Scholar : PubMed/NCBI
|
|
30
|
Guo H, Tong P, Liu Y, Xia L, Wang T, Tian
Q, Li Y, Hu Y, Zheng Y, Jin X, et al: Mutations of P4HA2 encoding
prolyl 4-hydroxylase 2 are associated with nonsyndromic high
myopia. Genet Med. 17:300–306. 2015. View Article : Google Scholar : PubMed/NCBI
|
|
31
|
Napolitano F, Di Iorio V, Di Iorio G,
Melone MA, Gianfrancesco F, Simonelli F, Esposito T, Testa F and
Sampaolo S: Early posterior vitreous detachment is associated with
LAMA5 dominant mutation. Ophthalmic Genet. 40:39–42. 2019.
View Article : Google Scholar : PubMed/NCBI
|
|
32
|
Cai XB, Zheng YH, Chen DF, Zhou FY, Xia
LQ, Wen XR, Yuan YM, Han F, Piao SY, Zhuang W, et al: Expanding the
phenotypic and genotypic landscape of nonsyndromic high myopia: A
cross-sectional study in 731 chinese patients. Invest Ophthalmol
Vis Sci. 60:4052–4062. 2019. View Article : Google Scholar : PubMed/NCBI
|
|
33
|
Feng GX, Li J, Yang Z, Zhang SQ, Liu YX,
Zhang WY, Ye LH and Zhang XD: Hepatitis B virus X protein promotes
the development of liver fibrosis and hepatoma through
downregulation of miR-30e targeting P4HA2 mRNA. Oncogene.
36:6895–6905. 2017. View Article : Google Scholar : PubMed/NCBI
|
|
34
|
Zhang T, Piao HY, Guo S, Zhao Y, Wang Y,
Zheng ZC and Zhang J: LncRNA PCGEM1 enhances metastasis and gastric
cancer invasion through targeting of miR-129-5p to regulate P4HA2
expression. Exp Mol Pathol. 116:1044872020. View Article : Google Scholar : PubMed/NCBI
|
|
35
|
Pankova D, Jiang Y, Chatzifrangkeskou M,
Vendrell I, Buzzelli J, Ryan A, Brown C and O'Neill E: RASSF1A
controls tissue stiffness and cancer stem-like cells in lung
adenocarcinoma. EMBO J. 38:e1005322019. View Article : Google Scholar : PubMed/NCBI
|
|
36
|
Toss MS, Miligy IM, Gorringe KL, AlKawaz
A, Khout H, Ellis IO, Green AR and Rakha EA: Prolyl-4-hydroxylase α
subunit 2 (P4HA2) expression is a predictor of poor outcome in
breast ductal carcinoma in situ (DCIS). Br J Cancer. 119:1518–1526.
2018. View Article : Google Scholar : PubMed/NCBI
|
|
37
|
Xiong G, Deng L, Zhu J, Rychahou PG and Xu
R: Prolyl-4-hydroxylase α subunit 2 promotes breast cancer
progression and metastasis by regulating collagen deposition. BMC
Cancer. 14:12014. View Article : Google Scholar : PubMed/NCBI
|
|
38
|
Gilkes DM, Bajpai S, Chaturvedi P, Wirtz D
and Semenza GL: Hypoxia-inducible factor 1 (HIF-1) promotes
extracellular matrix remodeling under hypoxic conditions by
inducing P4HA1, P4HA2, and PLOD2 expression in fibroblasts. J Biol
Chem. 288:10819–10829. 2013. View Article : Google Scholar : PubMed/NCBI
|
|
39
|
Hu D, Ansari D, Pawłowski K, Zhou Q, Sasor
A, Welinder C, Kristl T, Bauden M, Rezeli M, Jiang Y, et al:
Proteomic analyses identify prognostic biomarkers for pancreatic
ductal adenocarcinoma. Oncotarget. 9:9789–9807. 2018. View Article : Google Scholar : PubMed/NCBI
|
|
40
|
Li Q, Wang Q, Zhang Q and Zhang J and
Zhang J: Collagen prolyl 4-hydroxylase 2 predicts worse prognosis
and promotes glycolysis in cervical cancer. Am J Transl Res.
11:6938–6951. 2019.PubMed/NCBI
|
|
41
|
Chang KP, Yu JS, Chien KY, Lee CW, Liang
Y, Liao CT, Yen TC, Lee LY, Huang LL, Liu SC, et al: Identification
of PRDX4 and P4HA2 as metastasis-associated proteins in oral cavity
squamous cell carcinoma by comparative tissue proteomics of
microdissected specimens using iTRAQ technology. J Proteome Res.
10:4935–4947. 2011. View Article : Google Scholar : PubMed/NCBI
|
|
42
|
Jiang W, Zhou X, Li Z, Liu K, Wang W, Tan
R, Cong X, Shan J, Zhan Y, Cui Z, et al: Prolyl 4-hydroxylase 2
promotes B-cell lymphoma progression via hydroxylation of Carabin.
Blood. 131:1325–1336. 2018. View Article : Google Scholar : PubMed/NCBI
|
|
43
|
Teodoro JG, Parker AE, Zhu X and Green MR:
p53-mediated inhibition of angiogenesis through up-regulation of a
collagen prolyl hydroxylase. Science. 313:968–971. 2006. View Article : Google Scholar : PubMed/NCBI
|
|
44
|
Berger B, Capper D, Lemke D, Pfenning PN,
Platten M, Weller M, von Deimling A, Wick W and Weiler M: Defective
p53 antiangiogenic signaling in glioblastoma. Neuro-oncol.
12:894–907. 2010. View Article : Google Scholar : PubMed/NCBI
|
|
45
|
Trépant AL, Bouchart C, Rorive S, Sauvage
S, Decaestecker C, Demetter P and Salmon I: Identification of OLIG2
as the most specific glioblastoma stem cell marker starting from
comparative analysis of data from similar DNA chip microarray
platforms. Tumour Biol. 36:1943–1953. 2015. View Article : Google Scholar
|
|
46
|
Lathia JD, Gallagher J, Heddleston JM,
Wang J, Eyler CE, Macswords J, Wu Q, Vasanji A, McLendon RE,
Hjelmeland AB, et al: Integrin alpha 6 regulates glioblastoma stem
cells. Cell Stem Cell. 6:421–432. 2010. View Article : Google Scholar : PubMed/NCBI
|
|
47
|
Bradshaw A, Wickremsekera A, Tan ST, Peng
L, Davis PF and Itinteang T: Cancer Stem Cell Hierarchy in
Glioblastoma Multiforme. Front Surg. 3:212016. View Article : Google Scholar : PubMed/NCBI
|
|
48
|
Shi Y, Guryanova OA, Zhou W, Liu C, Huang
Z, Fang X, Wang X, Chen C, Wu Q, He Z, et al: Ibrutinib inactivates
BMX-STAT3 in glioma stem cells to impair malignant growth and
radioresistance. Sci Transl Med. 10:102018. View Article : Google Scholar : PubMed/NCBI
|
|
49
|
Zhang J, Wang J, Marzese DM, Wang X, Yang
Z, Li C, Zhang H, Zhang J, Chen CC, Kelly DF, et al: B7H3 regulates
differentiation and serves as a potential biomarker and theranostic
target for human glioblastoma. Lab Invest. 99:1117–1129. 2019.
View Article : Google Scholar : PubMed/NCBI
|