Introduction
Lung cancer is the most common malignant tumor in
the world and the cancer with the highest morbidity and lethality
rates, causing >1 million deaths every year (1). In addition, lung cancer causes earlier
mortality than other cancer types, decreasing the patient lifespan
by an average of 5.75 years (2). In
China in 2015, lung cancer had morbidity and mortality rates of
57.26 per 100,000 and 45.87 per 100,000 individuals, respectively
(3). According to histological
classification, lung cancer has four major types: Adenocarcinoma,
squamous cell carcinoma, large cell carcinoma and small cell
carcinoma. Among all the subtypes of lung cancer, lung
adenocarcinoma (LUAD) is the most heterogeneous and aggressive
subtype (4). In the past few
decades, the incidence of LUAD has increased and it has become one
of the most common lung cancer types (5). LUAD accounts for ~40% of all lung
cancer cases. Symptomatic LUAD is usually diagnosed at an advanced
stage, and >80% of patients cannot be operated on. Screening and
treatment of early stage LUAD can effectively decrease the
mortality rate (6). However, the
utilization of traditional chest X-rays, sputum tests and
bronchoscopies is limited in lung cancer screening due to their low
detection rate and high discomfort level. Low-dose computed
tomography (LDCT) screening is a better choice for lung cancer
screening. LDCT examination is a fast procedure and the radiation
dose is significantly lower than that of conventional chest CT,
being equivalent to the effective radiation dose of chest X-rays.
Moreover, the clarity of the chest structure and the sensitivity
and accuracy of chest lesions detected by LDCT are greater than
that of conventional chest X-rays. In China, the utilization of
LDCT results in a significant increase in the detection of
early-stage lung cancer, especially in females (7,8).
Unfortunately, the low number of healthcare providers that can
perform LDCT and the high price of this test limit its widespread
use (9).
Liquid biopsy includes the detection of tumor
markers (TMs), circulating tumor DNA, circulating tumor cells and
other molecules. This type of biopsy is non-invasive and has been
widely used in recent years (10).
Detection of TMs in the blood was first employed in 1963, when
α-fetoprotein (AFP) and carcinoembryonic antigen (CEA) were
determined to be cancer markers (11). With the development of monoclonal
antibody technology, hundreds of TMs have been discovered and
widely used for detection clinically. AFP is a glycoprotein and is
employed as a cancer biomarker, particularly in liver cancer
(12). CEA is an oncofetal protein
and a cell adhesion molecule that is associated with tumor
invasion, dissemination, metastasis and immune suppression
(13). The serum CEA level conveys
prognostic information and can predict recurrence and patient
mortality in lung cancer cases (14,15).
Carbohydrate antigen (CA)125, CA153, CA199 and CA724 are all
membrane antigens that have been reported to be useful biomarkers
in patients with lung, breast and ovarian cancer (16,17).
Cytokeratin 19 fragment 21-1 (CYFRA211) is a cell structural
protein that can be released into the blood from degraded tumor
cells (18). Elevated serum CYFRA211
levels have been found in a variety of organs, including the lungs
and liver, and in the breast (19–21). The
glycolytic enzyme neuron-specific enolase (NSE) mainly exists in
the central and neuroendocrine tissues. NSE has been reported as a
useful marker in both non-small cell lung cancer (NSCLC) and SCLC
(22).
MicroRNAs (miRNAs/miRs) are small non-coding RNAs of
~20 nucleotides that regulate target gene expression at either the
translational or post-transcriptional level and can also function
as biomarkers (23). miRNAs are
dysregulated in numerous types of diseases, particularly cancer. It
has been reported by some researchers that circulating miRNAs in
the plasma or serum could be potential biomarkers and therapeutic
targets for LUAD. The miR-200 family could function as a prognostic
marker of LUAD (24). miR-1205 may
also be a predictor of overall survival (OS) in LUAD (25). In addition, miR-198 has been observed
to serve as an independent prognostic factor for survival (26). However, the complex internal
environment limits the application of miRNAs. For example, RNase is
abundant in vivo, which could result in RNA degradation
(27). Extracellular vesicles (EVs)
are small vesicles that are shed from all types of live cells. EVs
contain proteins, mRNAs, miRNAs and other molecules, and function
to transport them to distant target cells. EV cargo varies
depending on the health of the cell and the pathological state. The
membrane structure of EVs provides protection for delivery of these
molecules and ensures their stability, allowing these molecules to
function as TMs (28). The present
study searched for potential markers of LUAD via bioinformatics
analysis and determined that miR-10b may be a good candidate. Next,
the expression of miR-10b was determined in both plasma and EVs,
and the diagnostic power of miR-10b was then compared with that of
TMs such as AFP and CEA.
Materials and methods
Subjects and sample collection
Between May 2018 and June 2020, 80 subjects who were
diagnosed with LUAD and 69 control subjects were recruited from The
Affiliated Suzhou Hospital of Nanjing Medical University (Suzhou,
China). The Ethics Review Board of The Affiliated Suzhou Hospital
of Nanjing Medical University approved the study. Informed consent
was obtained from all participants. The subjects were treated
according to the principles described in the Declaration of
Helsinki. Patient clinical parameters, including sex and age, were
collected by reviewing the medical records.
For patients with LUAD, blood was drawn after
diagnosis and before any treatment. Patients with a history of
cancer or severe clinical symptoms and genetic diseases were
excluded from the study. The control samples were obtained only
from healthy subjects who came to the hospital for a physical
examination and patients with benign lung disease, and not from
patients with other tumor types. EDTA blood tubes were employed for
blood collection. For plasma separation, blood samples were
centrifuged at 1,600 × g for 10 min at room temperature, and the
plasma samples were stored in a refrigerator at −80°C for later
use.
EV isolation and identification
Before EV isolation, plasma samples were centrifuged
at 2,000 × g for 10 min at 4°C and 10,000 × g for 30 min at 4°C to
separate out the cells and apoptotic bodies. Next, 400 µl of 30%
PEG4000 (1 M NaCl) was added and incubated with 800 µl of
supernatant for 3 h at 4°C. After centrifugation at 3,000 × g for
15 min at 4°C, the pellet was subjected to further experiments. The
Nano platform (IZON Science, Ltd.) was utilized to analyse the size
distribution of the pellet.
Western blotting
Western blotting (WB) was employed to detect the
signature proteins of EVs, including tumor susceptibility gene 101
protein (TSG101) and cluster of differentiation 9 (CD9), with GAPDH
as the reference protein. Exosomes were lysed with RIPA buffer
(Enzo Biochem, Inc.), and the protein concentrations were assayed
using a BCA protein assay kit (Thermo Fisher Scientific, Inc.).
Anti-TSG101 (catalog no. ab133586; 1:5,000), anti-CD9 (catalog no.
ab223052; 1:5,000) and anti-GAPDH (catalog no. ab8245; 1:5,000)
(all Abcam) were used as the primary antibodies. The detailed WB
protocol was in keeping with a previously reported protocol
(29). The density of the WB image
was analyzed using ImageJ software (National Institutes of
Health).
RNA isolation and qPCR
RNA isolation and qPCR were performed in accordance
with the studies by Shan et al (30) and Su et al (31). RNAiso Plus (Takara Biotechnology Co.,
Ltd.) was employed to isolate RNA from EVs and plasma according to
the manufacturer's instructions. In detail, 1 ml RNAiso Plus was
added to the pellets or 200 µl plasma and mixed with a homogenizer.
Next, 200 µl chloroform was added and mixed with a vortex
oscillator. The mixture was placed at room temperature for 10 min
and centrifuged at 12,000 × g for 15 min at 4°C. The supernatant
was transferred to a new 1.5-ml centrifuge tube and mixed with an
equal volume of isopropyl alcohol. After overnight incubation at
−20°C, the solution was centrifuged at 12,000 × g for 15 min at
4°C. The supernatant was discarded, and 75% ethanol was prepared
with DEPC water to wash the RNA. After centrifugation at 12,000 × g
for 5 min at 4°C, the remaining liquid was removed with blotting
paper, and the inverted position was maintained on new blotting
paper for 15–30 min. The RNA was dissolved in 10 µl DEPC water.
A total of 5 control subjects and 5 patients with
LUAD were selected to perform a preliminary experiment. A U6 snRNA
Normalization RT-PCR Quantitation kit (Shanghai GenePharma Co.,
Ltd.) was employed to perform reverse transcription of the RNA. The
RT-PCR system used a final reaction volume of 20 µl, which
contained 4 µl 5X MMLV RT Buffer, 0.75 µl dNTP (10 mM), 1.2 µl
miRNA RT primers (1 µM), 0.25 µl RNasin (40 U/µl), 0.2 µl MMLV
Reverse Transcriptase, 10 µl RNA sample (1–3 µg) and 3.6 µl
RNase-free H2O. The standard thermocycling conditions
were as follows: 25°C for 30 min, 42°C for 30 min, 85°C for 5 min
and then storage at 4°C. Next, Cq values were measured via qPCR.
Three Hairpin-it™ miRNAs qPCR Quantitation kit reagents boxes
(Shanghai GenePharma Co., Ltd.) were employed to perform qPCR. All
the primer sequences used in the study are listed in Table I. The qPCR system used a final
reaction volume of 20 µl, which contained 10 µl 2X Real-time PCR
Master Mix Buffer (FAM), 0.4 µl miRNA specific primer set (10 µM),
0.4 µl miRNA specific probe (10 µM), 0.4 µl ROX reference dye
(50X), 0.2 µl Taq DNA polymerase (5 U/µl), 2 µl cDNA and 7.6 µl
sterilized H2O. The standard thermocycling conditions
were as follows: 95°C for 3 min, followed by 40 cycles of 95°C for
12 sec and 62°C for 40 sec. The signal was then collected at 62°C.
U6 snRNA was used as an internal reference for normalization,
relative to which the expression of miRNAs was calculated using the
comparison 2−∆∆Cq method (32). The EV-associated and plasma miR-10b,
miR-200a and miR-141 expression levels in the LUAD and control
groups were compared. Synthetic miR-10b was diluted to
10−3, 10−4, 10−5, 10−6,
10−7 and 10−8 µM. RNA (2 µl) from samples and
different concentrations of synthetic miR-10b were reverse
transcribed into cDNA and then were used to establish standard
curve. The concentration of miR-10b in samples was calculated
according to the established standard curve.
 | Table I.Primer sequences used for
quantitative PCR. |
Table I.
Primer sequences used for
quantitative PCR.
| Gene | Primer sequences
(5′- 3′) |
|---|
| U6 snRNA | Forward:
CTCGCTTCGGCAGCACA |
|
| Reverse:
AACGCTTCACGAATTTGCGT |
| miR-10b | Forward:
AACCCATACCCTGTAGAACCGAA |
|
| Reverse:
GTGCAGGGTCCGAGGT |
| miR-141 | Forward:
AGACCTCACCTGGCCTGTGGCC |
|
| Reverse:
GAACCCACCCGGGAGCCATCTT |
| miR-200a | Forward:
TAACACTGTCTGGTAACGATGT |
|
| Reverse:
CATCTTACCGGACAGTGCTGGA |
Detection of TMs
The AFP, NSE, CEA, CYFRA211,
pro-gastrin-releasing-peptide (Pro-GRP), CA125, CA153, CA199 and
CA724 were detected by the Department of Laboratory Medicine, The
Affiliated Suzhou Hospital of Nanjing Medical University. Blood was
drawn after diagnosis and before any treatment. After standing for
20 min, the serum was separated by centrifugation at 1,600 × g for
10 min at room temperature and electrochemiluminescence detection
was used. The serum samples were tested on the same day. Results
were obtained from the Department of Pathology.
Bioinformatics analysis
The Cancer Genome Atlas (TCGA) (https://www.cancer.gov/about-nci/organization/ccg/research/structural-genomics/tcga)
survival analysis was performed with Kaplan-Meier Plotter
(https://kmplot.com/analysis/) (33). The expression data of the target
miRNA in the GSE114711 dataset (34)
were obtained from the Gene Expression Omnibus (GEO) database
(https://www.ncbi.nlm.nih.gov/geo/)
using R v3.5.3 (https://cran.r-project.org/bin/windows/base/old/3.5.3/).
Target gene prediction was performed using TarBase (35), TargetScan (36) and microT-CDS (37). The function of target genes was
analyzed via Kyoto Encyclopedia of Genes and Genomes (KEGG;
http://www.kegg.jp/kegg/kegg1.html),
Gene Ontology (GO; http://david.ncifcrf.gov/) annotation and
protein-protein interaction (https://string-db.org/) analyses. The expression of
genes was analyzed using UALCAN (38). The networks of target genes were
constructed with Cytoscape v3.6.0 (http://chianti.ucsd.edu/cytoscape-3.6.0/) and
GeneMANIA (39).
Statistical analysis
Data are presented as the mean ± standard deviation.
Experiments were repeated in triplicate. Data were analyzed using
SPSS v.19 (IBM Corp.). A non-parametric Mann-Whitney U test was
employed to compare miRNA expression levels between the control and
LUAD groups. A Wilcoxon signed-rank test was employed to compare
miRNA expression levels between EVs and plasma. A non-parametric
Kruskal-Wallis test was employed to compare miRNA expression levels
at different stages. Bonferroni's correction was used for the
correction of multiple comparisons. P<0.05 was considered to
indicate a statistically significant difference. Pearson's
correlation analysis was employed to analyze the correlation
between miRNA expression levels and age. A receiver operating
characteristic (ROC) curve and the area under the ROC curve (AUC)
were established to assess the potential of miR-10b to distinguish
LUAD patients from individuals in the control group. Kaplan-Meier
plotter (https://kmplot.com/analysis/) was
used to analyze the survival curve of miRNAs (33). The OS from 0 to 120 months of
patients with LUAD and control subjects was calculated from data
recorded in the TCGA database. The distributions of OS time were
analyzed using the Kaplan-Meier method and compared using a
two-sided log-rank test.
Results
Description of subjects
In total, 149 patients were enrolled in this study,
including 69 control subjects and 80 patients with LUAD (Table II). The age of the patients ranged
from 21 to 82 years old. There were 66 female patients and 83 male
patients. Of the 80 patients with LUAD, 64 had early stage disease
(stage I + II). The number of patients with lesions located in the
right or left lobe was similar. A total of 70 patients had only 1
lesion, 2 patients had 2 lesions and only 1 patient had 3
lesions.
| Table II.Summary of patient characteristics
(n=149). |
Table II.
Summary of patient characteristics
(n=149).
| Characteristic | Value |
|---|
| Diagnosis, n
(%) |
|
|
Control | 69 (46.3) |
|
LUAD | 80 (53.7) |
| Age, years |
| Mean ±
SD | 59.93±13.26 |
|
Range | 21-82 |
| Sex, n (%) |
|
Female | 66 (44.3) |
|
Male | 83 (55.7) |
| Stage, n (%) |
| I | 58 (38.9) |
| II | 16 (10.7) |
|
III | 5
(3.4) |
|
Unknown | 1
(0.7) |
| Lobe location, n
(%) |
| Left
lower | 18 (12.1) |
| Left
upper | 21 (14.1) |
| Right
lower | 15 (10.1) |
| Right
middle | 5
(3.4) |
| Right
upper | 19 (12.8) |
| Right
upper, lower | 1
(0.7) |
| Right
upper, middle | 1
(0.7) |
| Lesions, n (%) |
| 1 | 70 (47.0) |
| 2 | 9
(6.0) |
| 3 | 1
(0.7) |
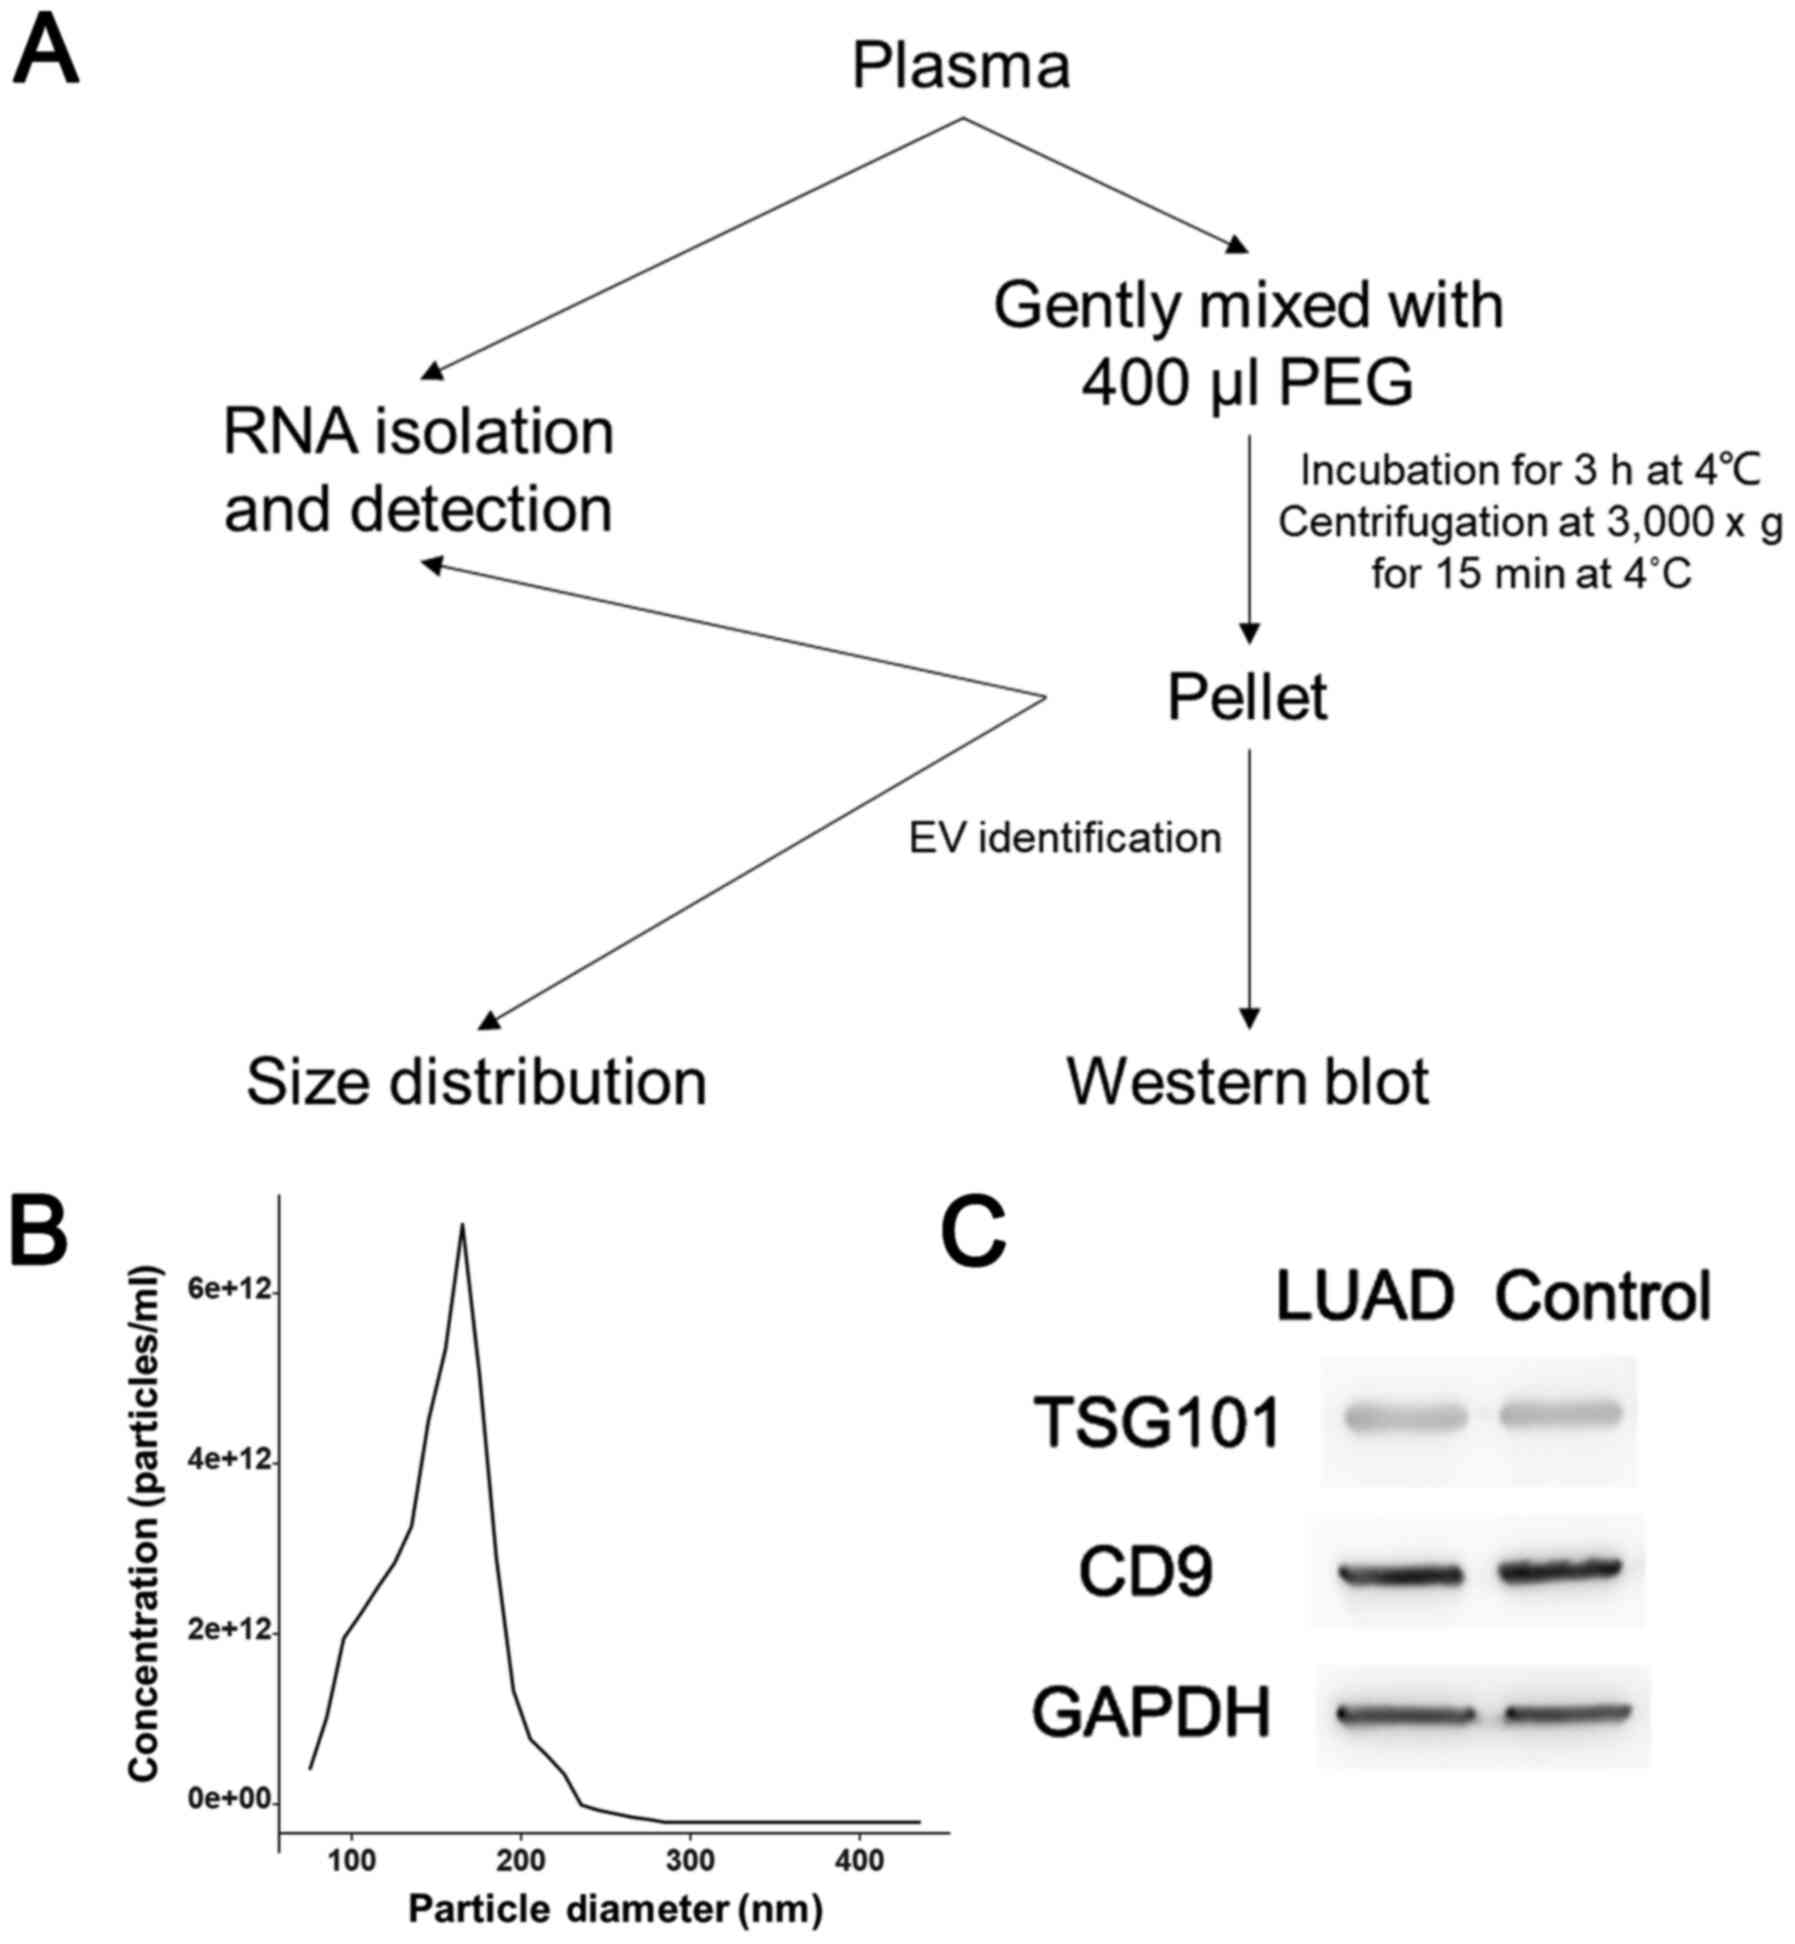
EV isolation and identification
The procedure for isolating EVs is shown in Fig. 1A. The size distribution analysis
indicated that the pellets contained vesicles ranging in size from
80 to 280 nm (Fig. 1B). Signature
proteins, including TSG101 and CD9, and the reference GAPDH, were
detected by WB analysis (Fig. 1C).
The results of the density analysis are shown in Fig. S1. The WB results indicated that the
pellets obtained by PEG precipitation did contain EVs, and there
was no significant difference in relative protein expression
between the LUAD group and control group.
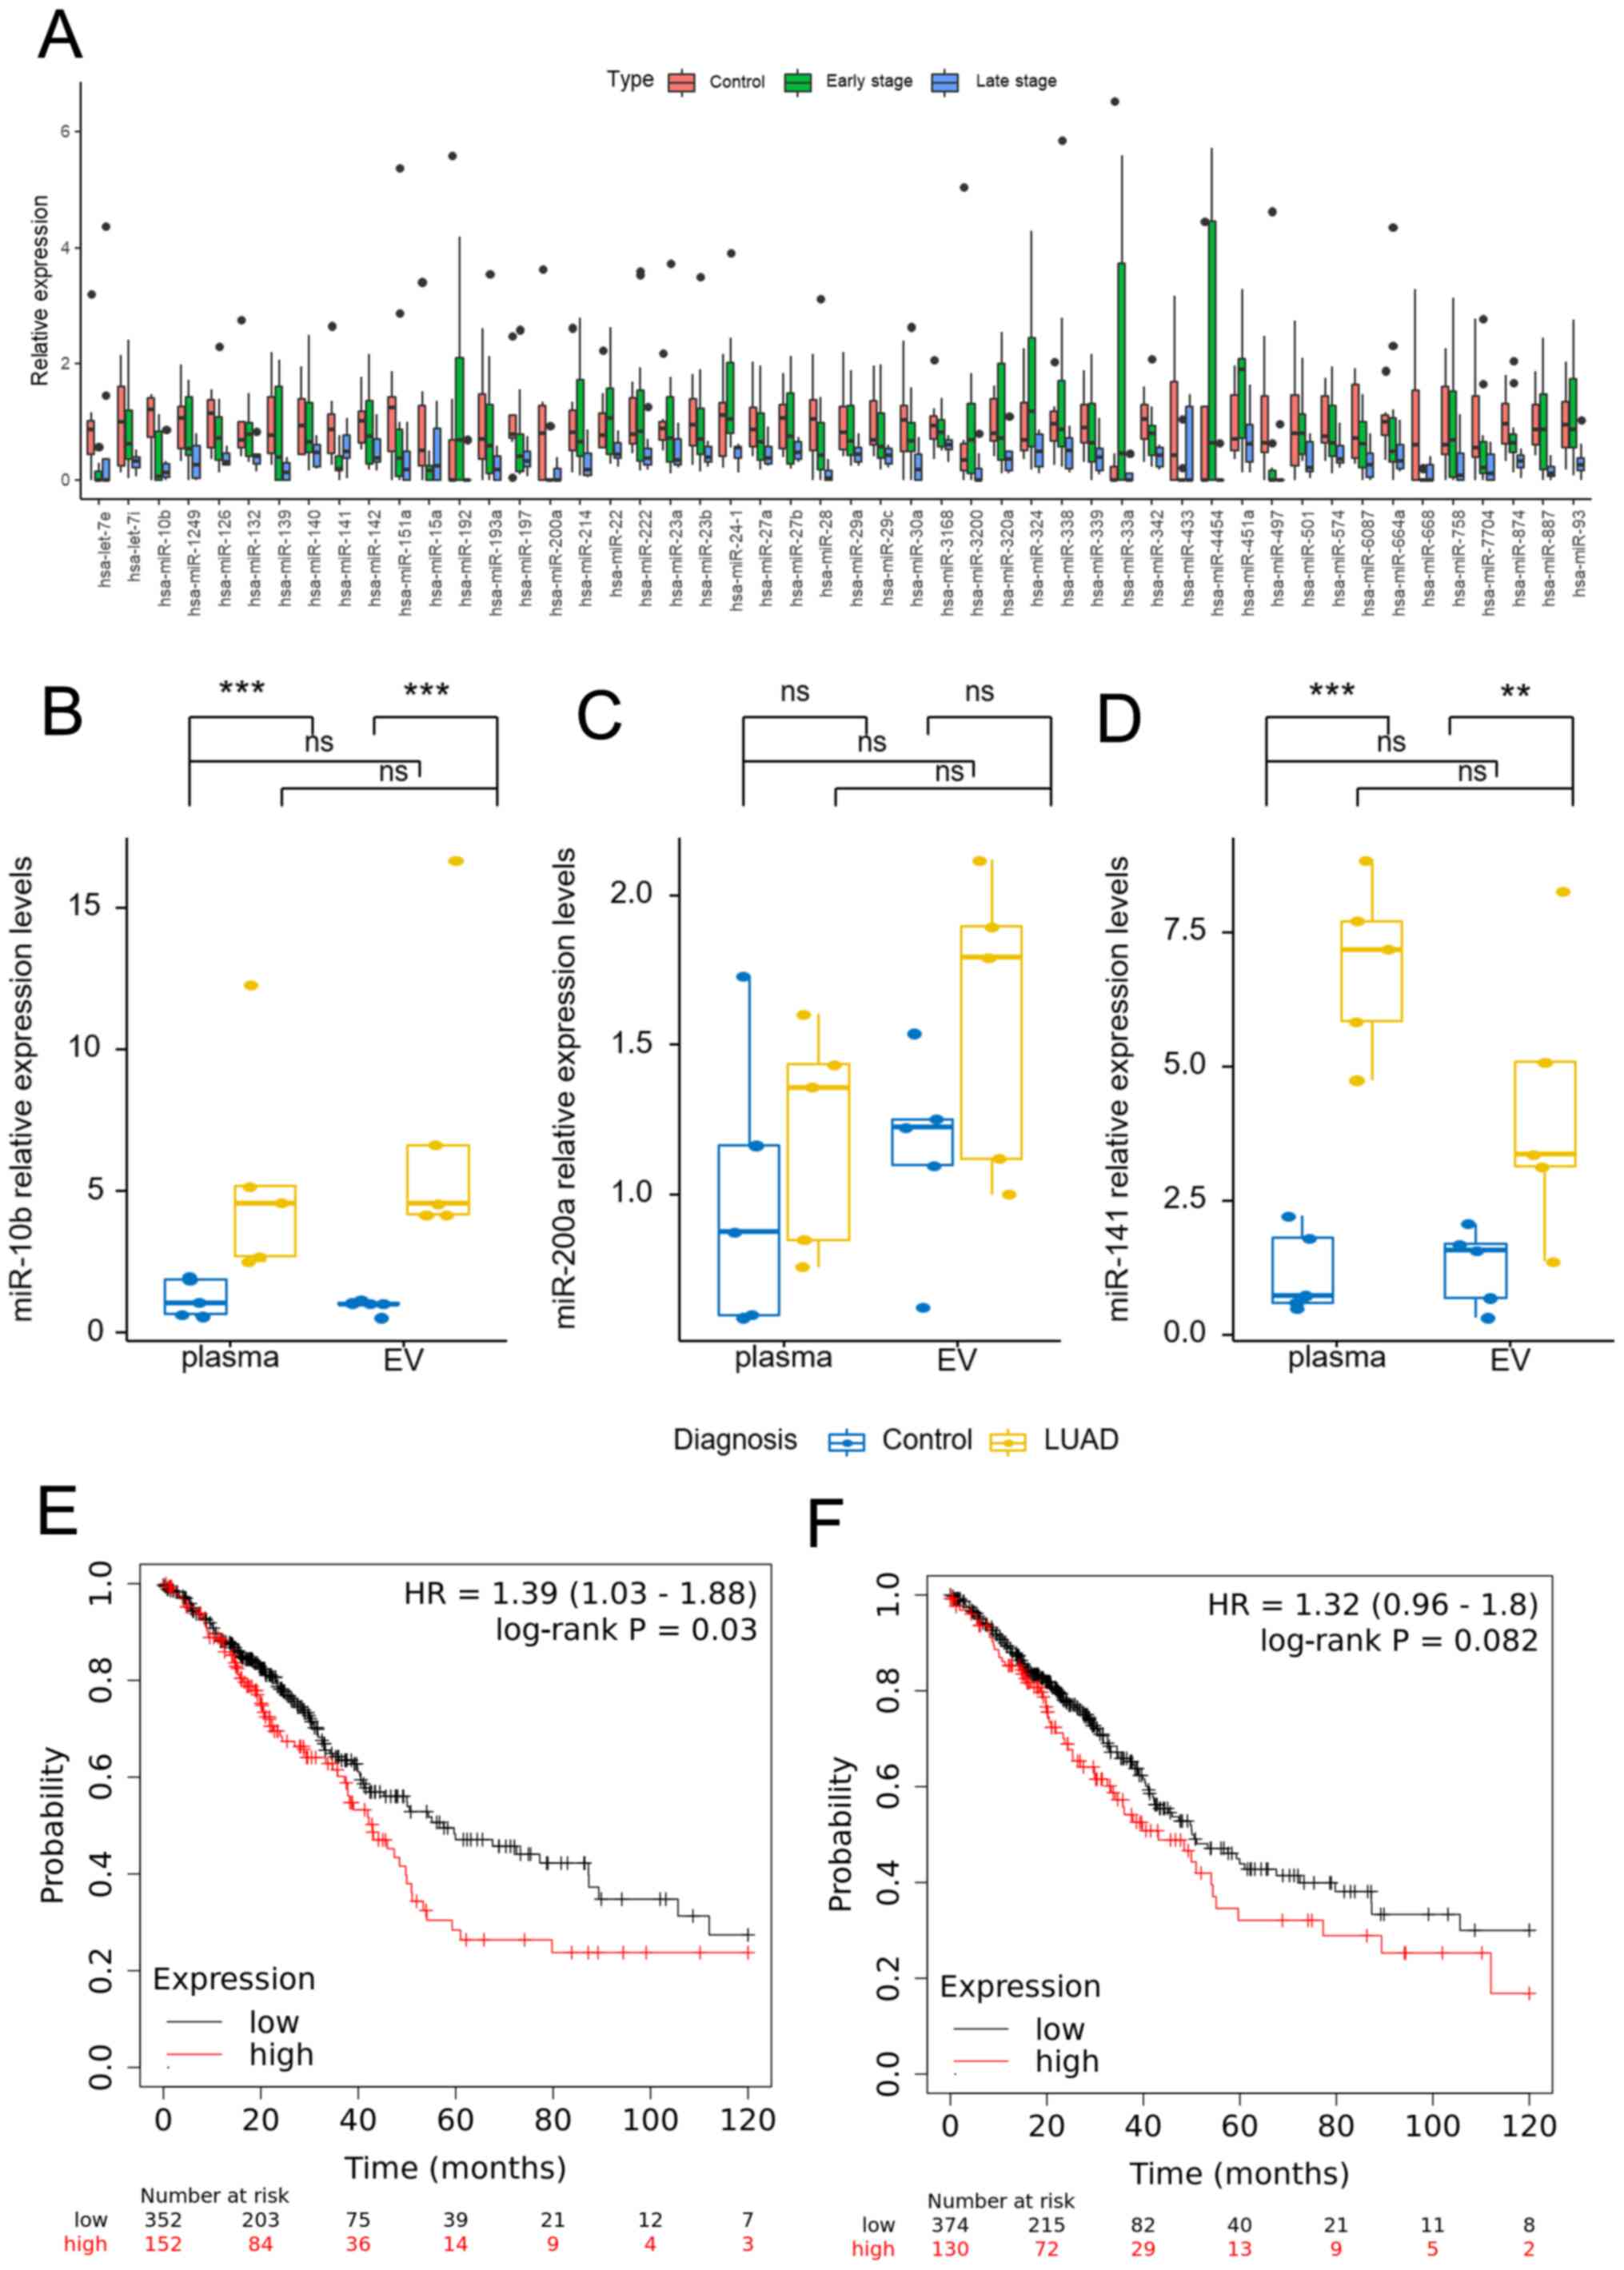
Search for potential miRNA
markers
Obtained from the GEO database, the GSE114711
dataset contains small-RNA sequencing data for plasma-derived EVs
from a cohort of patients with NSCLC at different stages (34). These patients included 7 control
smokers, 11 patients with early stage NSCLC and 8 patients with
late-stage NSCLC. Among the 3,762 detected miRNAs, there were no
miRNAs that with significantly increased expression. However, 7
miRNAs in early stage disease and 33 miRNAs in late-stage disease
exhibited significantly decreased expression compared with the
control group, and 16 miRNAs showed significantly decreased
expression in the late stages compared with the early stages. Using
the expression in the control group as a reference, the expression
of these miRNAs is shown in Fig. 2A.
As the 80 outpatients with LUAD were primarily early stage lung
cancer patients, a further comparison was made of the expression
levels of the 7 miRNAs in the early stage and control groups
(Table SI). The results showed that
miR-10b, miR-141 and miR-200a were the 3 miRNAs that exhibited the
most change in expression. The expression levels of miR-10b,
miR-141 and miR-200a were then measured in 5 control subjects and 5
patients with LUAD (Fig. 2B-D). The
non-parametric Mann-Whitney U test showed that the expression
levels of plasma or EV miR-10b and miR-141 in the LUAD group were
significantly higher than those in the control group (P<0.05),
while there was no significant difference in miR-200a expression
level. The Wilcoxon signed-rank test showed that there was no
significant difference between the plasma and EV miR-10b and
miR-141 expression levels in the control or LUAD groups
(P>0.05). For miR-200a, there was no significant difference
between plasma and EV in the control group, but there was a
significant difference in the LUAD group (P=0.043). After
Bonferroni's correction, there was no significant difference in
miR-200a level in the LUAD group (P>0.05). Kaplan-Meier plotter
was used to analyze the survival curve of miR-10b and miR-141
(Fig. 2E and F). miR-10b had a
hazard ratio (HR) of 1.39 (P=0.039), while miR-141 had an HR of
1.32 (P=0.082). Finally, miR-10b was selected for further
research.
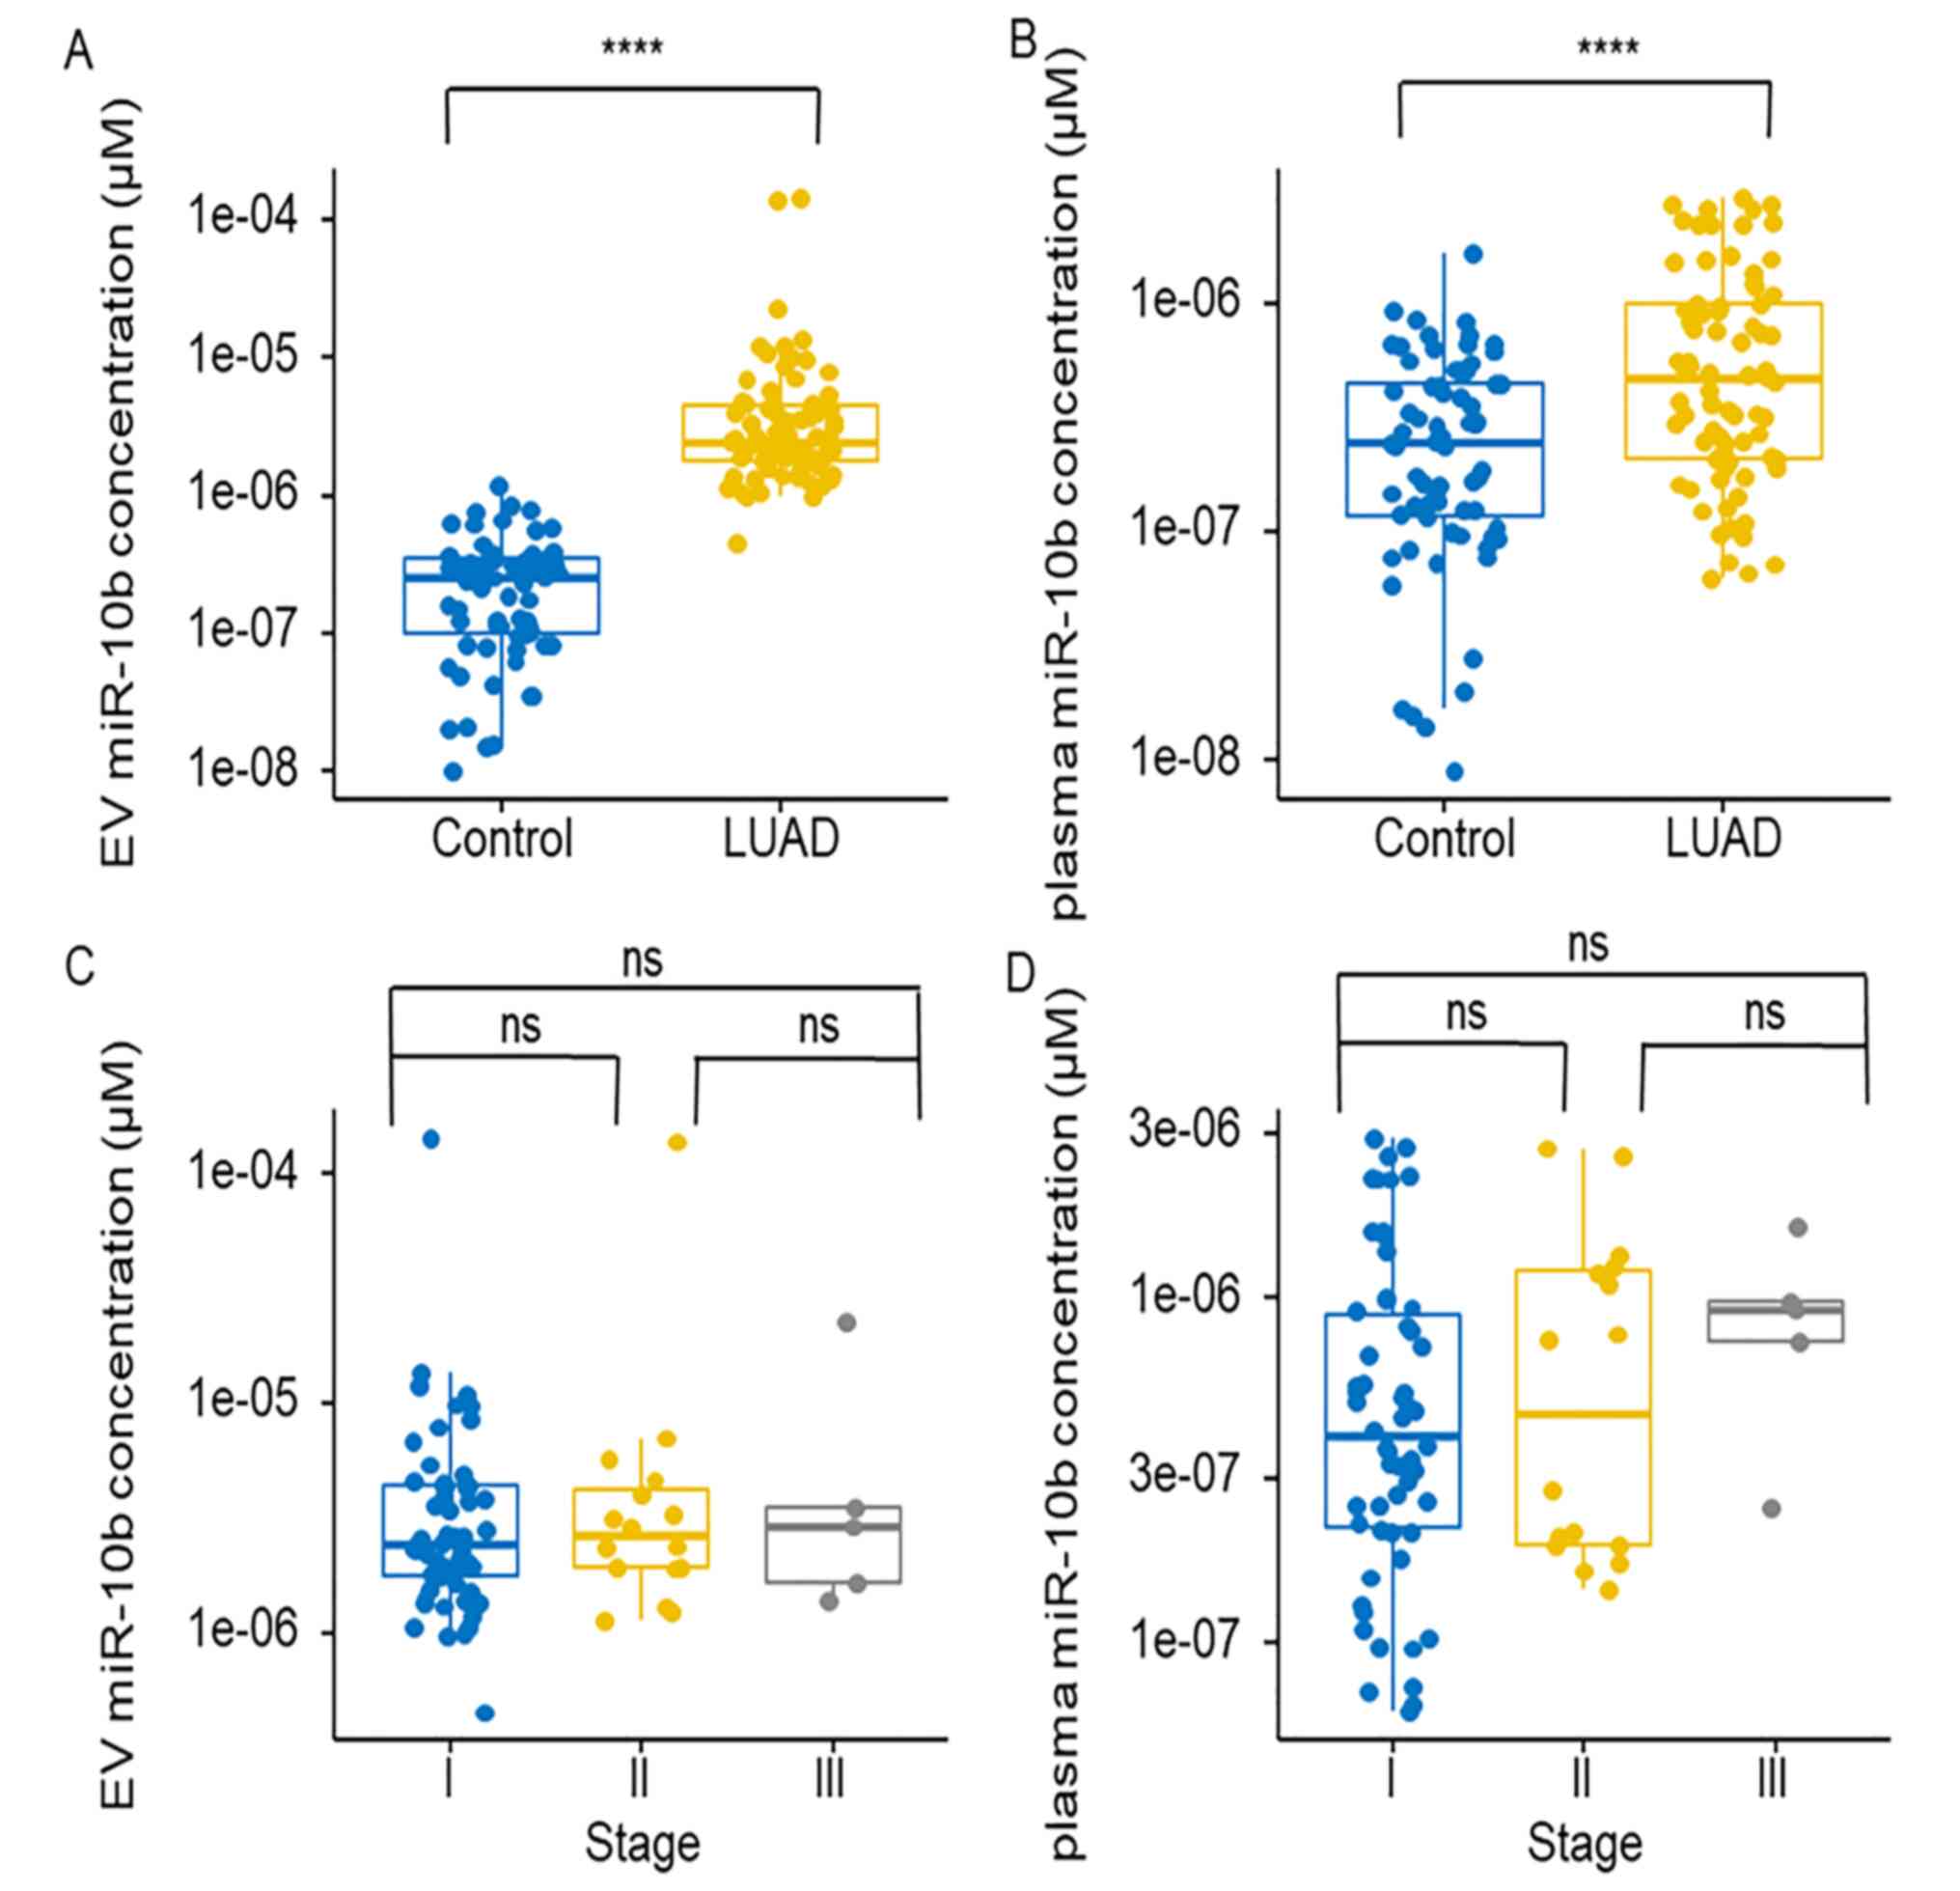
Detection of miR-10b in plasma and
EVs
Synthetic miR-10b was diluted for standard curve
establishment (Fig. S2). The
expression level of miR-10b in EVs and plasma was significantly
increased in the LUAD group compared with that in the control group
(Fig. 3A and B). The expression
levels of miR-10b at different stages were also compared and the
non-parametric Kruskal-Wallis test results showed that the
expression levels of miR-10b did not exhibit a significant
difference between stages I, II and III in EVs or plasma (Fig. 3C and D). The expression levels of
miR-10b were also analyzed in patients with different sexes and
ages. The results showed that the expression levels of miR-10b in
EVs and plasma did not show a significant difference between males
and females (Fig. S3A and B). The
correlation between miR-10b and age was also analysed, and the
results showed that there was no linear correlation. The
correlation coefficients were 0.084 and 0.073, respectively
(Fig. S3C and D).
Detection of TMs
A total of 5 volunteers from the 69 patients of the
control group and all LUAD subjects underwent the TM tests, which
included AFP, NSE, CEA, CYFRA211, Pro-GRP, CA125, CA153, CA199 and
CA724 assays (Fig. 4). The threshold
of these markers is marked by dotted grey lines in the figures.
Among these markers, CYFRA211 (22/80) and NSE (20/80) had the
highest detection rates in the LUAD group (Fig. 4C and I). CA125, CA724 and NSE were
determined to be abnormal in the control groups (Fig. 4D, G and I). The normal range of each
marker is shown in Table III.
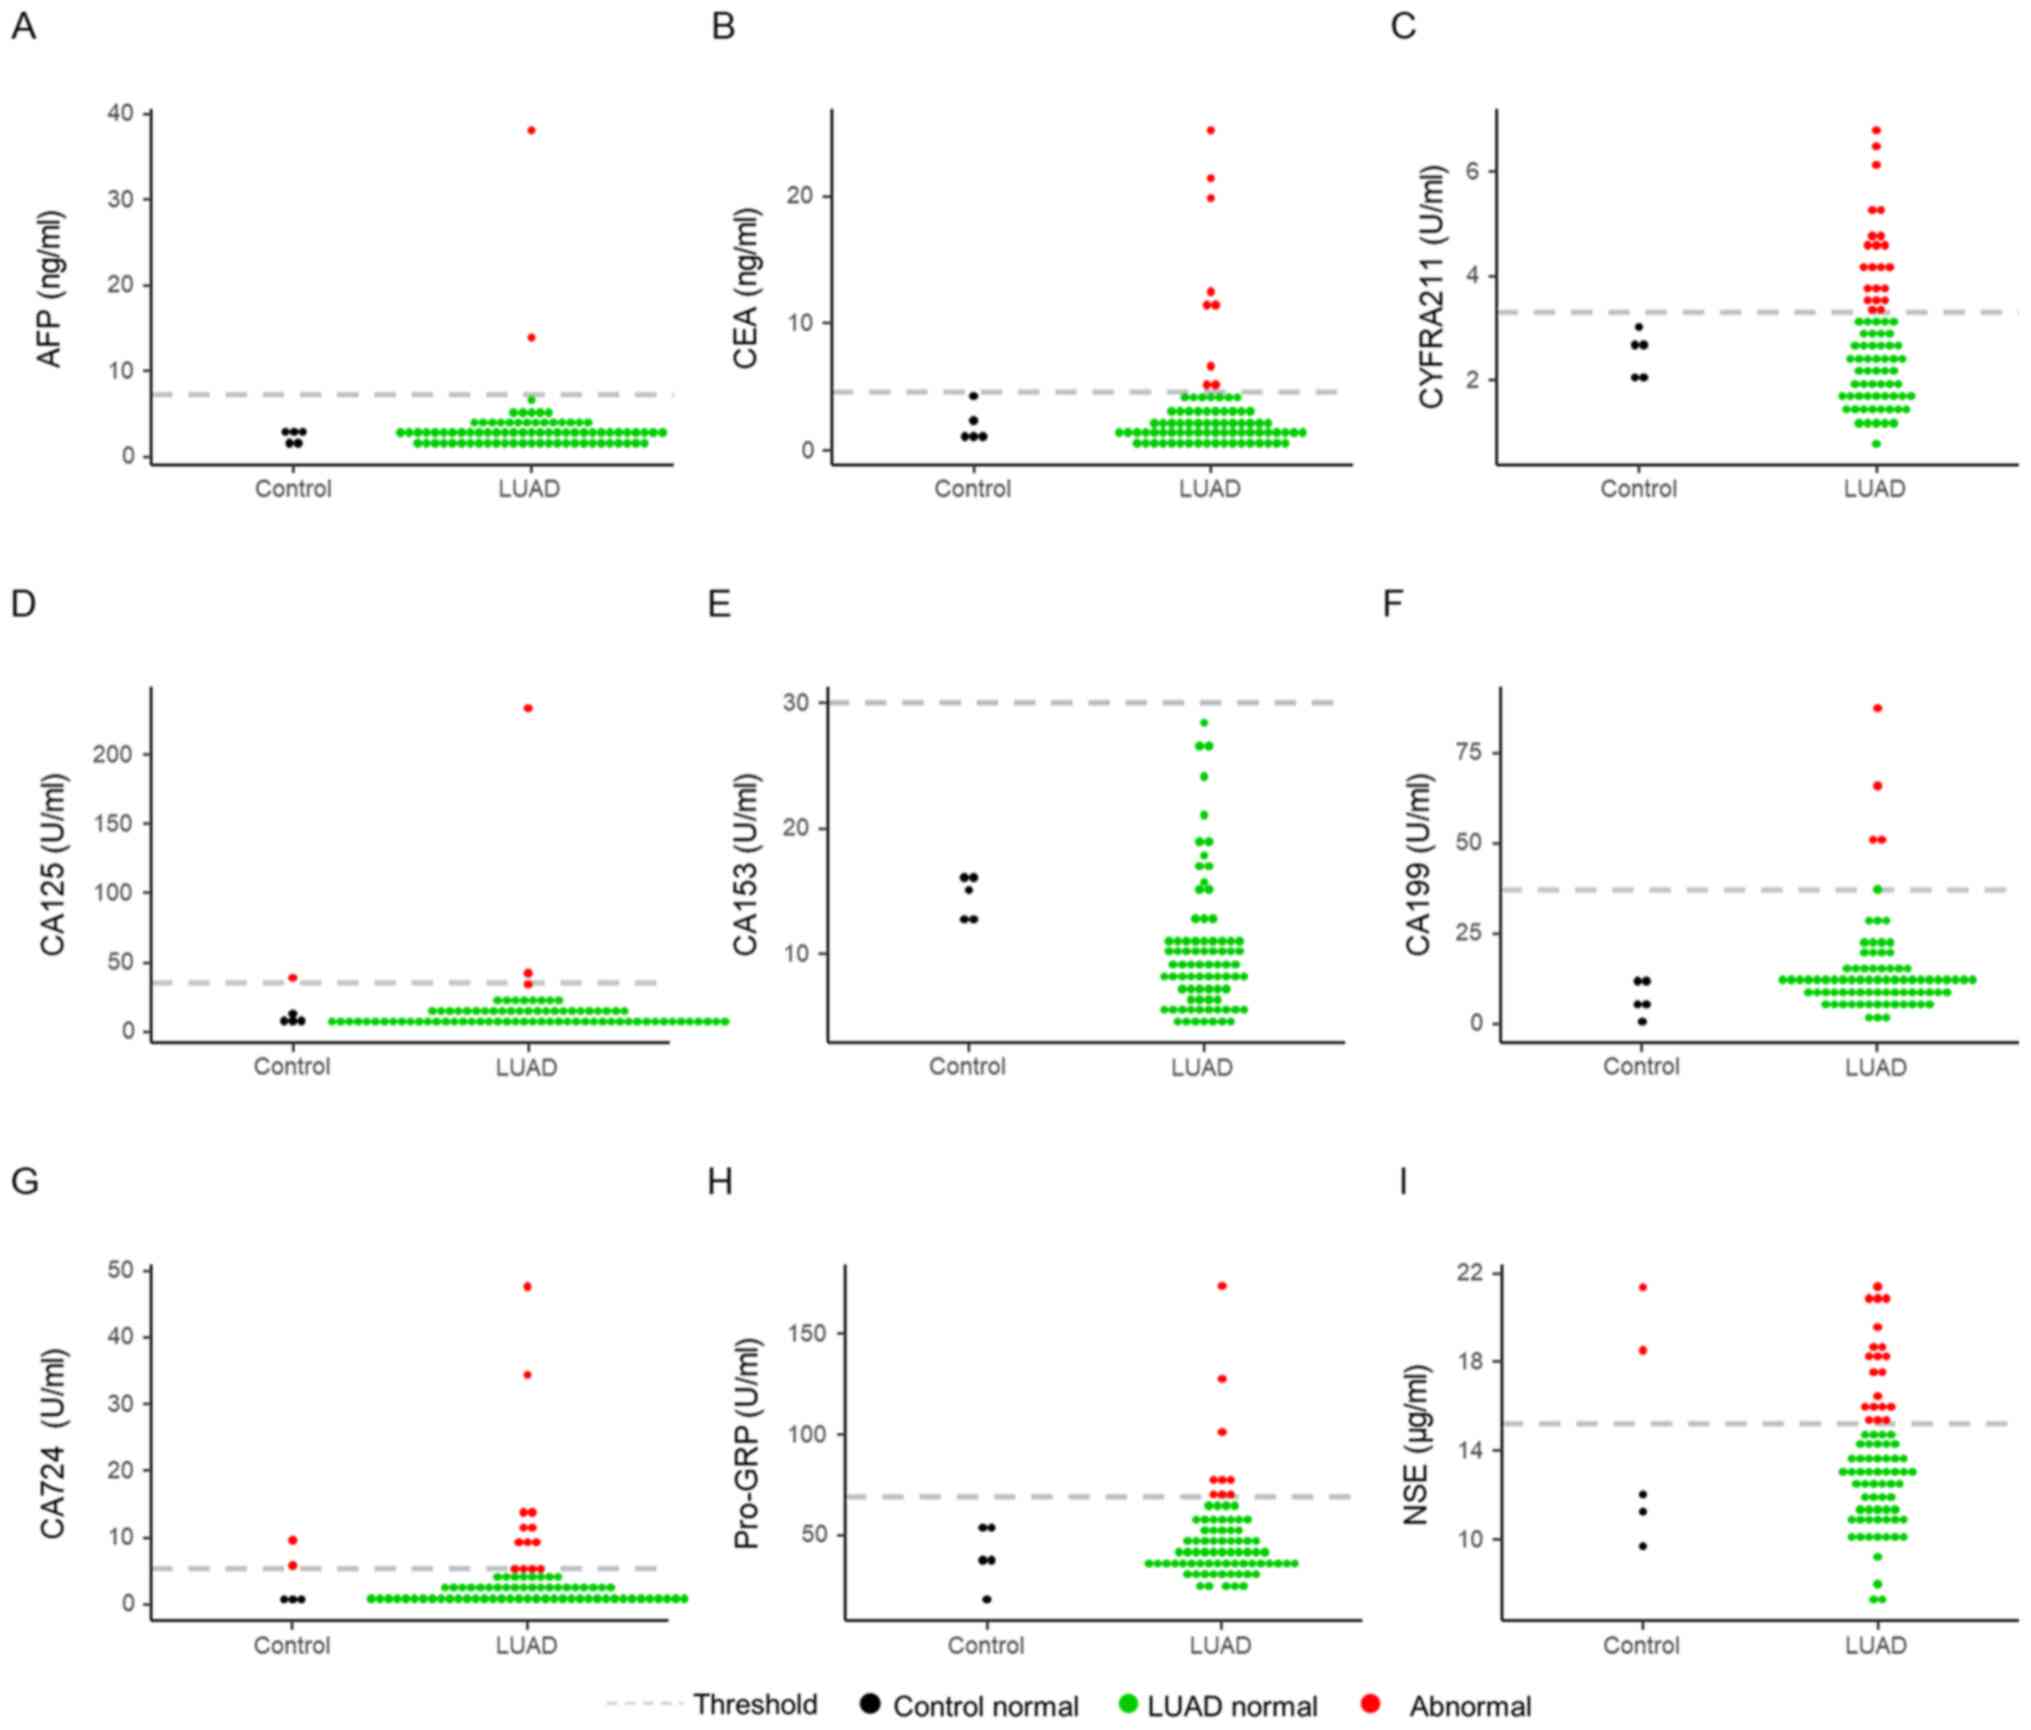 | Figure 4.Levels of tumor markers. The levels
of (A) AFP, (B) NSE, (C) CEA, (D) CYFRA211, (E) Pro-GRP, (F) CA125,
(G) CA153, (H) CA199 and (I) CA724. According to common thresholds,
a red dot indicates abnormal results, a black dot indicates normal
results in the control group, and a green dot indicates normal
results in the LUAD group. AFP, α-fetoprotein; NSE, neuron-specific
enolase; CYFRA211, cytokeratin 19 fragment 21-1; Pro-GRP,
pro-gastrin-releasing-peptide; CA, carbohydrate antigen; LUAD, lung
adenocarcinoma. |
| Table III.Normal reference ranges of TMs. |
Table III.
Normal reference ranges of TMs.
| TM | Range |
|---|
| AFP | 0–10 ng/ml |
| NSE | 0–20 ng/ml |
| CEA | 0–5 ng/ml |
| CYFRA211 | 0-3.5 ng/ml |
| Pro-GRP | 0–75 U/ml |
| CA125 | 0–35 U/ml |
| CA153 | 0–30 U/ml |
| CA199 | 0–34 U/ml |
| CA724 | 0-8.2 U/ml |
Comparison of miR-10b and TMs
ROC curve analysis was employed to compare the
diagnostic efficiencies of miR-10b and TMs. miR-10b in EVs had a
significantly higher AUC (AUC=0.998) than that in plasma
(AUC=0.693) (P<0.01; Fig. 5A).
The Youden index was employed to determine the cut-off value. The
sensitivity and specificity of EV-associated miR-10b (sensitivity,
98.75%; specificity, 98.55%) and plasma miR-10b (sensitivity,
37.5%; specificity, 94.2%) reached a maximum when the cut-off
values were 9.087×10⁻⁷ and 7.389×10⁻⁷ µM,
respectively. According to the cut-off value, the new AUCs of EV
and plasma miR-10b were 0.986 and 0.658, respectively (Fig. 5B). The ROC curves of TMs are shown in
Fig. 5C. Among these markers, CA153
(AUC=0.844), CA199 (AUC=0.7275) and GRP (AUC=0.655) had the top 3
AUCs. After threshold modification, CYFRA211 had the highest AUC of
0.635 (Fig. 5D).
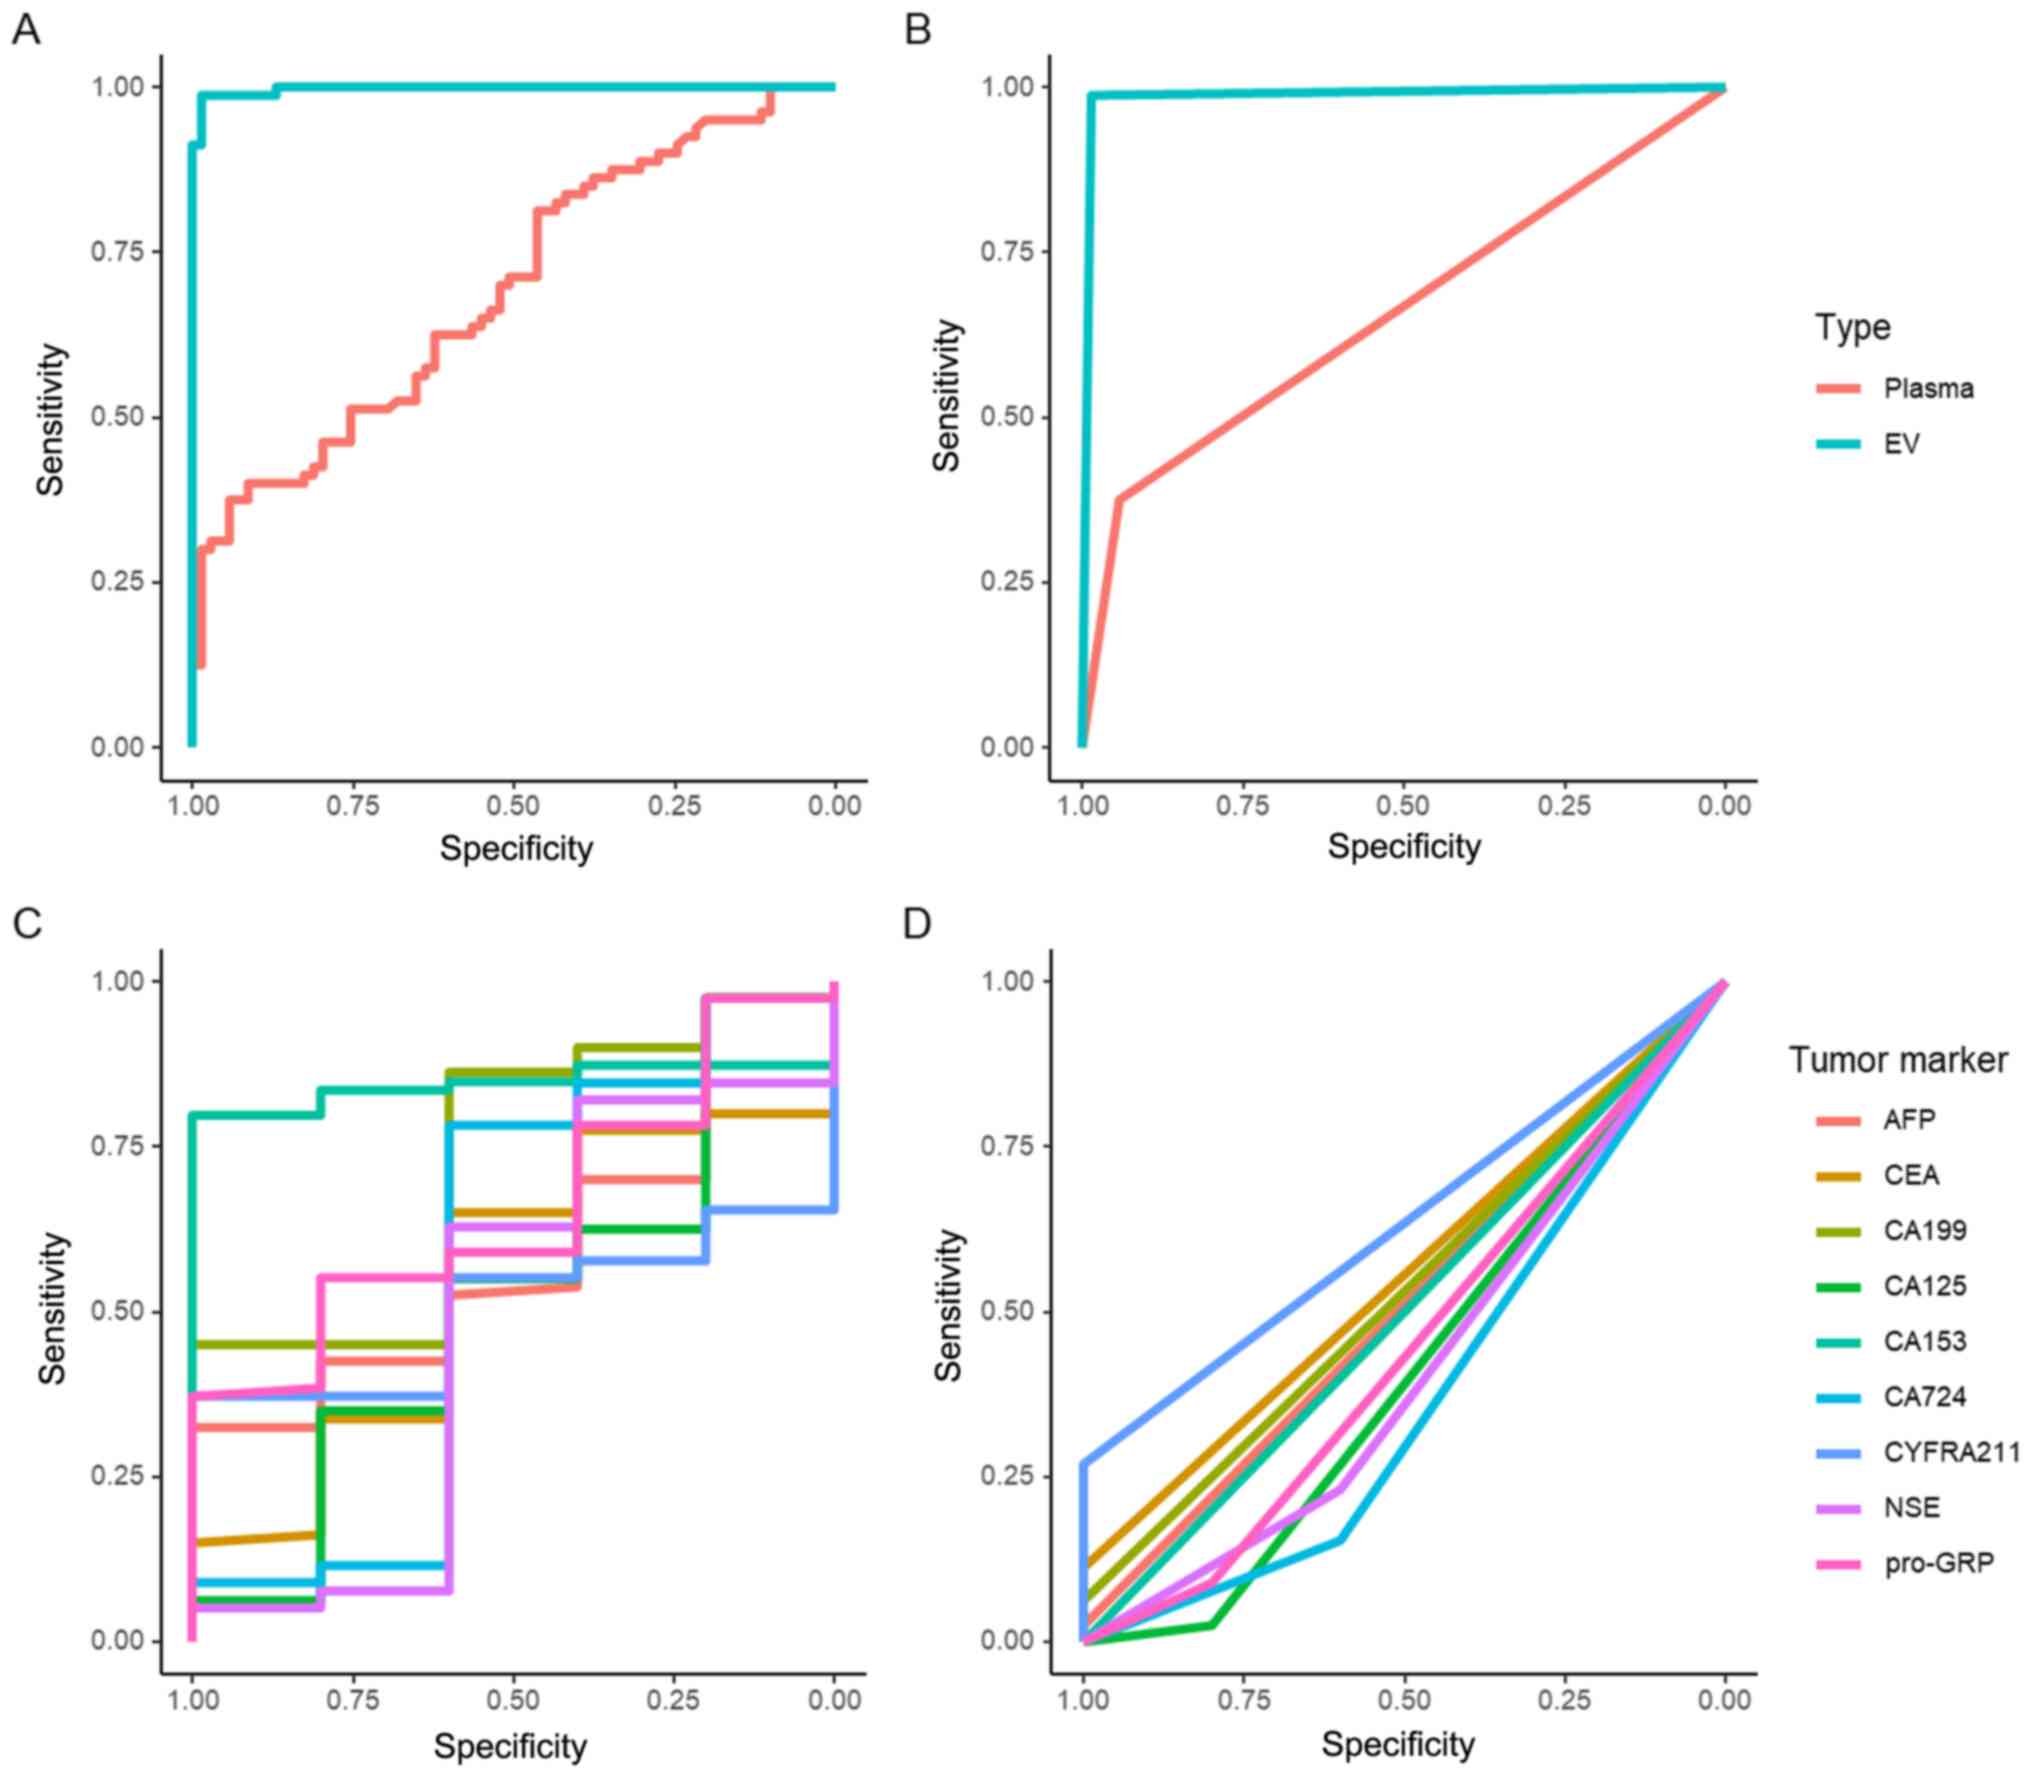 | Figure 5.ROC curve analysis of miR-10b in EVs
and plasma, and analysis of TMs. (A) ROC curve of miR-10b in EVs
and plasma. (B) ROC curve of miR-10b in EVs and plasma adjusted by
thresholds. (C) ROC curve of TMs. (D) ROC curve of TMs adjusted by
thresholds. TM, tumor marker; AFP, α-fetoprotein; NSE,
neuron-specific enolase; CYFRA211, cytokeratin 19 fragment 21-1;
Pro-GRP, pro-gastrin-releasing-peptide; CA, carbohydrate antigen;
EV, extracellular vesicle; miR, microRNA; ROC, receiver operating
characteristic. |
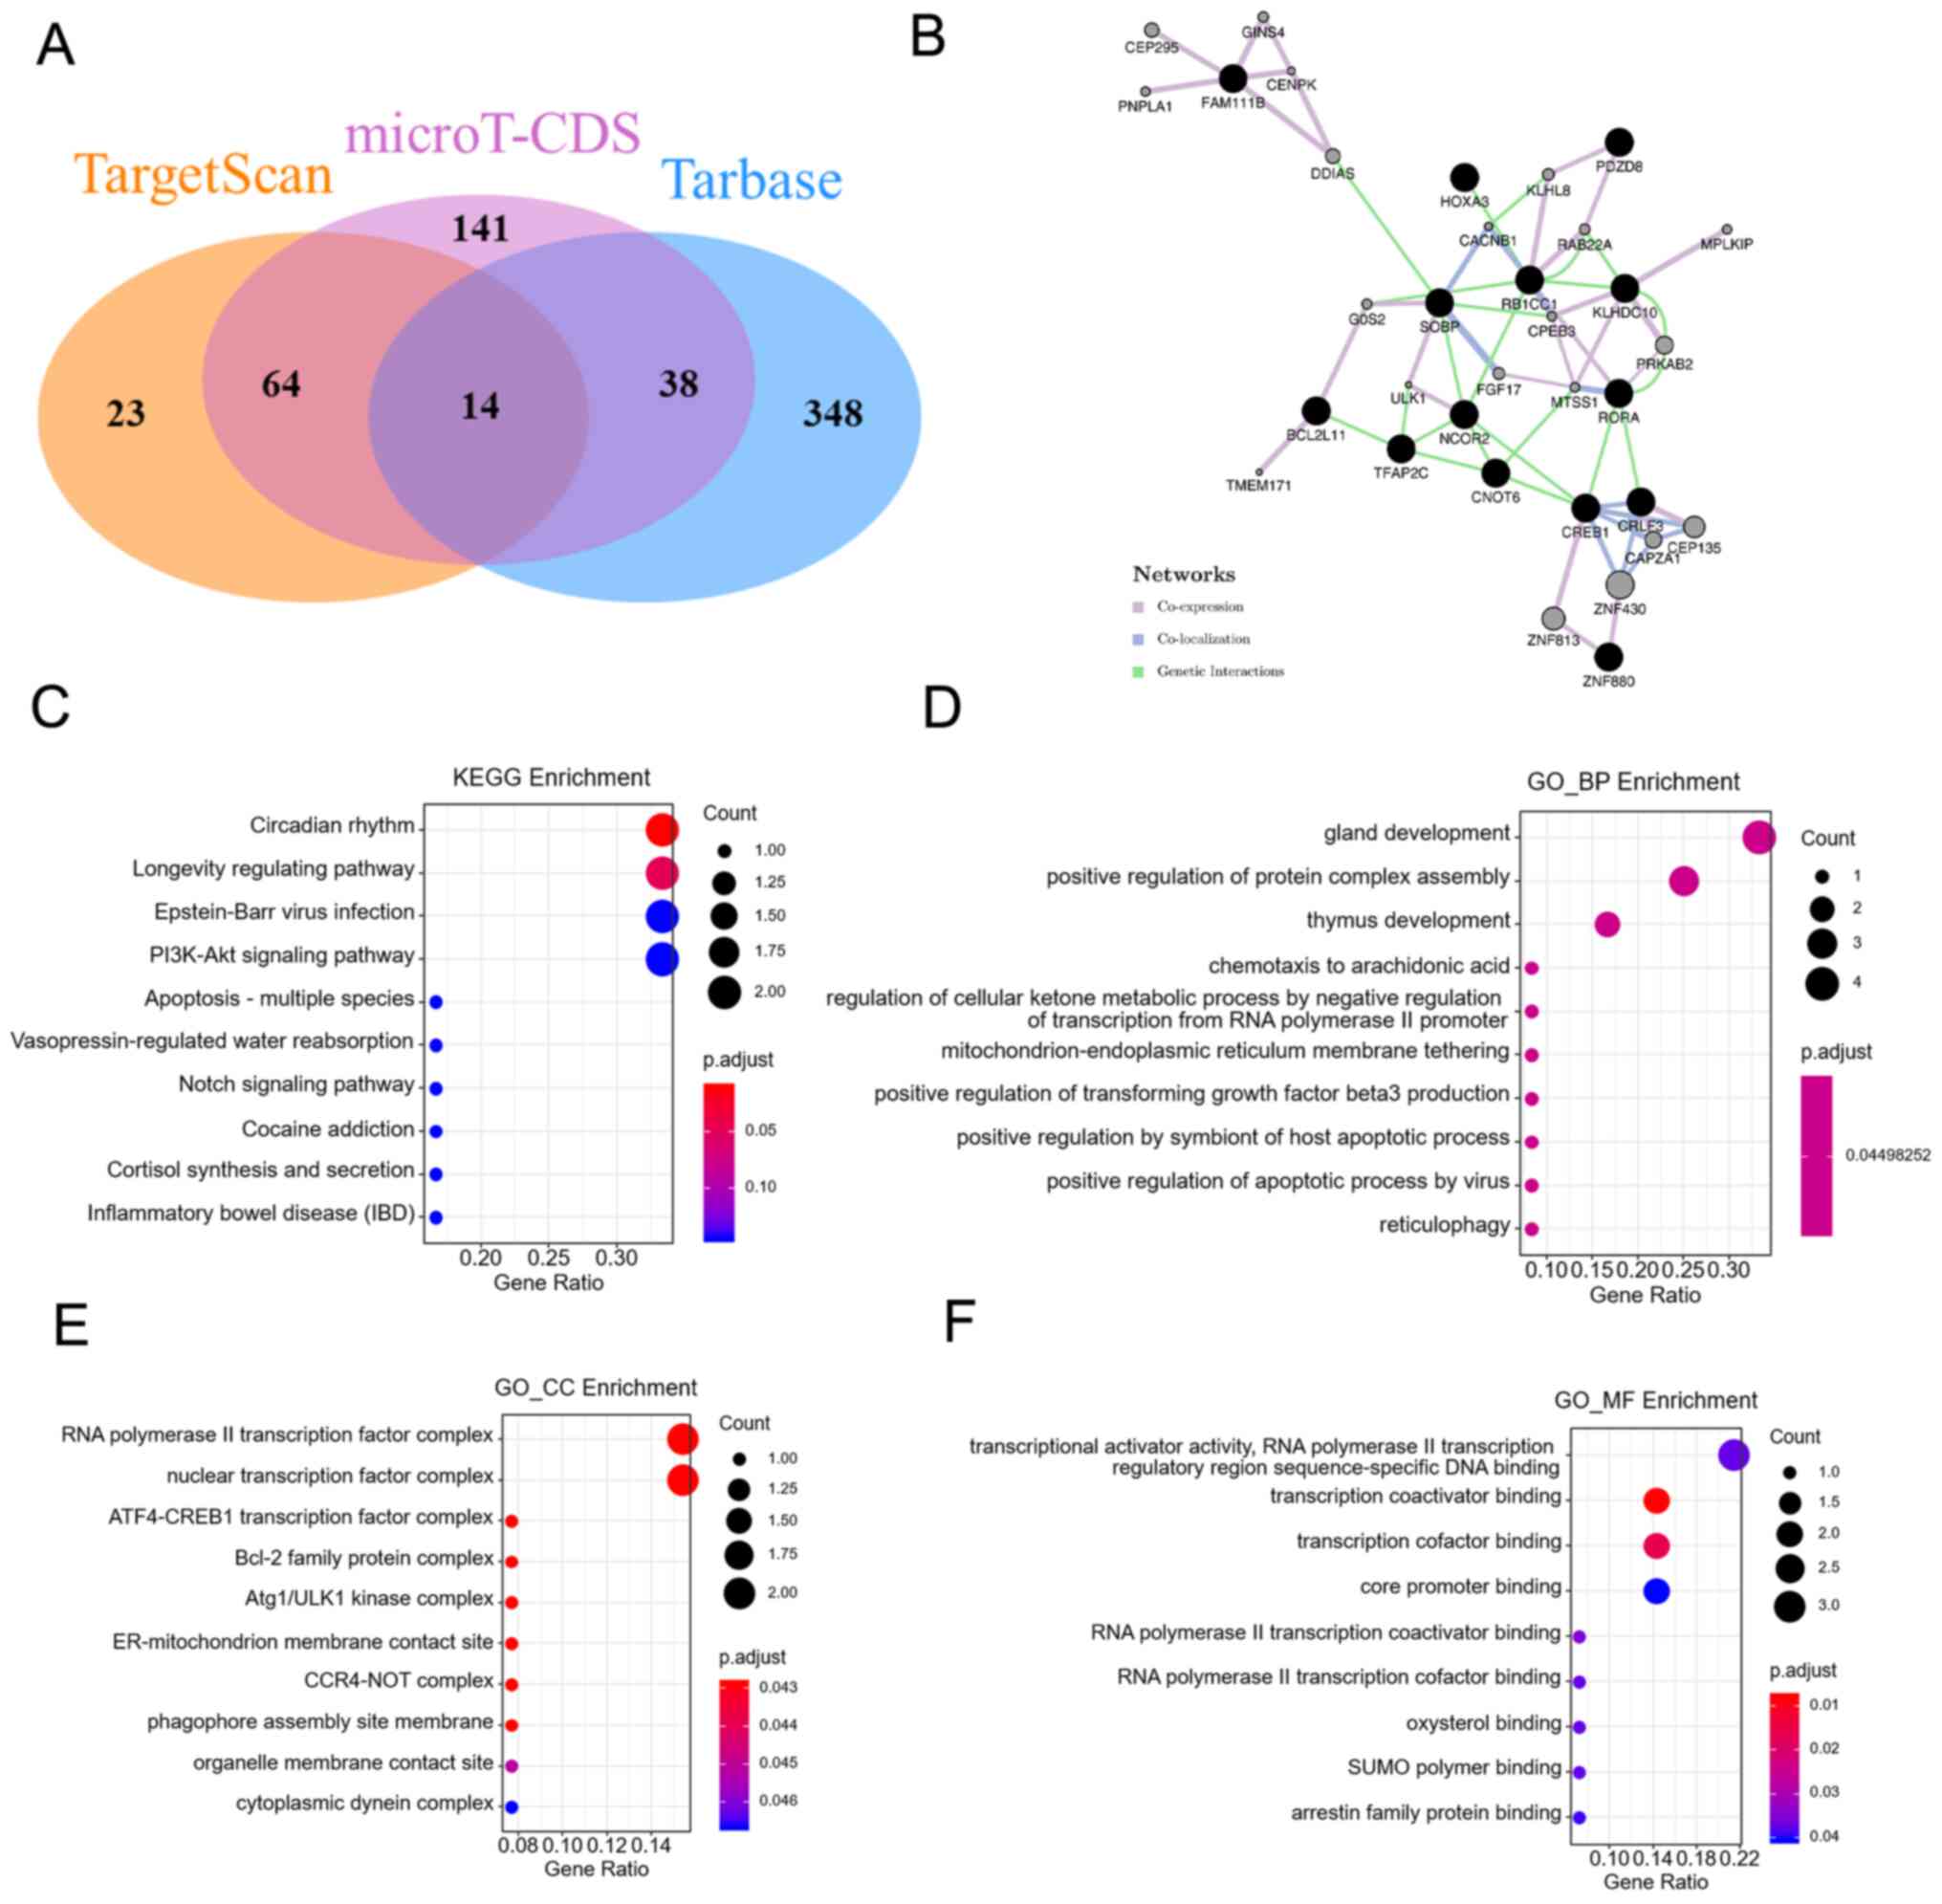
Bioinformatics analysis of miRNA and
target genes
The target genes of miR-10b were predicted using
TargetScan, microT-CDS and TarBase. There were 14 interaction
target genes (Fig. 6A). These genes
formed a network that included coexpression, colocalization and
genetic interactions (Fig. 6B).
Next, KEGG pathway enrichment analysis was performed and it was
found that the ‘circadian rhythm’ pathway and the ‘longevity
regulating pathway’ were the most enriched pathways (Fig. 6C). GO analysis was also performed.
‘Gland development’, ‘thymus development’ and ‘positive regulation
of protein complex assembly’ were the top 3 biological processes
(Fig. 6D). The ‘RNA polymerase II
transcription factor complex’ and the ‘nuclear transcription factor
complex’ were the top 2 cellular components (Fig. 6E). ‘Transcriptional activator
activity, RNA polymerase II transcription regulatory region
sequence-specific DNA binding’ and ‘transcription coactivator
binding’ were the most enriched molecular functions (Fig. 6F).
Discussion
In China, the incidence of lung cancer continues to
increase rapidly, which imposes a severe social and economic burden
(40). In the present study, public
databases were used to search for target miRNAs and miR-10b was
determined to be a possible useful candidate for LUAD. TCGA
database was also employed to verify the relationship between
miR-10b and survival. The results showed that high miR-10b
expression was associated with shorter survival time in LUAD. Next,
clinical blood samples were used for further verification, and
miR-10b was upregulated in LUAD samples in both plasma and EVs. The
expression levels of miR-10b in plasma and EVs were not related to
sex or age. The detailed reasoning as to why miR-10b expression is
higher in LUAD is still unclear and requires further research.
In addition to traditional imaging examinations,
including X-ray and LDCT, other molecular tests have also been
applied in LUAD detection. CYFRA211, CEA and NSE have been recorded
as upregulated in the peripheral blood from patients with LUAD and
may be used as diagnostic and prognostic markers for the disease
(14,41). In the present study, 22 CYFRA211, 20
NSE and 9 CEA abnormalities were found in the patients with LUAD.
Moreover, in the control group, 2 samples showed abnormal NSE
levels, and the highest abnormal levels in the control and LUAD
groups were similar (20.79 and 21.41 µg/ml, respectively). Subjects
with a high abnormal NSE level in the control group need long-term
monitoring to prevent the disease (42).
ROC curve analysis was employed to compare the
diagnostic value of miR-10b in plasma or EVs and TMs. miR-10b in
both plasma and EVs showed significant differences between the
control and LUAD groups. ROC curve analysis showed that
EV-associated miR-10b was superior to plasma. Among the nine TMs,
CA153 had the highest AUC of 0.844. However, the AUC was decreased
to 0.5 when CA153 was adjusted by the common cut-off value of 30
U/ml. CA153 is a recommended marker for breast cancer (17). The present data indicated that CA153
may be a marker for LUAD, but it requires an appropriate cut-off
value. Even with the best cut-off, CA153 was still inferior to
EV-associated miR-10b.
Bioinformatics analysis of miR-10b and its target
genes was also performed to determine their potential functions.
There were 14 target genes of miR-10b included in all the three
databases. ‘Circadian rhythm’ was found to be the key KEGG pathway.
It has been reported that circadian rhythm disruption can promote
lung tumorigenesis (43). GO BP, CC
and MF analyses showed that RNA polymerase II might have key
involvement. RNA polymerase II participates in the transcription of
mRNA and a number of non-coding RNAs in eukaryotic genomes, which
is necessary for almost all life activities (44). These regulatory networks indicate new
directions for further research.
The sample size is a limitation of this study. A
total of 80 subjects who were diagnosed with LUAD and 69 control
subjects were enrolled, and it took >2 years to collect these
eligible patients. In the future, the sample size will be increased
to ensure more accurate results. Besides the sample size, the
detailed reasoning as to why miR-10b expression is higher in LUAD
is still unclear. Huang et al (45) found that silencing of miR-10b
inhibited tumor cell progress by arresting cell cycle progression
in the G0/G1 phase and promoted apoptosis in
NSCLC cells. EV-associated miR-10b in LUAD may also be involved in
this pathway.
In conclusion, EV-associated miR-10b may be a
potential biomarker for LUAD diagnosis and may be superior to
plasma miR-10b and TMs. In addition, with an appropriate threshold,
CA153 may also serve as a diagnostic biomarker for LUAD.
Supplementary Material
Supporting Data
Acknowledgements
Not applicable.
Funding
No funding was received.
Availability of data and materials
All data generated or analyzed during this study are
included in this published article.
Authors' contributions
GY and HX collected the patient data and performed
the bioinformatics analysis. TW, DZ and CZ performed the
experiments. YY and GY contributed to the study design and
manuscript writing. All authors have read and approved the
manuscript. GY and YY confirm the authenticity of all the raw data.
All authors read and approved the final manuscript.
Ethics approval and consent to
participate
Blood sample and clinical data collection were
approved by the Ethics Review Board of The Affiliated Suzhou
Hospital of Nanjing Medical University (Suzhou, China). Oral
informed consent for publication was obtained from all
participants, as approved by the Ethics Review Board.
Patient consent for publication
Not applicable.
Competing interests
The authors declare that they have no competing
interests.
References
|
1
|
Siegel R, Ward E, Brawley O and Jemal A:
Cancer statistics, 2011: The impact of eliminating socioeconomic
and racial disparities on premature cancer deaths. CA Cancer J
Clin. 61:212–236. 2011. View Article : Google Scholar : PubMed/NCBI
|
|
2
|
Yan Y, Chen Y, Jia H, Liu J, Ding Y, Wang
H, Hu Y, Ma J, Zhang X and Li S: Patterns of Life Lost to Cancers
with High Risk of Death in China. Int J Environ Res Public Health.
16:2175–2193. 2019. View Article : Google Scholar : PubMed/NCBI
|
|
3
|
Zheng RS, Sun KX, Zhang SW, Zeng HM, Zou
XN, Chen R, Gu XY, Wei WW and He J: Report of cancer epidemiology
in China, 2015. Zhonghua Zhong Liu Za Zhi. 41:19–28. 2019.(In
Chinese). PubMed/NCBI
|
|
4
|
Zhang H, Guo L and Chen J: Rationale for
Lung Adenocarcinoma Prevention and Drug Development Based on
Molecular Biology During Carcinogenesis. OncoTargets Ther.
13:3085–3091. 2020. View Article : Google Scholar : PubMed/NCBI
|
|
5
|
Zhang X, Wu L, Xu Y, Zhang B, Wu X, Wang Y
and Pang Z: Trends in the incidence rate of lung cancer by
histological type and gender in Sichuan, China, 1995–2015: A
single-center retrospective study. Thorac Cancer. 9:532–541. 2018.
View Article : Google Scholar : PubMed/NCBI
|
|
6
|
Dama E, Melocchi V, Mazzarelli F,
Colangelo T, Cuttano R, Di Candia L, Ferretti GM, Taurchini M,
Graziano P and Bianchi F: Non-Coding RNAs as Prognostic Biomarkers:
A miRNA Signature Specific for Aggressive Early-Stage Lung
Adenocarcinomas. Noncoding RNA. 6:482020.PubMed/NCBI
|
|
7
|
Yang W, Qian F, Teng J, Wang H, Manegold
C, Pilz LR, Voigt W, Zhang Y, Ye J, Chen Q, et al Written on behalf
of the AME Thoracic Surgery Collaborative Group, : Community-based
lung cancer screening with low-dose CT in China: Results of the
baseline screening. Lung Cancer. 117:20–26. 2018. View Article : Google Scholar : PubMed/NCBI
|
|
8
|
Liang F, Wu C, Gu H, Zhu M, Xuan Z, Jiang
Y, Chen H, Fu C and Zheng Y: Lung cancer incidence in female rises
significantly in urban sprawl of Shanghai after introduction of
LDCT screening. Lung Cancer. 132:114–118. 2019. View Article : Google Scholar : PubMed/NCBI
|
|
9
|
He D, Yu H and Chen Y: Equity in the
distribution of CT and MRI in China: A panel analysis. Int J Equity
Health. 12:39–53. 2013. View Article : Google Scholar : PubMed/NCBI
|
|
10
|
Siravegna G, Mussolin B, Venesio T,
Marsoni S, Seoane J, Dive C, Papadopoulos N, Kopetz S, Corcoran RB,
Siu LL, et al: How liquid biopsies can change clinical practice in
oncology. Ann Oncol. 30:1580–1590. 2019. View Article : Google Scholar : PubMed/NCBI
|
|
11
|
Sell S: Cancer markers of the 1990s.
Comparison of the new generation of markers defined by monoclonal
antibodies and oncogene probes to prototypic markers. Clin Lab Med.
10:1–37. 1990. View Article : Google Scholar : PubMed/NCBI
|
|
12
|
He Y, Lu H and Zhang L: Serum AFP levels
in patients suffering from 47 different types of cancers and
noncancer diseases. Prog Mol Biol Transl Sci. 162:199–212. 2019.
View Article : Google Scholar : PubMed/NCBI
|
|
13
|
Beauchemin N and Arabzadeh A:
Carcinoembryonic antigen-related cell adhesion molecules (CEACAMs)
in cancer progression and metastasis. Cancer Metastasis Rev.
32:643–671. 2013. View Article : Google Scholar : PubMed/NCBI
|
|
14
|
Grunnet M and Sorensen JB:
Carcinoembryonic antigen (CEA) as tumor marker in lung cancer. Lung
Cancer. 76:138–143. 2012. View Article : Google Scholar : PubMed/NCBI
|
|
15
|
Lei L, Chen Q, Wang Z, Han N, Chen B, Qin
J and Lu HY: Usefulness of carcinoembryonic antigen in the
diagnosis of small cell lung cancer combined with adenocarcinoma.
Adv Clin Exp Med. 26:1091–1094. 2017. View Article : Google Scholar : PubMed/NCBI
|
|
16
|
Nakamura H and Nishimura T: History,
molecular features, and clinical importance of conventional serum
biomarkers in lung cancer. Surg Today. 47:1037–1059. 2017.
View Article : Google Scholar : PubMed/NCBI
|
|
17
|
Li X, Xu Y and Zhang L: Serum CA153 as
biomarker for cancer and noncancer diseases. Prog Mol Biol Transl
Sci. 162:265–276. 2019. View Article : Google Scholar : PubMed/NCBI
|
|
18
|
Buccheri G and Ferrigno D: Lung tumor
markers of cytokeratin origin: An overview. Lung Cancer. 34 (Suppl
2):S65–S69. 2001. View Article : Google Scholar : PubMed/NCBI
|
|
19
|
Uenishi T, Kubo S, Hirohashi K, Tanaka H,
Shuto T, Yamamoto T and Nishiguchi S: Cytokeratin-19 fragments in
serum (CYFRA 21-1) as a marker in primary liver cancer. Br J
Cancer. 88:1894–1899. 2003. View Article : Google Scholar : PubMed/NCBI
|
|
20
|
Narita T, Funahashi H, Imai T, Takagi H
and Kannagi R: Cytosol and serum concentration of cytokeratin
subunit-19 fragment (cyfra-21-1) in breast-cancer. Oncol Rep.
1:747–750. 1994.PubMed/NCBI
|
|
21
|
Kammer MN, Kussrow AK, Webster RL, Chen H,
Hoeksema M, Christenson R, Massion PP and Bornhop DJ: Compensated
Interferometry Measures of CYFRA 21-1 Improve Diagnosis of Lung
Cancer. ACS Comb Sci. 21:465–472. 2019. View Article : Google Scholar : PubMed/NCBI
|
|
22
|
Yang G, Xiao Z, Tang C, Deng Y, Huang H
and He Z: Recent advances in biosensor for detection of lung cancer
biomarkers. Biosens Bioelectron. 141:1114162019. View Article : Google Scholar : PubMed/NCBI
|
|
23
|
Gu Y, Liu S, Zhang X, Chen G, Liang H, Yu
M, Liao Z, Zhou Y, Zhang CY, Wang T, et al: Oncogenic miR-19a and
miR-19b co-regulate tumor suppressor MTUS1 to promote cell
proliferation and migration in lung cancer. Protein Cell.
8:455–466. 2017. View Article : Google Scholar : PubMed/NCBI
|
|
24
|
Yuan L, Bing Z, Yan P, Li R, Wang C, Sun
X, Yang J, Shi X, Zhang Y and Yang K: Integrative data mining and
meta-analysis to investigate the prognostic role of microRNA-200
family in various human malignant neoplasms: A consideration on
heterogeneity. Gene. 716:144025. 2019. View Article : Google Scholar : PubMed/NCBI
|
|
25
|
Dai B, Kong D-L, Tian J, Liu T-W, Zhou H
and Wang ZF: microRNA-1205 promotes cell growth by targeting APC2
in lung adenocarcinoma. Eur Rev Med Pharmacol Sci. 23:1125–1133.
2019.PubMed/NCBI
|
|
26
|
Wang SS, Fang YY, Huang JC, Liang YY, Guo
YN, Pan LJ and Chen G: Clinical value of microRNA-198-5p
downregulation in lung adenocarcinoma and its potential pathways.
Oncol Lett. 18:2939–2954. 2019.PubMed/NCBI
|
|
27
|
Sheu-Gruttadauria J, Pawlica P, Klum SM,
Wang S, Yario TA, Schirle Oakdale NT, Steitz JA and MacRae IJ:
Structural Basis for Target-Directed MicroRNA Degradation. Mol
Cell. 75:1243–1255.e7. 2019. View Article : Google Scholar : PubMed/NCBI
|
|
28
|
Barile L and Vassalli G: Exosomes: Therapy
delivery tools and biomarkers of diseases. Pharmacol Ther.
174:63–78. 2017. View Article : Google Scholar : PubMed/NCBI
|
|
29
|
Kowal EJK, Ter-Ovanesyan D, Regev A and
Church GM: Extracellular Vesicle Isolation and Analysis by Western
Blotting. Methods Mol Biol. 1660:143–152. 2017. View Article : Google Scholar : PubMed/NCBI
|
|
30
|
Shan B, Ai Z, Zeng S, Song Y, Song J, Zeng
Q, Liao Z, Wang T, Huang C and Su D: Gut microbiome-derived lactate
promotes to anxiety-like behaviors through GPR81 receptor-mediated
lipid metabolism pathway. Psychoneuroendocrinology. 117:1046992020.
View Article : Google Scholar : PubMed/NCBI
|
|
31
|
Su D, Liao Z, Feng B, Wang T, Shan B, Zeng
Q, Song J and Song Y: Pulsatilla chinensis saponins cause liver
injury through interfering ceramide/sphingomyelin balance that
promotes lipid metabolism dysregulation and apoptosis.
Phytomedicine. 76:1532652020. View Article : Google Scholar : PubMed/NCBI
|
|
32
|
Livak KJ and Schmittgen TD: Analysis of
relative gene expression data using real-time quantitative PCR and
the 2(-Delta Delta C(T)). Methods. 25:402–408. 2001. View Article : Google Scholar : PubMed/NCBI
|
|
33
|
Nagy Á, Lánczky A, Menyhárt O and Győrffy
B: Validation of miRNA prognostic power in hepatocellular carcinoma
using expression data of independent datasets. Sci Rep.
8:9227–9235. 2018. View Article : Google Scholar : PubMed/NCBI
|
|
34
|
Nigita G, Distefano R, Veneziano D, Romano
G, Rahman M, Wang K, Pass H, Croce CM, Acunzo M and Nana-Sinkam P:
Tissue and exosomal miRNA editing in Non-Small Cell Lung Cancer.
Sci Rep. 8:10222–10229. 2018. View Article : Google Scholar : PubMed/NCBI
|
|
35
|
Karagkouni D, Paraskevopoulou MD,
Chatzopoulos S, Vlachos IS, Tastsoglou S, Kanellos I, Papadimitriou
D, Kavakiotis I, Maniou S, Skoufos G, et al: DIANA-TarBase v8: A
decade-long collection of experimentally supported miRNA-gene
interactions. Nucleic Acids Res. 46D:D239–D245. 2018. View Article : Google Scholar : PubMed/NCBI
|
|
36
|
Agarwal V, Bell GW, Nam JW and Bartel DP:
Predicting effective microRNA target sites in mammalian mRNAs.
eLife. 4:e05005–e05042. 2015. View Article : Google Scholar : PubMed/NCBI
|
|
37
|
Paraskevopoulou MD, Georgakilas G,
Kostoulas N, Vlachos IS, Vergoulis T, Reczko M, Filippidis C,
Dalamagas T and Hatzigeorgiou AG: DIANA-microT web server v5.0:
Service integration into miRNA functional analysis workflows.
Nucleic Acids Res. 41W:W169–W173. 2013. View Article : Google Scholar : PubMed/NCBI
|
|
38
|
Chandrashekar DS, Bashel B, Balasubramanya
SAH, Creighton CJ, Ponce-Rodriguez I, Chakravarthi BVSK and
Varambally S: UALCAN: A Portal for Facilitating Tumor Subgroup Gene
Expression and Survival Analyses. Neoplasia. 19:649–658. 2017.
View Article : Google Scholar : PubMed/NCBI
|
|
39
|
Warde-Farley D, Donaldson SL, Comes O,
Zuberi K, Badrawi R, Chao P, Franz M, Grouios C, Kazi F, Lopes CT,
et al: The GeneMANIA prediction server: Biological network
integration for gene prioritization and predicting gene function.
Nucleic Acids Res. 38 (Suppl 2):W214–W220. 2010. View Article : Google Scholar : PubMed/NCBI
|
|
40
|
Hong QY, Wu GM, Qian GS, Hu CP, Zhou JY,
Chen LA, Li WM, Li SY, Wang K, Wang Q, et al Lung Cancer Group of
Chinese Thoracic Society; Chinese Alliance Against Lung Cancer, :
Prevention and management of lung cancer in China. Cancer. 121
(Suppl 17):3080–3088. 2015. View Article : Google Scholar : PubMed/NCBI
|
|
41
|
Jiang ZF, Wang M and Xu JL: Thymidine
kinase 1 combined with CEA, CYFRA21-1 and NSE improved its
diagnostic value for lung cancer. Life Sci. 194:1–6. 2018.
View Article : Google Scholar : PubMed/NCBI
|
|
42
|
Isgrò MA, Bottoni P and Scatena R:
Neuron-Specific Enolase as a Biomarker: Biochemical and Clinical
Aspects. Adv Exp Med Biol. 867:125–143. 2015. View Article : Google Scholar
|
|
43
|
Papagiannakopoulos T, Bauer MR, Davidson
SM, Heimann M, Subbaraj L, Bhutkar A, Bartlebaugh J, Vander Heiden
MG and Jacks T: Circadian Rhythm Disruption Promotes Lung
Tumorigenesis. Cell Metab. 24:324–331. 2016. View Article : Google Scholar : PubMed/NCBI
|
|
44
|
Schier AC and Taatjes DJ: Structure and
mechanism of the RNA polymerase II transcription machinery. Genes
Dev. 34:465–488. 2020. View Article : Google Scholar : PubMed/NCBI
|
|
45
|
Huang J, Sun C, Wang S, He Q and Li D:
MicroRNA miR-10b inhibition reduces cell proliferation and promotes
apoptosis in non-small cell lung cancer (NSCLC) cells. Mol Biosyst.
11:2051–2059. 2015. View Article : Google Scholar : PubMed/NCBI
|