Introduction
Liver cancer is the third leading cause of
cancer-associated mortality worldwide (1). Currently, it is treated with curative
and palliative approaches. In clinical treatment, ablation
(2), excision (3) and transplantation therapies (4) may be considered for patients with
early-stage cancer. For patients with advanced cancer,
interventional therapy (5) and
targeted sorafenib therapy (2,6) are used
as palliative treatment. However, current patients with liver
cancer usually have a poor prognosis (3). This is caused by complex reasons, and
poor diagnostic and prognostic assessments are the most noteworthy
aspects (3). Therefore,
understanding the pathogenesis of liver cancer is of great
significance for its treatment.
In recent years, microarray technology and
bioinformatics tools have been used to identify novel genes
associated with the development, diagnosis and prognosis of tumors
(7,8). Numerous cancer-related databases, such
as Gene Expression Omnibus (GEO), Oncomine and Gene Expression
Profiling Interactive Analysis (GEPIA), have emerged. The analysis
of the expression and association with prognosis of cancer-related
genes is helpful for the diagnosis and treatment of cancer.
Previous studies have indicated that CDK1 and CCNB1 promote
G2/M transformation (9)
and serve a key role in regulating the cell cycle of mammalian
cells (10). Therefore, CDK1 and
CCNB1 are potential therapeutic targets of liver cancer, and the
inhibition of their expression is crucial for the treatment of
liver cancer.
Dihydroartemisinin (DHA) is the main extraction
ingredient of artemisinin, which extracted from the traditional
Chinese medicine of Artemisia annua Linn (11). In our previous study, it was
identified that DHA inhibited the proliferation of HepG2215 cells
(12). However, to the best of our
knowledge, the mechanism by which DHA inhibits the proliferation of
liver cancer cells remains unclear. The aim of the present study
was to investigate the mechanism by which DHA inhibited the
proliferation of liver cancer cells by inhibiting the expression of
CDK1 and CCNB1.
Materials and methods
Acquisition of microarray data
The expression profile microarrays of three genes
[GSE84402 (13), GSE19665 (14) and GSE121248 (13)] were obtained from the GEO database
(http://www.ncbi.nlm.nih.gov/geo/).
The samples were acquired on the same platform (GPL570). These
profile microarrays included liver cancer and corresponding
para-cancerous tissues. The array data of GSE84402 corresponded to
14 liver cancer tissues and 14 corresponding para-cancerous
tissues, those of GSE19665 corresponded to 10 liver cancer tissues
and 10 non-cancerous tissues, and those of GSE121248 corresponded
to 70 liver cancer tissues and 37 non-cancerous tissues.
Identification of differentially
expressed genes (DEGs)
The DEGs between tumor tissues and non-tumor tissues
were identified using GEO2R (https://www.ncbi.nlm.nih.gov/geo/geo2r/) with the
cut-off criteria of |log fold change|>1.0 and adjusted P-value
(adjust-P) <0.05. These genes were identified using the Venn
diagram webtool (bioinformatics.psb.ugent.be/webtools/Venn/).
Analysis of Gene Ontology (GO)
function and Kyoto Encyclopedia of Genes and Genomes (KEGG) pathway
enrichment
GO analysis is often used for functional enrichment
research in the three aspects of biological processes (BPs),
molecular functions (MFs) and cellular component (CCs) (15). The pathways were analyzed using KEGG
pathway enrichment (16).
Subsequently, GO and KEGG analysis was performed using the Database
for Annotation, Visualization and Integrated Discovery (DAVID
version 6.8) tools (https://david.ncifcrf.gov/). Visual analysis was
performed on bioinformatics tools (http://www.bioinformatics.com.cn/) to display the
bubble diagrams of DEGs. Adjust-P<0.01 and counts >10 were
considered statistically significant.
Construction of the protein-protein
interaction (PPI) network
Protein interaction network analysis was performed
using the Search Tool for the Retrieval of Interacting
Genes/Proteins (String version 11) (https://string-db.org/) database to evaluate protein
interactions. Subsequently, Cytoscape version 3.6.0 software
(https://cytoscape.org/) was used to visualize the
PPI network. The connected nodes are important to maintain the
stability of the whole network. MCODE plugin was used to screen the
key subnetworks in PPI network. The degree of each protein node was
calculated using CytoHubba, a plug-in for Cytoscape software
(17). The first 10 genes which
included AURKA, BIRC5, BUB1B, CCNA2, CCNB1, CCNB2, CDC20, CDK1,
DLGAP5 and MAD2L1were identified as the hub genes with the
screening criteria of degree >10.
Analysis of hub gene expression using
GEPIA and the Oncomine database
GEPIA (http://gepia.cancer-pku.cn/) and Oncomine (https://www.oncomine.org/resource/login.html) are
newly developed tools, which can analyze the gene expression data
of tumor tissues and normal tissues. The cut-off values of some
parameters were as follows: P-value, <0.05; fold change, ≥2;
gene rank, top 10%; data type, mRNA. The gene names were entered
according to these parameters and the expression of hub genes in
liver cancer was visualized.
Immunohistochemical analysis using
Human Protein Atlas (HPA)
The HPA version 20.1 website (https://www.proteinatlas.org/) contains the
immunohistochemical expression data for ~20 of the more common
cancers. The expression of nine hub genes in normal tissues and
hepatocellular carcinoma (HCC) tissues was analyzed using HPA.
However, the immunohistochemical image of BUB1B was not found.
Survival analysis of the hub
genes
Kaplan-Meier Plotter Liver cancer RNA-seq (KM
Plotter; http://kmplot.com/analysis/) is a
survival analysis database, which is clinically used to evaluate
the relationship between genes and overall survival with log-rank
P-value and hazard ratios (HR) with 95% confidence intervals.
Kaplan-Meier Plotter database divided patients into 2 groups based
on the median expression level of each of the 10 genes. Log-rank
test results with P<0.05 considered as statistically
significant.
Cell line and drug treatment
HepG2215 and HepG2 cells were purchased from
American Type Culture Collection. HepG2215 and HepG2 cells were
identified by Shanghai Fuheng Biological Technology Co., Ltd. and
Shanghai Biowing Applied Biotechnology Co., Ltd., respectively.
The cells were cultured in DMEM (Gibco; Thermo
Fisher Scientific, Inc.) supplemented with 10% FBS (Gibco; Thermo
Fisher Scientific, Inc.), 100 U/ml penicillin and 100 µg/ml
streptomycin at 37°C in an atmosphere with 100% humidity and 5%
CO2.
DHA was purchased from Tokyo Chemical Industry Co.,
Ltd. DHA was dissolved in DMSO (Sigma-Aldrich; Merck KGaA) and
stored at −20°C. HepG2215 and HepG2 cells were treated with DHA
(21.5 µM) for 24 h at 37°C in an atmosphere with 100% humidity and
5% CO2. Culture medium containing 0.1% DMSO was used as
the control.
Assay of cell viability
HepG2 cells were seeded in 96-well plates
(1×10⁴ cells/well) and treated with DHA at different
concentrations (5, 10, 20 and 40 µM) for 12, 24, 36 and 48 h at
37°C in an atmosphere with 5% CO2. A Cell Counting Kit-8
(CCK-8; Dojindo Molecular Technologies, Inc.) was used to determine
cell viability according to the manufacturer's protocol. Cells were
mixed with CCK8 and incubated at 37°C in an atmosphere with 5%
CO2 for 2 h. Subsequently, optical density was monitored
at 450 nm with 650 nm as a reference wavelength by a Multiskan
Spectrum Microplate Reader (Thermo Fisher Scientific, Inc.). The
infected cells were observed under a phase contrast microscope
(Motic AE31; Motic; magnification, ×100). Finally, the cell
viability values were calculated as previously described (18). IC50 values were obtained
from the cytotoxicity curves using Softmax Pro 5 Software (19).
Transcriptomic analysis
HepG2215 and HepG2 cells (1×10⁷
cells/well) were seeded into 6-well plates. The total RNA of HepG2
and HepG2215 cells was isolated using TRIzol (cat. no. R1100;
Beijing Solarbio Science and Technology Co. Ltd.). RNA integrity
was detected with 1.2% agarose gel (cat. no. 111860; Biowest). Gel
imaging was performed using a Bio-RAD (Bio-RAD GelDoc 2000; Bio-Rad
Inc.) and analyzed by Personal Biotechnology Co., Ltd. The
sequencing kit was NovaSeq 6000 Reagent kit v.1.5 (Illumina, Inc.).
In brief, the mRNA was purified from total RNA using poly-T
oligomeric magnetic beads. Subsequently, the RNA was broken into
fragments of 300 bp in length by ion interruption. The first strand
of cDNA was synthesized by using random primers and reverse
transcriptase and a specific library was established when the
second strand was synthesized. The sequencing type was PE150, with
150-base nucleotides and the direction of sequencing was
double-ended sequencing. The library was amplified and were
selected at 450 bp according to the fragment size. Subsequently,
the total and effective concentrations of the libraries were
detected using an Agilent 2100 Bioanalyzer (Agilent Technologies,
Inc.). The libraries were mixed in a certain proportion and diluted
to 2 nM. The single-chain libraries were formed by alkali
denaturation. After the samples were extracted, purified and stored
in the form of RNA, they were sequenced with next-generation
Sequencing (NGS) based on the Illumina Hiseq (20) sequencing platform (Illumina, Inc.) by
Personal Biotechnology Co., Ltd.
Reverse transcription-quantitative PCR
(RT-qPCR) analysis
HepG2215 and HepG2 cells were treated with DHA (21.5
µM) for 24 h at 37°C in an atmosphere with 100% humidity and 5%
CO2. Culture medium containing 0.1% DMSO was used as the
control. Total RNA was extracted from the cells using the Ambion
TRIzol reagent (Ambion; Thermo Fisher Scientific, Inc.). All steps
were performed under RNase-free conditions. RNA and purity were
assessed according to the ratio of A260/A280. Oligonucleotides
(CDK1 forward, 5′-GGATGTGCTTATGCAGGATTCC-3′ and reverse,
5′-CATGTACTGACCAGGAGGGATAG-3′; CCNB1 forward,
5′-ATAAGGCGAAGATCAACATGGC-3′ and reverse,
5′-TTTGTTACCAATGTCCCCAAGAG-3′; and actin forward,
5′-CATGTACGTTGCTATCCAGGC-3′ and reverse,
5′-CTCCTTAATGTCACGCACGAT-3′) were reverse transcribed into cDNA
according to the instruction of Prime Script TM RT reagent kit with
gDNA Eraser (Perfect Real Time) (cat. no. RR047A; Takara Bio Inc.)
and TB Green Premix Ex TaqTM II (Tli RNaseH Plus) (cat. no. RR820A;
Takara Bio Inc.). The conditions used for reverse transcription
were as follows: 37°C for 3 min, 85°C for 5 sec and 4°C for 13 min.
Real time fluorescence RT-qPCR was performed on a Real-Time PCR
system (Hangzhou Bioer Co. Ltd.) in reaction mixtures (25 µl)
containing cDNA, primer pairs, and platinum SYBR Green QPCR Super
Mix-UDG (Invitrogen; Thermo Fisher Scientific Inc.). The
thermocycling conditions were as follows: Pre-denaturation at 95°C
for 3 min followed by 39 cycles at 95°C for 10 sec and 58°C for 30
sec. The dissolution curve was from 65–95°C and the temperature
rose 1°C every 20 sec. The relative quantitative values
[2−ΔΔCq, Ct of the threshold cycle (21)] used in RT-qPCR were calculated for
each sample. Actin was used as an endogenous control.
Western blot analysis
HepG2215 and HepG2 cells were seeded into 6-well
plates (4×10⁵ cells/well) and treated as aforementioned.
After they were washed in PBS, the cells were directly lysed in SDS
sample buffer (50 mM Tris-HCl pH 6.8, 1% SDS, 10% glycerol, 5%
β-mercaptoethanol, 0.01% bromophenol blue). According to the
instructions of Epizyme Protein Extraction kit (cat: PC201Plus;
Shanghai Epizyme Biotech Co., Ltd.) proteins were added to 4X
protein loading buffer (cat: P1016; Beijing Solarbio Science &
Technology Co., Ltd.) and protein was determined by the BCA method
(cat: PC0020; Beijing Solarbio Science & Technology Co., Ltd.).
The amount of protein loaded was 10 µl/lane. Equal amounts of total
protein were separated by 12% gel and transferred onto PVDF
membranes. After blocking with 5% skimmed milk for 2.5 h at room
temperature. The primary antibodies were added overnight at 4°C.
The primary antibodies were rabbit anti-CDK1 polyclonal antibody
(dilution, 1:1,000; cat. no. DF6024; Affinity Biosciences Ltd.),
anti-CCNB1 polyclonal antibody (dilution, 1:500; cat. no. AF6168;
Affinity Biosciences Ltd.), β-tubulin antibody (dilution, 1:1,000;
cat. no. 2146; Cell Signaling Technology, Inc.) and rabbit
anti-GAPDH antibody (dilution, 1:1,000; cat. no. 2118; Cell
Signaling Technology, Inc.). The secondary antibody was goat
anti-rabbit IgG-horse radish peroxidase (HRP) [dilution, 1:10,000;
cat. no. abs20002; Absin (Shanghai) Biotechnology Co., Ltd.]. The
secondary antibody was incubated at room temperature for 2 h.
Finally, chemiluminescence and development were performed using
general-purpose ECL luminescent substrate (cat. no. sb-wb012;
Shanghai Shenger Biotechnology Co., Ltd.). The results were
analyzed using Image-Pro Plus v6.0 software (Media Cybernetics,
Inc.).
Statistical analysis
All statistical tests were performed using SPSS23.0
statistics software (IBM Corp.). All experiments were repeated at
least 3 times and data were presented as means ± SD. For the
comparison between two groups, unpaired t-test Student's t-test was
used to determine the statistical significance. When more than two
groups were compared, one-way ANOVA was used and then post-hoc
Bonferroni test was used for the pairwise comparison. All in
vitro experiments were repeated at least three times and at
least three samples were taken at a time. P<0.05 was considered
to indicate a statistically significant difference.
Results
Identification of DEGs in liver cancer
and construction of PPI network
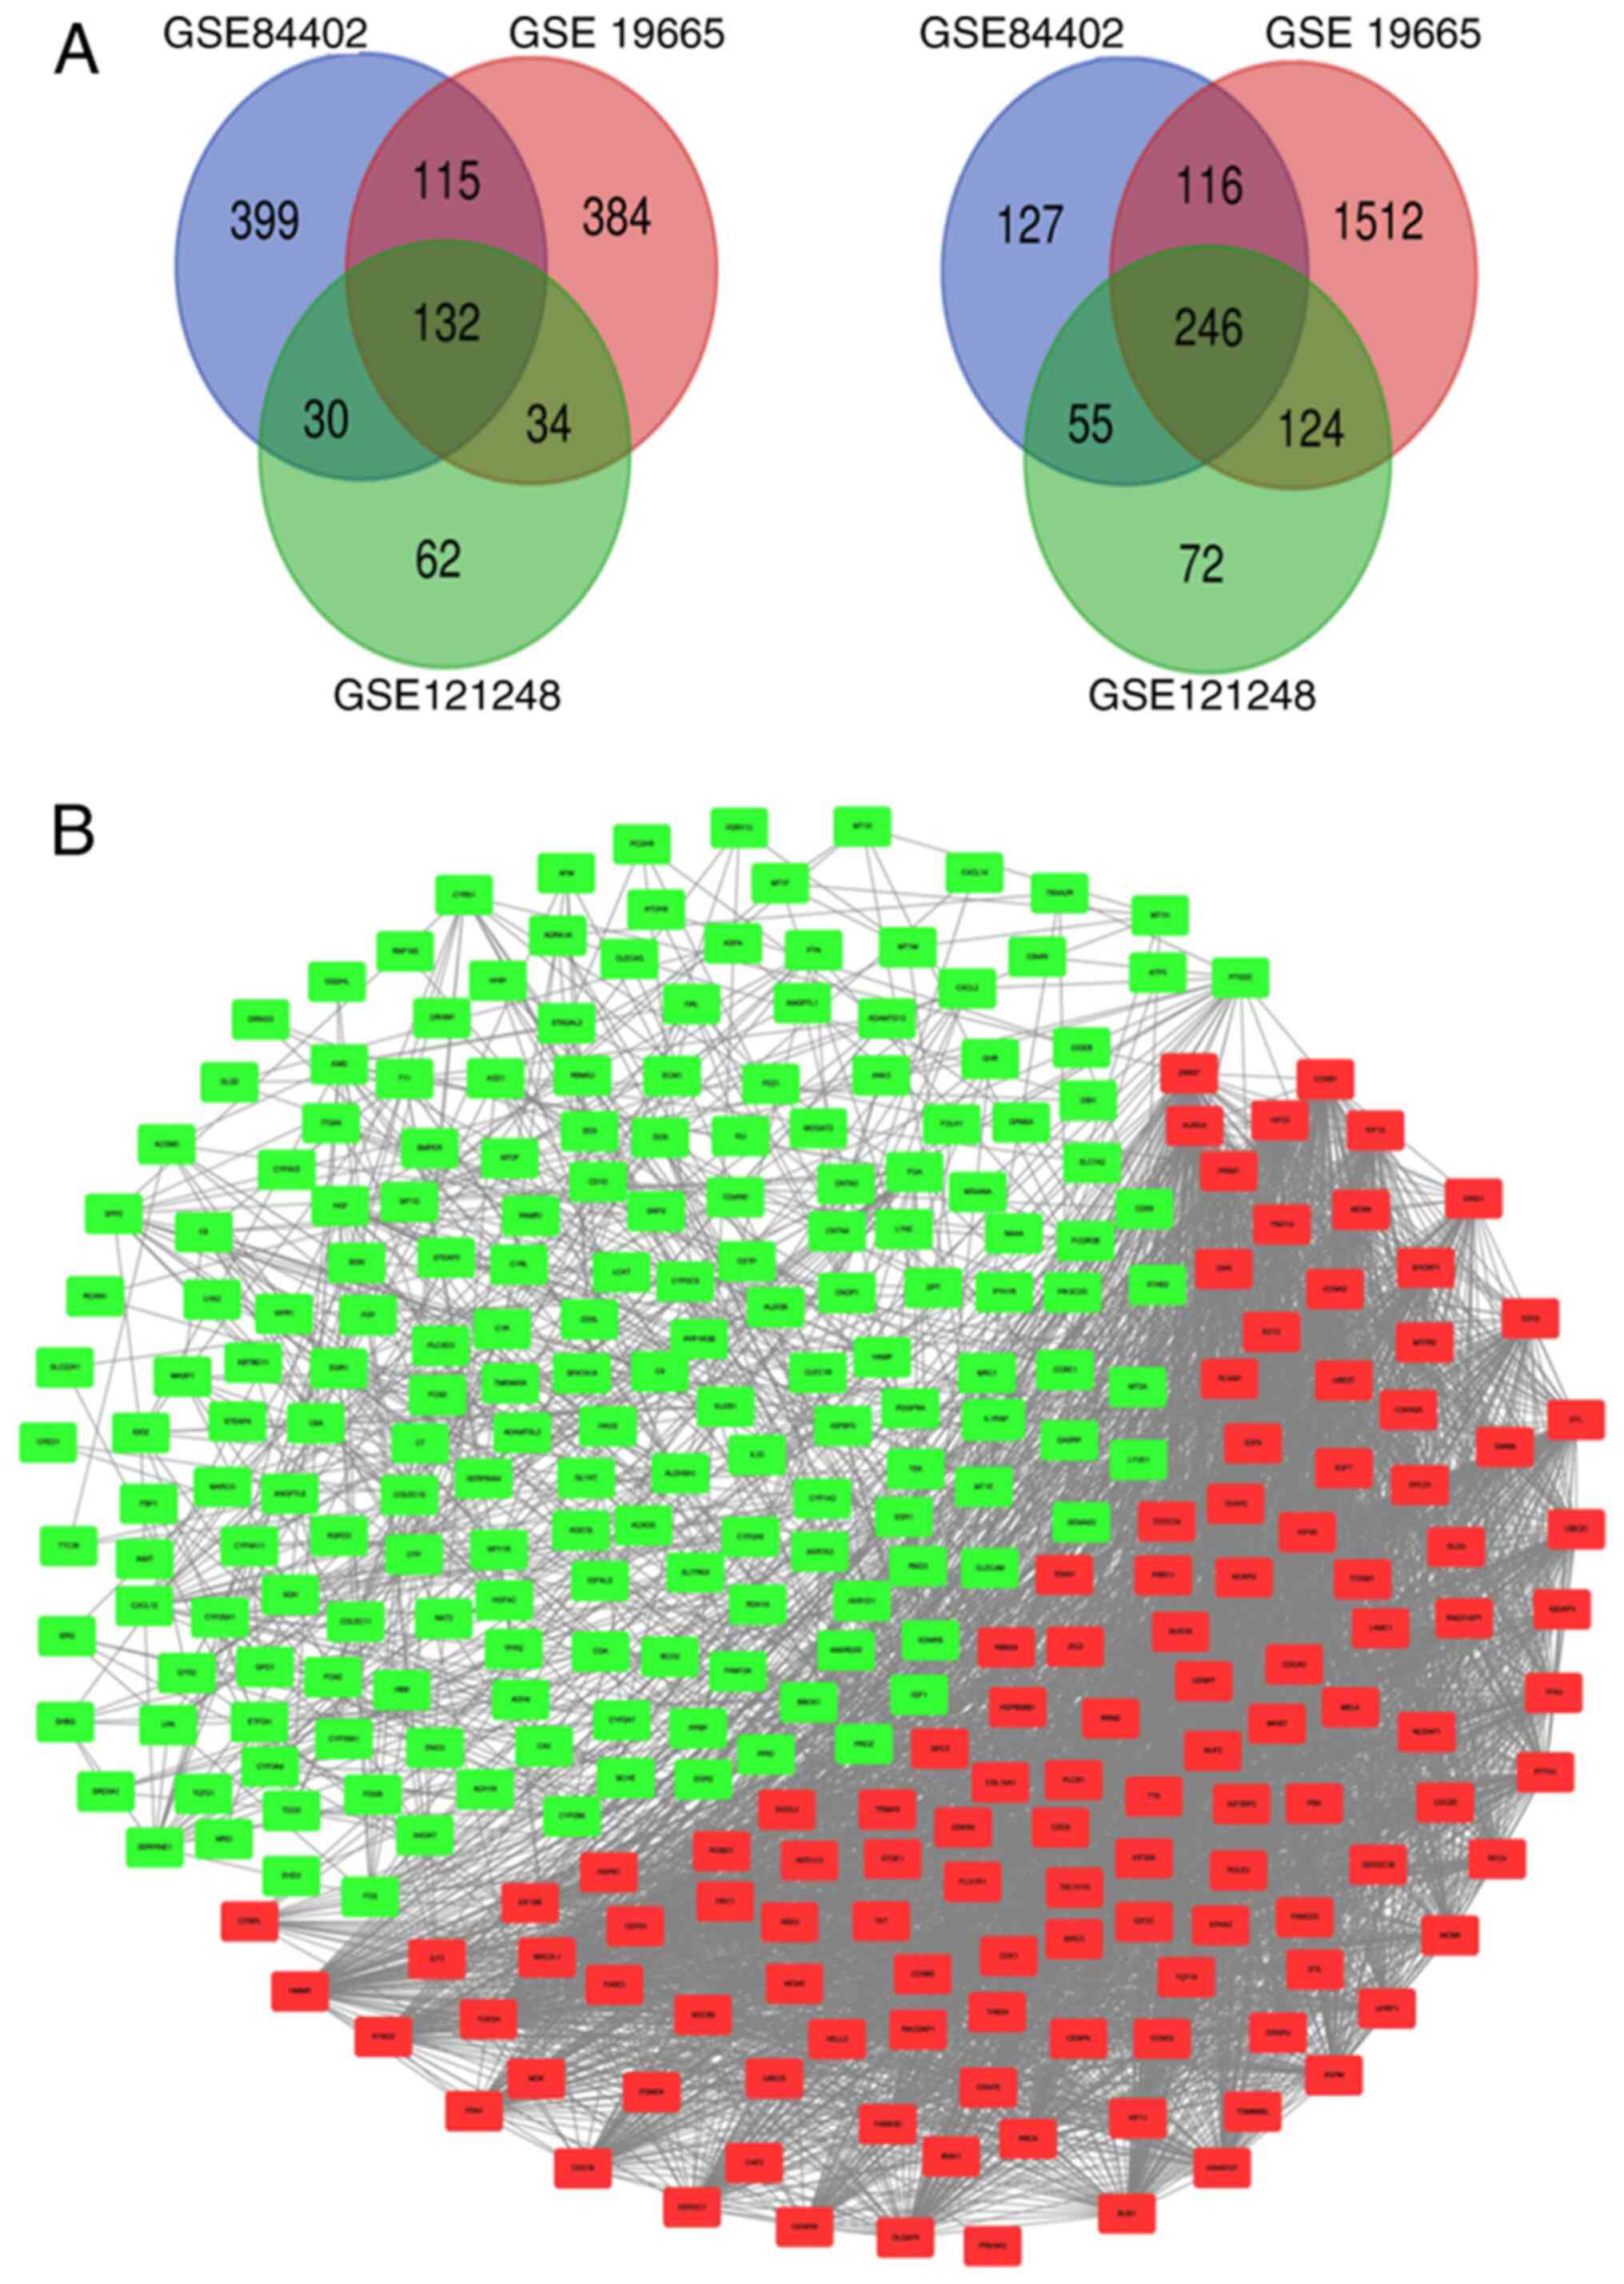
A total of 1,220, 2,663 and 755 DEGs were identified
in GSE84402, GSE19665 and GSE121248, respectively, according to
GEO2R. Venn diagrams were used to examine the intersection among
the DEGs, including 132 upregulated genes and 246 downregulated
genes (Fig. 1A). Protein interaction
network analysis was performed using the String database and
visualized Cytoscape. The PPI network showed that there were 132
upregulated genes and 246 downregulated genes. Red and green
rectangles indicate upregulated and downregulated genes,
respectively (Fig. 1B).
Analysis of hub genes
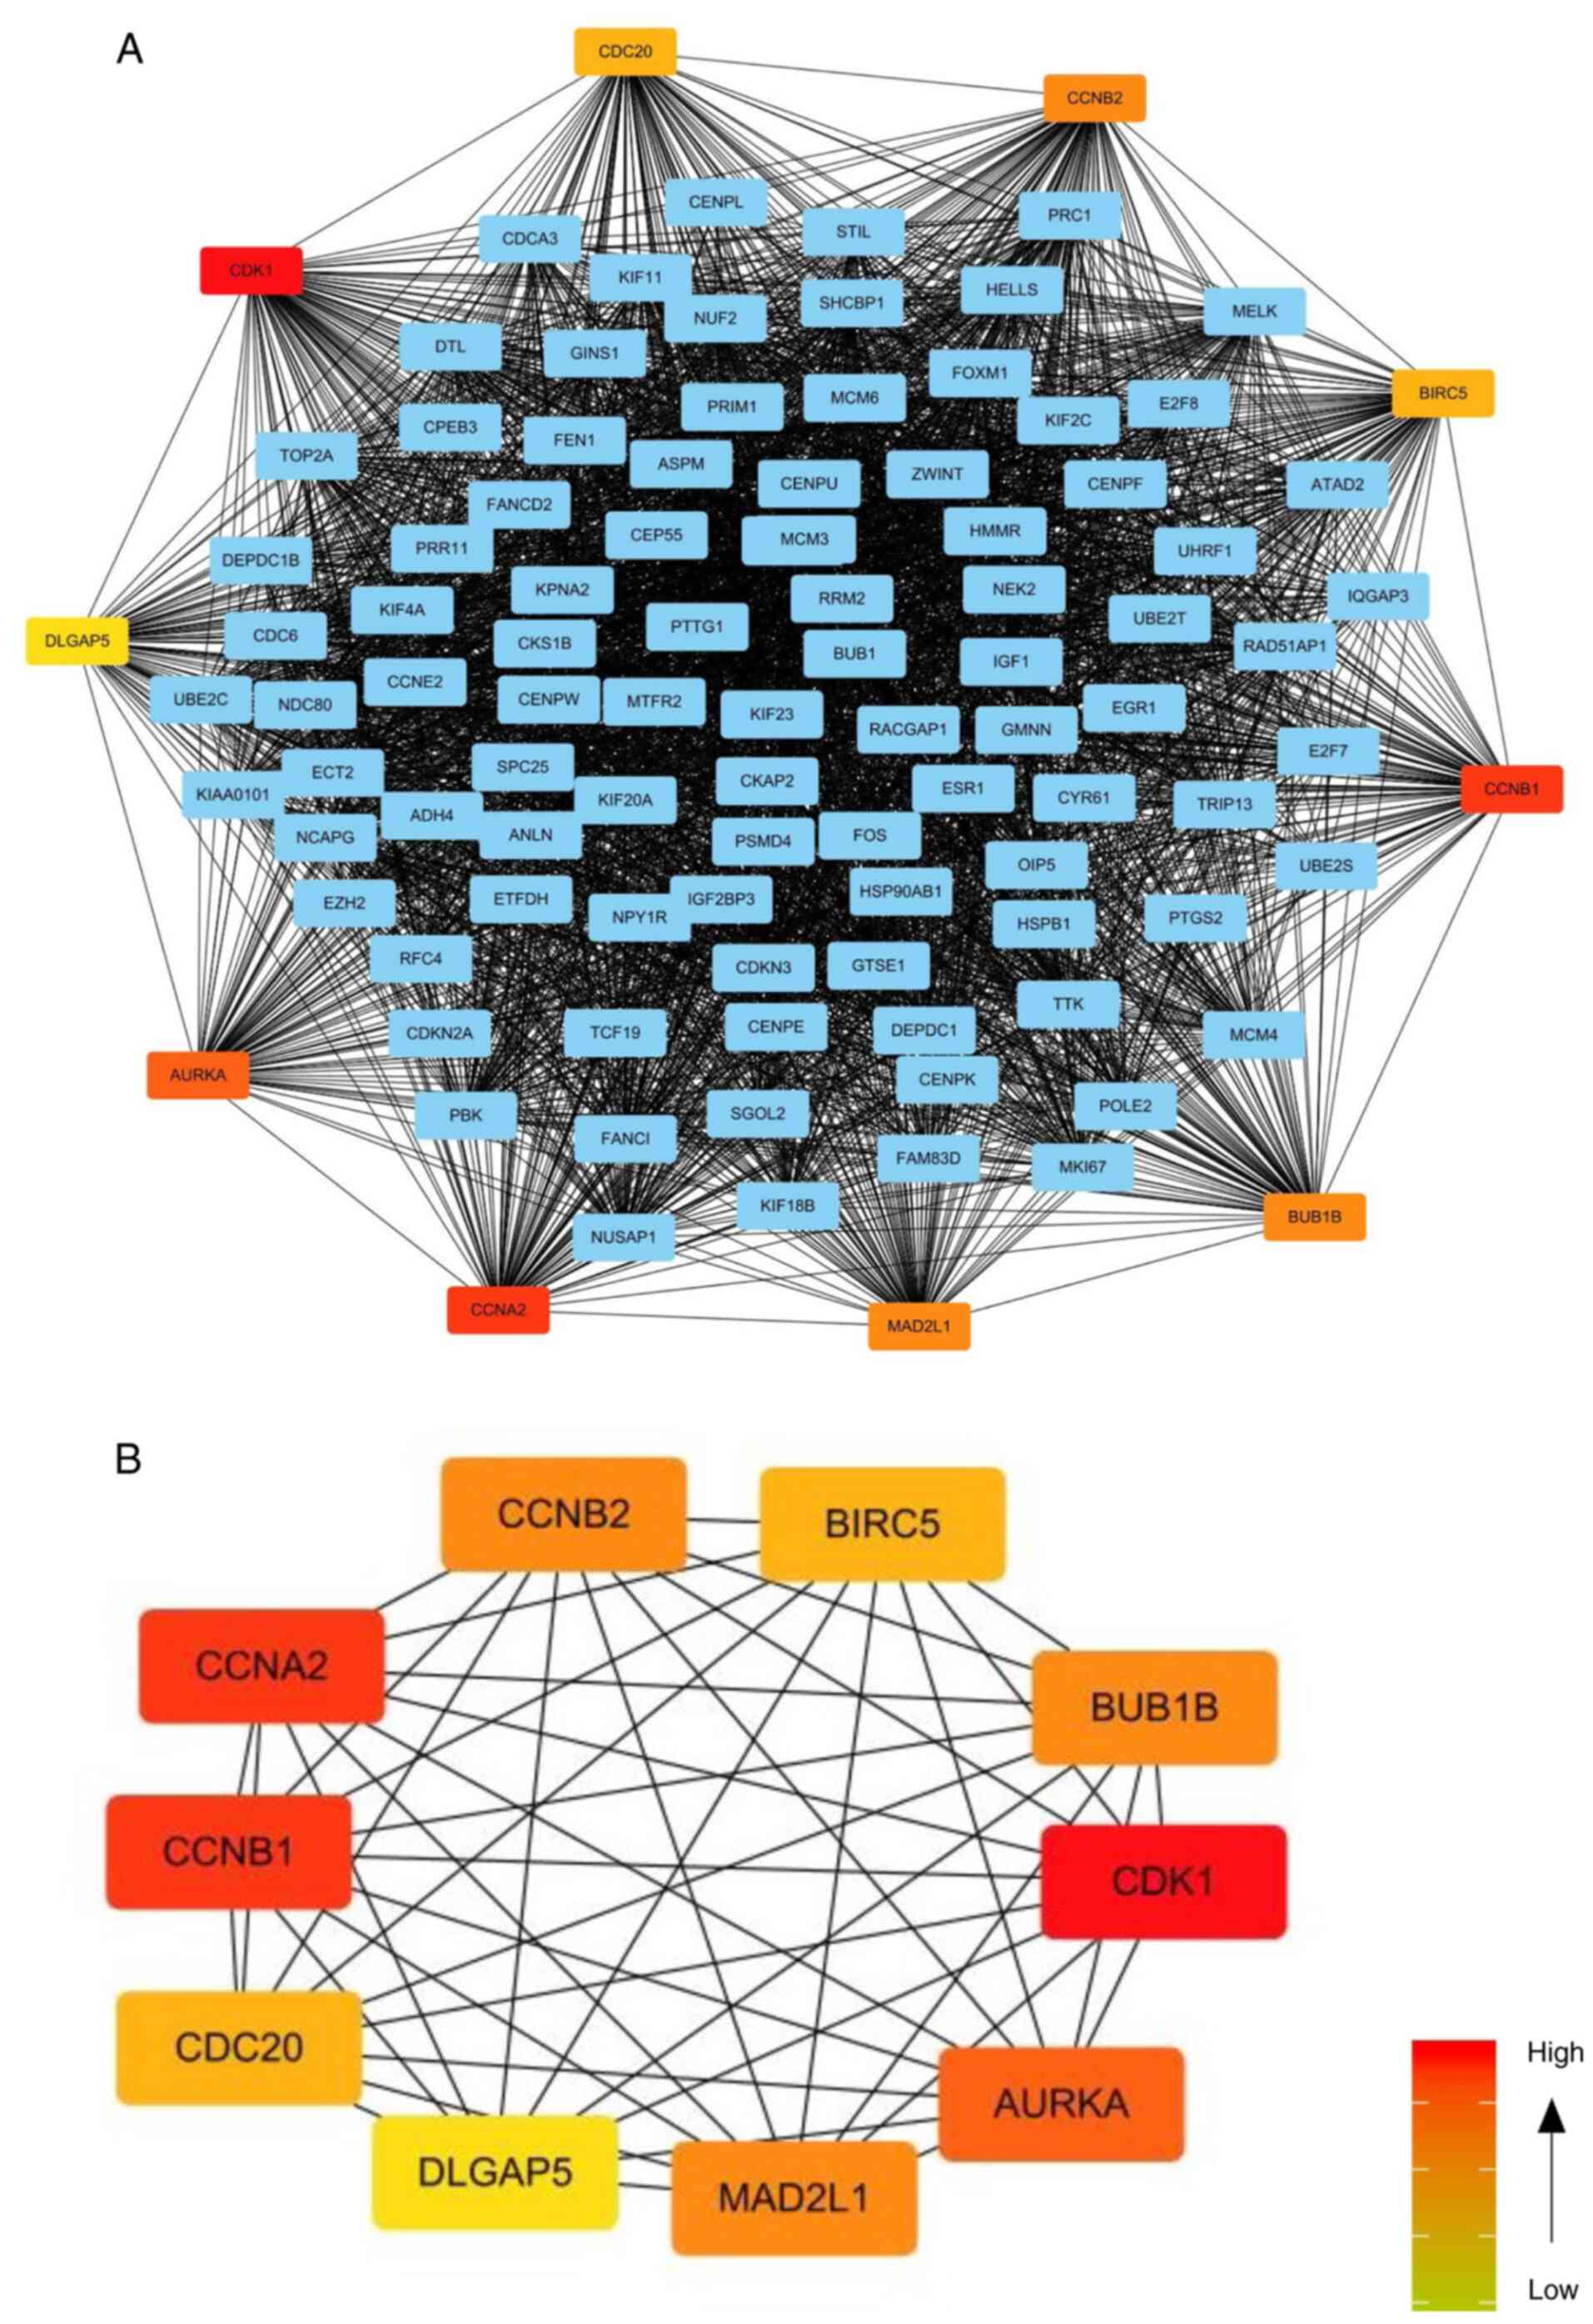
Subsequently, MCODE, a plug-in for Cytoscape, was
used to screen the key subnetworks in PPI network. There were 376
edges and 103 nodes in the key subnetworks of PPI network. The
greater the connection value of the node was, the higher the degree
of network connection was, and the greater the correlation degree
with disease was. The top 10 hub genes were identified according to
the degree >10, and these were AURKA, BIRC5, BUB1B, CCNA2,
CCNB1, CCNB2, CDC20, CDK1, DLGAP5 and MAD2L1. Among them, CDK1 and
CCNB1, CCNA2 had the highest scores (Fig. 2; Table
I). Normally, CDK1 and CCNB1 tend to form a complex, which is
conducive to cell mitosis (22).
CDK1 and CCNB1 had the most connection nodes and the highest score
and were therefore, the most significantly expressed. Hence, the
present study mainly studied CDK1 and CCNB1.
 | Table I.Top 10 hub genes identified using
CytoHubba. |
Table I.
Top 10 hub genes identified using
CytoHubba.
| Rank | Name | Official full
name | Score |
|---|
| 1 | CDK1 | Cyclin-dependent
kinase 1 | 192 |
| 2 | CCNB1 | Cyclin B1 | 186 |
| 2 | CCNA2 | Cyclin A2 | 186 |
| 4 | AURKA | Aurora kinase
A | 184 |
| 5 | MAD2L1 | Mitotic arrest
deficient 2 like 1 | 182 |
| 5 | BUB1B | BUB1 mitotic
checkpoint serine/threonine kinase B | 182 |
| 5 | CCNB2 | Cyclin B2 | 182 |
| 8 | BIRC5 | Baculoviral
inhibitor of apoptosis repeat containing | 180 |
| 8 | CDC20 | Cell division cycle
20 | 180 |
| 10 | DLGAP5 | DLG associated
protein 5 | 176 |
GO and KEGG enrichment analysis of
DEGs
The present study explored the influence of DEGs on
the function and pathways of genes using GO and KEGG enrichment
analysis using DAVID. The GO function analysis of these genes was
conducted in three parts (BP, MF and CC). The results were
considered to be statistically significant if count >10 and
adjust-P<0.05. The results of the three parts of GO analysis are
shown in Fig. 3. The bigger the dot,
the more genes; the redder the color, the more significant the
P-value. The main altered BP terms were ‘cell division’
(adjust-P=3.37×10⁻¹¹) and ‘mitotic nuclear division’
(adjust-P=6.24×10⁻¹⁰). The main altered CC terms were
‘condensed chromosome kinetochore’ (adjust-P=2.33×10⁻⁷)
and ‘chromosome, centromeric region’
(adjust-P=1.05×10⁻⁶). The main altered MF terms were
‘heme binding’ (adjust-P=2.31×10⁻⁴) and ‘iron ion
binding’ (adjust-P=0.001189). The altered KEGG pathways were ‘Cell
cycle’ (adjust-P=3.66×10⁻⁵), ‘p53 signaling pathway’
(adjust-P=3.21×10⁻⁴) and ‘Oocyte meiosis’
(adjust-P=0.007786; Fig. 3; Table II). Notably, these genes were mainly
involved in cell cycle function and pathways.
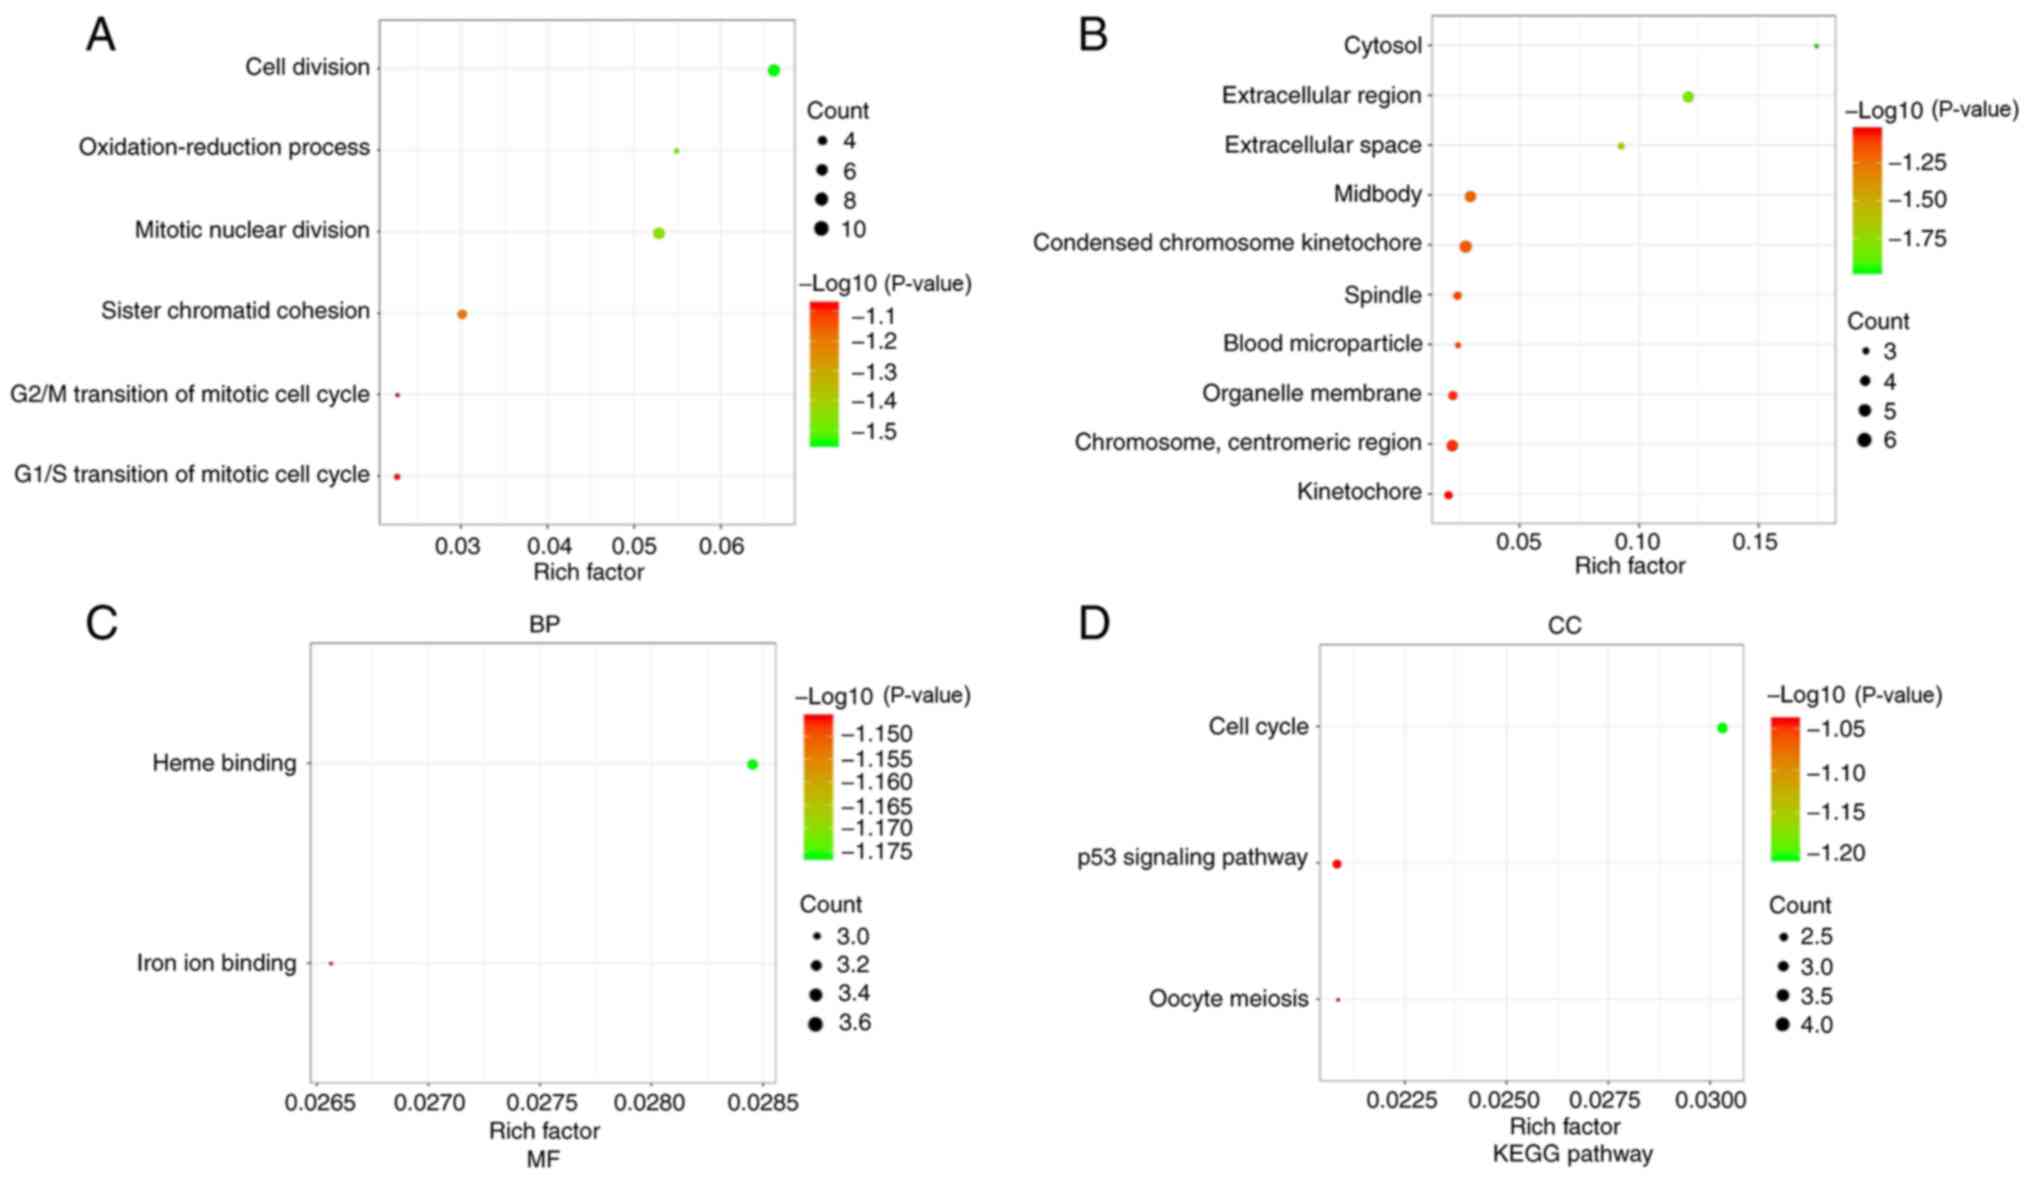 | Figure 3.GO and KEGG pathway enrichment
analysis of DEGs. (A) GO analysis results revealed that upregulated
DEGs and downregulated DEGs were enriched in BPs. The bigger the
dot, the more genes; the redder the color, the more significant the
P-value. The main BP terms were ‘cell division’ and ‘mitotic
nuclear division’. (B) GO analysis results demonstrated that
upregulated DEGs and downregulated DEGs were enriched in CCs. The
main altered CC terms were ‘condensed chromosome kinetochore’ and
‘chromosome, centromeric region’. (C) GO analysis results
demonstrated that upregulated DEGs and downregulated DEGs were
enriched in MFs. The main altered MF terms were ‘heme binding’ and
‘iron ion binding’. (D) Most significant KEGG enrichment pathways
of the upregulated and downregulated DEGs. The altered KEGG
pathways were ‘Cell cycle’, ‘p53 signaling pathway’ and ‘Oocyte
meiosis’. Adjusted P-value <0.01 and counts >10 were
considered statistically significant. BP, biological process; CC,
cellular component; DEGs, differentially expressed genes; GO, Gene
Ontology; KEGG, Kyoto Encyclopedia of Genes and Genomes; MF,
molecular function. |
| Table II.Analysis of Gene Ontology functions
and Kyoto Encyclopedia of Genes and Genomes pathways. |
Table II.
Analysis of Gene Ontology functions
and Kyoto Encyclopedia of Genes and Genomes pathways.
| Category | Term | Enrichment | Count | FDR |
|---|
| BP | Cell division | 0.06641 | 35 |
3.37×10⁻¹¹ |
| BP | Mitotic nuclear
division | 0.05313 | 28 |
6.24×10⁻¹⁰ |
| BP | Sister chromatid
cohesion | 0.03036 | 16 |
1.10×10⁻⁶ |
| BP | G1/S transition of
mitotic cell cycle | 0.02277 | 12 | 0.001308 |
| BP | Oxidation-reduction
process | 0.05503 | 29 | 0.003476 |
| BP | G2/M transition of
mitotic cell cycle | 0.02277 | 12 | 0.009342 |
| CC | Condensed
chromosome kinetochore | 0.02846 | 15 |
2.33×10⁻⁷ |
| CC | Chromosome,
centromeric region | 0.02277 | 12 |
1.05×10⁻⁶ |
| CC | Extracellular
region | 0.12144 | 64 |
1.45×10⁻⁶ |
| CC | Midbody | 0.03036 | 16 |
1.45×10⁻⁶ |
| CC | Organelle
membrane | 0.02277 | 12 |
3.84×10⁻⁵ |
| CC | Kinetochore | 0.02087 | 11 |
1.19×10⁻⁴ |
| CC | Spindle | 0.02467 | 13 |
1.19×10⁻⁴ |
| CC | Extracellular
space | 0.09298 | 49 |
5.03×10⁻⁴ |
| CC | Blood
microparticle | 0.02467 | 13 |
9.58×10⁻⁴ |
| CC | Cytosol | 0.17457 | 92 | 0.002001 |
| MF | Heme binding | 0.02846 | 15 |
2.31×10⁻⁴ |
| MF | Iron ion
binding | 0.02657 | 14 | 0.001189 |
| Pathway | Cell cycle | 0.03036 | 16 |
3.66×10⁻⁵ |
| Pathway | p53 signaling
pathway | 0.02087 | 11 |
3.21×10⁻⁴ |
| Pathway | Oocyte meiosis | 0.02087 | 11 | 0.007786 |
Expression levels of 10 genes in
HCC
The present study further explored the expression
levels of these genes in liver cancer using the GEPIA and Oncomine
databases. The results of GEPIA database analysis revealed that
AURKA, BIRC5, BUB1B, CCNA2, CCNB1, CCNB2, CDC20, CDK1, DLGAP5 and
MAD2L1 (Fig. 4) were upregulated in
liver cancer tissues compared with in normal tissues. T and N
indicated liver cancer tissues and normal tissues,
respectively.
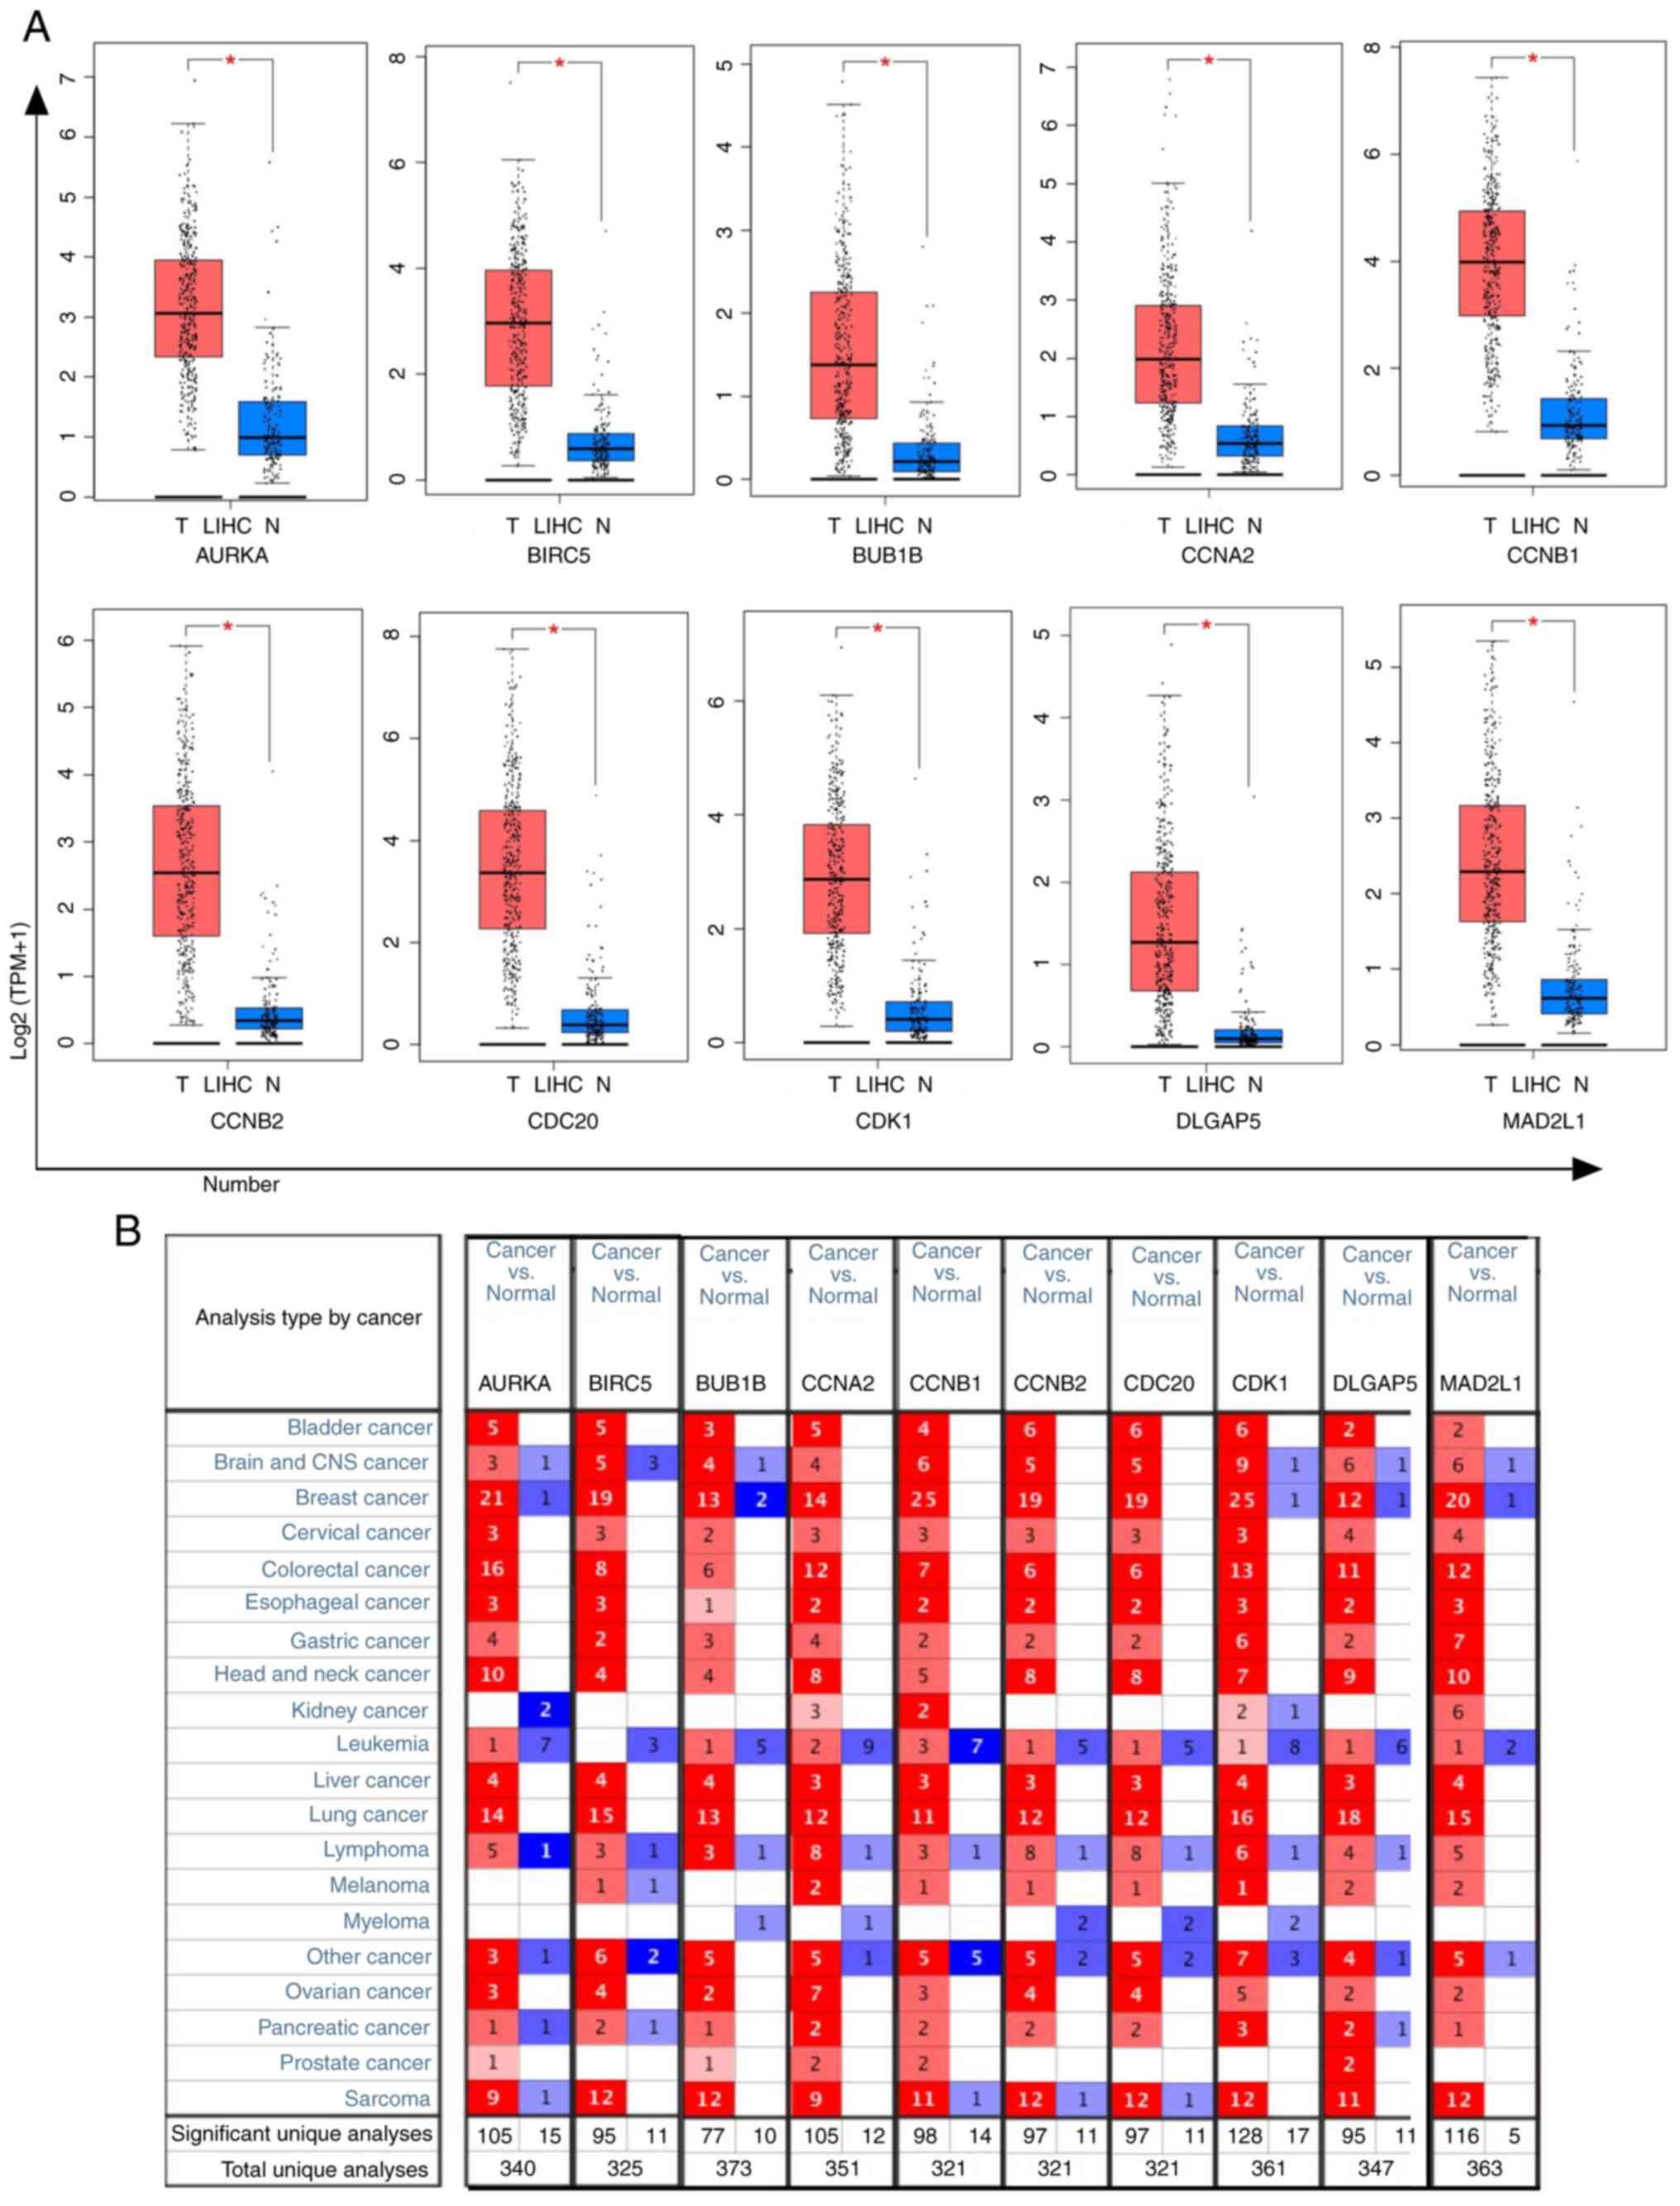 | Figure 4.Expression levels of 10 hub genes
based on GEPIA and Oncomine database analysis. (A) The 10 hub genes
(AURKA, BIRC5, BUB1B, CCNA2, CCNB1, CCNB2, CDC20, CDK1, DLGAP5 and
MAD2L1) were more highly expressed in liver cancer tissues compared
with in normal tissues according to GEPIA. The red and blue boxes
represent cancer and normal tissues, respectively. *P<0.05. (B)
The 10 hub genes were more highly expressed in liver cancer tissues
compared with in normal tissues according to Oncomine. The red box
means up and blue box means down. GEPIA, Gene Expression Profiling
Interactive Analysis; LIHC, liver hepatocellular carcinoma; TPM,
transcripts per million. |
In addition, the present study verified the mRNA
expression levels of AURKA, BIRC5, BUB1B, CCNA2, CCNB1, CCNB2,
CDC20, CDK1, DLGAP5 and MAD2L1 in different types of cancer using
the Oncomine database. Similarly, the present study demonstrated
that AURKA, BIRC5, BUB1B, CDK1 and MAD2L1 were upregulated in four
datasets in liver cancer, whereas CCNA2, CCNB1, CCNB2, CDC20 and
DLGAP5 were upregulated in three datasets of liver cancer (Fig. 4). These results demonstrated that the
expression levels of the hub genes were upregulated in liver
cancer.
Analysis of the protein expression
levels of hub genes in liver cancer
Subsequently, the present study analyzed the protein
expression levels of the 10 hub genes using the HPA database.
Notably, in HPA database, the results showed that CDK1, CCNB1,
AURKA, CCNA2, CDC20 and DLGAP5 proteins were not expressed in
normal liver tissues, whereas low expression, and even medium (CDK1
and CCNB1) and high expression (AURKA) of these hub genes was
observed in liver cancer tissues (Fig.
5). These results demonstrated that these genes except MAD2L1
were upregulated in liver cancer.
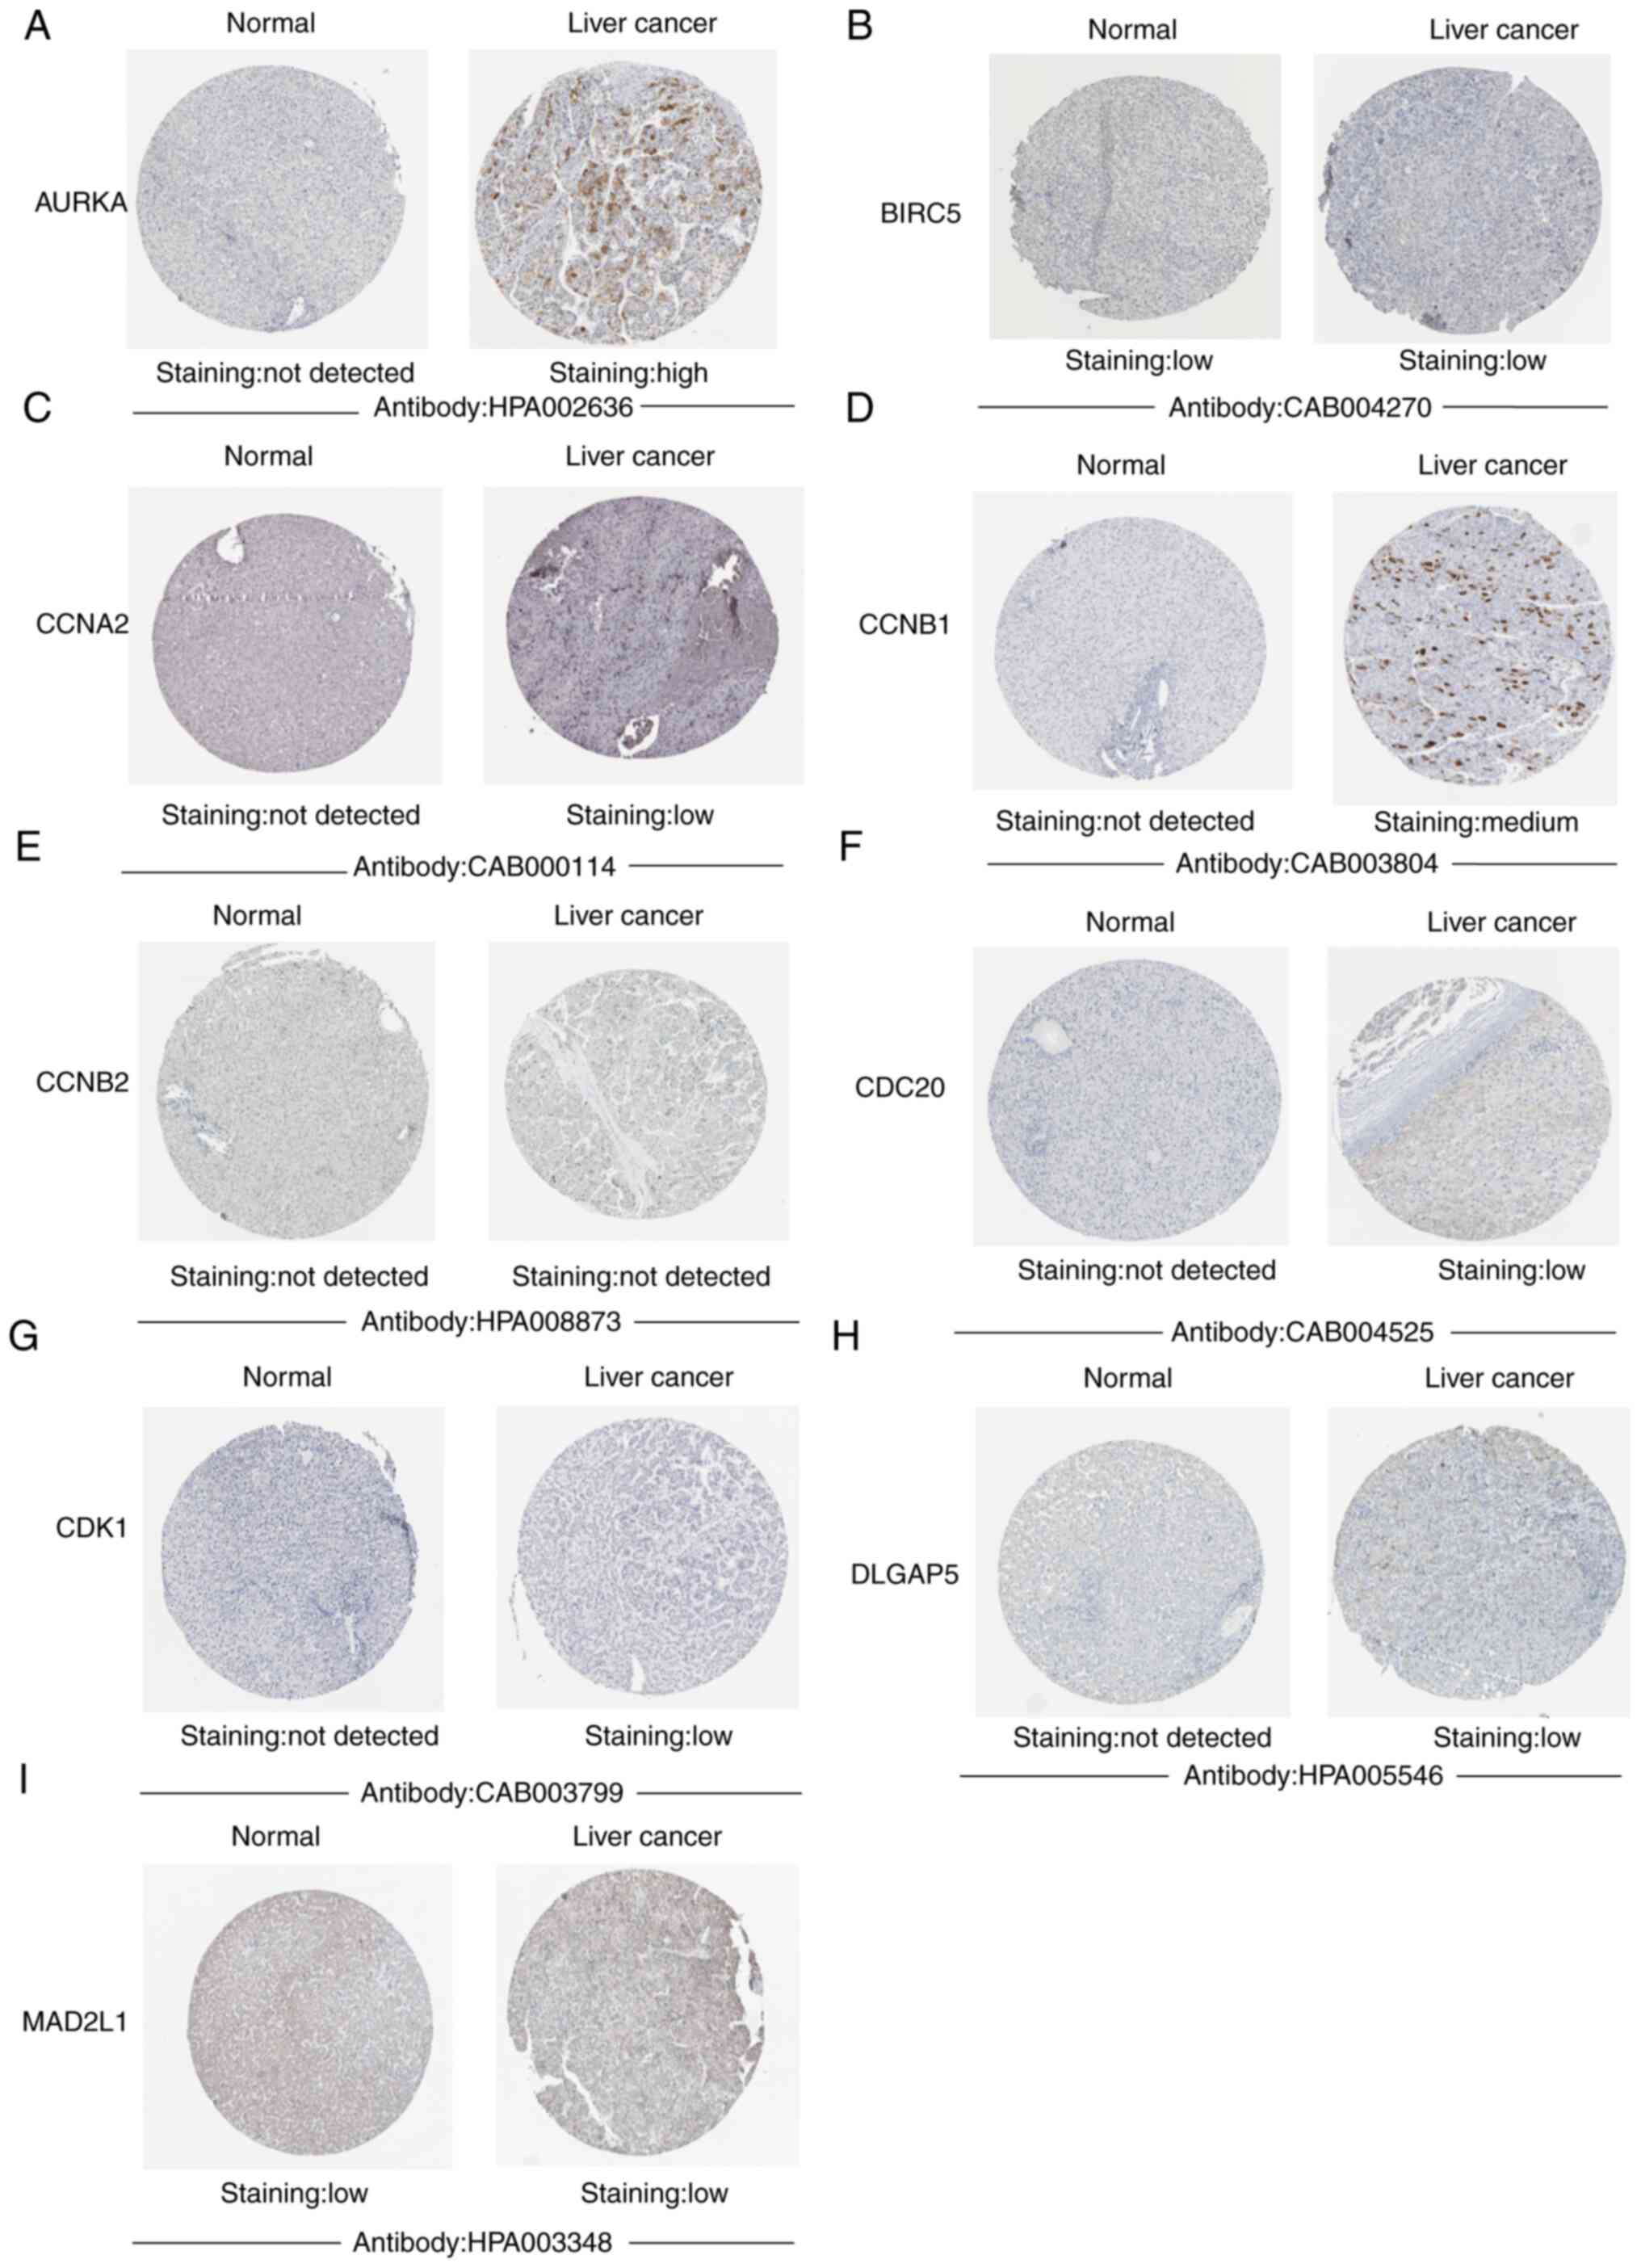 | Figure 5.Immunohistochemical analysis of the
10 hub genes using HPA. The immunohistochemical images of (A)
AURKA, (B) BIRC5, (C) CCNA2, (D) CCNB1, (E) CCNB2, (F) CDC20, (G)
CDK1, (H) DLGAP5 and (I) MAD2L1 in HCC and liver tissues from the
HPA database. The results demonstrated that CDK1, CCNB1, AURKA,
CCNA2, CDC20, DLGAP5CCNB1 and AURKA were upregulated in HCC.
However, BIRC5, CCNB2 and MAD2L1 were not changed significantly in
liver cancer. HCC, hepatocellular carcinoma; HPA, Human Protein
Atlas. |
Survival analysis of 10 genes
To illustrate the overall survival time of these
genes in patients with liver cancer, KM plotter was used to draw
the survival curves of patients with liver cancer. As shown in
Fig. 6, AURKA [hazard ratio (HR)=1.9
(1.33–2.71), log-rank P=3.6×10⁻⁴], BIRC5 [HR=2.56
(1.79–3.66), log-rank P=8.6×10⁻⁸], BUB1B [HR=2.07
(1.45–2.97), log-rank P=4.7×10⁻⁵], CCNA2 [HR=2.76
(1.65–4.62), log-rank P=5.5×10⁻⁵], CCNB1 [HR=2.72
(1.74–4.26), log-rank P=5.1×10⁻⁶], CCNB2 [HR=2.2
(1.42–3.39), log-rank P=2.7×10⁻⁴], CDC20 [HR=2.8
(1.9–4.13), log-rank P=5.7×10⁻⁸], CDK1 [HR=2.2
(1.53–3.16), log-rank P=1.2×10⁻⁵], DLGAP5 [HR=2.83
(1.77–4.54), log-rank P=6.4×10⁻⁶] and MAD2L1 [HR=2.47
(1.65–3.7), log-rank P=5.3×10⁻⁶] were highly expressed
and associated with poor overall survival time (Fig. 6). It was demonstrated that the hazard
ratio and expression of these ten hub genes were generally higher
in male patients than in female patients. However, there was little
difference among ethnicities (Table
SI). Furthermore, it was identified that the hazard ratios
expression levels of the 10 hub genes were generally associated
with the grade and stage of liver cancer (Table SI).
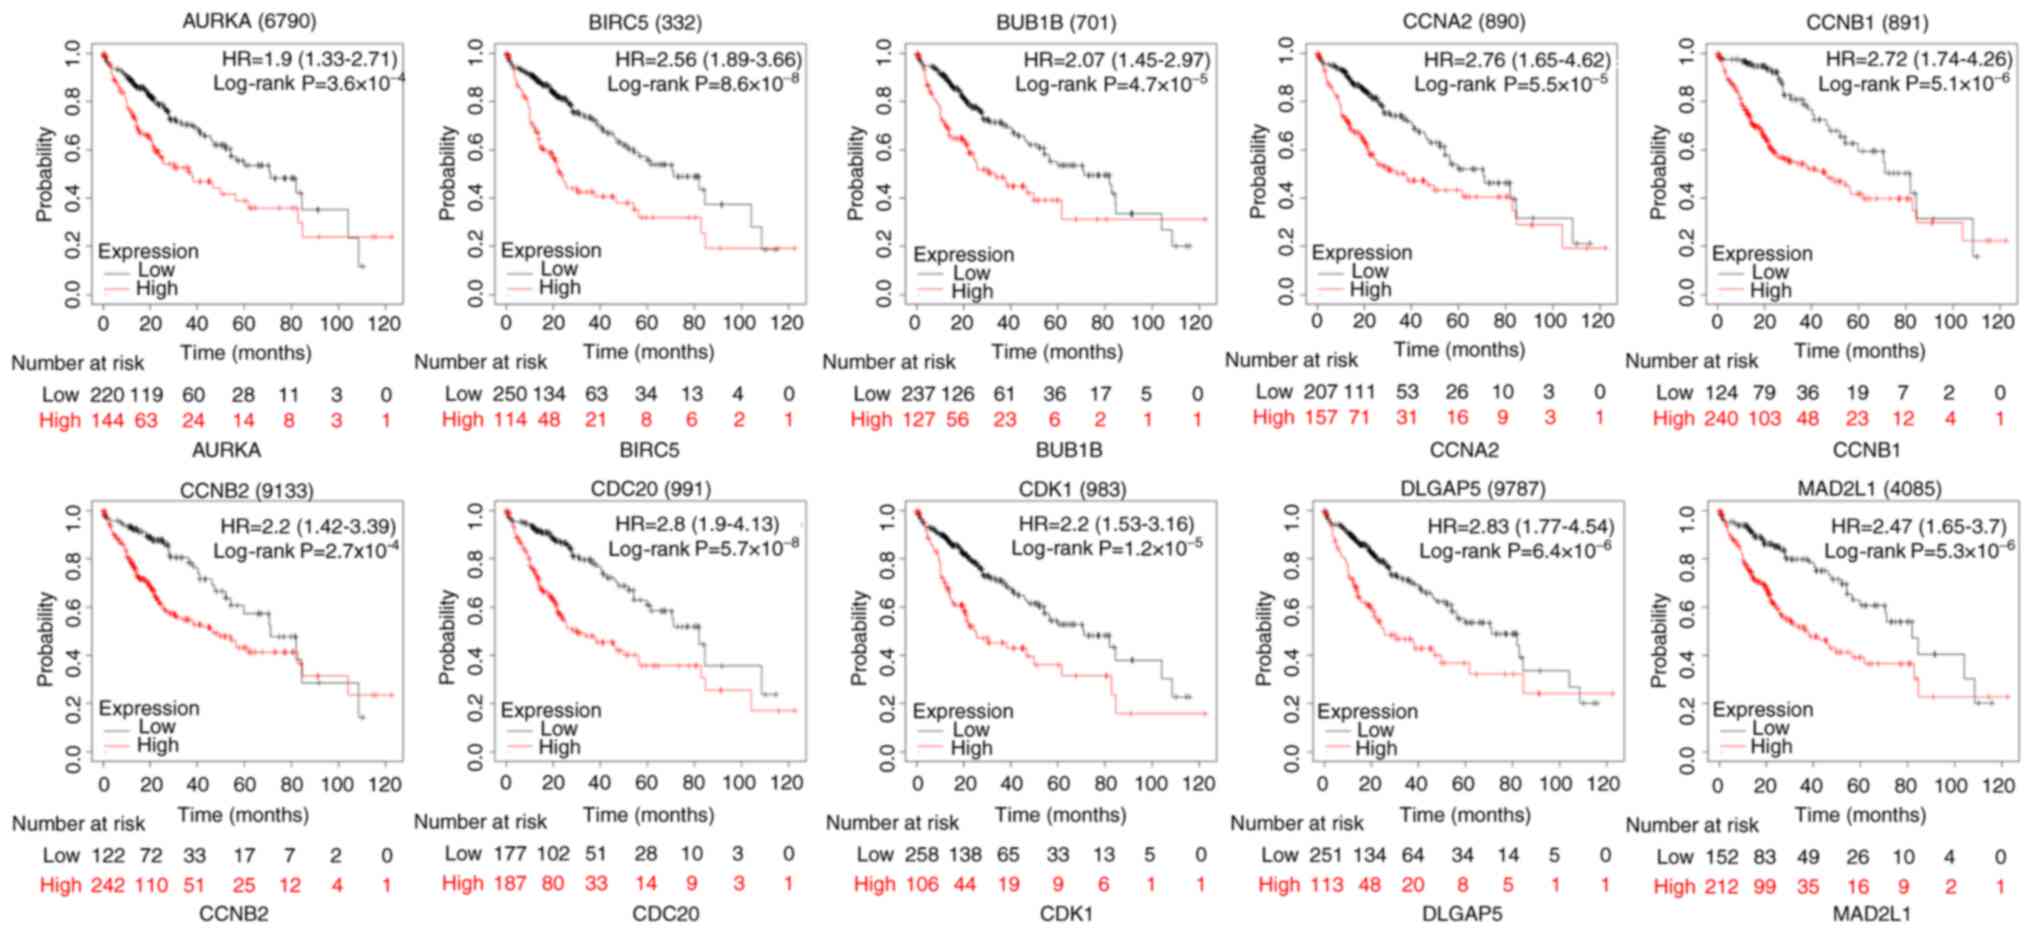 | Figure 6.Analysis of the prognostic value of
the 10 hub genes in HCC using Kaplan-Meier Plotter. The 10 hub
genes were represented by hazard ratios with a 95% confidence
interval. AURKA [HR=1.9 (1.33–2.71), log-rank
P=3.6×10⁻⁴], BIRC5 [HR=2.56 (1.79–3.66), log-rank
P=8.6×10⁻⁸, BUB1B [HR=2.07 (1.45–2.97), log-rank
P=4.7×10⁻⁵], CCNA2 [HR=2.76 (1.65–4.62), log-rank
P=5.5×10⁻⁵], CCNB1 [HR=2.72 (1.74–4.26), log-rank P=
5.1×10⁻⁶], CCNB2 [HR=2.2 (1.42–3.39), log-rank
P=2.7×10⁻⁴], CDC20 [HR=2.8 (1.9–4.13), log-rank P=
5.7×10⁻⁸], CDK1 [HR=2.2 (1.53–3.16), log-rank
P=1.2×10⁻⁵], DLGAP5 [HR=2.83 (1.77–4.54), log-rank
P=6.4×10⁻⁶] and MAD2L1 [HR=2.47 (1.65–3.7), log-rank
P=5.3×10⁻⁶] High expression levels of AURKA, BIRC5,
BUB1B, CCNA2, CCNB1, CCNB2, CDC20, CDK1, DLGAP5 and MAD2L1 were
associated with poor overall survival. Log-rank P<0.05 was
considered to indicate a statistically significant difference. HR,
hazard ratio. |
DHA inhibits the proliferation of
HepG2 cells in vitro
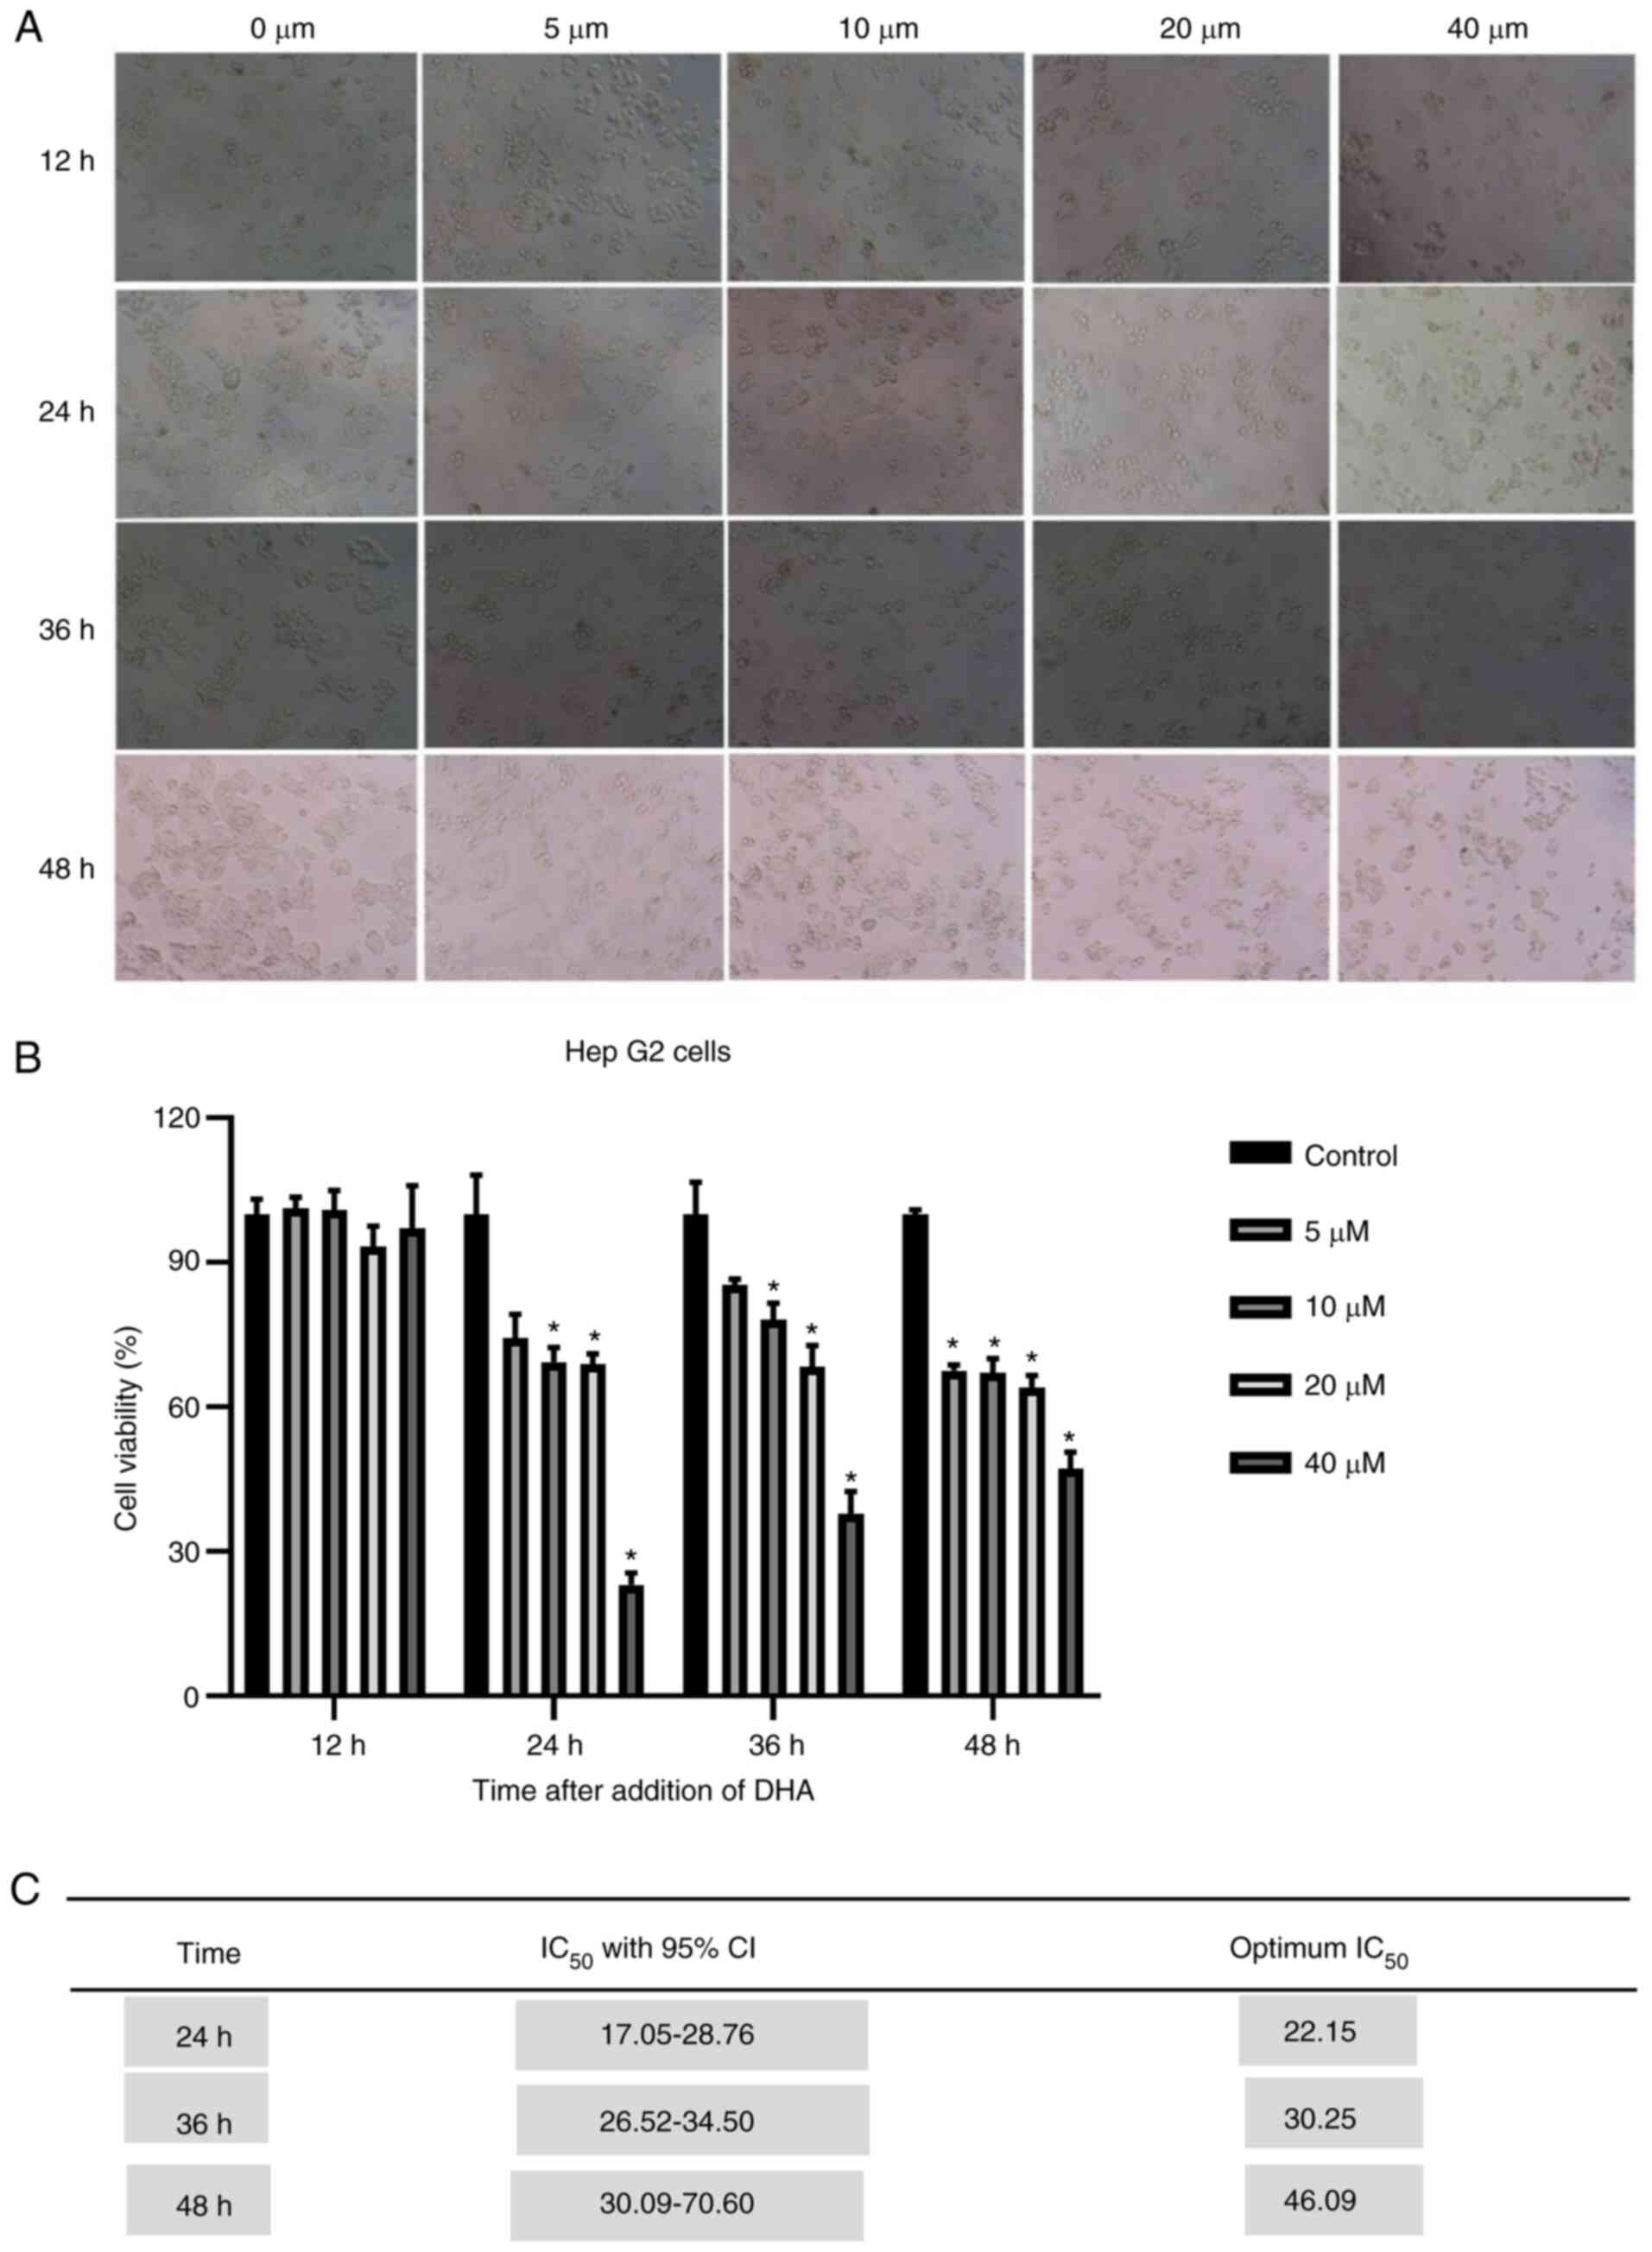
Our previous study revealed that DHA was selectively
cytotoxic for a number of cancer cell lines, including HepG2215
cells (12). HepG2 cells were
treated with DHA (5, 10, 20 and 40 µM) for 12, 24, 36 and 48 h to
test the anti-proliferative effect of DHA on the cells in
vitro. The cell viability was measured by the CCK-8 assay. It
was revealed that DHA cytotoxicity was dose- dependent. In
addition, it was identified that the cancer cells viability
decreased with the increase of concentration at 24, 36 and 48 h in
the DHA group (Fig. 7A and B).
Compared with that at other times, DHA had little inhibitory effect
on liver cancer cells at 12 h. Therefore, 24 h was the optimal
time, with an IC50 of 22.15 µM (Fig. 7C).
DHA reduces the mRNA and protein
expression levels of CDK1 and CCNB1
CDK1 and CCNB1 were associated with the occurrence
of liver cancer. Our previous study also indicated that DHA
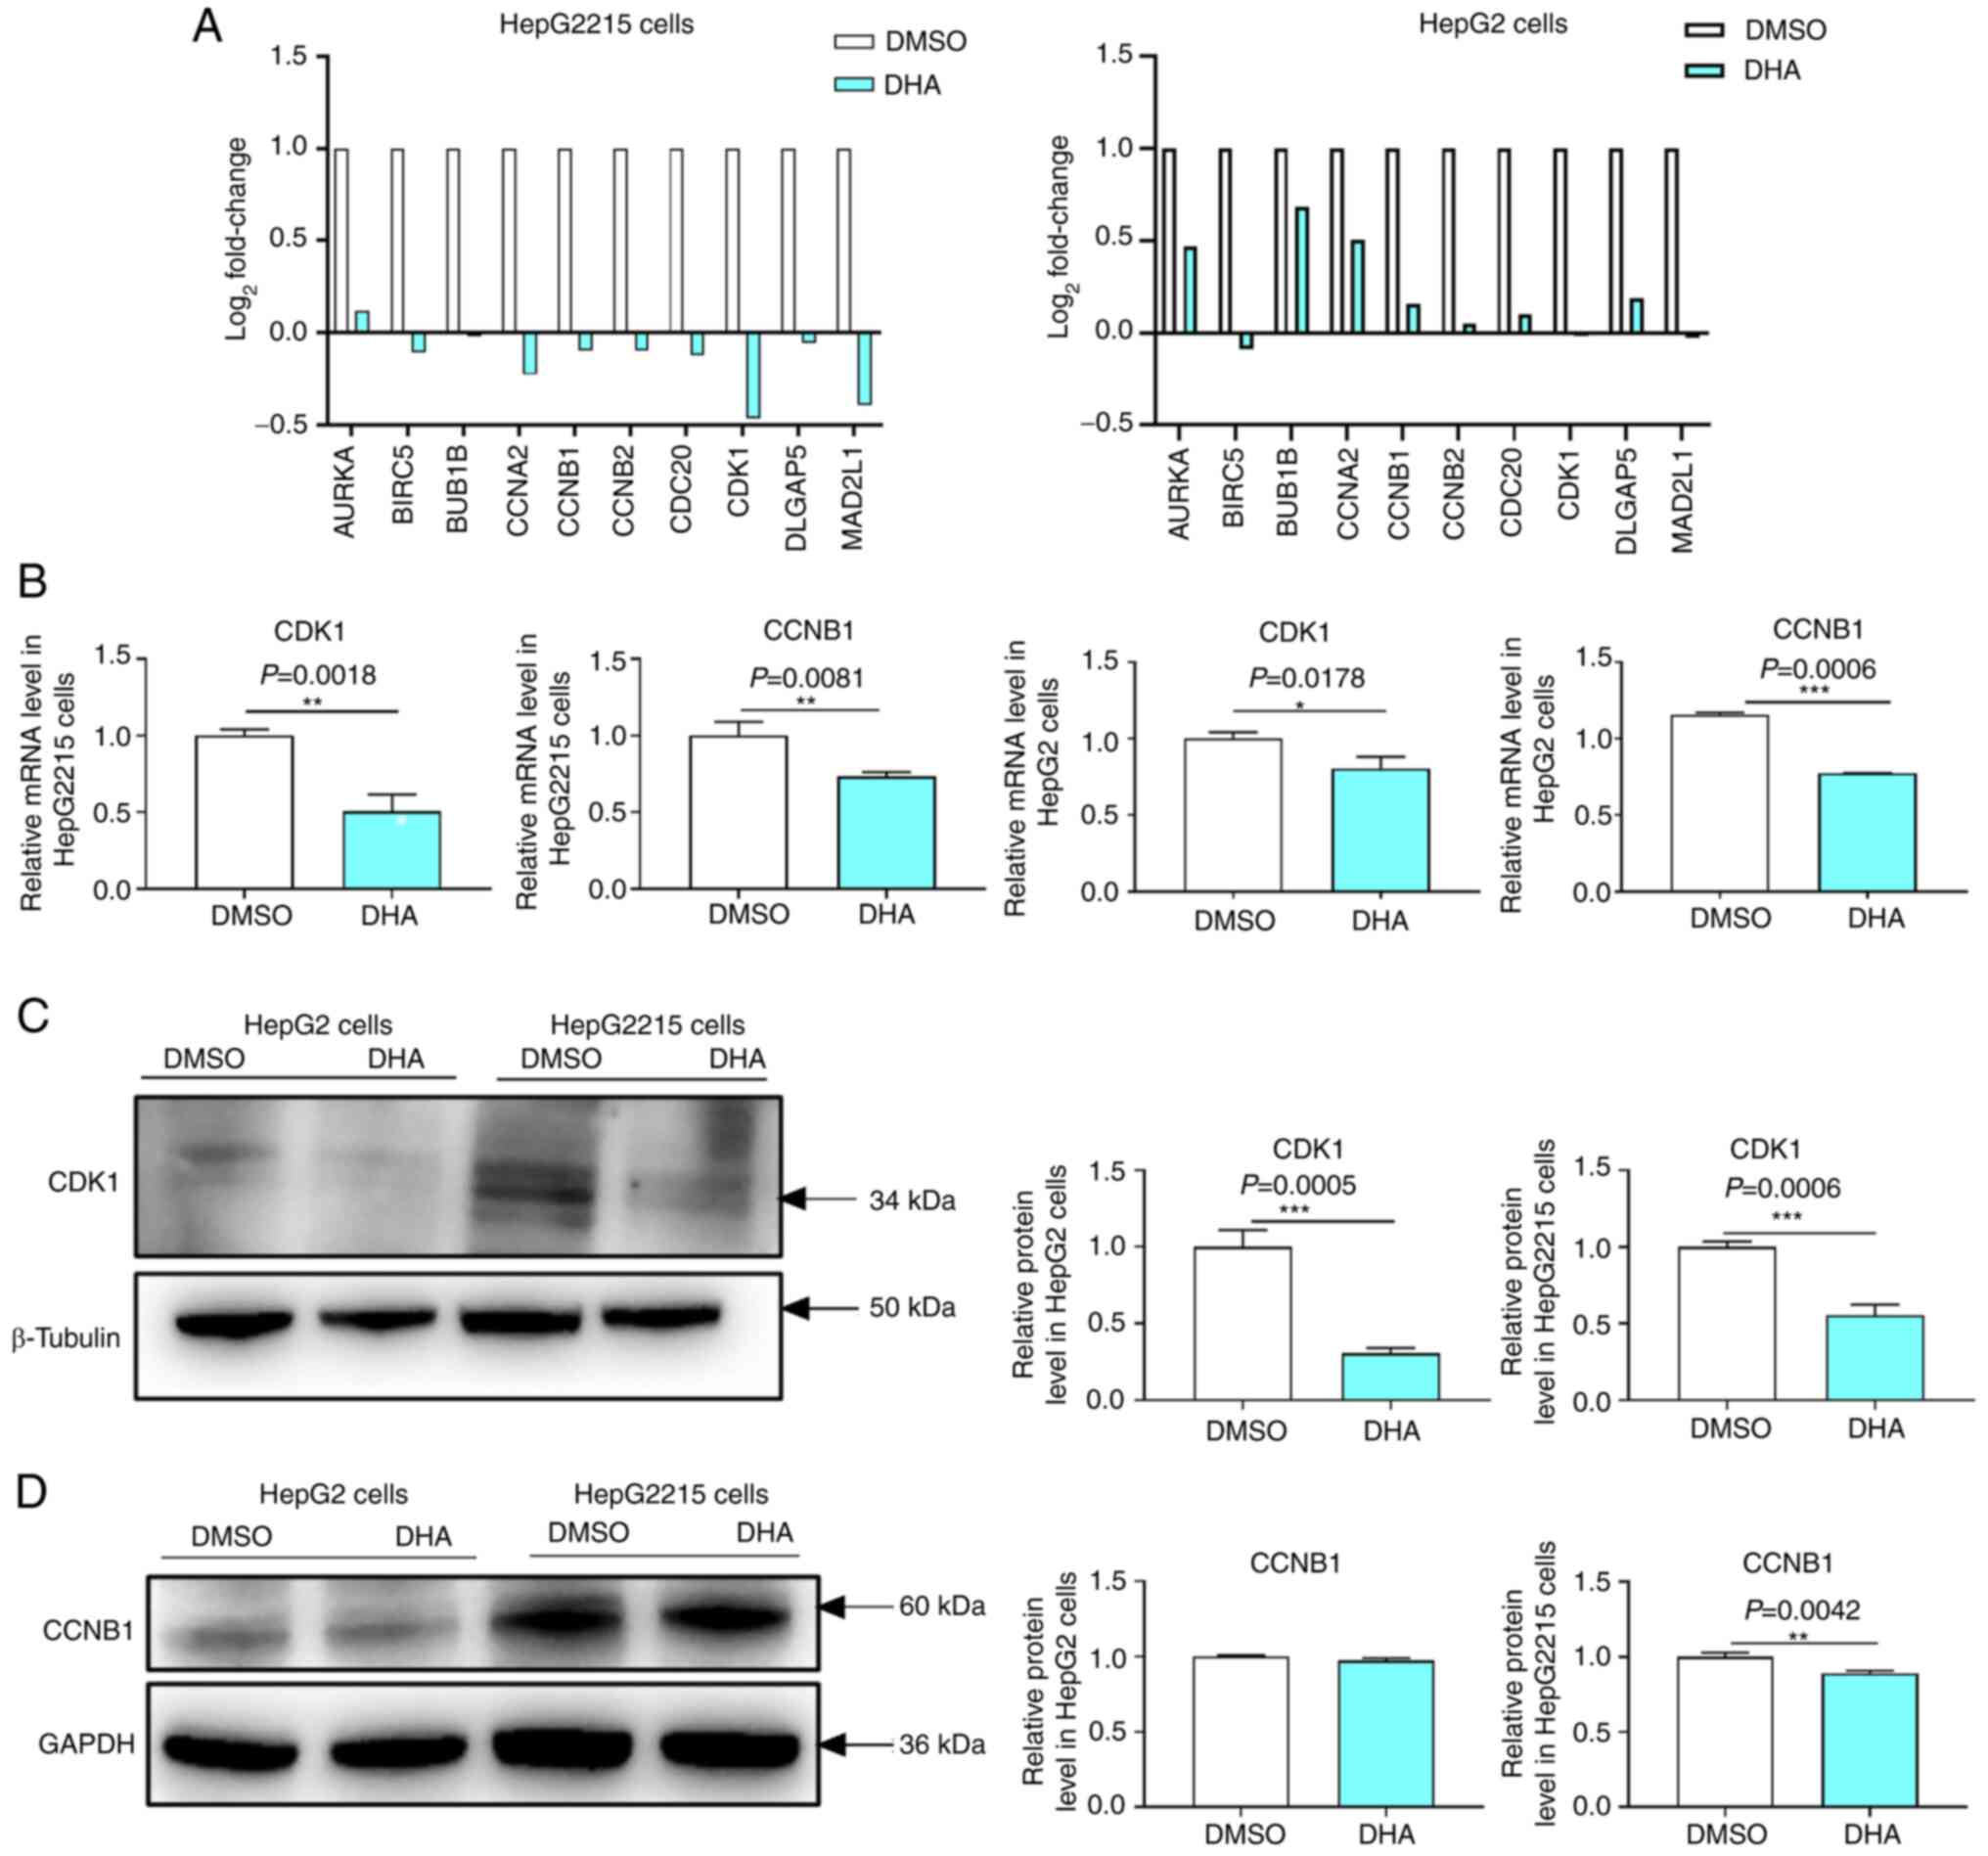
inhibited the proliferation of HepG2215 cells (12). Transcriptome analysis revealed that
DHA reduced the mRNA expression levels of the 10 hub genes
including CDK1 and CCNB1 in HepG2 and HepG2215 cells (Fig. 8A). Similarly, RT-qPCR results
demonstrated that the mRNA expression levels of CDK1 (P=0.0018) and
CCNB1 (P=0.0081) in HepG2215 cells were lower (Fig. 8B) in the DHA group compared with in
the DMSO group. DHA also reduced the mRNA expression levels of CDK1
(P=0.0178) and CCNB1 (P=0.0006) in HepG2 cells (Fig. 8B). Western blotting demonstrated that
DHA reduced the protein expression levels of CDK1 in HepG2 and
HepG2215 cells (Fig. 8C). However,
DHA did not reduce CCNB1 expression in HepG2 cells but reduced it
in HepG2215 cells (Fig. 8D). These
results suggested that DHA reduced CDK1 and CCNB1 expression, and
inhibited cell proliferation in HepG2215 cells.
Discussion
Gene-targeted therapy serves an important role in
the treatment of liver cancer, and has attracted increasing
attention. Therefore, bioinformatics experiments were performed to
identify several potential target molecules for liver cancer.
First, it was revealed through the analysis of DEGs of liver cancer
that AURKA, BIRC5, BUB1B, CCNA2, CCNB1, CCNB2, CDC20, CDK1, DLGAP5
and MAD2L1 were upregulated in liver cancer and high expression of
these genes was associated with poor prognosis. It was demonstrated
through GO and KEGG enrichment analysis that these genes were
mainly involved in cell cycle function and pathways. The CDK1,
CCNB1, AURKA, CCNA2, CDC20 and DLGAP5 genes were not expressed in
normal liver tissues, whereas low expression, and even moderate
(CDK1 and CCNB1) and high (AURKA) expression of these hub genes
emerged in liver cancer tissues in the HPA database. Secondly, it
was revealed that CDK1 and CCNB1 were the most significantly
expressed compared with other genes and were more closely related
to liver cancer. Finally, the present results suggested that DHA
reduced the expression levels of CDK1 and CCNB1 and inhibited the
proliferation of liver cancer cells.
CDK1 is a member of the Ser/Thr protein kinase
family. Previous studies have indicated that CDK1-CCNB1 regulate
cell mitosis (23,24). CCNB1 is the main activator of CDK1,
which promotes G2/M transformation together with CDK1
(9). A study has suggested that the
dysfunction of the cell cycle leads to the generation of tumor stem
cells, which is currently considered to be the cause of tumor
formation (25). CDK1 is highly
expressed in HCC (25), which
promotes the growth of cancer and has a marked influence on the
overall survival of patients (26).
Studies have demonstrated that reduced CCNB1 expression inhibits
the occurrence and development of HCC, and activated CCNB1
expression promotes the proliferation of human HCC cells (27,28). In
addition, a previous study has revealed that CDK1 and CCNB1 promote
the occurrence of rhabdomyosarcoma (29). Similarly, the present study also
identified that CDK1 and CCNB1 were upregulated using GEO, GEPIA
and Oncomine databases. High expression levels of CDK1 and CCNB1
were associated with poor overall survival. These results suggested
that CDK1 and CCNB1 were potential biomarkers of liver cancer.
Accumulated evidence has suggested that the upregulation of cyclin
B1 and CDK1 contributes to cancer occurrence and progression
(30,31). Therefore, it is important to
understand the role of CDK1 and CCNB1 for the treatment of liver
cancer. DHA is an antimalarial drug extracted from the traditional
Chinese medicine of Artemisia annua Linn (11). Studies have demonstrated that DHA
induces cell cycle arrest at different phases in various types of
cancer (32), that DHA causes the
cell cycle arrest mediated by forkhead box protein M1 (33) and induces cell cycle arrest at the
G0/G1 phase in Lewis lung carcinoma cells (34), and that DHA also induces G2/M phase
cell cycle arrest in NCI-H1975 human lung adenocarcinoma cells by
reducing the protein expression levels of cyclin B1 and CDK1
(35). Similarly, in our previous
study, it was identified that DHA inhibited the proliferation of
HepG2215 cells (12). In the present
study, it was demonstrated that DHA inhibited the proliferation of
HepG2 cells, and that DHA reduced mRNA expression levels of CDK1
and CCNB1 in HepG2215 and HepG2 cells. Furthermore, DHA also
reduced the protein expression levels of CDK1 in HepG2215 and HepG2
cells and reduced the protein expression levels of CCNB1 in
HepG2215 cells. Consistently, certain studies have also found that
DHA exerted its anticancer effect by changing the expression levels
of cell cycle-related genes, such as CCNB1 and cyclinD1, inhibiting
the growth of leukemia K562 (36)
and human osteosarcoma cells (37).
These results suggested that DHA inhibited the proliferation of
HepG2215 and HepG2 cells by reducing the expression levels of CDK1
and CCNB1. However, the present study revealed that DHA had no
significant effect on the protein expression levels of CCNB1 in
HepG2 cells. This result may be due to the fact that the
integration of hepatitis B virus (HBV) induced CCNB1 expression in
HepG2215 cells compared with HepG2 cells (38). Similarly, a study has demonstrated
that HBV X protein induces cell cycle progression (38). Sirtuin 4 (SIRT4) suppresses
CyclinB1/Cdc2 in HCC, and the expression levels of SIRT4 in
HBV-infected patients are lower than those in uninfected patients
(38).
Furthermore, expression levels of other eight hub
genes (AURKA, BIRC5, BUB1B, CCNA2, CCNB2, CDC20, DLGAP5 and
MAD2L1) were upregulated in liver cancer and high expression
of these was associated with poor prognosis of liver cancer.
Similarly, studies have demonstrated that AURKA, BIRC5, BUB1B,
CCNA2, CCNB2 and CDC20 are upregulated in liver cancer High
expression of DLGAP5 is associated with poor overall survival of
patients with lung cancer (39). A
study also demonstrated that the expression levels of MAD2L1 in
colorectal cancer tissues are higher than those in normal tissues
(40). Collectively, this suggested
that these 10 hub genes were associated with the prognosis of liver
cancer and other cancer types, and they may also serve an important
role in the development of numerous cancer types.
The present study demonstrated through
bioinformatics methods that some hub genes (AURKA, BIRC5, BUB1B,
CCNA2, CCNB1, CCNB2, CDC20, CDK1, DLGAP5 and MAD2L1) were
upregulated in HCC. CDK1 and CCNB1 were the most significantly
expressed compared with other genes. Furthermore, DHA reduced the
expression levels of CDK1 and CCNB1 in HepG2215 cells. However, the
present study may have some limitations. There were no available
clinical patients with liver cancer. The specific mechanism by
which hub genes are involved in liver cancer remains unclear.
Therefore, further clinical studies are required to verify the
reliability of the results to identify the genes most closely
associated with the pathogenesis of liver cancer and to provide a
novel treatment for liver cancer.
Supplementary Material
Supporting Data
Acknowledgements
Not applicable.
Funding
The present study was financially supported by the
National Natural Science Foundation of China (grant no. 81873112),
Talent Engineering Training Funding Project of Hebei Province
(grant no. A201902015), and The Project to Support Hundreds of
Outstanding Innovative Talents from the Universities in Hebei
Province (grant no. SLRC2019043).
Availability of data and materials
The datasets generated and/or analyzed during the
current study are available in the NCBI repository, SRA accession:
PRJNA733334 (https://www.ncbi.nlm.nih.gov/sra/).
Authors' contributions
XS and LH designed the research. LH, SL, QP, YG, ZZ,
JJ, YX and YL performed the experiments. LH and XS wrote the
manuscript with contributions from all authors. XS and LH confirmed
the authenticity of all the raw data. All authors read and approved
the final manuscript.
Ethics approval and consent to
participate
Not applicable.
Patient consent for publication
Not applicable.
Competing interests
The authors declare that they have no competing
interests.
References
|
1
|
Bray F, Ferlay J, Soerjomataram I, Siegel
RL, Torre LA and Jemal A: Global cancer statistics 2018: GLOBOCAN
estimates of incidence and mortality worldwide for 36 cancers in
185 countries. CA Cancer J Clin. 68:394–424. 2018. View Article : Google Scholar : PubMed/NCBI
|
|
2
|
Anwanwan D, Singh SK, Singh S, Saikam V
and Singh R: Challenges in liver cancer and possible treatment
approaches. Biochim Biophys Acta Rev Cancer. 1:1883142020.
View Article : Google Scholar : PubMed/NCBI
|
|
3
|
Zhu HZ, Zhou WJ, Wan YF, Ge K, Lu J and
Jia CK: Downregulation of orosomucoid 2 acts as a prognostic factor
associated with cancer-promoting pathways in liver cancer. World J
Gastroenterol. 26:804–817. 2020. View Article : Google Scholar : PubMed/NCBI
|
|
4
|
Liu CY, Chen KF and Chen PJ: Treatment of
Liver Cancer. Cold Spring Harb Perspect Med. 5:a0215352015.
View Article : Google Scholar : PubMed/NCBI
|
|
5
|
Su S and Huang XW: Advances in the study
of cellular immunotherapy for liver cancer. Zhonghua Gan Zang Bing
Za Zhi. 28:461–465. 2020.(In Chinese). PubMed/NCBI
|
|
6
|
Wang H, Lu Z and Zhao X: Tumorigenesis,
diagnosis, and therapeutic potential of exosomes in liver cancer. J
Hematol Oncol. 12:1332019. View Article : Google Scholar : PubMed/NCBI
|
|
7
|
Zhuang L, Yang Z and Meng Z: Upregulation
of BUB1B, CCNB1, CDC7, CDC20, and MCM3 in tumor tissues predicted
worse overall survival and disease-free survival in hepatocellular
carcinoma patients. Biomed Res Int. 30:78973462018.
|
|
8
|
Song X, Du R, Gui H, Zhou M, Zhong W, Mao
C and Ma J: Identification of potential hub genes related to the
progression and prognosis of hepatocellular carcinoma through
integrated bioinformatics analysis. Oncol Rep. 43:133–146.
2020.PubMed/NCBI
|
|
9
|
Huang Y, Sramkoski RM and Jacobberger JW:
The kinetics of G2 and M transitions regulated by B cyclins. PLoS
One. 8:e808612013. View Article : Google Scholar : PubMed/NCBI
|
|
10
|
Zou Y, Ruan S, Jin L, Chen Z, Han H, Zhang
Y, Jian Z, Lin Y, Shi N and Jin H: CDK1, CCNB1, and CCNB2 are
prognostic biomarkers and correlated with immune infiltration in
hepatocellular carcinoma. Med Sci Monit. 31:9252892020.
|
|
11
|
Liu Y, Gao S, Zhu J, Zheng Y, Zhang H and
Sun H: Dihydroartemisinin induces apoptosis and inhibits
proliferation, migration, and invasion in epithelial ovarian cancer
via inhibition of the hedgehog signaling pathway. Cancer Med.
7:5704–5715. 2018. View Article : Google Scholar : PubMed/NCBI
|
|
12
|
Shi X, Wang L, Ren L, Li J, Li S and Cui
Q: Dihydroartemisinin, an antimalarial drug, induces absent in
melanoma 2 inflammasome activation and autophagy in human
hepatocellular carcinoma HepG2215 cells. Phytother Res.
33:1413–1425. 2019. View
Article : Google Scholar : PubMed/NCBI
|
|
13
|
Ouyang G, Yi B, Pan G and Chen X: A robust
twelve-gene signature for prognosis prediction of hepatocellular
carcinoma. Cancer Cell Int. 20:020–01294. 2020. View Article : Google Scholar
|
|
14
|
Yue C, Ren Y, Ge H, Liang C, Xu Y, Li G
and Wu J: Comprehensive analysis of potential prognostic genes for
the construction of a competing endogenous RNA regulatory network
in hepatocellular carcinoma. Onco Targets Ther. 12:561–576. 2019.
View Article : Google Scholar : PubMed/NCBI
|
|
15
|
Wang L, Sun T, Li S, Zhang Z, Jia J and
Shan B: Protein anabolism is key to long-term survival in
high-grade serous ovarian cancer. Transl Oncol. 14:92021.
|
|
16
|
Chen B, Sun D, Qin X and Gao XH: Screening
and identification of potential biomarkers and therapeutic drugs in
melanoma via integrated bioinformatics analysis. Invest New Drugs.
Jan 26–2021.(Epub ahead of print). View Article : Google Scholar
|
|
17
|
Zhan Z, Chen Y, Duan Y, Li L, Mew K, Hu P,
Ren H and Peng M: Identification of key genes, pathways and
potential therapeutic agents for liver fibrosis using an integrated
bioinformatics analysis. PeerJ. 22:e66452019. View Article : Google Scholar
|
|
18
|
Cai X, Ye T, Liu C, Lu W, Lu M, Zhang J,
Wang M and Cao P: Luteolin induced G2 phase cell cycle arrest and
apoptosis on non-small cell lung cancer cells. Toxicol In Vitro.
25:1385–1391. 2011. View Article : Google Scholar : PubMed/NCBI
|
|
19
|
Mishra RK, Mishra V, Pandey A, Tiwari AK,
Pandey H, Sharma S, Pandey AC and Dikshit A: Exploration of
anti-Malassezia potential of Nyctanthes arbor-tristis L. and their
application to combat the infection caused by Mala s1 a novel
allergen. BMC Complement Altern Med. 16:1142016. View Article : Google Scholar : PubMed/NCBI
|
|
20
|
Lin W, Jia G, Sun H, Sun T and Hou D:
Genome sequence of the fungus Pycnoporus sanguineus, which produces
cinnabarinic acid and pH- and thermo-stable laccases. Gene.
742:132020. View Article : Google Scholar
|
|
21
|
Livak KJ and Schmittgen TD: Analysis of
relative gene expression data using real-time quantitative PCR and
the 2(-Delta Delta C(T)) method. Methods. 25:402–408. 2001.
View Article : Google Scholar : PubMed/NCBI
|
|
22
|
Fang L, Du WW, Awan FM, Dong J and Yang
BB: The circular RNA circ-Ccnb1 dissociates Ccnb1/Cdk1 complex
suppressing cell invasion and tumorigenesis. Cancer Lett.
459:216–226. 2019. View Article : Google Scholar : PubMed/NCBI
|
|
23
|
Alfonso-Pérez T, Hayward D, Holder J,
Gruneberg U and Barr FA: MAD1-dependent recruitment of CDK1-CCNB1
to kinetochores promotes spindle checkpoint signaling. J Cell Biol.
218:1108–1117. 2019. View Article : Google Scholar
|
|
24
|
Gavet O and Pines J: Progressive
activation of CyclinB1-Cdk1 coordinates entry to mitosis. Dev Cell.
18:533–543. 2010. View Article : Google Scholar : PubMed/NCBI
|
|
25
|
Wu CX, Wang XQ, Chok SH, Man K, Tsang SHY,
Chan ACY, Ma KW, Xia W and Cheung TT: Blocking CDK1/PDK1/β-Catenin
signaling by CDK1 inhibitor RO3306 increased the efficacy of
sorafenib treatment by targeting cancer stem cells in a preclinical
model of hepatocellular carcinoma. Theranostics. 8:3737–3750. 2018.
View Article : Google Scholar : PubMed/NCBI
|
|
26
|
Yang W, Cho H, Shin HY, Chung JY, Kang ES,
Lee EJ and Kim JH: Accumulation of cytoplasmic Cdk1 is associated
with cancer growth and survival rate in epithelial ovarian cancer.
Oncotarget. 7:49481–49497. 2016. View Article : Google Scholar : PubMed/NCBI
|
|
27
|
Chai N, Xie HH, Yin JP, Sa KD, Guo Y, Wang
M, Liu J, Zhang XF, Zhang X, Yin H, et al: FOXM1 promotes
proliferation in human hepatocellular carcinoma cells by
transcriptional activation of CCNB1. Biochem Biophys Res Commun.
500:924–929. 2018. View Article : Google Scholar : PubMed/NCBI
|
|
28
|
Meng Z, Wu J, Liu X, Zhou W, Ni M, Liu S,
Guo S, Jia S and Zhang J: Identification of potential hub genes
associated with the pathogenesis and prognosis of hepatocellular
carcinoma via integrated bioinformatics analysis. J Int Med Res.
48:3000605209100192020. View Article : Google Scholar : PubMed/NCBI
|
|
29
|
Li Q, Zhang L, Jiang J, Zhang Y, Wang X,
Zhang Q, Wang Y, Liu C and Li F: CDK1 and CCNB1 as potential
diagnostic markers of rhabdomyosarcoma: Validation following
bioinformatics analysis. BMC Med Genomics. 12:1982019. View Article : Google Scholar : PubMed/NCBI
|
|
30
|
Li Y, Chen YL, Xie YT, Zheng LY, Han JY,
Wang H, Tian XX and Fang WG: Association study of germline variants
in CCNB1 and CDK1 with breast cancer susceptibility, progression,
and survival among Chinese Han women. PLoS One. 8:e844892013.
View Article : Google Scholar : PubMed/NCBI
|
|
31
|
Gomathinayagam R, Sowmyalakshmi S,
Mardhatillah F, Kumar R, Akbarsha MA and Damodaran C: Anticancer
mechanism of plumbagin, a natural compound, on non-small cell lung
cancer cells. Anticancer Res. 28:785–792. 2008.PubMed/NCBI
|
|
32
|
Cheong DHJ, Tan DWS, Wong FWS and Tran T:
Anti-malarial drug, artemisinin and its derivatives for the
treatment of respiratory diseases. Pharmacol Res. 158:132020.
View Article : Google Scholar : PubMed/NCBI
|
|
33
|
Lin R, Zhang Z, Chen L, Zhou Y, Zou P,
Feng C, Wang L and Liang G: Dihydroartemisinin (DHA) induces
ferroptosis and causes cell cycle arrest in head and neck carcinoma
cells. Cancer Lett. 381:165–175. 2016. View Article : Google Scholar : PubMed/NCBI
|
|
34
|
Zhang B, Zhang Z, Wang J, Yang B, Zhao Y,
Rao Z and Gao J: Dihydroartemisinin sensitizes Lewis lung carcinoma
cells to carboplatin therapy via p38 mitogen-activated protein
kinase activation. Oncol Lett. 15:7531–7536. 2018.PubMed/NCBI
|
|
35
|
Jin H, Jiang AY, Wang H, Cao Y, Wu Y and
Jiang XF: Dihydroartemisinin and gefitinib synergistically inhibit
NSCLC cell growth and promote apoptosis via the Akt/mTOR/STAT3
pathway. Mol Med Rep. 16:3475–3481. 2017. View Article : Google Scholar : PubMed/NCBI
|
|
36
|
Yao L, Xie H, Jin QY, Hu WL and Chen LJ:
Analyzing anti-cancer action mechanisms of dihydroartemisinin using
gene chip. Zhongguo Zhong Yao Za Zhi. 33:1583–1586. 2008.(In
Chinese). PubMed/NCBI
|
|
37
|
Ji Y, Zhang YC, Pei LB, Shi LL, Yan JL and
Ma XH: Anti-tumor effects of dihydroartemisinin on human
osteosarcoma. Mol Cell Biochem. 351:99–108. 2011. View Article : Google Scholar : PubMed/NCBI
|
|
38
|
Huang FY, Wong DK, Seto WK, Mak LY, Cheung
TT and Yuen MF: Tumor suppressive role of mitochondrial sirtuin 4
in induction of G2/M cell cycle arrest and apoptosis in hepatitis B
virus-related hepatocellular carcinoma. Cell Death Discov.
7:882021. View Article : Google Scholar : PubMed/NCBI
|
|
39
|
Wang Q, Chen Y, Feng H, Zhang B and Wang
H: Prognostic and predictive value of HURP in non-small cell lung
cancer. Oncol Rep. 39:1682–1692. 2018.PubMed/NCBI
|
|
40
|
Ding X, Duan H and Luo H: Identification
of core gene expression signature and key pathways in colorectal
cancer. Front Genet. 11:452020. View Article : Google Scholar : PubMed/NCBI
|