Introduction
Iron, the most abundant trace element in the human
body, is involved in various biological processes such as oxygen
transport, mitochondrial respiration and DNA synthesis (1,2). Iron
deficiency causes numerous types of diseases. For instance,
patients with chronic kidney disease have an absolute iron
deficiency, and anemia can accelerate heart disease progression and
increase the risk of death (3,4).
However, excess iron is also toxic and produces reactive oxygen
species (ROS), leading to DNA and protein damage, lipid
peroxidation and cellular death (5–7).
Bilateral substantia nigra in patients with Parkinson's disease
exhibit increased iron levels (8).
Non-alcoholic fatty liver disease, which shows signs of elevated
serum ferritin concentration, has been confirmed to be closely
related to type 2 diabetes (2,9,10). Therefore, both iron deficiency and
iron overload are harmful to human health, and it is essential to
maintain iron homeostasis in the body.
Iron regulatory protein (IRP)1 and IRP2 are two iron
regulatory proteins that play essential roles in iron metabolism.
These proteins regulate the transcription of genes associated with
iron metabolism by binding to iron-responsive elements (IREs)
(11). IRP1 is a bifunctional enzyme
that also functions as a cytosolic aconitase (ACO1) (12). When intracellular iron levels are
high, ACO1 binds to the iron-sulfur (4Fe-4S) cluster and functions
as an aconitase; when intracellular iron levels are low, IRP1
dissociates from the iron-sulfur cluster and functions as an iron
regulatory protein (13,14). IRP1 is insensitive to cellular iron
status but sensitive to oxygen, nitrogen oxides and hydroxides.
With increasing oxygen concentrations, ACO1 is converted to IRP1,
and its RNA-binding activity is significantly increased (15–19). In
contrast, IRP2 is sensitive to iron status and can be activated on
a low-iron diet (15). When IRP1 and
IRP2 are activated, they bind to the 5′ untranslated region (UTR)
of the iron exporter protein ferroportin (FPN) and the iron storage
protein ferritin to inhibit their translation, thus reducing iron
export and storage (1,16). Moreover, IRP1 and IRP2 can bind to
the 3′UTR of the transferrin receptor (TFRC), which is involved in
iron uptake, to prevent its degradation, thereby increasing iron
import (1,16).
Ferroptosis is a non-apoptotic form of cell death
characterized by its dependence on iron ions and the accumulation
of lipid ROS (20). Erastin and RSL3
are two small-molecule ferroptosis inducers that were originally
identified by high-throughput screening (21,22).
RSL3 induces ferroptosis by directly inhibiting the antioxidant
enzyme glutathione peroxidase 4, which plays an essential role in
removing lipid ROS (23). Erastin
induces ferroptosis by inhibiting the activity of the
glutamate/cystine antiporter system Xc−,
which transports cystine into cells (20). Reduced cystine intake leads to
decreased glutathione synthesis, lipid ROS accumulation and
ferroptosis (20). The relative
intracellular levels of iron and lipid ROS are typical indicators
of ferroptosis (24). Several genes
that affect iron metabolism are involved in ferroptosis. For
example, knockdown of FPN accelerates erastin-induced ferroptosis
in neuroblastoma cells (25).
Transferrin is also important for ferroptosis, and knockdown of the
TFRC gene can significantly inhibit ferroptosis (26). In addition, ferritinophagy is also an
effective inducer of ferroptosis. In this process, ferritin heavy
chain 1 (FTH1) is degraded via autophagy, leading to increased
intracellular iron and ferroptosis (27–30).
Melanoma is the most aggressive type of skin cancer,
which arises from pigment-producing melanocytes (31,32).
Currently, the main treatment methods for melanoma are
immunotherapy and BRAF inhibitor therapy; however, numerous
patients do not benefit from these methods due to immune escape and
drug resistance (33). Multiple
studies have shown that ferroptosis plays an essential role in
melanoma cells. For example, ferroptosis inducers significantly
enhance the inhibition of B16F10 tumor growth by radiotherapy or
immunotherapy (34). Moreover,
knockdown of the glutamate/cysteine anti-transporter significantly
inhibits melanoma metastasis and improves C57BL/6-mouse survival
(35).
In the present study, the human melanoma cell lines,
A375 and G-361, were used to study the molecular mechanism of IRP1
and IRP2 in ferroptosis. A previous study demonstrated that
oncogenic RAS mutants can increase ROS levels through the
RAS-RAF-MEK-MAPK pathway (20). Both
A375 and G-361 harbor the BRAFV600E mutation and are
sensitive to ferroptosis inducers (35–38).
Iron metabolism plays an important role in ferroptosis; however,
the role of IRP1 in ferroptosis remains unclear. The present study
used melanoma A375 and G-361 cells to investigate whether IRP1 is
involved in the regulation of ferroptosis and the molecular
mechanisms involved, hoping to provide a potential target for the
treatment of melanoma.
Materials and methods
Cell culture
The melanoma cell lines A375 (cat. no. CRL-1619),
G-361 (cat. no. CRL-1424) and human embryonic kidney cells 293T
(cat. no. CRL-3216) cell lines were obtained from the American Type
Culture Collection and cultured in a cell incubator with 5%
CO2 at 37°C. Cells were cultured in DMEM containing 0.1
mg/l ferric nitrate (cat. no. 11995065, Gibco; Thermo Fisher
Scientific, Inc.) with 10% FBS (Invitrogen; Thermo Fisher
Scientific, Inc.) and 1% penicillin-streptomycin (Gibco; Thermo
Fisher Scientific, Inc.). The universal mycoplasma detection kit
(cat. no. 30-1012K; American Type Culture Collection) was used to
detect mycoplasma contamination. Mycoplasma contamination was not
found in any cell line.
Plasmids and transfection
To transient expression of IRP1, IRP2 and TFRC in
cells, the overexpression structures of pcDNA5/FRT/TO-IRP1-Flag,
pcDNA5/FRT/TO-IRP2-HA and pcDNA5/FRT/TO-TFRC-Flag were constructed.
The full-length cDNA sequence of IRP1, IRP2 or TFRC was cloned into
the AflII and NotI sites of the pcDNA5/FRT/TO vector
(AddGene, Inc.), and the Flag or HA sequence was cloned into the
XhoI site of the pcDNA5/FRT/TO vector in frame with the gene
coding region of IRP1, IRP2 or TFRC. To make cell lines stably
expressing IRP1, IRP2 and TFRC, the pCDH/puro-IRP1-Flag,
pCDH/puro-IRP2-HA and pCDH/puro-TFRC-Flag plasmids were
constructed. Using pcDNA5/FRT/TO-IRP1-Flag, pcDNA5/FRT/TO-IRP2-HA
and pcDNA5/FRT/TO-TFRC-Flag as templates, the tagged full length
cDNA sequences were cloned and inserted into the XbaI and
NotI sites of the pCDH-CMV-MCS-EF1-Puro vector (Addgene,
Inc.). All constructs were confirmed by sequencing.
All shRNA targeting sequences were designed using
the Broad Institute website (https://portals.broadinstitute.org/gpp/public). The
miRNAs were transfected into A375 or G-361 cells using
Lipofectamine® 2000 (cat. no. 11668019; Invitrogen;
Thermo Fisher Scientific, Inc.) or the calcium phosphate
transfection kit (cat. no. K278001, Thermo Fisher Scientific,
Inc.), according to the manufacturer's instructions. Following
incubation for 48 h at 37°C, the cells were collected for
subsequent analysis. The targeting sequences were as follows: i)
IRP1, 5′-CCTACAAGAAAGCGGAGTCAT-3′ and 5′-GCAGGATTGTTAGCAAAGAAA-3′;
ii) IRP2, 5′-CCACCCTTAGTGGTAGCTTAT-3; iii) FPN,
5′-TTGTTCAAGACTAGCTAATTT-3′; and iv) FTH1,
5′-CCTGTCCATGTCTTACTACTT-3′. All constructs were confirmed by
sequencing.
The transfection process of
Lipofectamine® 2000 was as follows: Cells were seeded at
a density of 70% and cultured overnight. On the second day, dilute
15 µl lipofectamine 2000 reagent with 150 µl Opti-MEM medium in a
centrifuge tube and dilute 10 µg DNA constructs with 150 µl
Opti-MEM medium in another tube, respectively. The diluted DNA was
mixed with the diluted Lipofectamine® 2000 reagent at a
ratio of 1:1 and incubated at 25°C for 5 min. The mixture was added
into the cells to be transfected. Following incubation for 48 h at
37°C, the cells were collected for subsequent analysis.
The transfection of calcium phosphate transfection
process is as follows: Cells were seeded at a density of 50% and
cultured overnight. The next day, 4 h before transfection, the
medium was replaced with a fresh medium containning 2% FBS. The DNA
(25 µg) was mixed directly with a concentrated solution (2 M) of
CaCl2, which was added dropwise to a phosphate buffer to
form a fine precipitate. Following incubation at 25°C for 20 min,
the precipitate was added to cells to be transfected. Following
incubation for 48 h at 37°C, cells were collected for subsequent
analysis.
Antibodies and reagents
The following antibodies were used: IRP1 (cat. no.
ab236773; Abcam), IRP2 (cat. no. ab232994; Abcam), TFRC (cat. no.
ab214039; Abcam), FPN (cat. no. ab239583; Abcam), ferritin heavy
chain 1 (cat. no. ab183781; Abcam), HA (cat. no. H6533;
Sigma-Aldrich; Merck KGaA), Flag (cat. no. F3165; clone M2;
Sigma-Aldrich; Merck KGaA) and β-actin (cat. no. PA11689; Thermo
Fisher Scientific, Inc.). The horseradish peroxidase (HRP)-labeled
secondary antibody conjugates (cat. no. G-21040) were purchased
from Thermo Fisher Scientific, Inc. Erastin (cat. no. E7781) and
RSL3 (cat. no. S8155) were obtained from Selleck Chemicals.
Cell viability assay
Cell viability was evaluated using Cell Counting
Kit-8 (CCK-8; cat. no. 96992; Sigma-Aldrich; Merck KGaA). This
assay uses the highly water-soluble tetrazolium salt WST-8, which
can be reduced by mitochondrial dehydrogenases in the presence of
electron-coupled agents to produce a water-soluble formazan dye
(https://www.dojindo.eu.com/TechnicalManual/Manual_CK04.pdf).
Briefly, A375 or G-361 cells (1×10³) were seeded in
96-well plates after being exposed to erastin (5 µM for A375 and 20
µM for G-361) or RSL3 (0.5 µM for A375 and 2 µM for G-361) at the
indicated concentration at 37°C for 24 h. The medium was then
replaced with fresh medium containing 5 µl CCK-8, and the cells
were returned to the incubator, and incubated for 1–4 h, according
to the manufacturer's instructions, until the color of the culture
medium turned orange. The absorbance was measured using a
fluorescence spectrophotometer at 450 nm.
Iron assay
The intracellular content of Fe2+ was
measured using the Iron Assay Kit (cat. no. ab83366; Abcam). The
cells were collected after being treated with erastin (5 µM for
A375 and 20 µM for G-361) or RSL3 (0.5 µM for A375 and 2 µM for
G-361) at the indicated concentrations at 37°C for 24 h and
homogenized with iron assay buffer on ice. The samples were then
centrifuged at 13,000 × g for 10 min at 4°C, and 300 µl supernatant
was collected. Iron reducer (300 µl) was added, mixed and incubated
at room temperature for 30 min. A volume of 200 µl iron probes was
then added and mixed thoroughly. The reaction mixture was incubated
for 30 min at room temperature away from light. The absorbance was
measured on a colorimetric microplate reader at 593 nm.
Malondialdehyde (MDA) assay
MDA concentrations were determined using the Lipid
Peroxidation Assay Kit (cat. no. ab118970; Abcam) according to the
manufacturer's instructions. The cells treated with erastin (5 µM
for A375 and 20 µM for G-361) or RSL3 (0.5 µM for A375 and 2 µM for
G-361) at the indicated concentrations at 37°C for 24 h were
collected, and lysis buffer was added. The cells were homogenized
on ice and centrifuged at 13,000 × g for 10 min at 4°C to obtain
the supernatant. A volume of 200 µl supernatant from each sample
and 600 µl thiobarbituric acid (TBA) solution was added to
microcentrifuge tubes, and the samples were then incubated at 95°C
for 40 min. Samples were then cooled to room temperature on an ice
bath for 10 min, and 200 µl from each reaction mixture was added to
each well of a 96-well plate for analysis using a microplate
reader. The absorbance of the MDA-TBA adduct was measured at 532
nm.
Detection of lipid ROS
Lipid ROS levels were analyzed by flow cytometry
using the BODIPY-C11 dye (cat. no. D3861; Thermo Fisher Scientific,
Inc.). The cells were treated with the indicated concentrations
erastin (5 µM for A375 and 20 µM for G-361) or RSL3 (0.5 µM for
A375 and 2 µM for G-361) at 37°C for 24 h. Cells were washed with
cold PBS twice and incubated in DMEM containing 5 µM BODIPY-C11 at
37°C for 20 min. The cells were then digested with 0.25% trypsin
and resuspended in PBS at with PBS to a cell density of
approximately 106/ml. The cell suspension was filtered
and immediately subjected to flow cytometry (Agilent NovoCyte
Advanteon) to analyze lipid ROS levels.
ACO1 activity assay
ACO1 activity was measured using the aconitase assay
kit (cat. no. ab83459; Abcam) according to the manufacturer's
instructions. Briefly, 10 µl isocitrate was added to a 490 µl
analytical buffer to prepare a 2 mM isocitrate standard and
gradiently diluted to make a standard curve samples. The cells were
collected and washed with cold PBS twice, then resuspended in assay
buffer for homogenization. Cells were centrifuged at 800 × g for 10
min at 4°C, and 100 µl supernatant was then collected into a new
tube. Subsequently, 10 µl activation solution was added to the 100
µl sample, and incubated on ice for 1 h to activate ACO1. The
activated samples (50 µl/well) and the standard sample (50 µl/well)
were added into the 96 well plates. Add 50 µl reaction mixture
(provided in the kit) to each well, and the mixture was incubated
at 25°C for 60 min. Following incubation, 10 µl developer solution
was added and the mixture was incubated at 25°C for 10 min. The
absorbance was measured at a wavelength of 450 nm, using a
microplate reader (Epoch™; Bio Tek).
RNA Immunoprecipitation (RIP)
analysis
The IRE-binding activity of IRP1 in melanoma cells
was analyzed by RIP (39). Briefly,
cells expressing Flag-tagged IRP1 or HA-tagged IRP2 were lysed in
100 µl lysis buffer (25 mM Tris at pH 7.5, 300 mM NaCl, 1 mM EDTA
and 1% NP40) with protease inhibitor and RNase. Then the whole-cell
lysates were centrifuged at 20,000 × g for 10 min at 4°C and
incubated with 50 µl protein G magnetic beads (Bio-Rad
Laboratories, Inc.) conjugated with anti-Flag antibody (cat. no.
F3165; clone M2; Sigma-Aldrich; Merck KGaA) or anti-HA antibody
(cat. no. H6533; Sigma-Aldrich; Merck KGaA) for 4 h at 4°C. The
immunoprecipitates were washed with RIP Wash buffer, and the RNA
was extracted from the immunoprecipitation complex using 50 µg/ml
Proteinase K (cat. no. P2308; Sigma-Aldrich; Merck KGaA) at 55°C
for 30 min. qPCR was performed using the iQ SYBR-Green Master Mix
(Bio-Rad Laboratories, Inc.) on a CFX96 Touch Quantitative PCR
Detection System (Bio-Rad Laboratories, Inc.). The following primer
sequences were used for qPCR: FTH1 forward,
5′-ACTGATGAAGCTGCAGAACC-3′ and reverse, 5′-GTCACCCAATTCTTTGATGG-3′;
and β-actin forward, 5′-GCTCGTCGTCGACAACGGCT-3′ and reverse,
5′-CAAACATGATCTGGCTCATCTTCTC-3′. The following thermocycling
conditions were used for qPCR: Pre-denaturation at 94°C for 30 sec,
followed by 40 cycles of deformation at 94°C for 5 sec, annealing
at 50–60°C for 10 sec, and extension at 72°C for 20 sec. Relative
FTH1 expression was normalized to β-actin according to the
2−∆∆Cq method (40).
Reverse transcription-quantitative PCR
analysis
Total RNA was extracted using the RNeasy Mini kit
from cells (cat. no. 74104; Qiagen GmbH). cDNA was synthesized
using the iScript™ cDNA Synthesis kit (Bio-rad Laboratories, Inc.).
The temperature and duration of RT were as follows: The RNA was
denatured at 65°C for 5 min, then incubated at 42°C for 15 min and
finally heated at 85°C for 5 sec. qPCR was carried out using the iQ
SYBR-Green Master Mix (Bio-rad Laboratories, Inc.) on a CFX96 Touch
Quantitative PCR Detection System (Bio-Rad Laboratoreis, Inc.). The
following thermocycling conditions were used for qPCR:
Pre-denaturation at 94°C for 30 sec, followed by 45 cycles of
deformation at 94°C for 5 sec, annealing at 50–60°C for 10 sec, and
extension at 72°C for 20 sec. The quantification was determined
using the 2−ΔΔCq method (40). The gene expression levels were all
normalized to β-actin. The following primer sequences were used:
IRP1 forward, 5′-GTGAGTGAGAAGCAGAGTAT-3′ and reverse,
5′-TGGTGGCAGTGGTAGTTA-3′; IRP2 forward, 5′-TCCATTACCAGTCATCCATC-3′
and reverse, 5′-TATCTTCCTTACCTCGTCTATC-3′; TFRC forward,
5′-GGTTATGTGGCGTATAGTAAG-3′ and reverse,
5′-CTGAGTGTGATTGAAGGAAG-3′; FPN forward, 5′-ATCACAACCGCCAGAGA-3′
and reverse, 5′-GCAACAACAACAATCCAATC-3′; FTH1 forward,
5′-GCTTGGCGGAATATCTCTT-3′ and reverse, 5′-AACTGAACAACGGCACTTA-3′;
and β-actin forward, 5′-GCTCGTCGTCGACAACGGCT-3′ and reverse,
5′-CAAACATGATCTGGCTCATCTTCTC-3′.
Immunoblotting
For immunoblotting, cells were washed with cold PBS
twice, then lysed in lysis buffer (20 mM Tris at pH 7.5; 150 mM
NaCl; 1 mM EDTA; 2% Triton X-100) supplemented with a phosphatase
inhibitor mix (Pierce™; Thermo Fisher Scientific, Inc.) and a
complete protease inhibitor cocktail (Roche Diagnostics). The
samples were heated with SDS-PAGE loading buffer at 95°C for 5 min.
Protein concentration was determined using the Bio-Rad protein
assay. The proteins were loaded equally (10 µl) onto 8%
polyacrylamide gels, separated, then transferred to a PVDF membrane
(Bio-Rad Laboratories, Inc.). The PVDF membrane was then blocked
with 5% non-fat milk at room temperature for 30 min, then incubated
with the antibodies against IRP1 (1:1,000; cat. no. ab236773;
Abcam), IRP2 (1:1,000; cat. no. ab232994; Abcam), TFRC (1:1,000;
cat. no. ab214039; Abcam), FPN (1:1,000; cat. no. ab239583; Abcam),
FTH1 (1:1,000; cat. no. ab183781; Abcam), HA (1:1,000; cat. no.
H6533; Sigma-Aldrich; Merck KgaA), Flag (1:1,000; cat. no. F3165;
Sigma-Aldrich; Merck KgaA) and β-actin (1:1,000; cat. no. PA11689;
Thermo Fisher Scientific, Inc.) at 4°C for 24 h. The membranes were
washed twice with PBST (PBS+1% Tween 20) and subsequently incubated
with HRP-conjugated goat secondary antibodies (1:5,000; cat. no.
G-21040; Thermo Fisher Scientific, Inc.) at room temperature for 1
h. The bands were visualized using the Pierce™ ECL Western Blotting
Substrate (Thermo Fisher Scientific, Inc.) and densitometry
analysis was performed using ImageJ software (Image-Pro Plus 6.0;
National Institutes of Health).
Lentivirus production and
transduction
293T cells (the third generation) were transfected
with the aforementioned plasmid constructs, pCMV–VSV-G (Addgene,
Inc.) and pCMV-dR8.91 (Addgene, Inc.) at a ratio of 5:4:1 using the
calcium phosphate transfection kit (cat. no. K278001, Thermo Fisher
Scientific, Inc.). Viral particles were collected 48 h after
transfection, filtered with a 0.45-µm sterile filter, then
concentrated by ultracentrifugation at 4°C (30,000 × g for 2 h) in
a Beckman-Coulter ultracentrifuge XL-100K. The viral particles were
resuspended with fresh medium, then A375 or G-361 cells were
infected with viral particles (multiplicity of infection=50), the
cultures were centrifuged at 25°C (300 × g for 1 h) to facilitate
the entry of viruses into cells, then incubated cells at 37°C for
24 h. Replenished the cultures with fresh medium and maintained for
another 48 h. Finally, selected the lentivirus-transduced cells
with fresh medium containing 1 µg/ml puromycin for 7 days.
Statistical analysis
Data are presented as the mean ± SD. Statistical
analysis was performed using GraphPad Prism 8.0 (GraphPad Software,
Inc.). For multigroup comparisons, one-way ANOVA followed by
Dunnett's post hoc test was used. All experiments were
independently repeated three times. P<0.05 was considered to
indicate a statistically significant difference.
Results
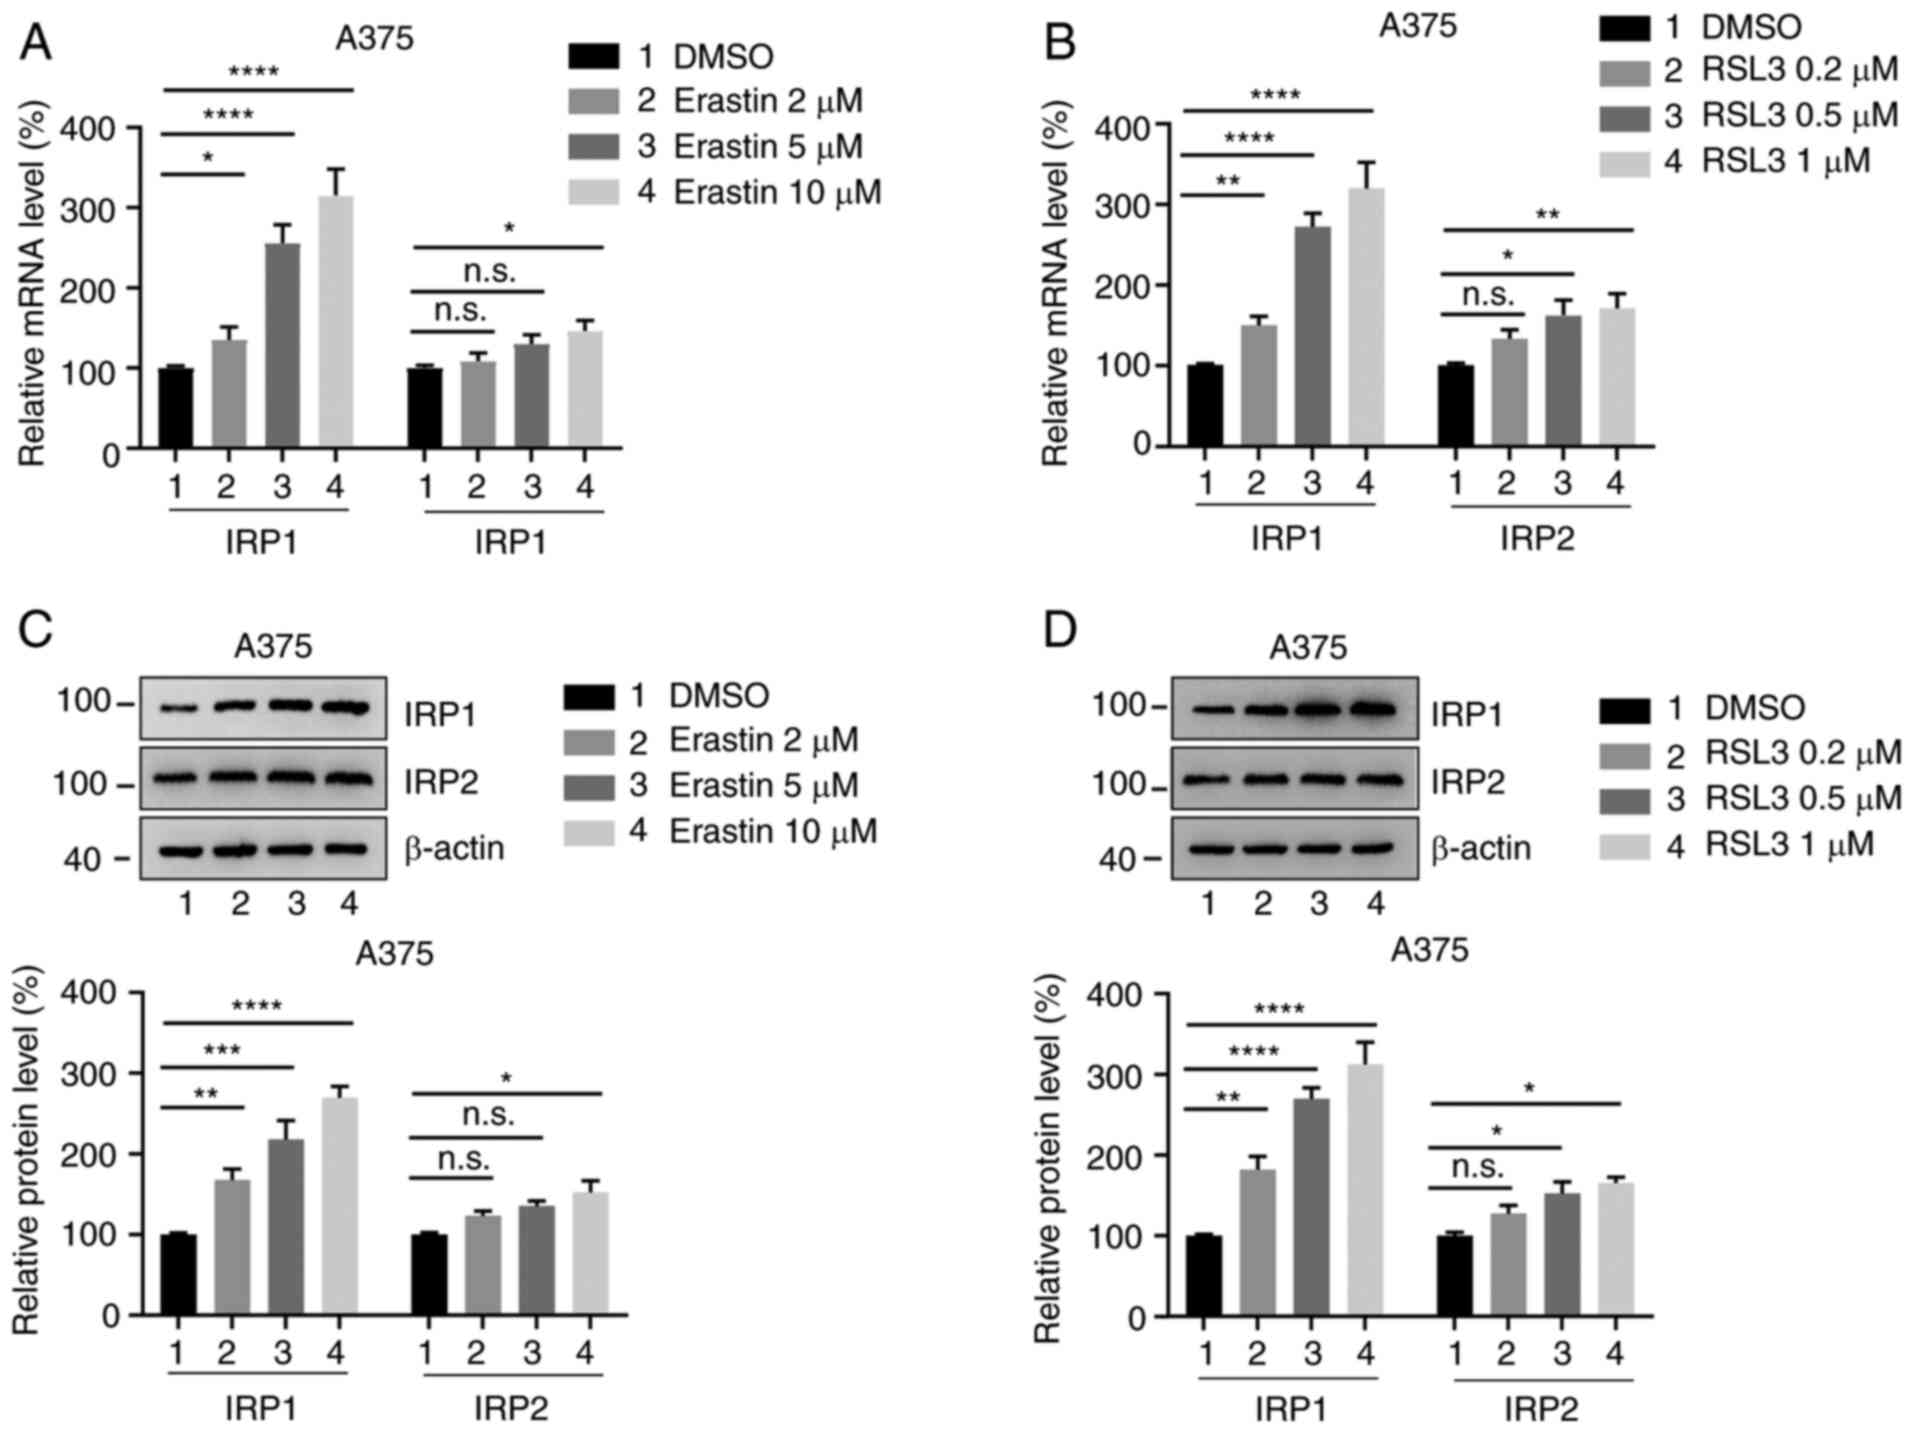
Expression of IRP1 and IRP2 is
increased in melanoma cells treated with erastin and RSL3
To investigate whether the expression of IRP1 and
IRP2 is altered in ferroptosis, the human melanoma cell lines A375
and G-361 were treated with different concentrations of erastin and
RSL3 for 24 h, and the mRNA levels of IRP1 and IRP2 were analyzed
using RT-qPCR. Erastin and RSL3 significantly promoted the mRNA
levels of IRP1 in a dose-dependent manner (Fig. 1A and B; Fig. S1A and B). However, IRP2 expression
only slightly increased compared with the DMSO-treated group. The
protein levels of IRP1 and IRP2 were also by western blotting. It
was observed that the protein levels of IRP1 were significantly
increased following erastin and RSL3 treatment in a dose-dependent
manner, whereas IRP2 protein levels only increased slightly
compared with the DMSO-treated group (Fig. 1C and D; Fig. S1C and D). These findings indicate
that erastin and RSL3 promote the expression of IRP1 and IRP2 in
melanoma cells.
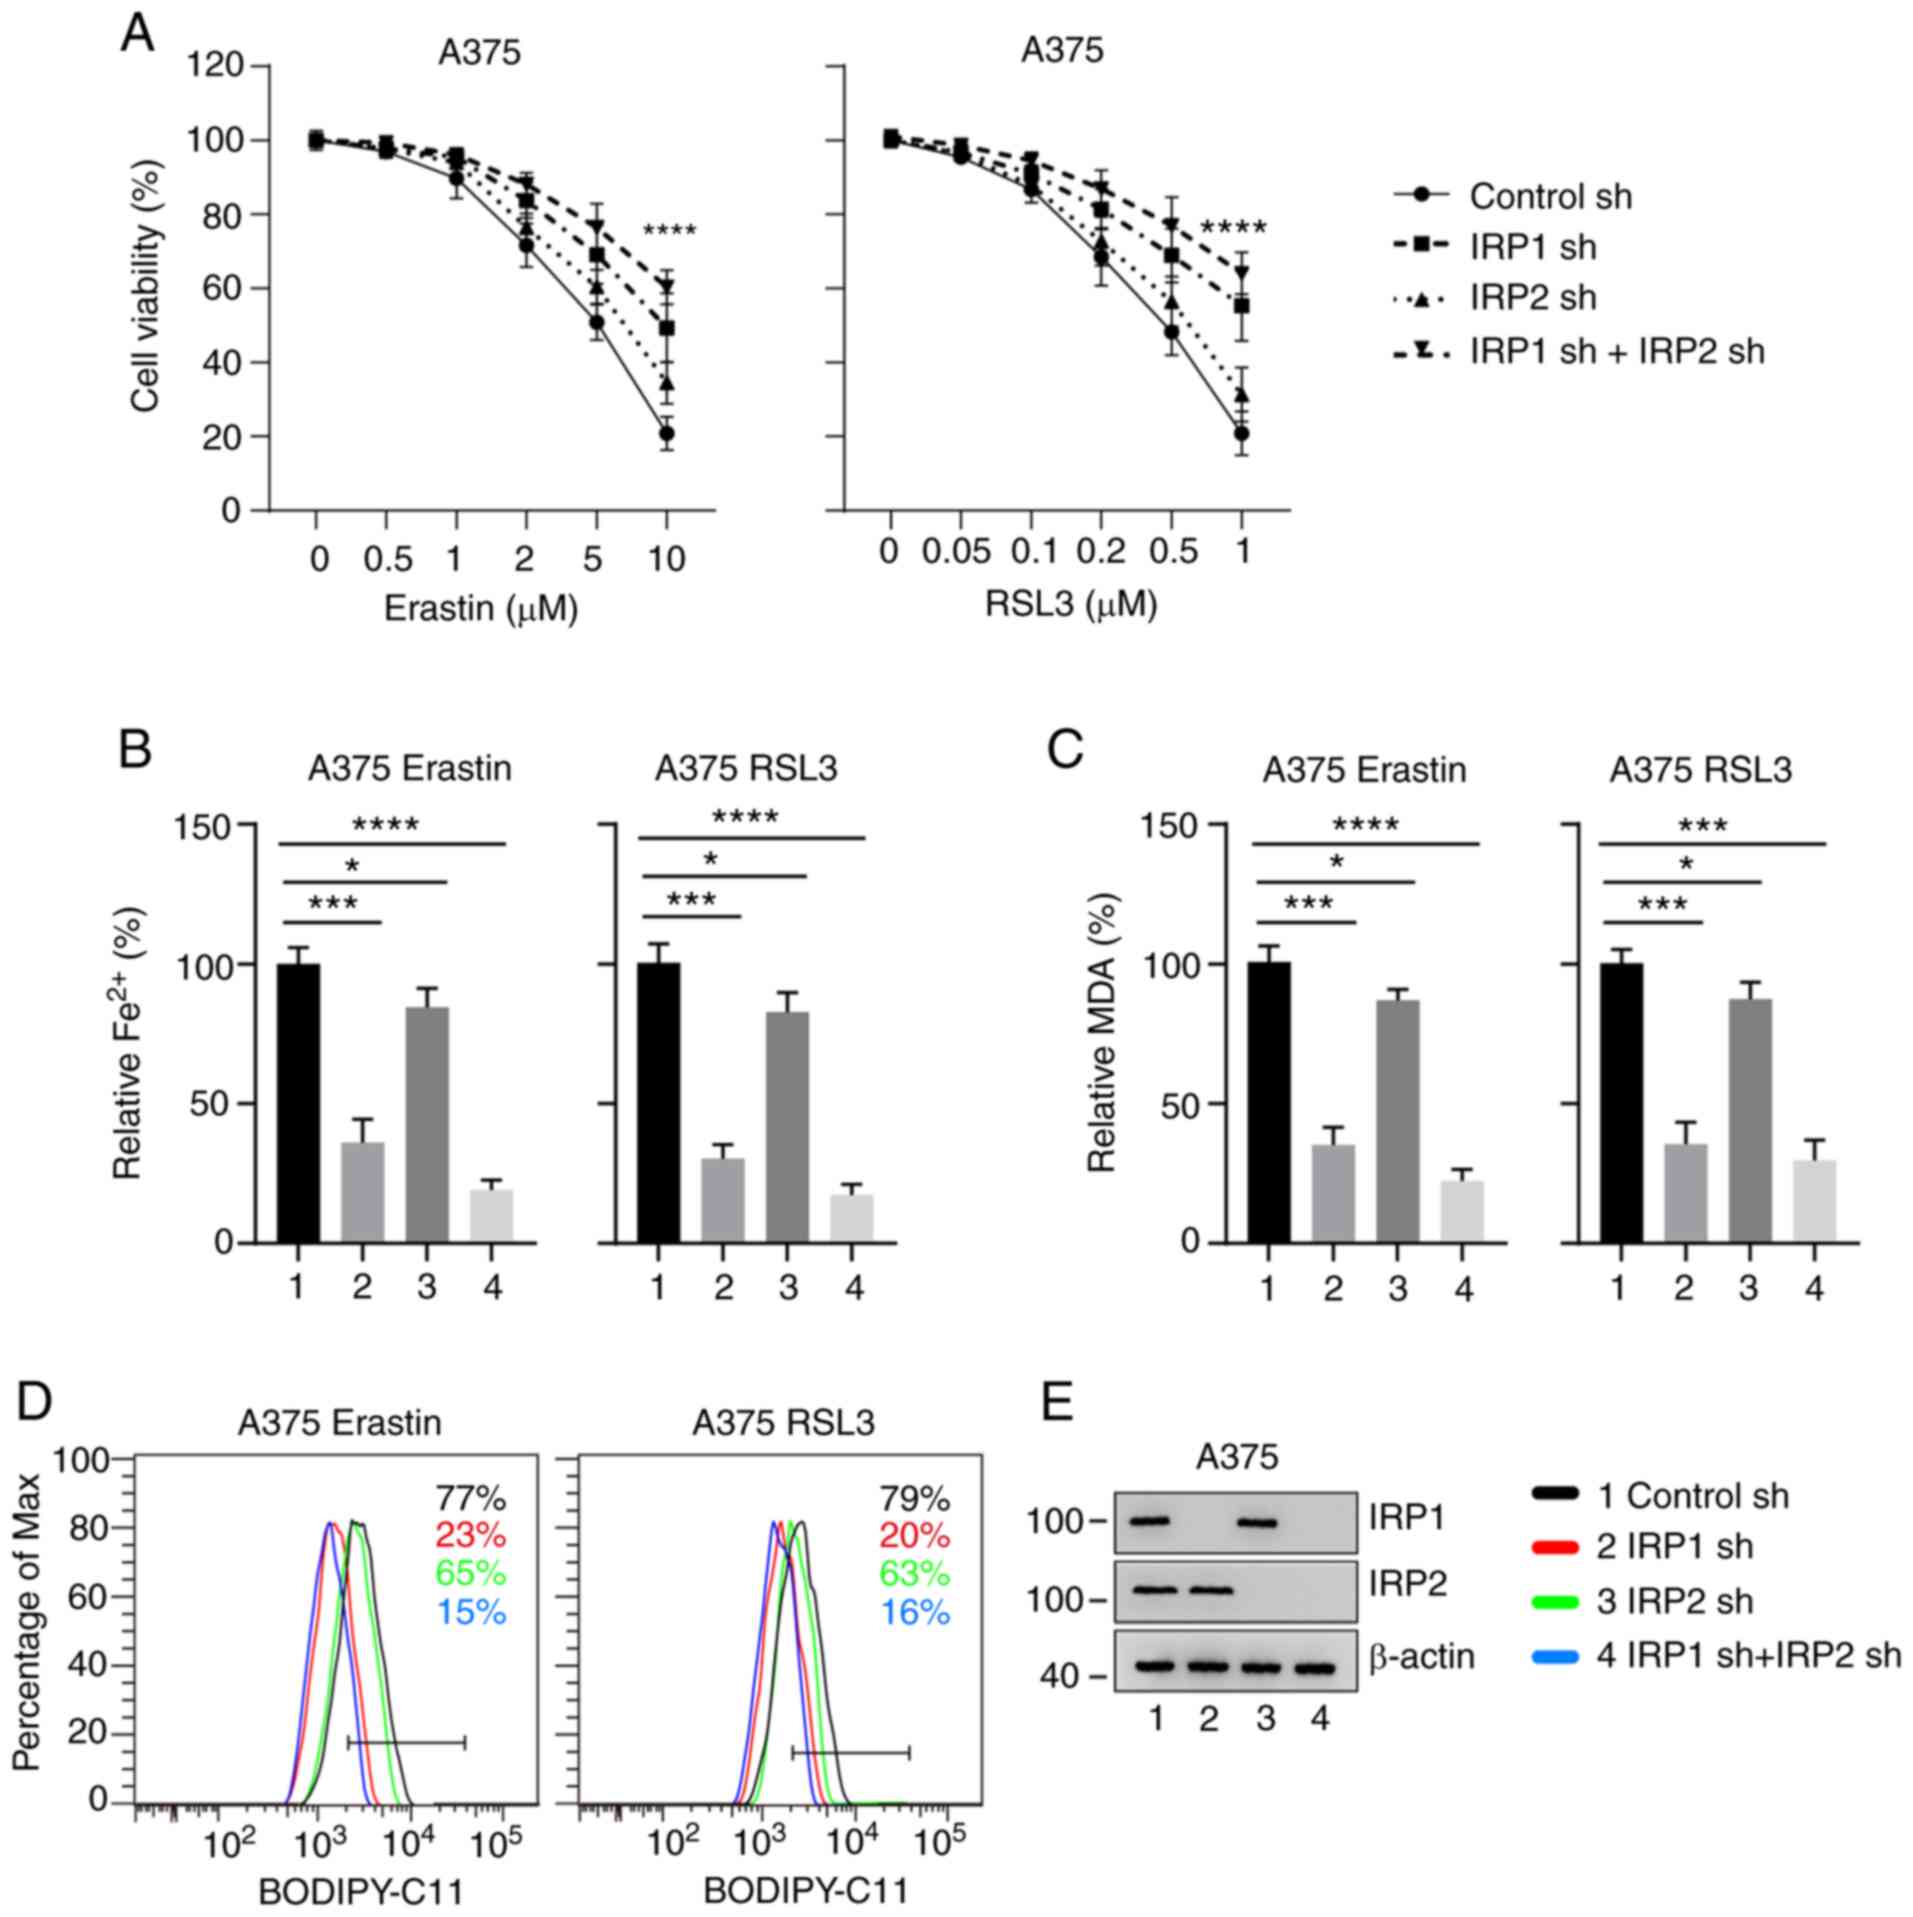
Knockdown of IRP1 significantly
inhibits erastin- and RSL3-induced ferroptosis
To determine whether IRP1 and IRP2 regulate erastin-
and RSL3-induced ferroptosis, IRP1, IRP2, and IRP1/2 knockdown A375
and G-361 cells using shRNA constructs. These cell lines were then
treated with different concentrations of erastin and RSL3 for 24 h.
It was identified that knockdown of IRP1 significantly inhibited
erastin- and RSL3-induced ferroptotic cell death (Figs. 2A and S2A). Knockdown of IRP2 had a slight
effect, and simultaneous knockdown of IRP1 and IRP2 demonstrated a
more substantial effect on erastin- and RSL3-induced ferroptotic
cell death (Figs. 2A and S2A). The intracellular concentrations of
iron, MDA and lipid ROS are the main indicators of ferroptosis
(24). The effect of IRP1 and IRP2
on the accumulation of Fe2+ was then evaluated.
Knockdown of IRP1 significantly suppressed the accumulation of
Fe2+ compared with the control group (Figs. 2B and S2B). Lipid peroxidation is an essential
process in ferroptosis. MDA, as the end product of lipid
peroxidation, is used to quantify ferroptosis (24). The levels of MDA in IRP1 knockdown
cells was significantly decreased compared with the control group.
Lipid ROS accumulation also reduced in IRP1 knockdown cells
compared with the control group (Figs.
2D and S2D). However, the
accumulation of Fe2+, MDA and lipid ROS in the IRP2
knockdown cells was only slightly reduced compared with the control
group (Figs. 2 and S2). The expression levels of IRP1 and IRP2
in the corresponding knockdown cell lines were significantly
decreased compared with the control group (Figs. 2E and S2E).
Interestingly, simultaneous knockdown of IRP1 and
IRP2 had a more substantial effect on the accumulation of
Fe2+, MDA and lipid ROS, suggesting that IRP1 and IRP2
have synergistic effects in ferroptosis (Figs. 2 and S2). These results indicate that knockdown
of IRP1 significantly inhibits erastin- and RSL3-induced
ferroptosis, which can be further promoted by IRP2 silencing.
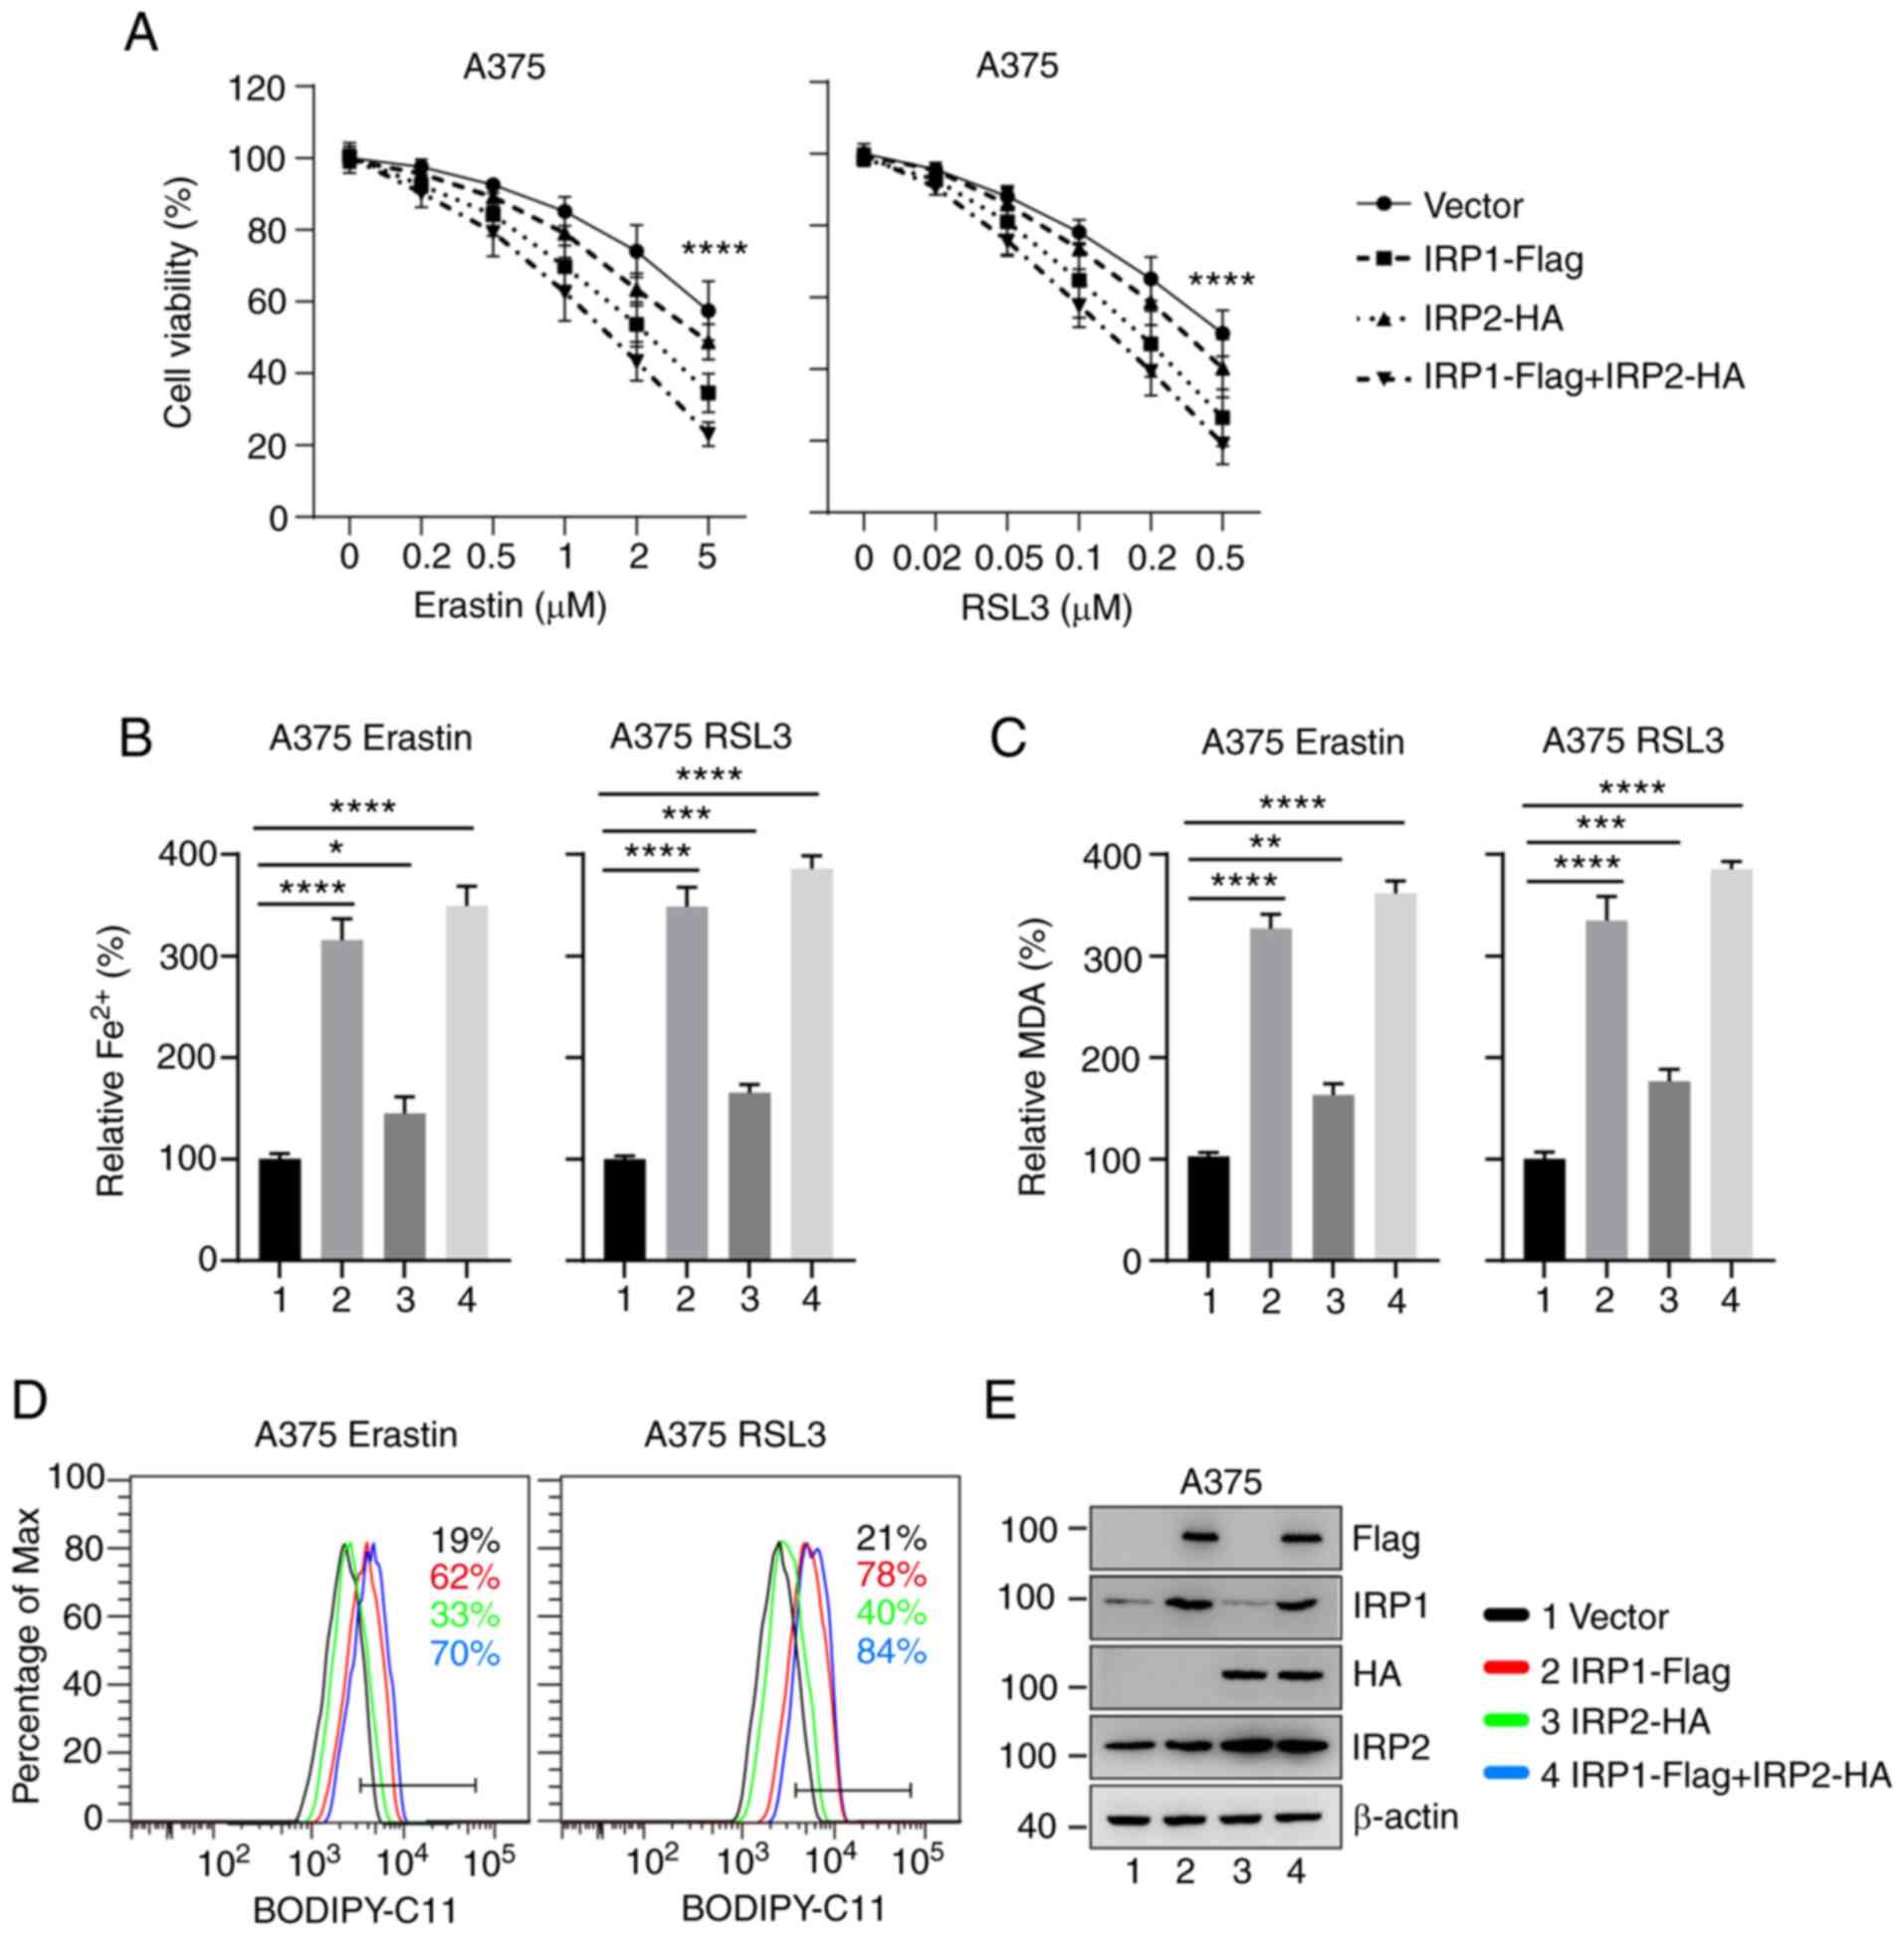
Overexpression of IRP1 significantly
promotes erastin- and RSL3-induced ferroptosis
To further confirm the role of IRP1 and IRP2 in
ferroptosis, IRP1-, IRP2- and IRP1/IRP2-overexpressing A375 and
G-361 cell lines were established. Cell viability was measured
following treatment with different concentrations of erastin and
RSL3 for 24 h. Overexpression of IRP1 significantly reduced cell
viability following erastin and RSL3 treatment, while
overexpression of IRP2 had a weak effect (Figs. 3A and S3A). The accumulation of iron, MDA, and
lipid ROS. Consistent with the aforementioned results, the
intracellular levels of Fe2+, MDA and lipid ROS in
IRP1-overexpressing cells were significantly increased compared
with the control group (Figs. 3B-D
and S3B-D). Overexpression of IRP2
had a slight effect on the accumulation of iron, MDA and lipid ROS
(Figs. 3B-D and S3B-D). The expression levels of IRP1 and
IRP2 in the corresponding overexpression cell lines were
significantly increased compared with the control group (Figs. 3E and S3E). These findings support the essential
role of IRP1 in ferroptosis induced by erastin and RSL3 and suggest
that IRP2 is also involved in this process.
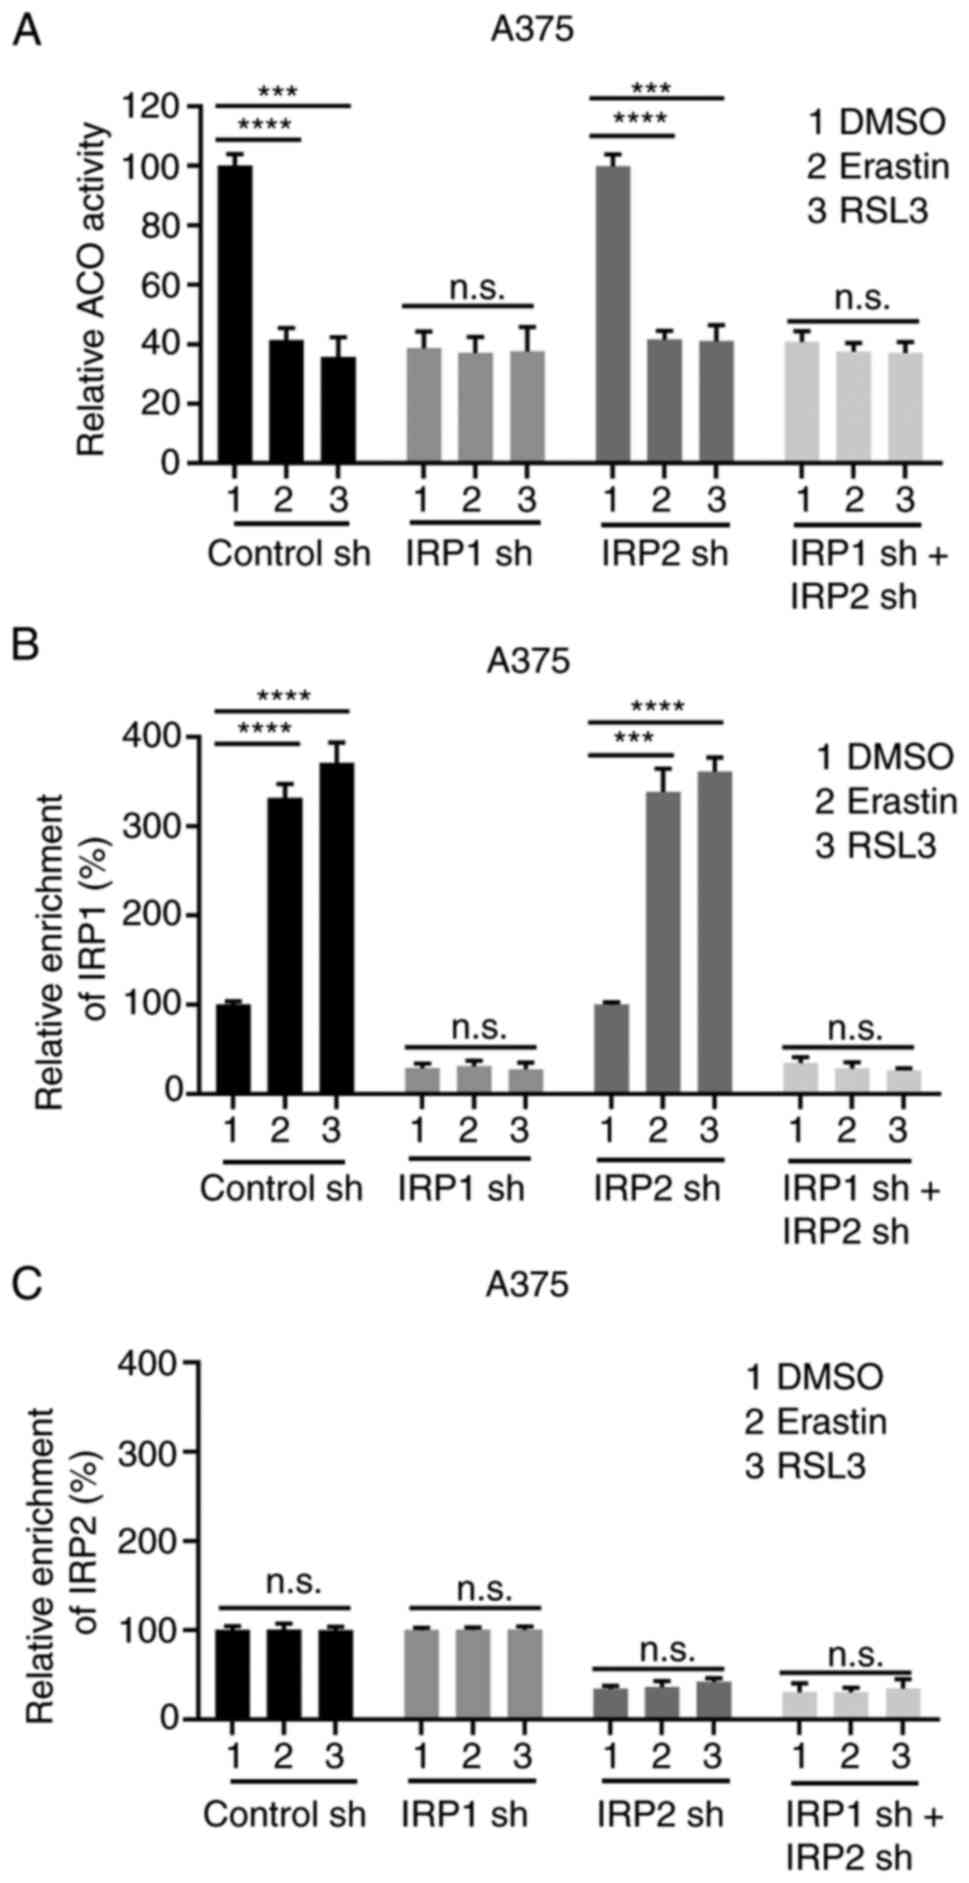
Erastin and RSL3 promote the
conversion of ACO1 to IRP1
IRP1 is a bifunctional protein that either regulates
the conversion of citrate and iso-citrate as ACO1 or regulates iron
homeostasis as IRP1 (41). To verify
which function mediates erastin- and RSL3-induced ferroptosis, the
activity of ACO1 and the IRE binding of IRP1 were detected in
transfected cells treated with erastin and RSL3. Comparing the
changes in these two activities could reveal the transition between
ACO1 and IRP1 in response to erastin and RSL3.
As shown in Fig. 4A and
B, as well as S4A and B, there was a significant decrease in
ACO1 activity and a substantial increase of IRE-binding activity
upon erastin and RSL3 treatment in the control cells, and IRP2
cells, rather than IRP1 knockdown cells, or IRP1/IRP2
simultaneously knockdown cells, suggesting that erastin and RSL3
facilitated the transition of ACO1 to IRP1 and the transition
depends on IRP1. Knockdown of IRP1 strongly suppressed the activity
of ACO1 and IRP1, and the transition of ACO1 to IRP1 induced by
erastin or RSL3 was also significantly inhibited (Fig. 4A and B; Fig. S4A and B). Consistent with the
aforementioned results, the transition of ACO1 to IRP1 was also
eliminated in IRP1 and IRP2 knockdown cells, as evidenced by the
lack of change in the activity of ACO1 and IRE binding (Fig. 4A and B; Fig. S4A and B). However, the changes in
ACO1 activity and IRE binding in IRP2 knockdown cells were similar
to the control cells, suggesting that IRP2 has no significant
impact on the transition of ACO1 to IRP1 under basal conditions or
in response to erastin and RSL3 (Fig. 4A
and B; Fig. S4A and B). Unlike
IRP1, the IRE binding of IRP2 was not affected by erastin or RSL3
(Figs. 4C and S4C). These data suggest that erastin and
RSL3 can significantly facilitate the transition of ACO1 to IRP1
and that the IRE binding activity of IRP1 is significantly
increased during ferroptosis.
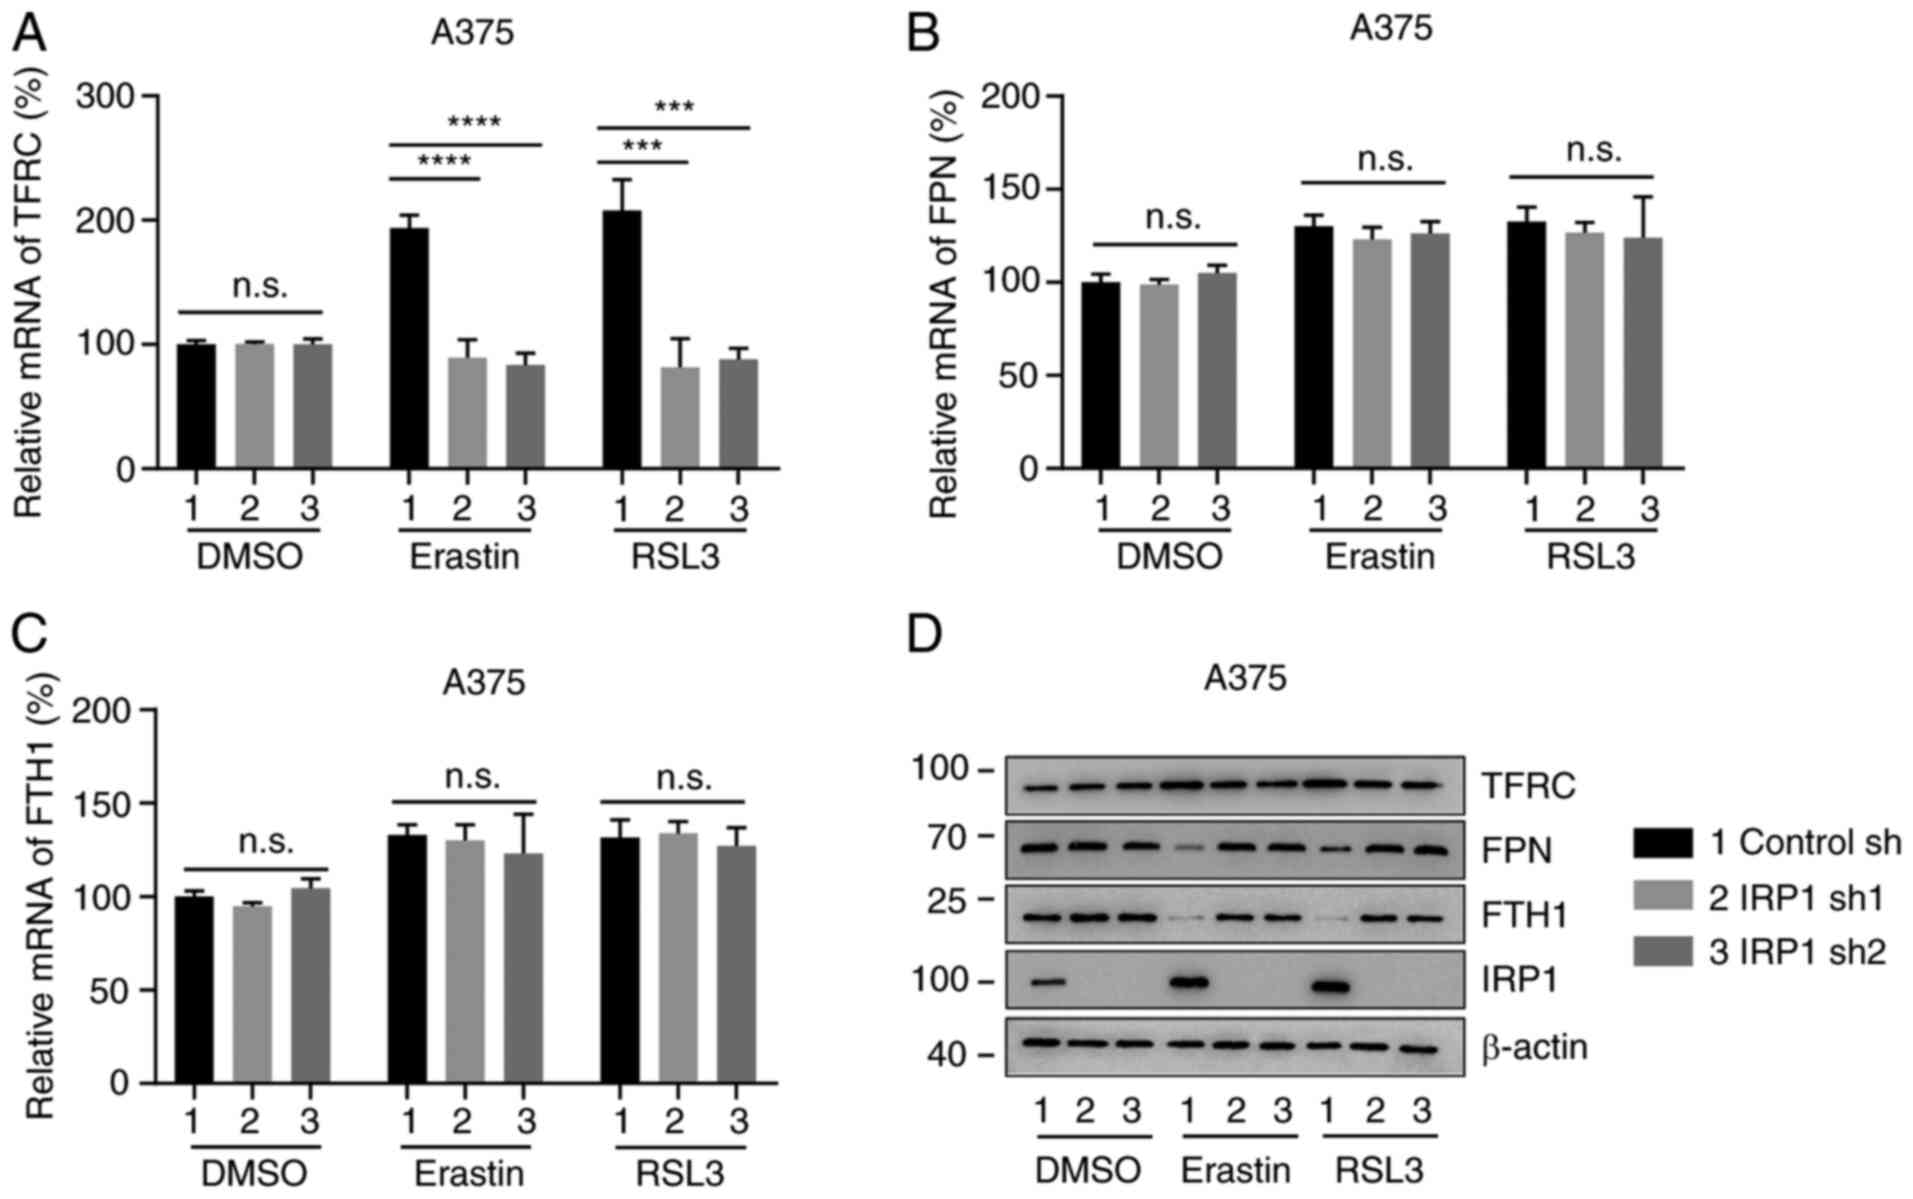
IRP1 regulates the expression of iron
metabolism proteins during ferroptosis
IRP1 regulates iron homeostasis by
post-transcriptionally modifying proteins involved in iron
metabolism, such as TFRC, FPN and ferritin (1,42–44). To
further explore the molecular mechanism underlying IRP1 in erastin-
and RSL3-induced ferroptosis, the expression levels of TFRC, FPN
and FTH1 were analyzed in control sh cells and IRP1 knockdown
cells. As shown in Figs. 5A and
S5A, erastin and RSL3 increased the
mRNA levels of TFRC in control sh cells cells. Knockdown of IRP1
had no significant effect on the mRNA expression of TFRC in
DMSO-treated cells, but significantly inhibited TFRC mRNA level in
erastin and RSL3 treated cells compared with DMSO-treated cells
(Figs. 5A and S5A). The protein levels of TFRC was
upregulated in erastin and RSL3 treated control sh cells compared
with DMS-treated cells, but not in IRP1-deficient cells (Figs. 5D and S5D). Therefore, the upregulation of TFRC
in erastin- and RSL3-induced ferroptosis requires IRP1. The
expression levels of FPN and FTH1, which are silenced by IRPs at
the post-translational level (11),
were then detected. Although the mRNA levels of FPN and FTH1 had no
significant increase upon erastin or RSL3 treatment compared with
the DMSO treated group, (Fig. 5B, C,
S5B, and SC), erastin and RSL3
decreased the protein levels of FPN and FTH1 in control sh cells
but not in IRP1 knockdown cells (Figs.
5D and S5D). Therefore, IRP1
can regulate the protein expression of TFRC, FPN and FTH1 during
ferroptosis.
The function of IRP1 in ferroptosis is
dependent on iron metabolism proteins
Given that IRP1 regulates the protein expression of
TFRC, FPN and FTH1 (11), it was
hypothesized that the function of IRP1 in erastin- and RSL3-induced
ferroptosis may be dependent on these iron metabolism proteins. To
test this hypothesis, TFRC was overexpressed in IRP1 knockdown
cells. The overexpression of TFRC strongly reduced cell viability
in IRP1 knockdown cells, compared with IRP1 alone (Figs. 6A and S6A). It was also hypothesized that
overexpression of TFRC could affect iron accumulation and lipid ROS
production in IRP1 knockdown cells. As shown in Figs. 6B-D and S6B-D, overexpression of TFRC significantly
enhanced iron accumulation, MDA and lipid ROS production in IRP1
knockdown cells, compared with IRP1 alone. TFRC expression
significantly increased in TFRC overexpression cell lines (Figs. 6E, S6E and SF). Similarly, knockdown of FPN and FTH1
significantly reduced cell viability in IRP1 knockdown cells,
compared with IRP1 alone (Figs. 6
and S6). As expected, the
simultaneous overexpression of TFRC and knockdown of FPN and FTH1
could almost eliminate the inhibitory effect of IRP1 knockdown on
erastin- and RSL3-induced ferroptosis in melanoma cells (Figs. 6 and S6). Therefore, these results indicate that
IRP1 plays a crucial role in ferroptosis by regulating iron
metabolism proteins.
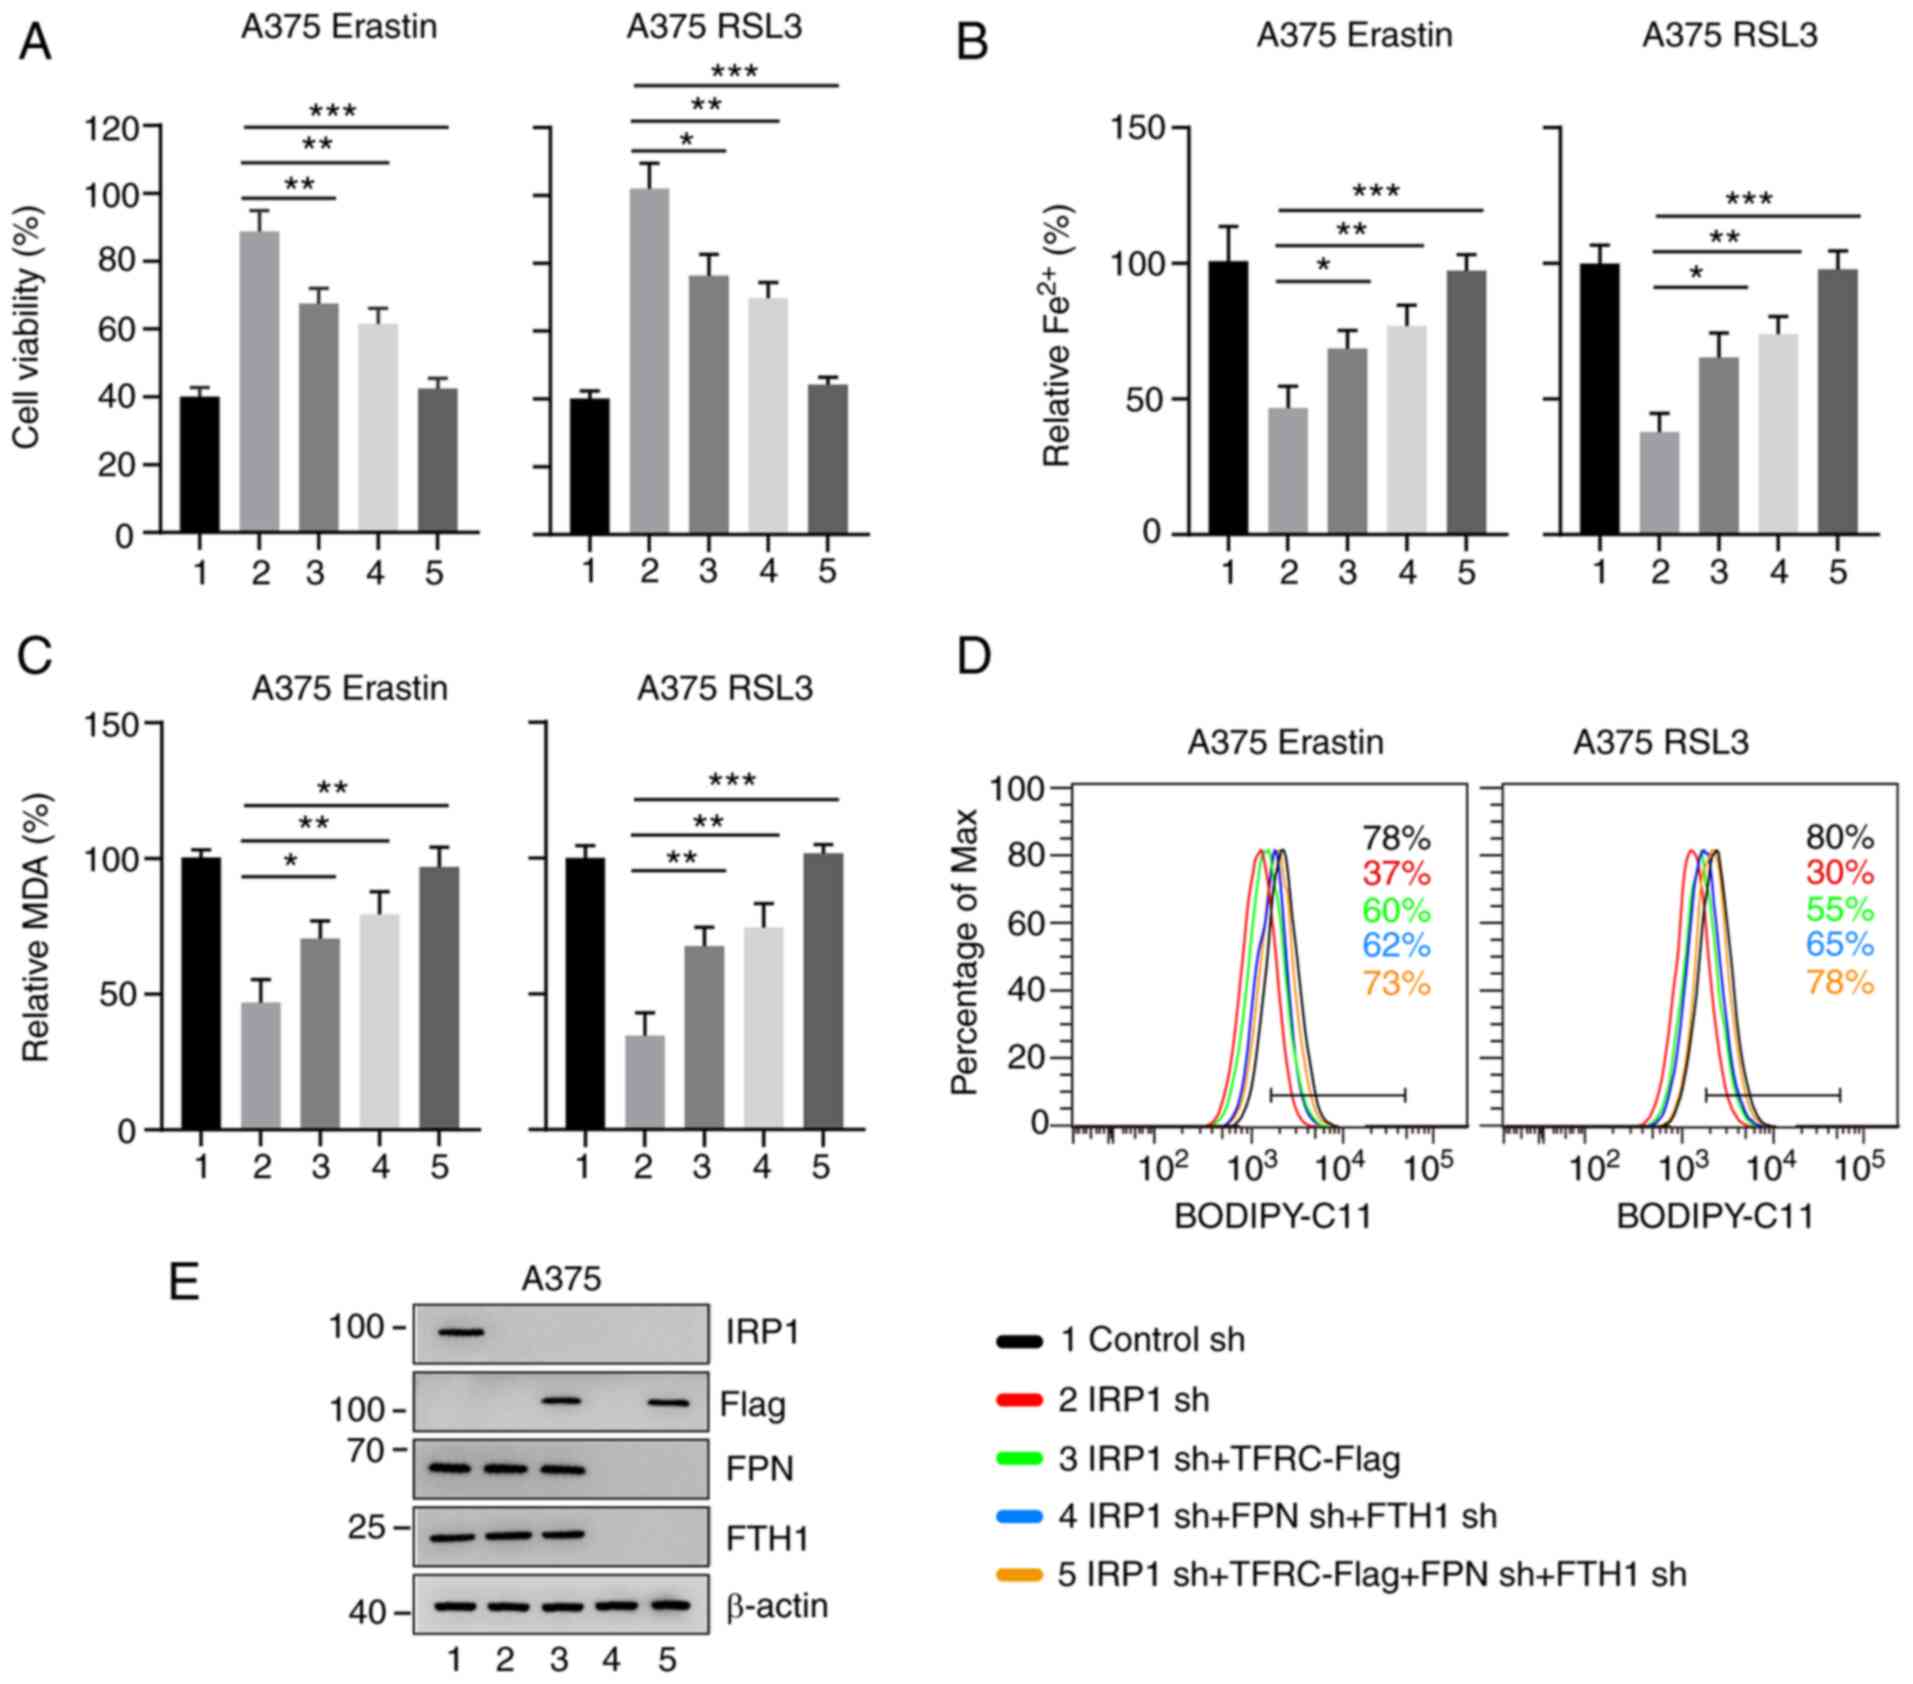 | Figure 6.IRP1 function in ferroptosis depends
on TFRC, FPN and FTH1. (A) Overexpression of TFRC and knockdown of
FPN and FTH1 enhanced erastin- and RSL3-induced ferroptotic cell
death in IRP1 knockdown A375 melanoma cells. (B) Overexpression of
TFRC and knockdown of FPN and FTH1 promoted erastin- and
RSL3-induced iron accumulation in IRP1 knockdown A375 melanoma
cells. (C and D) Overexpression of TFRC and knockdown of FPN and
FTH1 promoted erastin- and RSL3-induced (C) MDA accumulation and
(D) lipid ROS accumulation in IRP1 knockdown A375 melanoma cells.
The black line represents the control cells; the red line
represents IRP1 knockdown; the green line represents overexpression
of TFRC and IRP1 knockdown; the blue line represents the FPN, FTH1
and IRP1 knockdown and the orange line represents overexpression of
TFRC and FPN, FTH1 and IRP1 knockdown. (E) Protein levels of IRP1,
TFRC, FPN and FTH1 in A375 cells transfected with the indicated
constructs. Data are presented as the mean ± SD of three
independent experiments. *P<0.05; **P<0.01; ***P<0.001.
IRP, iron regulatory protein; TFRC, transferrin receptor; FPN,
ferroportin; FTH1, ferritin heavy chain 1; sh, short hairpin RNA;
MDA, malondialdehyde; n.s., not significant. |
Discussion
In the present study, IRP1 promoted ferroptosis by
regulating iron homeostasis. The expression of IRP1 significantly
increased in melanoma cells following treatment with erastin and
RSL3. Increased IRP1 levels could promote the expression of TFRC
and inhibit the translation of FPN and FTH1, which further
increased the intracellular iron levels to promote ferroptosis. In
the absence of IRP1, the accumulation of intracellular iron was
suppressed, and cells were insensitive to ferroptosis inducers
(Fig. 7).
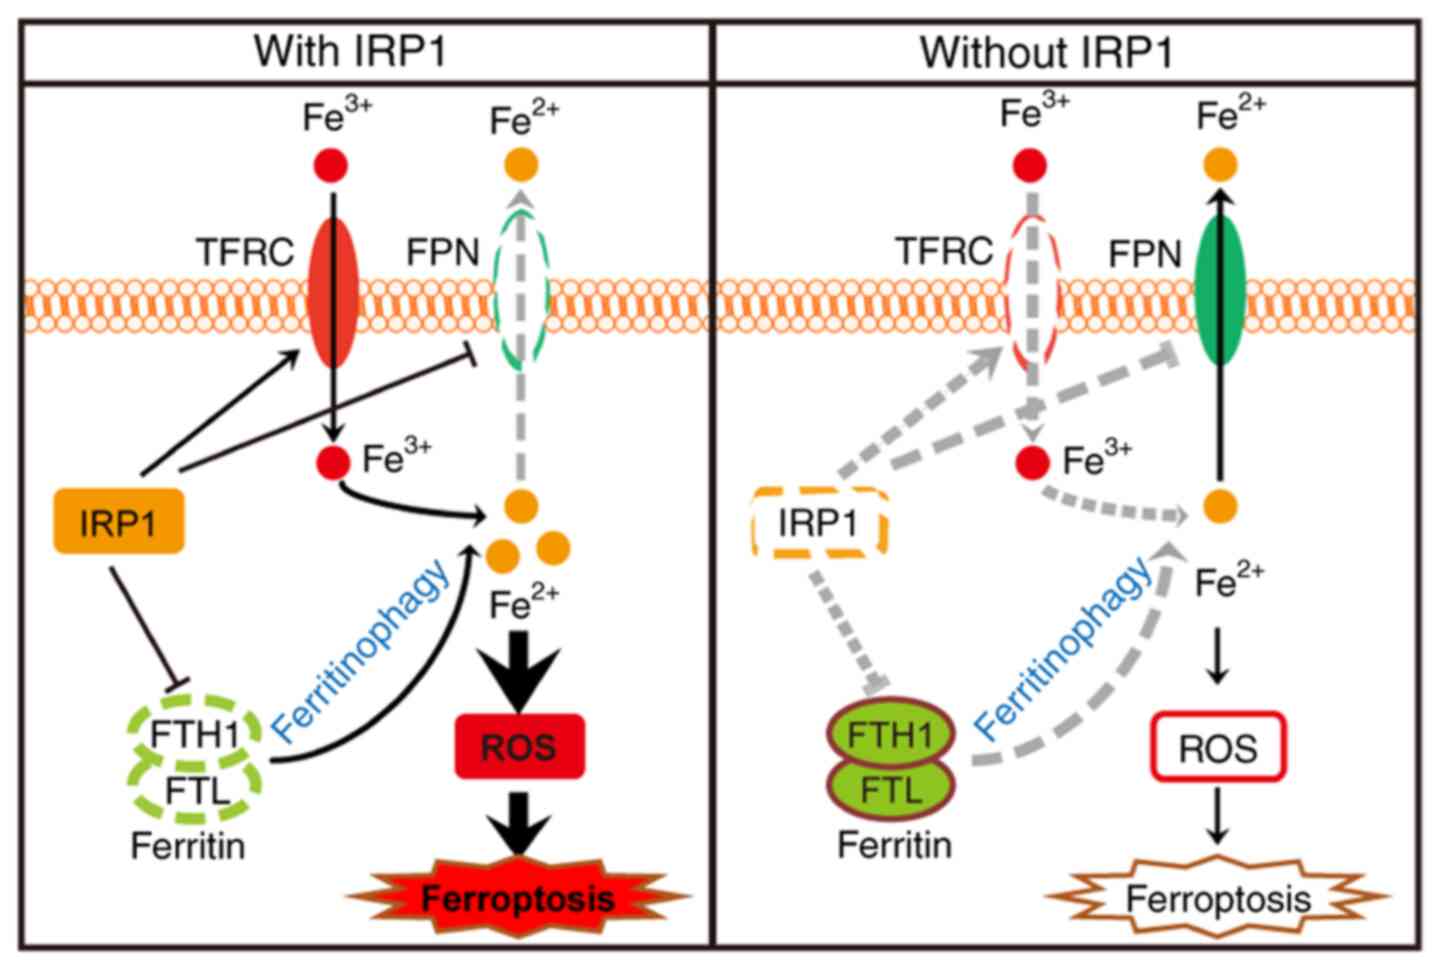 | Figure 7.Schematic depicting IRP1-mediated
ferroptosis in melanoma cells. The Fe3+ transported into
cells by TFRC and the Fe2+ released through
ferritinophagy are the main sources of iron pools. In wild-type
cells, erastin- and RSL3-induced IRP1 promotes the expression of
TFRC and suppresses the expression of FPN and ferritin, which
increases the intracellular Fe2+ levels and promotes
ferroptosis. In the absence of IRP1, these effects are reversed,
resulting in significantly decreased intracellular Fe2+
levels, thus suppressing erastin- and RSL3-induced ferroptosis.
IRP, iron regulatory protein; TFRC, transferrin receptor; FPN,
ferroportin; FTH1, ferritin heavy chain 1; ROS, reactive oxidant
species; FTL, ferritin light chain. |
The role of IRP1 and IRP2 in iron homeostasis is
well-documented. IRP2 was previously speculated to be a major
regulator of iron homeostasis, since IRP1 is insensitive to changes
in iron levels, and knockdown of IRP1 does not lead to overall
dysregulation of iron metabolism to the same extent as knockdown of
IRP2 (15,45). However, under the condition of
oxidative stress, ACO1 disassociates from Fe-S clusters and is
converted into IRP1, significantly increasing IRP1, and IRP1 plays
a key role in iron regulation (16–18). For
example, with increasing oxygen concentration, IRP1 is activated
and can be a major source of IRE-binding activity (16). IRP1 is also superior to IRP2 in
regulating cellular iron homeostasis in response to nitric oxide
(18). Nitric oxide stimulates the
disassembly of the Fe-S cluster in IRP1, leading to the activation
of IRP1 (18). In IRP2 knockout
mice, nitroxide tempol prevents the symptoms of neurodegenerative
disease by activating IRP1 activity (17). In the present study, IRP1 expression
increased more significantly in erastin- and RSL3-treated cells
than IRP2. Although IRP2 is also involved in the regulation of iron
homeostasis, IRP1 plays a major role in this process. Knockdown of
IRP1 showed a more robust phenotype, including ferroptotic cell
death, iron accumulation and lipid ROS accumulation, further
confirming that IRP1 plays a major role in iron metabolism under
stress conditions.
IRP1 is a bifunctional protein, which can plays a
role in iron homeostasis regulation as an iron regulatory protein
or participates in mitochondrial metabolism as ACO1. The present
study demonstrated that the aconitase activity of ACO1 was reduced
and the IRE-binding activity of IRP1 was increased in erastin- and
RSL3-induced ferroptosis. These results suggested that erastin and
RSL3 may facilitate the transition of ACO1 to IRP1. ACO1, a
metabolic enzyme in the TCA cycle, is also sensitive to ROS
(13,46,47).
Under oxidative stress, ACO1 activity is reduced (48). It is possible that the accumulated
lipid ROS suppresses the ACO1 activity of ACO1. To detect whether
the reduction of enzyme activity is also related to the conversion
of ACO1 to IRP1, the activity of IRP1 was analyzed using RIP. IRP1
was more enriched on the IRE sequences compared with the DMSO
treated group, and the expression levels of TFRC, FPN and Ft were
also changed. Therefore, lipid ROS may directly inhibit the
activity of ACO1 or indirectly suppress the activity of ACO1 by
promoting the conversion of ACO1 to IRP1.
Furthermore, the present study demonstrated that
overexpression of IRP1 increases the susceptibility of melanoma
cells to ferroptosis. Previous studies have reported that mutant
p53 regulates ferroptosis independently of IRPs (49–51).
This contradictory result may be due to the difference between the
wild-type and mutant p53 genes, and previous studies have reported
the same results (52–55). For example, knockdown of spermine
N1-acetyltransferase 1 in p53 wild-type tumors significantly
enhanced the resistance of cells to ferroptosis, but not in p53
mutant tumors (52). Wild-type p53
can markedly enhance the sensitivity of tumor cells to ferroptosis
by inhibiting solute carrier family 7 member 11 (SLC7A11), while
the sensitivity of tumor cells to ferroptosis is decreased and the
repression of p53 on SLC7A11 is impaired in p534KR98-expressing
cells (53–55). Since tumor cells expressing wild-type
or mutated p53 may have different sensitivities to ferroptosis, p53
mutational status may be an important factor to consider in the
treatment of tumors with ferroptosis. Although therapies that
target ferroptosis are not yet available for the treatment of
tumors due to the low targeting and short half-life of ferroptosis
inducers, ferroptosis is a promising treatment for tumors.
Nanotechnology may also provide a technical platform for the use of
ferroptosis in melanoma treatment (56–58).
In conclusion, overexpression of IRP1 increases the
susceptibility of melanoma cells to ferroptosis, suggesting that
patients with high expression of IRP1 may benefit more from
ferroptosis treatment. Since iron homeostasis is very similar in
different cancer cell types (59–62), the
function and IRP1 in ferroptosis identified in melanoma may be
extended to other tumors as well. Considering that several tumor
types, especially drug-resistant tumors, are sensitive to
ferroptosis inducers, the activation of IRP1 may represent a new
therapeutic method for the treatment of tumors.
Supplementary Material
Supporting Data
Acknowledgements
Not applicable.
Funding
The present study was supported by The National
Natural Science Foundation of China (grant nos. 81772915 and
82073022).
Availability of data and materials
The datasets used and analyzed during the present
study are available from the corresponding author upon reasonable
request.
Authors' contributions
FY performed the experiments and analyzed the data.
XC, YZ participated in the data processing, ZB participated in data
interpretation and HW participated in the manuscript drafting. DZ,
HQW and HW performed the experiments and analyzed the data. YY
designed the experiments, analyzed the data and drafted the initial
manuscript. XC, YZ confirmed the authenticity of all the raw data.
All authors have read and approved the final manuscript.
Ethics approval and consent to
participate
Not applicable.
Patient consent for publication
Not applicable.
Competing interests
The authors declare that they have no competing
interests.
References
|
1
|
Hentze MW, Muckenthaler MU, Galy B and
Camaschella C: Two to tango: Regulation of Mammalian iron
metabolism. Cell. 142:24–38. 2010. View Article : Google Scholar : PubMed/NCBI
|
|
2
|
Datz C, Müller E and Aigner E: Iron
overload and non-alcoholic fatty liver disease. Minerva Endocrinol.
42:173–183. 2017. View Article : Google Scholar : PubMed/NCBI
|
|
3
|
Babitt JL and Lin HY: Mechanisms of anemia
in CKD. J Am Soc Nephrol. 23:1631–1634. 2012. View Article : Google Scholar : PubMed/NCBI
|
|
4
|
Keith DS, Nichols GA, Gullion CM, Brown JB
and Smith DH: Longitudinal follow-up and outcomes among a
population with chronic kidney disease in a large managed care
organization. Arch Intern Med. 164:659–663. 2004. View Article : Google Scholar : PubMed/NCBI
|
|
5
|
Bush AI: The metallobiology of Alzheimer's
disease. Trends Neurosci. 26:207–214. 2003. View Article : Google Scholar : PubMed/NCBI
|
|
6
|
Singh A, Kukreti R, Saso L and Kukreti S:
Oxidative Stress: A Key Modulator in Neurodegenerative Diseases.
Molecules. 24:15832019. View Article : Google Scholar : PubMed/NCBI
|
|
7
|
Zager RA: Parenteral iron compounds:
Potent oxidants but mainstays of anemia management in chronic renal
disease. Clin J Am Soc Nephrol. (Suppl 1):S24–S31. 2006. View Article : Google Scholar
|
|
8
|
Jin L, Wang J and Zhao L: Decreased serum
ceruloplasmin levels characteristically aggravate nigral iron
deposition in Parkinson's disease. Brain. 134:50–58. 2011.
View Article : Google Scholar : PubMed/NCBI
|
|
9
|
Britton LJ, Subramaniam VN and Crawford
DH: Iron and non-alcoholic fatty liver disease. World J
Gastroenterol. 22:8112–8122. 2016. View Article : Google Scholar : PubMed/NCBI
|
|
10
|
Jiang R, Manson JE, Meigs JB, Ma J, Rifai
N and Hu FB: Body iron stores in relation to risk of type 2
diabetes in apparently healthy women. JAMA. 291:711–717. 2004.
View Article : Google Scholar : PubMed/NCBI
|
|
11
|
Wilkinson N and Pantopoulos K: The IRP/IRE
system in vivo: Insights from mouse models. Front Pharmacol.
5:1762014. View Article : Google Scholar : PubMed/NCBI
|
|
12
|
Brown NM, Kennedy MC, Antholine WE,
Eisenstein RS and Walden WE: Detection of a [3Fe-4S] cluster
intermediate of cytosolic aconitase in yeast expressing iron
regulatory protein 1. Insights into the mechanism of Fe-S cluster
cycling. J Biol Chem. 277:7246–7254. 2002. View Article : Google Scholar : PubMed/NCBI
|
|
13
|
Lushchak OV, Piroddi M, Galli F and
Lushchak VI: Aconitase post-translational modification as a key in
linkage between Krebs cycle, iron homeostasis, redox signaling, and
metabolism of reactive oxygen species. Redox Rep. 19:8–15. 2014.
View Article : Google Scholar : PubMed/NCBI
|
|
14
|
Tong WH and Rouault TA: Metabolic
regulation of citrate and iron by aconitases: Role of iron-sulfur
cluster biogenesis. Biometals. 20:549–564. 2007. View Article : Google Scholar : PubMed/NCBI
|
|
15
|
Meyron-Holtz EG, Ghosh MC, Iwai K, LaVaute
T, Brazzolotto X, Berger UV, Land W, Ollivierre-Wilson H, Grinberg
A, Love P and Rouault TA: Genetic ablations of iron regulatory
proteins 1 and 2 reveal why iron regulatory protein 2 dominates
iron homeostasis. EMBO J. 23:386–395. 2004. View Article : Google Scholar : PubMed/NCBI
|
|
16
|
Meyron-Holtz EG, Ghosh MC and Rouault TA:
Mammalian tissue oxygen levels modulate iron-regulatory protein
activities in vivo. Science. 306:2087–2090. 2004. View Article : Google Scholar : PubMed/NCBI
|
|
17
|
Ghosh MC, Tong WH, Zhang D,
Ollivierre-Wilson H, Singh A, Krishna MC, Mitchell JB and Rouault
TA: Tempol-mediated activation of latent iron regulatory protein
activity prevents symptoms of neurodegenerative disease in IRP2
knockout mice. Proc Natl Acad Sci USA. 105:12028–12033. 2008.
View Article : Google Scholar : PubMed/NCBI
|
|
18
|
Stys A, Galy B, Starzynski RR, Smuda E,
Drapier JC, Lipiński P and Bouton C: Iron regulatory protein 1
outcompetes iron regulatory protein 2 in regulating cellular iron
homeostasis in response to nitric oxide. J Biol Chem.
286:22846–22854. 2011. View Article : Google Scholar : PubMed/NCBI
|
|
19
|
Dev S, Kumari S, Singh N, Kumar Bal S,
Seth P and Mukhopadhyay CK: Role of extracellular Hydrogen peroxide
in regulation of iron homeostasis genes in neuronal cells:
Implication in iron accumulation. Free Radic Biol Med. 86:78–89.
2015. View Article : Google Scholar : PubMed/NCBI
|
|
20
|
Dixon SJ, Lemberg KM, Lamprecht MR, Skouta
R, Zaitsev EM, Gleason CE, Patel DN, Bauer AJ, Cantley AM, Yang WS,
et al: Ferroptosis: An iron-dependent form of nonapoptotic cell
death. Cell. 149:1060–1072. 2012. View Article : Google Scholar : PubMed/NCBI
|
|
21
|
Dolma S, Lessnick SL, Hahn WC and
Stockwell BR: Identification of genotype-selective antitumor agents
using synthetic lethal chemical screening in engineered human tumor
cells. Cancer Cell. 3:285–296. 2003. View Article : Google Scholar : PubMed/NCBI
|
|
22
|
Yang WS and Stockwell BR: Synthetic lethal
screening identifies compounds activating iron-dependent,
nonapoptotic cell death in oncogenic-RAS-harboring cancer cells.
Chem Biol. 15:234–245. 2008. View Article : Google Scholar : PubMed/NCBI
|
|
23
|
Yang WS, SriRamaratnam R, Welsch ME,
Shimada K, Skouta R, Viswanathan VS, Cheah JH, Clemons PA, Shamji
AF, Clish CB, et al: Regulation of ferroptotic cancer cell death by
GPX4. Cell. 156:317–331. 2014. View Article : Google Scholar : PubMed/NCBI
|
|
24
|
Wang H, An P, Xie E, Wu Q, Fang X, Gao H,
Zhang Z, Li Y, Wang X, Zhang J, et al: Characterization of
ferroptosis in murine models of hemochromatosis. Hepatology.
66:449–465. 2017. View Article : Google Scholar : PubMed/NCBI
|
|
25
|
Geng N, Shi BJ, Li SL, Zhong ZY, Li YC,
Xua WL, Zhou H and Cai JH: Knockdown of ferroportin accelerates
erastin-induced ferroptosis in neuroblastoma cells. Eur Rev Med
Pharmacol Sci. 22:3826–3836. 2018.PubMed/NCBI
|
|
26
|
Gao M, Monian P, Quadri N, Ramasamy R and
Jiang X: Glutaminolysis and transferrin regulate ferroptosis. Mol
Cell. 59:298–308. 2015. View Article : Google Scholar : PubMed/NCBI
|
|
27
|
Mancias JD, Wang X, Gygi SP, Harper JW and
Kimmelman AC: Quantitative proteomics identifies NCOA4 as the cargo
receptor mediating ferritinophagy. Nature. 509:105–109. 2014.
View Article : Google Scholar : PubMed/NCBI
|
|
28
|
Zhang Z, Yao Z, Wang L, Ding H, Shao J,
Chen A, Zhang F and Zheng S: Activation of ferritinophagy is
required for the RNA-binding protein ELAVL1/HuR to regulate
ferroptosis in hepatic stellate cells. Autophagy. 14:2083–2103.
2018. View Article : Google Scholar : PubMed/NCBI
|
|
29
|
Lin LS, Song J, Song L, Ke K, Liu Y, Zhou
Z, Shen Z, Li J, Yang Z, Tang W, et al: Simultaneous Fenton-like
ion delivery and glutathione depletion by MnO2-based
nanoagent to enhance chemodynamic therapy. Angew Chem Int Ed Engl.
57:4902–4906. 2018. View Article : Google Scholar : PubMed/NCBI
|
|
30
|
Sui S, Zhang J, Xu S, Wang Q, Wang P and
Pang D: Ferritinophagy is required for the induction of ferroptosis
by the bromodomain protein BRD4 inhibitor (+)-JQ1 in cancer cells.
Cell Death Dis. 10:3312019. View Article : Google Scholar : PubMed/NCBI
|
|
31
|
Siegel RL, Miller KD and Jemal A: Cancer
statistics, 2020. CA: Cancer J Clin. 70:7–30. 2020.PubMed/NCBI
|
|
32
|
Brenner M and Hearing VJ: The protective
role of melanin against UV damage in human skin. Photochem
Photobiol. 84:539–549. 2008. View Article : Google Scholar : PubMed/NCBI
|
|
33
|
Armstrong JL, Corazzari M, Martin S,
Pagliarini V, Falasca L, Hill DS, Ellis N, Al Sabah S, Redfern CP,
Fimia GM, et al: Oncogenic B-RAF signaling in melanoma impairs the
therapeutic advantage of autophagy inhibition. Clin Cancer Res.
17:2216–2226. 2011. View Article : Google Scholar : PubMed/NCBI
|
|
34
|
Lang X, Green MD, Wang W, Yu J, Choi JE,
Jiang L, Liao P, Zhou J, Zhang Q, Dow A, et al: Radiotherapy and
immunotherapy promote tumoral lipid oxidation and ferroptosis via
synergistic repression of SLC7A11. Cancer Discov. 9:1673–1685.
2019. View Article : Google Scholar : PubMed/NCBI
|
|
35
|
Sato M, Onuma K, Domon M, Hasegawa S,
Suzuki A, Kusumi R, Hino R, Kakihara N, Kanda Y, Osaki M, et al:
Loss of the cystine/glutamate antiporter in melanoma abrogates
tumor metastasis and markedly increases survival rates of mice. Int
J Cancer. 147:3224–3235. 2020. View Article : Google Scholar : PubMed/NCBI
|
|
36
|
Konieczkowski DJ, Johannessen CM,
Abudayyeh O, Kim JW, Cooper ZA, Piris A, Frederick DT,
Barzily-Rokni M, Straussman R, Haq R, et al: A melanoma cell state
distinction influences sensitivity to MAPK pathway inhibitors.
Cancer Discov. 4:816–827. 2014. View Article : Google Scholar : PubMed/NCBI
|
|
37
|
Luo M, Wu L, Zhang K, Wang H, Zhang T,
Gutierrez L, O'Connell D, Zhang P, Li Y, Gao T, et al: miR-137
regulates ferroptosis by targeting glutamine transporter SLC1A5 in
melanoma. Cell Death Differ. 25:1457–1472. 2018. View Article : Google Scholar : PubMed/NCBI
|
|
38
|
Tsoi J, Robert L, Paraiso K, Galvan C,
Sheu KM, Lay J, Wong DJL, Atefi M, Shirazi R, Wang X, et al:
Multi-stage differentiation defines melanoma subtypes with
differential vulnerability to drug-induced iron-dependent oxidative
stress. Cancer Cell. 33:890–904.e5. 2018. View Article : Google Scholar : PubMed/NCBI
|
|
39
|
Miyazawa M, Bogdan AR and Tsuji Y:
Perturbation of iron metabolism by cisplatin through inhibition of
iron regulatory protein 2. Cell Chem Biol. 26:85–97.e4. 2019.
View Article : Google Scholar : PubMed/NCBI
|
|
40
|
Livak KJ and Schmittgen TD: Analysis of
relative gene expression data using real-time quantitative PCR and
the 2(-Delta Delta C(T)) method. Methods. 25:402–408. 2001.
View Article : Google Scholar : PubMed/NCBI
|
|
41
|
Philpott CC, Klausner RD and Rouault TA:
The bifunctional iron-responsive element binding protein/cytosolic
aconitase: The role of active-site residues in ligand binding and
regulation. Proc Natl Acad Sci USA. 91:7321–7325. 1994. View Article : Google Scholar : PubMed/NCBI
|
|
42
|
Eisenstein RS: Iron regulatory proteins
and the molecular control of mammalian iron metabolism. Annu Rev
Nutr. 20:627–662. 2000. View Article : Google Scholar : PubMed/NCBI
|
|
43
|
Wallander ML, Leibold EA and Eisenstein
RS: Molecular control of vertebrate iron homeostasis by iron
regulatory proteins. Biochim Biophys Acta. 1763:668–689. 2006.
View Article : Google Scholar : PubMed/NCBI
|
|
44
|
Hentze MW, Muckenthaler MU and Andrews NC:
Balancing acts: Molecular control of mammalian iron metabolism.
Cell. 117:285–297. 2004. View Article : Google Scholar : PubMed/NCBI
|
|
45
|
LaVaute T, Smith S, Cooperman S, Iwai K,
Land W, Meyron-Holtz E, Drake SK, Miller G, Abu-Asab M, Tsokos M,
et al: Targeted deletion of the gene encoding iron regulatory
protein-2 causes misregulation of iron metabolism and
neurodegenerative disease in mice. Nat Genet. 27:209–214. 2001.
View Article : Google Scholar : PubMed/NCBI
|
|
46
|
Velsor LW, Kariya C, Kachadourian R and
Day BJ: Mitochondrial oxidative stress in the lungs of cystic
fibrosis transmembrane conductance regulator protein mutant mice.
Am J Respir Cell Mol Biol. 35:579–586. 2006. View Article : Google Scholar : PubMed/NCBI
|
|
47
|
Gardner PR: Aconitase: Sensitive target
and measure of superoxide. Methods Enzymol. 349:9–23. 2002.
View Article : Google Scholar : PubMed/NCBI
|
|
48
|
Gardner PR, Nguyen DD and White CW:
Aconitase is a sensitive and critical target of oxygen poisoning in
cultured mammalian cells and in rat lungs. Proc Natl Acad Sci USA.
91:12248–12252. 1994. View Article : Google Scholar : PubMed/NCBI
|
|
49
|
Funauchi Y, Tanikawa C, Yi Lo PH, Mori J,
Daigo Y, Takano A, Miyagi Y, Okawa A, Nakamura Y and Matsuda K:
Regulation of iron homeostasis by the p53-ISCU pathway. Sci Rep.
5:164972015. View Article : Google Scholar : PubMed/NCBI
|
|
50
|
Zhang F, Wang W, Tsuji Y, Torti SV and
Torti FM: Post-transcriptional modulation of iron homeostasis
during p53-dependent growth arrest. J Biol Chem. 283:33911–33918.
2008. View Article : Google Scholar : PubMed/NCBI
|
|
51
|
Thompson LR, Oliveira TG, Hermann ER,
Chowanadisai W, Clarke SL and Montgomery MR: Distinct TP53 mutation
types exhibit increased sensitivity to ferroptosis independently of
changes in iron regulatory protein activity. Int J Mol Sci.
21:67512020. View Article : Google Scholar : PubMed/NCBI
|
|
52
|
Ou Y, Wang SJ, Li D, Chu B and Gu W:
Activation of SAT1 engages polyamine metabolism with p53-mediated
ferroptotic responses. Proc Natl Acad Sci USA. 113:E6806–E6812.
2016. View Article : Google Scholar : PubMed/NCBI
|
|
53
|
Jiang L, Kon N, Li T, Wang SJ, Su T,
Hibshoosh H, Baer R and Gu W: Ferroptosis as a p53-mediated
activity during tumour suppression. Nature. 520:57–62. 2015.
View Article : Google Scholar : PubMed/NCBI
|
|
54
|
Jennis M, Kung CP, Basu S, Budina-Kolomets
A, Leu JI, Khaku S, Scott JP, Cai KQ, Campbell MR, Porter DK, et
al: An African-specific polymorphism in the TP53 gene impairs p53
tumor suppressor function in a mouse model. Genes Dev. 30:918–930.
2016. View Article : Google Scholar : PubMed/NCBI
|
|
55
|
Wang SJ, Li D, Ou Y, Jiang L, Chen Y, Zhao
Y and Gu W: Acetylation is crucial for p53-mediated ferroptosis and
tumor suppression. Cell Rep. 17:366–373. 2016. View Article : Google Scholar : PubMed/NCBI
|
|
56
|
Li J, Li J, Pu Y, Li S, Gao W and He B:
PDT-Enhanced ferroptosis by a polymer nanoparticle with
pH-activated singlet oxygen generation and superb biocompatibility
for cancer therapy. Biomacromolecules. 22:1167–1176. 2021.
View Article : Google Scholar : PubMed/NCBI
|
|
57
|
Jasim KA and Gesquiere AJ: Ultrastable and
biofunctionalizable conjugated polymer nanoparticles with
encapsulated iron for ferroptosis assisted chemodynamic therapy.
Mol Pharm. 16:4852–4866. 2019. View Article : Google Scholar : PubMed/NCBI
|
|
58
|
Kim SE, Zhang L, Ma K, Riegman M, Chen F,
Ingold I, Conrad M, Turker MZ, Gao M, Jiang X, et al: Ultrasmall
nanoparticles induce ferroptosis in nutrient-deprived cancer cells
and suppress tumour growth. Nat Nanotechnol. 11:977–985. 2016.
View Article : Google Scholar : PubMed/NCBI
|
|
59
|
Wang Y, Yu L, Ding J and Chen Y: Iron
metabolism in cancer. Int J Mol Sci. 20:952018. View Article : Google Scholar : PubMed/NCBI
|
|
60
|
Bian Z, Hann HW, Ye Z, Yin C, Wang Y, Fang
W, Wan S, Wang C and Tao K: Ferritin level prospectively predicts
hepatocarcinogenesis in patients with chronic hepatitis B virus
infection. Oncol Lett. 16:3499–3508. 2018.PubMed/NCBI
|
|
61
|
Song A, Eo W, Kim S, Shim B and Lee S:
Significance of serum ferritin as a prognostic factor in advanced
hepatobiliary cancer patients treated with Korean medicine: A
retrospective cohort study. BMC Complement Altern Med. 18:1762018.
View Article : Google Scholar : PubMed/NCBI
|
|
62
|
Guo W, Zhang S, Chen Y, Zhang D, Yuan L,
Cong H and Liu S: An important role of the hepcidin-ferroportin
signaling in affecting tumor growth and metastasis. Acta Biochim
Biophys Sin (Shanghai). 47:703–715. 2015. View Article : Google Scholar : PubMed/NCBI
|