Introduction
Gastric cancer (GC), a malignant type of tumor
originating from gastric epithelial cells, is one of the leading
causes of cancer-associated mortality worldwide. Its incidence
ranks fifth among all types of cancer worldwide, behind lung,
breast, colorectal and prostate cancers (1,2). With
progress in science and biotechnology, the early diagnosis of GC
has improved, and a significant increase in the survival rate of
patients has been observed. However, the overall 5-year survival
rate of patients with GC remains ~30% due to the recurrence and
metastasis of advanced GC. Furthermore, local recurrence and
distant metastasis are the most common causes of death (3,4).
The survival and prognosis of patients with GC have
been greatly improved with the use of chemotherapy, radiotherapy,
surgery, molecular targeted therapy and immunotherapy; however, the
underlying molecular mechanisms for this disease remain largely
unknown (5,6). The carcinogenesis of GC involves both
environmental and genetic factors and is a multi-step process
(7,8). It is therefore crucial to study the
genes involved in tumor progression, invasion and metastasis, as
well as to determine the underlying mechanisms of these genes in
affecting both the treatment and prognosis of GC (9,10). For
example, efforts are currently being made to identify molecular
regulators for cancer invasion.
One approach to identify the molecular regulators of
GC is to search for actin regulatory proteins, which may be targets
for future anticancer therapy (11).
Among a variety of cellular processes, the formin family
coordinates the rearrangement of the actin cytoskeleton. Actin
cytoskeleton remodeling is crucial in cell migration and is
mediated by actin regulatory proteins, which are active in
different cellular locations (12).
Formins, which are highly conserved actin nucleating proteins, are
usually found in all eukaryotes. Individual formins are usually
inactive, until they are activated or phosphorylated by rhodopsin
(Rho) GTPases. The latter have a variety of biochemical and
functional properties in the formation of actin filaments, such as
remodeling the cytoskeleton of different intercellular compartments
and controlling the assembly of stress fibers, the formation of
adhesion points and the movement of cancer cells (13,14).
However, the role of formins in tumor tissues remains unknown
(15). Several proteins of the
formin family, including formin homology 2 domain containing
protein 1 (FHOD1), are primarily expressed in the mesothelial
tissue. It has been reported that their upregulation occurs during
cancer cell epithelial-mesenchymal transition (EMT) in vivo
(16). For example, the high
expression of formin like 2 in colon cancer tissues is associated
with metastasis (17). Despite these
findings, there is a lack of studies evaluating the
clinicopathological significance of FHOD1 in GC and its underlying
molecular mechanisms.
The present study analyzed a dataset from The Cancer
Genome Atlas (TCGA) and performed immunohistochemistry (IHC) on GC
tissues to evaluate FHOD1 expression in GC tissues. Furthermore,
the current study determined the association between FHOD1
expression and the overall survival rate of patients with GC. The
possible role of FHOD1 in the development of GC was studied using
several in vitro assays performed on two human GC cell lines
that underwent FHOD1 knockdown and overexpression. The present
study may provide novel evidence regarding the role of FHOD1 in GC
pathogenesis and patient prognosis. FHOD1 may represent a potential
new target for the treatment and management of GC.
Materials and methods
TCGA datasets
The RNA sequencing data of FHOD1 in normal gastric
and GC tissues were obtained from TCGA-STAD (https://gdc-portal.nci.nih.gov/projects/TCGA-STAD).
The expression level of FHOD1 between normal gastric and GC tissues
were compared. The gene expression data used to analyze the
association between FHOD1 expression and the overall survival rate
of patients with GC were obtained from our previous cohort study
(Nanjing Drum Tower Hospital; Nanjing, China) on the multigene
prognostic signature in GC (18).
Patients and tissues
To investigate FHOD1 expression in GC samples using
IHC, a total of 30 patients (76.7% men; 23.3% women; mean age,
59.63 years; age range, 33–80 years) were enrolled between December
2012 and April 2014 at Nanjing Drum Tower Hospital. The
paraffin-embedded slides, including 30 pairs of GC and adjacent
gastric tissues (3–6 cm from the tumor), were obtained from the
Department of Pathology of Nanjing Drum Tower Hospital. The
protocol was approved by The Institutional Ethical Committee of The
Nanjing Drum Tower Hospital (approval no. 2019-196-01) and signed
informed consent form was obtained from each participant prior to
the study.
IHC
Specimens were collected from GC resection following
informed consent from patients. Full thickness gastric tissues
(size, 1.5×1.5×0.3 cm) were resected from the lesion and the normal
section of patients' stomach. These tissues were immediately fixed
in 10% neutral formalin at room temperature for 23 h, dehydrated in
ethanol solution with a concentration gradient (50% ethanol for 10
h, 70% ethanol for 8 h and 100% ethanol for 1 h, all steps
performed at room temperature) and permeabilized three times in
xylene (100% xylene for 40 min at room temperature). Finally, the
tissues were embedded in paraffin. Representative 4-µm serial
sections were prepared from the tissue blocks for IHC. After
deparaffinization, sections were exposed to 3% hydrogen peroxide at
room temperature for 10 min to block endogenous peroxidase
activity, and heat-mediated antigen retrieval was performed using
Tris/EDTA buffer (pH 8). The FHOD1 antibody (cat. no. ab73443;
polyclonal; 1:350; anti-mouse; Abcam) diluted in QuickBlock™
Primary Antibody Dilution Buffer (cat. no. P0262; Beyotime
Institute of Biotechnology) was then incubated overnight with the
human tissue sections in a humidified chamber at 4°C, followed by
incubation with 100 µl of the HRP-conjugated goat anti-mouse IgG
secondary antibody working solution from the Mouse two-step kit
(cat. no. PV-6002; OriGene Technologies, Inc.) at 37°C for 30 min.
Both negative (without the primary antibody) and positive controls
(human pancreatic tissue) were conducted in each run. Based on the
antibody staining, a professional pathologist interpreted the IHC
staining results. Images were acquired using a EVOS M7000 imaging
system (Thermo Fisher Scientific, Inc.; magnification, ×200).
Cell lines and cell culture
The two human gastric cancer cell lines HGC-27
(adherent cells) and MKN45 (semi-suspension cells) were used in the
present study and purchased from The Cell Bank of Type Culture
Collection of The Chinese Academy of Sciences). Cells were cultured
in RPMI-1640 complete medium (Corning) supplemented with 10% FBS
(Biological Industries), 100 U/ml penicillin and 100 µg/ml
streptomycin and placed at 37°C in a humidified incubator
containing 5% CO2 (Thermo Direct Heat CO2;
Thermo Fisher Scientific, Inc.).
Construction and transfection of short
hairpin RNA (shRNA) and overexpression vector using a
lentivirus
For knockdown and overexpression of FHOD1,
lentiviral human FHOD1 shRNA and overexpression vectors were
constructed, respectively. The synthesized FHOD1 targeted knockdown
and overexpression sequences were cloned into the lentiviral
vectors pGL3-U6-enhanced green fluorescence protein (EGFP; TsingKe
Biological Technology) and pGV208-EGFP (Shanghai GeneChem Co.,
Ltd.), respectively. After being incubated at 37°C for 2 h,
pGL3-U6-shFHOD1 and pGV208-LV-FHOD1 vectors were generated. The
empty vector pGV208-EGFP was used as a control plasmid (Shanghai
GeneChem Co., Ltd.). The HGC-27 cell line was transfected with
pGL3-U6-shFHOD1 and pGV208-LV-FHOD1. The MKN45 cell line was
transfected with pGV208-EGFP and pGV208-LV-FHOD1. All transfections
were carried out with 1:50 diluted HitransG P (Shanghai GeneChem
Co., Ltd.) as transfection reagent. To establish a stable cell
line, 72 h after the lentiviral vectors were transfected, 2 µg/ml
puromycin was added to the medium and cells were cultured for 1
week. Knockdown and overexpression efficiency were verified via
reverse transcription-quantitative (RT-q)PCR and western
blotting.
RT-qPCR
TRIzol® reagent (Invitrogen; Thermo
Fisher Scientific, Inc.) was used to extract total RNA from HGC-27
and MKN45 cells according to manufacturer's instructions. Total RNA
was diluted to 1 µg/16 µl with 4 µl 4X gDNA wiper mix (Vazyme
Biotech Co., Ltd.) and RNase-free H2O (Vazyme Biotech
Co., Ltd.) at 4°C for 2 min to remove genomic DNA. Then, 4 µl 5X
HiScript III qRT SuperMix (Vazyme Biotech Co., Ltd.) was added for
RT. The RT conditions were as follows: RT at 37°C for 15 min and
termination at 85°C for 5 sec. The sequences of the primers
designed from NCBI Primer Blast (https://www.ncbi.nlm.nih.gov/tools/primer-blast/index.cgi?LINK_LOC=BlastHome)
and were as follows: FHOD1 forward, 5′-CCTCAGCTGACACCTCCAG-3′ and
reverse, 5′-CAGCGCAACCTGCTTCTC-3′; GAPDH forward,
5′-AGATCATCAGCAATGCCTCCT-3′ and reverse,
5′-TGGTCATGAGTCCTTCCACG-3′; COL1A1 forward,
5′-GATTCCCTGGACCTAAAGGTGC-3′ and reverse,
5′-AGCCTCTCCATCTTTGCCAGCA-3′; and COL18A1 forward,
5′-AAGGACGAGCTGCTGTTTCC-3′ and reverse,
5′-TTGCCGTCAAAGGAGAAGATG-3′. FHOD1, COL1A1 and COL18A1 expression
levels were normalized to those of GAPDH. The SYBR Green PCR
MasterMix (Vazyme Biotech Co., Ltd.) and Lightcycle96 system (Roche
Applied Science) were used for RT-qPCR. The thermocycling
conditions were as follows: Initial denaturation at 95°C for 30
sec, followed by 40 cycles of PCR amplification at 95°C for 10 sec
and annealing/elongation at 60°C for 30 sec. The melting curve was
generated at 95°C for 15 sec, 60°C for 60 sec and 95°C for 15 sec
after the thermocycling. The Cq value calculation and the
transcriptional level analysis of the samples were performed using
the 2−ΔΔCq method (19).
Western blotting
HGC-27 and MKN45 cells were lysed using RIPA buffer
(Beyotime Institute of Biotechnology) supplemented with a protease
and phosphatase inhibitor cocktail (No. 4693116001 Roche
Diagnostics GmbH) and phenylmethylsulphonyl fluoride (Biosharp Life
Sciences). The cells were lysed at 4°C for 30 min and centrifugated
at 14,000 × g for 30 min at 4°C. The supernatant containing
proteins was collected. Protein concentration was determined using
the BCA method with a KGPBCA kit (cat. no. E162-01; Nanjing KeyGen
Biotech Co., Ltd.). Proteins (20 µg/lane) were separated by 7.5%
PAGE Gel Fast Preparation Kit (EpiZyme) with corresponding protein
size standards and transferred onto PVDF membranes. Membranes were
blocked with 5% skimmed milk at room temperature for 2 h. Membranes
were incubated with anti-FHOD1 polyclonal mouse antibody (cat. no.
ab73443; polyclonal; 1:1,000; anti-mouse; Abcam) at 4°C overnight,
and then with an HRP-labeled horse anti-mouse antibody (cat. no.
7076; 1:3,000; anti-mouse IgG, HRP-linked Antibody; Cell Signaling
Technology, Inc.) at room temperature for 2 h. Enhanced
chemiluminescence reagent (Nanjing KeyGen Biotech Co., Ltd.) was
used to detect the signal on the membrane.
Cell colony assay
HGC-27 cells transfected with shFHOD1 or LV-FHOD1
were seeded in 6-well plates at the density of 1,000 cells/well 24
h after transfection, and the medium was replaced every 3 days. Two
weeks later, cells were fixed with 100% methanol for 15 min and
stained with 0.1% crystal violet for 15 min (both at room
temperature). Each clone (containing ≥50 cells) was manually
counted under a ×40 magnifying glass. Each experiment was repeated
three times.
Cell counting kit (CCK)-8 cell
proliferation assay
A CCK-8 (Dojindo Molecular Technologies, Inc.) assay
was used to determine GC cell viability. Briefly, cells were seeded
into 96-well plates at the density of 3×10³ cells/well
and cultured for 24 h. Then, 10 µl CCK-8 reagent was added and
cells were incubated at 37°C and 5% CO2 for 1 h. The
absorbance was determined at 450 nm using a plate reader. A growth
curve was drawn with time as the horizontal axis and absorbance as
the vertical axis.
Cell cycle analysis
GC cells were trypsinized at 37°C for 5 min and
washed twice with PBS (cat. no. BL302A; Biosharp Life Sciences).
The cell suspension was diluted to the density of 1×10⁶
cells/ml. Subsequently, 1 ml cell suspension was centrifuged at 300
× g for 5 min, the supernatant was discarded and the pellet was
mixed with 500 µl of 70% ethanol at 4°C overnight. After
immobilization, the cells were incubated with 500 µl propidium
iodide (PI)/RNase A working solution (cat. no. KGA512; Nanjing
KeyGen Biotech Co., Ltd.). The DNA content stained with PI was
detected by BD FACSCanto II flow cytometer (BD Biosciences) at the
peak of 536 nm. Furthermore, the cell cycle distribution was
analyzed via flow cytometry and BD FACSDiva software (v9.0; BD
Biosciences) was used to analyze the percentage of each cellular
population.
Transwell invasion and migration
assay
Transwell invasion and migration detections were
performed using a Transwell polycarbonate membrane (Corning), which
was previously either coated with Matrigel (Corning) or untreated.
The bottom chamber was filled with 500 µl RPMI-1640 supplemented
with 20% FBS. Then, the transfected HGC-27 cells
(1.0×10⁵ cells/ml) were seeded into the upper chamber
and cultured with FBS-free RPMI-1640 at 37°C in a humidified
incubator containing 5% CO2. After 24 h culture, the
remaining cells on the upper surface were mechanically removed.
Then, the membranes were cleaned, immobilized in methanol at room
temperature for 15 min and stained with methyl violet at room
temperature for 15 min (Tianjin Institute of Chemical Reagents).
Finally, the number of cells that have invaded the lower chamber
was determined using a fluorescence inversion microscope (IX51;
Olympus Corporation; magnification, ×100) in five bright fields to
count the number of cells that have migrated through the membrane
(ImageJ software; v1.52a; National Institutes of Health).
Cell wound scratch assay
The cell migratory ability was detected using a cell
wound scratch assay. Stably transfected GC cells were cultured in
6-well plates (5×10⁵ cells/well). The following day,
when ~100% of the surface was covered with cells, a straight
scratch was made to the monolayer with a sterile pipette tip. After
washing with PBS twice, cells were cultured for 24 h in RPMI-1640
medium containing 1% FBS. The wounds were observed under a ×40
magnification of a fluorescence inversion microscope at 0 and 24 h.
The wound width was measured as follows: Migration distance=scratch
distance at 0 h-scratch distance at 24 h (ImageJ software; v1.52a;
National Institutes of Health).
Soft agar assay
Agar (Biofroxx; neoFROXX GmbH) was prepared as a
1.2% solution in normal saline. The 0.6% agar/medium base layer was
added to a 6-well cell culture plate (Corning) to prevent cell
attachment to the plastic base and formation of a monolayer. Cells
in the logarithmic phase were detached and a 1×10⁴
cells/ml cell suspension was prepared. The 0.3% agar upper layer
was prepared by mixing 0.6% low-melting-point agarose with 2-fold
cell medium at 1:1 (volume). Subsequently, 1 ml upper agarose mixed
with 100 µl single-cell suspension (~1,000 cells) were added to
each well and solidified at room temperature. Cells were cultured
at 37°C in a humidified incubator containing 5% CO2 for
1–2 weeks. Cells were visualized under an inverted microscope for
colony counting (only colonies with >50 cells each were counted;
magnification, ×100).
Co-expression analysis of FHOD1
Co-expression analysis was performed in TCGA stomach
adenocarcinoma dataset using cBioPortal (http://www.cbioportal.org/, TCGA-STAD). WebGestalt (a
web-based Gene Set Analysis Toolkit; http://www.webgestalt.org/option.php) was used to
assess the enriched Gene Ontology (GO) terms within the gene list
of FHOD1 co-expressed genes (FDR<0.05).
3D spheroid culture
HGC-27 and MKN45 cells were cultured in DMEM
supplemented with 10% FBS. To form spheroids, cells were
trypsinized at 37°C for 5 min and diluted at 10 cells/ml, and the
cell suspension was added into Corning® Spheroid
Microplates (96-well plate; Corning; 100 µl/well). Each sample was
evaluated in octuplicate. After incubation in a humidified
incubator containing 5% CO2 at 37°C for 15 days, total
RNA was extracted from spheroids and RT-qPCR was conducted to
detect the levels of ECM-related genes (COL1A1 and COL18A1). The
RNA extraction and RT-qPCR methods used to detect the ECM-related
genes were the same as aforementioned.
Statistical analysis
SPSS software (version 19.0; IBM Corp.) was used for
data analysis. Data were presented as the means ± standard error of
the mean of three independent experiments. Unpaired two-tailed
Student's t-test or one-way ANOVA followed by Bonferroni's post hoc
test were used to analyze differences among the variables. One-way
ANOVA followed by Dunnett's post hoc test was employed to analyze
differences between multiple sets of data. P<0.05 was considered
to indicate a statistically significant difference. The prognostic
significance of FHOD1 and overall survival of patients with GC was
assessed using the Kaplan-Meier analysis. Patients were stratified
based on the FHOD1 expression Z-Score. The cutoff point of Z-Score
was-0.267 (optimal cutoff by the maximally selected log-rank
statistics).
Results
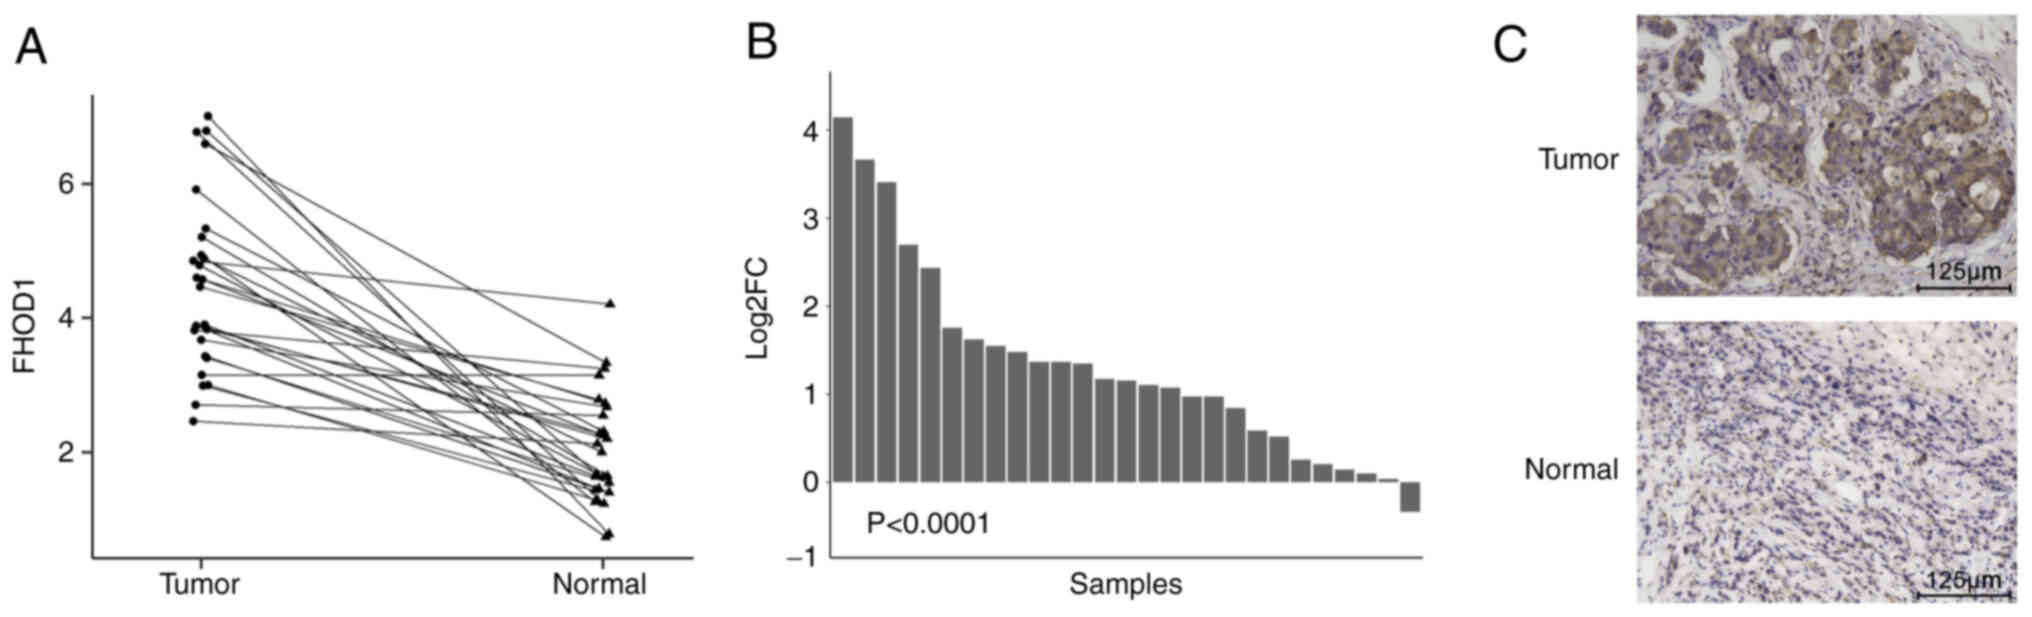
FHOD1 expression is elevated in
patients with GC
According to TCGA database, the mRNA expression
profiles for a total of 27 pairs of GC and adjacent non-tumor
tissues were evaluated. A paired samples line graph (Fig. 1A) and bar graph (Fig. 1B) were used to analyze the
differences in the expression level of FHOD1 between GC and
adjacent non-tumor tissues. The results demonstrated that FHOD1
expression was significantly upregulated in GC tissues
(P<0.0001) compared with adjacent non-tumor tissues.
Furthermore, IHC was performed in 30 pairs of human GC samples to
further confirm this result. The results demonstrated that FHOD1
expression level was higher in GC tissues compared with adjacent
non-tumor gastric tissues from patients enrolled at Nanjing Drum
Tower Hospital (Fig. 1C). Taken
together, these findings suggest that FHOD1 was upregulated in
GC.
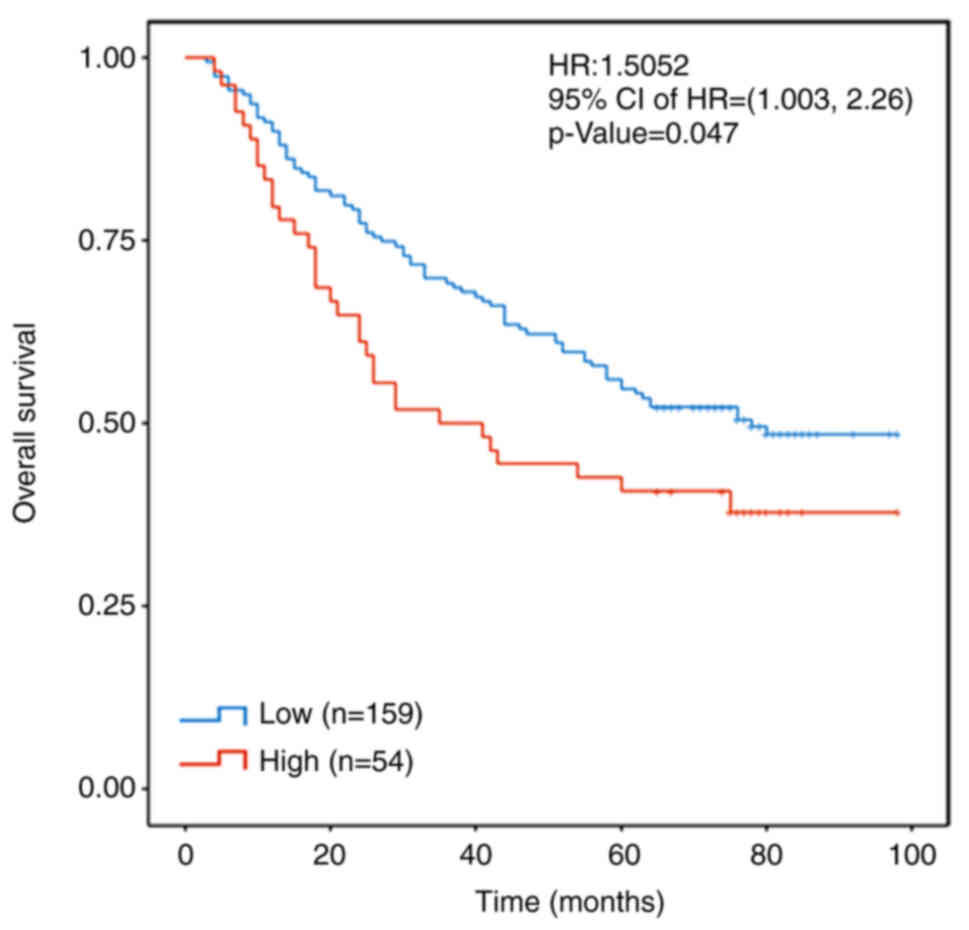
FHOD1 expression is inversely
associated with prognosis in patients with GC
In order to further evaluate the significance of
FHOD1 in the development of GC, Kaplan-Meier analysis was performed
on the transcriptome data of 203 patients with GC, which were
obtained from our previous study using the Panomics technique
designed to evaluate the prognostic value of a multigene panel for
patients with GC in a hospital cohort (18). Patients were stratified according to
the Z-scores of FHOD1 expression. If the Z-Score of FHOD1
expression was >-0.267 (the normal distribution limit of the
right tail was 0.95), this was defined as a high FHOD1 expression.
The results demonstrated that a high expression level of FHOD1 was
associated with a shortened overall survival in patients with GC
(Fig. 2).
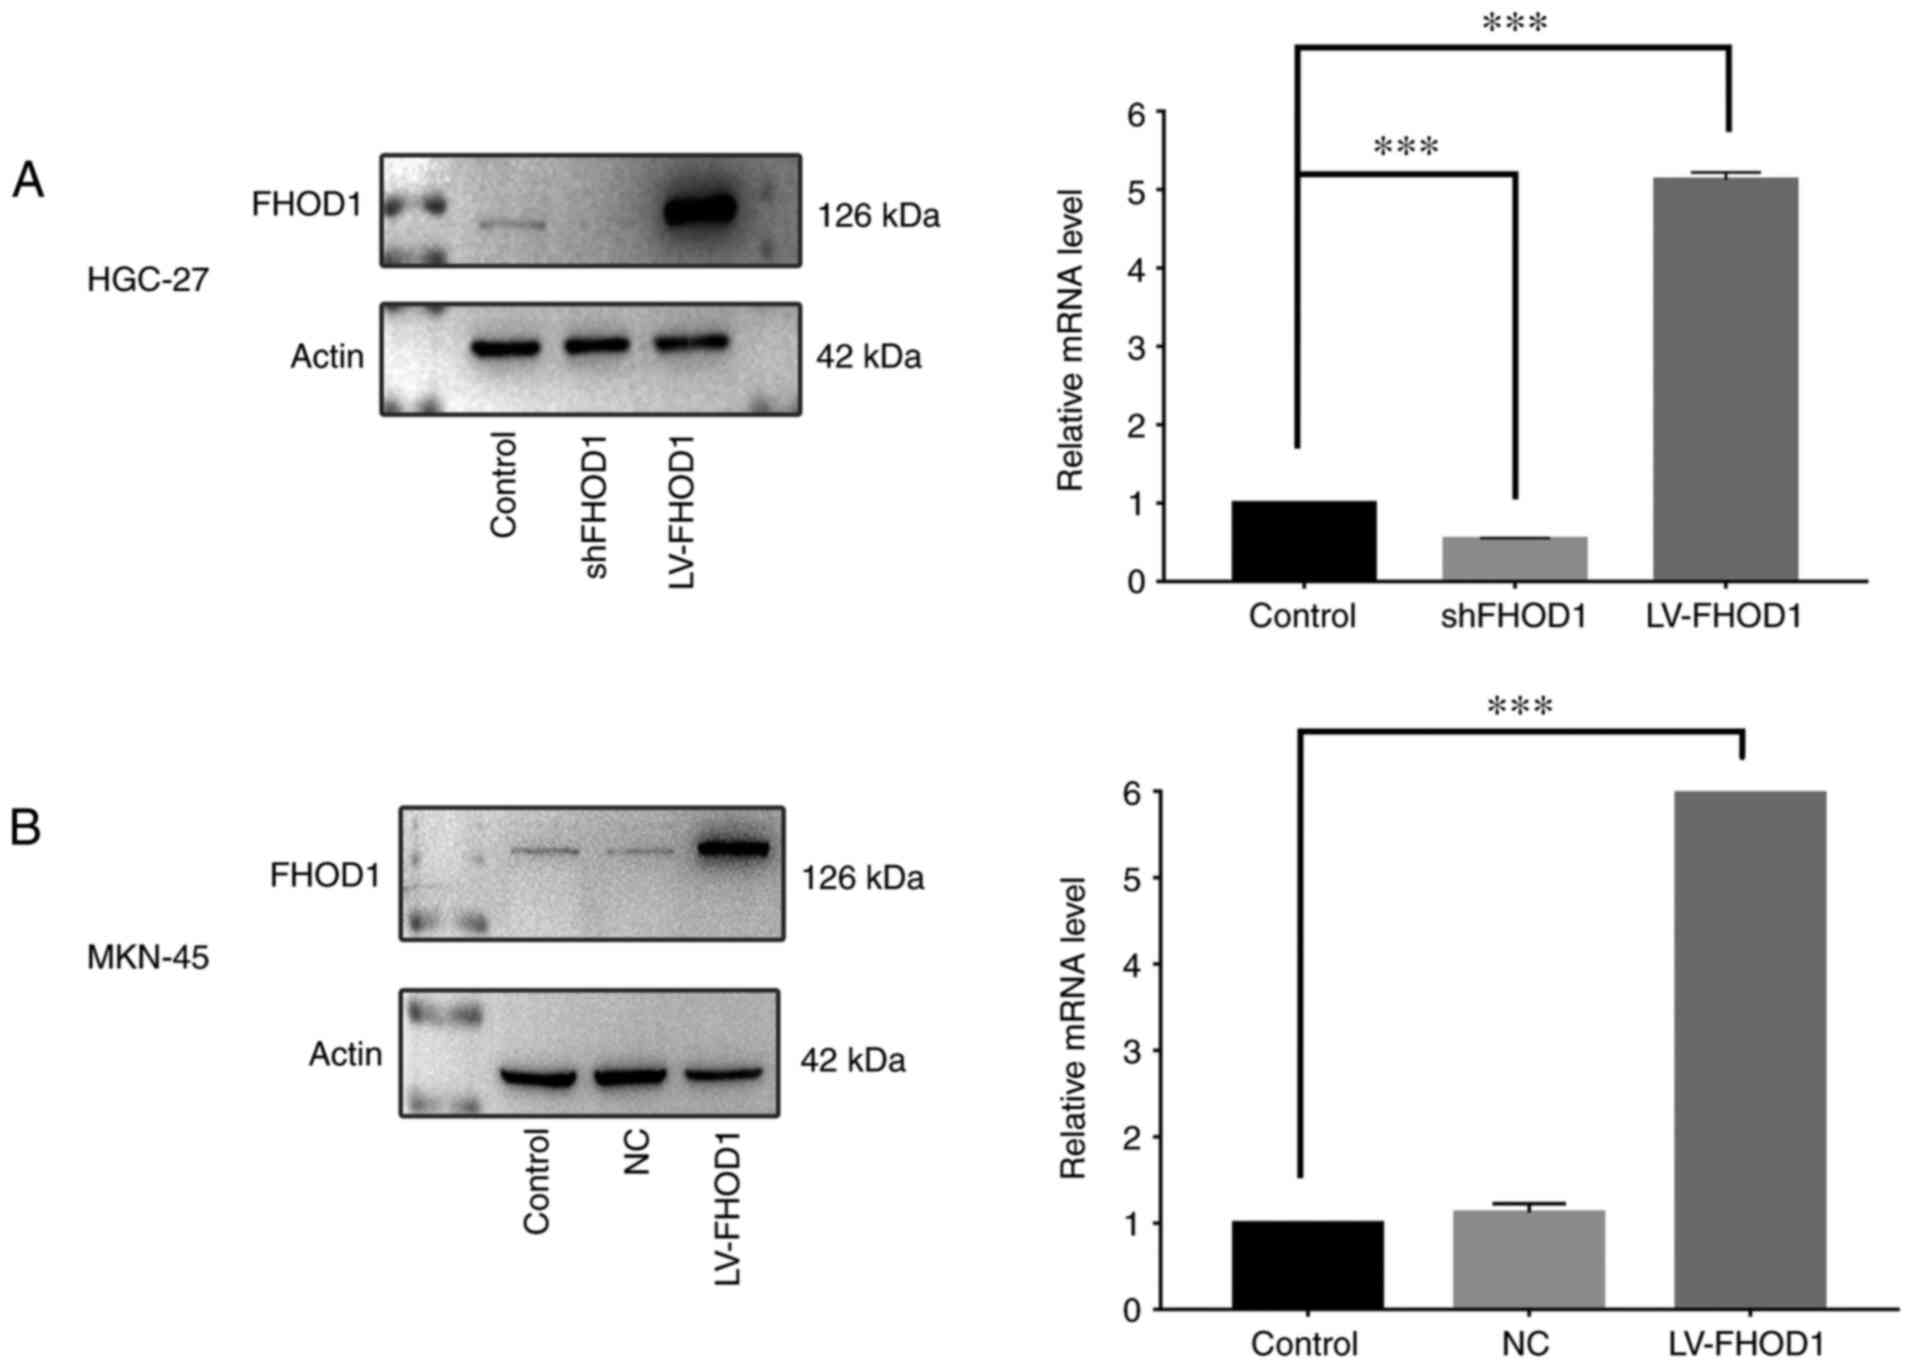
Efficiency of FHOD1 knockdown and
overexpression using lentivirus-mediated vectors in HGC27 and MKN45
cells
RT-qPCR was performed to detect FHOD1 expression and
the transfection efficiency in human GC HGC-27 and MKN45 cells. In
both cell lines, FHOD1 was moderately expressed, indicating that
these two cell lines were suitable for FHOD1 knockdown and
overexpression. Lentivirus-mediated shFHOD1 and LV-FHOD1 were
designed and used to infect HGC-27 and MKN45 cells. The results
demonstrated that FHOD1 mRNA expression in the shFHOD1 group in
HGC-27 cells was 50% lower compared with that in the untransfected
group, and the FHOD1 mRNA expression in the LV-FHOD1 group was
5-fold higher compared with that in the untransfected group
(Fig. 3A). In MKN45 cells, FHOD1
expression in the negative control group (transfected with control
vector) was similar to the untransfected group, while FHOD1
expression in the LV-FHOD1 group was 5.5-fold higher compared with
that in the untransfected cells (Fig.
3B). Furthermore, data from western blotting supported the
findings from RT-qPCR (Fig. 3A and
B).
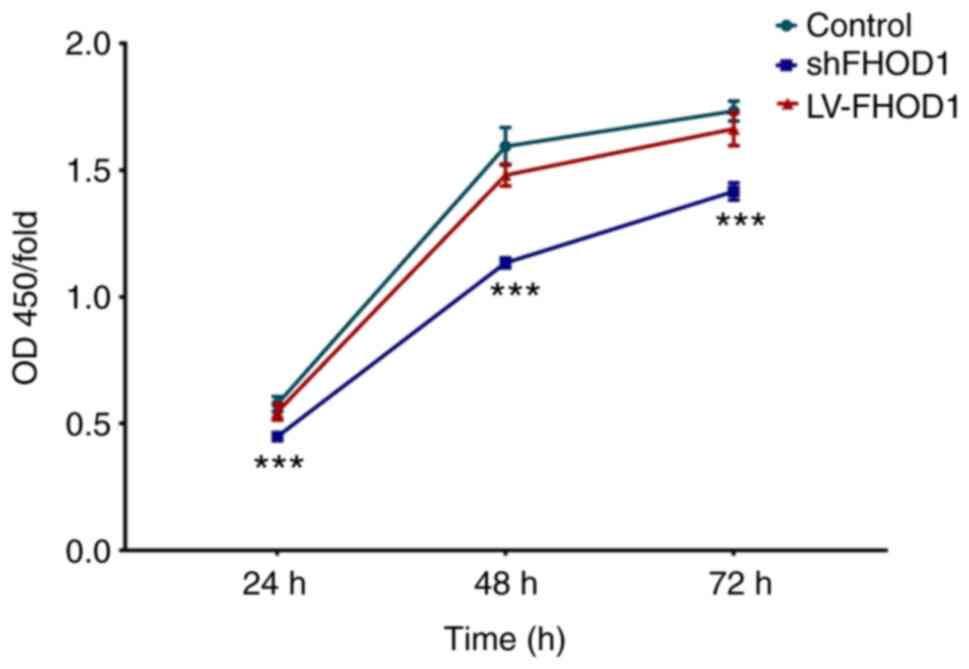
Effect of FHOD1 knockdown or
overexpression on the proliferation of GC cells
In order to examine the possible change in cell
proliferation according to FHOD1 expression, certain assays were
performed to evaluate the cell proliferation, cell cycle and colony
formation.
In the CCK-8 cell proliferation assay, knockdown of
FHOD1 induced a significant inhibitory effect on GC cell
proliferation at 24, 48 and 72 h (P<0.001; Fig. 4).
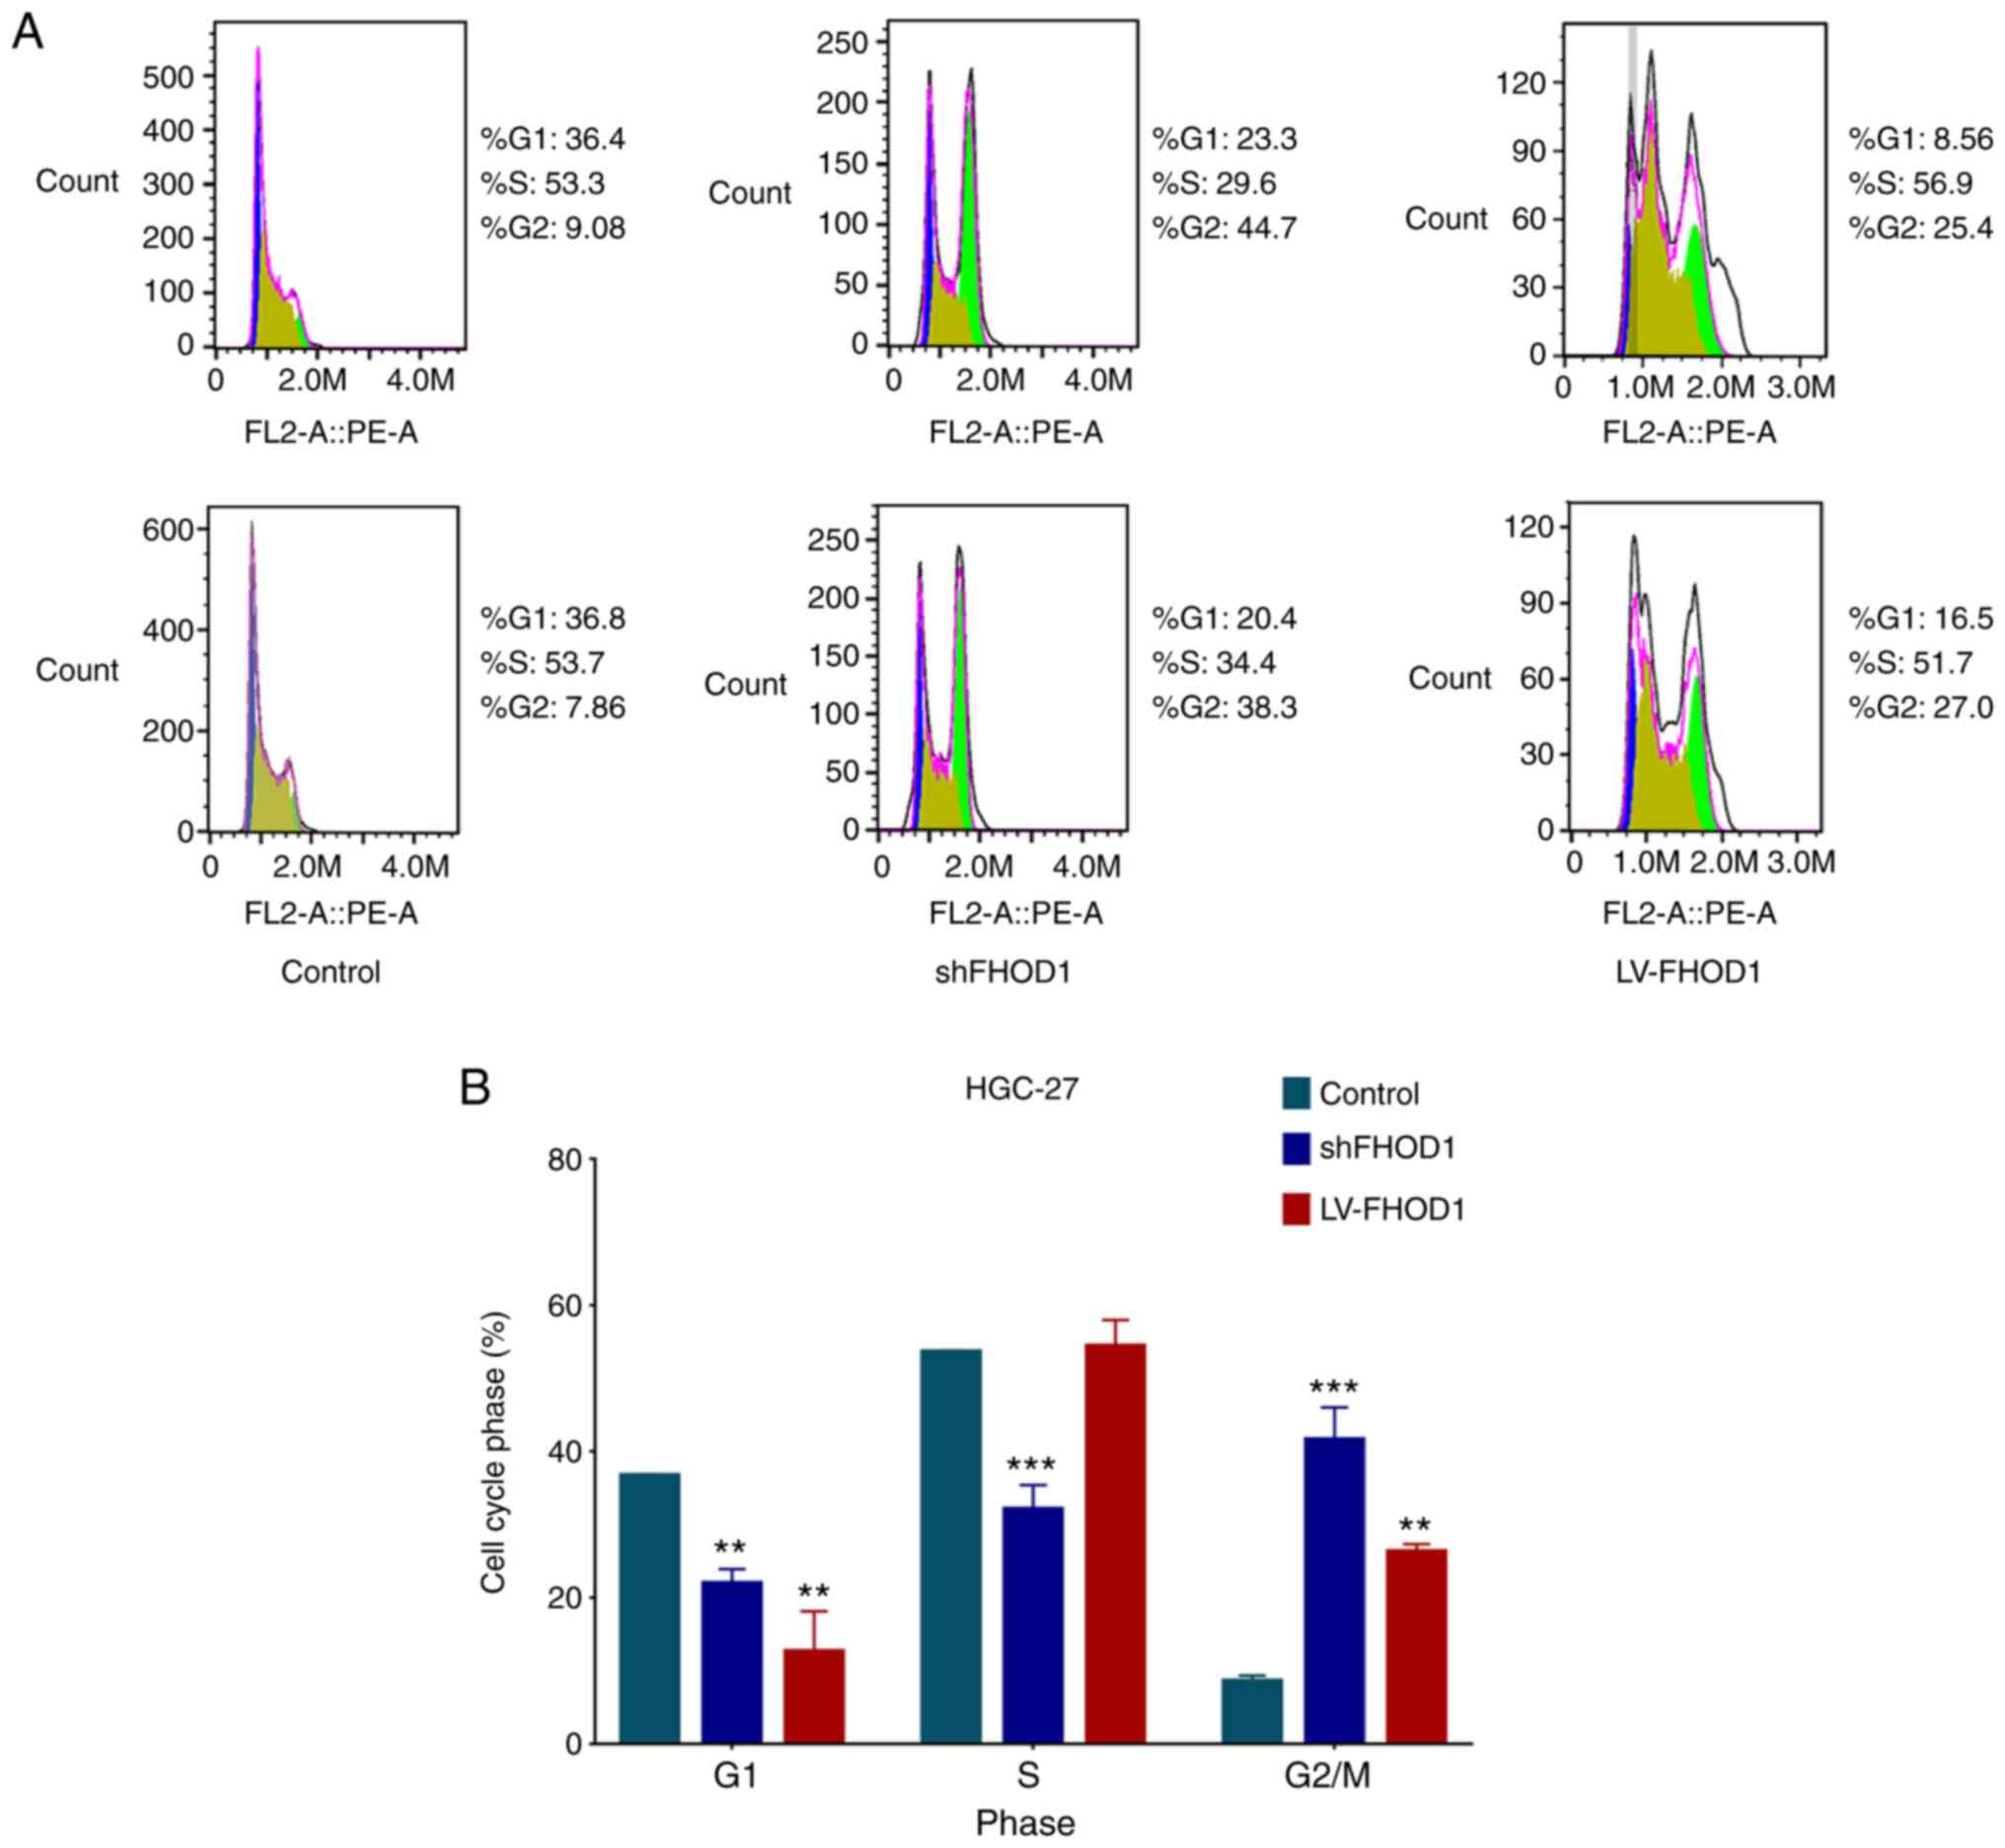
Cell cycle was analyzed via flow cytometry in
transfected and control GC cells. As presented in Fig. 5, the G1-S phase transition
in the cell cycle was inhibited, the S ratio was significantly
decreased, and the G2/M ratio was significantly
increased in HGC-27 cells following FHOD1 knockdown compared with
control cells. Furthermore, the G1 ratio was
significantly reduced, and the G2/M ratio was
significantly increased in HGC-27 cells overexpressing FHOD1. These
results indicated that the knockdown and overexpression of FHOD1
could affect the cell cycle of HGC-27 cells, primarily by affecting
the G1-S phase transition and causing G2/M
arrest. It is known that G1-S transition and
G2/M arrest are associated with the oncogenic process
(20).
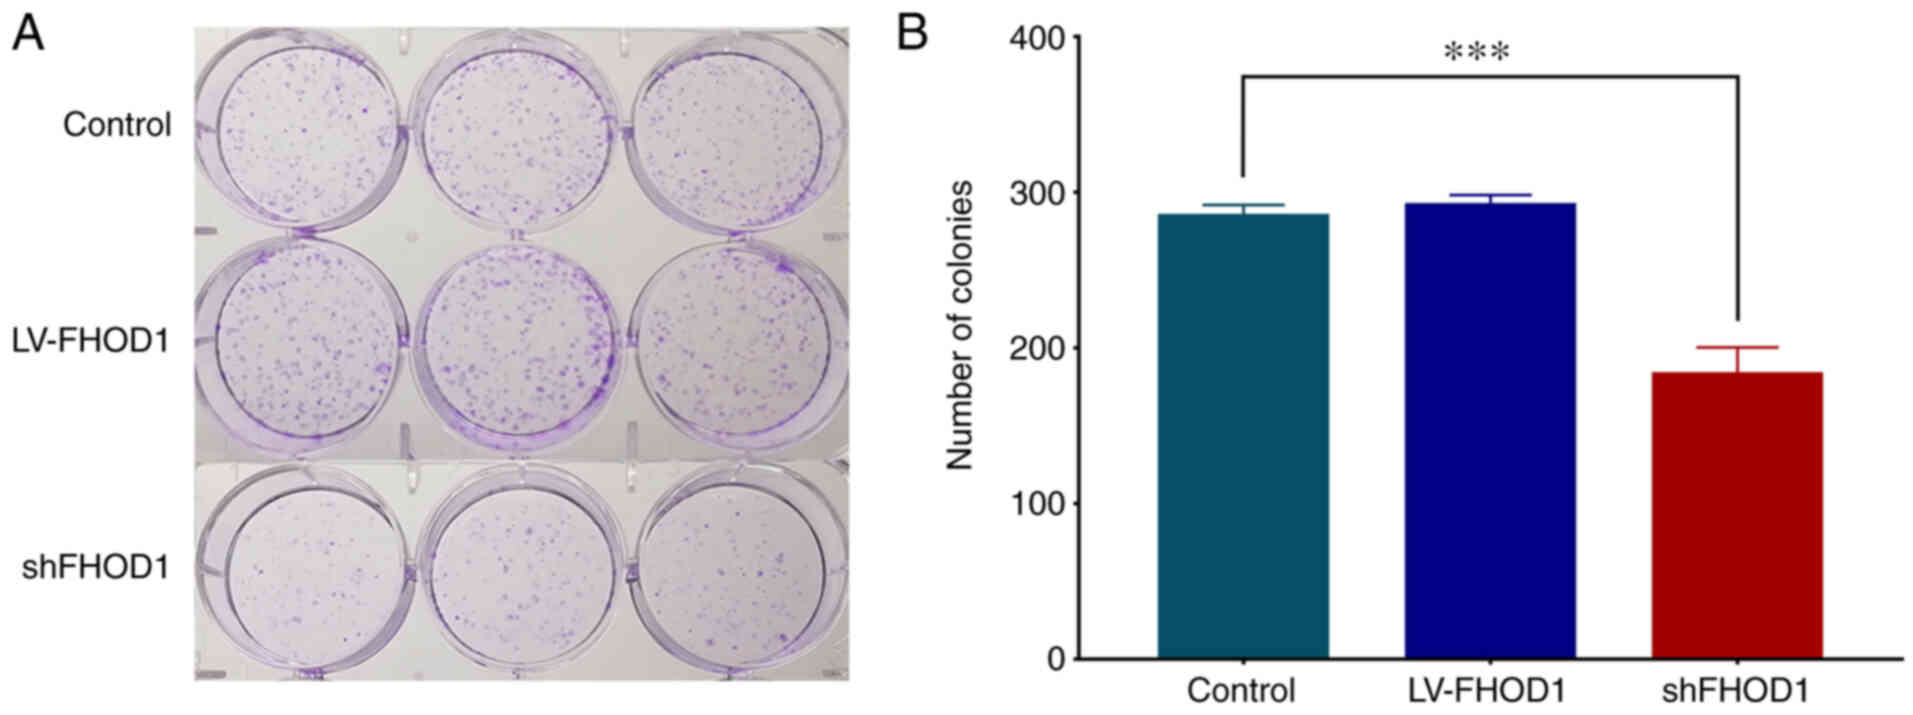
Subsequently, a colony formation experiment was
performed (Fig. 6) and the results
demonstrated that FHOD1 knockdown could significantly inhibit the
proliferation of HGC-27 compared with LV-FHOD1-transfected group
and the control cells. This finding suggested that FHOD1 knockdown
may significantly inhibit the proliferative ability of HGC-27 cells
(P<0.01).
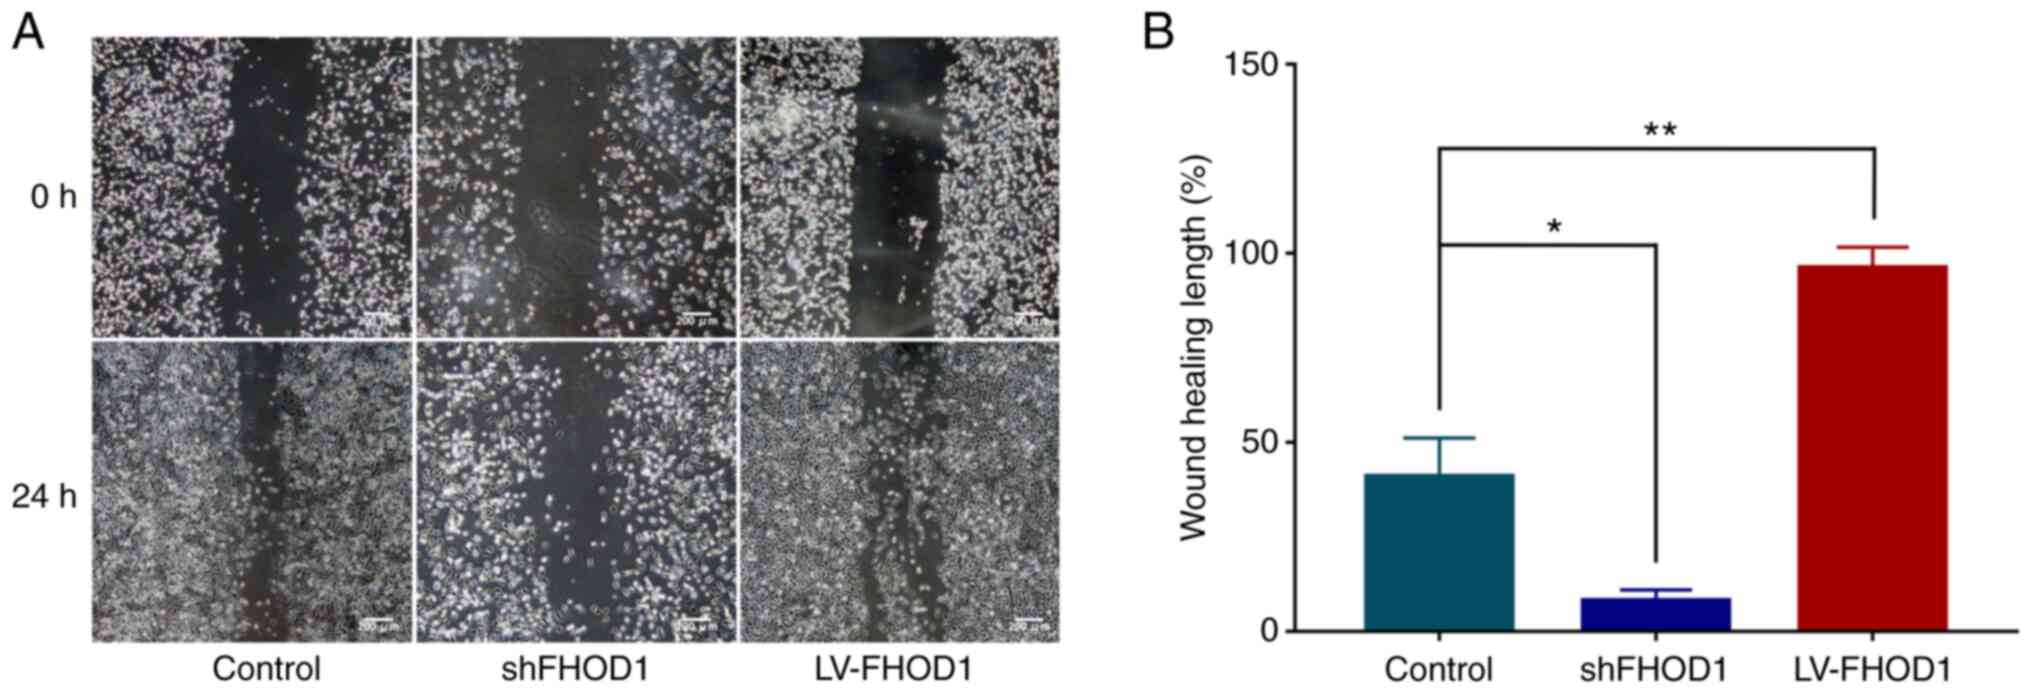
Effect of FHOD1 knockdown or
overexpression on the migratory ability of GC cells
The effects of FHOD1 knockdown and overexpression on
the migratory ability of GC cells were examined using a cell wound
scratch assay. As presented in Fig. 7A
and B, the wound healing of FHOD1-knockdown HGC-27 cells was
significantly delayed compared with FHOD1-overexpressed cells and
non-transfected cells (Fig. 7A).
Conversely, the wound healing rate was significantly increased in
FHOD1-overexpressing cells (Fig.
7A).
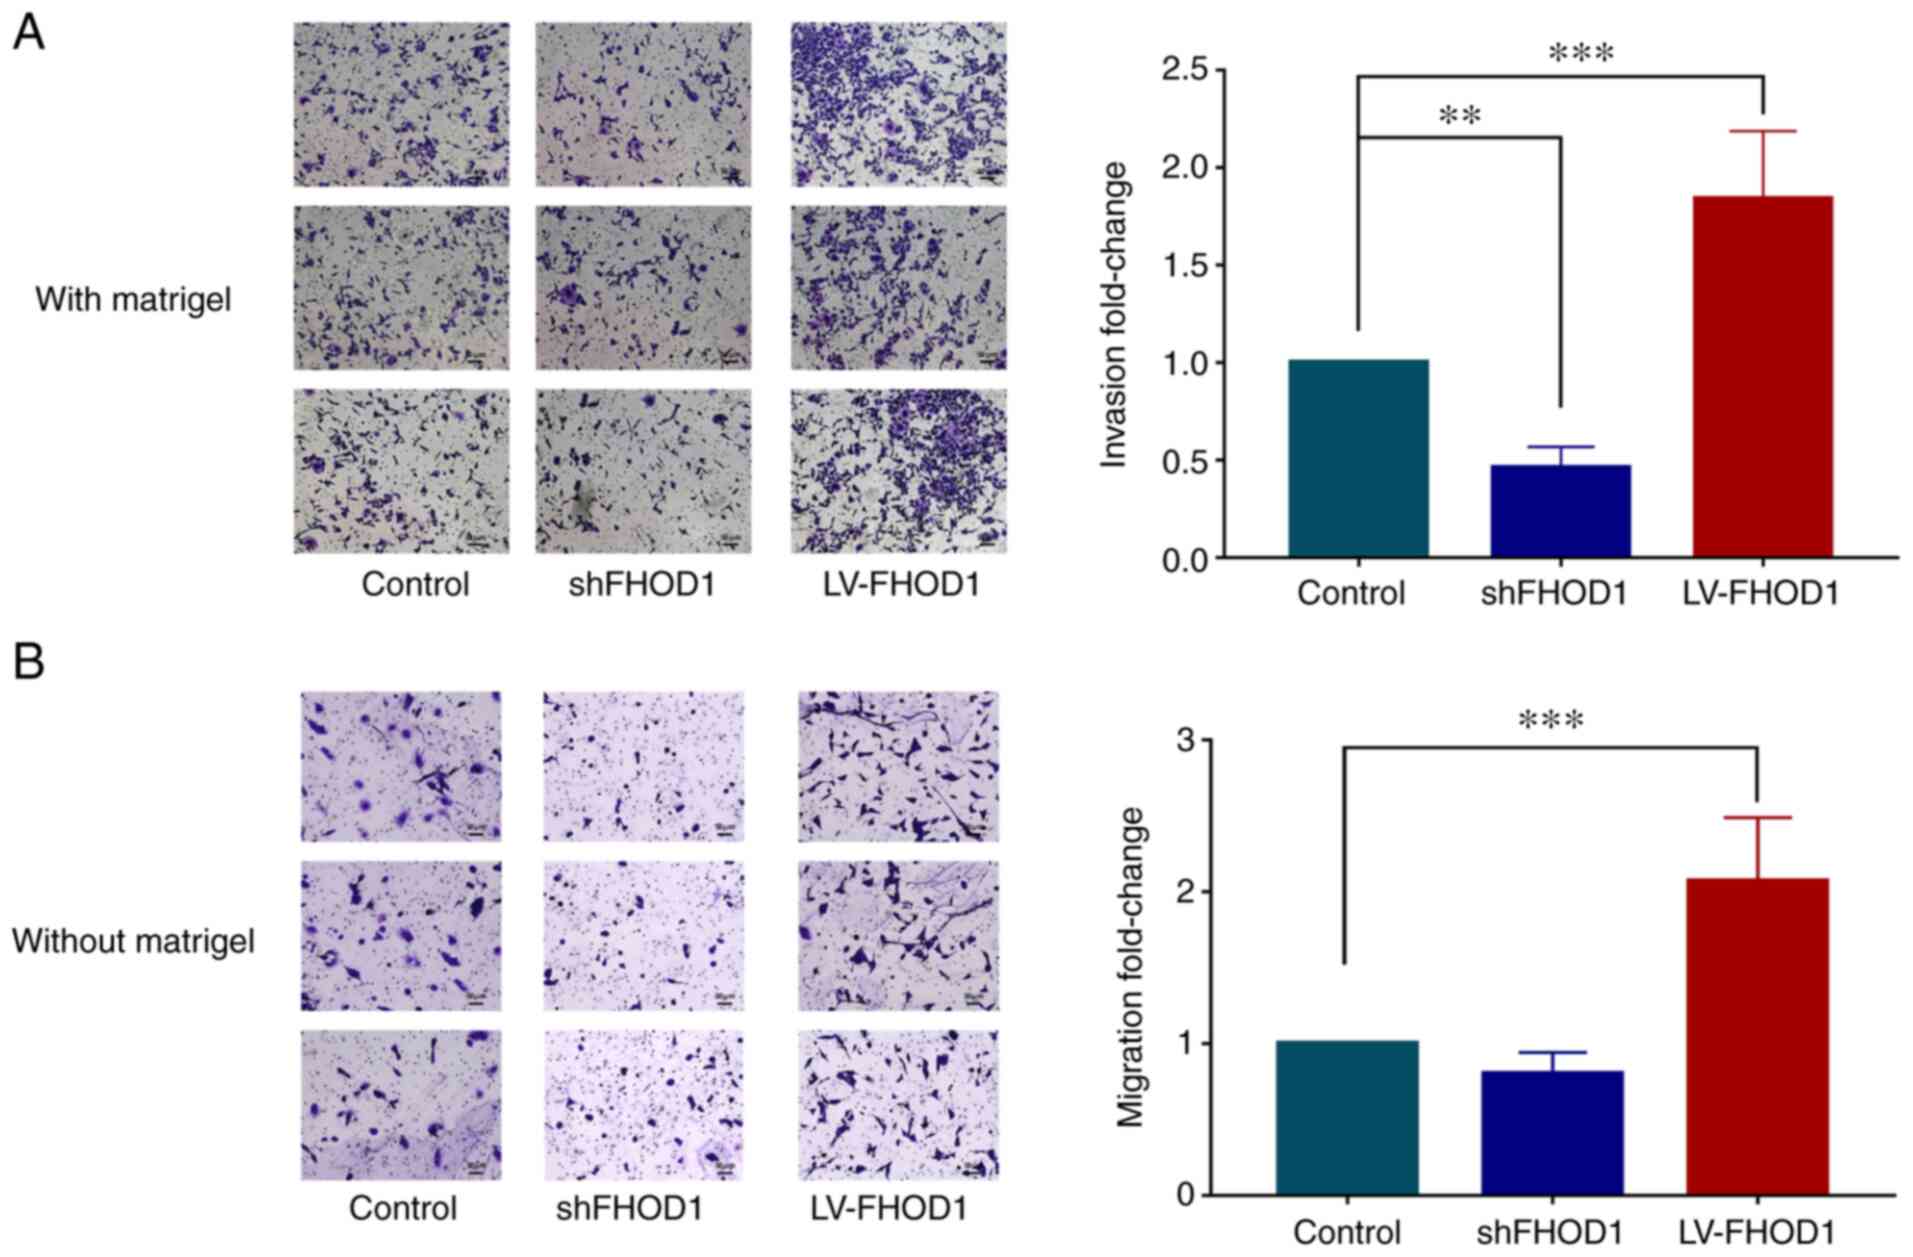
In vitro migratory and invasive
abilities
The results demonstrated that the invasive ability
of HGC-27 cells following FHOD1 knockdown was significantly
decreased compared with control group; however, it was
significantly increased after FHOD1 overexpression (Fig. 8A). In addition, knockdown of FHOD1
notably inhibited the migratory ability of HGC-27 cells compared
with the control cells; however, it was significantly increased
after FHOD1 overexpression (Fig.
8B).
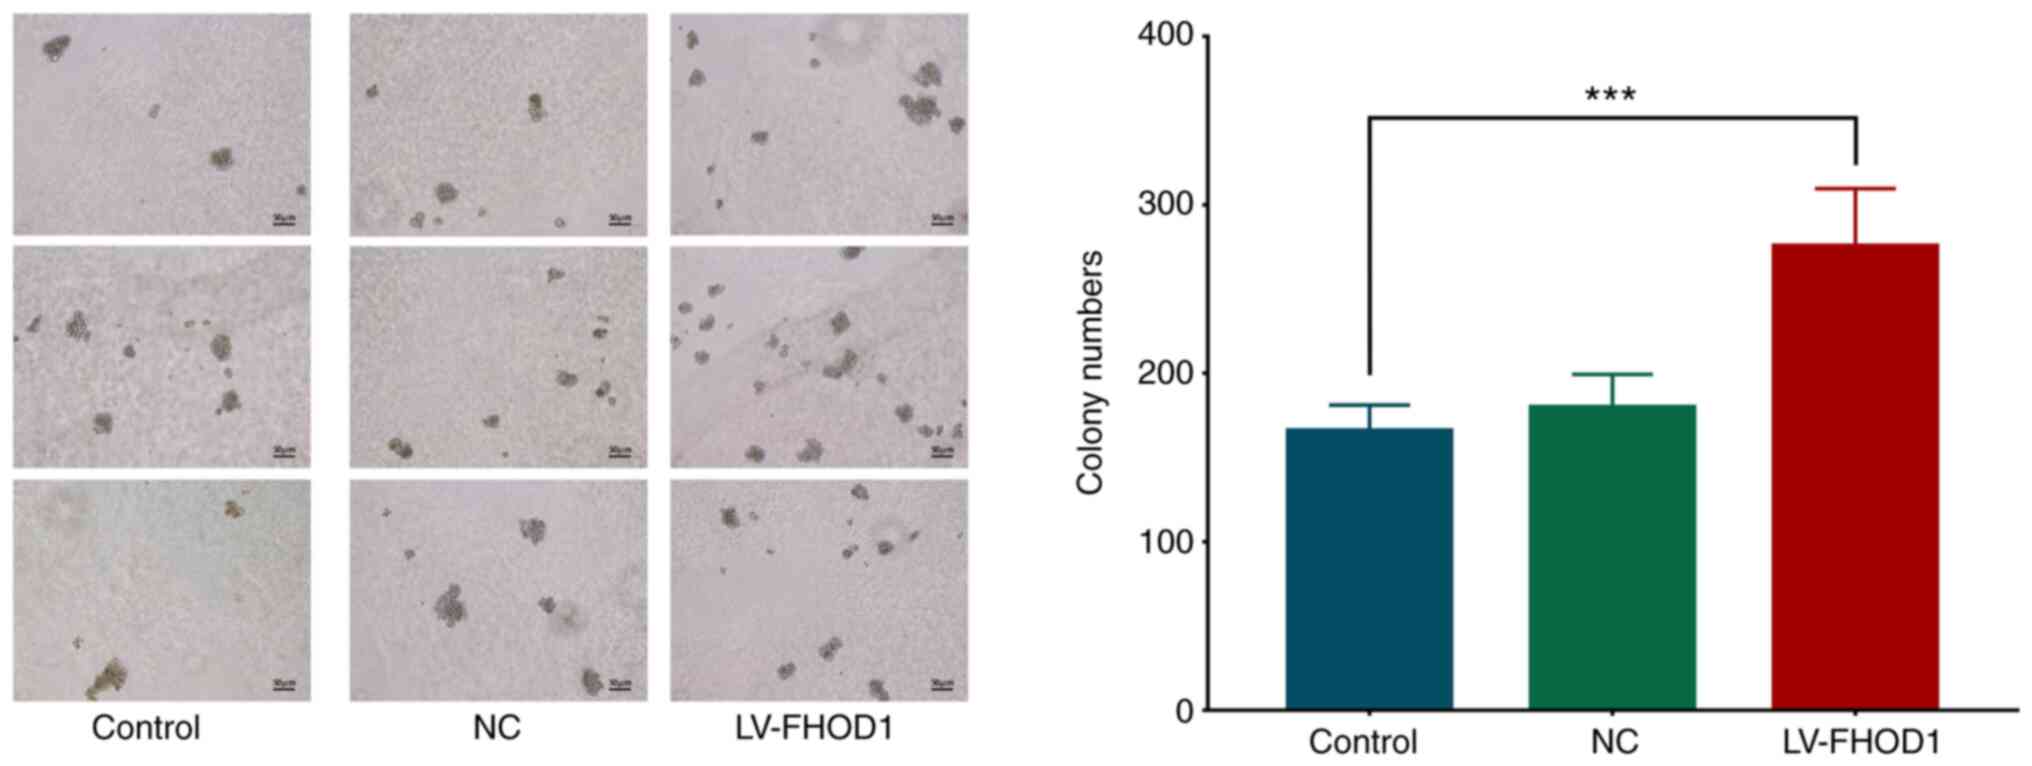
FHOD1 promotes the proliferation of
MKN45 cells
The results from soft agar colony formation assay
results demonstrated that the number of colonies 14 days after
FHOD1 overexpression was significantly higher compared with that of
the empty vector and untransfected HGC-27 cells (Fig. 9).
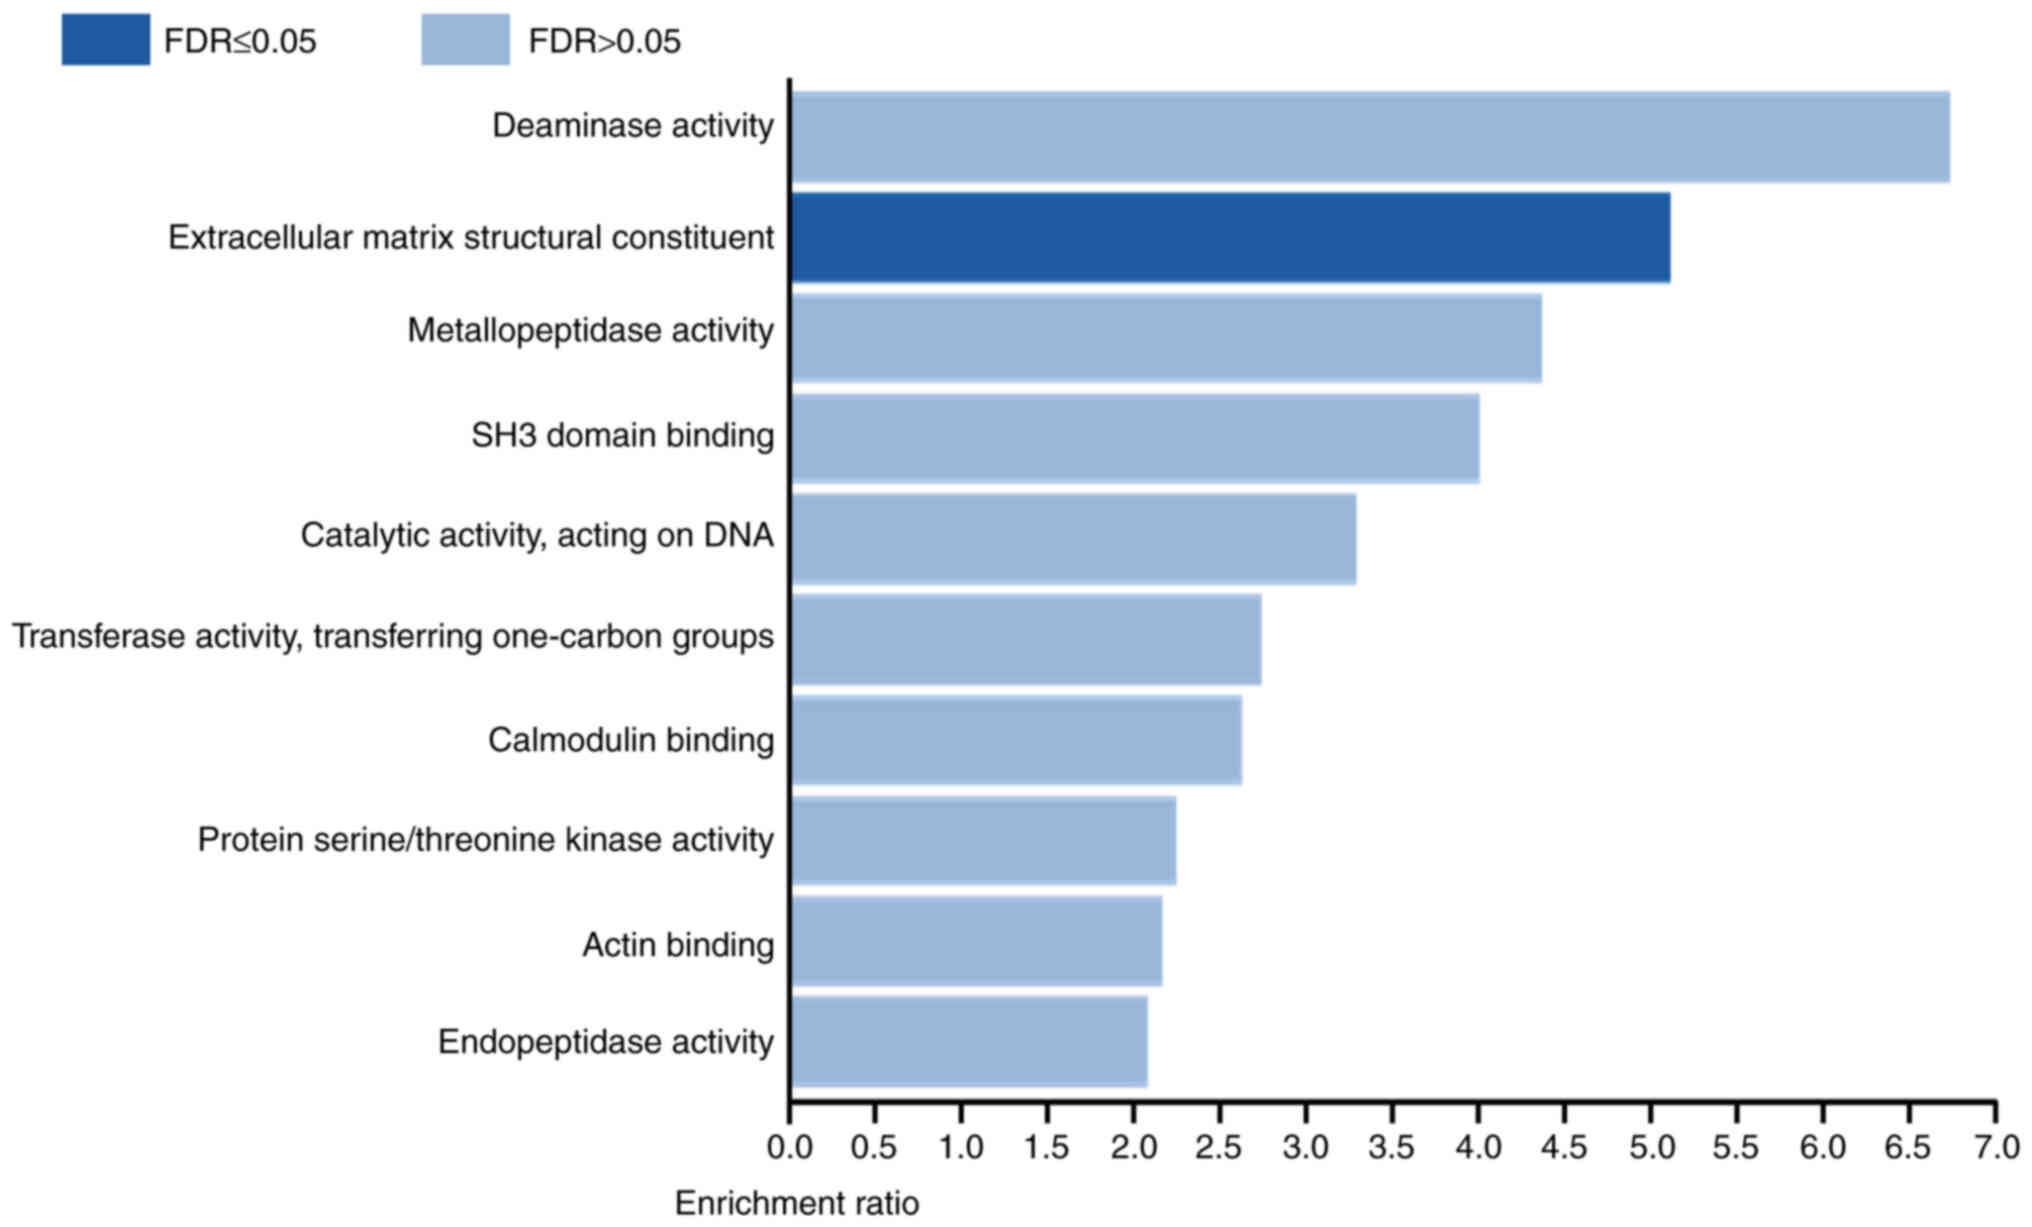
Genes positively co-expressed with
FHOD1 are enriched in the molecular function of extracellular
matrix (ECM) structural constituent
To understand the role of FHOD1, co-expression
analysis was performed in TCGA stomach adenocarcinoma data using
cBioPortal. It was demonstrated that the expression levels of 159
genes were positively correlated, while the expression levels of 75
genes were negatively correlated with the expression level of FHOD1
(|r|≥0.25; adjusted P<1.00×10⁻⁴; Table SI). Subsequently, functional
enrichment analysis of the genes co-expressed with FHOD1 was
conducted using WebGestalt. The results demonstrated that genes
which expression levels were positively correlated with FHOD1 were
enriched in the Gene Ontology term ‘Extracellular matrix structural
constituent’, which contributes to the structural integrity
of the ECM (Fig. 10). No functional
enrichment was identified for genes negatively correlated with
FHOD1. These results suggested that FHOD1 may contribute to GC
development and progression by regulating the structural integrity
of the ECM.
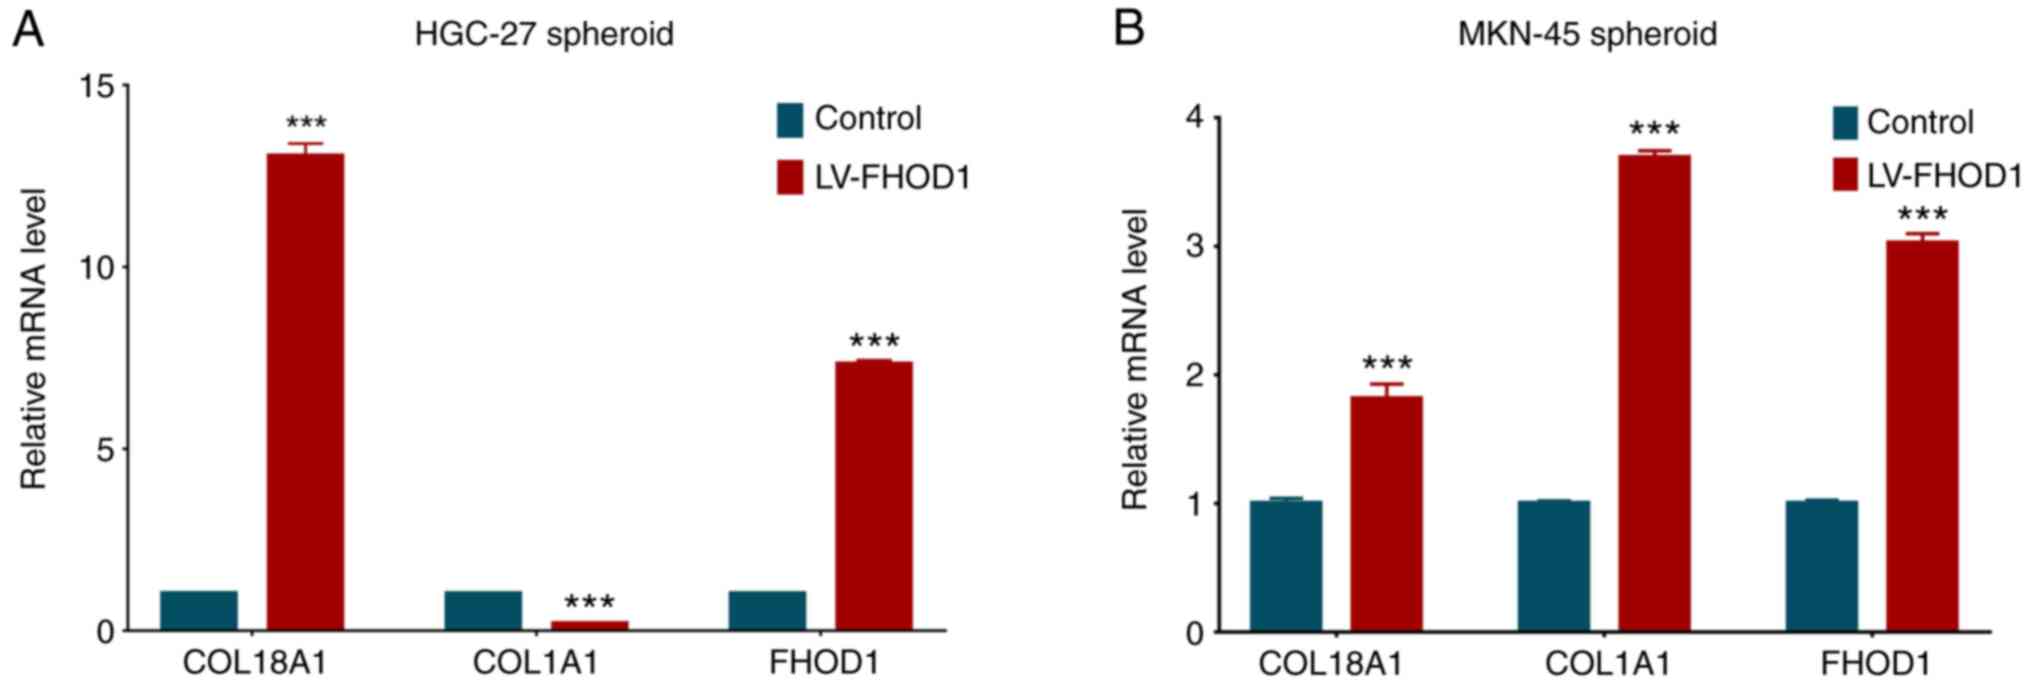
ECM-related gene expression is
regulated by FHOD1 in a 3D spheroid culture
To determine whether FHOD1 regulates the expression
of ECM-related genes, such as COL1A1 and COL18A1, which were found
to be positively correlated with FHOD1 expression in GC following
bioinformatics analysis, HGC-27 and MKN45 cells overexpressing
FHOD1 were cultured in vitro to form spheroids and total RNA
was extracted. The expression levels of COL1A1 and COL18A1, along
with FHOD1, were measured by RT-qPCR. As presented in Fig. 11, FHOD1 overexpression significantly
increased the expression of COL18A1 in both cell lines, while FHOD1
overexpression only significantly upregulated COL1A1 in MKN45
cells. These results suggested that FHOD1 may regulate the
expression of ECM-related genes to ensure the structural integrity
of the ECM.
Discussion
The development of GC is considered as a
multifactorial process involving cell proliferation, tumor growth,
ECM degradation, cell adhesion and motility, and angiogenesis
(21–25). The regulation of these cellular
processes involves oncogenes and tumor suppressor genes, and their
corresponding encoded products and pathways. The present study
aimed, therefore, to investigate the biological role of FHOD1 in
human GC cells.
FHOD1 is a member of the formin family. Formins are
highly conserved actin nucleating proteins found in all eukaryotic
cells. The activity of formins is regulated by Rho GTPases, which
are molecular switched that reshape the cytoskeleton in different
intercellular spaces (13,14). Rho GTPases serve a unique role in
controlling the assembly of stress fibers, the formation of
adhesion foci and the movement pattern of cancer cells (26,27).
Gardberg et al (28) reported
that FHOD1 is upregulated in the oral squamous cell carcinoma,
which affects the morphological and functional characteristics of
EMT, including actin tissue remodeling, cell migration and the
capability to degrade ECM. It has been demonstrated that FHOD1 may
mediate the changes and migration characteristics of the
cytoskeleton during cancer-related EMT in triple-negative breast
cancer and oral squamous cell carcinoma (28–30).
FHOD1 was reported to be involved in early cell migration or
invasion and is upregulated in clinical tumor tissues of basal-like
breast cancer (25). In addition,
FHOD1 is overexpressed in glioblastoma and melanoma tissues, and is
also involved in increased migration and invasion of HGC-27 in
vitro (11,31). However, to the best of our knowledge,
the expression of FHOD1 in human GC tissues is unknown.
In the present study, the analysis of TCGA
transcriptome data and results from IHC on GC human samples
demonstrated that FHOD1 expression levels were significantly
upregulated in GC tissues compared with normal tissues.
Furthermore, the high expression level of FHOD1 was significantly
associated with the poor prognosis of patients with GC. These
findings suggested that FHOD1 may serve an important biological
role in the progression of the GC.
Because the role of FHOD1 has not yet been reported
in human GC, the present study investigated the effects of FHOD1
knockdown or overexpression on certain important cellular processes
in two gastric cancer cell lines. The results indicated that cell
proliferation was inhibited following FHOD1 knockdown in HGC-27
cells. Furthermore, after FHOD1 knockdown, the cell cycle was
blocked. Conversely, FHOD1 overexpression in HGC-27 cells promoted
soft-agar colony formation, migration and invasion, but did not
affect proliferation. The same results were verified in MKN45 GC
cells overexpressing FHOD1. Previous studies have demonstrated that
FHOD1 serves a critical role in the structural and functional
changes of microfilaments, which is necessary for the
transformation of the cell phenotype from epithelial to mesenchymal
(28–30). The findings from the present study
were consistent with these previous studies, suggesting that FHOD1
may serve a role in GC progression, although it may not regulate
cell proliferation.
It has been reported that serum response element
(SRE) can be activated by FHOD1 via its effect on the actin
cytoskeleton in melanoma cells (31). Deletion of FHOD1 decreases SRE
transcription, resulting in cell cycle arrest and decreased cell
proliferation (8,9). In the present study, the role of FHOD1
was also evaluated using migration and invasion assays. The cell
migratory and invasive abilities were significantly decreased in
HGC-27 cells after FHOD1-shRNA transfection and were significantly
higher in the LV-FHOD1 group compared with the control. As MKN45
cells possess the characteristic of semi-suspension in culture,
these cells were not suitable for certain assays, such as cell
wound scratch, colony formation and Transwell invasion assays.
However, since MKN45 cells can float in soft agar, they were used
for soft agar-based proliferation experiment. Taken together, the
present findings suggested that FHOD1 may regulate the
proliferation, migration and invasion of GC cells in
vitro.
The current study presented certain limitations. All
experiments were performed using only two GC cell lines. The
findings obtained should therefore be verified using additional GC
cell lines and normal gastric cell lines in future studies.
Furthermore, the tumorigenic effect and tumor-promoting mechanism
of FHOD1 will be further verified using genetic manipulation-based
approaches to determine whether collagen genes, such as COL1A1 and
COL18A1, serve an important role in FHOD1-related gastric
tumorigenesis using appropriate model systems. For example, a
further study will investigate whether restoration of COL18A1
expression in FHOD1-knockdown cells could rescue their tumorigenic
phenotype, and whether COL18A1 knockdown in FHOD1-overexpressing
cells decrease tumorigenicity. Using the correct model systems is
therefore crucial to investigate the impact of ECM-related
functions on tumorigenesis.
In conclusion, the present study demonstrated that
FHOD1 was upregulated in GC tissues compared with adjacent normal
tissues, and that FHOD1 expression was associated with a poorer
overall survival in patients with GC. In human GC cells, FHOD1
knockdown and overexpression could modulate the cell proliferation,
migration and invasion in vitro. The co-expression and
functional enrichment analyses revealed that genes which expression
levels were correlated with FHOD1 were enriched in the GO term of
the ‘Extracellular matrix structural constituent’, suggesting that
FHOD1 may serve a role in the regulation of ECM structural
integrity. Although the underlying mechanisms remain unknown, the
results from the present study suggested that FHOD1 may serve an
important role in the occurrence and development of GC and may
therefore be considered as a potential target for the treatment of
GC.
Supplementary Material
Supporting Data
Acknowledgements
Not applicable.
Funding
The present study was supported by the National
Natural Science Foundation of China (grant no. 81802388) and the
Natural Science Foundation from the Department of Science and
Technology of Jiangsu Province (grant no. BK20180120).
Availability of data and materials
The datasets used and/or analyzed during the present
study are available from the corresponding author on reasonable
request.
Authors' contributions
PW designed the experiments and analyzed data. CJ
and BY performed the experiments and wrote the manuscript. XZ was
responsible for data analysis and manuscript revision. JHM and BH
analyzed data and edited the manuscript. XZ and PW confirm the
authenticity of all the raw data. All authors read and approved the
final manuscript.
Ethics approval and consent to
participate
Not applicable.
Patient consent for publication
Not applicable.
Competing interests
The authors declare that they have no competing
interests.
References
|
1
|
Bray F, Ferlay J, Soerjomataram I, Siegel
RL, Torre LA and Jemal A: Global cancer statistics 2018: GLOBOCAN
estimates of incidence and mortality worldwide for 36 cancers in
185 countries. CA Cancer J Clin. 68:394–424. 2018. View Article : Google Scholar : PubMed/NCBI
|
|
2
|
Global Burden of Disease Cancer
Collaboration, ; Fitzmaurice C, Dicker D, Pain A, Hamavid H,
Moradi-Lakeh M, MacIntyre MF, Allen C, Hansen G, Woodbrook R, et
al: The global burden of cancer 2013. JAMA Oncol. 1:505–527. 2015.
View Article : Google Scholar : PubMed/NCBI
|
|
3
|
International Agency for Research on
Cancer (IARC), . Cancer Fact Sheets, Digestive organs. IARC; Lyon:
2020, https://gco.iarc.fr/today/fact-sheets-cancerDecember.
2020
|
|
4
|
National Cancer Institute (NIH), . Cancer
Stat Facts: Stomach cancer. NIH; Bethesda, MD: 2021, https://seer.cancer.gov/statfacts/html/stomach.html
|
|
5
|
Bevan S and Houlston RS: Genetic
predisposition to gastric cancer. QJM. 92:5–10. 1999. View Article : Google Scholar : PubMed/NCBI
|
|
6
|
Ushijima T and Sasako M: Focus on gastric
cancer. Cancer Cell. 5:121–125. 2004. View Article : Google Scholar : PubMed/NCBI
|
|
7
|
Wang P, Wang Y, Hang B, Zou X and Mao JH:
A novel gene expression-based prognostic scoring system to predict
survival in gastric cancer. Oncotarget. 7:55343–55351. 2016.
View Article : Google Scholar : PubMed/NCBI
|
|
8
|
Cui J, Li F, Wang G, Fang X, Puett JD and
Xu Y: Gene-expression signatures can distinguish gastric cancer
grades and stages. PLoS One. 6:e178192011. View Article : Google Scholar : PubMed/NCBI
|
|
9
|
Mattioni M, Soddu S, Porrello A,
D'Alessandro R, Spila A and Guadagni F: Serum anti-p53 antibodies
as a useful marker for prognosis of gastric carcinoma. Int J Biol
Markers. 22:302–306. 2007. View Article : Google Scholar : PubMed/NCBI
|
|
10
|
Takeno A, Takemasa I, Doki Y, Yamasaki M,
Miyata H, Takiguchi S, Fujiwara Y, Matsubara K and Monden M:
Integrative approach for differentially overexpressed genes in
gastric cancer by combining large-scale gene expression profiling
and network analysis. Br J Cancer. 99:1307–1315. 2008. View Article : Google Scholar : PubMed/NCBI
|
|
11
|
Heuser VD, Kiviniemi A, Lehtinen L, Munthe
S, Kristensen BW, Posti JP, Sipilä JOT, Vuorinen V, Carpén O and
Gardberg M: Multiple formin proteins participate in glioblastoma
migration. BMC Cancer. 20:7102020. View Article : Google Scholar : PubMed/NCBI
|
|
12
|
Zhao S, Cai J, Zhang X, Cui J and Jiu Y:
Different formins restrict localization of distinct tropomyosins on
dorsal stress fibers in osteosarcoma cells. Cytoskeleton (Hoboken).
77:16–24. 2020. View
Article : Google Scholar : PubMed/NCBI
|
|
13
|
Alvarez DE and Agaisse H: A role for the
small GTPase Rac1 in vaccinia actin-based motility. Small GTPases.
6:119–122. 2015. View Article : Google Scholar : PubMed/NCBI
|
|
14
|
Schulte A, Stolp B, Schönichen A,
Pylypenko O, Rak A, Fackler OT and Geyer M: The human formin FHOD1
contains a bipartite structure of FH3 and GTPase-binding domains
required for activation. Structure. 16:1313–1323. 2008. View Article : Google Scholar : PubMed/NCBI
|
|
15
|
Heuser VD, Mansuri N, Mogg J, Kurki S,
Repo H, Kronqvist P, Carpén O and Gardberg M: Formin proteins FHOD1
and INF2 in triple-negative breast cancer: Association with basal
markers and functional activities. Breast Cancer (Auckl).
12:11782234187922472018.PubMed/NCBI
|
|
16
|
Sun BO, Fang Y, Li Z, Chen Z and Xiang J:
Role of cellular cytoskeleton in epithelial-mesenchymal transition
process during cancer progression. Biomed Rep. 3:603–610. 2015.
View Article : Google Scholar : PubMed/NCBI
|
|
17
|
Li DJ, Feng ZC, Li XR and Hu G:
Involvement of methylation-associated silencing of formin 2 in
colorectal carcinogenesis. World J Gastroenterol. 24:5013–5024.
2018. View Article : Google Scholar : PubMed/NCBI
|
|
18
|
Zhu L, Wang H, Jiang C, Li W, Zhai S, Cai
X, Wang X, Liao L, Tao F, Jin D, et al: Clinically applicable
53-Gene prognostic assay predicts chemotherapy benefit in gastric
cancer: A multicenter study. EBioMedicine. 61:1030232020.
View Article : Google Scholar : PubMed/NCBI
|
|
19
|
Livak KJ and Schmittgen TD: Analysis of
relative gene expression data using real-time quantitative PCR and
the 2(-Delta Delta C(T)) method. Methods. 25:402–408. 2001.
View Article : Google Scholar : PubMed/NCBI
|
|
20
|
Bertoli C, Skotheim JM and de Bruin RA:
Control of cell cycle transcription during G1 and S phases. Nat Rev
Mol Cell Biol. 14:518–528. 2013. View
Article : Google Scholar : PubMed/NCBI
|
|
21
|
Zhang H, Wang Y, Wang Y, Wu D, Lin E and
Xia Q: Intratumoral and intertumoral heterogeneity of HER2
immunohistochemical expression in gastric cancer. Pathol Res Pract.
216:1532292020. View Article : Google Scholar : PubMed/NCBI
|
|
22
|
Dai J, Peng T and Yu X: NK6 homeobox 2
regulated gastrokin-2 suppresses gastric cancer cell proliferation
and invasion via Akt signaling pathway. Cell Biochem Biophys.
79:123–131. 2021. View Article : Google Scholar : PubMed/NCBI
|
|
23
|
Han X, Zhang HB, Li XD and Wang ZA: Long
non-coding RNA X-inactive-specific transcript contributes to
cisplatin resistance in gastric cancer by sponging miR-let-7b.
Anticancer Drugs. 31:1018–1025. 2020. View Article : Google Scholar : PubMed/NCBI
|
|
24
|
Gao N, Yang F, Chen S, Wan H, Zhao X and
Dong H: The role of TRPV1 ion channels in the suppression of
gastric cancer development. J Exp Clin Cancer Res. 39:2062020.
View Article : Google Scholar : PubMed/NCBI
|
|
25
|
Li Z, Gao H, Liu Y, Wu H, Li W, Xing Y,
Zhang Z and Zhang X: Genetic variants in the regulation region of
TLR4 reduce the gastric cancer susceptibility. Gene.
767:1451812021. View Article : Google Scholar : PubMed/NCBI
|
|
26
|
Jurmeister S, Baumann M, Balwierz A,
Keklikoglou I, Ward A, Uhlmann S, Zhang JD, Wiemann S and Sahin Ö:
MicroRNA-200c represses migration and invasion of breast cancer
cells by targeting actin-regulatory proteins FHOD1 and PPM1F. Mol
Cell Biol. 32:633–651. 2012. View Article : Google Scholar : PubMed/NCBI
|
|
27
|
Gasteier JE, Madrid R, Krautkrämer E,
Schröder S, Muranyi W, Benichou S and Fackler OT: Activation of the
Rac-binding partner FHOD1 induces actin stress fibers via a
ROCK-dependent mechanism. J Biol Chem. 278:38902–38912. 2003.
View Article : Google Scholar : PubMed/NCBI
|
|
28
|
Gardberg M, Kaipio K, Lehtinen L, Mikkonen
P, Heuser VD, Talvinen K, Iljin K, Kampf C, Uhlen M, Grénman R, et
al: FHOD1, a formin upregulated in epithelial-mesenchymal
transition, participates in cancer cell migration and invasion.
PLoS One. 8:e749232013. View Article : Google Scholar : PubMed/NCBI
|
|
29
|
Haraguchi T, Kondo M, Uchikawa R,
Kobayashi K, Hiramatsu H, Kobayashi K, Chit UW, Shimizu T and Iba
H: Dynamics and plasticity of the epithelial to mesenchymal
transition induced by miR-200 family inhibition. Sci Rep.
6:211172016. View Article : Google Scholar : PubMed/NCBI
|
|
30
|
Perdigão-Henriques R, Petrocca F,
Altschuler G, Thomas MP, Le MT, Tan SM, Hide W and Lieberman J:
miR-200 promotes the mesenchymal to epithelial transition by
suppressing multiple members of the Zeb2 and Snail1 transcriptional
repressor complexes. Oncogene. 35:158–172. 2016. View Article : Google Scholar : PubMed/NCBI
|
|
31
|
Peippo M, Gardberg M, Lamminen T, Kaipio
K, Carpén O and Heuser VD: FHOD1 formin is upregulated in melanomas
and modifies proliferation and tumor growth. Exp Cell Res.
350:267–278. 2017. View Article : Google Scholar : PubMed/NCBI
|