Introduction
It has been reported that gastric cancer (GC) is the
second leading cause of cancer-associated mortality worldwide
(1). Although extensive studies have
been conducted, few risk factors have been confirmed and there are
no effective biomarkers or screening tools for early detection in
asymptomatic individuals (2,3). Conventional tumor markers, such as CEA,
CA72-4 and CA19-9, are useful only for identifying cases of
advanced GC and monitoring GC recurrence (3). However, these serum markers lack
sufficient sensitivity and specificity (4). Currently, endoscopy and the barium meal
test are the main methods used for the clinical diagnosis of GC.
However, due to their invasiveness, patient compliance with this
procedure is poor (1). Chronic
inflammation is not an important cause of GC; however, it is
considered to be involved in the pathogenesis of 25% of all cancer
cases worldwide (5). Blood routine
parameters have been introduced as biomarkers for the diagnosis of
numerous cancer-related diseases associated with inflammatory
processes (6–10). However, to the best of our knowledge,
the longitudinal changes of these parameters in different stages of
GC progression have not been studied comprehensively at
present.
MicroRNAs (miRNAs/miRs) are members of the
endogenous, non-coding single-stranded RNA family, and are released
from tissues to extracellular biofluids after receiving
inflammatory stimulation (11).
Specific miRNAs, which have carcinogenic or tumor-suppressive
activities, may be mediators for inflammation to induce
carcinogenesis (12), and have been
detected in numerous types of cancer, including breast cancer,
hepatocellular carcinoma and other cancer types (13–15).
Numerous studies have demonstrated that non-invasive circulating
miRNA recognition is valuable and useful in diseases, including GC
(16,17). However, these studies have not
included patients with early stage GC (EGC) or patients with a
precancerous lesion (Pre), although an ideal non-invasive marker
should be able to identify both of these stages.
A recent study has reported that the combination of
miR-650 and CA211 can distinguish between benign and malignant GC
(18). Therefore, we hypothesized
that the combined assessment of miRNAs and blood routine parameters
may reveal novel insights for the diagnosis of GC. The present
study examined the circulating levels of miR-130b and blood routine
parameters in 90 patients with GC, 90 patients with a Pre and 45
healthy individuals. Subsequently, statistical analysis was
performed to compare the diagnostic value of these markers for GC.
The present study indicated that plasma miR-130b and complete blood
count parameters might be promising non-invasive biomarkers for the
early detection of GC, and combined utilization of these markers
could improve the efficacy of the early diagnosis of GC.
Materials and methods
Patients and healthy control
characteristics
The present study included 90 patients with GC, 90
patients with Pres and 45 healthy controls (NCs) who received
treatment at the Affiliated Liutie Central Hospital of Guangxi
Medical University (Liuzhou, China) between January 2014 and March
2019. Patients with GC and Pres were selected according to
gastroscopy combined with histological examination and the blood
samples were collected prior to any surgery and therapy. Patients
who had received radiation therapy or chemotherapy were excluded
from the study.
The histological type and tumor stage were
identified according to the Union of International Cancer Control
TNM system, 7th edition (19). The
histology of all patients was assessed according to World Health
Organization criteria (20). NCs had
no history of diabetes, heart disease, hypertension or cancer, and
attended the Affiliated Liutie Central Hospital of Guangxi Medical
University for routine health checks. Approval for the study was
obtained from the Ethics Committee of the Affiliated Liutie Central
Hospital of Guangxi Medical University, and written informed
consent was issued by all study participants.
Plasma preparation and miRNA
extraction
Peripheral blood samples were drawn using EDTA
anticoagulative tubes prior to surgical treatment. Cell-free plasma
samples were centrifuged at 1,520 × g for 5 min to prevent
contamination by cellular nucleic acids and stored at −80°C until
miRNA extraction or kept at −20°C for conventional tumor marker
determination.
RNA isolation and reverse
transcription-quantitative PCR (RT-qPCR) assay
Total RNA was isolated from 200 µl plasma using a
Blood (Serum/Plasma) MicroRNA Extraction and Purification kit (spin
column) (Novland Co., Ltd.; http://www.novland.com.cn/). The concentration of
total RNAs was quantified using a NanoQ micro-volume
Spectrophotometer (CapitalBio Technology, Inc.). Circulating
miRNA-130b expression was determined by RT-qPCR using a One Step
qRT-PCR Kit (with Taqman probes; catalog no. LK-0106B) with 2 µl
initial template, while miR-16 served as an internal control
(21). Thermocycling conditions were
45°C for 30 min for reverse transcription, then 94°C for 2 min,
followed by 40 cycles of 94°C for 15 sec, 55°C for 45 sec and 72°C
for 60 sec. RT-qPCR was performed on an ABI 7500 Real-Time PCR
System (Applied Biosystems; Thermo Fisher Scientific, Inc.). The
primer sequences for PCR were as follows: miR-130b forward,
5′-GACACUCUUUCCCUGUUGCACUACU-3′ and reverse,
5′-CAGTGCGTGTCGTGGAGT-3′; and reference miRNA (hsa-miR-16) forward,
5′-GTCGTATCCAGTGCAGGGTCCGAGTCGCACTGGATACGACCGCCAA-3′ and reverse,
5′-GTATCCAGTGCAGGGTCCGAGGT-3′. Expression levels of target miRNAs
were calculated using the quantification cycle (Cq) values with SDS
2.0 software (Applied Biosystems; Thermo Fisher Scientific, Inc.).
The relative expression levels of miR-130b were calculated using
the 2−ΔΔCq method (22),
in which ∆Cq = Cq(miR-130b) - Cq(miR-16).
Blood parameter testing
Hematological parameters, including red blood cell
count (R#), hemoglobin (Hb), hematocrit (Hct), white blood cell
count (WBC), neutrophil count (N#), lymphocyte percentage (L#),
monocyte count (M#), platelet count (PLT) and mean platelet volume
(MPV), were measured before radical surgery using the automatic
blood analyzer 800i (Sysmex Corporation) according to the
manufacturer's protocols. Conventional tumor markers, including
CA125, CA211 and CA50, were detected using a Roche cobas E170
analyzer (Roche Diagnostics).
Statistical analysis
All experiments were repeated three times
independently, and the data are expressed as the mean ± SD.
Differences in relevant indicators between two groups were compared
using an unpaired t-test, or the Mann-Whitney U test when the
conditions for the Student's t-test were not satisfied. Differences
in relevant indicators among three groups were analyzed using
one-way ANOVA, or Kruskal-Wallis H test when the conditions for
one-way ANOVA were not satisfied. Tukey's honest significant
difference test was used as a post hoc test after one-way ANOVA,
and the Bonferroni method was used to correct for post hoc pairwise
comparisons of significance levels after the Kruskal-Wallis H test.
Differences in sex distribution among the three groups were
analyzed using the χ2 test. All statistical analyses and
generation of images were performed using SPSS 20.0 software (IBM
Corp.) or GraphPad Prism 8.0 Software (GraphPad Software, Inc.).
Correlations between circulating biomarkers in GC were analyzed
using Pearson's correlation. Correlations between blood biochemical
indexes and cancer stage in GC were analyzed by Spearman's
correlation. Sensitivity and specificity were defined by receiver
operating characteristic (ROC) curves, and differences in the area
under the curve (AUC) and diagnostic accuracy parameters, including
sensitivity, specificity, negative likelihood ratio
(LR−), positive likelihood ratio (LR+) and
diagnostic odds ratio (DOR) were detected using MedCalc version
19.5.3 (MedCalc Software, Ltd.). For all analyses, P<0.05 was
considered to indicate a statistically significant difference.
Results
Expression levels of miR-130b,
complete blood count parameters and conventional tumor markers in
GC, Pre and NCs
A total of 90 patients with GC, 90 patients with
Pres and 45 NCs were included in the present study. Plasma miR-130b
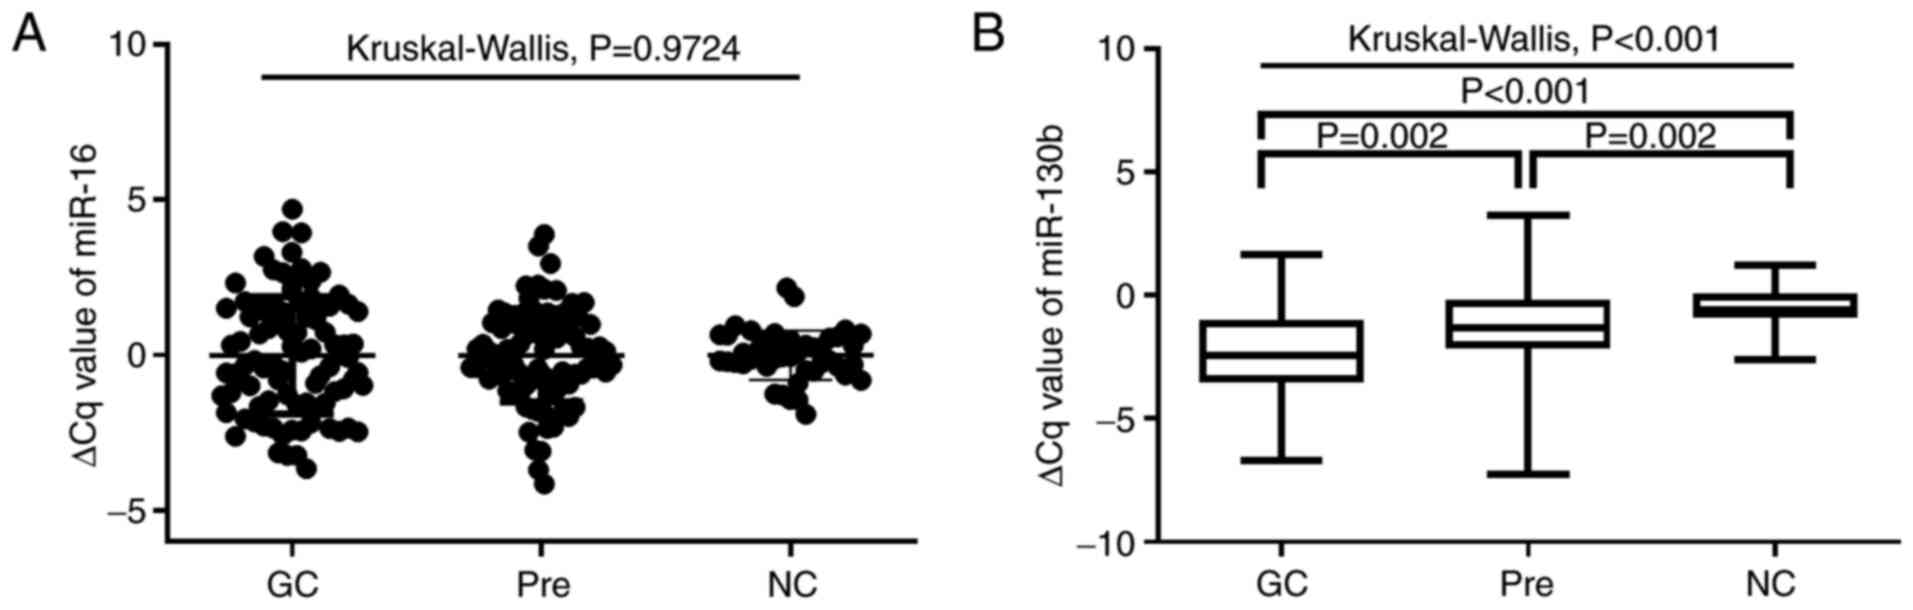
expression was examined by RT-qPCR. As shown in Fig. 1A, no significant differences in
miR-16 expression were observed among the three groups (P=0.9724).
As shown in Fig. 1B, plasma
miRNA-130b levels in patients with GC and Pres were significantly
higher than those of NCs (all P<0.05). Furthermore, the plasma
miRNA-130b levels in GC were significantly higher than those in the
Pre group (P=0.002). As shown in Table
I, the values for M#, monocyte percentage (M%), red blood cell
distribution width-coefficient of variation (RDW-CV), MPV, monocyte
to lymphocyte count ratio (MLR), neutrophil to lymphocyte ratio
(NLR), CA211 and CA50 in patients with GC and Pres were
significantly higher than those in NCs (all P<0.05). Notably,
patients with GC and Pres had significantly lower Hb, L% and
platelet distribution width (PDW) than NCs (GC vs. NC, P<0.05;
Pre vs. NC, P<0.05; Table I). The
values for N#, neutrophil percentage (N%), platelet to lymphocyte
ratio (PLR) and CA125 in patients with GC were significantly
higher, while Hct was significantly lower, compared with those in
the normal group (all P<0.05). Furthermore, the MPV to platelet
count ratio (MPV/PC) was significantly higher in the Pre cohort
(0.04±0.02) compared with NCs (0.03±0.01; P=0.004). In addition,
the values for WBC and PLT did not differ significantly among the
three groups.
 | Table I.Blood biochemical examination results
of subjects. |
Table I.
Blood biochemical examination results
of subjects.
|
| GC | Pre | NC |
|
|
|
|
|---|
|
|
|
|
|
|
|
|
|
|---|
| Variables | No. of
patients | Mean ± SD | No. of
patients | Mean ± SD | No. of
patients | Mean ± SD |
P-valuea | GC vs. Pre
P-value | GC vs. NC
P-value | Pre vs. NC
P-value |
|---|
| WBC,
109/l | 89 | 6.41±2.98 | 76 | 6.25±2.68 | 45 | 6.01±1.28 | 0.2846 | – | – | – |
| N#,
109/l | 89 | 4.55±2.86 | 76 | 3.84±2.61 | 45 | 3.61±0.98 | 0.0445 | >0.999 | 0.039 | 0.228 |
| L#,
109/l | 89 | 1.34±0.66 | 76 | 1.66±0.76 | 45 | 1.93±0.73 | <0.0001 | 0.002 | 0.001 | 0.169 |
| M#,
109/l | 89 | 0.31±0.21 | 76 | 0.31±0.17 | 45 | 0.24±0.4 | 0.0018 | >0.999 | 0.002 | 0.015 |
| N% | 89 | 67.81±14.75 | 76 | 63.45±12.65 | 45 | 61.23±7.99 | 0.0003 | 0.052 | 0.001 | 0.260 |
| L% | 89 | 22.74±11.4 | 76 | 29.31±11.63 | 45 | 31.90±7.57 | <0.0001 | 0.025 | 0.016 | 0.001 |
| M% | 89 | 5.31±3.75 | 76 | 5.05±2.17 | 45 | 3.71±1.35 | 0.0003 | 0.237 | 0.001 | 0.023 |
| Hb, g/l | 89 | 116.10±32.22 | 76 | 128.04±21.67 | 45 | 138.46±16.05 | <0.0001 | 0.001 | 0.01 | 0.001 |
| Hct, % | 89 | 35.70±9.07 | 76 | 39.21±6.18 | 45 | 40.43±3.92 | <0.0001 | 0.001 | 0.001 | >0.999 |
| RDW-CV, % | 89 | 14.01±3.24 | 76 | 12.75±1.92 | 45 | 12.31±1.40 | <0.0001 | 0.001 | 0.001 | 0.048 |
| PLT,
1012/l | 89 | 256.00±111.43 | 76 | 231.50±63.38 | 45 | 248.00±54.68 | 0.0704 | – | – | – |
| PDW, % | 89 | 11.65±2.77 | 76 | 11.91±2.51 | 45 | 15.90±0.38 | <0.0001 | >0.999 | 0.001 | 0.001 |
| MPV, fl | 89 | 9.62±1.20 | 76 | 9.91±1.14 | 45 | 8.90±1.39 |
<0.0001b | 0.046 | 0.003 | 0.001 |
| MPV/PC | 89 | 0.04±0.04 | 76 | 0.04±0.02 | 45 | 0.03±0.01 | 0.0047 | 0.105 | 0.428 | 0.004 |
| MLR | 89 | 0.24±0.41 | 76 | 0.17±0.18 | 45 | 0.11±0.98 | <0.0001 | 0.006 | 0.001 | 0.003 |
| NLR | 89 | 2.94±9.33 | 76 | 2.20±6.09 | 45 | 1.96±0.63 | <0.0001 | 0.001 | 0.001 | 0.001 |
| PLR | 89 | 198.05±286.52 | 76 | 131.03±112.07 | 45 | 134.36±76.12 | <0.0001 | 0.001 | 0.001 | 0.031 |
| CA125, U/ml | 68 | 59.22±92.72 | 53 | 12.36±7.78 | 45 | 11.07±4.05 | 0.0078 | 0.024 | 0.028 | >0.999 |
| CA211, ng/ml | 40 | 16.15±44.84 | 62 | 2.95±1.38 | 45 | 2.09±0.48 | <0.0001 | 0.045 | 0.001 | 0.001 |
| CA50, U/ml | 48 | 38.01±99.02 | 77 | 8.18±5.97 | 34 | 4.91±4.46 | <0.0001 | 0.001 | 0.001 | 0.001 |
Diagnostic values of tumor markers for
GC based on AUC analysis
To further assess the diagnostic value of potential
diagnostic biomarkers for GC, ROC analyses were subsequently
performed, and the key indicators, including sensitivity,
specificity, positive predictive value, negative predictive value,
cut-off value and AUC, were measured as shown in Fig. 2 and Table
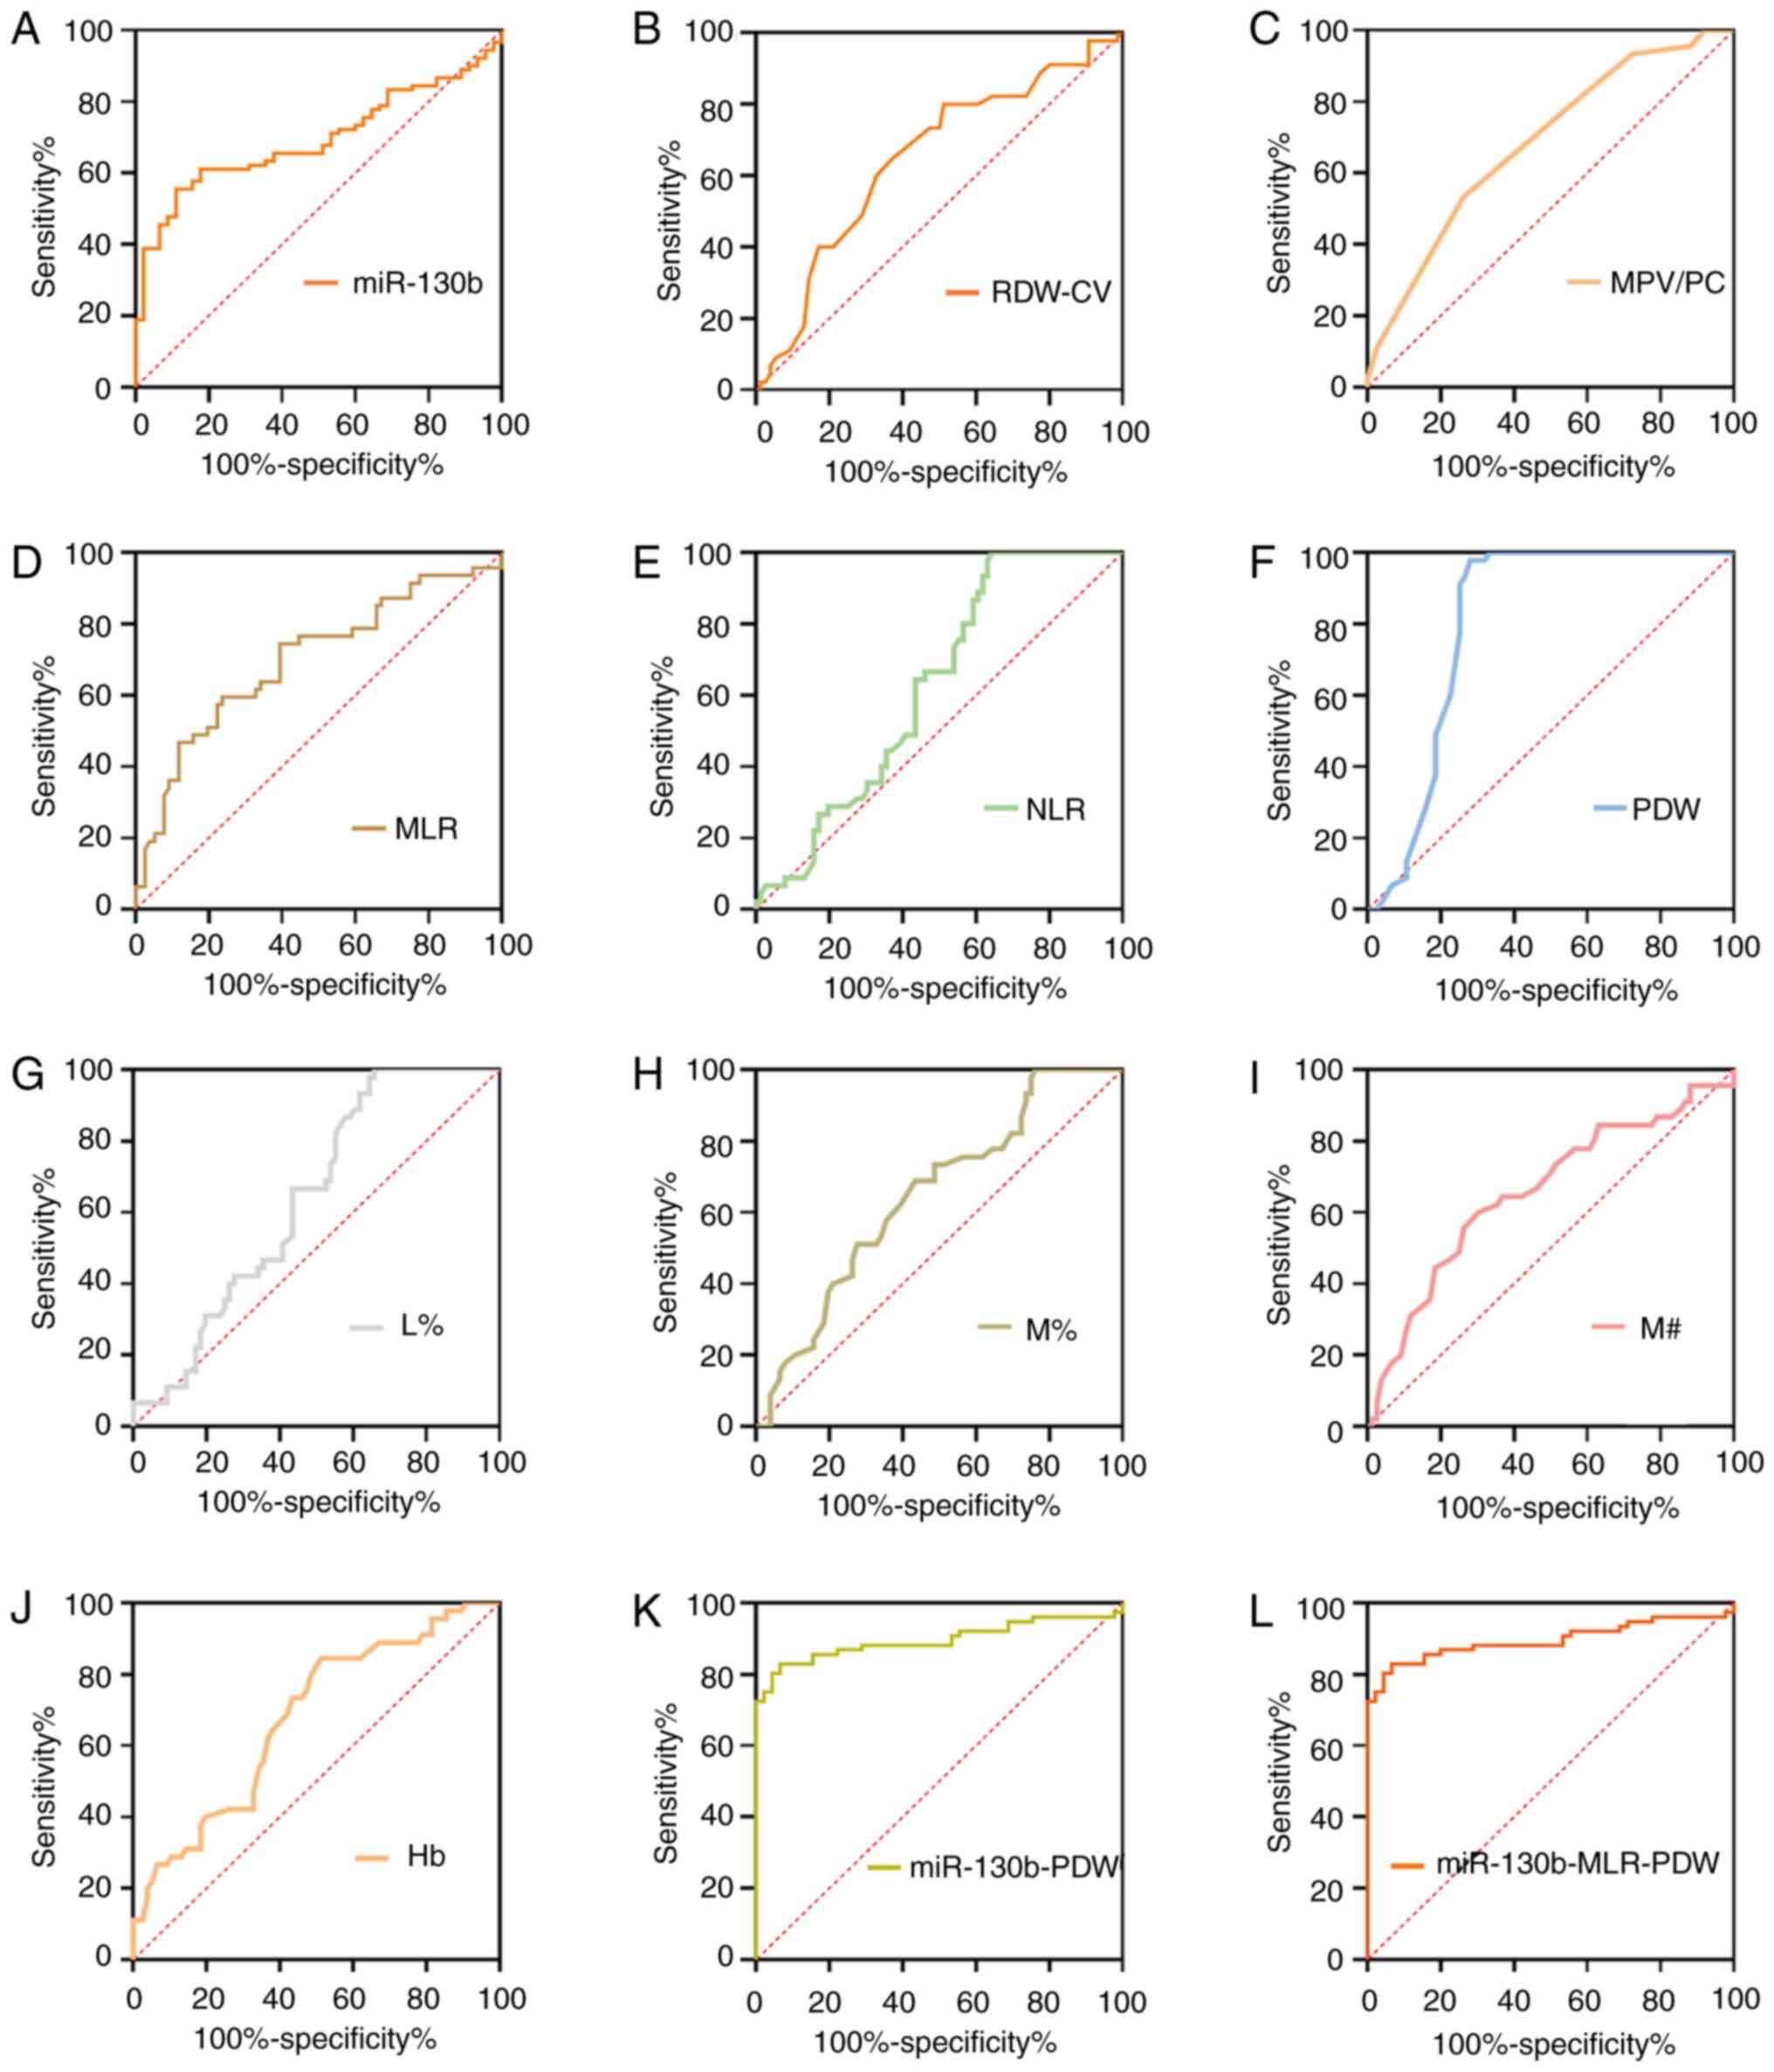
II. ROC analyses suggested that the AUC was calculated as 0.887
for miR-130b, 0.828 for Hb, 0.764 for Hct, 0.763 for RDW-CV, 0.667
for MPV, 0.757 for NLR, 0.814 for MLR, 0.712 for PLR, 0.840 for
PDW, 0.709 for N%, 0.715 for M%, 0.782 for L%, 0.634 for N#, 0.680
for M# and 0.719 for lymphocyte count (L#). At a cut-off value of
0.18, circulating miR-130b exhibited the highest diagnostic
accuracy and sensitivity compared with any other parameters,
highlighting its potential as an effective biomarker for GC. Our
previous study also assayed CA211 and CA50 levels in the same
plasma samples, and at cut-off values of 2.2 ng/ml for CA211 and
7.96 ng/ml for CA50, the sensitivity and specificity values were
80.65 and 95.65%, and 55.84 and 85.29%, respectively (23).
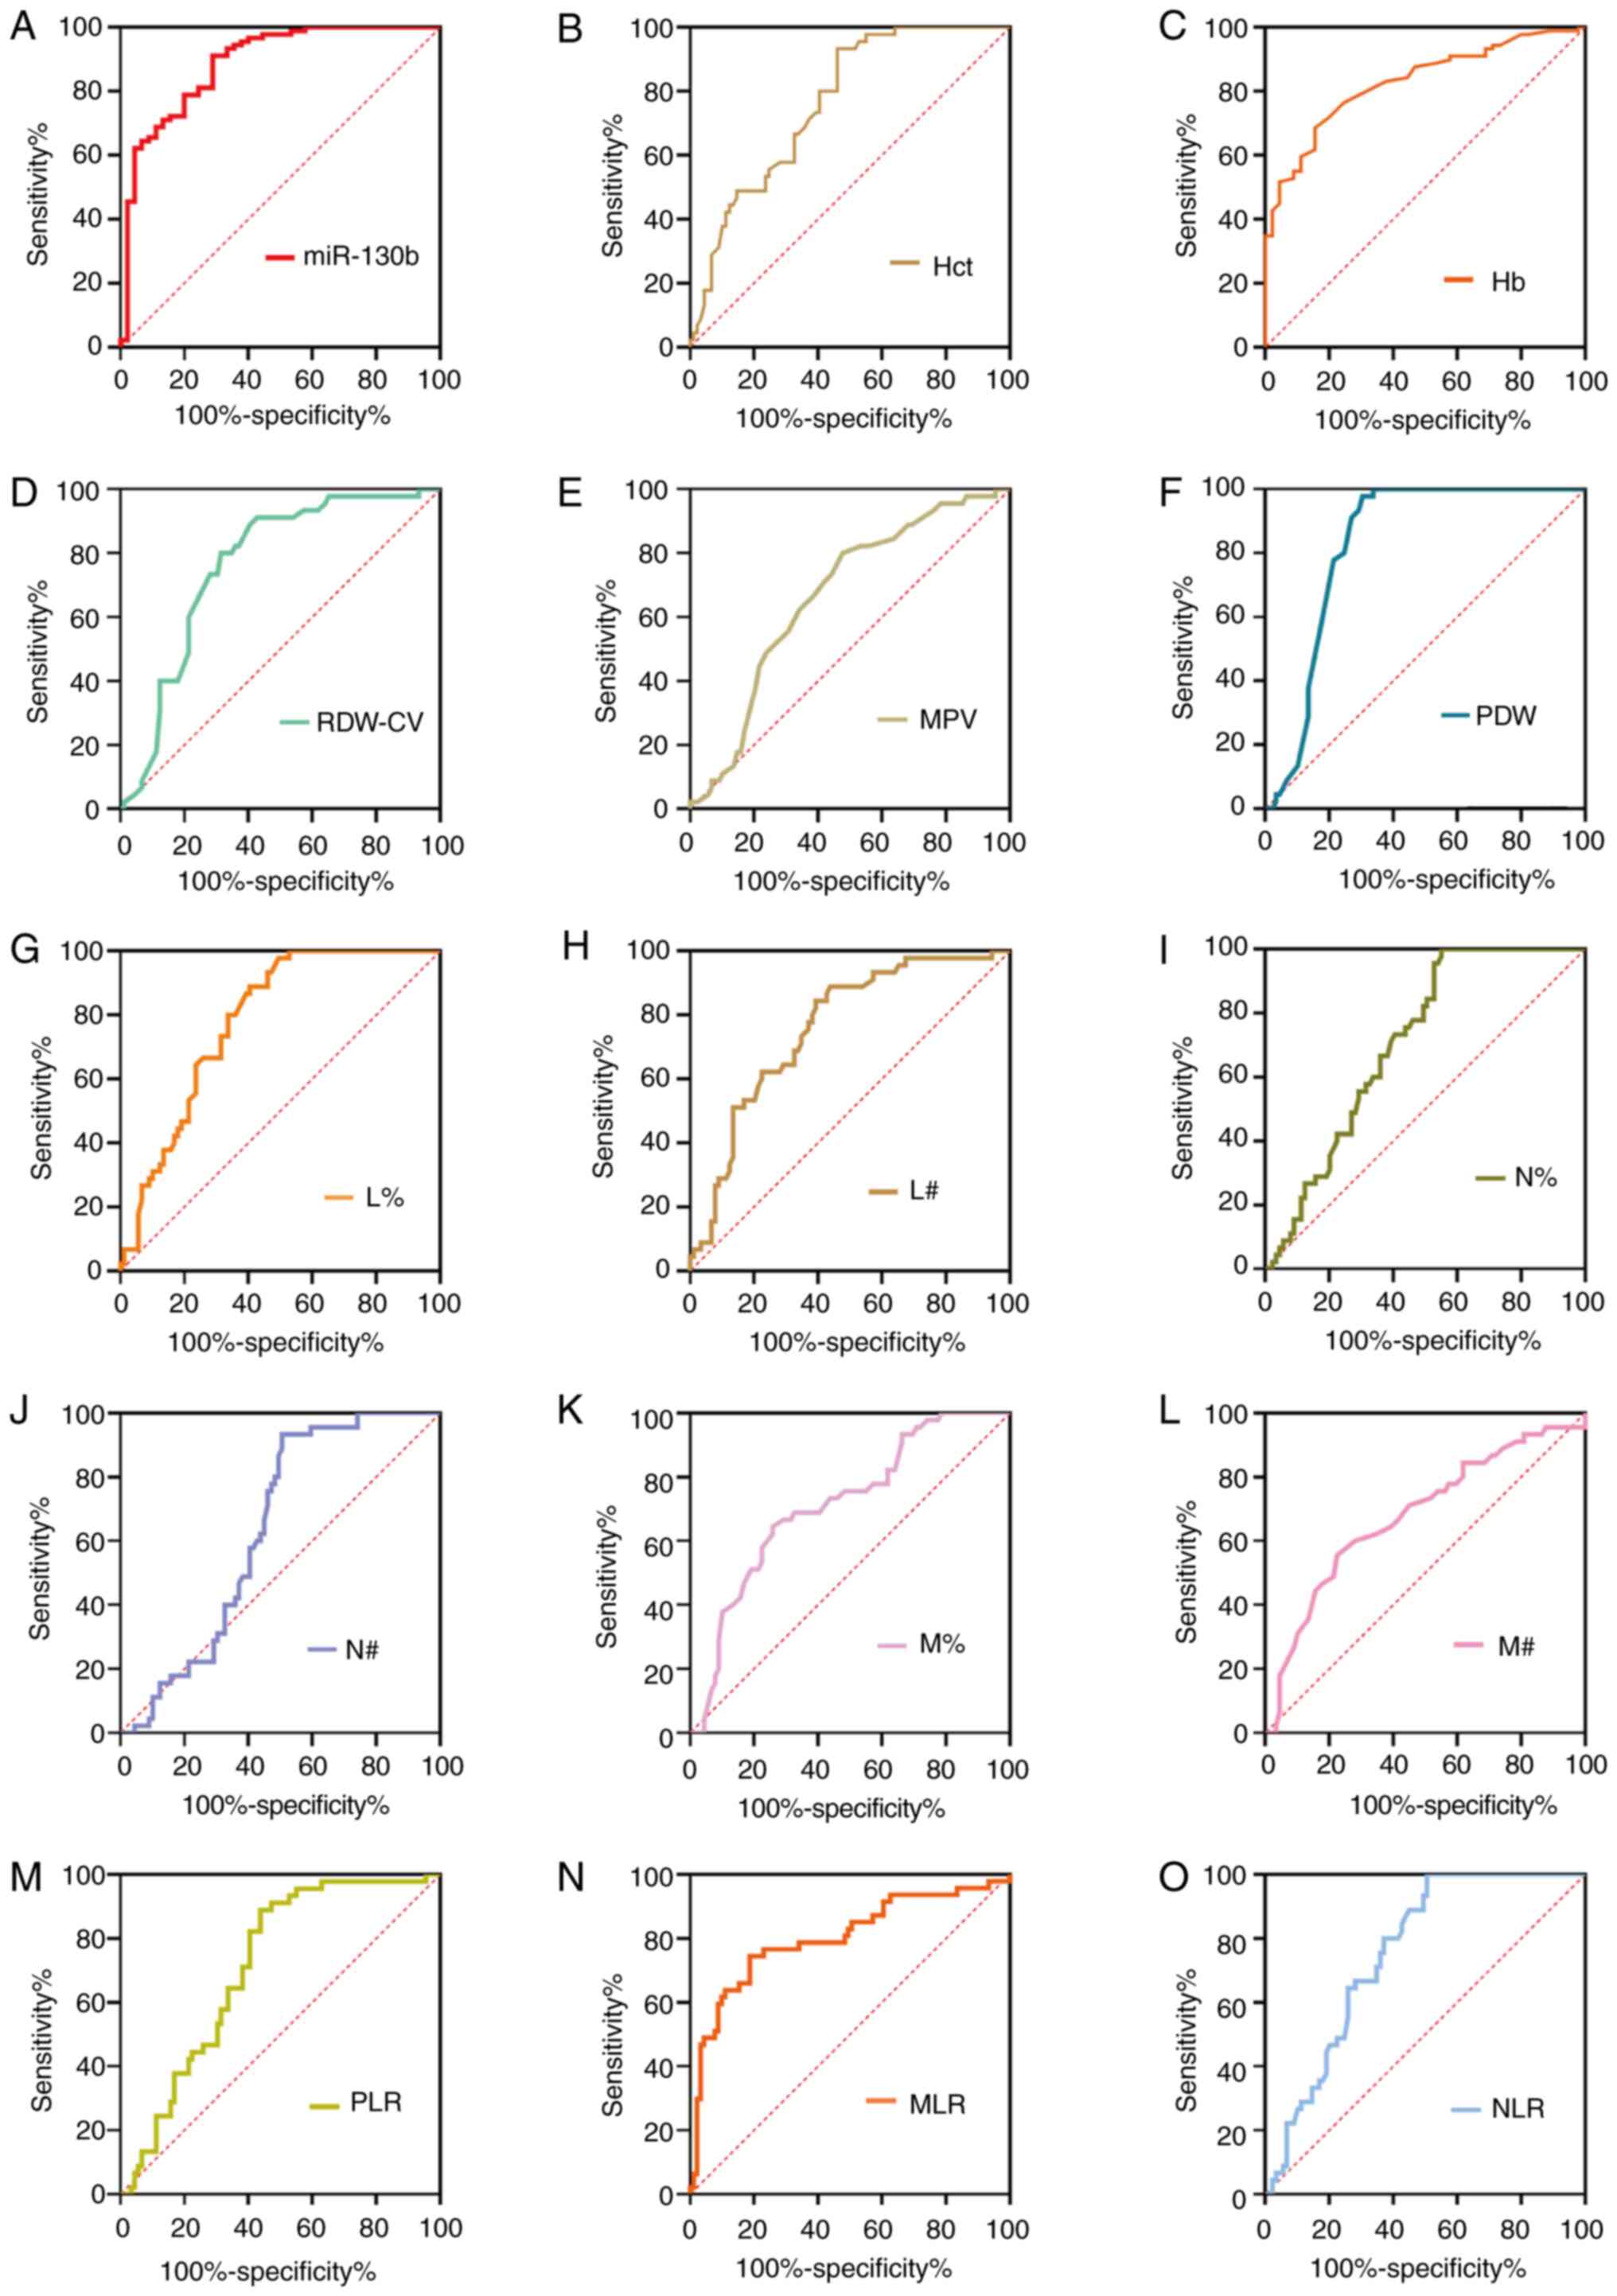 | Figure 2.ROC curve analyses of tumor markers
for gastric cancer. ROC curve analysis of biomarkers (A) miR-130b,
(B) Hct, (C) Hb, (D) RDW-CV, (E) MPV, (F) PDW, (G) L%, (H) L#, (I)
N%, (J) N#, (K) M%, (L) M#, (M) PLR, (N) MLR and (O) NLR for
discrimination between gastric cancer and healthy controls. Hb,
hemoglobin; Hct, hematocrit; L%, lymphocyte percentage; L#,
lymphocyte count; miR-130b, microRNA-130b; MLR, monocyte to
lymphocyte ratio; MPV, mean platelet volume; M%, monocyte
percentage; M#, monocyte count; N%, neutrophil percentage; N#,
neutrophil count; NLR, neutrophil to lymphocyte ratio; PDW,
platelet distribution width; PLR, platelet to lymphocyte ratio;
RDW-CV, red blood cell distribution width-coefficient of variation;
ROC, receiver operating characteristic. |
| Table II.Diagnostic value of different
indicators for gastric cancer. |
Table II.
Diagnostic value of different
indicators for gastric cancer.
| Variable | AUC (95% CI) | Cut-off index
J | Youden | Sensitivity, % | Specificity, % | Accuracy, % | PPV, % | NPV, % | P-value |
|---|
| miR-130b | 0.887
(0.821–0.935) | 0.18 | 0.6222 | 91.11 | 71.11 | 84.44 | 14.00 | 35.99 | 0.001 |
| Hb, g/l | 0.828
(0.753–0.888) | 127.00 | 0.5298 | 68.54 | 84.44 | 73.87 | 8.00 | 39.35 | 0.001 |
| Hct, % | 0.764
(0.682–0.833) | 36.11 | 0.4727 | 53.93 | 93.33 | 67.16 | 4.00 | 43.02 | 0.001 |
| RDW-CV, % | 0.763
(0.681–0.832) | 12.80 | 0.4854 | 68.54 | 80.00 | 72.39 | 10.00 | 37.28 | 0.001 |
| MPV, fl | 0.667
(0.580–0.747) | 9.50 | 0.3227 | 52.27 | 80.00 | 61.65 | 10.00 | 36.85 | 0.001 |
| NLR | 0.757
(0.675–0.827) | 3.13 | 0.4944 | 49.44 | 100.00 | 66.42 | 1.00 | 46.00 | 0.001 |
| MLR | 0.814
(0.738–0.876) | 0.15 | 0.5645 | 80.90 | 75.56 | 79.10 | 11.99 | 36.00 | 0.001 |
| PLR | 0.712
(0.628–0.787) | 188.98 | 0.4507 | 56.18 | 88.89 | 67.16 | 5.99 | 41.02 | 0.001 |
| PDW, % | 0.840
(0.766–0.898) | 15.31 | 0.6823 | 70.45 | 97.78 | 79.70 | 1.99 | 45.69 | 0.001 |
| N% | 0.709
(0.624–0.784) | 70.40 | 0.4494 | 44.94 | 100.00 | 63.43 | 1.00 | 45.91 | 0.001 |
| M% | 0.715
(0.630–0.789) | 4.21 | 0.3860 | 74.16 | 64.44 | 70.90 | 17.00 | 30.25 | 0.001 |
| L% | 0.782
(0.703–0.849) | 25.22 | 0.4844 | 59.55 | 88.89 | 69.40 | 5.99 | 41.11 | 0.001 |
| N#,
109/l | 0.634
(0.547–0.716) | 4.63 | 0.4277 | 49.44 | 93.33 | 64.18 | 4.00 | 42.93 | 0.0044 |
| M#,
109/l | 0.680
(0.594–0.758) | 0.24 | 0.3308 | 77.53 | 55.56 | 70.15 | 20.99 | 26.25 | 0.0004 |
| L#,
109/l | 0.719
(0.635–0.793) | 1.46 | 0.4067 | 60.67 | 80.00 | 67.16 | 10.00 | 37.02 | 0.001 |
Integrative diagnosis model for
detecting GC
To further assess the effect of circulating
biomarkers, an integrative diagnosis model was generated for
discriminating GC. The circulating markers with AUC >0.80
(miR-130b, Hb, MLR and PDW) were further considered for
combinations. For the two-dimensional models, PDW-Hb yielded the
greatest AUC (0.945), followed by miR-130b-Hb (0.937), miR-130b-PDW
(0.922), miR-130b-MLR (0.892), PDW-MLR (0.843) and MLR-Hb (0.835).
The AUC values of the dual-models miR-130b-PDW, miR-130b-Hb and
PDW-Hb were all greater than those of any of the one-dimensional
models. However, there was no statistically significant difference
in AUC between the PDW-MLR and MLR-Hb dual-models compared with the
corresponding one-dimensional models. In addition, the AUC of the
dual-model miR-130b-MLR was significantly different from that of
the miR-130b one-dimensional model, while miR-130b-MLR was not
statistically significantly different compared with the MLR
one-dimensional model. For the miR-130b-PDW-MLR three-dimensional
model, the AUC (0.955) was greater than those of the miR-130b-MLR
or the PDW-MLR two-dimensional models (all P<0.05; Table III). Similarly, the AUC (0.976) of
the three-dimensional model miR-130b-PDW-Hb was greater than those
of the miR-130b-Hb or the PDW-Hb two-dimensional models. The AUC
(0.942) of the miR-130b-MLR-Hb three-dimensional model was greater
than those of the miR-130b-MLR or the MLR-Hb two-dimensional
models. For the PDW-MLR-Hb three-dimensional model, the AUC (0.947)
was greater than those of the PDW-MLR or MLR-Hb two-dimensional
models. Furthermore, for the four-dimensional model
miR-130b-PDW-MLR-Hb, the AUC (0.978) was greater than those of the
three-dimensional models miR-130b-MLR-Hb and PDW-MLR-Hb (all
P<0.05; Table III). These
results indicated that the combination of different biomarkers can
improve the diagnostic efficiency to some extent.
| Table III.Receiver operating characteristic
analysis of circulating biomarkers individually and combined for
gastric cancer detection. |
Table III.
Receiver operating characteristic
analysis of circulating biomarkers individually and combined for
gastric cancer detection.
| Models | AUC (95% CI) | Cut-off | Sensitivity, % | Specificity, % | Youden index J | P-value |
|---|
| One-dimensional
model |
|
|
|
|
|
|
|
miR-130b | 0.887
(0.821–0.935) | 0.18 | 91.11 | 71.11 | 0.6222 |
|
|
PDW,% | 0.840
(0.766–0.898) | 15.31 | 70.45 | 97.78 | 0.6823 |
|
|
MLR | 0.814
(0.738–0.876) | 0.15 | 80.90 | 75.56 | 0.5645 |
|
| Hb,
g/l | 0.828
(0.753–0.888) | 127.00 | 68.54 | 84.44 | 0.5298 |
|
| Dual-model |
|
|
|
|
|
|
|
miR-130b-PDW | 0.922
(0.863–0.961) | 0.74 | 82.02 | 88.89 | 0.7091 |
<0.0001a, 0.0005b |
|
miR-130b-MLR | 0.892
(0.827–0.939) | 0.76 | 75.28 | 86.67 | 0.6195 |
<0.0001a, 0.1541c |
|
miR-130b-Hb | 0.937
(0.882–0.972) | 0.56 | 89.89 | 86.67 | 0.7655 |
<0.0001a, 0.0014d |
|
PDW-MLR | 0.843
(0.769–0.900) | 0.53 | 71.26 | 97.78 | 0.6904 | 0.5030b, 0.5662c |
|
PDW-Hb | 0.945
(0.891–0.977) | 0.50 | 89.66 | 88.89 | 0.7854 | 0.0003b, 0.0001d |
|
MLR-Hb | 0.835
(0.761–0.893) | 0.64 | 73.03 | 84.44 | 0.5748 | 0.6893c, 0.0940d |
| Tri-model |
|
|
|
|
|
|
|
miR-130b-PDW-MLR | 0.955
(0.905–0.984) | 0.61 | 94.25 | 91.11 | 0.8536 | 0.0921e, 0.0091f, 0.0005g |
|
miR-130b-PDW-Hb | 0.976
(0.933–0.995) | 0.77 | 90.80 | 97.78 | 0.8858 | 0.0602e, 0.0218h, 0.0341i |
|
miR-130b-MLR-Hb | 0.942
(0.888–0.975) | 0.52 | 91.01 | 86.67 | 0.7768 | 0.0095f, 0.0697h, 0.0012j |
|
PDW-MLR-Hb | 0.947
(0.894–0.978) | 0.55 | 89.66 | 91.11 | 0.8077 | 0.0004g, 0.2198i, 0.0002j |
| Tetrad-model |
|
|
|
|
|
|
|
miR-130b-PDW-MLR-Hb | 0.978
(0.936–0.996) | 0.76 | 91.95 | 97.78 | 0.8973 | 0.0651k, 0.1465l, 0.0277m, 0.0316n |
Diagnostic value of four-dimensional
biomarkers in GC
The corresponding diagnostic accuracy parameters,
including sensitivity, specificity, LR−, LR+
and DOR, are shown in Table IV.
miR-130b exhibited a sensitivity and specificity of 91.11 and
71.11%, PDW had a sensitivity and specificity of 70.45 and 97.78%,
MLR exhibited a sensitivity and specificity of 80.90 and 75.56%,
and Hb had a sensitivity and specificity of 68.54 and 84.44%,
respectively. miR-130b-PDW had a sensitivity of 82.02% and a
specificity of 88.89%, miR-130b-MLR had a sensitivity of 75.28% and
a specificity of 86.67%, miR-130b-Hb had a sensitivity of 89.89%
and a specificity of 86.67%, PDW-MLR had a sensitivity of 71.26%
and specificity of 97.78%, PDW-Hb had a sensitivity of 89.66% and a
specificity of 88.89%, and MLR-Hb had a sensitivity of 73.03% and a
specificity of 84.44%. The three-dimensional model of
miR-130b-RDW-MLR yielded a sensitivity of 94.25% and a specificity
of 91.11% at the optimal cut-off point, miR-130b-PDW-Hb yielded a
sensitivity of 90.80% and specificity of 97.78% at the optimal
cut-off point of 0.77 as the optimal cut-off point, miR-130b-MLR-Hb
yielded a sensitivity of 91.01% and a specificity of 86.67% at the
0.52 as the optimal cut-off point, and PDW-MLR-Hb yielded a
sensitivity of 89.66% and a specificity of 91.11% at 0.55 as the
optimal cut-off point. Furthermore, the four-dimensional model
miR-130b-PDW-MLR-Hb had a sensitivity of 91.95% and a specificity
of 97.78% at 0.76 as the optimal cut-off point. Furthermore, the
combination of miR-130b-PDW-MLR-Hb yielded the largest accuracy,
LR+ and DOR values.
| Table IV.Accuracy of miR-130b, PDW, MLR and Hb
individually and combined for gastric cancer detection. |
Table IV.
Accuracy of miR-130b, PDW, MLR and Hb
individually and combined for gastric cancer detection.
| Variable | Cut-off | Sensitivity, % | Specificity, % | Accuracy, % | LR+ | LR− | DOR |
|---|
| miR-130b | 0.18 | 91.11 | 71.11 | 84.44 | 3.15 | 0.13 | 25.23 |
| PDW,% | 15.31 | 70.45 | 97.78 | 72.39 | 3.43 | 0.39 | 8.71 |
| MLR | 0.15 | 80.90 | 75.56 | 79.11 | 3.31 | 0.25 | 13.09 |
| Hb, g/l | 127.00 | 68.54 | 84.44 | 73.88 | 4.40 | 0.37 | 11.82 |
| miR-130b-PDW | 0.74 | 82.02 | 88.89 | 84.33 | 7.38 | 0.20 | 36.49 |
| miR-130b-MLR | 0.764 | 75.28 | 86.67 | 79.11 | 5.65 | 0.29 | 19.80 |
| miR-130b-Hb | 0.56 | 89.89 | 86.67 | 88.80 | 6.74 | 0.12 | 57.81 |
| PDW-MLR | 0.53 | 71.26 | 97.78 | 80.17 | 32.10 | 0.29 | 109.21 |
| PDW-Hb | 0.50 | 89.66 | 88.89 | 89.40 | 8.07 | 0.12 | 69.38 |
| MLR-Hb | 0.64 | 73.03 | 84.44 | 76.89 | 4.69 | 0.32 | 14.69 |
|
miR-130b-PDW-MLR | 0.61 | 94.25 | 91.11 | 93.18 | 10.60 | 0.06 | 167.99 |
|
miR-130b-PDW-Hb | 0.77 | 90.80 | 97.78 | 93.18 | 40.90 | 0.09 | 434.71 |
|
miR-130b-MLR-Hb | 0.52 | 91.01 | 86.67 | 89.55 | 6.83 | 0.10 | 65.82 |
| PDW-MLR-Hb | 0.55 | 89.66 | 91.11 | 90.15 | 10.09 | 0.11 | 88.87 |
|
miR-130b-PDW-MLR-Hb | 0.76 | 91.95 | 97.78 | 93.94 | 41.42 | 0.08 | 503.10 |
Association between the levels of
circulating biomarkers and the risk of GC
To further determine whether the circulating marker
levels for GC were associated with the presence of GC, logistic
regression analysis was performed with the biomarkers as dependent
variables (Table V). The crude odds
ratio was obtained from logistic regression analysis, and the
adjusted odds ratio was evaluated by adjusting for age and sex. The
results demonstrated that the increase of miR-130b, RDW-CV, MPV,
NLR, PLR, N% and M% was positively associated with the presence of
GC (all P<0.05; Table V). The
levels of PDW, Hb, Hct, L% and L# were negatively associated with
the risk of GC (all P<0.05), while the levels of MLR, N# and M#
were not associated with the incidence of GC (all P>0.05;
Table V).
| Table V.Crude odds ratio and adjusted odds
ratio between circulating tumor marker levels and the risk of
gastric cancer. |
Table V.
Crude odds ratio and adjusted odds
ratio between circulating tumor marker levels and the risk of
gastric cancer.
| Indicators | β | Crude odds
ratio | HR (95% CI) | Sig | β | Adjusted odds
ratioa | HR (95% CI) | Sig |
|---|
| miR-130b | 0.900 | 0.406 | 0.301–0.548 | 0.000 | 0.869 | 0.419 | 0.293–0.601 | 0.000 |
| RDW-CV,% | 0.578 | 10.782 | 10.326–20.393 | 0.000 | 0.574 | 1.776 | 1.197–6.744 | 0.004 |
| MPV, fl | 0.519 | 10.680 | 10.173–20.405 | 0.005 | 0.710 | 2.034 | 1.272–7.309 | 0.003 |
| NLR | 0.802 | 20.229 | 10.460–30.404 | 0.000 | 1.006 | 2.733 | 1.484–5.974 | 0.001 |
| PLR | 0.008 | 10.008 | 10.003–10.013 | 0.001 | 0.007 | 1.007 | 1.002–5.951 | 0.008 |
| PDW,% | −0.769 | 0.464 | 0.334–0.643 | 0.000 | −0.702 | 0.496 | 0.353–0.696 | 0.000 |
| N% | 0.054 | 10.055 | 10.022–10.090 | 0.001 | 0.057 | 1.059 | 1.014–6.421 | 0.010 |
| M% | 0.415 | 10.514 | 10.194–10.918 | 0.001 | 0.412 | 1.511 | 1.126–2.027 | 0.006 |
|
N#,109/l | 0.026 | 10.027 | 0.930–10.133 | 0.601 | 0.051 | 1.052 | 0.963–1.150 | 0.262 |
|
M#,109/l | 0.494 | 10.639 | 0.398–60.753 | 0.494 | 0.499 | 1.646 | 0.342–7.926 | 0.534 |
| Hb, g/l | −0.063 | 0.939 | 0.914–0.964 | 0.000 | −0.070 | 0.933 | 0.903–0.964 | 0.000 |
| Hct,% | −0.191 | 0.826 | 0.757–0.902 | 0.000 | −0.201 | 0.818 | 0.737–0.907 | 0.000 |
| MLR | −0.219 | 1.245 | 0.607–2.554 | 0.550 | −0.188 | 0.829 | 0.477–1.439 | 0.505 |
| L% | −0.103 | 0.902 | 0.802–0.943 | 0.000 | −0.100 | 0.905 | 0.858–0.954 | 0.000 |
|
L#,109/l | −1.041 | 0.353 | 0.198–0.630 | 0.000 | −0.923 | 0.397 | 0.203–0.776 | 0.007 |
Association between circulating
biomarkers and conventional GC markers
Correlation analysis was performed as shown in
Fig. 3. Correlation analysis
demonstrated that the value of RDW-CV was positively associated
with the concentrations of CA50 (R=0.2424; P=0.0337; Fig. 3A) and CA125 (R=0.3426; P=0.0042;
Fig. 3B). Pearson's correlation
analysis indicated that PLR (R=0.2568; P=0.0346; Fig. 3C) and N% (R=0.2886; P=0.0170;
Fig. 3D) were positively associated
with the CA125 concentration, and L% (R, −0.367; P=0.0022; Fig. 3O) was negatively correlated with the
CA125 concentration. Furthermore, the analysis demonstrated that
MPV, N#, NLC and M# were positively associated with the CA211
concentration (all P<0.05; Fig.
3E-H). Particularly, Hb and Hct were negatively correlated with
the concentration of CA125, CA211 and CA50 (all P<0.05; Fig. 3I-N). However, miR-130b, MLR and PDW
were not correlated with CA125, CA50 or CA211 (all P>0.05; data
not shown).
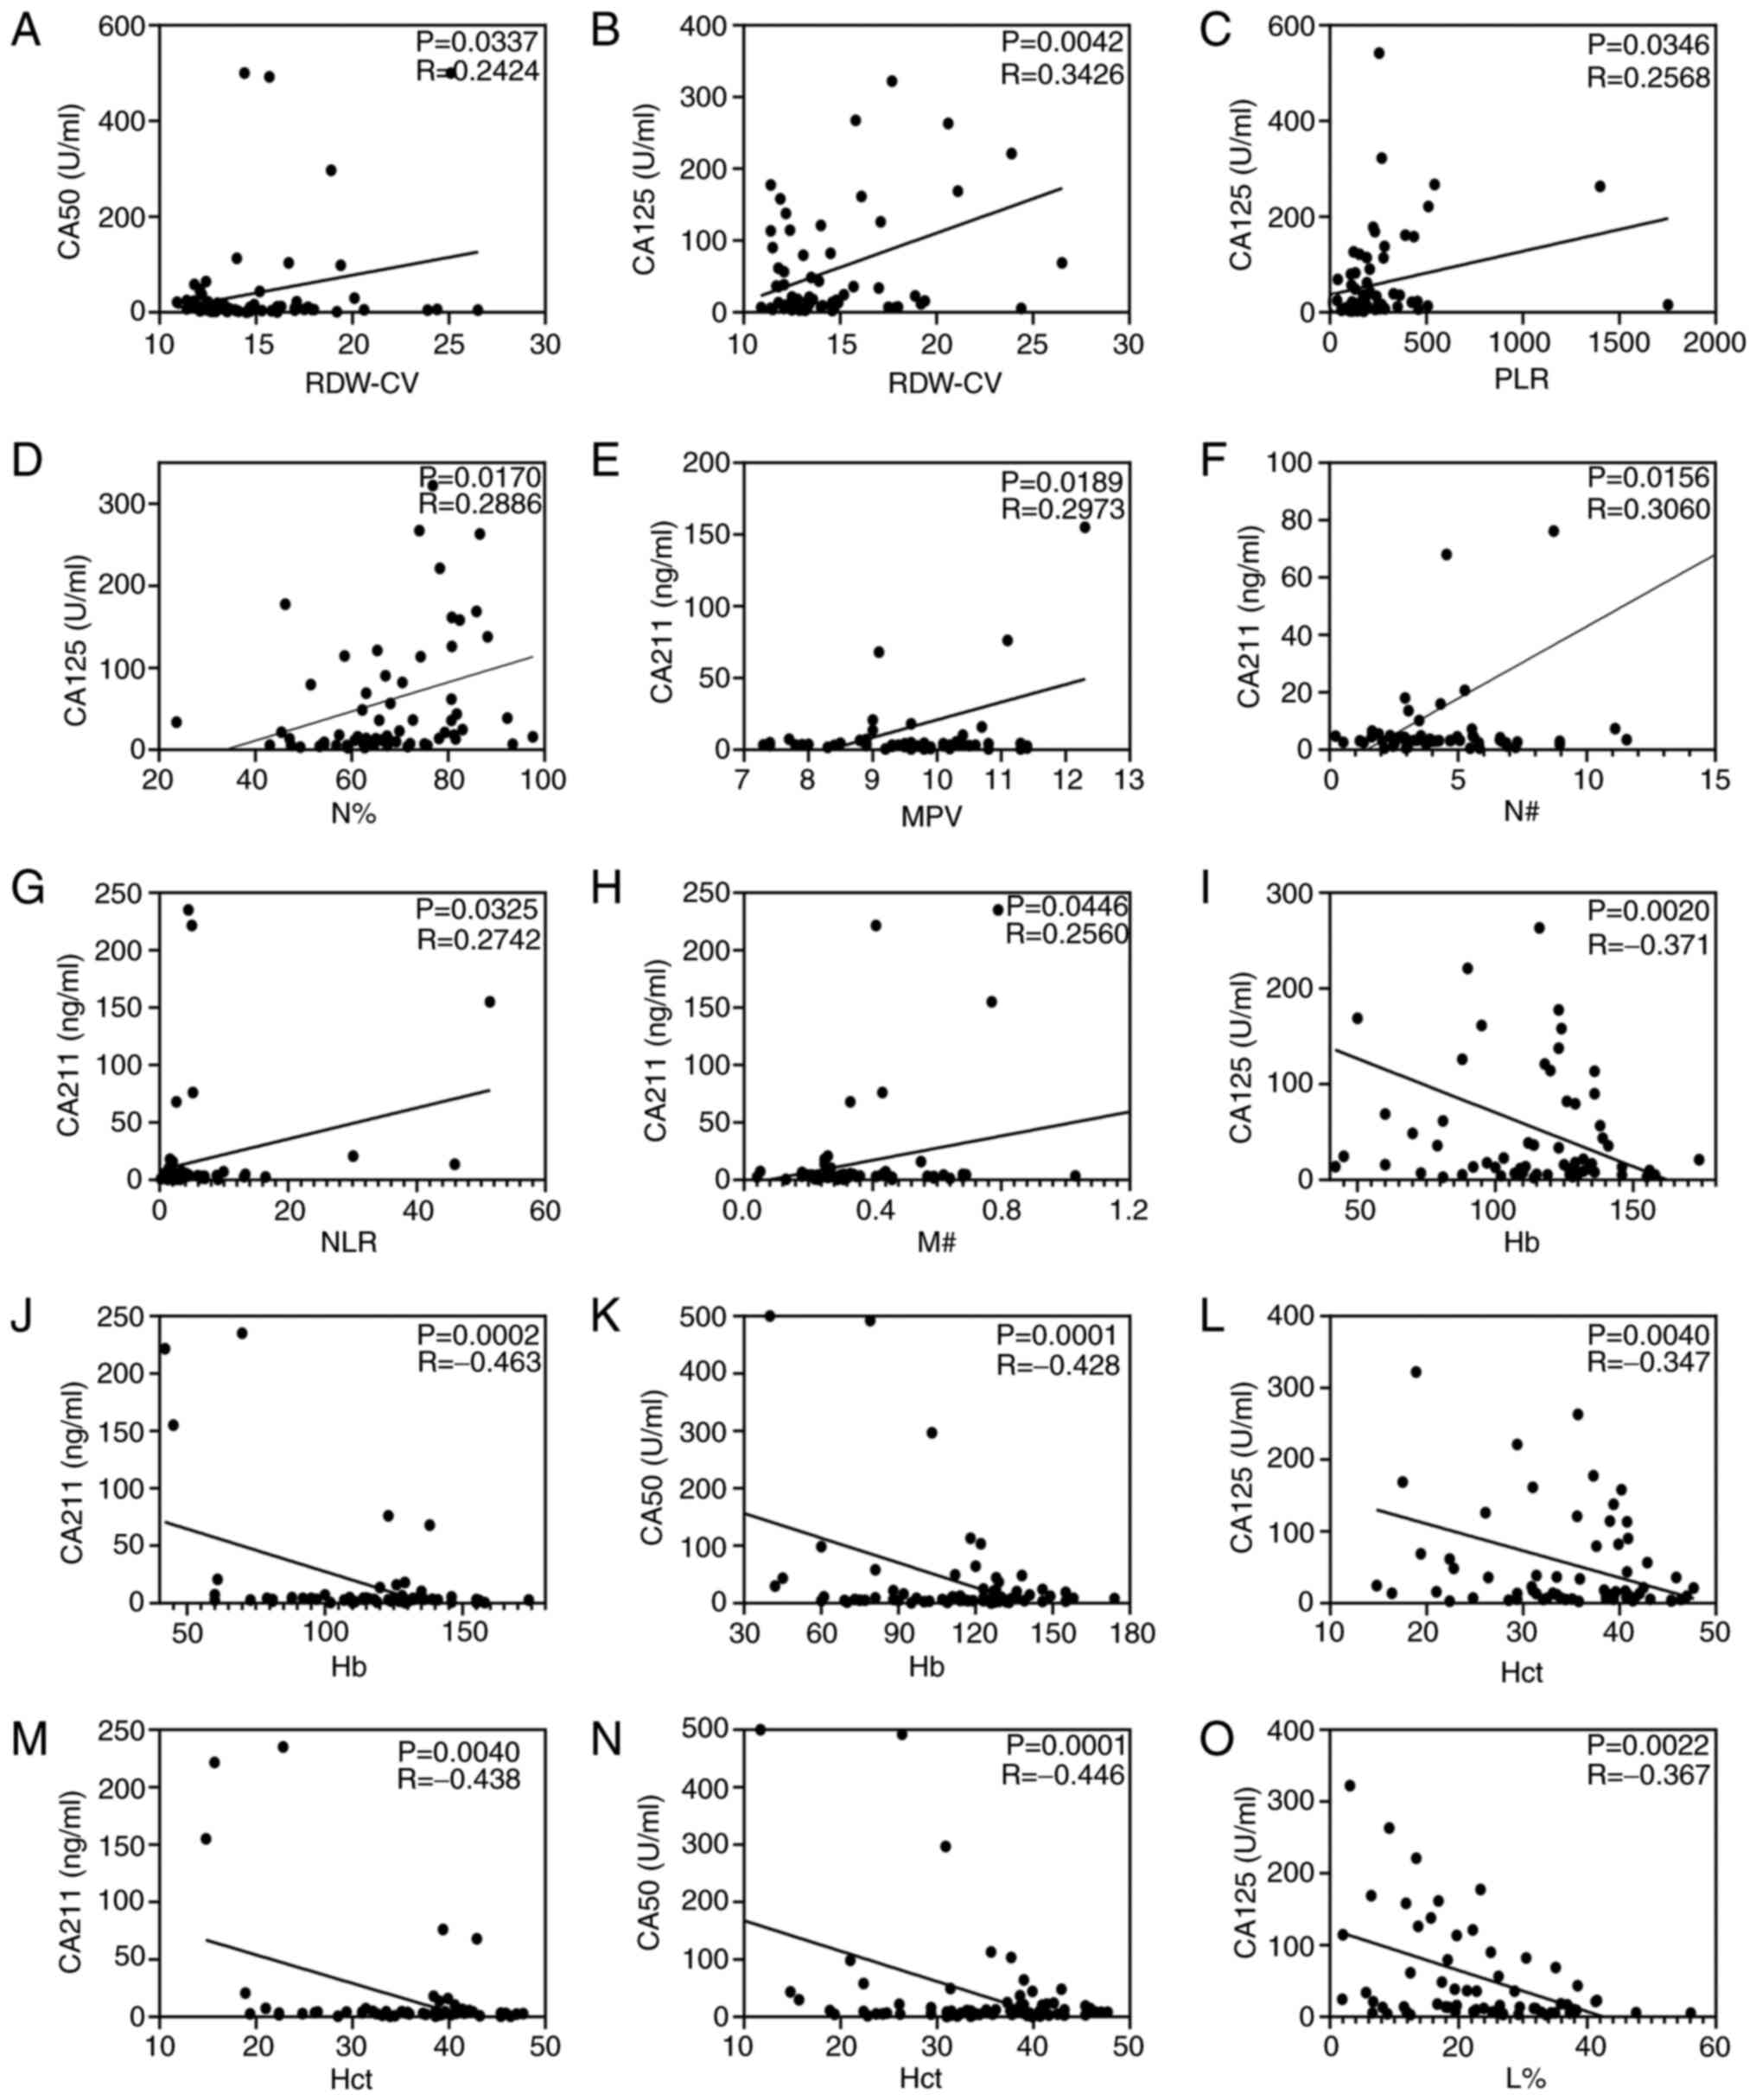 | Figure 3.Circulating biomarkers and
conventional gastric cancer markers analyzed using Pearson's
correlation. Correlation analysis of RDW-CV with (A) CA50 and (B)
CA125. Correlation analysis of CA125 with (C) PLR and (D) N%.
Correlation between (E) MPV, (F) N#, (G) NLR and (H) M# and CA211.
Continuous data for Hb with (I) CA125, (J) CA211 and (K) CA50.
Continuous data for Hct with (L) CA125, (M) CA211 and (N) CA50. (O)
Correlation analysis of L% with CA125. Hb, hemoglobin; Hct,
hematocrit; L%, lymphocyte percentage; MPV, mean platelet volume;
M#, monocyte count; N#, neutrophil count; NLR, neutrophil to
lymphocyte ratio; PLR, platelet to lymphocyte ratio; RDW-CV, red
blood cell distribution width-coefficient of variation. |
Levels of circulating biomarkers are
associated with severity of GC
Correlations between cancer stage and RDW-CV, PLR,
NLR, MPV, PDW, N#, M%, miR-130b, N%, M#, L#, L%, Hb, Hct and MLR in
patients with GC are shown in Fig.
4. Correlation analysis revealed that RDW-CV, PLR, NLR, N# and
N% were positively correlated with cancer stage and MPV, L#, L%, Hb
and Hct were negatively correlated with cancer stage. However, PDW,
M%, M#, MLR and miR-130b were not correlated with cancer stage. In
addition, the levels of circulating RDW-CV, PLR, NLR, and N% were
significantly higher in advanced stages (III and IV) than the
earlier pathologic stages (I and II) of GC. By contrast, the levels
of circulating L%, Hb, Hct and L# were significantly lower in
advanced stages than in the earlier pathological stages of GC.
However, there was no difference in miR-130b between the two groups
(Fig. 5). Since the levels of
RDW-CV, PLR, NLR and N% were positively correlated with tumor
pathological characteristics (TNM stage), it is reasonable to
hypothesize that these biomarkers may be associated with GC
metastasis.
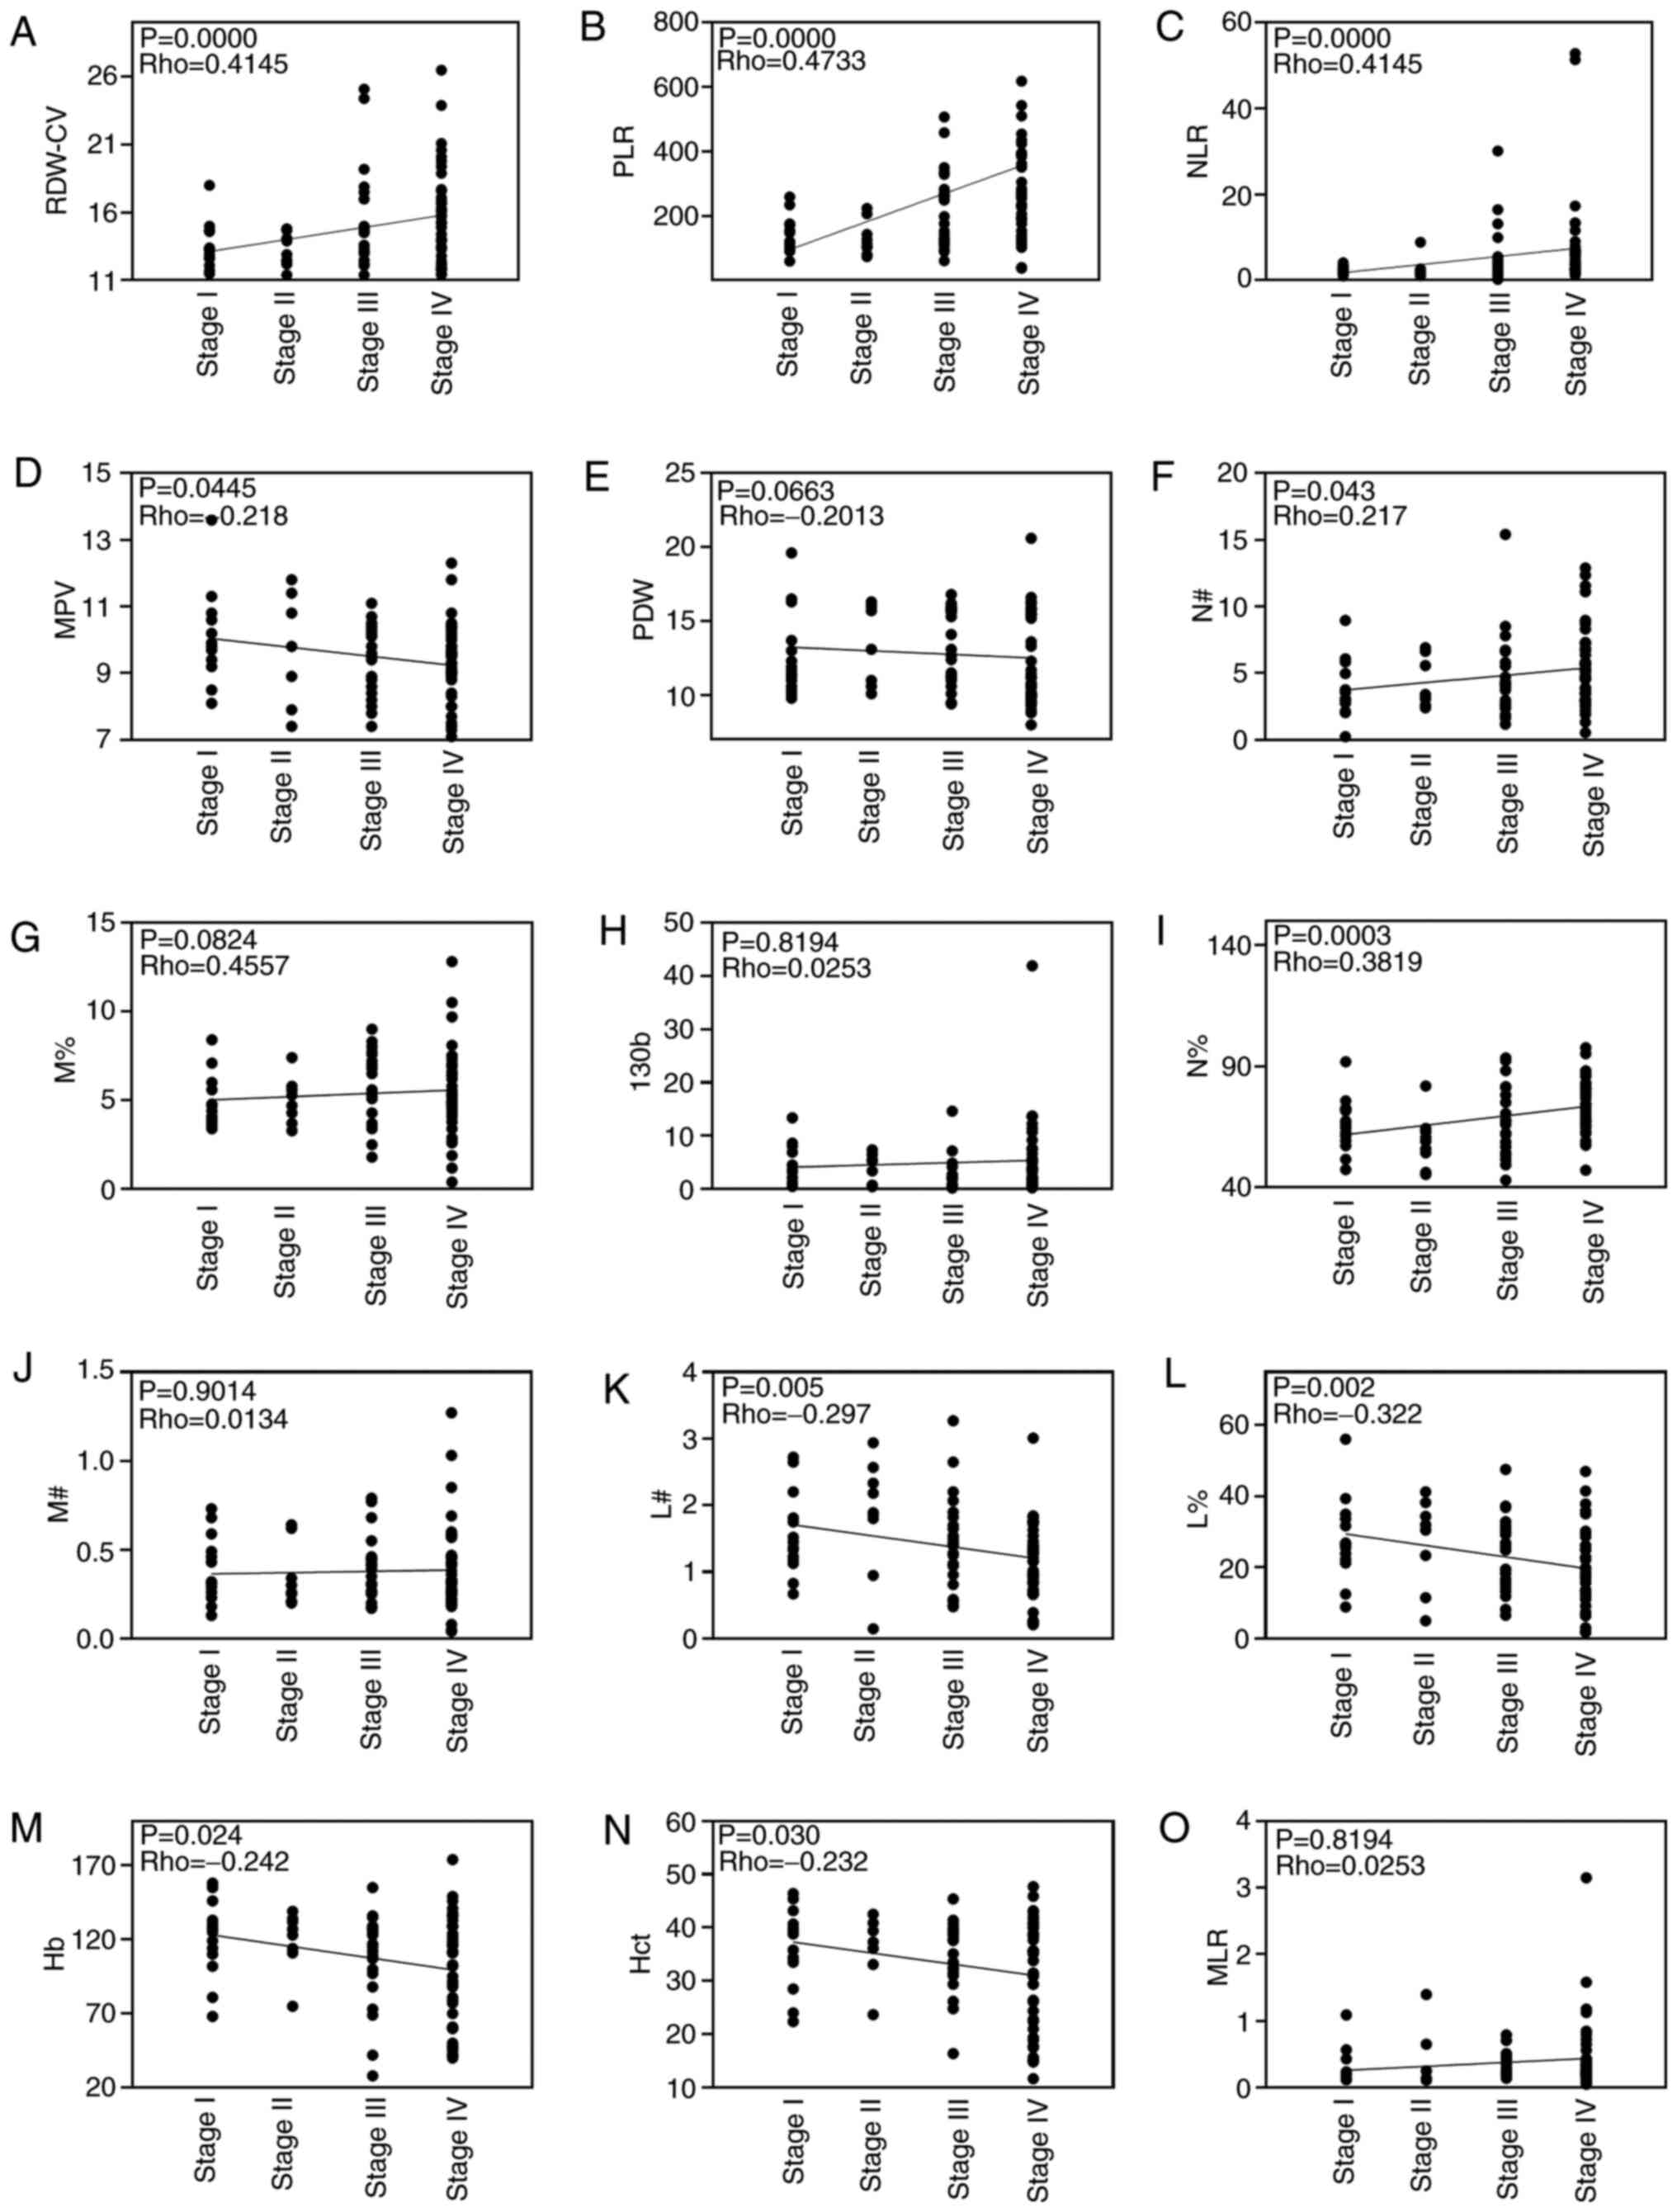 | Figure 4.Spearman's correlation analysis of
blood biochemical indexes and cancer stage. Analysis of correlation
between blood biochemical indexes, including (A) RDW-CV, (B) PLR,
(C) NLR, (D) MPV, (E) PDW, (F) N#, (G) M%, (H) miR-130b, (I) N%,
(J) M#, (K) L#, (L) L%, (M) Hb, (N) Hct and (O) MLR, and cancer
stage. Hb, hemoglobin; Hct, hematocrit; L%, lymphocyte percentage;
L#, lymphocyte count; miR-130b, microRNA-130b; MLR, monocyte to
lymphocyte ratio; MPV, mean platelet volume; M%, monocyte
percentage; M#, monocyte count; N%, neutrophil percentage; N#,
neutrophil count; NLR, neutrophil to lymphocyte ratio; PDW,
platelet distribution width; PLR, platelet to lymphocyte ratio;
RDW-CV, red blood cell distribution width-coefficient of
variation. |
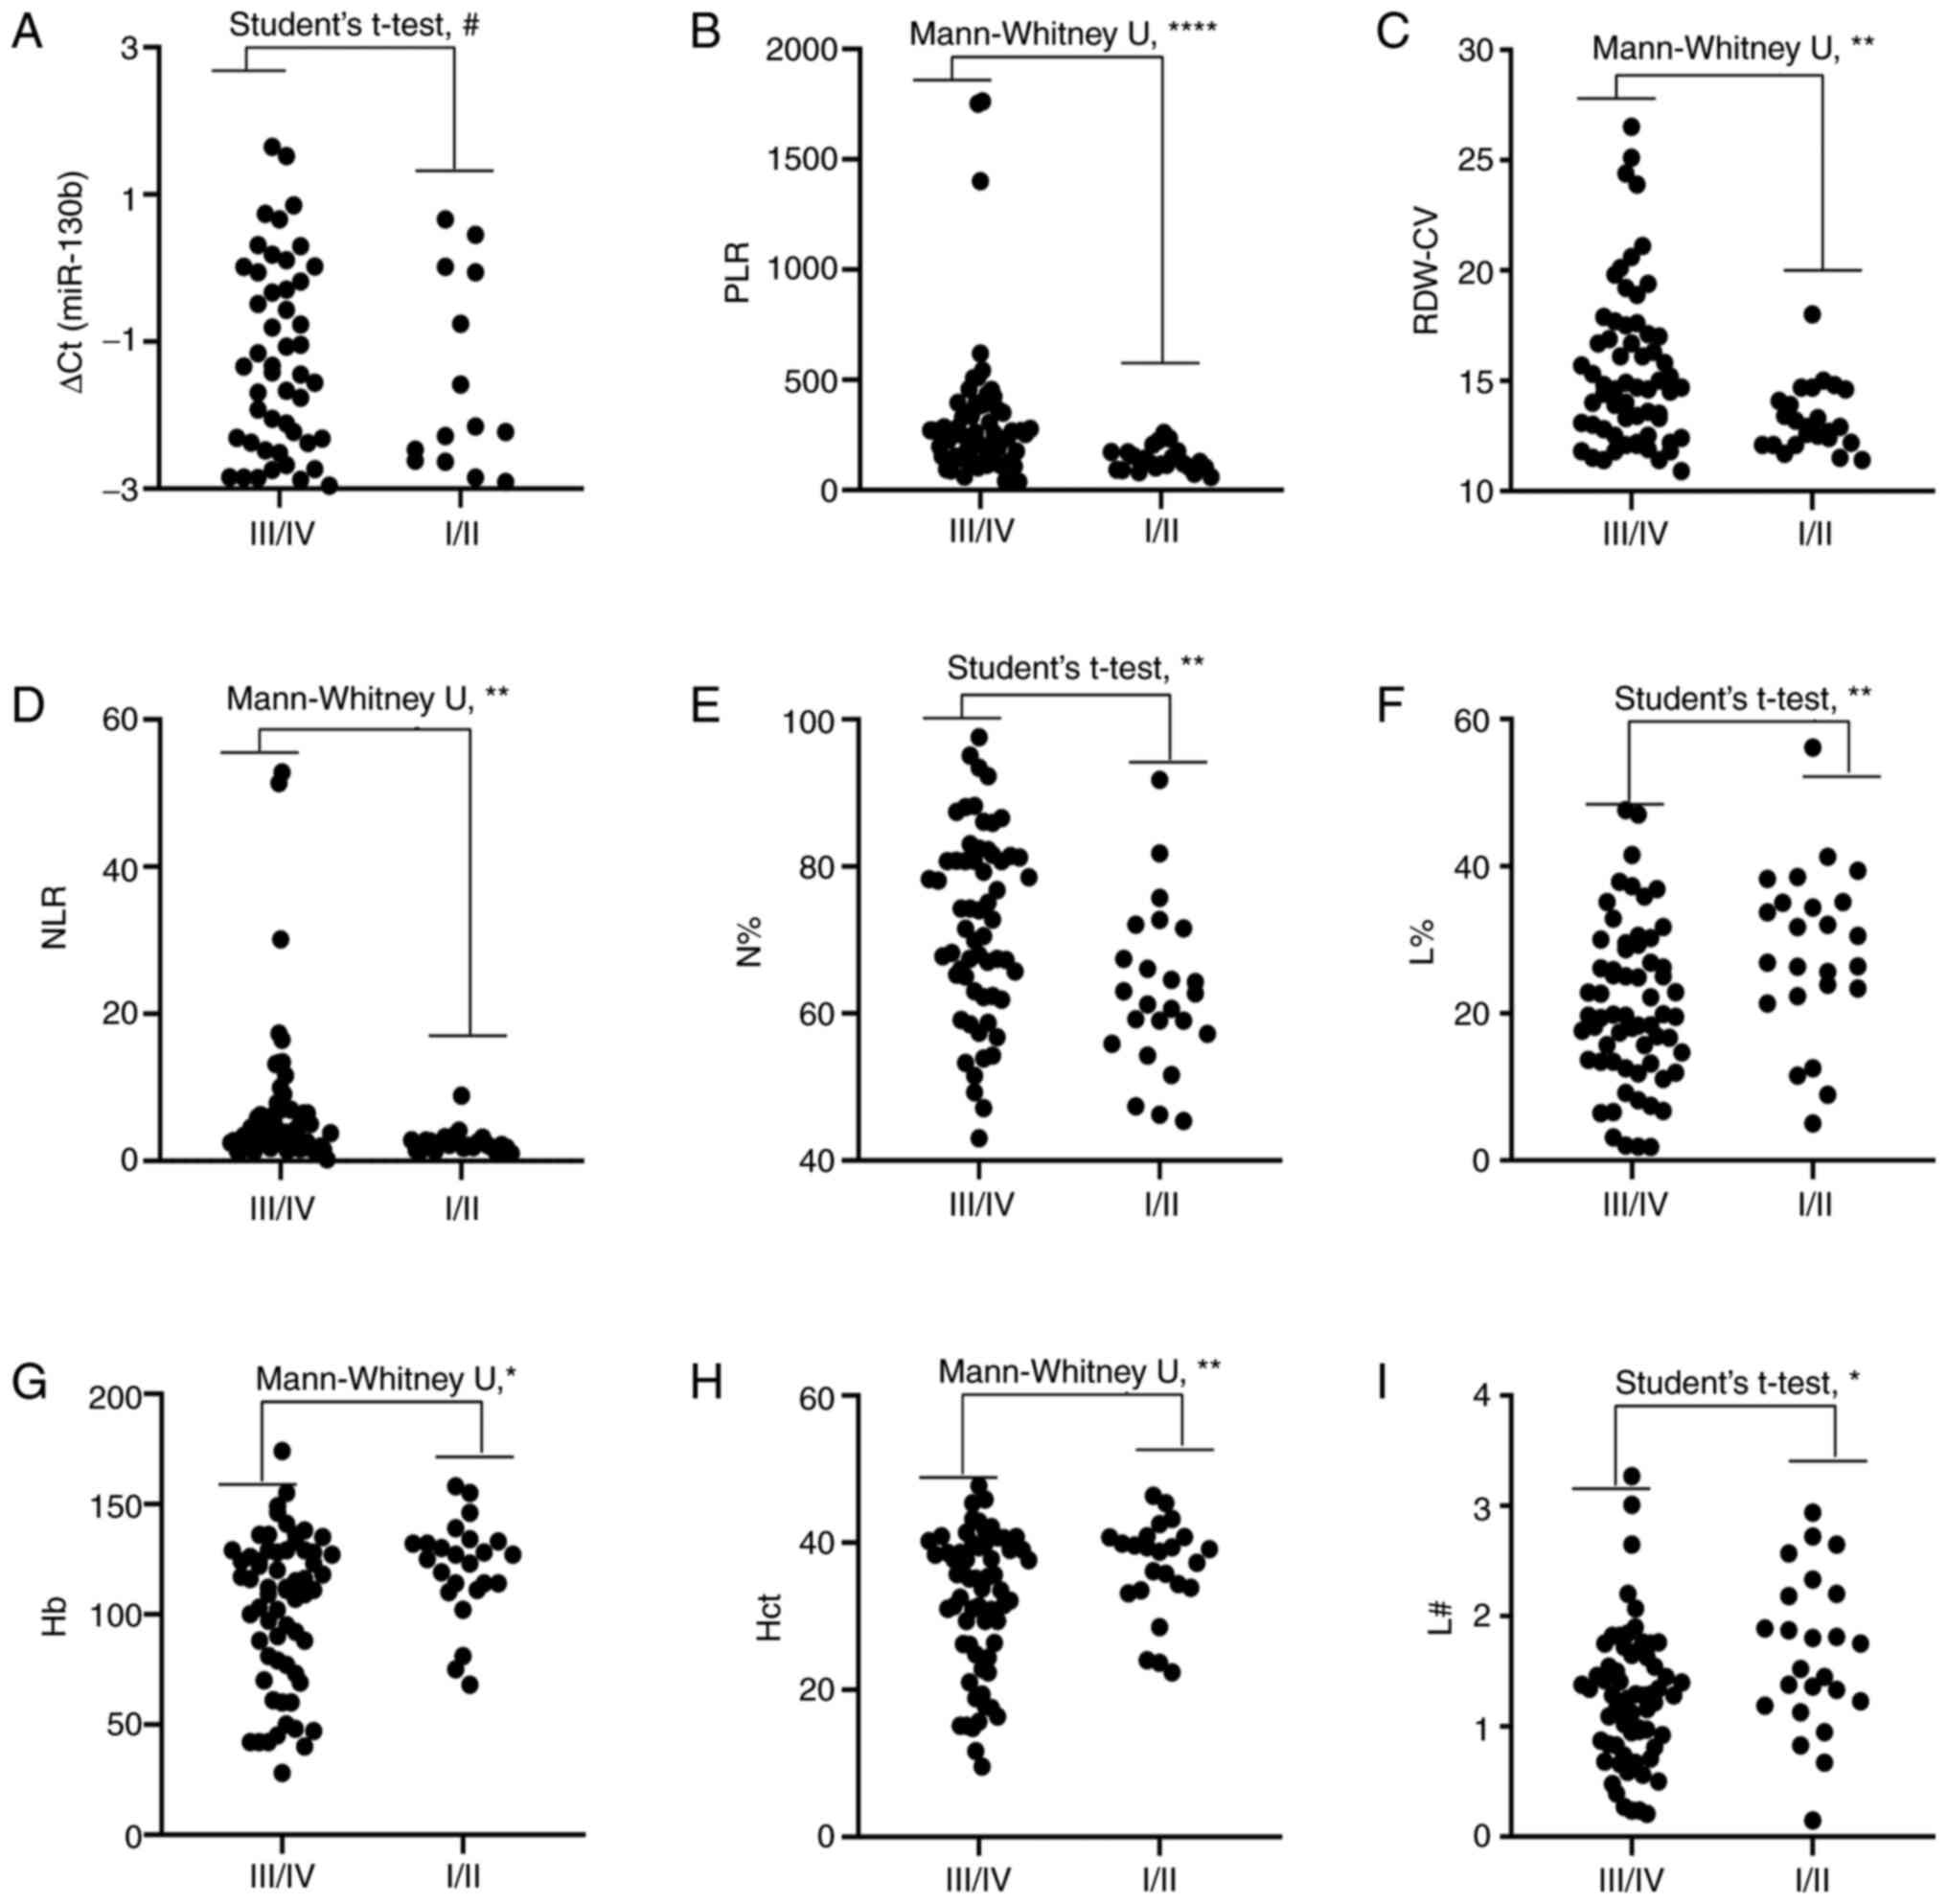 | Figure 5.Comparison of circulating biomarker
expression between the early stages (I/II) and advanced
pathological stages (III/IV) of gastric cancer. (A) ∆Cq value of
miR-130b, (B) PLR, (C) RDW-CV, (D) NLR, (E) N%, (F) L%, (G) Hb, (H)
Hct and (I) L#. Unpaired t-test or Mann-Whitney U test was used to
determine statistical significance at (#P>0.05,
*P<0.05, **P<0.01 and ****P<0.0001). Hb, hemoglobin; Hct,
hematocrit; L%, lymphocyte percentage; L#, lymphocyte count;
miR-130b, microRNA-130b; N%, neutrophil percentage; NLR, neutrophil
to lymphocyte ratio; PLR, platelet to lymphocyte ratio; RDW-CV, red
blood cell distribution width-coefficient of variation. |
Integrative diagnosis model for
discriminating EGC
To evaluate the role of circulating biomarkers in
the diagnosis of early GC (TNM I–II), the present study further
analyzed the levels of these markers (Fig. 6; Table
VI). As shown in Fig. 6A-C, G-I
and M-O, the circulating levels of mi-130b, NLR, RDW-CV, PDW, M%,
R#, Hct, Hb and MLR differed significantly between the early stage
group and the NC group. The results in Fig. 6D-F, J-L and P-R demonstrate the
diagnostic efficiency of circulating miR-130b, NLR, RDW-CV, PDW,
M%, R#, Hct, Hb and MLR individually for discriminating patients
with EGC from controls. As one-dimensional models, miRNA-130b,
RDW-CV, NLR, PDW, M%, R#, Hb, Hct, and MLR individually yielded AUC
values of 0.9110, 0.7130, 0.6491, 0.8037, 0.7367, 0.7019, 0.7745,
0.6935 and 0.7610, respectively. These results indicated that
miR-130b, NLR, RDW-CV, PDW, M%, R#, Hct, Hb and MLR could be used
as novel biomarkers for the early diagnosis of GC. To further
explore the diagnostic efficacy of joint markers, the biomarkers
with an AUC >0.77 (miR-130b, PDW and Hb) were further considered
for combinations. Among the two-dimensional models (i.e., the
models with two biomarkers), miR-130b-PDW yielded the greatest AUC
(0.956), followed by miR-130b-Hb (0.923) and PDW-Hb (0.906). The
combination of miR-130b with Hb had a significantly larger AUC
value (0.923; 0.833–0.974) compared with Hb alone (P=0.0181), and
the combination of PDW and Hb had a significantly larger AUC value
(0.906; 0.812–0.963) compared with Hb alone (P=0.0464). The
tri-model (miR-130b-PDW-Hb) had an AUC of 0.960 (0.883–0.993).
However, there were no significant differences in the AUC values
between the tri-model and dual-models (P=0.2250, P=0.4331 and
P=0.0940).
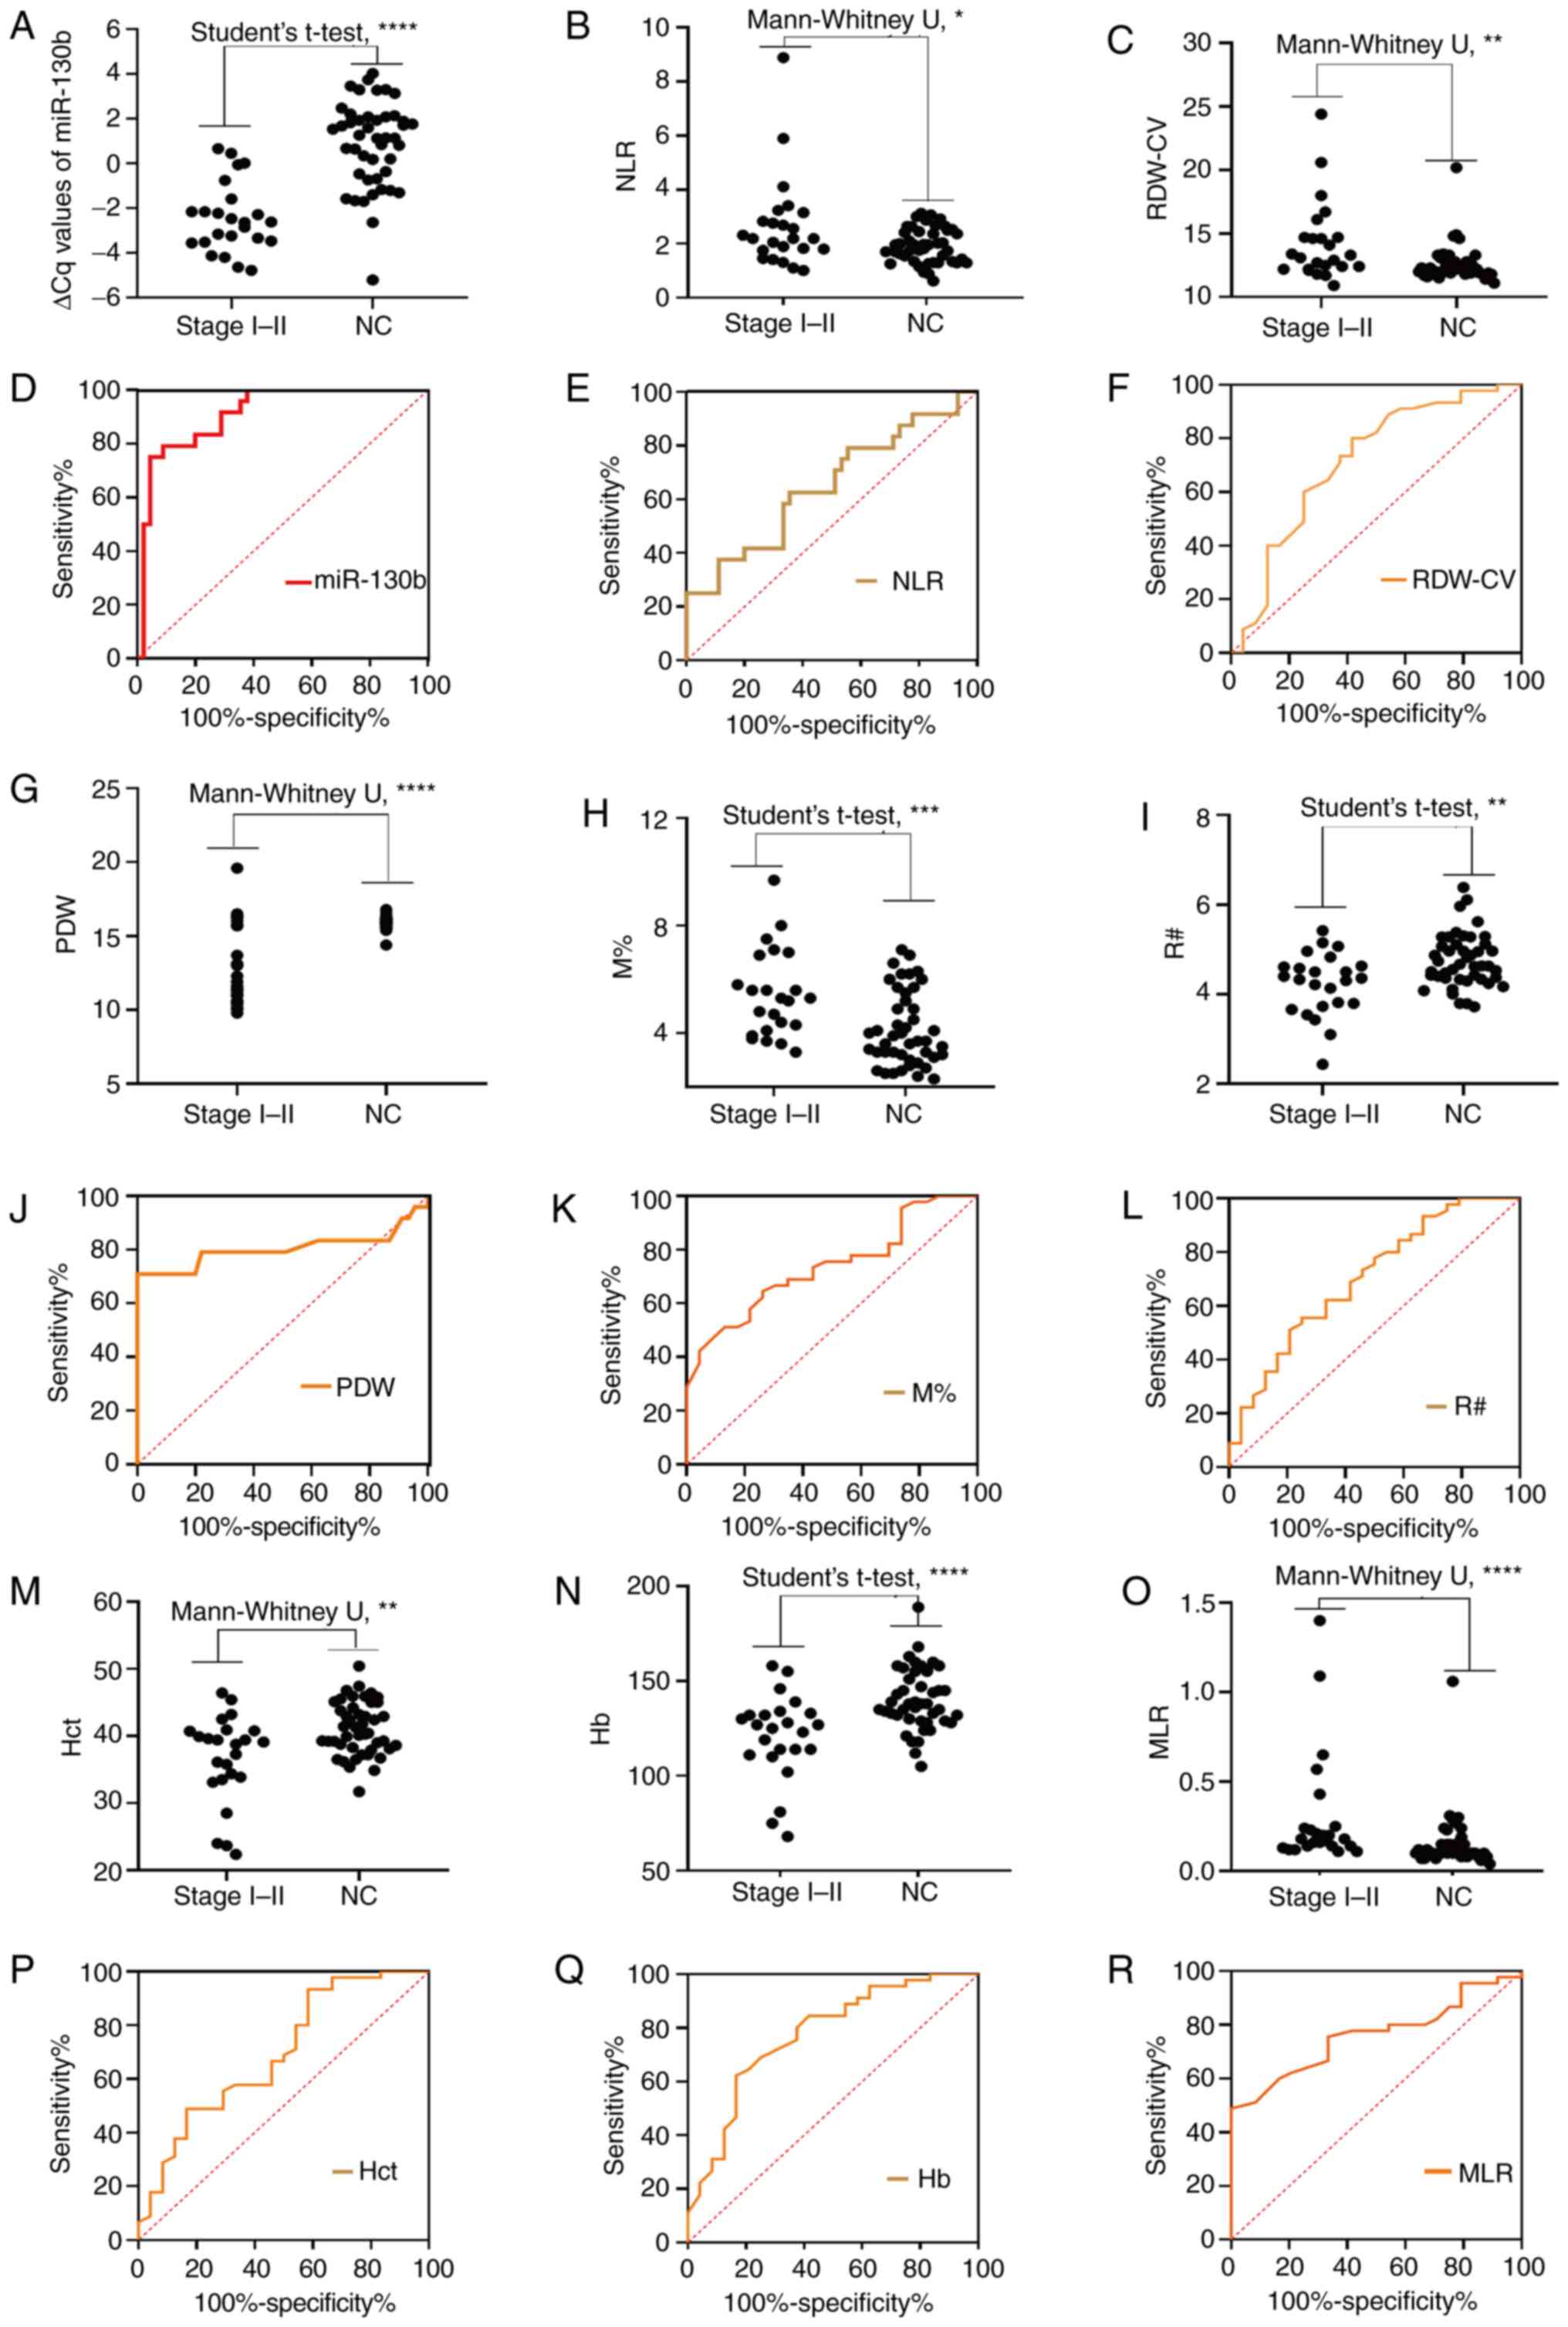 | Figure 6.Diagnosis of early stages (I/II) of
gastric cancer. Comparison of circulating biomarker expression
between the early stages (I/II) of gastric cancer and NCs. (A) ∆Cq
value of miR-130b, (B) NLR, (C) RDW-CV, (G) PDW, (H) M%, (I) R#,
(M) Hct, (N) Hb and (O) MLR. Unpaired t-test or Mann-Whitney U test
was used to determine statistical significance (*P<0.05,
**P<0.01, ***P<0.001 and ****P<0.0001). Area under the
curve of the expression of circulating biomarkers for early gastric
cancer diagnosis. (D) ∆Cq value of miR-130b, (E) NLR, (F) RDW-CV,
(J) PDW, (K) M%, (L) R#, (P) Hct, (Q) Hb and (R) MLR. Hb,
hemoglobin; Hct, hematocrit; miR-130b, microRNA-130b; MLR, monocyte
to lymphocyte ratio; M%, monocyte percentage; NC, healthy control;
NLR, neutrophil to lymphocyte ratio; PDW, platelet distribution
width; R#, red blood cell count; RDW-CV, red blood cell
distribution width-coefficient of variation. |
| Table VI.Receiver operating characteristic
analysis of circulating biomarkers individually and combined for
early stage gastric cancer detection. |
Table VI.
Receiver operating characteristic
analysis of circulating biomarkers individually and combined for
early stage gastric cancer detection.
| Models | AUC (95% CI) | P-value |
|---|
| One-dimensional
model |
|
|
|
miR-130b | 0.9110
(0.8417–0.9805) |
|
|
RDW-CV,% | 0.7130
(0.5770–0.8490) |
|
|
NLR | 0.6491
(0.5082–0.7900) |
|
|
PDW,% | 0.8037
(0.6616–0.9458) |
|
| M% | 0.7367
(0.6196–0.8539) |
|
|
R#,1012/l | 0.7019
(0.5715–0.8322) |
|
| Hb,
g/l | 0.7745
(0.6563–0.8928) |
|
|
Hct,% | 0.6935
(0.5601–0.8269) |
|
|
MLR | 0.7610
(0.6430–0.8560) |
|
| Dual-model |
|
|
|
miR-130b-PDW | 0.9560
(0.877–0.991) | 0.3775a; 0.0576b |
|
miR-130b-Hb | 0.9230
(0.833–0.974) | 0.7412a; 0.0181c |
|
PDW-Hb | 0.9060
(0.812–0.963) | 0.1731b; 0.0464c |
| Tri-model |
|
|
|
miR-130b-PDW-Hb | 0.960
(0.883–0.993) | 0.2250d; 0.4331e; 0.0940f |
Diagnostic performance of
tri-dimensional biomarkers for patients with EGC
The corresponding diagnostic accuracy parameters,
including sensitivity, specificity, accuracy, LR+,
LR− and DOR, are shown in Table VII. miR-130b and Hb had high
sensitivities (95.56 and 83.33%, respectively), RDW-CV, PDW, R# and
Hct had high specificities (80.00, 97.78, 97.78 and 93.33%,
respectively), and miR-130b, PDW and R# had high accuracy (82.15,
91.31 and 88.27%, respectively) for distinguishing early stage
cancer from NCs. The specificity and accuracy increased when
miR-130b and Hb were combined, and the sensitivity and accuracy
increased when miR-130b and PDW were combined. The combination of
miR-130b-PDW-Hb could not improve the sensitivity, specificity and
accuracy for the diagnosis of EGC in comparison with the
two-dimensional model of miR-130b-PDW. Furthermore, the combination
of miR-130b and PDW yielded the largest sensitivity, specificity,
accuracy, LR+ and DOR values, and the lowest
LR− value. These results indicated that miR-130b-PDW had
great diagnostic value for EGC and could be used as a non-invasive
diagnostic model for EGC.
| Table VII.Accuracy of miR-130b, PDW and Hb
individually and combined for early stage gastric cancer
detection. |
Table VII.
Accuracy of miR-130b, PDW and Hb
individually and combined for early stage gastric cancer
detection.
| Variable | Cut-off | Youden index J | Sensitivity, % | Specificity, % | Accuracy, % | LR+ | LR− | DOR |
|---|
| miR-130b | −2.15 | 0.71 | 95.56 | 75.00 | 82.15 | 3.82 | 0.06 | 64.57 |
| RDW-CV,% | 12.80 | 0.38 | 58.33 | 80.00 | 72.46 | 2.92 | 0.52 | 5.60 |
| NLR | 2.04 | 0.27 | 62.50 | 64.44 | 63.77 | 1.76 | 0.58 | 3.02 |
| PDW,% | 15.31 | 0.77 | 79.17 | 97.78 | 91.31 | 35.66 | 0.21 | 167.41 |
| M% | 4.20 | 0.38 | 73.91 | 64.44 | 67.64 | 2.08 | 0.40 | 5.13 |
|
R#,1012/l | 4.61 | 0.31 | 70.45 | 97.78 | 88.27 | 31.73 | 0.30 | 105.01 |
| Hb, g/l | 134 | 0.46 | 83.33 | 62.22 | 69.56 | 2.21 | 0.27 | 8.23 |
| Hct,% | 36.10 | 0.35 | 41.67 | 93.33 | 75.36 | 6.25 | 0.62 | 10.00 |
| MLR | 0.10 | 0.49 | 100.00 | 48.89 | 66.67 | 1.95 | – | – |
| miR-130b-PDW | 0.26 | 0.94 | 95.83 | 97.78 | 97.10 | 43.17 | 0.04 | 1,012.19 |
| miR-130b-Hb | 0.40 | 0.74 | 83.33 | 91.11 | 88.40 | 9.37 | 0.18 | 51.23 |
| PDW-Hb | 0.31 | 0.79 | 83.33 | 95.56 | 91.31 | 18.77 | 0.17 | 107.59 |
|
miR-130b-PDW-Hb | 0.29 | 0.94 | 95.83 | 97.78 | 97.10 | 43.17 | 0.04 | 1,012.19 |
Integrative diagnosis model for
discriminating precancerous gastric lesions
Based on the differences in RDW-CV, MPV/PC ratio,
MLR, NLR, PDW, L%, M%, M# and Hb between the Pre and NC groups
(Table I), the diagnostic analyses
of single or combinations of selected differentially expressed
biomarkers were conducted (Table
VIII; Fig. 7). As shown in
Table VIII, the AUC values for
miR-130b, RDW-CV, MPV/PC ratio, MLR, NLR, PDW, L %, M%, M# and Hb
were 0.700, 0.649, 0.687, 0.713, 0.616, 0.811, 0.638, 0.649, 0.657
and 0.679, respectively. To further explore the diagnostic efficacy
of joint models, the biomarkers with an AUC >0.70 (miR-130b, PDW
and MLR) were further considered for combinations. Among the
two-dimensional models (i.e., the models with two biomarkers),
miR-130b-PDW yielded the greatest AUC (0.896), followed by MLR-PDW
(0.816) and miR-130b-MLR (0.687). The dual-model miR-130b-PDW had a
significantly larger AUC 0.896 (0.827–0.944) compared with miR-130b
and PDW, respectively. The tri-model (miR-130b-PDW-MLR) yielded an
AUC value of 0.896 (0.827–0.944), which was larger than those of
the dual-models of miR-130b-MLR and MLR-PDW. However, there were no
significant differences in the AUC values between the tri-model
(miR-130b-MLR-PDW) and the dual-model (miR-130b-PDW).
 | Figure 7.ROC curve analyses of circulating
biomarkers for Pres. ROC analysis for detection of Pres using (A)
miR-130b, (B) RDW-CV, (C) MPV/PC, (D) MLR, (E) NLR, (F) PDW, (G)
L%, (H) M%, (I) M#, (J) Hb, (K) miR-130b-PDW and (L)
miR-130b-MLR-PDW. Hb, hemoglobin; L%, lymphocyte percentage;
miR-130b, microRNA-130b; MLR, monocyte to lymphocyte ratio; MPV/PC,
mean platelet volume to platelet count ratio; M%, monocyte
percentage; M#, monocyte count; NLR, neutrophil to lymphocyte
ratio; PDW, platelet distribution width; RDW-CV, red blood cell
distribution width-coefficient of variation; ROC, receiver
operating characteristic; Pres, precancerous gastric lesions. |
| Table VIII.Receiver operating characteristic
analysis of circulating biomarkers individually and combined for
precancerous lesion detection. |
Table VIII.
Receiver operating characteristic
analysis of circulating biomarkers individually and combined for
precancerous lesion detection.
| Models | AUC (95% CI) | P-value |
|---|
| One-dimensional
model |
|
|
|
miR-130b | 0.700
(0.613–0.788) |
|
| RDW-CV,
% | 0.649
(0.557–0.733) |
|
| MPV/PC
ratio | 0.687
(0.597–0.768) |
|
|
MLR | 0.713
(0.624–0.791) |
|
|
NLR | 0.616
(0.524–0.702) |
|
| PDW,
% | 0.811
(0.730–0.877) |
|
| L% | 0.638
(0.546–0.723) |
|
| M% | 0.649
(0.558–0.733) |
|
| M#
109/l | 0.657
(0.565–0.741) |
|
| Hb, g/l | 0.679
(0.588–0.761) |
|
| Dual-model |
|
|
|
miR-130b-MLR | 0.687
(0.597–0.768) | 0.8154a; 0.7273b |
|
miR-130b-PDW | 0.896
(0.827–0.944) |
<0.0001a; 0.0028c |
|
MLR-PDW | 0.816
(0.736–0.881) | 0.1069b; 0.0832c |
| Tri-model |
|
|
|
miR-130b-MLR-PDW | 0.896
(0.827–0.944) | 0.0001d; 0.6849e; 0.0049f |
Diagnostic performance of
tri-dimensional biomarkers for patients with Pres
The corresponding diagnostic accuracy parameters,
including sensitivity, specificity, accuracy, LR+,
LR− and DOR, are shown in Table IX. MLR and PDW had high
sensitivities for distinguishing Pres from NCs (77.92 and 72.37%,
respectively), miR-130b, NLR and L% had high specificities (93.30,
100.00 and 100.00%, respectively), and PDW had high accuracy
(81.74%). The sensitivity and accuracy increased when miR-130b and
PDW were combined. Furthermore, the combination of MLR-PDW yielded
the largest LR+ and DOR values. However, the combination
of miR-130b-MLR-PDW could not improve the sensitivity, specificity
and accuracy for the diagnosis of precancerous gastric lesions.
These results indicated that the dual-model of miR-130b-PDW was an
appropriate and non-invasive diagnostic model for Pres.
| Table IX.Accuracy of circulating biomarkers
individually and combined for Pre detection. |
Table IX.
Accuracy of circulating biomarkers
individually and combined for Pre detection.
| Pre vs. NC | AUC (95% CI) | Cut-off | Youden index J | Sensitivity, % | Specificity, % | Accuracy, % | LR+ | LR− | DOR |
|---|
| RDW-CV | 0.649
(0.557–0.733) | 12.40 | 0.2808 | 63.64 | 64.44 | 63.94 |
1.79 | 0.56 |
3.17 |
| MPV/PC ratio | 0.687
(0.597–0.768) | 0.04 | 0.2973 | 51.95 | 77.78 | 61.48 |
2.34 | 0.62 |
3.78 |
| MLR | 0.713
(0.624–0.791) | 0.12 | 0.3792 | 77.92 | 60.00 | 71.31 |
1.95 | 0.37 |
5.29 |
| NLR | 0.616
(0.524–0.702) | 3.12 | 0.3506 | 35.06 | 100.00 | 59.01 | – | 0.65 | – |
| PDW | 0.811
(0.730–0.877) | 15.31 | 0.7015 | 72.37 | 97.78 | 81.74 | 32.60 | 0.28 | 115.37 |
| L% | 0.638
(0.546–0.723) | 21.71 | 0.3377 | 33.77 | 100.00 | 58.20 | – | 0.66 | – |
| M% | 0.649
(0.558–0.733) | 4.50 | 0.2547 | 57.14 | 68.89 | 61.47 |
1.84 | 0.62 |
2.95 |
| M# | 0.657
(0.565–0.741) | 0.25 | 0.2974 | 69.74 | 60.00 | 66.15 |
1.74 | 0.50 |
3.46 |
| Hb | 0.679
(0.588–0.761) | 127.00 | 0.3250 | 48.05 | 84.44 | 61.47 |
3.09 | 0.62 |
5.02 |
| miR-130b-MLR | 0.687
(0.597–0.768) | 0.68 | 0.4343 | 54.55 | 88.89 | 67.22 |
4.91 | 0.51 |
9.60 |
| miR-130b-PDW | 0.896
(0.827–0.944) | 0.51 | 0.7623 | 82.89 | 93.33 | 86.77 | 12.43 | 0.18 |
67.79 |
| MLR-PDW | 0.816
(0.736–0.881) | 0.51 | 0.7146 | 73.68 | 97.78 | 82.64 | 33.19 | 0.27 | 123.30 |
|
miR-130b-MLR-PDW | 0.896
(0.827–0.944) | 0.51 | 0.7623 | 82.89 | 93.33 | 86.77 | 12.43 | 0.18 |
67.79 |
Baseline characteristics
A total of 90 patients with GC were included in the
present study, including 46 men and 44 women, with a mean age of 65
years (range, 36–89 years). The age range was 29–88 (mean, 64.5
years) years for the 90 patients with Pres, including 48 male
patients and 42 female patients. A total of 45 NCs (age range,
39–80 years) with a mean age of 65 years, including 21 male
patients and 24 female patients, were included. In the present
study, no significant differences were observed in age and sex
(P=0.9598 and P=0.7658, respectively). The clinical characteristics
of all patients are summarized in Table
X.
| Table X.Clinicopathological characteristics
of all individuals by subgroup. |
Table X.
Clinicopathological characteristics
of all individuals by subgroup.
|
Characteristics | GC (n=90) | Pre (n=90) | NC (n=45) | P-value |
|---|
| Mean age ± SD,
years | 65±12.7 | 64.5±14.4 | 65±5.1 | 0.9598a |
| Sex,
male/female | 46/44 | 48/42 | 21/24 | 0.7658b |
| TNM stage, n |
|
|
|
|
| I | 22 |
|
|
|
| II | 8 |
|
|
|
|
III | 13 |
|
|
|
| IV | 47 |
|
|
|
| Differentiation
degree, n |
|
|
|
|
|
High | 19 |
|
|
|
|
Moderate | 46 |
|
|
|
|
Poor | 25 |
|
|
|
| Histological type,
n |
|
|
|
|
|
Adenocarcinoma | 68 |
|
|
|
|
Mucinous carcinoma | 6 |
|
|
|
| Signet
ring cell carcinoma | 5 |
|
|
|
|
Adenocarcinoma with signet
ring cell carcinoma | 11 |
|
|
|
| Histological type,
n |
|
|
|
|
|
Intestinal metaplasia |
| 82 |
|
|
|
Atypical hyperplasia and other
type |
| 8 |
|
|
Discussion
The early diagnosis of GC is of great significance.
In the present study, an integrated analysis was performed and it
was revealed that plasma miR-130b and partial parameters of blood
routine, such as PDW, RDW, MLR, NLR, and PLR, were dysregulated in
Pres, EGC and GC. Furthermore, the early diagnostic value of
miR-130b and blood routine parameters alone or in combination was
explored and an optimal diagnostic model for GC, EGC and Pre was
identified.
Previous studies have reported that miR-130b
(24) is dysregulated in various
cancer types, including GC (25–29). It
has been reported that miR-130b promotes cell proliferation,
migration and invasion, and serves as a biomarker of a poor
prognosis in lung cancer (25). Zhu
et al (28) reported that
miR-130b is upregulated in esophageal squamous cell carcinoma tumor
tissues and cells, acting as a tumor promoter by targeting SAM and
SH3 domain containing 1. In ovarian cancer, miR-130b downregulation
has been associated with progression, multidrug resistance and poor
histological differentiation (30).
In breast cancer and lung cancer, miR-130b contributes to
chemoresistance by activating the phosphoinositol 3 kinase/protein
kinase B and Wnt/β catenin signaling pathways (31,32).
Furthermore, it has been documented that miR-130b upregulation may
be associated with enhanced epithelial-mesenchymal transition and
angiogenesis in colorectal cancer (33). Lai et al (29) revealed that miR-130b expression is
higher in gastric tissues compared with that in matched normal
tissue, and this decreases the growth suppressive potential of RUNX
family transcription factor 3 and contributes to tumorigenesis.
Similarly, the present results demonstrated that circulating
miRNA-130b was highly expressed in patients with GC, Pres and EGC,
and it was significantly associated with the TNM stage of GC.
Furthermore, the present study revealed that the AUC value of
miR-130b was 0.887 for the diagnosis of GC, 0.911 for the diagnosis
of EGC and 0.700 for the diagnosis of Pres, suggesting that
miR-130b may contribute to the development of GC and could be a
useful screening biomarker for EGC and Pres.
As an important parameter reflecting the
heterogeneity of erythrocyte volume, RDW is often used in the
diagnosis and observation of the curative effect of iron deficiency
anemia, the differential diagnosis of small cell hypochromic anemia
and the differential diagnosis of anemia (34). Beyazit et al (9) revealed that elevated RDW can serve as a
useful biomarker for differentiating benign from malignant causes
of biliary obstruction, with a sensitivity of 72% and a specificity
of 69%. Spell et al (10)
reported that RDW yielded 84% sensitivity and 88% specificity for
distinguishing between right-sided colon cancer cases and healthy
subjects. In breast cancer diagnosis, Seretis et al
(35) also suggested that RDW may be
a novel biomarker inversely associated with the tumor grade. The
present study revealed that elevated RDW in the peripheral blood
was a useful biomarker for the early diagnosis of GC, which was in
line with results from a previous study (8). A previous study revealed that RDW
levels in GC might be influenced by inflammation and iron loss
associated with chronic inflammatory status (36). An earlier study revealed that
response to elevated levels of pro-inflammatory factors in cancer,
erythropoietic activity, and therefore iron metabolism and
homeostasis, are impaired (37). In
addition, previous studies have revealed that RDW is positively
associated with the conventional tumor markers CEA and CA19-9 in
colorectal cancer (38), and tumor
stage in ovarian cancer (39). The
present study demonstrated that RDW was positively associated with
circulating markers CA50 and CA125, and the pathological staging of
GC. Therefore, the increased RDW may be associated with the
occurrence, development and prognosis of GC, and it might be an
excellent circulating marker for the early diagnosis of GC.
Anemia is a common complication of cancer, which is
associated with the energy level and quality of life score of
patients (40). As a prognostic
predictor, Hct has been reported in renal cell carcinoma, lung
cancer and triple-negative breast cancer (41–43).
Zhang et al (44)
demonstrated that lower levels of Hb predict worse survival rate of
patients with advanced GC. However, to the best of our knowledge,
the value of Hb and Hct in the diagnosis of GC has not been
reported. To the best of our knowledge, the present study was the
first to reveal that both Hb and Hct could be useful biomarkers for
GC, especially for EGC. As is well known, advanced stage is
associated with a poor prognosis of GC (2). In further analysis in the present
study, it was revealed that Hb and Hct were negatively correlated
with cancer stage, which suggested that Hb and Hct may be
associated with the severity of GC. It should be noted that
numerous clinicopathological factors can affect Hct levels. For
example, low Hct is more likely to occur in patients with advanced
stage, anemia and low albumin (45).
Therefore, these interference factors should be excluded when low
Hct is used as a prognostic indicator.
PDW is a parameter reflecting the variation of
platelet volume in the blood, and it is considered to be an
indicator of platelet activation (46). A previous study demonstrated that PDW
levels in patients with GC and Pres were lower than those in NCs
(47). However, in the present
study, there was no significant difference among the GC, Pre and NC
groups, and the reasons for this require further study. MPV is an
early indicator of platelet activation. In a study from China, Yun
et al (48) stated that
decreased levels of MPV in GC could be a potential biomarker for
follow-up independently of tumor stage. The present study revealed
higher levels of MPV in the GC and Pre groups than in the NC group,
which was similar to a previous study (49). MPV/PC has been preferentially
proposed as a predictor of patients with cancer (50). However, the association between
MPV/PC and cancer is inconsistent. Sun et al (51) reported a higher MPV/PC ratio in
patients with hepatocellular carcinoma compared with that in the
control group. By contrast, a decrease in the MPV/PC ratio was
detected in patients with advanced non-small cell lung carcinoma
(52). In the present study,
although the MPV/PC ratio of Pres was higher than that of the
normal group, there was no difference between patients with GC and
the control group. Additionally, the MPV/PC ratio has been
recommended to be measured to differentiate iron deficiency anemia
from other types of anemia (51).
Therefore, the MPV/PC ratio could have potential clinical value in
the identification of patients with GC. However, further
investigations should be conducted to clarify the pathogenic
mechanisms of the MPV/PC ratio in GC.
The other inflammatory parameters in the present
study were L#, L%, N#, N%, M#, M%, NLR, PLR and MLR. It has been
reported that platelet count, MPV, RDW, NLR and PLR can be used as
circulating tumor markers to discriminate GCs from NCs (8). As reported by Chen et al
(6), MLR can be used as a predictor
to assess the survival rate of patients with advanced GC receiving
chemotherapy. A previous study also reported that MLR may be a
potential biomarker for predicting the overall survival rate of
patients with advanced GC (53). The
present results appear to be similar to these previous reports
(6,8). Studies have demonstrated that high
levels of NLR and PLR are associated with a poor prognosis in colon
cancer, ovarian cancer and GC (7,8). The
present results agree with the findings of Aldemir et al
(54), Yu et al (55) and Lian et al (56). The direct mechanism is not entirely
understood. However, it seems most likely that increased
neutrophil- and platelet-associated inflammation and decreased
lymphocyte-dependent antitumor cellular immune response are closely
associated with tumorigenesis. These changes result in an increase
in neutrophil and platelet levels, and a decrease in lymphocyte
levels (57). In addition, the
present study was one of the few studies to focus specifically on
the diagnostic value of NLR and PLR in patients with GC compared
with past research (58). In the
present study, NLR and PLR levels in GC were higher than those in
NCs, and they were independently associated with the presence of
GC. Notably, the data also revealed that NLR and PLR were
positively correlated with GC staging and traditional tumor
markers.
Combinations of biomarkers, such as circulating
miR-19a-3p and miR-483-5p, can enhance the diagnostic performance
in various cancer types (59–62).
Notably, Chen et al (18)
recently demonstrated that miR-650 combined with CA211 could be an
effective diagnostic indicator for screening of the incidence of
GC. Sun et al (63)
demonstrated that the combination of serum multi-dimensional
biomarkers could further improve the specificity and sensitivity of
GC detection, thus achieving higher diagnostic efficiency. In the
present study, a predictive diagnostic model of association for GC,
EGC and Pres was developed. Different combinations were tested to
elucidate subsets of potential biomarkers used to separate early
and advanced stage patients. Furthermore, the present study
evaluated the diagnostic performance of a four-dimensional
biomarker panel for GC detection using AUC analysis. Overall, the
combination of four-dimensional biomarkers improved the diagnostic
accuracy for GC, with an accuracy of 93.94%, a DOR of 503.10 and an
LR+ of 41.42, which were better than those of one-, two-
or tri-dimensional biomarkers. It confirmed that such
four-dimensional biomarkers had potential value as a warning sign
of GC. Subsequently, the combinations of miR-130b with PDW and Hb
had larger AUC values for EGC compared with one- or two-dimensional
biomarkers, suggesting that using these combined markers may
improve the early detection of GC. Finally, the present study
assessed the diagnostic performance of a three-dimensional
biomarker panel for Pre detection using AUC analysis. Results
demonstrated that the combination of miR-130b and PDW was better
than any other single indicator or combination of indicators. Based
on the aforementioned analysis results, it was hypothesized that
circulating miR-130b and blood routine parameters were effective
early warning indicators for early diagnosis of GC.
Although the results of the present study have
certain clinical value, there were several limitations. Firstly, in
view of the small number of included cases, although valuable
results have been achieved in the present study, the time point at
which these indicators are measured is unclear and their specific
application has not been assessed. Therefore, clear consequences
cannot be obtained, and further research is required. Secondly,
Helicobacter pylori is an important carcinogen of GC. The
present study did not investigate the relationship between H.
pylori and mir-130 in GC, which is also a focus of further
research. Finally, there was no specific genotyping in patients
with GC, and miRNA expression might be different between gene
subtypes. Therefore, the significance of miR-130b and blood routine
parameters in the early diagnosis of GC requires further study.
In conclusion, miRNA-130b, which was upregulated in
GC, may be a novel early diagnostic marker for GC. Furthermore,
using ROC curve analysis, the optimal cut-off values of the markers
could be determined and the diagnosis of GC could be improved based
on these blood routine markers. Novel screening models (miR-130b
combined with blood routine parameters) were developed in the
present study, and the optimal application of these circulating
tumor markers could promote the clinical screening and diagnosis of
GC, which patients may be more willing to accept for the detection
of GC over more invasive tests.
Acknowledgements
Not applicable.
Funding
The present study was supported by a grant from the
Guangxi Zhuang Autonomous Region Health and Family Planning
Commission (no. Z2014613). The funders had no role in study design,
data collection and analysis, decision to publish, or preparation
of the manuscript.
Availability of data and materials
The datasets used and/or analyzed during the current
study are available from the corresponding author on reasonable
request.
Authors' contributions
JC conceived the idea, designed the study protocol
and performed the experiments. ZL, GG, YM, HZ, WH, LW, XH, JD, CL,
HL, JF and YS carried out the data collection and data analysis,
and provided the critical revision. XG analyzed and interpreted the
data, was involved in drafting and revision of the manuscript and
gave final approval of the version to be published. JC, ZL and YS
confirm the authenticity of all the raw data. All authors read and
approved the final manuscript, and agree to be accountable for all
aspects of the research in ensuring that the accuracy or integrity
of any part of the work are appropriately investigated and
resolved.
Ethics approval and consent to
participate
The present study was approved by The Ethical Review
Committee of Affiliated Liutie Central Hospital of Guangxi Medical
University (Liuzhou, China). All patients provided written informed
consent.
Patient consent for publication
Not applicable.
Competing interests
The authors declare that they have no competing
interests.
References
|
1
|
Zhang H, Zhong X, Zhang X, Shang D, Zhou
YI and Zhang C: Enhanced anticancer effect of ABT-737 in
combination with naringenin on gastric cancer cells. Exp Ther Med.
11:669–673. 2016. View Article : Google Scholar : PubMed/NCBI
|
|
2
|
Hamashima C: The burden of gastric cancer.
Ann Transl Med. 8:7342020. View Article : Google Scholar : PubMed/NCBI
|
|
3
|
Feng F, Tian Y, Xu G, Liu Z, Liu S, Zheng
G, Guo M, Lian X, Fan D and Zhang H: Diagnostic and prognostic
value of CEA, CA19-9, AFP and CA125 for early gastric cancer. BMC
Cancer. 17:7372017. View Article : Google Scholar : PubMed/NCBI
|
|
4
|
Thanh Huong P, Gurshaney S, Thanh Binh N,
Gia Pham A, Hoang Nguyen H, Thanh Nguyen X, Pham-The H, Tran PT,
Truong Vu K, Xuan Duong N, et al: Emerging role of circulating
tumor cells in gastric cancer. Cancers (Basel). 12:6952020.
View Article : Google Scholar : PubMed/NCBI
|
|
5
|
Hussain SP and Harris CC: Inflammation and
cancer: An ancient link with novel potentials. Int J Cancer.
121:2373–2380. 2007. View Article : Google Scholar : PubMed/NCBI
|
|
6
|
Chen L, Hao Y, Zhu L, Li S, Zuo Y, Zhang
Y, Song H and Xue Y: Monocyte to lymphocyte ratio predicts survival
in patients with advanced gastric cancer undergoing neoadjuvant
chemotherapy. Onco Targets Ther. 10:4007–4016. 2017. View Article : Google Scholar : PubMed/NCBI
|
|
7
|
Jiang Y, Xu H, Jiang H, Ding S and Zheng
T: Pretreatment neutrophil-lymphocyte count ratio may associate
with gastric cancer presence. Cancer Biomark. 16:523–528. 2016.
View Article : Google Scholar : PubMed/NCBI
|
|
8
|
Pietrzyk L, Plewa Z, Denisow-Pietrzyk M,
Zebrowski R and Torres K: Diagnostic power of blood parameters as
screening markers in gastric cancer patients. Asian Pac J Cancer
Prev. 17:4433–4437. 2016.PubMed/NCBI
|
|
9
|
Beyazit Y, Kekilli M, Ibis M, Kurt M,
Sayilir A, Onal IK, Purnak T, Oztas E, Tas A, Yesil Y and Arhan M:
Can red cell distribution width help to discriminate benign from
malignant biliary obstruction? A retrospective single center
analysis. Hepatogastroenterology. 59:1469–1473. 2012.PubMed/NCBI
|
|
10
|
Spell DW, Jones DV Jr, Harper WF and David
Bessman J: The value of a complete blood count in predicting cancer
of the colon. Cancer Detect Prev. 28:37–42. 2004. View Article : Google Scholar : PubMed/NCBI
|
|
11
|
Dhahbi JM, Atamna H, Li R, Yamakawa A,
Guerrero N, Lam HT, Mote P and Spindler SR: MicroRNAs circulate in
the hemolymph of drosophila and accumulate relative to tissue
microRNAs in an Age-dependent manner. Genomics Insights. 9:29–39.
2016. View Article : Google Scholar : PubMed/NCBI
|
|
12
|
Schetter AJ, Heegaard NH and Harris CC:
Inflammation and cancer: Interweaving microRNA, free radical,
cytokine and p53 pathways. Carcinogenesis. 31:37–49. 2010.
View Article : Google Scholar : PubMed/NCBI
|
|
13
|
Garrido-Cano I, Constâncio V,
Adam-Artigues A, Lameirinhas A, Simón S, Ortega B, Martínez MT,
Hernando C, Bermejo B, Lluch A, et al: Circulating miR-99a-5p
expression in plasma: A potential biomarker for early diagnosis of
breast cancer. Int J Mol Sci. 21:74272020. View Article : Google Scholar : PubMed/NCBI
|
|
14
|
Ghosh S, Bhowmik S, Majumdar S, Goswami A,
Chakraborty J, Gupta S, Aggarwal S, Ray S, Chatterjee R,
Bhattacharyya S, et al: The exosome encapsulated microRNAs as
circulating diagnostic marker for hepatocellular carcinoma with low
alpha fetoprotein. Int J Cancer. 147:2934–2947. 2020. View Article : Google Scholar : PubMed/NCBI
|
|
15
|
Ying L, Du L, Zou R, Shi L, Zhang N, Jin
J, Xu C, Zhang F, Zhu C, Wu J, et al: Development of a serum miRNA
panel for detection of early stage non-small cell lung cancer. Proc
Natl Acad Sci USA. 117:25036–25042. 2020. View Article : Google Scholar : PubMed/NCBI
|
|
16
|
Liu X and Chu KM: Exosomal miRNAs as
circulating biomarkers for prediction of development of
haematogenous metastasis after surgery for stage II/III gastric
cancer. J Cell Mol Med. 24:6220–6232. 2020. View Article : Google Scholar : PubMed/NCBI
|
|
17
|
Kong Y, Ning L, Qiu F, Yu Q and Cao B:
Clinical significance of serum miR-25 as a diagnostic and
prognostic biomarker in human gastric cancer. Cancer Biomark.
24:477–483. 2019. View Article : Google Scholar : PubMed/NCBI
|
|
18
|
Chen J, Wu L, Sun Y, Luo C, Chen X, Wu L,
Ding J, Pan G, Han C, Wu Z and Shen Y: Diagnostic value and
clinical significance of circulating miR-650 and CA211 in detecting
of gastric carcinoma. Oncol Lett. 20:2542020. View Article : Google Scholar : PubMed/NCBI
|
|
19
|
Catalano V, Sisti V, Spada D, Graziano F,
Cicetti M, Alessandroni PGP, Baldelli AM, Casadei V, Fedeli SL,
Rossi D, et al: Assessment of the 7th edition of the AJCC
classification and a proposal of a new classification in patients
with gastric cancer undergoing D2 gastrectomy. J Clin Oncol. 30
(Suppl 15):S40842012. View Article : Google Scholar
|
|
20
|
Bosman FT, Carneiro F, Hruban RH and
Theise ND: WHO Classification of Tumours of the Digestive System.
World Health Organization Classification of Tumours. 3. 4th
edition. Lyon France: 2010
|
|
21
|
Yamano T, Kubo S, Sonoda E, Kominato T,
Kimura K, Yasuhara M, Kataoka K, Son J, Babaya A, Takenaka Y, et
al: Assessment of circulating microRNA specific for patients with
familial adenomatous polyposis. PLoS One. 16:e02500722021.
View Article : Google Scholar : PubMed/NCBI
|
|
22
|
Livak KJ and Schmittgen TD: Analysis of
relative gene expression data using real-time quantitative PCR and
the 2(-Delta Delta C(T)) Method. Methods. 25:402–408. 2001.
View Article : Google Scholar : PubMed/NCBI
|
|
23
|
Chen J, Wu L, Sun Y, Yin Q, Chen X, Liang
S, Meng Q, Long H, Li F, Luo C and Xiao X: Mir-421 in plasma as a
potential diagnostic biomarker for precancerous gastric lesions and
early gastric cancer. PeerJ. 7:e70022019. View Article : Google Scholar : PubMed/NCBI
|
|
24
|
Burmistrova OA, Goltsov AY, Abramova LI,
Kaleda VG, Orlova VA and Rogaev EI: MicroRNA in schizophrenia:
Genetic and expression analysis of miR-130b (22q11). Biochemistry
(Mosc). 72:578–582. 2007. View Article : Google Scholar : PubMed/NCBI
|
|
25
|
Kim Y, Kim H, Bang S, Jee S and Jang K:
MicroRNA-130b functions as an oncogene and is a predictive marker
of poor prognosis in lung adenocarcinoma. Lab Invest. 101:155–164.
2021. View Article : Google Scholar : PubMed/NCBI
|
|
26
|
Ou C, Peng NF, Li H, Peng YC and Li LJQ:
The potential mechanism of miR-130b on promotion of the invasion
and metastasis of hepatocellular carcinoma by inhibiting
Notch-Dll1. J Recept Signal Transduct Res. 40:157–165. 2020.
View Article : Google Scholar : PubMed/NCBI
|
|
27
|
Hashimoto Y, Shiina M, Dasgupta P,
Kulkarni P, Kato T, Wong RK, Tanaka Y, Shahryari V, Maekawa S,
Yamamura S, et al: Upregulation of miR-130b contributes to risk of
poor prognosis and racial disparity in African-American prostate
cancer. Cancer Prev Res (Phila). 12:585–598. 2019. View Article : Google Scholar : PubMed/NCBI
|
|
28
|
Zhu Y, Ma Y, Peng H, Gong L, Xiao M, Xiang
L, He D and Cao K: miR-130b promotes the progression of oesophageal
squamous cell carcinoma by targeting SASH1. J Cell Mol Med.
23:93–103. 2019. View Article : Google Scholar : PubMed/NCBI
|
|
29
|
Lai KW, Koh KX, Loh M, Tada K, Subramaniam
MM, Lim XY, Vaithilingam A, Salto-Tellez M, Iacopetta B, Ito Y, et
al: MicroRNA-130b regulates the tumour suppressor RUNX3 in gastric
cancer. Eur J Cancer. 46:1456–1463. 2010. View Article : Google Scholar : PubMed/NCBI
|
|
30
|
Yang C, Cai J, Wang Q, Tang H, Cao J, Wu L
and Wang Z: Epigenetic silencing of miR-130b in ovarian cancer
promotes the development of multidrug resistance by targeting
colony-stimulating factor 1. Gynecol Oncol. 124:325–334. 2012.
View Article : Google Scholar : PubMed/NCBI
|
|
31
|
Miao Y, Zheng W, Li N, Su Z, Zhao L, Zhou
H and Jia L: MicroRNA-130b targets PTEN to mediate drug resistance
and proliferation of breast cancer cells via the PI3K/Akt signaling
pathway. Sci Rep. 7:419422017. View Article : Google Scholar : PubMed/NCBI
|
|
32
|
Zhang Q, Zhang B, Sun L, Yan Q, Zhang Y,
Zhang Z, Su Y and Wang C: MicroRNA-130b targets PTEN to induce
resistance to cisplatin in lung cancer cells by activating
Wnt/β-catenin pathway. Cell Biochem Funct. 36:194–202. 2018.
View Article : Google Scholar : PubMed/NCBI
|
|
33
|
Colangelo T, Fucci A, Votino C, Sabatino
L, Pancione M, Laudanna C, Binaschi M, Bigioni M, Maggi CA, Parente
D, et al: MicroRNA-130b promotes tumor development and is
associated with poor prognosis in colorectal cancer. Neoplasia.
15:1086–1099. 2013. View Article : Google Scholar : PubMed/NCBI
|
|
34
|
Zhao L, Mao ZG, Jiang H, Qin L, Huang CY
and Tan B: Value of MCV/RDW combined with reticulocyte parameters
in differential diagnosis of Anemia diseases. Zhongguo Shi Yan Xue
Ye Xue Za Zhi. 23:1662–1666. 2015.(In Chinese). PubMed/NCBI
|
|
35
|
Seretis C, Seretis F, Lagoudianakis E,
Gemenetzis G and Salemis NS: Is red cell distribution width a novel
biomarker of breast cancer activity? Data from a pilot study. J
Clin Med Res. 5:121–126. 2013.PubMed/NCBI
|
|
36
|
Sategna Guidetti C, Scaglione N and
Martini S: Red cell distribution width as a marker of coeliac
disease: A prospective study. Eur J Gastroenterol Hepatol.
14:177–181. 2002. View Article : Google Scholar : PubMed/NCBI
|
|
37
|
Lippi G, Targher G, Montagnana M, Salvagno
GL, Zoppini G and Guidi GC: Relation between red blood cell
distribution width and inflammatory biomarkers in a large cohort of
unselected outpatients. Arch Pathol Lab Med. 133:628–632. 2009.
View Article : Google Scholar : PubMed/NCBI
|
|
38
|
Li Y, Xing C, Wei M, Wu H, Hu X, Li S, Sun
G, Zhang G, Wu B, Zhang F and Li Z: Combining red blood cell
distribution width (RDW-CV) and CEA predict poor prognosis for
survival outcomes in colorectal cancer. J Cancer. 10:1162–1170.
2019. View Article : Google Scholar : PubMed/NCBI
|
|
39
|
Qin YY, Wu YY, Xian XY, Qin JQ, Lai ZF,
Liao L and Lin FQ: Single and combined use of red cell distribution
width, mean platelet volume, and cancer antigen 125 for
differential diagnosis of ovarian cancer and benign ovarian tumors.
J Ovarian Res. 11:102018. View Article : Google Scholar : PubMed/NCBI
|
|
40
|
Gilreath JA and Rodgers GM: How I treat
cancer-associated anemia. Blood. 136:801–813. 2020. View Article : Google Scholar : PubMed/NCBI
|
|
41
|
Zhang X, Zhang F, Qiao W, Zhang X, Zhao Z
and Li M: Low hematocrit is a strong predictor of poor prognosis in
lung cancer patients. Biomed Res Int. 2018:68049382018.PubMed/NCBI
|
|
42
|
Seda CJ, Salas AS, Sánchez CG, Blasco JM,
García IO, Sánchez JM, Ruíz CB, Navarro SM and López RA:
Thrombocytosis and hematocrit as prognostic factors in renal
carcinoma. Arch Esp Urol. 64:883–890. 2011.PubMed/NCBI
|
|
43
|
Chen B, Dai D, Tang H, Ai X, Chen X, Zhang
X, Li Z and Xie X: Pretreatment hematocrit is superior to
hemoglobin as a prognostic factor for triple negative breast
cancer. PLoS One. 11:e01651332016. View Article : Google Scholar : PubMed/NCBI
|
|
44
|
Zhang S, Lu M, Li Y, Li J and Shen LJCo: A
lower haemoglobin level predicts a worse survival of patients with
advanced gastric cancer. Clin Oncol (R Coll Radiol). 26:239–240.
2014. View Article : Google Scholar : PubMed/NCBI
|
|
45
|
Chen J, Li Y and Cui H: Preoperative low
hematocrit is an adverse prognostic biomarker in ovarian cancer.
Arch Gynecol Obstet. 303:767–775. 2021. View Article : Google Scholar : PubMed/NCBI
|
|
46
|
Liu F, Hu HJ, Regmi P, Jin YW, Ma WJ, Wang
JK, Zou RQ and Li FY: Elevated platelet distribution width predicts
poor prognosis in gallbladder carcinoma. Cancer Manag Res.
13:4647–4655. 2021. View Article : Google Scholar : PubMed/NCBI
|
|
47
|
Aksoy EK, Kantarcı S, Torgutalp M, Akpınar
MY, Sapmaz FP, Yalçın GŞ, Uzman M, Şimşek GG and Nazlıgül Y: The
importance of complete blood count parameters in the screening of
gastric cancer. Prz Gastroenterol. 14:183–187. 2019.PubMed/NCBI
|
|
48
|
Yun ZY, Li N, Zhang X, Zhang H, Bu Y, Sun
Y, Liu T, Wang RT and Yu KJ: Mean platelet volume, platelet
distribution width and carcinoembryonic antigen to discriminate
gastric cancer from gastric ulcer. Oncotarget. 8:62600–62605. 2017.
View Article : Google Scholar : PubMed/NCBI
|
|
49
|
Kılınçalp S, Ekiz F, Başar O, Ayte MR,
Coban S, Yılmaz B, Altınbaş A, Başar N, Aktaş B, Tuna Y and Erbiş
H: Mean platelet volume could be possible biomarker in early
diagnosis and monitoring of gastric cancer. Platelets. 25:592–594.
2014. View Article : Google Scholar : PubMed/NCBI
|
|
50
|
Tuncel T, Ozgun A, Emirzeoglu L, Celik S,
Bilgi O and Karagoz B: Mean platelet volume as a prognostic marker
in metastatic colorectal cancer patients treated with
bevacizumab-combined chemotherapy. Asian Pac J Cancer Prev.
15:6421–6423. 2014. View Article : Google Scholar : PubMed/NCBI
|
|
51
|
Sun YC, Yang JJ, Suh JT, Lee WI, Lee HJ
and Park TS: Mean platelet volume/platelet count ratio in anemia.
Platelets. 24:244–245. 2013. View Article : Google Scholar : PubMed/NCBI
|
|
52
|
Inagaki N, Kibata K, Tamaki T, Shimizu T
and Nomura S: Prognostic impact of the mean platelet
volume/platelet count ratio in terms of survival in advanced
non-small cell lung cancer. Lung Cancer. 83:97–101. 2014.
View Article : Google Scholar : PubMed/NCBI
|
|
53
|
Song S, Li C, Li S, Gao H, Lan X and Xue
Y: Derived neutrophil to lymphocyte ratio and monocyte to
lymphocyte ratio may be better biomarkers for predicting overall
survival of patients with advanced gastric cancer. Onco Targets
Ther. 10:3145–3154. 2017. View Article : Google Scholar : PubMed/NCBI
|
|
54
|
Aldemir MN, Turkeli M, Simsek M, Yildirim
N, Bilen Y, Yetimoglu H, Bilici M and Tekin SB: Prognostic value of
baseline neutrophil-lymphocyte and platelet-lymphocyte ratios in
local and advanced gastric cancer patients. Asian Pac J Cancer
Prev. 16:5933–5937. 2015. View Article : Google Scholar : PubMed/NCBI
|
|
55
|
Yu L, Lv CY, Yuan AH, Chen W and Wu AW:
Significance of the preoperative neutrophil-to-lymphocyte ratio in
the prognosis of patients with gastric cancer. World J
Gastroenterol. 21:6280–6286. 2015. View Article : Google Scholar : PubMed/NCBI
|
|
56
|
Lian L, Xia YY, Zhou C, Shen XM, Li XL,
Han SG, Zheng Y, Mao ZQ, Gong FR, Wu MY, et al: Application of
platelet/lymphocyte and neutrophil/lymphocyte ratios in early
diagnosis and prognostic prediction in patients with resectable
gastric cancer. Cancer Biomark. 15:899–907. 2015. View Article : Google Scholar : PubMed/NCBI
|
|
57
|
Hsu JT, Liao CK, Le PH, Chen TH, Lin CJ,
Chen JS, Chiang KC and Yeh TS: Prognostic value of the preoperative
neutrophil to lymphocyte ratio in resectable gastric cancer.
Medicine (Baltimore). 94:e15892015. View Article : Google Scholar : PubMed/NCBI
|
|
58
|
Deng Q, He B, Liu X, Yue J, Ying H, Pan Y,
Sun H, Chen J, Wang F, Gao T, et al: Prognostic value of
pre-operative inflammatory response biomarkers in gastric cancer
patients and the construction of a predictive model. J Transl Med.
13:662015. View Article : Google Scholar : PubMed/NCBI
|
|
59
|
Yang SH, Wang XL, Cai J and Wang SH:
Diagnostic value of circulating PIGF in combination with Flt-1 in
early cervical cancer. Curr Med Sci. 40:973–978. 2020. View Article : Google Scholar : PubMed/NCBI
|
|
60
|
Leandersson P, Åkesson A, Hedenfalk I,
Malander S and Borgfeldt C: A multiplex biomarker assay improves
the diagnostic performance of HE4 and CA125 in ovarian tumor
patients. PLoS One. 15:e02404182020. View Article : Google Scholar : PubMed/NCBI
|
|
61
|
Huang J, Zheng Y, Xiao X, Liu C, Lin J,
Zheng S, Yang B and Ou Q: A circulating long noncoding RNA panel
serves as a diagnostic marker for hepatocellular carcinoma. Dis
Markers. 2020:54175982020. View Article : Google Scholar : PubMed/NCBI
|
|
62
|
Cheng J, Yang A, Cheng S, Feng L, Wu X, Lu
X, Zu M, Cui J, Yu H and Zou L: Circulating miR-19a-3p and
miR-483-5p as novel diagnostic biomarkers for the early diagnosis
of gastric cancer. Med Sci Monit. 26:e9234442020. View Article : Google Scholar : PubMed/NCBI
|
|
63
|
Sun L, Tu H, Chen T, Yuan Q, Liu J, Dong N
and Yuan Y: Three-dimensional combined biomarkers assay could
improve diagnostic accuracy for gastric cancer. Sci Rep.
7:116212017. View Article : Google Scholar : PubMed/NCBI
|