Introduction
Cholangiocarcinoma (CCA) or bile duct cancer is a
serious health problem worldwide, especially in Asian countries
(1), and its incidence is
increasing. Owing to the difficulty associated with achieving
early-stage diagnosis, CCA has a high mortality rate. CCA has been
classified into two types based on its anatomical location:
intrahepatic CCA (iCCA) and extrahepatic CCA (eCCA) (1,2). It has
been reported that these have different carcinogenic pathways
(3). According to the anatomical
site, further eCCA is divided into two categories, distal (dCCA)
type and perihilar (pCCA) type, also known as Klatskin tumors
(4). In CCA, the dCCA is expected to
have the highest survival rates, followed by the pCCA and iCCA
types. Thailand has the highest incidence of CCA (1). The incidence rate of CCA has been
decreasing in Thailand in the past 10 years; however, the death of
patients with CCA is still higher than six per 100,000 people
(5). In Japan, the mortality rate of
CCA is 5.85 in total deaths per 100,000 (6). Currently, serum levels of
carcinoembryonic antigen (CEA) and CA19-9 have been used in the
diagnosis and prognosis of CCA. However, the sensitivity and
specificity are insufficient for the early diagnosis of CCA.
Therefore, serum tests must be coupled with imaging methods, such
as ultrasound, computed tomography (CT), and magnetic resonance
imaging (MRI) methods, to achieve a better diagnosis (7). Currently surgical resection is only
curative treatment. Thus, we need to understand CCA more profoundly
to ameliorate the prognosis of patients with CCA.
The mucin-type O-glycans attached to the
serine and threonine residues of proteins are diverse in structure
and function. In fact, alterations in various mucin-type
O-glycan structures have been reported during tumor
progression (6,8). As shown in Fig. 1, O-glycans are classified into
several core structures that are specifically synthesized by unique
enzymes (9). Core 3 structure is a
mucin-type O-glycan that plays important roles in
differentiation and mucosal barrier formation in digestive organs,
including gastrointestinal goblet cells. The core 3 structure is
synthesized by β1,3-N-acetylglucosaminyltransferase 6
(B3GNT6 or core 3 synthase), which adds GlcNAc with β1,3-linkage to
the Tn antigen (GalNAcα-serine/threonine) (10,11).
Because the same 3′position of GalNAc in the Tn antigen is utilized
by core 1 synthase, core 3 synthesis may compete with core 1
synthesis, as shown in Fig. 1.
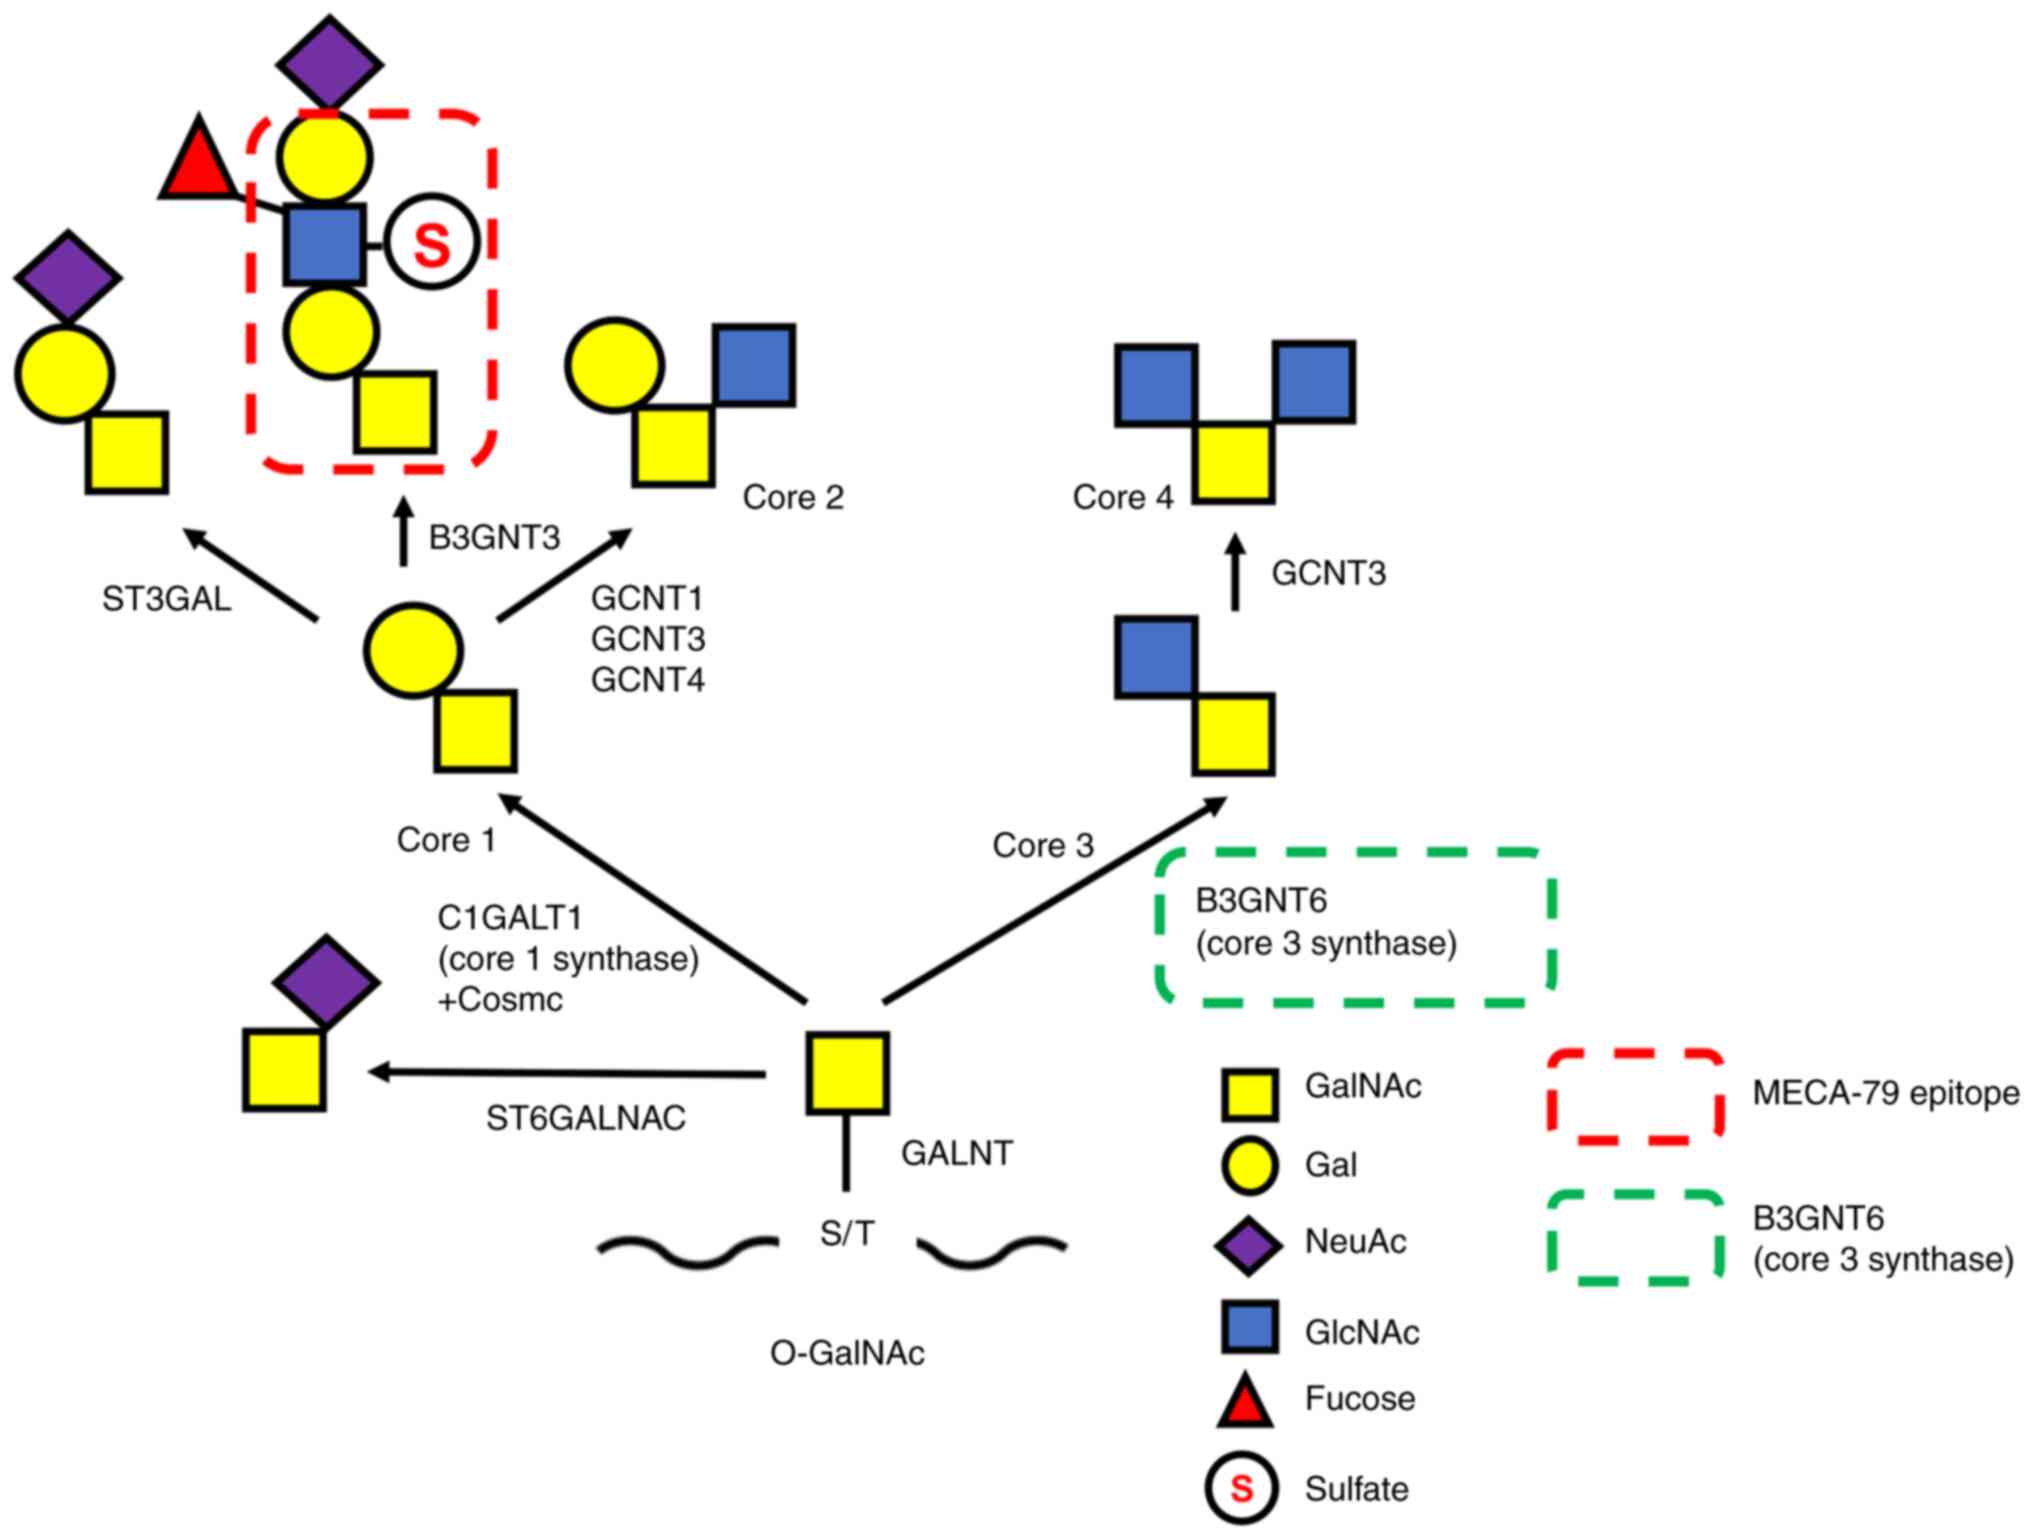 | Figure 1.O-glycan synthetic pathway.
Mucin O-glycosylation is initiated by the transfer of GalNAc
from UDP-GalNAc to S or T residues. This process is catalyzed by
multiple GALNTs resulting in the generation of the Tn antigen.
Thereafter, the Tn antigen is extended by specific enzymes, such as
C1GALT1/core 1 synthase with its chaperone Cosmc or B3GNT6/core 3
synthase, to form the structure of core 1 or core 3, respectively.
The MECA-79 epitope (a sulfated N-acetyllactosamine on
extended core 1) is synthesized on the structure of core 1. Core 3
synthase and the MECA-79 epitope are indicated by green and red
dashed line rectangles, respectively. GalNAc,
N-acetylgalactosamine; S, serine; T, threonine; GALNTs,
polypeptide-N-acetyl-galactosaminyltransferases; B3GNT6,
β1,3-N-acetylglucosaminyltransferase 6; C1GALT1,
glycoprotein-N-acetylgalactosamine 3β-galactosyltransferase
1; ST3GAL, ST3 β-galactoside a-2,3-sialytransferase 3; GCNT,
glucosaminyl (N-acetyl) transferase; ST6GALNAC, ST6
N-acetylgalactosaminide α-2,6-sialyltransferase;
O-GalNAc, O-linked N-acetylgalactosamine;
NeuAc, N-acetylneuraminic acid. |
A monoclonal antibody against core 3 synthase,
G8-144, was established in a previous study (10). Immunohistochemical analysis of
colorectal cancer tissues from familial adenomatous polyposis
patients demonstrated that the enzyme was expressed in the normal
epithelial cells of colorectal tissues, mainly in goblet cells, but
decreased or disappeared in cancer cells (10). Moreover, compared to parental cells,
the cells expressing core 3 via transfection of the core 3
synthase gene (B3GNT6 gene) showed lower migration
activity in vitro as well as very low metastatic activity
when core 3-expressing cells were introduced into nude mice
(10). Core 3-expressing prostate
cancer cells were also found to decrease the activity of tumor
formation and metastatic activity to the lymph nodes by attenuating
the maturation and heterodimerization of integrin α2β1 (12). The core 3 structure was recently
reported to be involved in EMT-MET regulation via the
MUC1/p53/miR-200c signaling cascade (13).
O-glycan pathways have been suggested to be
correlated with cancer progression (14). For instance, Tn antigen was
identified to be increased in colon cancer and breast cancer
(15–17), and core 1 and core 2 structures are
often found in breast and prostate cancers (18,19).
However, antibodies specifically recognizing the core structures of
O-glycans have not been established; this might be due to
modification of core O-glycans by additional glycosylation,
such as fucosylation and sialylation. For example, the 6-sulfated
N-acetyllactosamine (6-sulfo LacNAc) structure, which is
synthesized on the extended core 1 O-glycans, is known as
the epitope of the MECA-79 antibody (Fig. 1) (20).
In the present study, we aimed to investigate the
clinicopathological correlation of core 3 synthase expression with
the prognosis of patients with eCCA relative to that with MECA-79
expression. Briefly, an immunohistochemical study was conducted
with 185 patients with eCCA using two antibodies, G8-144 (anti-core
3 synthase) and MECA-79 (anti-6-sulfo LacNAc on core 1). As a
result, these O-glycosylation-related antibodies, G8-144 and
MECA-79, were identified to be associated with eCCA survival rates
in an opposing manner.
Materials and methods
Cholangiocarcinoma specimens
This study was approved by the Institutional Review
Board of the National Cancer Center, Tokyo, Japan (2019–0186).
Informed consent was obtained from all participants before their
participation in the study. All clinical investigations were
conducted in accordance with the principles of the Declaration of
Helsinki.
This study included 185 patients, 118 with dCCA and
67 with pCCA underwent surgical resection between 2006 and 2016 at
the National Cancer Center Hospital, Tokyo. All patients included
in this study underwent macroscopic curative resection. None of the
patients received radiotherapy or chemotherapy before surgery.
Recurrence was diagnosed when a new local or distant metastatic
lesion was detected in imaging studies or when an increase in tumor
marker levels with deterioration of the patient's condition was
observed. All of the CCA were diagnosed according to the World
Health Organization (WHO) classification (2), the 8th UICC/AJCC TNM Classification
(3,4). Macroscopic types of eCCA and the
following histopathological variables were evaluated following the
Japanese Society of Biliary Surgery (JSBS) classification (4): lymphatic, venous, and perineural
invasions. The clinicopathological characteristics of patients are
summarized in Table SI. All
patients with stage IV disease were diagnosed on the basis of
para-aortic lymph node involvement.
Preparation of the two antibodies,
G8-144 (anti-core 3 synthase) and MECA-79 (anti-6-sulfo LacNAc on
core 1)
The monoclonal antibody that reacts with core 3
synthase, called G8-144, was previously established by our
laboratory (10). First, G8-144 was
purified using protein-G beads. G8-144 secreted from hybridoma
cells was diluted with PBS to a total volume of 25 ml and applied
to 200 µl protein-G Sepharose fast flow (GE Healthcare) for
antibody capture at 4°C overnight. The protein-G beads were washed
and eluted with 0.1 M glycine (pH 2.5), followed by neutralization
with 3 M Tris-HCl (pH 8.5). Subsequently, the purified antibody was
dialyzed with pH 7.5 phosphate buffer saline (PBS; pH; Fujifilm
Wako Pure Chemical Corporation), and concentrated using an Amicon
ultra 0.5 ml filter cut off 100 K (Merck). Purified G8-144 was
subjected to immunohistochemical analysis.
The MECA-79 antibody recognizes a sulfated
N-acetyllactosamine on extended core 1 mucin-type
O-glycan, Galβ1→4(sulfo→6)GlcNAcβ1→3Galβ1→3GalNAc (6-sulfo
LacNAc on core 1) (20). The MECA-79
rat monoclonal IgM antibody used to stain the serial pathological
sections was purchased from BD Biosciences.
Construction of core 3 synthase
expression plasmid DNA and western blotting
To confirm the specificity of G8-144 before
performing the immunohistochemical study, the purified G8-144
antibody was subjected to western blot analysis. As most of the
core 3 synthase-expressing cells, which were transfected with core
3 synthase cDNA, were reported as overexpressing cell lines, there
are only a few cell lines that stably express core 3 synthase
(21). To prepare core 3 synthase
(B3GNT6), B3GNT6 cDNA was subcloned into the pCDN3.1 vector
(Thermo Fisher Scientific, Inc.), resulting in pcDNA3.1-B3GNT6.
Thereafter, the purified plasmid DNA was transfected into HEK293T
cells using Lipofectamine® LTX DNA transfection reagent
(Thermo Fisher Scientific, Inc.), according to the manufacturer's
protocol. Forty-eight hours after transfection, the cells
transiently expressing the core 3 synthase were collected and lysed
with lysis buffer containing 1% NP-40, 0.1% SDS, 50 mM Tris-Cl pH
7.4, 150 mM NaCl, 5 mM EDTA, 1 mM PMSF, and protease inhibitors
(Merck). Frozen tissues were obtained from resected surgical
specimens and were stored at −80°C until use. For comparison
between pathological specimens and cancer cell lines, frozen CCA
tissue samples from the G8-144 positive cases and HAL8 cells, a
lung adenocarcinoma cell line (22),
were lysed using the lysis buffer. After centrifugation, the
supernatant was collected, and the protein concentration was
measured using a micro-BCA kit (Thermo Fisher Scientific, Inc.).
Core 3 synthase might be expressed in minute amounts, so collecting
them from the positive sites in the frozen tissue may provide
limited yield. Thus, the samples were concentrated from frozen
tissue and HAL8 cells using an Amicon 3 K (Merck) tube. The
proteins were then loaded and separated using 5–20% gradient
SDS-PAGE, while the HEK235T+B3GNT6 and HEK293T cell lysates were
loaded at 5 µg/µl and blotted onto a polyvinylidene fluoride
membrane (Bio-Rad). Proteins that reacted with G8-144 or GAPDH
(Fujifilm Wako) were detected using anti-mouse IgG conjugated with
HRP (Thermo Fisher Scientific, Inc.) and Immobilon Forte western
HRP substrate (Merck).
Immunohistochemistry
The representative tumor tissue was used for all the
examinations of the tissue specimen in this study. To evaluate the
expression levels of core 3 synthase and 6-sulfo LacNAc on core 1
in CCA, serial CCA sections were immunohistochemically stained
using G8-144 and MECA-79. Briefly, formalin-fixed and
paraffin-embedded sections were deparaffinized in xylene and
rehydrated using a graded ethanol series. After the sections were
washed with deionized water, endogenous peroxidase was blocked with
0.3% H2O2 in methanol for 20 min. Antigens
were retrieved via autoclaving in 1X Envision™ flex target
retrieval solution at high pH (Dako). The sections were washed with
PBS, and endogenous biotin and biotin-binding factors were blocked
with a biotin-blocking system (Dako). After washing with PBS, the
sections were incubated with each antibody overnight at 4°C
(23). G8-144 (anti-core 3 synthase
antibody) was used at a concentration of 0.5 µg/ml while MECA-79
(anti-6-sulfo LacNAc on core 1 antibody) was used at a
concentration of 1.0 µg/ml. The sections were incubated with the
secondary antibody, biotinylated goat anti-mouse IgG (Vector
Laboratories) for G8-144 or biotinylated goat anti-rat IgM (Vector
Laboratories) for MECA-79 for 30 min. Thereafter, they were reacted
for 30 min to form the avidin-biotin-peroxidase complex (Vectastain
ABC kitl Vector Laboratories). Staining was visualized with
diaminobenzidine. The sections were also counterstained with
hematoxylin.
Cancerous tissues were divided into two regions:
non-invasive and invasive regions. Cancer cells that remained on
the epithelial layer of the bile duct were determined to be
non-invasive cancer cells, while cells infiltrating beyond the
epithelial layer were determined to be invasive cancer cells. To
evaluate the level of staining positivity, sections were
quantitatively scored based on the percentage of positive cells in
the total cancer cells (1–100%). When the immunolabelled positive
cells were more than 1%, the cancer was judged as a positively
stained. The staining scores were evaluated by two independent
pathologists that were blinded to the clinical status.
Statistical analysis
The associations between characteristic variables
were analyzed by chi-square or the Fisher exact tests.
Postoperative overall survival (OS), disease-free survival (DFS)
rates, and the expression of core 3 synthase and MECA-79 positivity
were calculated using the Kaplan-Meier method and analyzed by the
log-rank test (24). Factors found
to be significant in univariate analysis were incorporated into the
multivariate analysis using the Cox proportional hazards model
(backward elimination method). Differences were considered
statistically significant at P<0.05, and all statistical
analyses were performed using StatView-J 5.0 software (Abacus
Concepts).
Results
Confirmation of the specificity of the
G8-144 antibody using CCA tissue
To determine whether G8-144 could be applied to
immunohistochemical studies for diagnostic purposes, we assessed
the specificity of G8-144 by western blotting using CCA samples.
HAL8, a lung adenocarcinoma cell line, was used as a positive
control cell line expressing core 3 synthase [(22), data not shown]. HEK293T cells that
did not express core 3 synthase were compared with HEK293T cells
transfected with B3GNT6 cDNA. Lysates purified from CCA
tissues that were positive for G8-144 staining were blotted. The
results indicated that this enzyme was approximately 45 to 50 kDa,
as detected using the G8-144 antibody (Fig. S1, upper right). The size differences
may be due to differences in glycosylation between transient
expression in cultured cells and human CCA tissue. Western blotting
results showed several weak positive bands with higher molecular
weights, which may be polymers or complexes with other proteins.
Such findings indicate that a detectable amount of core 3 synthase
with G8-144 antibody was expressed in the CCA tissue, unlike that
in colorectal cancer (11).
Core 3 synthase expression in CCA
tissues as revealed by immunohistochemical analysis with the G8-144
antibody
To explore the expression of core 3 synthase in CCA
and its clinicopathological correlation with patient prognosis, an
immunohistochemical study using the G8-144 antibody was performed
using 185 CCA patient specimens. Briefly, we classified the 185 CCA
pathological specimens into two groups, 118 samples of dCCA and 67
of pCCA, based on their anatomical location. The dCCA specimens
were retrieved from 98 males and 20 females of different ages;
median age was 72 years. As shown in (Table SI), the study included 64 cases of
patients ≥72 and 54 cases of patients <72 years of age.
Meanwhile, 51 male and 16 female samples were retrieved for pCCA;
median age was 67 years. There were 34 cases of patients ≥67 years
and 33 cases of patients <67 years).
The results of immunohistochemical staining with
G8-144 showed that dCCA and pCCA were positive for G8-144 in 55.1
and 59.7% of the total cases, respectively (Table I). No core 3 synthase was expressed
in any of the normal epithelial cells in the bile duct (Fig. S1, lower left). It was expressed
frequently in the intraepithelial non-invasive cancer cells
(Fig. 2, upper left panel) and the
invasive cancer cells (Fig. 2, upper
right panel) at the shallow invasive lesion, that is, near mucosal
layer in the bile duct wall in the eCCA. It could be found in a low
frequency that cancer cells invaded deeply into the bile duct
expressed core 3 synthase. These findings were observed in both of
dCCA and pCCA. The frequencies of core 3 synthase expression in
non-invasive cancer cells and invasive cancer cells were 52.7 and
33.6% in dCCA, respectively (Table
I), and 51.9 and 38.2% in pCCA, respectively (data not
shown).
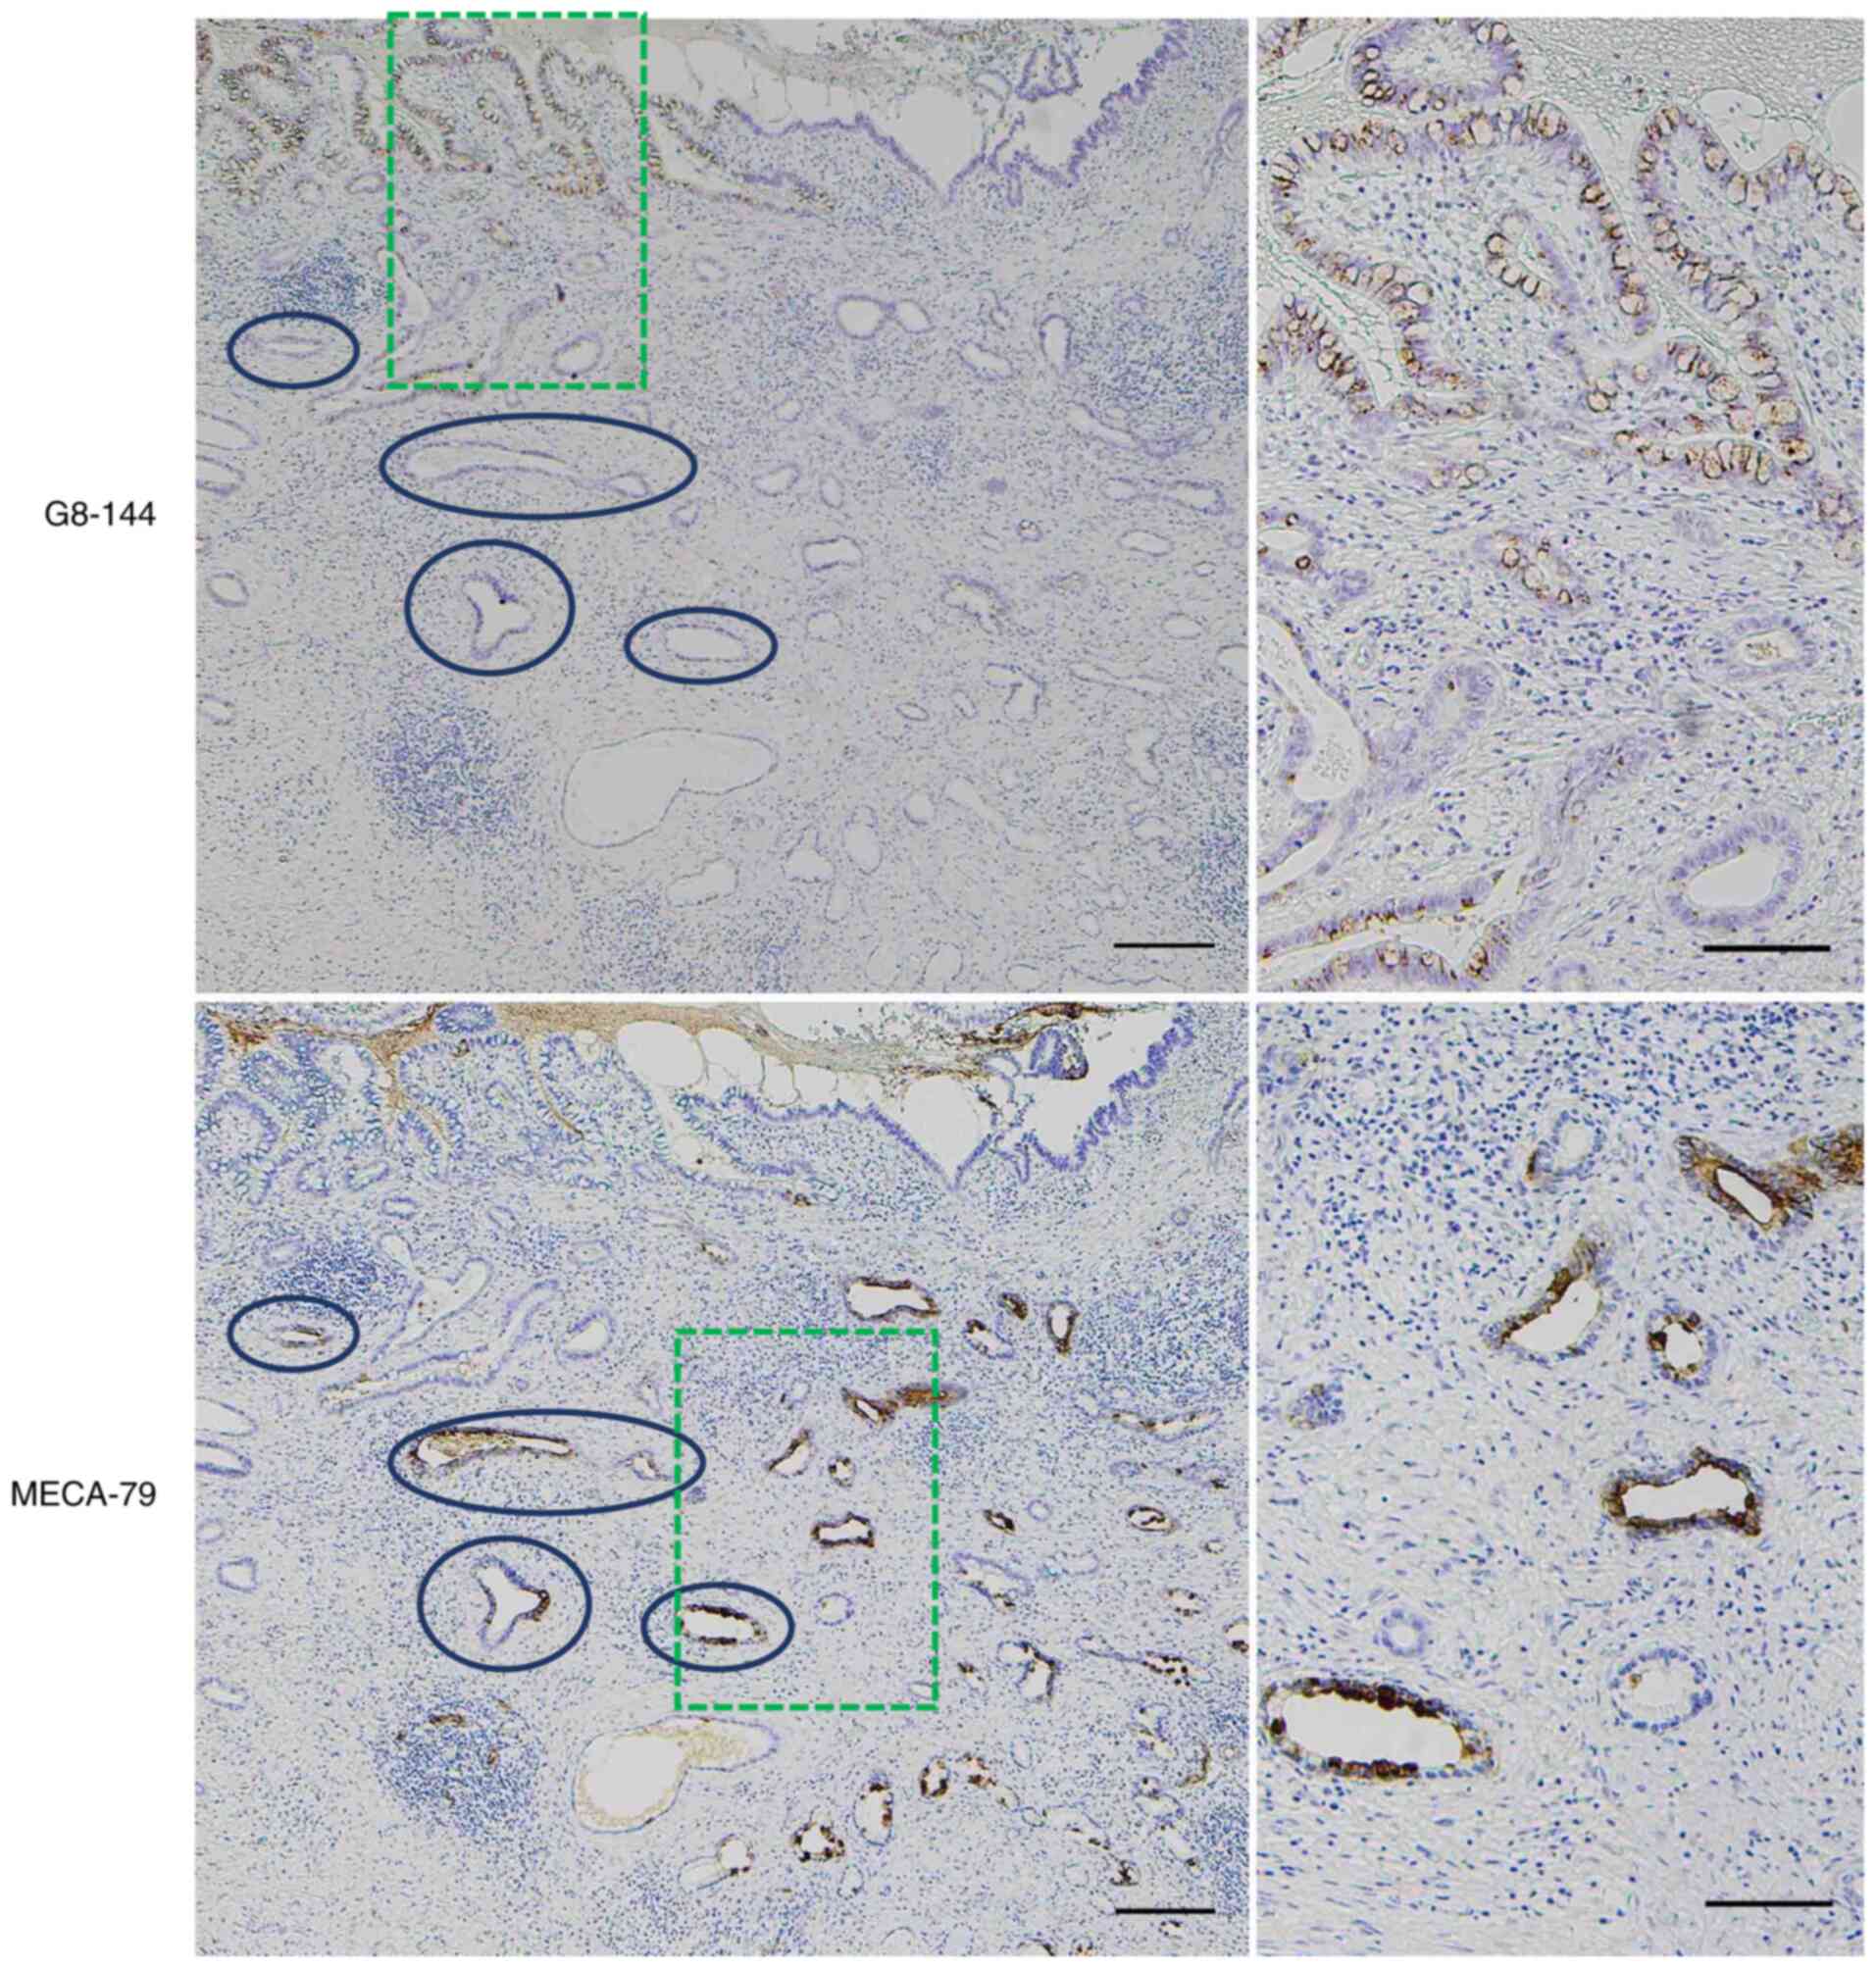
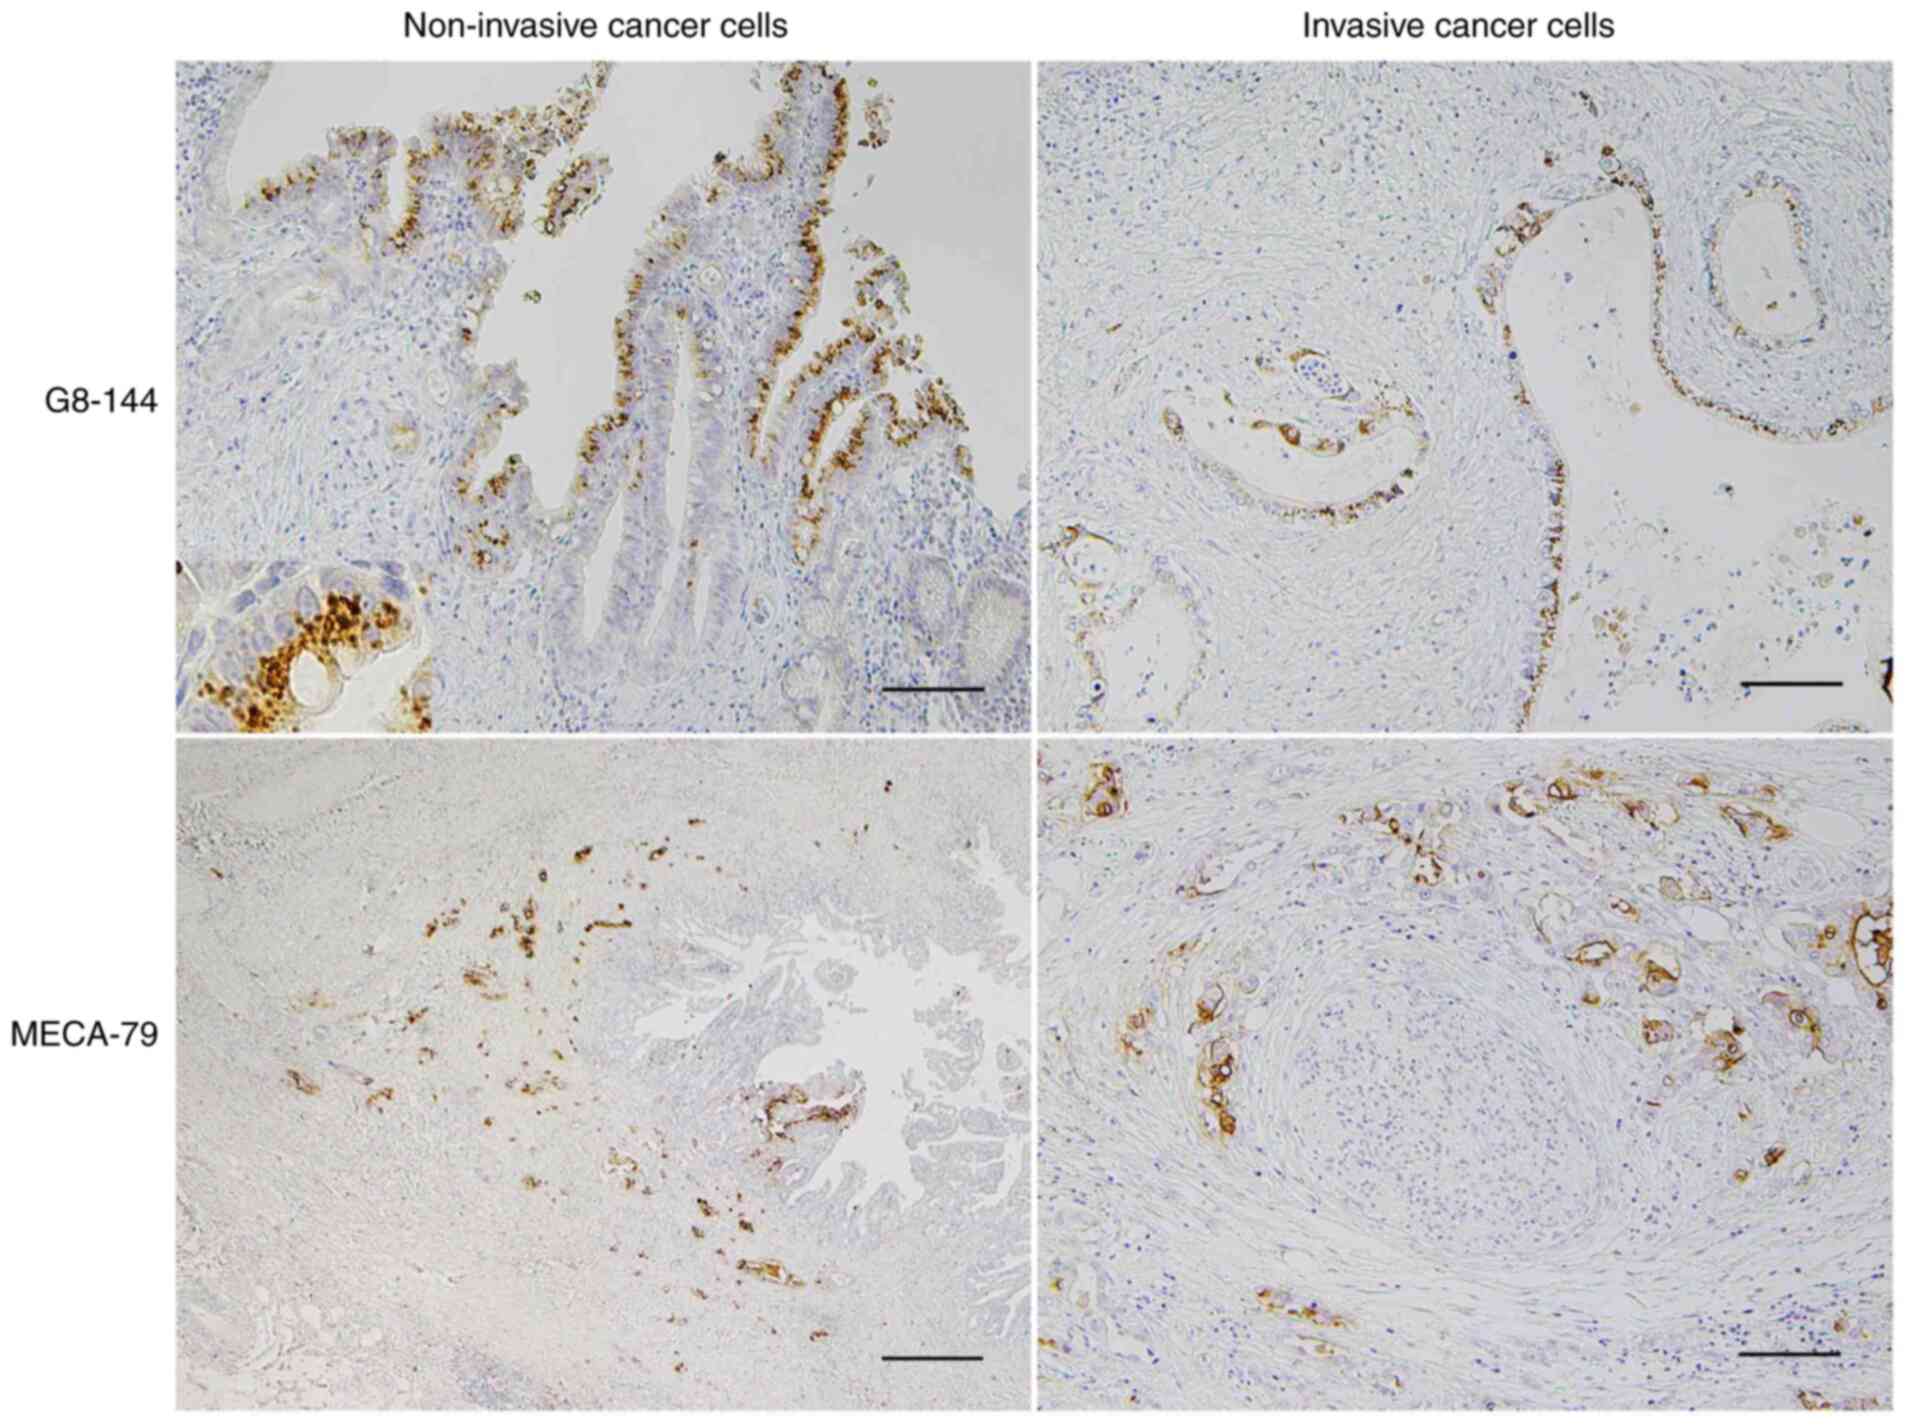 | Figure 2.Immunohistochemical detection of
β1,3-N-acetylglucosaminyltransferase 6/core 3 synthase using
G8-144 and MECA-79 antigen in CCA. Core 3 synthase was
immunohistochemically detected using the G8-144 antibody in dCCA
(upper sections). Core 3 synthase was mainly expressed in the
intraepithelial non-invasive cancer cells and some cancer cells at
shallow invasive areas, but not in any normal epithelial cells in
the bile duct. Proliferating dCCA cancer cells forming a papillary
structure toward the luminal side (upper direction) in the surface
epithelial layer expressed core 3 synthase (upper left). Core 3
synthase was observed as an intracytoplasmic dot-like feature
(upper left, inset) that was consistent with the presence of core 3
synthase in the Golgi apparatus. Also, core 3 synthase was not
frequently present in the invasive cancer cells (upper right).
Scale bar (upper sections), 100 µm. MECA-79 antigen was detected in
dCCA cancer cells in both non-invasive and invasive areas, but it
was predominantly expressed in deeply invasive cancer cells (lower
sections). In the deeply infiltrating dCCA with a bile duct lumen
at the right in the panel, cancer cells expressing MECA-79 antigen
were observed mostly in the invaded area and the intraepithelial
non-invasive area (lower left). MECA-79-positive cancer cells,
which are moderately to poorly differentiated adenocarcinoma with
an aborted gland structure or nest formation morphology, showed
perineural invasion at the invasive front (lower right). Scale bar
(lower left), 500 µm and scale bar (lower right), 50 µm. CCA,
cholangiocarcinoma; dCCA, distal cholangiocarcinoma. |
 | Table I.Summary of core 3 synthase and
MECA-79 antibody staining of the dCCA specimens. |
Table I.
Summary of core 3 synthase and
MECA-79 antibody staining of the dCCA specimens.
| A, Core 3
synthase |
|---|
|
|---|
|
| Expression
(non-invasive/invasive) |
|
|
|
|---|
|
|
|
|
|
|
|---|
| dCCA | +/+ | +/− | −/+ | ‒/‒ | Total positive
non-invasive, n (%) | Total positive
invasive, n (%) | Total positive, n
(%) |
|---|
| Cases, n | 31 | 28 | 6 | 53 | 59 (50.00) | 37 (31.41) | 65 (55.10) |
|
| B, MECA-79
staining |
|
|
| Expression
(non-invasive/invasive) |
|
|
|
|
|
|
|
|
|
| dCCA | +/+ | +/− | −/+ | ‒/‒ | Total positive
non-invasive, n (%) | Total positive
invasive, n (%) | Total positive, n
(%) |
|
| Cases, n | 42 | 13 | 27 | 36 | 55 (46.61) | 69 (58.47) | 82 (69.49) |
Core 1 structure with the MECA-79
epitope identified on epithelial cells of the bile duct and
CCA
To obtain further knowledge on O-glycan
expression in eCCA, MECA-79, which is specific to 6-sulfated
N-acetyllactosamine (6-sulfo LacNAc) on the extended core-1
O-glycans (Fig. 1), was
compared to G8-144. Serial sections of the pathological specimen
used for G8-144 staining were subjected to MECA-79 staining
(Fig. 2). In contrast to G8-144
staining, MECA-79 antigen was expressed in the non-cancerous
epithelial cells of the bile duct (Fig.
S1, lower right). MECA-79 antigen was expressed in 69.5 and
55.2% in dCCA and pCCA, respectively. It tended that MECA-79
antigen was expressed more frequently in deeply infiltrating cancer
cells (Fig. 2, lower left panel) and
often found in cancer cells showing lymphovascular or perineural
invasion (Fig. 2, lower right
panel). The frequencies of MECA-79 antigen expression in
non-invasive cancer cells and invasive cancer cells were 49.1 and
62.7% in dCCA, respectively (Table
I), and 42.3 and 50.9% in pCCA, respectively (data not shown).
Thus, cancer cells expressing core 3 synthase and those expressing
MECA-79 were different cancer areas. Furthermore, we often observed
that in the serial specimens, cancer cells expressing core 3
synthase did not display MECA-79-positivity in the non-invasive
(Fig. 3, upper left and right) or
invasive (Fig. 3, lower left and
right) areas.
Correlation of G8-144 positivity with
the prognosis of dCCA patients
As summarized in Table
I, the 118 dCCA patients were divided into four groups: i)
positive staining in both non-invasive and invasive regions (31
patients), ii) positive in non-invasive but negative in invasive
region (28 patients), iii) negative in non-invasive but positive in
invasive region (6 patients), and iv) negative in both non-invasive
and invasive regions (53 patients). pCCA patients were not included
in this table as no correlation was found between G8-144 staining
and patient prognosis as shown in later.
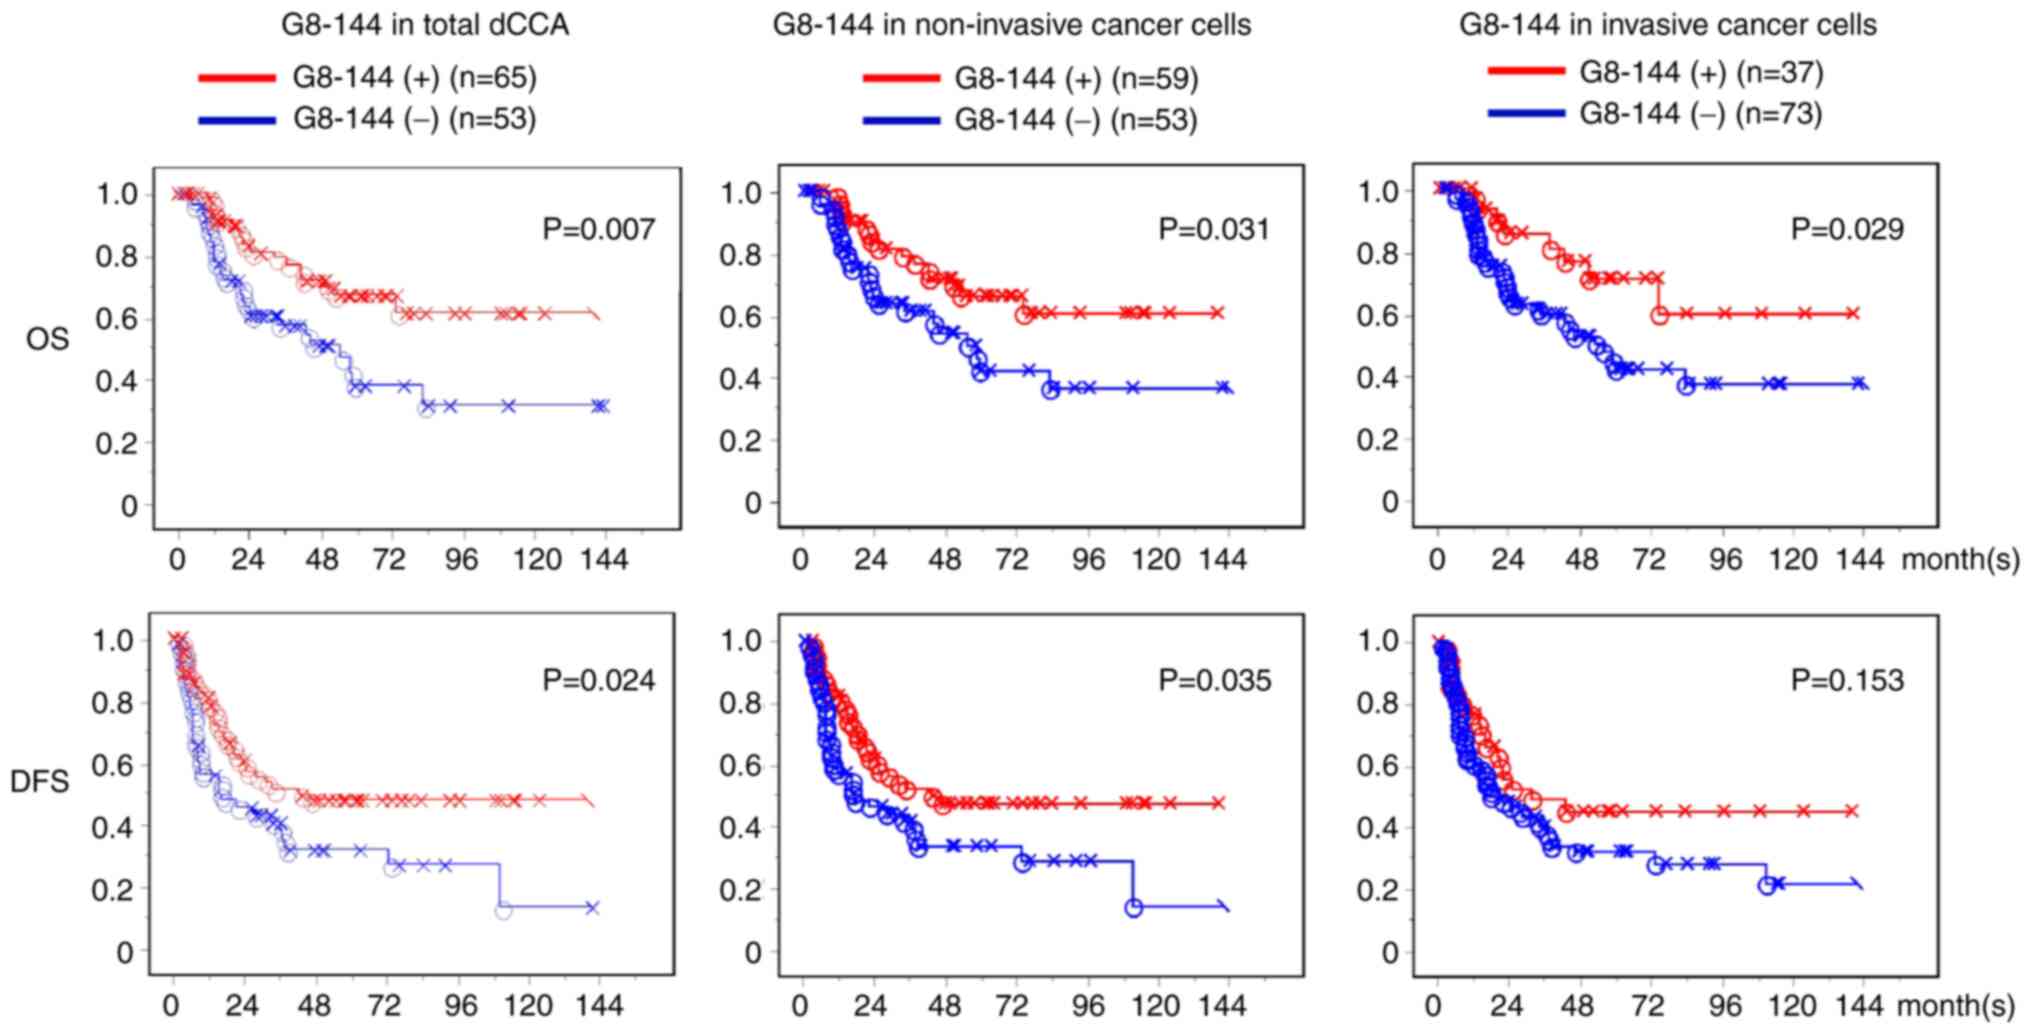
To analyze the correlation between core 3 synthase
expression and the survival rate of dCCA patients, the classified
staining results were subjected to Kaplan-Meier survival analysis
(Fig. 4). As shown in the left
panels of Fig. 4, the dCCA patients
showing positive G8-144-staining in non-invasive or invasive cancer
regions (65 of the 118 patients, 55.1%) had a significantly better
prognosis than the G8-144-negative patients (53 patients). The
difference between core 3 synthase -positive and -negative survival
rates of dCCA patients was significant in postoperative OS (upper
panels) and DFS (lower panels) (P=0.007 and P=0.024, respectively).
The dCCA patients with positive staining in the non-invasive region
displayed a better prognosis than those with negative dCCA (P=0.031
and P=0.035 in OS and DFS, respectively; middle panels of Fig. 4). The dCCA patients with positive
staining in the invasive region also showed a slightly good
correlation with OS (P=0.029) relative to those with negative dCCA;
however, not significantly correlated in DFS (P=0.153) (right
panels of Fig. 4). Moreover, there
was no significant correlation between core 3 synthase expression
and outcome in patients with pCCA (Fig.
S2).
Various clinicopathological factors shown in
Table II were investigated to
determine whether they were prognostic. When the significant
factors identified at univariate analysis were subjected to the
multivariate analysis; core 3 synthase positive in cancer cells, no
nodal metastasis, negative tumor margin status, and lower lymphatic
invasion were closely associated with longer DFS. In addition, core
3 synthase positive in cancer cells, lower tumor status, no nodal
metastasis and lower lymphatic invasion were significantly
associated with longer OS. Thus, dCCA patients expressing core 3
synthase, regardless of the non-invasive or invasive region,
displayed a significantly better prognosis than negative dCCA
patients and it is indicated that core 3 synthase expression in any
cancer cells is an independent prognosticator. As presented in
Table SI, core 3 synthase displayed
high positivity accounting for 100% of positive cases in tumors
in situ or at the zero stage.
| Table II.Univariate and multivariate analyses
of prognostic factors in patients with distal cholangiocarcinoma
(n=118). |
Table II.
Univariate and multivariate analyses
of prognostic factors in patients with distal cholangiocarcinoma
(n=118).
| A, Disease-free
survival |
|---|
|
|---|
|
| Univariate
analysis | Multivariate
analysis |
|---|
|
|
|
|
|---|
| Variables | HR (95% CI) | P-value | HR (95% CI) | P-value |
|---|
| Age, ≤72 years vs.
>72 years | 0.905
(0.555–1.477) | 0.6900 |
|
|
| Sex,
female/male | 0.565
(0.312–1.024) | 0.0600 |
|
|
| Pathological tumor
status, Tis+T1+T2 vs. T3 | 1.911
(0.970–3.765) | 0.0610 |
|
|
| Pathological node
status, N0 vs. N1+N2 | 2.598
(1.566–4.311) | 0.0002a | 2.046
(1.208–3.466) | 0.0080a |
| Pathological
metastatic status, M0 vs. M1 | 2.574
(1.163–5.698) | 0.0200a |
|
|
| Histological grade,
G1 vs. G2-4 | 0.901
(0.458–1.775) | 0.7640 |
|
|
| Tumor margin
status, negative vs. positive | 2.518
(1.540–4.115) | 0.0002a | 2.296
(1.399–3.768) | 0.0010a |
| Lymphatic invasion,
0 + 1 vs. 2 + 3b | 3.669
(2.164–6.221) |
<0.0001a | 3.628
(2.090–6.298) |
<0.0001a |
| Venous invasion, 0
+ 1 vs. 2 + 3b | 1.859
(1.137–3.038) | 0.0130a |
|
|
| Perineural
invasion, 0 + 1 vs. 2 + 3b | 2.000
(1.017–3.932) | 0.0450a |
|
|
| B3GNT6 expression
in cancerc, -vs. + | 0.573
(0.351–0.935) | 0.0260a | 0.496
(0.300–0.818) | 0.0060a |
| MECA-79 antigen
expression in cancerd,
- vs. + | 2.245
(1.285–3.923) | 0.0050a |
|
|
|
| B, Overall
survival |
|
|
| Univariate
analysis | Multivariate
analysis |
|
|
|
|
|
Variables | HR (95%
CI) | P-value | HR (95%
CI) | P-value |
|
| Age, ≤72 years vs.
>72 years | 0.865
(0.471–1.589) | 0.6410 |
|
|
| Sex, female vs.
male | 0.472
(0.225–0.992) | 0.0470a |
|
|
| Pathological tumor
status, Tis+T1+T2 vs. T3 | 2.840
(1.312–6.146) | 0.0080a | 3.753
(1.606–8.766) | 0.0020a |
| Pathological node
status, N0 vs. N1+N2 | 2.827
(1.510–5.291) | 0.0010a | 2.179
(1.116–4.254) | 0.0230a |
| Pathological
metastatic status, M0 vs. M1 | 2.577
(0.909–7.306) | 0.0750 |
|
|
| Histological grade,
G1 vs. G2-4 | 1.625
(0.776–3.402) | 0.1980 |
|
|
| Tumor margin
status, negative vs. positive | 2.345
(1.284–4.283) | 0.0060a |
|
|
| Lymphatic invasion,
0 + 1 vs. 2 + 3b | 4.872
(2.485–9.552) |
<0.0001a | 4.817
(2.314–10.026) |
<0.0001a |
| Venous invasion, 0
+ 1 vs. 2 + 3b | 3.010
(1.642–5.518) | 0.0004a |
|
|
| Perineural
invasion, 0 + 1 vs. 2 + 3b | 1.723
(0.795–3.731) | 0.1680 |
|
|
| B3GNT6
expressionc, - vs.
+ | 0.442
(0.240–0.817) | 0.0090a | 0.282
(0.146–0.545) | 0.0002a |
| MECA-79 antigen
expressiond, -vs.
+ | 2.574
(1.279–5.181) | 0.0080a |
|
|
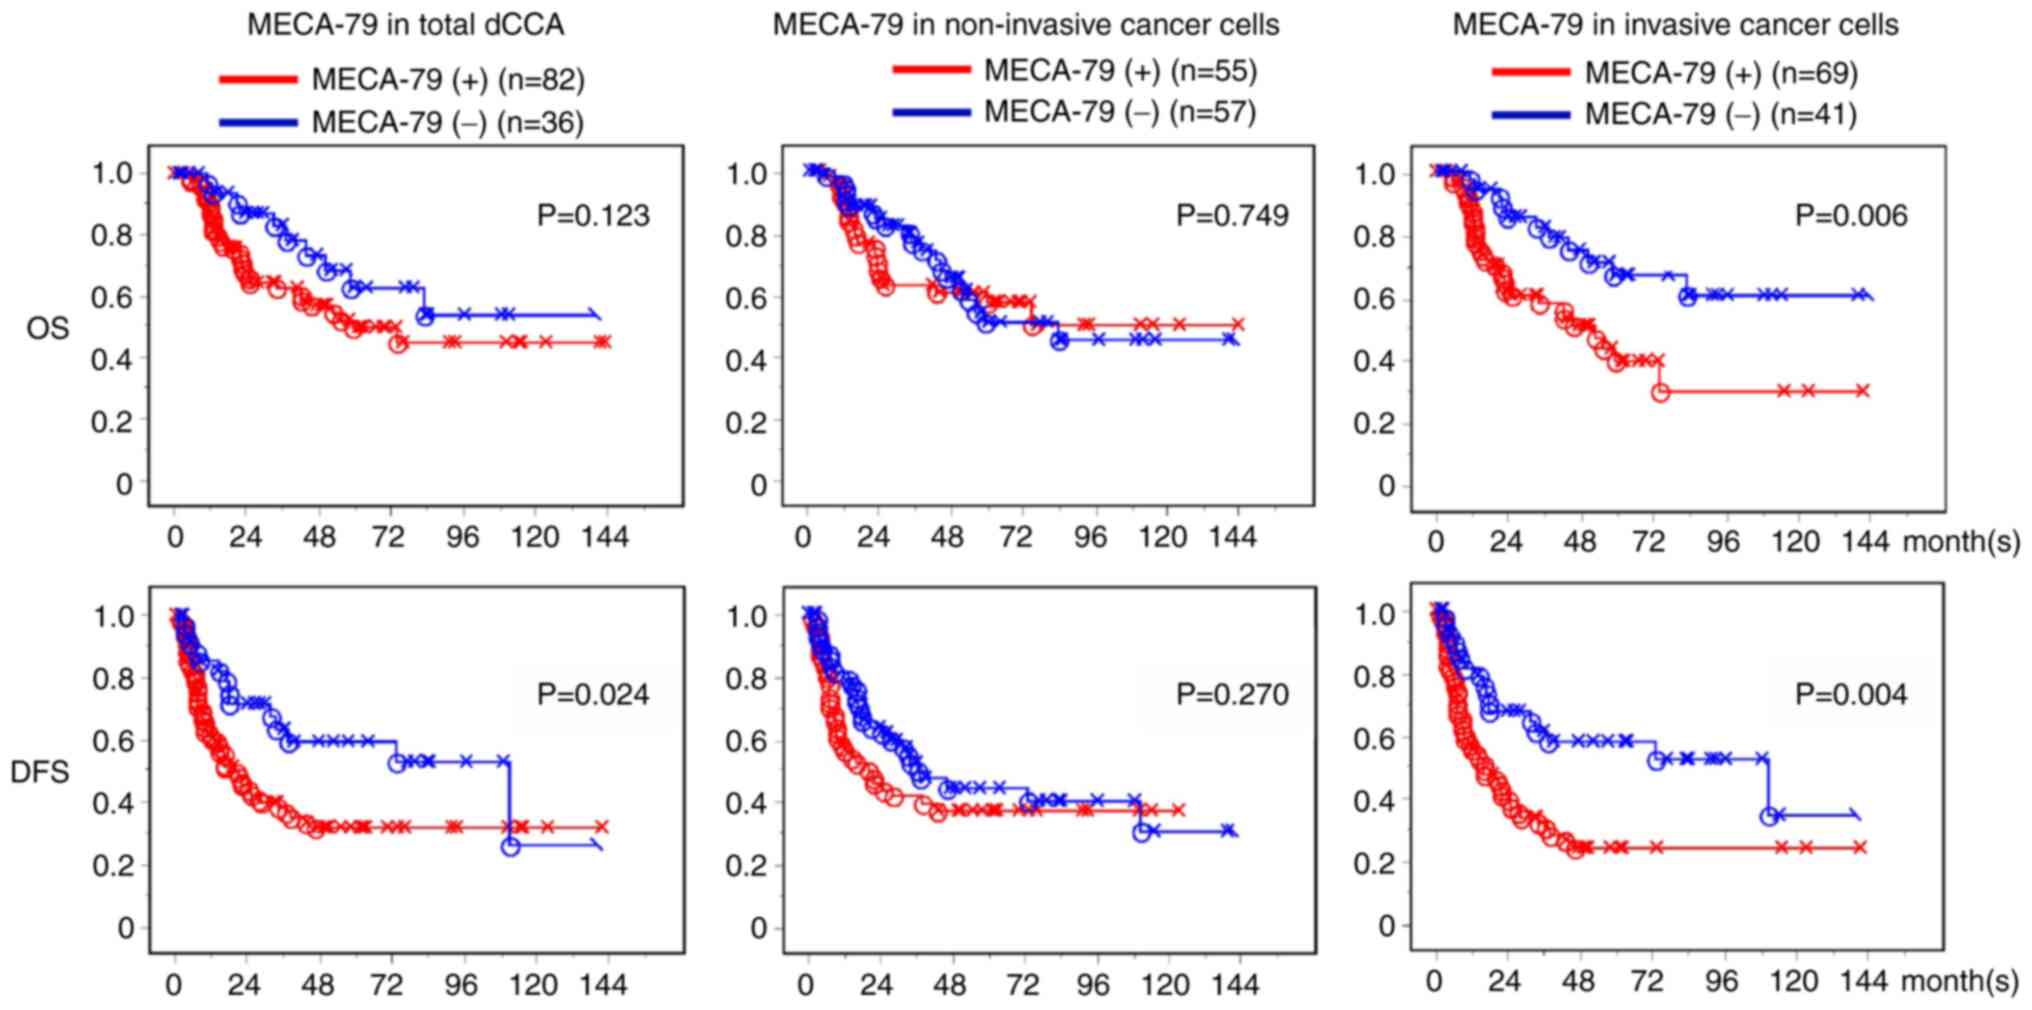
MECA-79 expression correlates with a
poor prognosis for dCCA patients
MECA-79 positivity in the invasive cancer region of
the dCCA was significantly associated with patient survival rate in
an unfavorable manner (P=0.006 for OS, P=0.004 for DFS) (right
panels of Fig. 5). While MECA-79
positivity in the non-invasive cancer did not have any significant
association with patient outcome (Fig.
5). When the significant factors identified at univariate
analysis were subjected to the multivariate analysis, expression of
MECA-79 antigen in invasive cancer cells was not a significant
factor in the multivariate analyses of both DFS and OS (Table II). There was no significant
survival effect of MECA-79 antigen expression in cancer cells found
in pCCA (Fig. S3).
When the correlation between MECA-79 antigen
expression and the various clinicopathological factors was
analyzed, MECA-79 positivity was significantly associated with the
node status, and cancer progression, such as lymphatic and venous
invasion (Table SI).
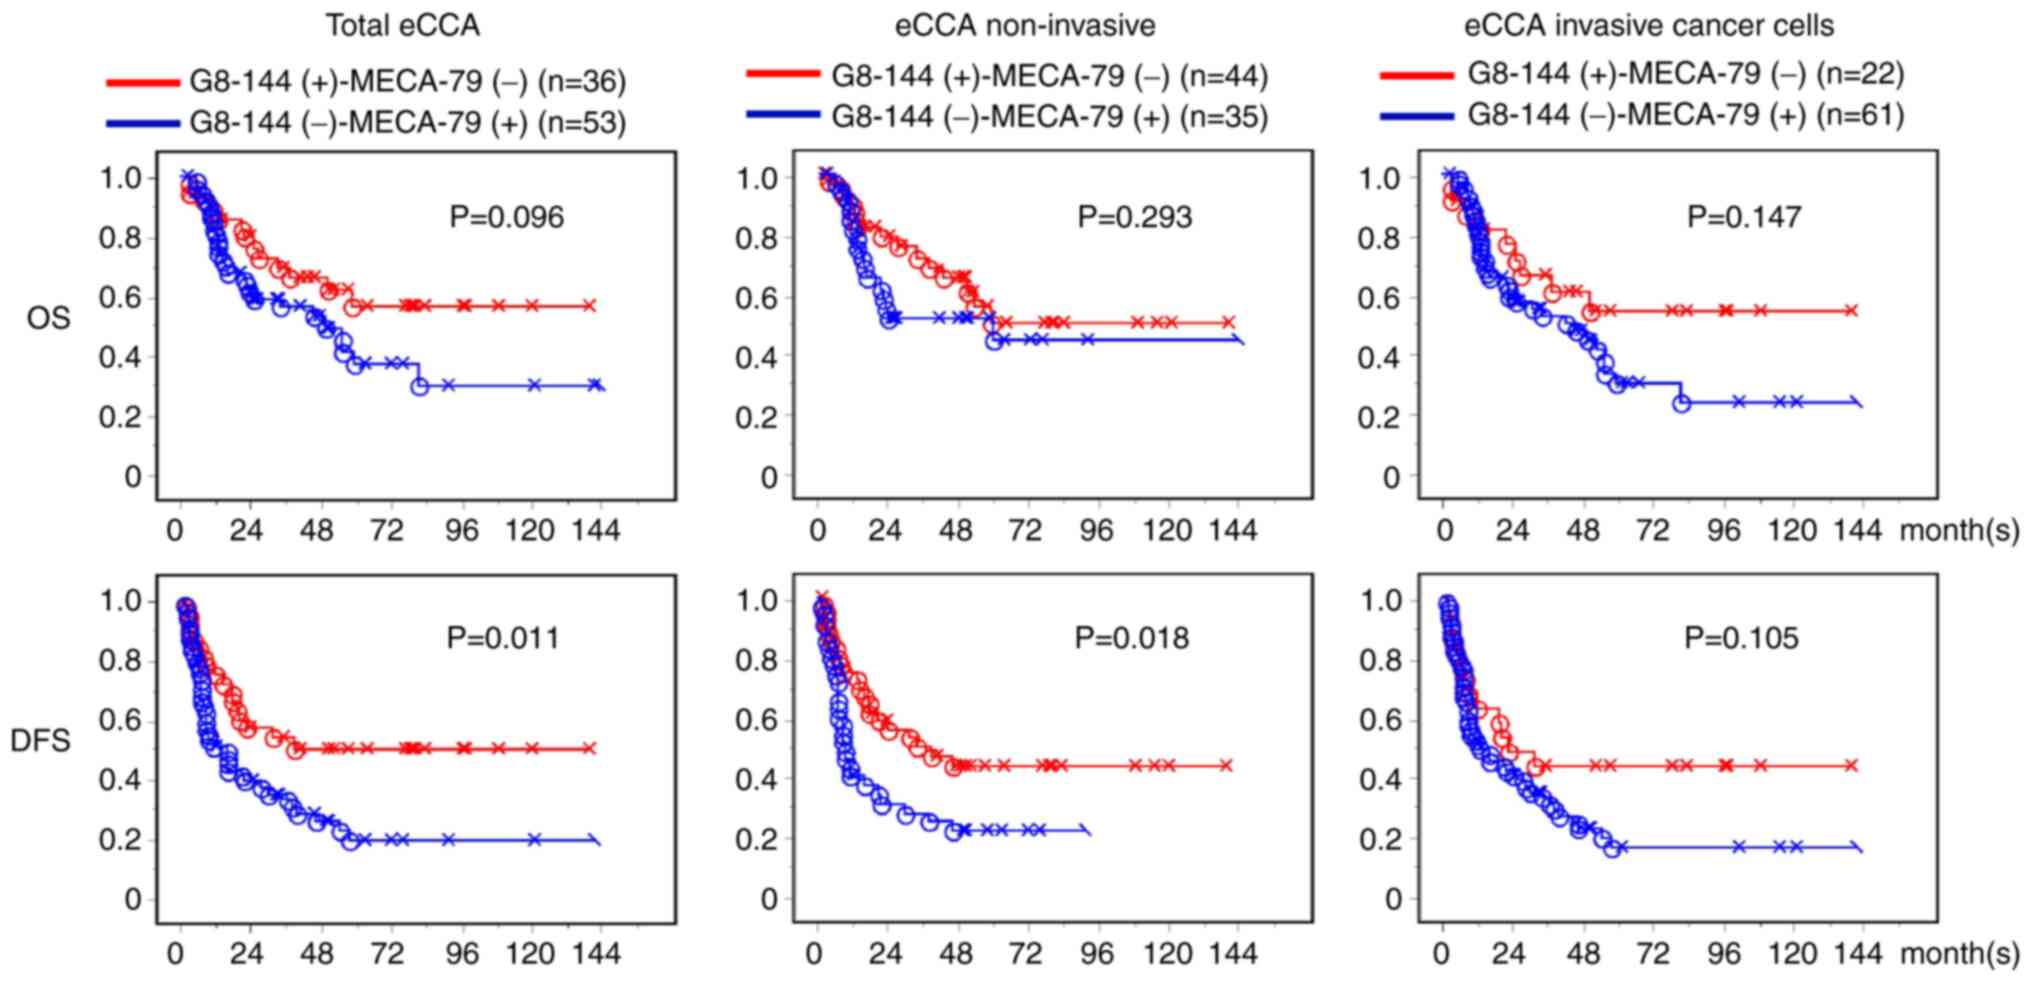
Comparison of survival rates between
the G8-144(+)-MECA-79(−) and the G8-144-MECA-79(+) groups of
patients with eCCA
From the total of 185 patients with eCCA, two
groups, G8-144(+)-MECA-79(−) and G8-144(−)-MECA-79(+), were
selected and analyzed to compare which O-glycan pathway
(core 3 or core 1) was associated with a longer survival rate. From
the results, we suggest that G8-144 is a favorable type of core
structure in dCCA. The OS and DSF of G8-144 and MECA-79 in the eCCA
cases are shown in Fig. 6. Both OS
and DFS were longer in the G8-144(+)-MECA-79(−) group than in the
G8-144(−)-MECA-79(+) group, except for the OS of the non-invasive
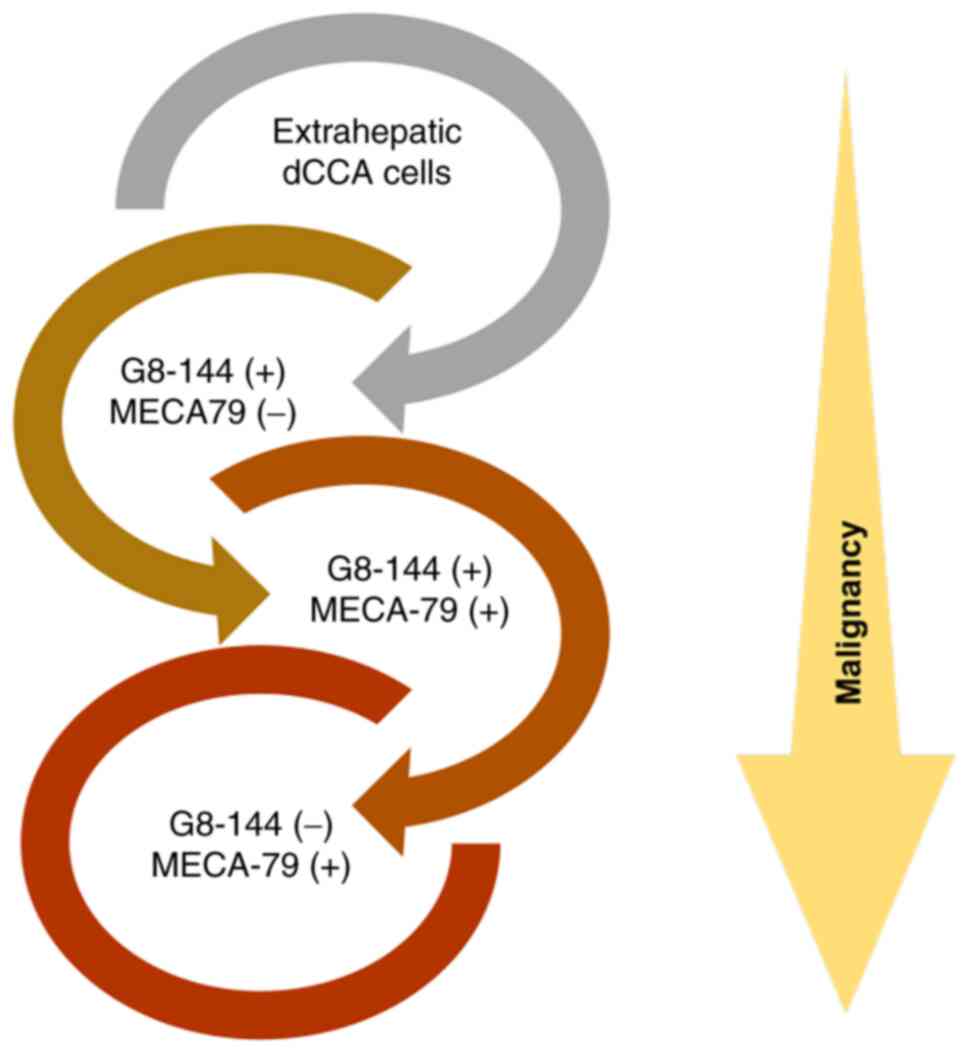
eCCA cases. These results suggest that when eCCA with
G8-144(+)-MECA-79(−) progresses to G8-144(+)-MECA-79(+) and
G8-144(−)-MECA-79(+), the survival rate may decrease as malignant
transformation progresses.
No association between the expression
of core 3 synthase and MECA-79 in the CCA cells
We expected to find an inverse relationship between
G8-144 and MECA-79 expression due to their glycan structures.
However, there was no significant correlation between the
expression of core 3 synthase and MECA-79 in the CCA cells
(Table SII). This may be due to the
fact that both antigens are not diffusely expressed on tumor cells
in the same case, but are often expressed on some tumor cells
separately.
The frequency of G8-144 expression is high in
non-invasive intramucosal cancers and tends to decrease as the
cancer cells invade deeper into the mucosa, but the low frequency
of G8-positive tumor cells makes data generation difficult.
However, based on the characteristics of G8-144, which is
frequently expressed in non-invasive intramucosal cancers, the
relationship between G8-144 and depth of invasion should be
statistically significant. This would also support that G8-144 is a
good prognostic marker, but it is unclear since we have not
searched for it.
Discussion
The alteration of the O-glycan structures in
cancer is one of the characteristics responsible for its
aggressiveness (17,25). Core 3 expression has been reported to
suppress tumor progression and inhibit metastasis in sarcoma,
pancreatic, and prostate cancer cells (10,12,26),
while aberrant O-glycans, such as Tn and STn, are increased
in various carcinomas (17,27,28).
Because antibodies recognizing the core 3 structure have not been
established for diagnosis, we opted to use the antibody that
recognizes core 3 synthase (11,29,30).
In our previous study, we found that the expression
of core 3 synthase was restricted in Goblet cells of the colon;
however, its expression level was decreased during cancer
progression and completely absent in colon cancer tissues (10,11). In
fact, the mRNA level of B3GNT6 was identified to be almost
negative in more than 100 cancer cell lines examined by qRT-PCR and
RNA-Seq (22) (data not shown).
However, two studies ((24) and this
study) demonstrated that some cancer tissues of PDAC and CCA
expressed core 3 synthase. core 3 synthase was found to be
expressed in approximately 20% of PDAC cases, and a higher
expression of this enzyme was found in PDAC cells with more
differentiated adenocarcinoma cases (24). In the present study, core 3 synthase
was found to be positive in CCA and was mainly observed in the
non-invasive area. Such findings indicate that core 3 synthase
expression is induced in differentiated cancers of the pancreas and
bile ducts. Importantly, the detection of core 3 synthase in
patients with PDAC or dCCA was significantly associated with a
longer survival rate than core 3 synthase-negative patients
(24), Fig. 3). Such findings suggest that core 3
synthase can be a favorable prognostic marker for dCCA patient.
Consistent with our results, the mRNA expression level of
B3GNT6 was predicted to be a favorable marker for colorectal
cancer (21). Thus,
immunohistochemical detection of core 3 synthase would be useful to
rapidly detect and diagnose several cancers that might secrete
O-glycosylated proteins as their cellular
characteristic.
In contrast to dCCA, the prognosis of pCCA patients
did not correlate with the expression of core 3 synthase (Fig. S2). Although both dCCA and pCCA are
included in the eCCA, pCCA is located in the extrahepatic biliary
tree near hepatic hilar area and easy to extend both right and left
hepatic ducts. As a result, surgical operation is more difficult
and causes higher unresectable rates (31) which lead to a poor survival rate. A
previous report suggested that core 3 might be involved in the
differentiation of colon tissues (10). Although the number of pCCA cases was
fewer than that of dCCA, pCCA had a higher percentage of G8-144
positivity than dCCA. Thus, core 3 synthase may be differentially
expressed in CCA cells according to the localization, which should
be associated with bile duct differentiation. The effect of core 3
synthase expression on the survival rate of dCCA and pCCA was thus
inconsistent.
As shown in Fig. 1,
core 1 structures are synthesized at the 3′ position of GalNAc on
mucins, which is shared with core 3 structures. Core 1 synthase
requires co-expression with the cofactor Cosmc (32), thus, the expression of core 1
synthase alone does not determine the core 1 structure. Because of
this complexity, we did not stain the samples with an anti-core 1
synthase antibody. In addition, antibodies against the core 3
glycan structure are not yet available. Therefore, to analyze the
differences between the expression of core 1 and core 3 in
association with the prognosis of CCA, we used the MECA-79 antibody
and the G8-144 antibody as alternative tools for core 1 and core 3,
respectively. As core 1 synthase is involved in the progression of
cancer (17,33), the invasive front of the cancer,
which are located between cancer and normal tissues, displayed
strong positivity of cancer cells with MECA-79, as shown in
Fig. 2. Further, the MECA-79 epitope
was identified to be increased upon cancer progression and is
associated with poor prognosis in gastric cancers (29,34).
MECA-79 was thus identified to be associated with a shorter
survival rate of dCCA, especially when expressed in invasive cancer
areas (Fig. 5). Based on the
statistical analyses, MECA-79 positivity was found to be
significantly correlated with the cancer metastasis factors
examined, as summarized in Table
SI. Such findings suggest that MECA-79 is an unfavorable
prognosticator for dCCA patients. Considering the synthetic pathway
of the O-glycan cores, core 3 synthase may suppress MECA-79
expression in vivo. Indeed, a mirror-image stain was
observed between G8-144 and MECA-79 in eCCA; core 3 synthase
expressing mainly in intraepithelial or shallow invasive cancer
cells and MECA-79 antigen expressing mainly in deeply invasive
cancer cells, and rare event of cancer cells expressing both core 3
synthase and MECA-79 antigen (data not shown). According to the
multivariate survival analyses (Table
II), core 3 synthase expression in CCA cells was an independent
prognosticator, although the association between the expression of
core 3 synthase and MECA-79 in CCA cells was not determined. There
are some limitations in this study as the data collection and
analyses of our clinicopathological study were performed
retrospectively. Using antibodies that directly detect core 3 or
core 1 glycan structures might be better than detecting the enzymes
themselves; however, the synthesis pathway and the glycan
structures after core 3 are quite complicated, and no antibody
specific against the core 3 structure is available.
In the present study, we aimed to identify
prognostic biomarkers for patients with eCCA. We analyzed two
candidate markers, core 3 synthase (G8-144) and core 1 containing
glycan (MECA-79). Based on our findings, core 3 synthase was found
to be expressed in non-invasive cancer cells. Further, it was
implied that expression of core 3 synthase in cancer cells is an
independent prognostic factor for dCCA patients predicting the
better prognosis. However, a good correlation was not found with
other cancer progression variables. The MECA-79 epitope was also
observed to be increased in invasive cancer cells, and MECA-79
positivity correlated closely with the worse lifespan of dCCA
patients. It has been confirmed that core 3 synthase is expressed
in dCCA cells in situ. If the core 3 pathway competes with
the core 1 pathway in vivo, then the core 1 pathway should
become dominant as the expression level of the core 3 pathway
decreases. As the expression level of core 3 synthase decreases,
dCCA cells may turn into MECA-79-positive cells and become more
malignant. Taken together, the observations of our staining
experiments and statistical analysis suggest that the decrease in
the Core 3 pathway expression (represented by G8-144) followed by
an increase in the Core 1 pathway (represented by MECA-79)
expression could be associated with the progression of dCCA
(Fig. 7). These findings imply that
these two antibodies could be employed to analyze the
O-glycan pathways to predict the prognosis of patients with
dCCA.
Supplementary Material
Supporting Data
Acknowledgements
Not applicable.
Funding
This work was supported by the Japan Science and
Technology Agency through the e-ASIA Joint Research Program (grant
nos. JP18jm0210045 and 20ck0106532).
Availability of data and materials
The datasets used and/or analyzed during the current
study are available from the corresponding author on reasonable
request.
Authors' contributions
PB collected, analyzed and validated the data, and
wrote the original manuscript draft. YI collected and analyzed the
data, and provided resources. NH conceived and designed the
methodology of the present study, collected, analyzed and validated
the data, was responsible for providing the resources and acquiring
funding, and reviewed and edited the manuscript. KS provided
resources and performed data analysis of the patient clinical
records. KA conceived and designed the methodology of this study,
and wrote the original draft of the manuscript. HN conceived and
designed this study, was responsible for acquiring funding,
supervised the experiments, and reviewed and edited the manuscript.
PB and NH confirm the authenticity of all the raw data. All authors
have read and approved the final manuscript.
Ethics approval and consent to
participate
This study was approved by the Institutional Review
Board of the National Cancer Center (approval no. 2019-0186; Tokyo,
Japan). Written informed consent was obtained from all participants
before their participation in the study. All clinical
investigations were conducted in accordance with the principles of
the Declaration of Helsinki.
Patient consent for publication
Not applicable.
Competing interests
The authors declare that they have no competing
interests.
Glossary
Abbreviations
Abbreviations:
|
6-sulfo LacNAc
|
6-sulfated
N-acetyllactosamine
|
|
B3GNT6
|
β1,3-N-acetylglucosaminyltransferase 6
|
|
CCA
|
cholangiocarcinoma
|
|
dCCA
|
distal cholangiocarcinoma
|
|
eCCA
|
extrahepatic cholangiocarcinoma
|
|
iCCA
|
intrahepatic cholangiocarcinoma
|
|
LacNAc
|
N-acetyllactosamine
|
|
pCCA
|
perihilar cholangiocarcinoma
|
References
|
1
|
Cancer International Agency for Research
on Cancer, . Cancer fact sheets. Cancer Today International Agency
for Research on Cancer. World Health Organization; 2020
|
|
2
|
Nagtegaal ID, Odze RD and Klimstra D: WHO
Classification of Tumours, Digestive System. International Agency
for Research on Cancer. Wiley-Blackwell; Lyon: 2019
|
|
3
|
Amin MB, Edge S, Greene F, Byrd DR,
Brookland RK, Washington MK, Gershenwald JE, Compton CC, Hess KR,
Sullivan DC, et al: AJCC Cancer Staging Manual. Springer
International Publishing; New York, NY: 2017, View Article : Google Scholar
|
|
4
|
Brierley JD, Gospodarowicz MK and
Wittekind C; Union for International Cancer Control, : TNM
Classification of Malignant Tumours. John Wiley & Sons, Inc.;
Oxford, UK: 2017
|
|
5
|
Kamsa-Ard S, Luvira V, Suwanrungruang K,
Kamsa-Ard S, Luvira V, Santong C, Srisuk T, Pugkhem A,
Bhudhisawasdi V and Pairojkul C: Cholangiocarcinoma trends,
incidence, and relative survival in khon kaen, thailand from 1989
through 2013: A population-based cancer registry study. J
Epidemiol. 29:197–204. 2019. View Article : Google Scholar : PubMed/NCBI
|
|
6
|
Banales JM, Marin JJG, Lamarca A,
Rodrigues PM, Khan SA, Roberts LR, Cardinale V, Carpino G, Andersen
JB, Braconi C, et al: Cholangiocarcinoma 2020: The next horizon in
mechanisms and management. Nat Rev Gastroenterol Hepatol.
17:557–588. 2020. View Article : Google Scholar : PubMed/NCBI
|
|
7
|
Dodson RM, Weiss MJ, Cosgrove D, Herman
JM, Kamel I, Anders R, Geschwind JF and Pawlik TM: Intrahepatic
cholangiocarcinoma: Management options and emerging therapies. J Am
Coll Surg. 217:736–750.e4. 2013. View Article : Google Scholar : PubMed/NCBI
|
|
8
|
Stowell SR, Ju T and Cummings RD: Protein
glycosylation in cancer. Ann Rev Pathol. 10:473–510. 2015.
View Article : Google Scholar : PubMed/NCBI
|
|
9
|
Varki A, Cummings RD, Esko JD, Stanley P,
Hart GW, Aebi M, Darvill AG, Kinoshita T, Packer NH, Prestegard JH,
et al: Essentials of Glycobiology. 3rd edition. Cold Spring Harbor
Laboratory Press; Cold Spring Harbor, NY: 2015-2017
|
|
10
|
Iwai T, Kudo T, Kawamoto R, Kubota T,
Togayachi A, Hiruma T, Okada T, Kawamoto T, Morozumi K and
Narimatsu H: Core 3 synthase is down-regulated in colon carcinoma
and profoundly suppresses the metastatic potential of carcinoma
cells. Proc Natl Acad Sci USA. 102:4572–4457. 2005. View Article : Google Scholar : PubMed/NCBI
|
|
11
|
Iwai T, Inaba N, Naundorf A, Zhang Y,
Gotoh M, Iwasaki H, Kudo T, Togayachi A, Ishizuka Y, Nakanishi H
and Narimatsu H: Molecular cloning and characterization of a novel
UDP-GlcNAc: GalNAc-peptide beta1,3-N Acetylglucosaminyltransferase
(beta 3Gn-T6), an Enzyme Synthesizing the Core 3 Structure of
O-Glycans. J Biol Chem. 277:12802–12809. 2002. View Article : Google Scholar : PubMed/NCBI
|
|
12
|
Lee SH, Hatakeyama S, Yu SY, Bao X, Ohyama
C, Khoo KH, Fukuda MN and Fukuda M: Core3 O-Glycan synthase
suppresses tumor formation and metastasis of prostate carcinoma PC3
and LNCaP cells through Down-regulation of alha2bata1 Integrin
Complex. J Biol Chem. 284:17157–17169. 2009. View Article : Google Scholar : PubMed/NCBI
|
|
13
|
Ye J, Wei X, Shang Y, Pan Q, Yang M, Tian
Y, He Y, Peng Z, Chen L, Chen W and Wang R: Core 3 mucin-type
O-glycan restoration in colorectal cancer cells promotes
MUC1/p53/miR-200c-dependent epithelial identity. Oncogene.
36:6391–6407. 2017. View Article : Google Scholar : PubMed/NCBI
|
|
14
|
Pearce OMT: Cancer glycan epitopes:
Biosynthesis, structure and function. Glycobiology. 28:670–696.
2018. View Article : Google Scholar : PubMed/NCBI
|
|
15
|
Springer GF, Desai PR and Banatwala I:
Blood group MN specific substances and precursors in normal and
malignant human breast tissues. Naturwissenschaften. 61:457–458.
1974. View Article : Google Scholar : PubMed/NCBI
|
|
16
|
Springer GF: T and Tn, general carcinoma
autoantigens. Science. 224:1198–1206. 1984. View Article : Google Scholar : PubMed/NCBI
|
|
17
|
Chia J, Goh G and Bard F: Short O-GalNAc
glycans: Regulation and role in tumor development and clinical
perspectives. Biochim Biophys Acta. 1860:1623–1639. 2016.
View Article : Google Scholar : PubMed/NCBI
|
|
18
|
Hagisawa S, Ohyama C, Takahashi T, Endoh
M, Moriya T, Nakayama J, Arai Y and Fukuda M: Expression of core 2
beta1, 6-N-acetylglucosaminyltransferase facilitates prostate
cancer progression. Glycobiology. 15:1016–1024. 2005. View Article : Google Scholar : PubMed/NCBI
|
|
19
|
Brockhausen I: Mucin-type O-glycans in
human colon and breast cancer: Glycodynamics and functions. EMBO
Rep. 7:599–604. 2006. View Article : Google Scholar : PubMed/NCBI
|
|
20
|
Yeh JC, Hiraoka N, Petryniak B, Nakayama
J, Ellies LG, Rabuka D, Hindsgaul O, Marth JD, Lowe JB and Fukuda
M: Novel sulfated lymphocyte homing receptors and their control by
a core1 extension beta 1,3-N-Acetylglucosaminyltransferase. Cell.
105:957–969. 2001. View Article : Google Scholar : PubMed/NCBI
|
|
21
|
Proteomics, . Tissue-based map of the
human proteome. Science. 347:12604192015.https://www.proteinatlas.org/ENSG00000198488-B3GNT6July
23–2021 View Article : Google Scholar : PubMed/NCBI
|
|
22
|
Angata K, Sawaki H, Tsujikawa S, Ocho M,
Togayachi A and Narimatsu H: Glycogene expression profiling of
hepatic cells by RNA-Seq analysis for Glyco-biomarker
identification. Front Oncol. 10:12242020. View Article : Google Scholar : PubMed/NCBI
|
|
23
|
Ino Y, Yamazaki-Itoh R, Oguro S, Shimada
K, Kosuge T, Zavada J, Kanai Y and Hiraoka N: Arginase II expressed
in cancer-associated fibroblasts indicates tissue hypoxia and
predicts poor outcome in patients with pancreatic cancer. PLoS One.
8:e551462013. View Article : Google Scholar : PubMed/NCBI
|
|
24
|
Doi N, Ino Y, Angata K, Shimada K,
Narimatsu H and Hiraoka N: Clinicopathological significance of core
3 O-glycan synthetic enzyme, β1,3-N-acetylglucosaminyltransferase 6
in pancreatic ductal adenocarcinoma. PLoS One. 15:e02428512020.
View Article : Google Scholar : PubMed/NCBI
|
|
25
|
Pinho SS and Reis CA: Glycosylation in
cancer: Mechanisms and clinical implications. Nat Rev Cancer.
15:540–555. 2015. View Article : Google Scholar : PubMed/NCBI
|
|
26
|
Radhakrishnan P, Grandgenett PM, Mohr AM,
Bunt SK, Yu F, Chowdhury S and Hollingsworth MA: Expression of core
3 synthase in human pancreatic cancer cells suppresses tumor growth
and metastasis. Int J Cancer. 133:2824–2833. 2013.PubMed/NCBI
|
|
27
|
Fu C, Zhao H, Wang Y, Cai H, Xiao Y, Zeng
Y and Chen H: Tumor-associated antigens: Tn antigen, sTn antigen,
and T antigen. HLA. 88:275–286. 2016. View Article : Google Scholar : PubMed/NCBI
|
|
28
|
Ju T, Wang Y, Aryal RP, Lehoux SD, Ding X,
Kudelka MR, Cutler C, Zeng J, Wang J, Sun X, et al: Tn and
sialyl-Tn antigens, aberrant O-glycomics as human disease markers.
Proteomics Clin Appl. 7:618–631. 2013. View Article : Google Scholar : PubMed/NCBI
|
|
29
|
Okayama H, Kumamoto K, Saitou K, Hayase S,
Kofunato Y, Sato Y, Miyamoto K, Nakamura I, Ohki S, Koyama Y, et
al: Ectopic expression of MECA-79 as a novel prognostic indicator
in gastric cancer. Cancer Sci. 102:1088–1094. 2011. View Article : Google Scholar : PubMed/NCBI
|
|
30
|
Steentoft C, Yang Z, Wang S, Ju T,
Vester-Christensen MB, Festari MF, King SL, Moremen K, Larsen ISB,
Goth CK, et al: A validated collection of mouse monoclonal
antibodies to human glycosyltransferases functioning in mucin-type
O-glycosylation. Glycobiology. 29:645–656. 2019. View Article : Google Scholar : PubMed/NCBI
|
|
31
|
Dondossola D, Ghidini M, Grossi F, Rossi G
and Foschi D: Practical review for diagnosis and clinical
management of perihilar cholangiocarcinoma. World J Gastroenterol.
26:3542–3561. 2020. View Article : Google Scholar : PubMed/NCBI
|
|
32
|
Aryal RP, Ju T and Cummings RD: The
endoplasmic reticulum chaperone cosmc directly promotes in vitro
folding of T-synthase. J Biol Chem. 285:2456–2462. 2010. View Article : Google Scholar : PubMed/NCBI
|
|
33
|
Gupta R, Leon F, Rauth S, Batra SK and
Ponnusamy MP: A systematic review on the implications of O-linked
glycan branching and truncating enzymes on cancer progression and
metastasis. Cells. 9:4462020. View Article : Google Scholar : PubMed/NCBI
|
|
34
|
Hoshino H, Ohta M, Ito M, Uchimura K,
Sakai Y, Uehara T, Low S, Fukushima M and Kobayashi M: Apical
membrane expression of distinct sulfated glycans represents a novel
marker of cholangiolocellular carcinoma. Lab Invest. 96:1246–1255.
2016. View Article : Google Scholar : PubMed/NCBI
|