Introduction
Gastric cancer (GC) is the fifth most commonly diagnosed malignancy and the third leading cause of cancer-associated mortality worldwide (1–3). The majority of GC cases (95%) are adenocarcinomas, which can be grouped into the following two major histopathological subtypes using the Lauren classification: Intestinal gastric carcinoma (IGC) and diffuse gastric carcinoma (DGC) (3,4). In the more common IGC variant, cohesive malignant cells form well-differentiated gland-like structures with expansive growth patterns and well-established sequences of pre-malignant and malignant stages (5–7). By contrast, the DGC subtype is characterized by architectures that do not resemble glandular structures and mainly comprise poorly differentiated cells lacking cohesion, which readily invade adjacent tissues (5–7). In addition, the stages of DGC malignancy remain elusive (5–7). In particular, the DGC subtype is more frequently clinically diagnosed in younger patients, who typically present at advanced stages of the disease (8,9). DGC is characterized by fast rates of progression, higher recurrence frequencies and worse prognoses compared with those of IGC (8,9).
The distinct histological and clinical characteristics of these two GC subtypes are regulated by a complex network of interactions between environmental and endogenous, host-related factors, both of which can have profound effects on disease progression and prognosis (8–13). DGC is specifically associated with somatic or hereditary defects in the cadherin 1 (CDH1) gene, which encodes E-cadherin, and is caused by inactivating gene mutations and/or transcriptional silencing by hypermethylation in its promoter site (8,9,13–16). Notably, germline mutations or copy number variations in the CDH1 gene have been identified in 12–38% of diagnosed hereditary DGC (8,17). Furthermore, in sporadic DGC cases, somatic mutations of the CDH1 gene are more frequently detected in early-onset than late-onset DGC (18). Additionally, a number of studies have demonstrated the association of variations in the Ras homolog family member A (RHOA) gene, such as mutations and amplifications, and changes in its transcriptional activation (resulting in protein upregulation) with specific clinicopathological characteristics of the DGC subtype (17–21).
Both E-cadherin and RHOA proteins are functionally involved in the Wnt/β-catenin signaling pathway, which is essential for embryonic development and postnatal tissue homeostasis (22–25). In the gastrointestinal tract, Wnt signaling is primarily involved in the regulation of epithelial stem cell identity and proliferation, in addition to the maintenance of tissue regeneration following injury (26–28). The aberrant hypo- or hyperactivation of this signaling pathway is associated with various gastrointestinal diseases, including cancer (28–32).
Dysregulation of the Wnt signaling pathway is observed in ~50% of GC cases (29,30,32). Reported mechanisms of Wnt pathway dysregulation include upregulation and functional increase of transcriptional co-activator β-catenin (CTNNB1), Wnt ligands (Wnt 1, 2, 2B, 5a, 6, 8b and 10a), Frizzled receptors (FZD2, 3, 5, 7, 8 and 9) and lipoprotein receptor-related protein 6 (29,30,32). In addition, inactivation by allelic loss, gene mutations [CTNNB1, adenomatous polyposis coli (APC) and GSK3β] or by microRNA (miRNA/miR) targeting APC and/or downregulation (functional decrease) by gene promoter hypermethylation (CDH1, APC, Wnt-inhibitory factor-1, and Dickkopf Wnt-antagonists 1, 2 and 3) of various components of the canonical and non-canonical Wnt signaling pathways have also been observed (29,30,32).
Aberrant expression of the family of secreted frizzled-related proteins (SFRP), namely SFRP1, SFRP2, SFRP3, SFRP4 and SFRP5, which can serve as soluble antagonists of the Wnt signaling pathway, has been reported in pre-neoplastic gastric lesions, primary GC tissues, GC cell lines, and in blood and stool samples of patients with GC (31,33–46). Since Wnt-targeted genes are typically associated with tumor cell proliferation, tumor growth and inhibition of apoptosis in GC (33–46), restoration of SFRP activities can attenuate Wnt signaling and expression of these related genes, which in turn suppresses GC growth (33–46).
The mammalian dishevelled (DVL) family of proteins function as key mediators of Wnt signals from the plasma membrane to downstream effectors further in the cell (47,48). DVL dysfunction can also result in carcinogenesis by activating the canonical and non-canonical Wnt/β-catenin signaling pathways in several types of cancer, including GC (47,48). The dishevelled segment polarity protein 2 (DVL2) has been reported to be a central component of the Wnt/planar cell polarity signaling pathway, which regulates migration and invasion of tumor cells in GC tissues (48,49). In addition, the role of DVL2 and dishevelled segment polarity protein 3 (DVL3) in the regulation of CTNNB1 protein activation has previously been reported in Helicobacter pylori-induced GC (50).
However, it should be noted that in the majority of the aforementioned studies (33–46) investigating the effects of the aberrant expression of SFRP or DVL protein family members, only a small number of DGC cohorts were analyzed. In some cases, information specifically regarding the DGC subtype was missing entirely. Therefore, the present study aimed to investigate the protein and mRNA expression profile of Wnt antagonists SFRP1 and SFRP3/frizzled-related protein B, and dishevelled family members DVL2 and DVL3 in a larger cohort of DGC cases before analyzing the association of their expression levels with the clinicopathological parameters of patients.
Materials and methods
Patients and tissue samples
Retrospectively collected archived formalin-fixed and paraffin-embedded (FFPE) tumor tissue samples were obtained from 62 treatment-naïve patients with DGC [mean age at diagnosis ± standard deviation, 63.13±11.5 years; 36 males (58.1%) and 26 females (41.9%)] who underwent surgical resection for GC between January 2008 and October 2011 at the Department of Pathology, University Hospital Centre (Zagreb, Croatia). Histopathological diagnosis was performed according to the Lauren histological classification and the World Health Organization (WHO) criteria (3,51). With the exception of DGC tumor tissue samples, all other histopathological types of GC were not included in the study (exclusion criteria). Biopsy samples [n=62; mean age at gastroscopy ± standard deviation, 54.58±15.65 years; 35 males (56.5%) and 27 females (43.5%)] of the normal gastric mucosa obtained between October 2015 and October 2017 at the Department of Pathology, University Hospital Centre (Zagreb, Croatia) from patients without GC and H. pylori infection (exclusion criteria) who underwent gastroscopy at the Department of Gastroenterology, University Hospital Centre (Zagreb, Croatia) were used as the control. The present study protocol, including the use of archival DGC FFPE tissue samples and control FFPE samples obtained from patients without GC and H. pylori infection, was approved by the Clinical Research Ethics Committee of the University Hospital Centre Zagreb (approval no. 02/21/JG, class no. 8.1.-14/93/2; November 1, 2014) and the Research Ethics Committee of the School of Medicine, University of Zagreb (approval no. 380-59-10106-21-111/186, class no. 641/01/21-02/01). The patient demographic (i.e., age at diagnosis and sex) and clinical data (i.e., location of DGC and tumor staging parameters) were retrieved from their corresponding medical records and written informed consent was obtained from all participants involved in the present study.
Immunohistochemistry (IHC)
Retrieved FFPE DGC and normal gastric mucosa tissue blocks prepared immediately after surgical resection/biopsy procedures (to escape the potential loss of epitopes due to a delayed time to fixation). Briefly, 2–5-mm thick tissue sections were first immersed in 4% formaldehyde (for 48 h at 4°C) followed by dehydration using increasing concentrations of ethanol [for a 1-h incubation in each concentration at room temperature (RT)] and incubation in xylene (3 changes; 1.5 h each at RT), and then embedded in paraffin wax according to a standard procedure (52). Obtained FFPE tissue blocks were first cut into 5-µm thick sections and placed on silanized glass slides (DakoCytomation; Agilent Technologies, Inc.) for immunostaining. Sections were deparaffinized (3X; 5 min) with xylene (Sigma-Aldrich; Merck KGaA) and rehydrated in an ethanol (Sigma-Aldrich; Merck KGaA) gradient and distilled water. Endogenous peroxidase was blocked using 3% hydrogen peroxide for 10 min at RT, followed by heating in a water bath for 20 min at 97°C in Dako REAL Target Retrieval Solution (S2367; Dako; Agilent Technologies, Inc.). After incubation, the slides were washed three times in 1% PBS/5% goat serum (Sigma-Aldrich; Merck KGaA). Protein expression levels and cellular localization of SFRP1, SFRP3, DVL2 and DVL3 were determined using rabbit polyclonal antibodies against human SFRP1 (dilution, 1:200; cat. no. sc-13939; Santa Cruz Biotechnology, Inc.), SFRP3 (dilution, 1:200; cat. no. sc-13941; Santa Cruz Biotechnology, Inc.), DVL2 (dilution, 1:500; cat. no. sc-13974; Santa Cruz Biotechnology, Inc.) and DVL3 (dilution, 1:100; cat. no. sc-271295; Santa Cruz Biotechnology, Inc.). Following incubation with primary antibodies at 4°C overnight, the slides were incubated with ready-to-use HRP-conjugated secondary antibodies (cat. no. K8024; EnVision Flex/HRP High pH; Dako; Agilent Technologies, Inc.) for 45 min at RT, developed in a 3,3′-diaminobenzidine chromogen solution (Dako; Agilent Technologies, Inc.) and counterstained with ready to use hematoxylin solution (Mayer's, modified; Abcam) for 35 sec at RT. Negative controls underwent the same staining procedure with the exclusion of the primary antibodies. The FFPE tissue sections of renal cell carcinomas were used as a positive control for SFRP1 and SFRP3 protein expression, while FFPE placental tissue sections were used as a positive control for DVL1 and DVL3 protein expression as previously described (53,54). The inclusion of several tissue sections obtained from one placental (female; 35 years of age) and one clear cell renal cell carcinoma (male, 55 years of age) FFPE tissue block to be used as positive controls for IHC staining was approved by the Clinical Research Ethics Committee of the Clinical Hospital ‘Sveti Duh’ Zagreb, Croatia (approval no. 01-4685; November 20, 2017), Clinical Hospital ‘Merkur’ Zagreb; Croatia (approval no. 03/1-11088, December 7, 2017) and the Research Ethics Committee of the School of Medicine University of Zagreb (approval no. 380-59-10106-19-111/181, class 641-01/19-02/01). Renal cell carcinomas and placental tissue FFPE sections were obtained from the Department of Pathology, School of Medicine, University of Zagreb (Zagreb, Croatia) and from the Department of Pathology, Clinical Hospital ‘Merkur’ (Zagreb, Croatia), respectively. Samples use as positive controls for IHC staining were collected between January and March 2018, and informed consent was obtained from both patients providing the tissue samples. Analysis of the IHC staining parameters was performed using compound light microscopy (Olympus) by two independent observers blinded to the parameters of the experiment.
SFRP1 and SFRP3 protein expression was measured by performing a quantitative stereological analysis of the numerical density (Nv) and volume density (Vv) of their IHC staining pattern, while DVL2 and DVL3 expression in normal gastric mucosa and DGC tissue samples was assessed using the following semi-quantitative scoring method: 0, no staining; 1, positive staining in <10% cells; 2, positive staining in 10–50% cells; and 3, positive staining in >50% of the cells. For the statistical analysis of DVL2 and DVL3 protein expression, the DGC and control groups were subsequently subdivided into the following two groups: i) Positive staining in <10% cells combined with sections with no staining; and ii) positive staining in 10–50% of the cells. For 3 patients there are no data for DVL2 and DVL3 IHC staining due to tissue scarcity. Thus, for this analysis the total number of DGC patients was 59.
Quantitative stereological analysis of SFRP1 and SFRP3 IHC staining
Quantitative stereological analysis of SFRP1 and SFRP3 Nv in the aforementioned IHC samples was performed using a Nikon Alphaphot binocular light microscope (Nikon Corporation) coupled with a Weibel's multipurpose test system with 42 points at a magnification of ×400, with a total length of test lines of 1.008 mm and test area (At) of 0.0837 mm2 for each microscopic field analyzed (53). For each investigated group, an orientation/pilot stereological measurement was performed to first define the number of fields to be tested (55). The Nv of SFRP1- and SFRP3-positive cells was then determined according to the point-counting method and calculated using the following formula: Nv × ¼N=At × D, where N is the number of positive cells on the tested area, and D is the average ‘tangent diameter’ of the structures (55–57). Subsequently, the SFRP1 and SFRP3 Vv calculation was performed according to the following formula: Vv=Pf/Pt, where Pf represents the number of hit test points on the positive cells and Pt represents the number of all test points on the tested area (55).
Reverse transcription-quantitative PCR (RT-qPCR)
Total RNA was isolated from five consecutive 5-µm thick sections of DGC FFPE tissue blocks (n=62), and FFPE tissue blocks of the normal gastric mucosae (n=62) were used as the control. All tissue sections were deparaffinized by incubation in 1.0 ml xylene (Invitrogen; Thermo Fisher Scientific, Inc.) for 3 min at 50°C followed, by centrifugation three times for 5 min at RT at 12,000 × g each. The supernatant was then discarded, and the pellet was washed three times with 1.0 ml absolute ethanol. Subsequently, the pellet obtained from tissue sections was incubated in 350 µl protease K digestion buffer (20 mM Tris-HCl pH 8.0; 1 mM CaCl2; 0.5% sodium dodecyl sulfate and 500 µg/ml protease K; all reagents were obtained from Sigma-Aldrich; Merck KGaA) overnight at 55°C. Total RNA was isolated using TRIzol® reagent (Invitrogen; Thermo Fisher Scientific, Inc.) according to the manufacturer's protocol. RNA purity and concentration were evaluated using a NanoDrop 200 spectrophotometer (Thermo Fisher Scientific, Inc.). A total of 1 µg total RNA from each sample was reverse transcribed using the high-capacity cDNA Reverse Transcription kit (Applied Biosystems; Thermo Fisher Scientific, Inc.) according to the manufacturer's protocol. The mRNA expression levels of SFRP1, SFRP3, DVL2 and DVL3 were determined using a CFX-96 real-time qPCR detection system and a C100 thermal cycler (Bio-Rad Laboratories, Inc.). All qPCR reactions were performed in triplicate using TB Green™ Premix Ex Taq™ II (Tli RNaseH Plus PCR master mix; Takara Biotechnology Co., Ltd.). The following thermocycling conditions were used: Initial denaturation at 95°C for 30 sec, followed by 40 cycles of 95°C for 5 sec and 60°C for 30 sec. The CFX96 manager software version 3.1, (Bio-Rad Laboratories, Inc.) was used to generate the cycle threshold values and the data were analyzed using the 2−ΔΔCq method (58). The relative mRNA expression levels of SFRP1, SFRP3, DVL2 and DVL3 were normalized against the mRNA expression levels of the β-actin (ACTB) gene as an endogenous control. The specificity of qPCR amplification was confirmed using melting curve analysis. The sequences of the oligonucleotide primers used were as follows: SFRP1 forward, 5′-ATCTCTGTGCCAGCGAGTTT-3′ and reverse, 5′-GGCTTCTTCTTCTTGGGGAC-3′ [accession no. NM_003012.5; product length, 94 nucleotides (nt)]; SFRP3 forward, 5′-CCTGCCCTGGAACATGACTAA-3′ and reverse, 5′-CAGACCTTCGAACTGCTCGAT-3′ (accession no. NM_001463.4; product length, 91 nt); DVL2 forward, 5′-TGAGCAACGATGACGCTGTG-3′ and reverse, 5′-GCAGGGTCAATTGGCTGGA-3′ (accession no. NM_004422.3; product length, 148 nt); DVL3 forward, 5′-ACAATGCCAAGCTACCATGCTTC-3′ and reverse, 5′-AGCTCCGATGGGTTATCAGCAC-3′ (accession no. NM_004423.4; product length, 109 nt); and ACTB forward, 5′-GGGCATGGGTCAGAAGGATT-3′ and reverse, 5′-AGTTGGTGACGATGCCGTG-3′ (accession no. NM_001101.5; product length, 101 nt).
In silico analysis of RNA-sequencing (RNA-seq) data from the cancer genome atlas (TCGA)-stomach cancer (STAD) project
The in silico analysis of differential gene expression (mRNA levels) of SFRP1, SRP3, DVL2 and DVL3 between the GC tissue samples and corresponding adjacent normal solid tissue or normal gastric tissue obtained from non-cancerous patients was initially performed using the University of California Santa Cruz (UCSC) Xena browser (https://xenabrowser.net; accessed, August 9, 2021) (59).
Firstly, clinical and genetic information of the GC samples (n=580) were derived from TCGA-STAD dataset (https://xenabrowser.net; accessed, August 9, 2021) (59). The obtained data were then sub-divided according to the tumor histological classification, where only data corresponding to DGC (tumor and adjacent normal tissues) with no history of neoadjuvant therapy (total number of samples n=75; DGC n=69; adjacent normal solid tissue n=6) were used. Data corresponding to IGC subtypes and other GC samples that were not histologically specified were excluded from further analysis. Secondly, using the UCSC Xena browser, the so-called TCGA TARGET Genotype-Tissue Expression (GTEx) study analysis of the GC tissues was performed, which contained both the gene expression data for GC tumor tissue (n=414) and gene expression data for normal tissue samples (n=174) obtained from individuals who do not have cancer (https://xenabrowser.net; accessed, August 9, 2021) (59). In TCGA TARGET GTEx study analysis, data for the normal adjacent tissues were omitted from the analysis so that the final number of analyzed samples was 588 (59). RNA-seq data corresponding to SFRP1, SRP3, DVL2 and DVL3 gene expression obtained from TCGA STAD study and TCGA TARGET GTEx study were normalized using the UCSC XENA browser and presented as log2(norm count + 1) and RNA-seq data (IlluminaHiSeq TCGA Hub) were normalized and presented as log2(norm count + 1), in which the norm_count refers to RNA-seq by Expectation Maximization values. Gene transcript expression was calculated as transcripts per million (TPM). The following criteria were applied: log2(fold-change)|≥2, P<0.05. The expression of SFRP1, SFRP3, DVL2 and DVL3 in tumor and adjacent normal tissues was compared using Welch's t-test (unequal variances t-test), and P<0.05 was considered to indicate a statistically significant difference. Analysis was performed online using the default parameters of the UCSC Xena browser (https://xenabrowser.net; accessed, August 9, 2021) (59).
The in silico analysis of differential SFRP1, SFRP3, DVL2 and DVL3 gene expression (mRNA levels) between DGC and corresponding adjacent solid normal tissues was also performed using the UALCAN web resource (http://ualcan.path.uab.edu/analysis.html; last accessed, August 9, 2021) as previously described (45,60). In this case, the required clinical and genetic information related to the DGC samples was also derived from the TCGA-STAD dataset. Differences in the transcriptional levels of SFRP1, SFRP3, DVL2 and DVL3 were first assessed between the adjacent normal tissue samples (n=34) and all primary GC cases (n=415) and subsequently between the adjacent normal tissue samples and GC histological subtypes [gastric adenocarcinoma non otherwise specified n=155; DGC n=69; signet-ring cell carcinoma (SRCC) GC samples n=12; IGC not otherwise specified n=73; IGC tubular n=76; IGC mucinous n=20, and IGC papillary n=7]. In all cases, comparisons between the groups were performed using the unequal variances t-test as previously described (45,60). The differential analysis of SFRP1, SFRP3, DVL2 and DVL3 transcriptional levels (mRNA) in adjacent solid normal tissues and distinct histological subgroups of GC from the UALCAN dataset was assessed using a t-test, and P<0.05 was considered to indicate a statistically significant difference (60). As a measure of targeted gene expression (SFRP1, SFRP3, DVL2 and DVL3) UALCAN web resource uses the TPM expression values to generate the visualized representations of gene expression featuring the interquartile range (IQR), including minimum, 25th percentile, median, 75th percentile and maximum values (60). Outliers were excluded from the plot. Analysis was performed online using the default parameters of the UALCAN web resource (http://ualcan.path.uab.edu/analysis.html) (60).
Statistical analysis
Statistical analysis was performed using SPSS software version 22.0 (IBM Corp.) and GraphPad Prism 5.01 (GraphPad Software, Inc.). Normal distribution was assessed using the Shapiro-Wilk test. Data are presented as counts (n) and percentages (%) for categorical variables and as the mean ± standard deviation or median and IQR for continuous variables. Statistical analyses were performed using the Fisher's exact test, unpaired independent-samples t-test, Mann-Whitney U test and Kruskal-Wallis test (with Bonferroni post hoc test for multiple comparisons when applicable), as appropriate. The correlations between SFRP1, SFRP3, DVL2 and DVL3 protein expression values and patient clinicopathological data were determined using the Spearman's rank correlation model. All statistical tests were two-sided and intergroup differences with P<0.05 were considered significant and corrected according to the Bonferroni procedure [the corrected P-value threshold for significance (Pc) was as follows: Pc = 0.05/N, where N represents the number of independent tests]. All reported P-values were uncorrected unless stated otherwise.
Results
Demographic and clinical characteristics of the patients with DGC
The basal clinical and demographic characteristics of the patients with DGC included in the present study are shown in Table I. No significant difference (DGC: 36 males (58.1%) and 26 females (41.9); control: 35 males (56.5%) and 27 females (43.5%); P>0.999) was observed in gender distribution between the DGC and control patients group (data not shown). Significant differences were observed between the DGC and control groups in terms of age at the time of surgery/biopsy (DGC, 63.13±11.50 years; control, 54.58±15.65 years, P=0.001; data not shown). However, no difference was observed when this variable was separately analyzed in male and female patient groups (DGC, 64.39±10.45 years for male patients and 61.32±12.91 years for female patients, P=0.309; control, 54.57±16.40 years for male patients and 54.59±14.94 years for female patients, P=0.996; data not shown).
 |
Table I.
Basic demographic and clinical characteristics of the group of patients with diffuse gastric carcinoma (n=62).
|
Table I.
Basic demographic and clinical characteristics of the group of patients with diffuse gastric carcinoma (n=62).
| Characteristics |
Value |
| Age, years |
63.13±11.50 |
| ≤60 |
50.78±7.17 |
| >60 |
70.61±5.64 |
| Sex, n (%) |
|
| Male |
36 (58.1) |
| Female |
26 (41.9) |
| T stagea, n (%) |
|
| T1-T2 |
6 (9.7) |
| T3-T4 |
55 (88.7) |
| N stagea, n (%) |
|
| N0 |
13 (21.0) |
| N1-N3 |
48 (77.4) |
| M stagea, n (%) |
|
| M0 |
45 (72.6) |
| M1 |
16 (25.8) |
| Clinical stagea, n (%) |
|
| I–II |
11 (17.7) |
| III–IV |
50 (80.6) |
| Locationa, n (%) |
|
| Proximal |
5 (8.1) |
| Medial |
29 (46.8) |
| Distal |
23 (37.1) |
| Gastric stump/remnant |
1 (1.6) |
At the time of surgery, 50% of the tumors were localized in the antrum (30.6%) or minor curvature (21.0%; data not shown). In addition, the majority of the DGC cases were either in the T3-T4 (88.7%), N1-N3 (77.4%) and/or M0 (72.6%) clinical stages, indicating advanced stages of disease (Table I).
For 4 patients, clinicopathological data were incomplete.
Protein expression levels of SFRP1 and SFRP3 in the DGC and control tissue samples
IHC analysis revealed higher protein expression levels of SFRP1 and SFRP3 in the normal gastric mucosa compared with the tumor tissue samples. In the normal gastric mucosa samples, SFRP1 protein was mainly localized in the cytoplasm and nuclei of gland cells, while SFRP3 staining was also detected in the plasma membrane (Figs. 1 and 2). Cytoplasmic and nuclear localization of the SFRP1 protein was also detected in the DGC tissue sections, while SFRP3 localization in the DGC tissues was predominantly cytoplasmic, although nuclear and membrane positivity could also be observed (Figs. 1 and 2).
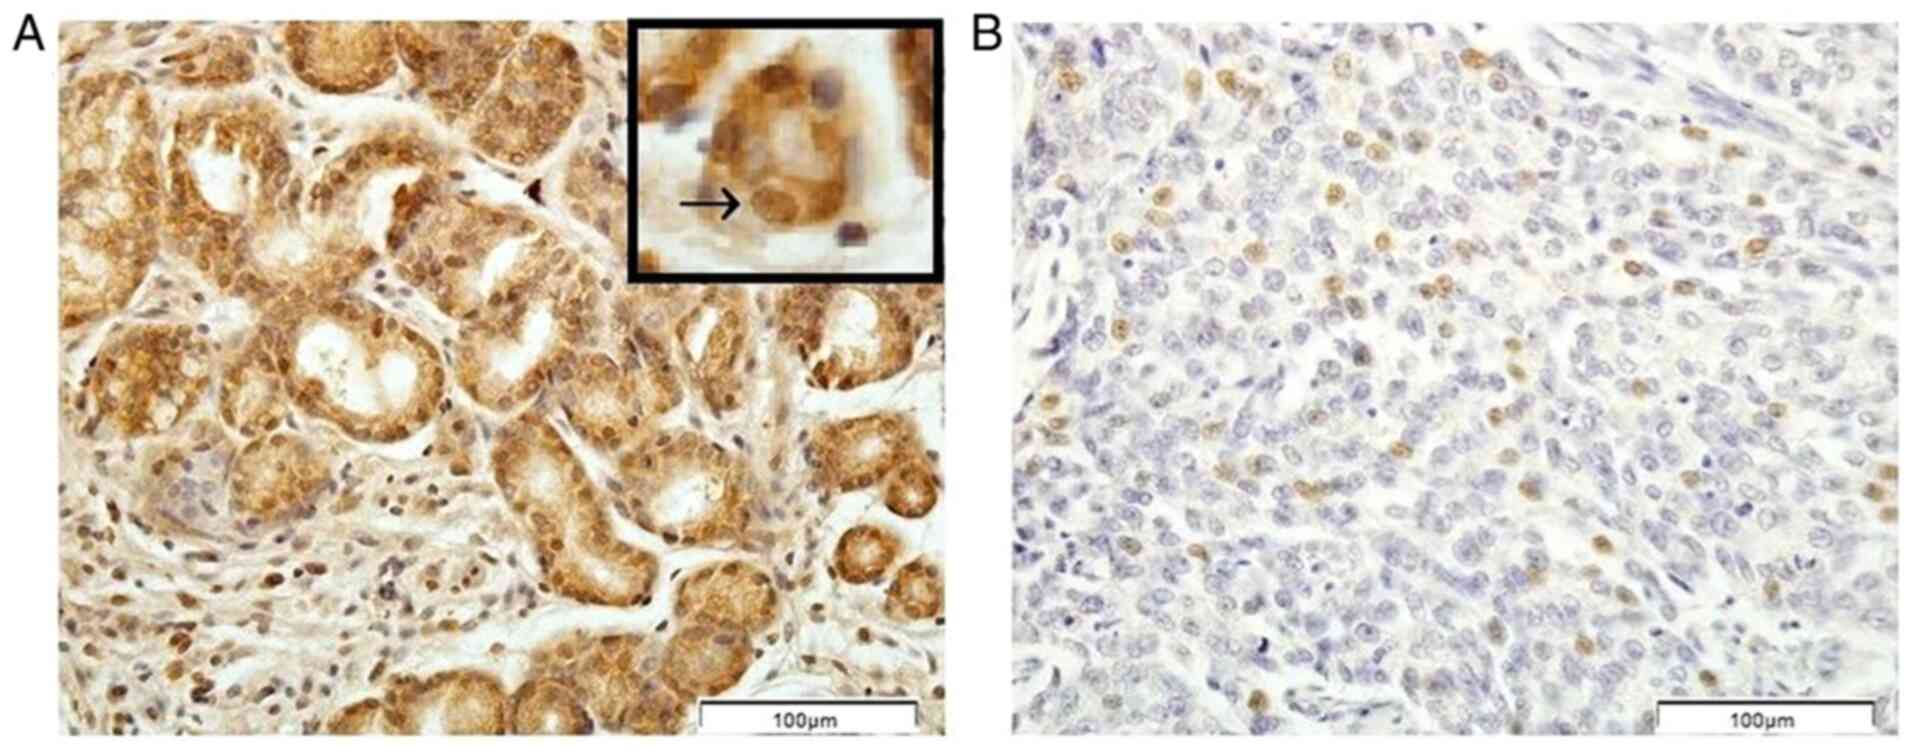 |
Figure 1.
Immunohistochemical pattern of secreted frizzled-related protein 1 protein expression in (A) the biopsy samples of the normal gastric mucosae and (B) tumor tissue samples of patients with diffuse gastric carcinoma. The arrow in the upper box in (A) indicates the nuclear staining. Scale bar, 100 µm.
|
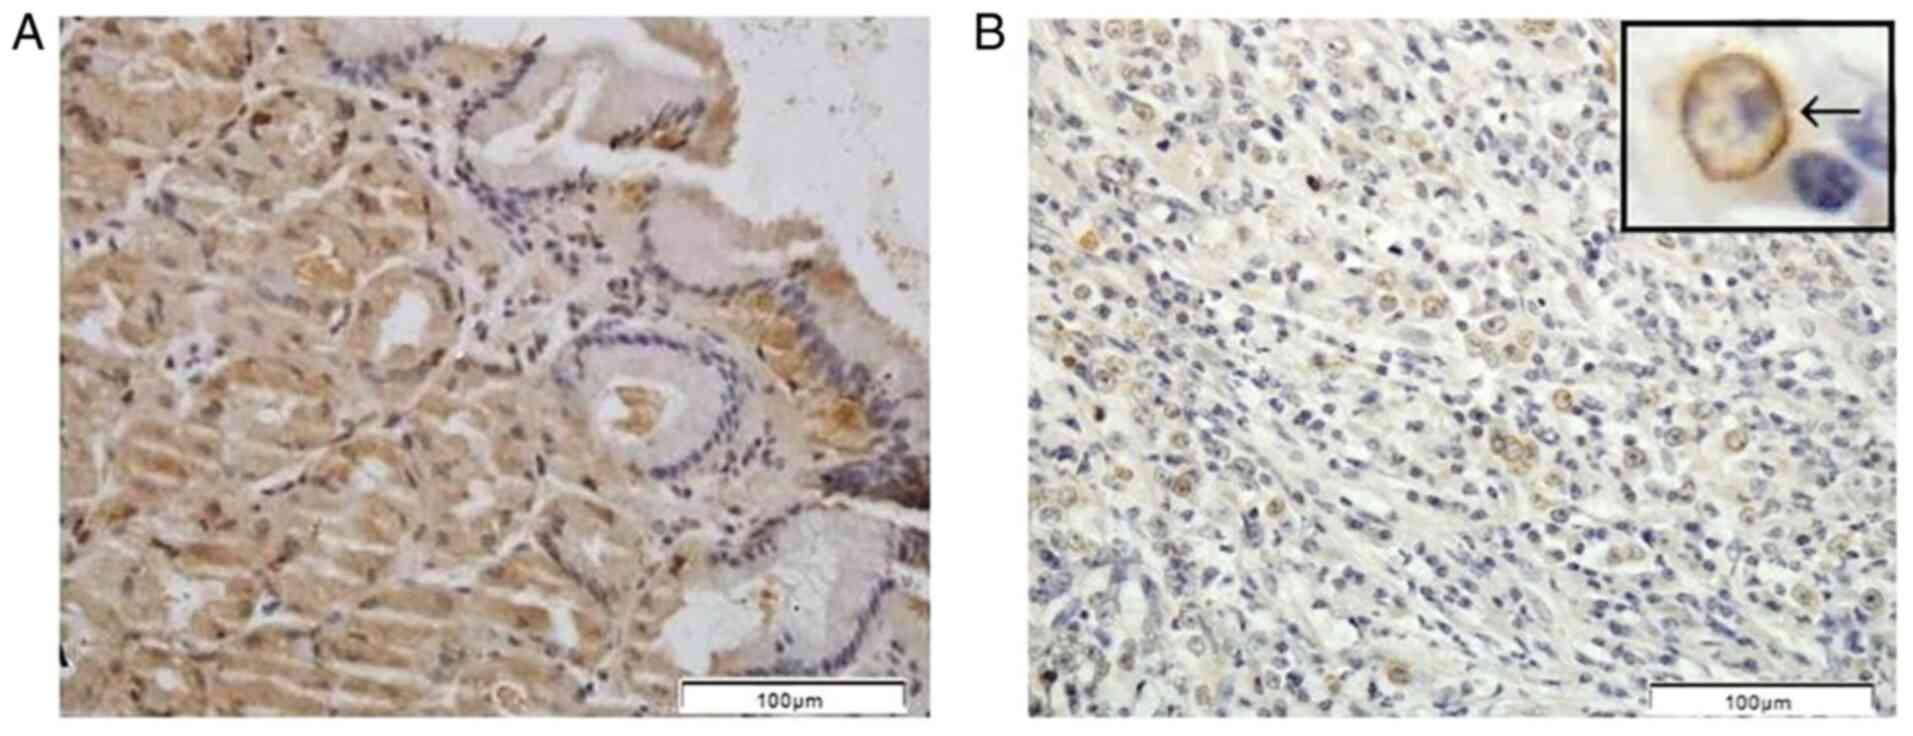 |
Figure 2.
Immunohistochemical pattern of secreted frizzled-related protein 3 protein expression in (A) the biopsy samples of the normal gastric mucosae and (B) tumor tissue samples of patients with diffuse gastric carcinoma. The arrow in the upper box in (B) indicates the cell membrane staining. Scale bar, 100 µm.
|
Higher SFRP1 and SFRP3 protein expression in control tissues was also demonstrated using quantitative stereological analysis. Specifically, the Nv values for SFRP1 [control, 372,732.07 (325,775.89–437,725.94); DGC, 67,516.88 (49,371.91–105,720.87); P<0.001] and SFRP3 [control, 344,669.50 (300,769.64–390,305.91); DGC, 72,657.05 (40,774.08–124,892.33); P<0.001] protein expression were significantly higher in normal gastric mucosa samples compared with DGC tissue samples (Fig. 3). Additionally, a similar trend was identified in Vv analysis (Fig. 3) in terms of both SFRP1 [control, 0.20 (0.16–0.32); DGC, 0.07 (0.04–0.09); P<0.001] and SFRP3 [control, 0.19 (0.16–0.27); DGC, 0.06 (0.04–0.08), P<0.001]. These results of Nv and Vv analyses remained significant even after Bonferroni's correction was applied (P<Pc; Pc=0.05/2=0.025).
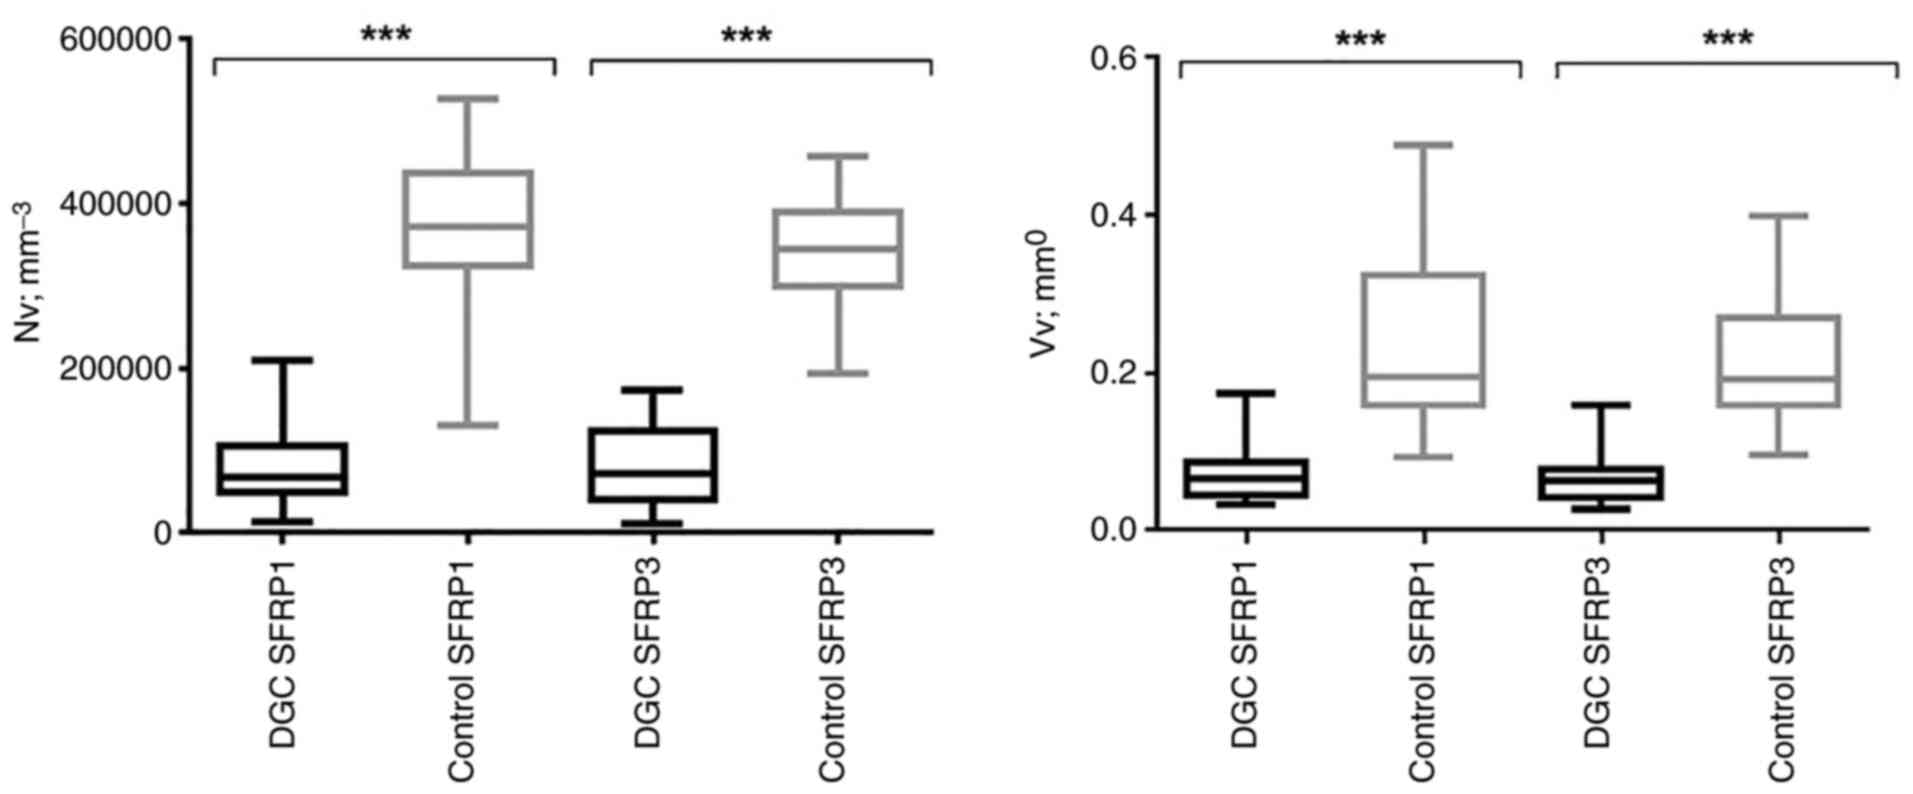 |
Figure 3.
Nv (mm−3) and Vv (mm°) analysis of SFRP3 and SFRP1 protein immunostaining pattern in DGC and control tissue samples. ***Significant (<Pc) P-values (P<0.001; Mann-Whitney U test) after Bonferroni correction for multiple comparisons (Pc = 0.025=0.05/2-number of comparisons). DGC, diffuse gastric carcinoma; Nv, numerical density; Pc, Bonferroni correction for multiple comparisons; SFRP1, secreted frizzled-related protein 1; SFRP3, secreted frizzled-related protein 3; Vv, volume density.
|
When SFRP1 and SFRP3 protein expression values were compared separately among the members of the DGC or control tissue group, no significant difference was observed for either Nv or Vv after Bonferroni's correction was applied (data not shown). However, in both DGC and control tissue samples, slightly higher values for SFRP1 expression were observed compared with those of SFRP3 expression (data not shown). In addition, no statistically significant association was found between the Nv or Vv values of SFRP1 and any of the demographic or clinicopathological characteristics analyzed (Table II). By contrast, Vv values of SFRP3 protein expression were significantly associated with T stage (P=0.004; Mann-Whitney U test) and DGC clinical stage (P=0.004; Mann-Whitney U test). In particular, the values of SFRP3 Vv were higher in the T3-T4 group [0.06 (0.05–0.08)] compared with the T1-T2 stage group [0.04 (0.0328–0.06)], while also being higher in the III–IV group [0.07 (0.05–0.08)] compared with the I–II clinical stage group [0.04 (0.03–0.06); Table III]. Therefore, this suggested that higher SFRP3 protein expression levels may be associated with more advanced DGC stages.
|
Table II.
Association between SFRP1 protein expression (numerical and volume density) and demographic and clinical data of patients.
|
Table II.
Association between SFRP1 protein expression (numerical and volume density) and demographic and clinical data of patients.
| Characteristics |
SFRP1 numerical density, mm−3 |
P-value |
SFRP1 volume density, mm° |
P-value |
| Age, years |
|
0.982 |
|
0.732 |
| ≤60 |
67516.88 (50290.35–133088.83) |
|
0.06 (0.05–0.09) |
|
| >60 |
69045.04 (50622.22–104887.33) |
|
0.07 (0.05–0.09) |
|
| Sex |
|
0.260 |
|
0.607 |
| Male |
64321.64 (47951.80–94815.37) |
|
0.07 (0.05–0.08) |
|
| Female |
70712.12 (48831.65–163443.63) |
|
0.07 (0.05–0.12) |
|
| T stagea |
|
0.878 |
|
0.714 |
| T1-T2 |
73490.59 (49804.12–116279.07) |
|
0.06 (0.04–0.09) |
|
| T3-T4 |
67516.88 (50290.35–106971.19) |
|
0.07 (0.05–0.09) |
|
| N stagea |
|
0.109 |
|
0.214 |
| N0 |
104748.41 (56541.91–151982.44) |
|
0.07 (0.05–0.10) |
|
| N1-N3 |
63071.32 (44995.82–100233.39) |
|
0.06 (0.05–0.08) |
|
| M stagea |
|
0.688 |
|
0.605 |
| M0 |
70573.20 (51957.43–106137.65) |
|
0.07 (0.05–0.09) |
|
| M1 |
61245.30 (44995.82–143369.18) |
|
0.06 (0.05–0.11) |
|
| Clinical stagea |
|
0.866 |
|
0.735 |
| I–II |
67794.73 (50290.35–149203.97) |
|
0.06 (0.05–0.09) |
|
| III–IV |
67516.88 (49788.68–105304.10) |
|
0.07 (0.05–0.09) |
|
| Locationa |
|
0.769b |
|
0.271b |
| Proximal |
94468.06 (48623.27–156983.69) |
|
0.07 (0.05–0.14) |
|
| Medial |
60848.55 (43483.09–116140.15) |
|
0.05 (0.04–0.08) |
|
| Distal |
67794.73 (55291.60–101692.09) |
|
0.07 (0.05–0.10) |
|
| Gastric stump/remnant |
61126.39 (NA) |
|
0.07 (NA) |
|
|
Table III.
Association between SFRP3 protein expression (numerical and volume density) and demographic and clinical data of patients.
|
Table III.
Association between SFRP3 protein expression (numerical and volume density) and demographic and clinical data of patients.
| Characteristics |
SFRP1 numerical density, mm−3 |
P-value |
SFRP1 volume density, mm° |
P-value |
| Age, years |
|
0.527 |
|
0.409 |
| ≤60 |
80297.85 (39454.31–127809.73) |
|
0.07 (0.04–0.08) |
|
| >60 |
62932.40 (40774.08–120933.01) |
|
0.06 (0.04–0.08) |
|
| Sex |
|
0.120 |
|
0.949 |
| Male |
72657.05 (53832.90–138993.08) |
|
0.06 (0.04–0.08) |
|
| Female |
68350.42 (34036.29–118571.30) |
|
0.07 (0.04–0.08) |
|
| T stagea |
|
0.067 |
|
0.004 |
| T1-T2 |
43622.02 (26673.34–72379.21) |
|
0.04 (0.03–0.06) |
|
| T3-T4 |
77241.53 (43622.02–128643.27) |
|
0.06 (0.05–0.08) |
|
| N stagea |
|
0.346 |
|
0.167 |
| N0 |
56125.14 (36953.68–113361.67) |
|
0.06 (0.04–0.07) |
|
| N1-N3 |
75018.75 (44663.94–132185.82) |
|
0.06 (0.05–0.08) |
|
| M stagea |
|
0.342 |
|
0.787 |
| M0 |
66405.49 (37648.30–119335.39) |
|
0.06 (0.04–0.08) |
|
| M1 |
79603.23 (53693.98–131977.44) |
|
0.06 (0.05–0.08) |
|
| Clinical stagea |
|
0.141 |
|
0.004 |
| I–II |
53068.82 (34175.21–104470.56) |
|
0.04 (0.03–0.06) |
|
| III–IV |
78769.69 (46747.80–129824.12) |
|
0.07 (0.05–0.08) |
|
| Locationa |
|
0.350b |
|
0.059b |
| Proximal |
66405.49 (43344.17–104053.79) |
|
0.06 (0.03–0.06) |
|
| Medial |
72795.98 (39593.23–125864.80) |
|
0.07 (0.05–0.83) |
|
| Distal |
80297.85 (43622.02–139201.47) |
|
0.06 (0.04–0.08) |
|
| Gastric stump/remnant |
174210.22 (NA) |
|
0.031 (NA) |
|
Protein expression levels of DVL2 and DVL3
Positive IHC staining for DVL2 and DVL3 in the normal gastric mucosa and DGC tissues was found mainly in the cytoplasm of gland cells (Figs. 4 and 5). In control tissues, both DVL2 and DVL3 proteins exhibited mostly weak (1+; DVL2, 56.9%; DVL3, 63.8%) to moderate (2+; DVL2, 27.6%; DVL3, 34.5%) staining, while no staining (IHC=0) was detected in 15.5% (DVL2) and 1.7% (DVL3) of the cases (data not shown). Furthermore, a predominantly weak (1+; DVL2, 44.1%; DVL3, 11.9%) to moderate (2+; DVL2, 55.9%; DVL3, 88.1%) staining pattern was also observed in DGC. However, negative DVL2 and DVL3 staining patterns were not observed in the analyzed DGC tissue sections (data not shown). No staining pattern with >50% stained cells (IHC=3+) could be observed in any of the analyzed DGC or control tissue sections (data not shown). Therefore, for the statistical analysis of DVL2 and DVL3 protein expression, the DGC and control groups were subsequently subdivided into the following two groups: i) Positive staining in <10% cells combined with sections with no staining; and ii) positive staining in 10–50% of the cells.
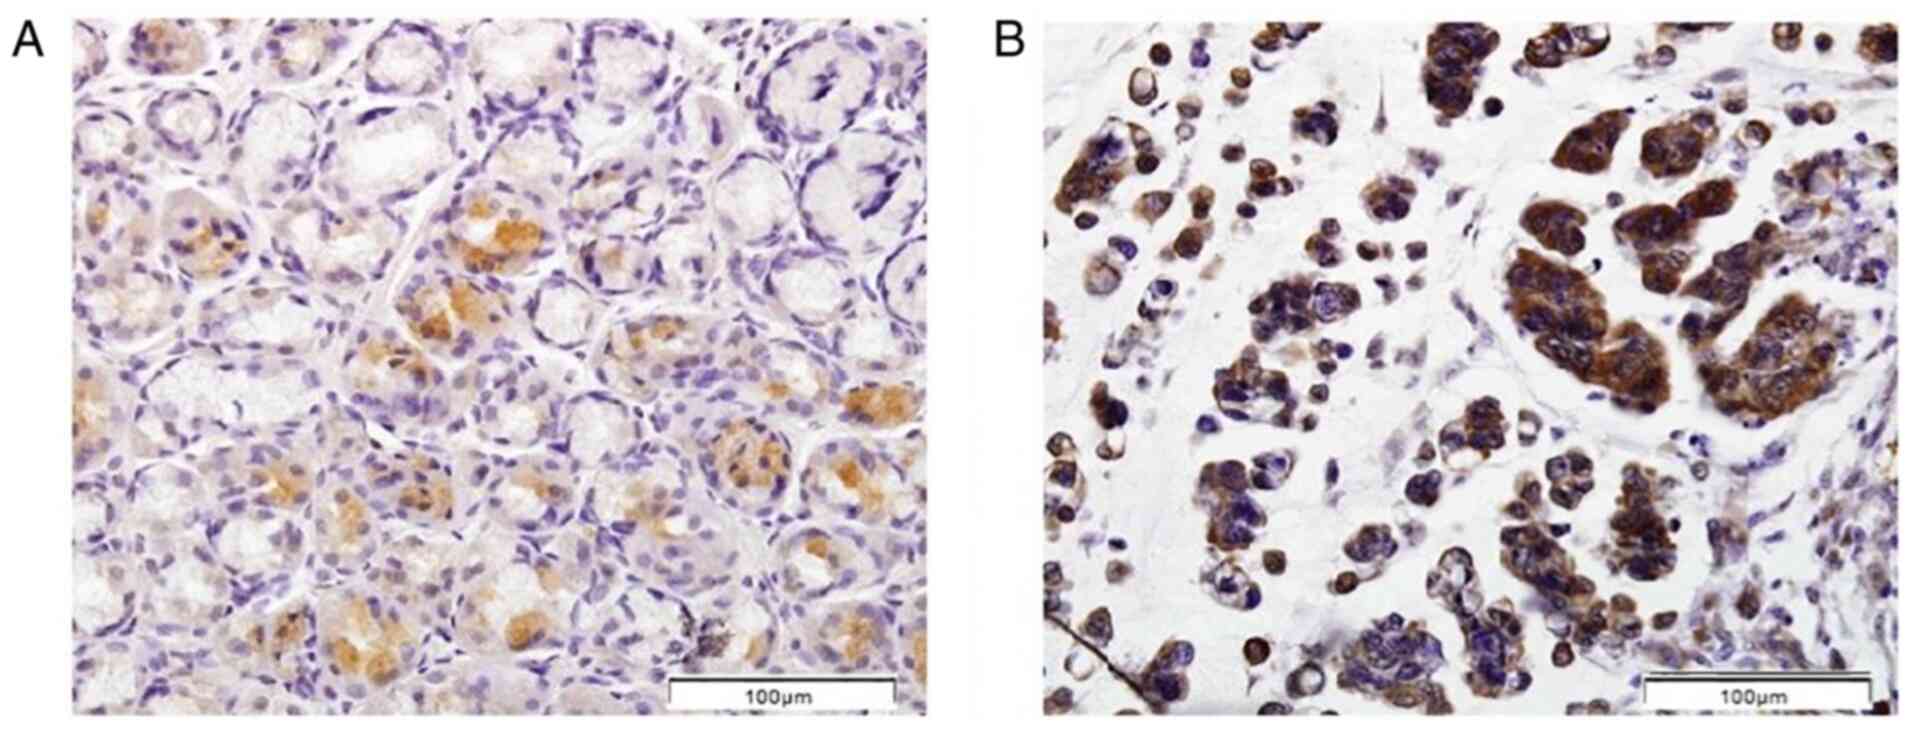 |
Figure 4.
Immunohistochemical pattern of dishevelled segment polarity protein 2 protein expression. (A) Normal gastric mucosae and (B) tumor tissue samples of patients with diffuse gastric carcinoma. Scale bar, 100 µm.
|
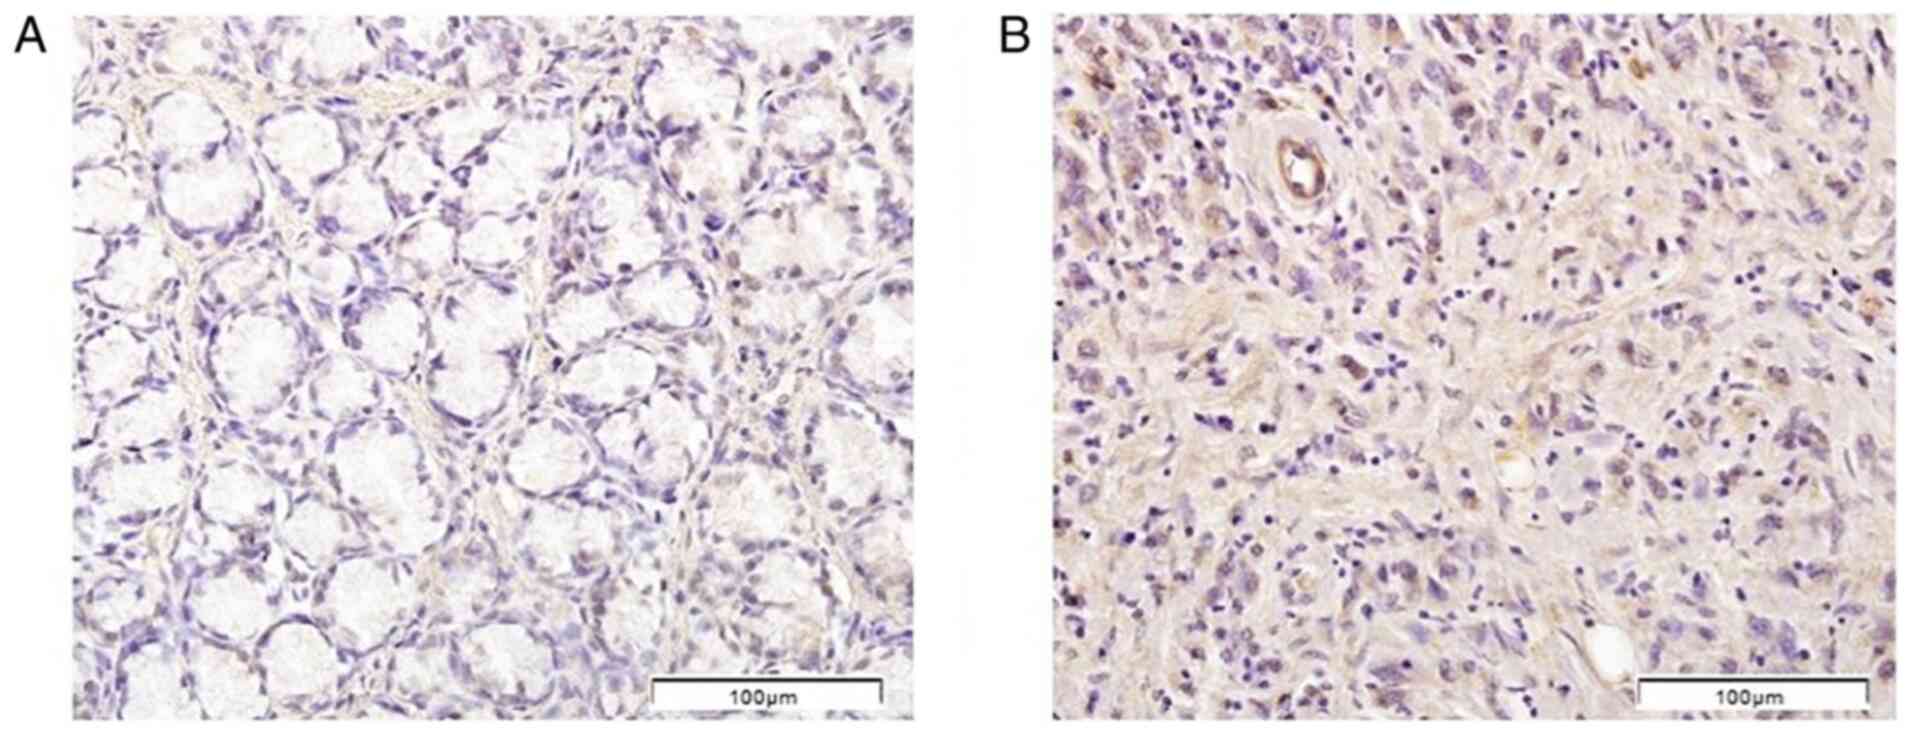 |
Figure 5.
Immunohistochemical pattern of dishevelled segment polarity protein 3 protein expression. (A) Normal gastric mucosae and (B) tumor tissue samples of patients with diffuse gastric carcinoma. Scale bar, 100 µm.
|
The protein expression levels of DVL2 (P<0.001) and DVL3 (P<0.001) were significantly higher in DGC tissues compared with in control tissue sections (Fig. 6), which remained significant even after Bonferroni's correction was applied (Pc=0.05/3=0.017).
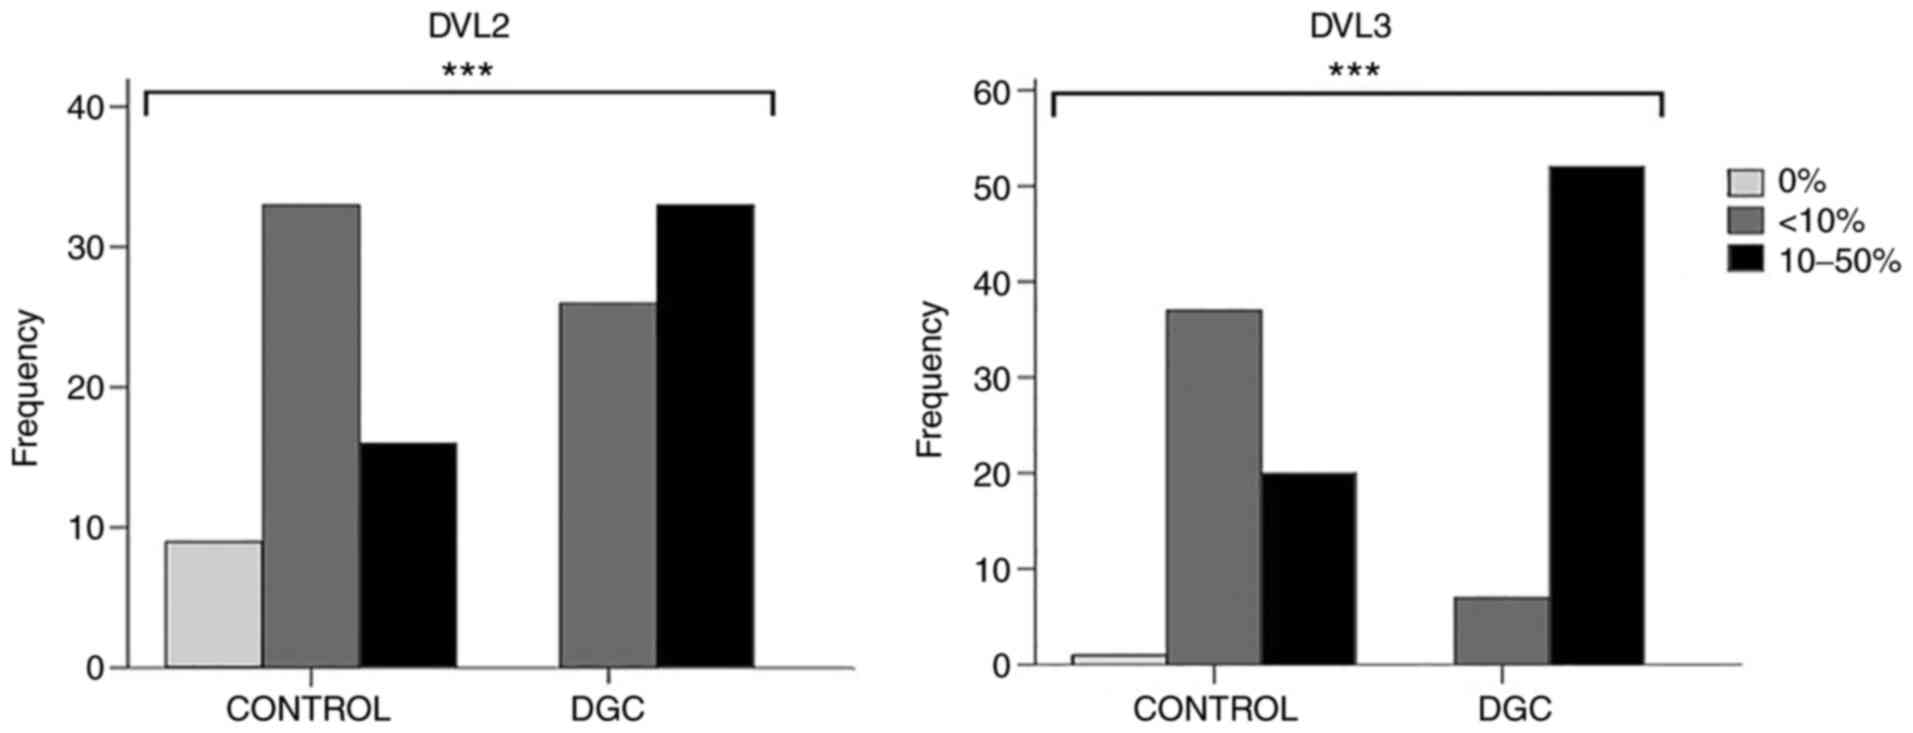 |
Figure 6.
Differential protein expression of DVL2 and DVL3 between the DGC and control tissue samples. ***Significant P-values (P<0.001; Fisher's exact test). Fig. 6 was generated using SPSS software version 22.0. DGC, diffuse gastric carcinoma; DVL2, dishevelled segment polarity protein 2; DVL3, dishevelled segment polarity protein 3.
|
When the protein expression values of DVL2 and DVL3 were compared separately among the members of the DGC or control tissue group, no statistically significant difference was observed. However, in both DGC and control tissue samples, slightly higher DVL3 protein expression values were observed compared with those of DVL2 (data not shown). No statistically significant association was observed between either DVL2 or DVL3 protein expression and any of the clinicopathological parameters of the patients with DGC analyzed in the present study (Table IV).
|
Table IV.
Association between the DVL2 and DVL3 protein expression values and demographic and clinical data of the patients.
|
Table IV.
Association between the DVL2 and DVL3 protein expression values and demographic and clinical data of the patients.
| |
DVL2 |
|
DVL3 |
|
| |
|
|
|
|
| Characteristics |
<10% |
10–50% |
P-value |
<10% |
10–50% |
P-value |
| Agea, years |
|
|
0.416 |
|
|
0.085 |
| ≤60 |
11 (42.3) |
10 (31.3) |
|
0 (0.0) |
21 (40.4) |
|
| >60 |
15 (57.7) |
23 (68.7) |
|
7 (100.0) |
31 (59.6) |
|
| Sexa |
|
|
0.791 |
|
|
0.687 |
| Male |
14 (53.8) |
20 (60.6) |
|
5 (71.4) |
29 (44.2) |
|
| Female |
12 (46.2) |
13 (39.4) |
|
2 (28.6) |
23 (55.8) |
|
| T stagea,b |
|
|
0.393 |
|
|
>0.999 |
| T1-T2 |
4 (15.4) |
2 (6.3) |
|
0 (0.0) |
6 (11.5) |
|
| T3-T4 |
22 (84.6) |
30 (93.7) |
|
6 (100.0) |
46 (88.5) |
|
| N stagea,b |
|
|
0.535 |
|
|
>0.999 |
| N0 |
7 (26.9) |
6 (18.8) |
|
1 (16.7) |
12 (23.1) |
|
| N1-N3 |
19 (73.1) |
26 (81.3) |
|
5 (83.3) |
40 (76.9) |
|
| M stagea,b |
|
|
>0.999 |
|
|
>0.999 |
| M0 |
19 (73.1) |
24 (75.0) |
|
5 (83.3) |
38 (73.1) |
|
| M1 |
7 (26.9) |
8 (25.0) |
|
1 (16.7) |
14 (26.9) |
|
| Clinical stagea,b |
|
|
0.193 |
|
|
0.583 |
| I–II |
7 (26.9) |
4 (12.5) |
|
0 (0.0) |
11 (21.2) |
|
| III–IV |
19 (73.1) |
28 (87.5) |
|
6 (100.0) |
41 (78.8) |
|
| Locationa,b |
|
|
0.518 |
|
|
>0.999 |
| Proximal |
1 (4.0) |
4 (13.3) |
|
0 (0.0) |
5 (10.2) |
|
| Medial |
12 (48.0) |
14 (46.7) |
|
3 (50.0) |
23 (46.9) |
|
| Distal |
11 (44.0) |
12 (40.0) |
|
3 (50.0) |
20 (40.8) |
|
| Gastric stump/remnant |
1 (4.0) |
0 (0.0) |
|
0 (0.0) |
1 (2.0) |
|
mRNA expression levels of SFRP1, SFRP3, DVL2 and DVL3 in DGC and control tissue samples
To measure the mRNA expression levels of SFRP1, SFRP3, DVL2 and DVL3, RT-qPCR was performed using RNA isolated from the DGC and normal gastric mucosa tissue samples. SFRP1, SFRP3, DVL2 and DVL3 were found to be transcriptionally active in both DGC and control tissue samples. However, contrary to observations made from IHC staining, RT-qPCR analysis only revealed significantly higher (2.81-fold; P<0.05) expression levels of SFRP1 mRNA in the control tissues and significantly higher (1.99-fold; P<0.05) expression levels of DVL3 mRNA in the DGC tissue samples (Fig. 7). Although SFRP3 and DVL2 mRNA expression was slightly higher in the control and DGC tissue samples, respectively, no statistical significance was observed. In addition, no statistically significant difference between the DGC and control tissue samples was observed in terms of the mRNA expression levels of the ACTB gene used as the reference control (data not shown).
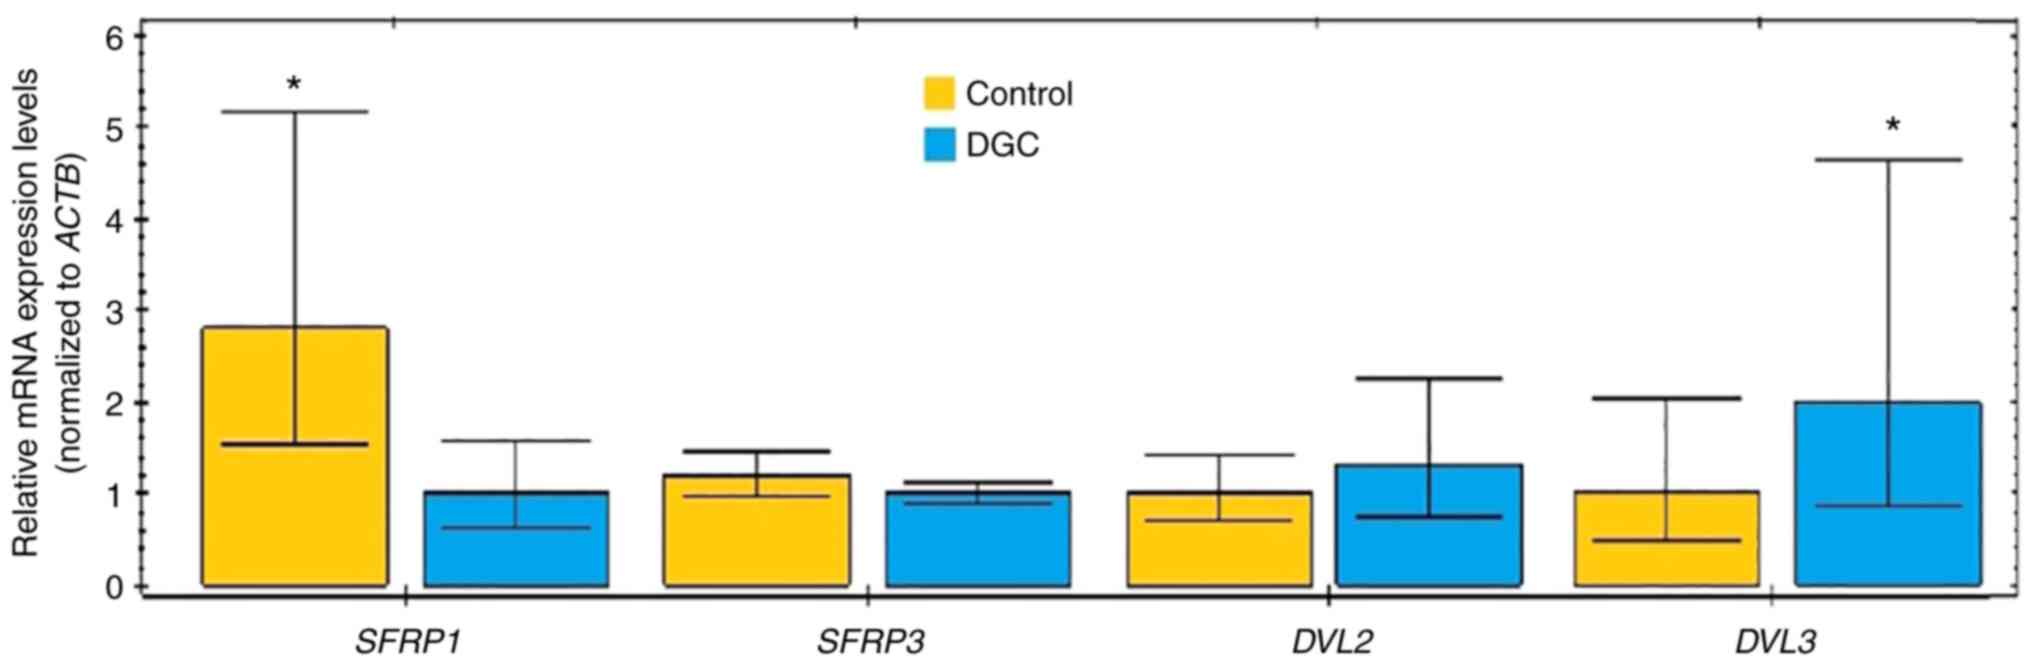 |
Figure 7.
Reverse transcription-quantitative PCR analysis of differential mRNA expression of SFRP1, SFRP3, DVL2 and DVL3 between DGC and control tissue samples (*P<0.05; Mann-Whitney U test). Fig. 7 was generated using GraphPad Prism 5.01 statistical software. ACTB, β-actin; DGC, diffuse gastric carcinoma; DVL2, dishevelled segment polarity protein 2; DVL3, dishevelled segment polarity protein 3; SFRP1, secreted frizzled-related protein 1; SFRP3, secreted frizzled-related protein 3.
|
Correlation analysis
Spearman's correlation analysis among all cases combined (DGC + control) revealed the following negative and statistically significant correlations: i) SFRP1 Nv and DVL2 (r=−0.310; P=0.001) or DVL3 (r=−0.470; P<0.001) protein expression; ii) SFRP1 Vv and DVL2 (r=−0.209; P=0.024) or DVL3 (r=−0.390; P<0.001) protein expression; iii) SFRP3 Nv and DVL2 (r=−0.339; P<0.001) or DVL3 (r=−0.480; P<0.001) protein expression; and iv) SFRP3 Vv and DVL2 (r=−0.252; P=0.006) or DVL3 (r=−0.431; P<0.001) protein expression (data not shown). Furthermore, a positive but not significant correlation was found between DVL2 and DVL3 expression (r=0.157; P=0.090).
In terms of the clinicopathological data, statistically significant correlations were found only between SFRP3 Vv and tumor tissue T stage (r=0.304; P=0.017), in addition to between SFRP3 Vv and clinical stage (r=0.336; P=0.008) in DGC tissues, but this was not confirmed for SFRP3 Nv values (T stage: r=0.227, P=0.078; clinical stage: r=0.174, P=0.179). Statistically significant correlations between the SFRP3 Vv values and T stage (r=0.357; P=0.005), in addition to between SFRP3 Vv and clinical stage (r=0.368; P=0.003), were also found in a separate analysis of the DGC group (data not shown). In the DGC subgroup, there was also a negative but not significant correlation between DVL2 and DVL3 protein expression (r=−0.220; P=0.094; data not shown).
In silico analysis of RNA-seq data from TCGA-STAD project
To verify the experimental findings from the IHC and RT-qPCR analyses, in silico analysis of SFRP1, SRP3, DVL2 and DVL3 gene expression (mRNA levels) in GC tissues based on publicly available RNA-seq data derived from TCGA-STAD project was performed. Using the web-based UCSC Xena browser analysis of target gene expression was first performed on the selected paired samples of tumor and adjacent normal tissues of DGC cases without a history of neoadjuvant therapy (Fig. 8A-E), in line with the patients with DGC recruited for the present study. Similar to the results of the present study, the expression levels of SFRP1 (P<0.001) were significantly lower in the primary tumor tissues compared with in solid adjacent normal tissues (Fig. 8F). By contrast, no statistically significant difference was observed for SFRP3 (P=0.171) and DVL3 (P=0.125), while, opposite to the results of the present study, DVL2 (P=0.005) was expressed at significantly lower levels in the primary tumor tissues compared with the solid adjacent normal tissues (Fig. 8F).
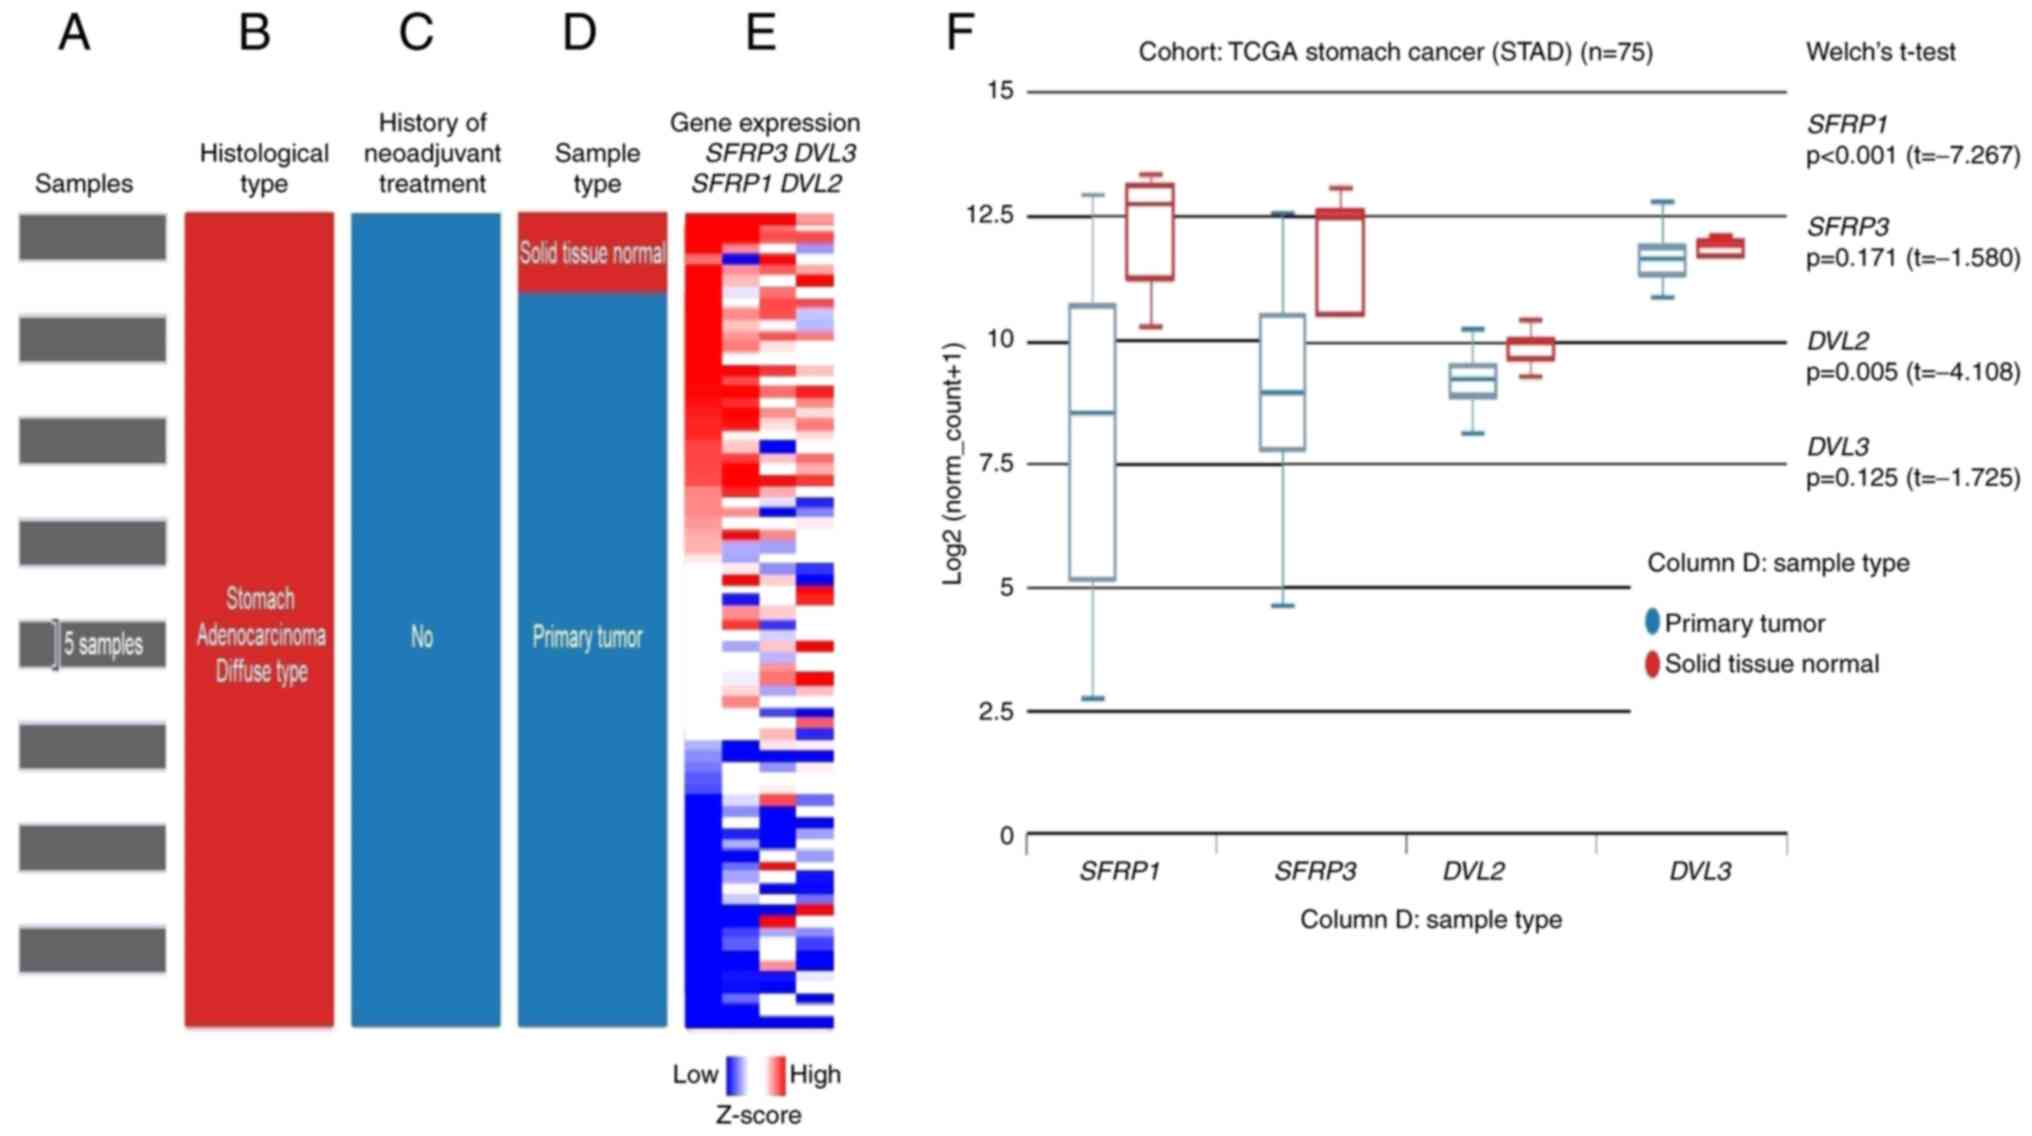 |
Figure 8.
In silico analysis of RNA-seq data from TCGA-STAD project revealing the differential expression of SFRP1, SFRP3, DVL2 and DVL3 between the normal adjacent tissue samples and primary DGC tissue samples. (Left) Selection of TCGA-STAD samples: (A) GC samples used for study, (B) histological type, (C) history of neoadjuvant therapy and (D) sample type. (E) Heatmap of RNA-seq expression z-scores computed for differentially expressed SFRP1, SFRP3, DVL2 and DVL3 genes in adjacent solid tissue normal samples and gastric cancer tumor tissues with DGC histological subtype present in the TCGA database obtained from the UCSC Xena web-based tool. The differentially expressed genes were screened using the following criteria: Adjacent normal solid tissue vs. primary diffuse gastric carcinoma. |log2(fold-change)|≥2, P<0.05. P-values were calculated by performing an unpaired t-test with Welch's correction (unequal variances t-test). The low to high scale underneath column E represents the gene expression Z-score. (F) Association between the SFRP1, SFRP3, DVL2 and DVL3 gene expression and tissue types (primary DGC tumor tissue and adjacent normal tissue). RNA-seq data (IlluminaHiSeq TCGA Hub) were normalized and presented as log2(norm count + 1), in which the norm_count refers to RNA-seq by Expectation Maximization values. Gene transcript expression was calculated as transcripts per million. UCSC Xena browser was used to generate this figure. DGC, diffuse gastric carcinoma; DVL2, dishevelled segment polarity protein 2; DVL3, dishevelled segment polarity protein 3; RNA-seq, RNA-sequencing; SFRP1, secreted frizzled-related protein 1; SFRP3, secreted frizzled-related protein 3; STAD, stomach cancer; TCGA, The Cancer Genome Atlas; UCSC, University of California Santa Cruz.
|
Since the normal solid tissues adjacent to the tumor tissues may, even if they appear histologically normal under the microscope, present transcriptionally and translationally unique intermediate states (morphologically normal but molecularly altered cells) between non-tumor-bearing healthy tissues and nearby tumor tissues (61), so-called ‘TCGA TARGET GTEx study analysis’ of the GC tissue was also performed (Fig. 9), which included expression data for both solid adjacent normal tissues and normal tissues obtained from individuals with no malignant disease (59,62,63). The data for the solid adjacent normal tissue were omitted from this analysis (Fig. 9C). In this case, the grouping of GC cases based on their histological subtypes was not possible and the obtained data, therefore, corresponded to overall GC cases and not specifically to the DGC subtype itself (Fig. 9A-F).
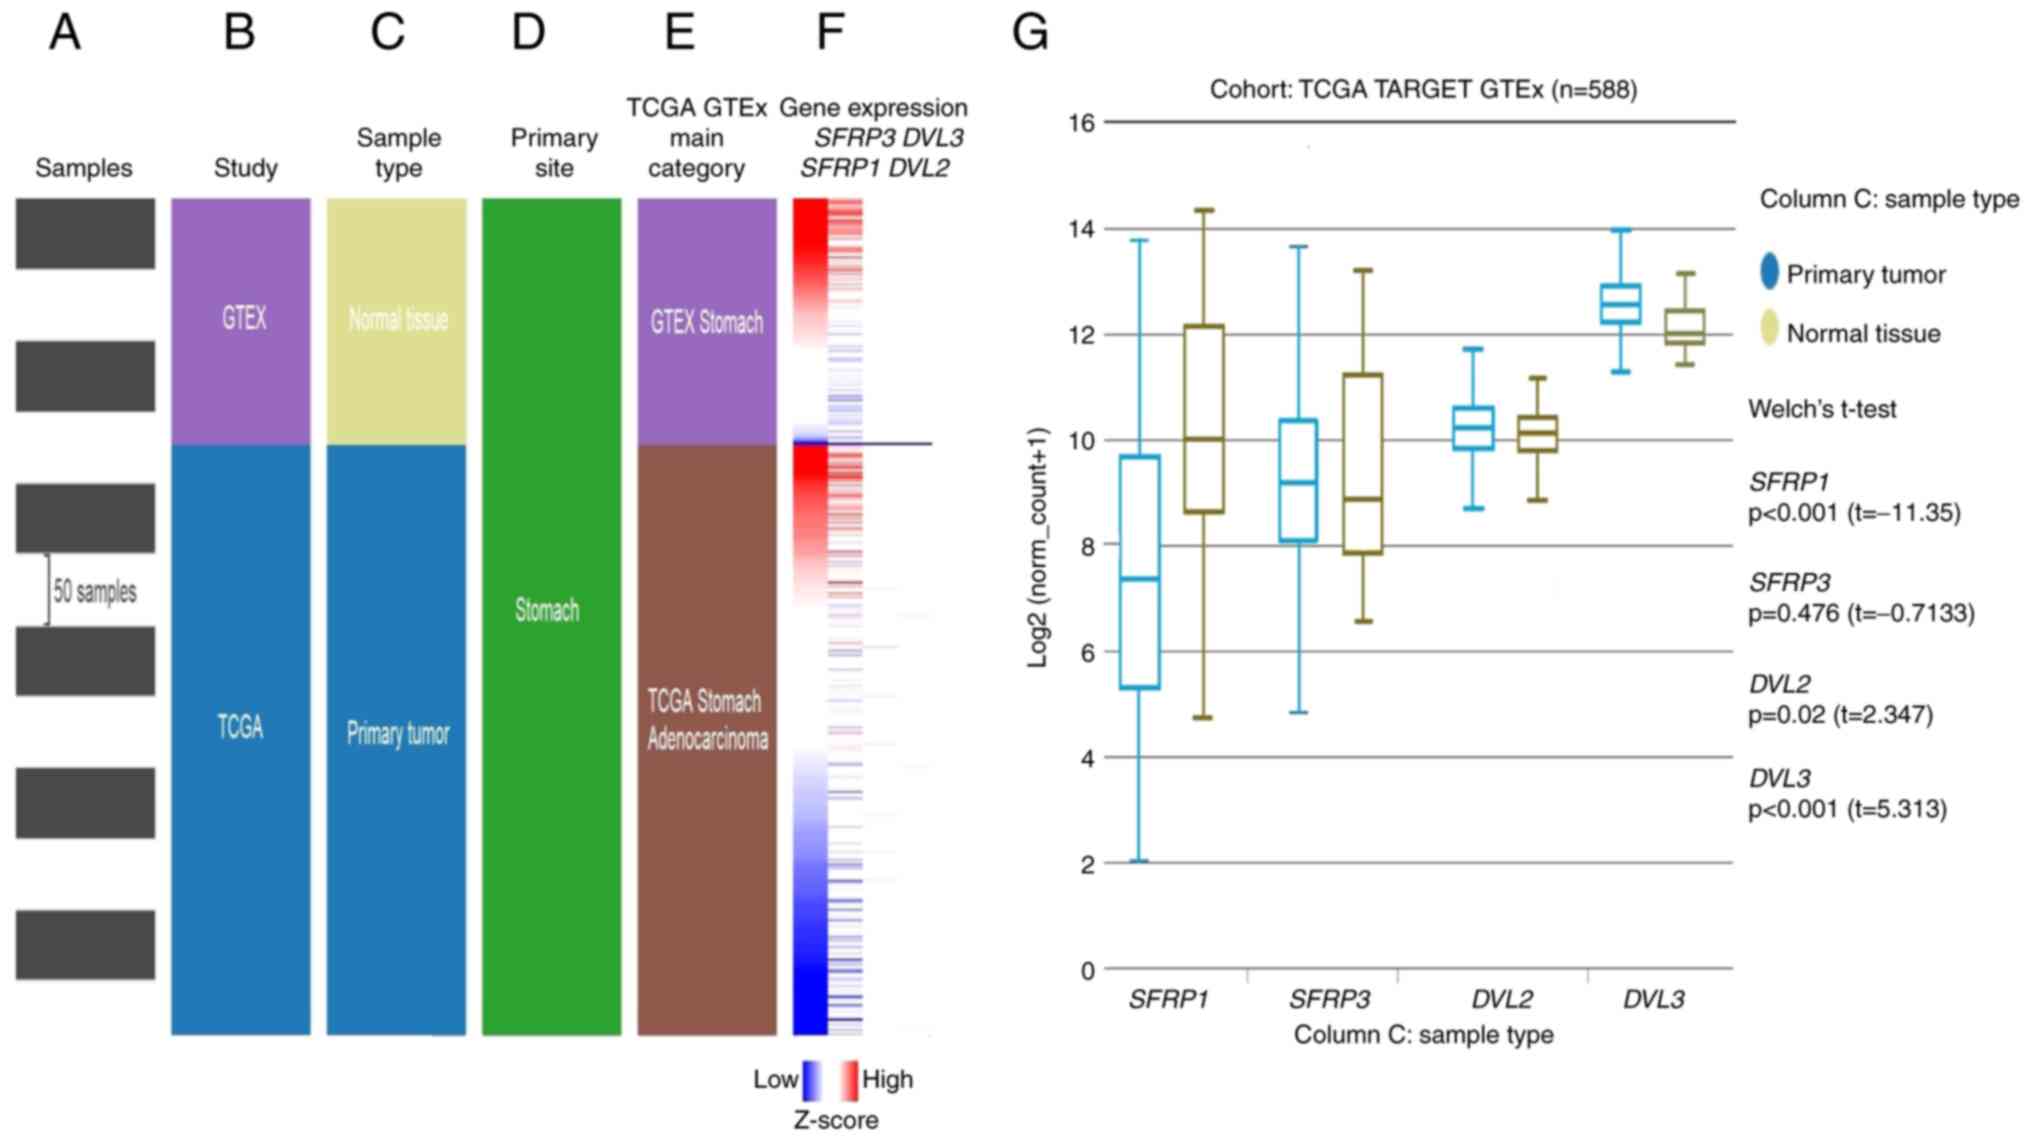 |
Figure 9.
In silico analysis of RNA-seq data from TCGA TARGET GTEx study. (Left) Selection of TCGA TARGET GTEx samples: (A) Samples used for the study, (B) study type, (C) sample type, (D) primary site and (E) the main category. (F) Heatmap of RNA-seq expression Z-scores computed for differentially expressed SFRP1, SFRP3, DVL2 and DVL3 genes in normal tissue samples and GC tumor tissues presented in TCGA TARGET GTEx study database and obtained by the UCSC Xena web-based tool. The differentially expressed genes were screened using the following criteria: Adjacent normal tissue samples vs. primary GC. [|log2(fold-change)|≥2, P<0.05]. P-values were calculated by performing an unpaired t-test with Welch's correction (unequal variances t-test). The red to blue scale represents the gene expression Z-score. (G) Correlation between the target gene expression (SFRP1, SFRP3, DVL2 and DVL3) and tissue types (primary diffuse gastric carcinoma tumor tissue and adjacent normal tissue). RNA-seq data (IlluminaHiSeq TCGA Hub) were normalized and presented as log2(norm count + 1), in which the norm_count refers to RNA-seq by Expectation Maximization values. Gene transcript expression was calculated as transcripts per million. UCSC Xena browser was used to generate this figure. DVL2, dishevelled segment polarity protein 2; DVL3, dishevelled segment polarity protein 3; GTEx, Genotype-Tissue Expression; RNA-seq, RNA-sequencing; SFRP1, secreted frizzled-related protein 1; SFRP3, secreted frizzled-related protein 3; STAD, stomach cancer; TCGA, The Cancer Genome Atlas; UCSC, University of California Santa Cruz.
|
In line with the RT-qPCR data of the present study and aforementioned in silico UCSC Xena browser analysis performed on the paired samples of tumor and adjacent normal tissues, the expression levels of SFRP1 (P<0.001) were significantly higher in normal gastric tissue samples compared with in tumor GC tissues, while no difference was observed for SFRP3 (P=0.476) expression (Fig. 9G). By contrast, the expression levels of DVL2 (P=0.02) and DVL3 (P<0.001) were significantly higher in the GC tissue samples than in normal gastric tissue samples (Fig. 9G).
Data from TCGA-STAD project were also used for the analysis of SFRP1, SFRP3, DVL2 and DVL3 gene expression between the DGC tumor tissue and adjacent solid normal tissue samples using the UALCAN web browser (Figs. 10 and 11).
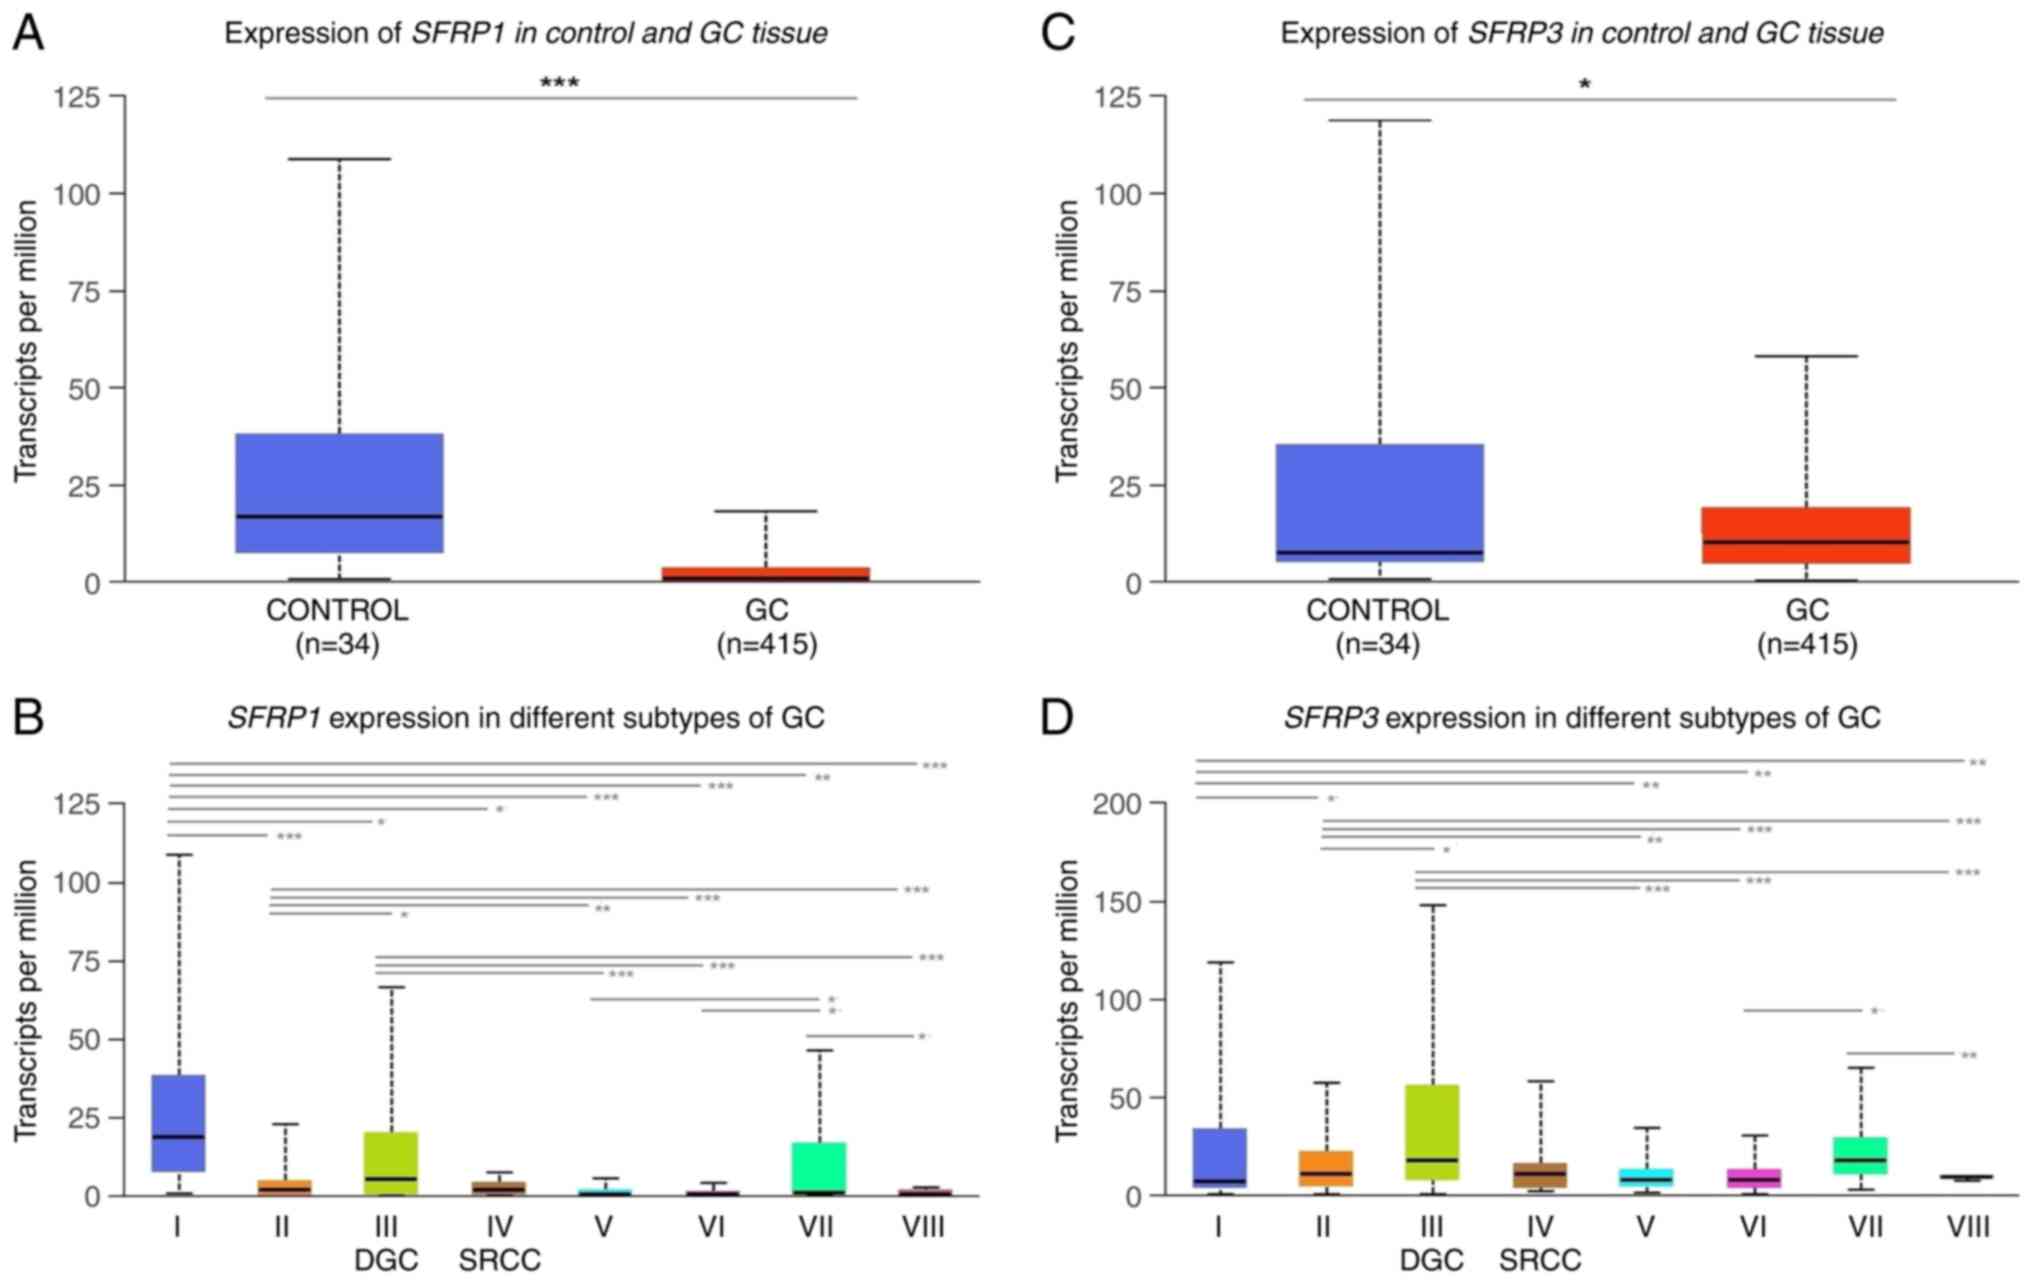 |
Figure 10.
In silico analysis of RNA-sequencing data from TCGA-STAD project using the UALCAN web resource revealing the differential expression of SFRP1 and SFRP3 in normal adjacent solid tissues and primary DGC tumor tissue samples. (A and C) Differential expression of SFRP1 and SFRP3 between the control and GC tissue samples. (B and D) Differential expression of SFRP1 and SFRP3 between the control and GC tissue samples and histological GC subtypes. I, adjacent normal tissue, n=34; II, gastric adenocarcinoma not otherwise specified, n=155; III, DGC, n=39; IV, SRCC GC samples, n=12; V, IGC not otherwise specified, n=73; VI, IGC tubular, n=76; VII, IGC mucinous, n=20; and VIII, IGC papillary, n=7. The differential analysis of SFRP1 and SFRP3 transcriptional levels (presented as transcripts per million) in adjacent normal solid tissues and different histological subgroups of GC from the UALCAN dataset was assessed by t-test. P<0.05 was considered to indicate a statistically significant difference. ***P<0.001, **P<0.01, *P<0.05. The figure was generated using the UALCAN web resource. DGC, diffuse gastric carcinoma; GC, gastric cancer; IGC, intestinal gastric carcinoma; SFRP1, secreted frizzled-related protein 1; SFRP3, secreted frizzled-related protein 3; SRCC, signet-ring cell carcinoma; STAD, stomach cancer; TCGA, The Cancer Genome Atlas.
|
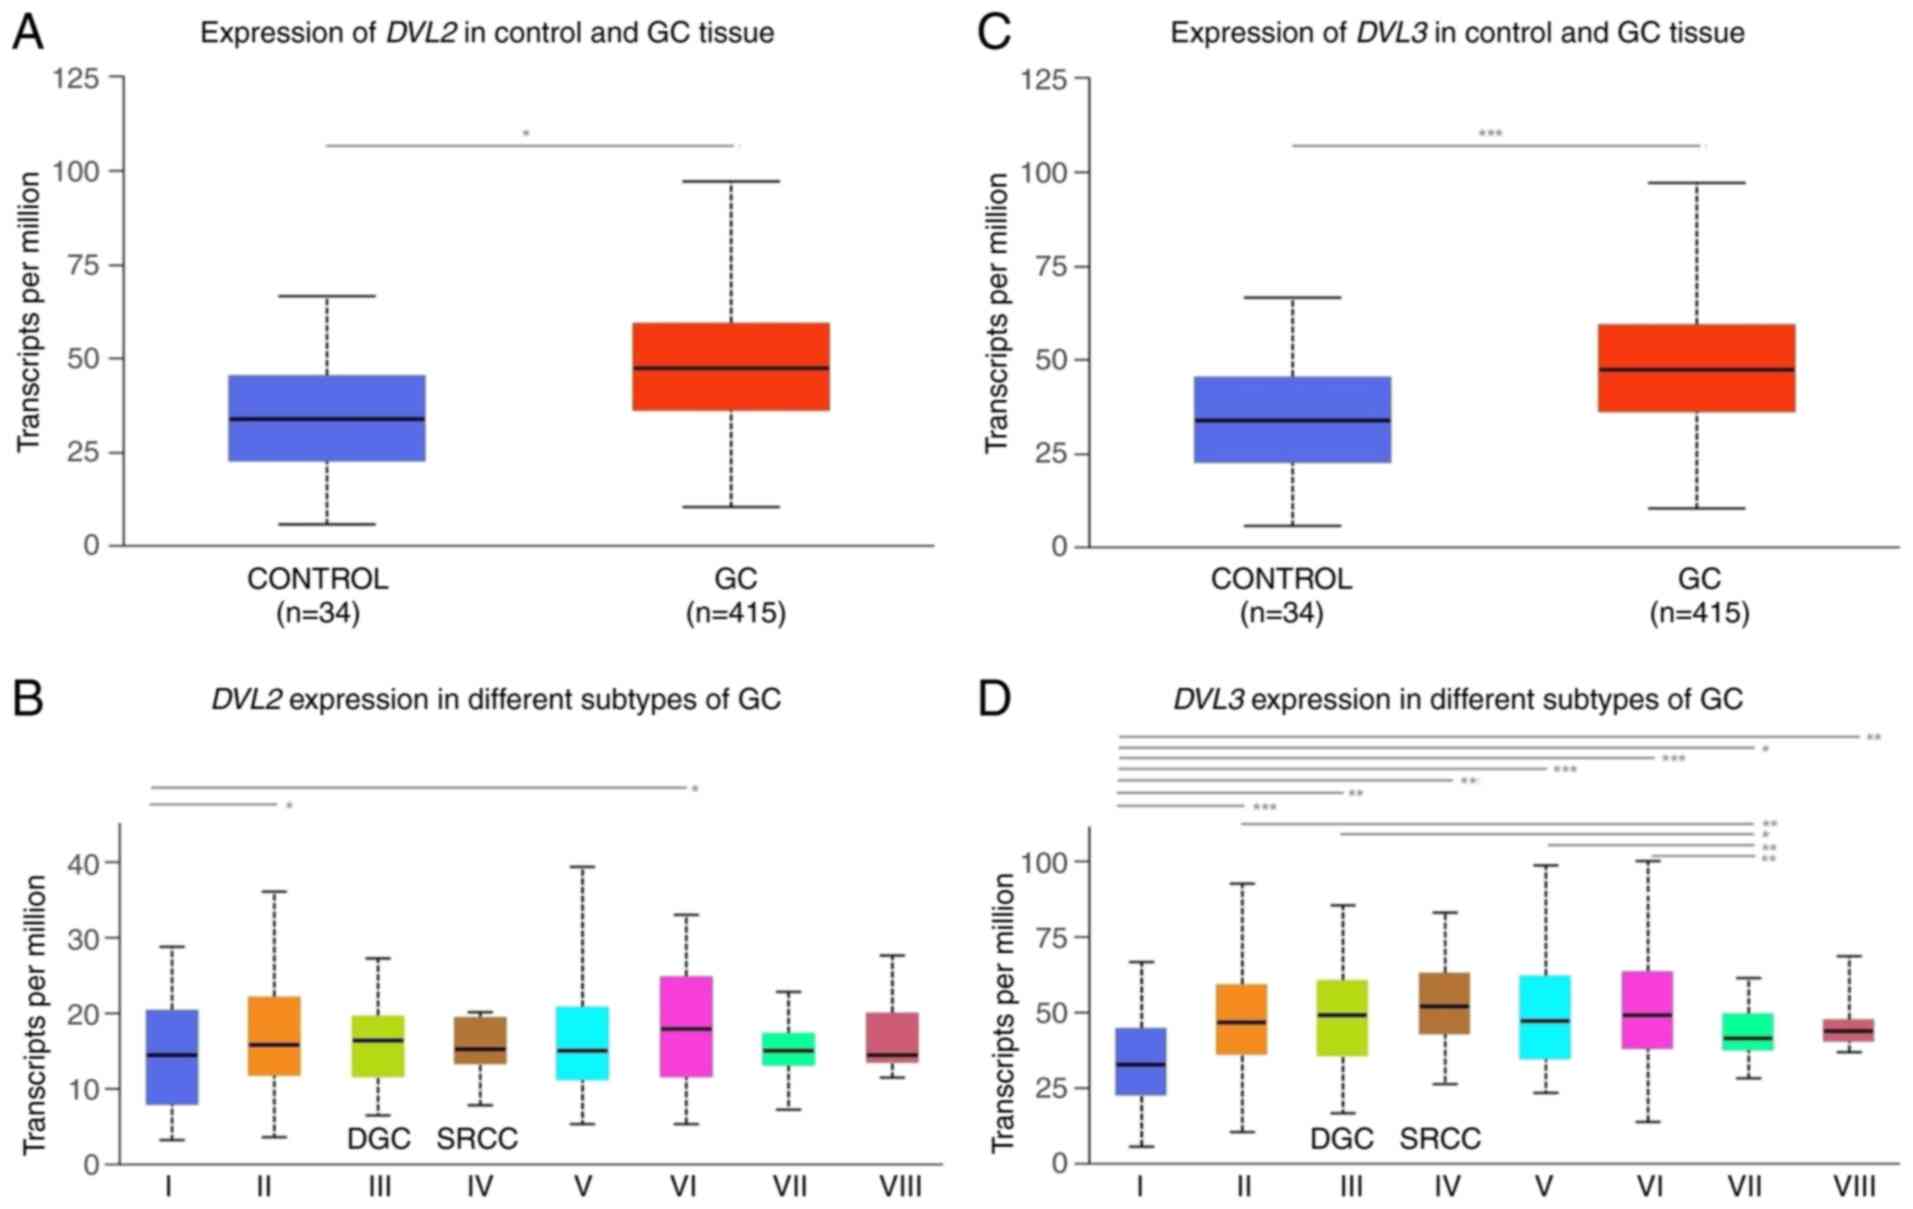 |
Figure 11.
In silico analysis of RNA-sequencing data from TCGA-STAD project using the UALCAN web resource revealing the differential expression of DVL2 and DVL3 in normal adjacent solid tissue and primary DGC tumor tissue samples. (A and C) Differential expression of DVL2 and DVL3 between the control (normal adjacent solid tissue samples) and GC tissues. (B and D) Differential expression of DVL2 and DVL3 between the control and GC tissue samples and histological GC subtypes. I, adjacent normal tissue, n=34; II, gastric adenocarcinoma not otherwise specified, n=155; III, DGC, n=39; IV, SRCC GC samples, n=12; V, IGC not otherwise specified, n=73; VI, IGC tubular, n=76; VII, IGC mucinous, n=20; and VIII, IGC papillary, n=7. The differential analysis of DVL2 and DVL3 transcriptional levels (presented as transcripts per million) in adjacent normal solid tissues and different histological subgroups of GC from the UALCAN dataset were assessed t-test. P<0.05 was considered to indicate a statistically significant difference. ***P<0.001, **P<0.01, *P<0.05. The figure was generated using the UALCAN web resource. DGC, diffuse gastric carcinoma; DVL2, dishevelled segment polarity protein 2; DVL3, dishevelled segment polarity protein 3; GC, gastric cancer; IGC, intestinal gastric carcinoma; SRCC, signet-ring cell carcinoma; STAD, stomach cancer; TCGA, The Cancer Genome Atlas.
|
The expression levels of SFRP1 were significantly lower in both primary GC tumors (P<0.001) and DGC tumor tissues (P<0.05) compared with in the adjacent solid normal tissue samples (Fig. 10A and B). Additionally, the expression levels of SFRP3 were significantly lower in overall cohort of primary GC tumors (P<0.05) compared with in the adjacent solid normal tissue samples (Fig. 10C). However, no significant difference in SFRP3 expression was detected between the tissues of DGC tumor subtype and the adjacent solid normal tissue samples (Fig. 10D).
Significantly higher expression levels of SFRP1 were also detected in SRCC of the stomach (P>0.05; group IV in Fig. 10B) compared with those in the adjacent solid normal tissue samples, while no significantly different expression of either SFRP1 or SFRP3 gene expression was detected between the DGC and SCRR histological subtypes (Fig. 10B and D).
Previously, this histologic subtype of gastric adenocarcinoma was, by Lauren's classification, considered as a part of the DGC type or designated as infiltrative, undifferentiated or high-grade GC subtype as defined by Nakamura, Ming and International Union Against Cancer classification systems, respectively (4,64–66). At present, in the WHO classification of gastrointestinal tumors, the SRCC type is defined as a poorly cohesive carcinoma (51).
The expression levels of DVL3 were significantly higher in both primary GC tumors (P<0.001) and DGC tumor tissues (P<0.001) compared with levels in the adjacent solid normal tissue samples (Fig. 11C and D). By contrast, DVL2 expression was significantly higher in primary GC samples (P<0.05) compared with in the adjacent solid normal tissue samples, while no significant difference in DVL2 expression was detected between the DGC tumor tissues and the adjacent solid normal tissue samples (Fig. 11A and B). Significantly higher expression levels of DVL3 were also detected in the SRCC histological subtype samples (P<0.01; group IV in Fig. 11D) compared with the adjacent solid normal tissue samples. No significantly different expression levels of either DVL2 or DVL3 gene expression were detected between the DGC and SCRR histological subtypes (Fig. 11B and D).
Discussion
The data presented in the current study revealed significantly lower protein expression levels of SFRP1 and SFRP3 and higher protein expression levels of DVL2 and DVL3 in DGC tissues compared with in the control tissues. In addition, significantly lower SFRP1 mRNA expression and higher DVL3 mRNA expression in DGC tissues were also demonstrated using RT-qPCR analysis. A significant association was also identified between the SFRP3 Vv and T stage, as well as between SFRP3 Vv and clinical stage of the disease, implicating a possible pathological role of dysregulated SFRP3 expression in more advanced stages of DGC.
Consistent with the results of the present study, downregulated (loss of activity) expression of SFRP family members has been previously documented in various malignant diseases, including GC (33–46). Dysregulation is primarily caused by promoter hypermethylation-dependent gene silencing, although histone modifications and mRNA ‘inhibition’ by regulatory miRNAs may also be involved (33–46). Zhao et al (67) previously reported that loss of the SFRP1 gene in primary GC tumor tissues and GC cancer cell lines is associated with hypermethylation in its promoter region. In addition, the promoter hypermethylation rate observed in the previous study was higher in GC tissues compared with in their corresponding adjacent non-tumor tissues (67). The consequent loss of SFRP1 expression was also associated with the pathological stage and lymph node involvement in the GC cases analyzed, suggesting an association between dysregulated SFRP1 expression and poor prognosis (67). Associations between SFRP1 downregulation in DGC tissue and higher DGC histological grade, worse patient prognosis or worse metastatic lymph node status have also been reported in other previous studies (36,68,69).
Nojima et al (33) previously documented that overexpression of SFRP1 could attenuate Wnt signaling transduction, inhibit cell proliferation and induce apoptosis in GC tumor cells. This supports the hypothesis that SFRP1 inactivation can contribute to Wnt-induced GC cell proliferation and invasion (33). However, concomitant alteration of the cellular transcriptional profile and activation of other oncogenic pathways via the dysregulation of SFRP1, including hedgehog and TGFβ/Smad3, is equally possible (46,70–73).
The tumor-suppressing potential and epigenetic regulation (promoter methylation and histone code changes) of SFRP gene expression in human GC tissues and GC cell lines are supported further by the in vitro findings of Shin et al (35). They were among the first to report the role of histone code alterations in the regulation of SFRP gene expression (35). In their in vitro experiments, treatment of human GC cell lines with sodium butyrate, a well-known histone deacetylase inhibitor, resulted in both promoter demethylation and histone modification, thus promoting the activation of SFRP1 gene expression (35). GC is characterized by increased methylation in the promoter regions of SFRP1, SFRP2 and SFRP5 genes (32–45). In addition, this form of increased methylation has also been frequently observed in cases of severe H. pylori infection, suggesting that infection can serve as an initial trigger for these observed epigenetic changes (36,39,74). Therefore, these previous findings strongly support the role of DNA methylation as a primary mechanism of epigenetic SFRP1 silencing, which promotes the tumorigenesis and progression of GC.
Accumulating evidence suggests that various non-coding regulatory miRNAs, including miR-27a, miR-196a-1, miR-208a and miR-206, also serve a prominent role in the activation of the Wnt/β-catenin signaling pathway by inactivating SFRP1, which induces GC cell proliferation, migration, invasion and metastasis (46,75–80). In addition, long non-coding RNAs (lncRNAs) are also emerging as key players in mediating this process (81). For example, in lncRNA maternally expressed gene 3 may function as a competing endogenous RNA by sponging miR-208a, which promotes GC progression by targeting SFRP1 (82). Therefore, it is likely that the lower levels of SFRP1 expression observed in the present study are a consequence of transcriptional inactivation by DNA methylation or other related epigenetic mechanisms, such as lncRNA/miRNA interference.
Some previous reports suggested that SFRP1 activation may also promote tumor growth (44,81,83,84). Qu et al (81) reported that increased expression levels of SFRP1 in DGC can lead to increases in cell proliferation and invasion, in addition to being positively associated with poor prognosis. Furthermore, SFRP1 upregulation observed in this previous study was associated with activation of the TGFβ signaling pathway (81). The possible oncogenic function of SFRP1 upregulation and activation of GSK3β/Rac family small GTPase 1/TGFβ signaling in human GC cell lines has also been reported by Peng et al (73). In addition, Kim et al (44) reported that SFRP1 expression in DGC tumor tissues is increased, particularly in the core diffuse-type (COD). It was found to be associated with mediating epithelial-to-mesenchymal transition (EMT)-associated functions, such as cell adhesion/migration or the TGFβ signaling pathway (44).
Therefore, these reported dual tumor-promoting and tumor-suppressing roles of SFRP1 in GC render its true function controversial at present, and further study is required. However, the SFRP1 expression and/or functional profile can vary depending on the stage of development, disease status or heterogeneity/cellular structure within the particular tumor tissue histology (8,9,44).
SFRP3 is an important antagonist of the Wnt signaling pathway (84,85). It reduces the activity of tissue metalloproteinases, inhibits the activity of β-catenin and inhibits EMT transition (44,84). Qu et al (86) previously detected SFRP3 expression in adenocarcinoma tissues of the intestinal type and pre-cancerous lesions (intestinal metaplasia and dysplasia), while detecting weak or no SFRP3 expression in the adjacent normal gastric mucosa (86). SFRP3 expression in this previous study cohort was found to be stronger in IGC compared with in DGC and mix-type GC tissue samples (86). In addition, its expression was also positively associated with higher IGC differentiation grades (86). However, no significant association between SFRP3 expression and other clinicopathological features, including age, sex, tumor size, TNM stage and metastasis, was detected in this previous study (86). Furthermore, protein expression and transcriptional activity of SFRP3 were significantly higher in GC cell lines compared with in immortal gastric epithelial cell lines (87). Overexpression of SFRP3 also led to the inhibition of cell proliferation both in vitro and in vivo (86). In addition, SFRP3 overexpression could inhibit tumorigenesis and induce apoptosis in the SGC7901 GC cell line, which is otherwise, in its normal condition, characterized by lower SFRP3 expression (87). Based on these findings, Qu et al (86) suggested that SFRP3 may serve a dual role in the normal gastric mucosa and malignant GC tumor tissues, where its expression likely represents an early event during the tumorigenesis of IGCs and a differentiation marker for GC carcinogenesis (86). A recent study by Qin et al (88) also revealed higher SFRP3 expression in GC compared with normal gastric tissue samples, which was negatively associated with the expression levels and subcellular localization of β-catenin, suggesting a tumor suppressor role of SFRP3. In their study cohort, membrane-localized β-catenin tended to exist in the high SFRP3 expression GC group, while nuclear localization of β-catenin was detected in the low SFRP3 expression group (88). In addition, a tumor suppressor role of SFRP3 has also been suggested by Byun et al (87). However, this previous study reported positive SFRP3 expression in normal gastrointestinal tissues but not in GC tissue specimens of different histological types (87).
DVL proteins serve an important role as mediators of signaling transduction in both canonical and non-canonical Wnt signaling pathways (47,48). Increased DVL expression has been reported in various malignant tissues, such as brain and lung tumors, breast cancer, colon adenocarcinoma, hepatoblastoma, and lymphoma (89–93). However, data remain limited in terms of their expression profile in GC tissues of varying histological types. Furthermore, the majority of data available are associated with the role of DVL-mediated protein-protein interactions in distinct GC cell lines, some of which accompany aberrant DVL2 expression (49,94–99).
Similar to the results of the present study, Demirci et al (100) reported increased DVL2 expression in GC and intestinal metaplasia tissues compared with in normal gastric mucosa tissues with no detectable endoscopic or histopathological lesions (100). Furthermore, in this previous study cohort, DVL2 expression was higher in patients with metastatic disease compared with in their non-metastatic counterparts (100). DVL2 upregulation was also detected in DGC compared with the non-diffuse subtype (100).
Similar to SFRP proteins, DVL2 and DVL3 have also been found to be aberrantly expressed in GC with H. pylori infection (50), where they may mediate H. pylori-induced phosphorylation of low-density lipoprotein receptor-related protein 6 and nuclear β-catenin accumulation (50).
Epigenetic regulation of the DVL2 gene by DNA methylation has also been previously reported in GC (101). According to Chong et al (101), the aberrant methylation of DVL2 is associated with the DGC variant or mixed GC tumor-type but not with the IGC type (101). Specifically, the DVL2 gene has been demonstrated to be hypomethylated in both tumor tissues and adjacent normal tissues of the IGC variants but to be hypermethylated in the mixed-GC type and DGC phenotypes (101). This is contradictory to the data in the present study, which revealed higher expression levels of DVL2 in the DGC tissue samples, possibly due to the different molecular backgrounds of the tumor tissue samples in the DGC cohorts analyzed.
It is important to note that DGC tumor tissues may exhibit great case-by-case and intratumor heterogeneity with distinct genetic and epigenetic backgrounds, a characteristic that is reflected in their classification in terms of specific prognostic and histological subtypes (8,9,44). Therefore, the determination of their molecular signature is of utmost clinical importance for the prediction of the overall response to therapy and disease outcome. However, previous attempts to associate the molecular subtypes obtained with the main GC subtypes provided ambiguous results (8,102–104). Oh et al (105) previously reported that the DGC subtype is more likely to exhibit a mesenchymal phenotype (MP) and a higher stromal or non-tumor content compared with GC, exhibiting a more epithelial phenotype (EP) (105). However, a subsequent genome-wide survey of the gene expression data revealed that the MP molecular subtype is biologically and clinically distinct from Lauren's histological classification of DGC, with only a small number of genes common to both MP and Lauren's tumor subgroups (105).
In TCGA cohort of GC tissue samples, Oh et al (105) found lower expression levels of SFRP1 and SFRP3, as well as lower SFRP2 and SFRP4 expression levels, in EP compared with the MP molecular subtype. Due to the inverse relationship between DNA methylation and mRNA expression observed, this decreased transcriptional activity of all SFRP isoforms found in the EP tumor subtype is likely to be mediated by promoter hypermethylation (105). Similarly, a previous investigation of DGC RNA-seq data also revealed the transcriptional downregulation of SFRP1 and SFRP5 in DGC (106). However, RNA-seq-based transcriptome analysis of distinct DGC tissue subtypes (normal-like, intestinal-type-like and COD subgroups) performed by Kim et al (44) revealed higher transcriptional activity of SFRP1 and SFRP2 in the COD-type subgroup compared with that in the intestinal-type-like cluster of DGC tissues.
Further in silico analysis of TCGA-STAD RNA-seq data performed in the present study using the UCSC Xena browser revealed higher gene expression levels of SFRP1 and DVL2 in adjacent normal solid tissues compared with those in primary DGC, while no statistically significant changes were observed for SFRP3 and DVL3 expression. Similar to the previously published data by Liu et al (45), significant downregulation of the expression levels of SFRP1 in the adjacent normal solid tissues compared with that in primary DGC was also demonstrated in the present study using the UALCAN web-based analysis tool. In this analysis, the expression levels of SFRP1 were also higher in the adjacent normal tissue samples compared with in overall GC samples. However, no significant changes were observed in SFRP3 gene expression between adjacent normal solid tissues and primary DGC tissues. By contrast, UALCAN analysis performed in present study revealed higher DVL3 expression in DGC tumor tissues compared with in adjacent normal tissue samples, while no significant difference in DVL2 gene expression between the adjacent normal tissue samples and DGC tissues was detected. However, significantly higher expression levels of DVL2 were revealed in overall primary GC cases compared with in adjacent solid normal tissue samples. In line with the RT-qPCR data of the present study, the present in silico TCGA TARGET GTEx data analysis revealed higher expression levels of SFRP1 in normal gastric tissue samples compared with in tumor GC tissues, while no difference in SFRP3 expression was observed. By contrast, the UALCAN web-based analysis of TCGA-STAD RNA sequencing data performed in the present study revealed higher gene expression levels of DVL2 and DVL3 were detected in the GC tissue samples compared with the normal gastric tissues.
The observed discrepancy in SFRP1, SFRP3, DVL2 and DVL3 gene expression values between RT-qPCR results of the present study, and in silico analysis of RNA-seq data from TCGA-STAD project performed using the UCSC Xena browser and UALCAN web-based data analysis tool could be explained by the differences in specific DGC cohorts (tumor grade, nodal metastasis status and clinical stage of this malignant disease) used for the analysis. As aforementioned, DGC tumor tissues may exhibit great case-by-case and intratumor heterogeneity, which is reflected in specific oncogenic molecular profiles underlying their distinct histologic subtypes (8,9,44,107–109).
There are several limitations of the present study. The sample size of the present study was moderate. In addition, the majority of DGC cases in the present patient cohort were diagnosed during the advanced clinical stages of the disease (stage III or IV). The effect of either SFRP1 and SFRP3 or DVL2 and DVL3 expression on DGC was also not analyzed. Further studies are required to pinpoint their downstream targets and/or clinically relevant cellular processes they may regulate.
In conclusion, the results of the present study demonstrated that important components of the Wnt signaling pathway are aberrantly expressed in the DGC subtype, suggesting an important role of these components in the development of DGC. The present data also revealed a positive relationship between the SFRP3 protein expression levels and the clinical or T stage of the DGC cases. Further large-scale studies and molecular analysis aimed at confirming the obtained results and deciphering the exact functional role of SFRP3 and other Wnt signaling components in the development of this malignant disease are warranted.
Acknowledgements
Not applicable.
Funding
This research was co-financed by the European Union through the Europe Regional Development Fund, Operational Programme Competitiveness, and Cohesion, under grant agreement no. KK.01.1.1.01.0008, Reproductive, and Regenerative Medicine-Exploring New Platforms and Potentials.
Availability of data and materials
The demographic and clinical characteristics of patients with diffuse gastric carcinoma and immunohistochemistry and reverse transcription-quantitative PCR datasets used and/or analyzed during the current study are available from the corresponding author on reasonable request. The datasets generated and/or analyzed during the current study are available in the UCSC Xena (https://xenabrowser.net) and UALCAN (http://ualcan.path.uab.edu/analysis.html) databases.
Authors' contributions
MS, ZK, APD, IB and KGR made substantial contributions to conception, design, and acquisition of data. FP, MS, TNM, IB and LS made contribution to analysis and interpretation of data. FP, MS, TNM, ZK and LS have been involved in drafting the manuscript and revising it critically for important intellectual content. TNM, FP, ZK and LS confirm the authenticity of all the raw data. All authors have read and approved the final version of the manuscript and agreed to be accountable for all aspects of the work in ensuring that questions related to the accuracy or integrity of any part of the work are appropriately investigated and resolved.
Ethics approval and consent to participate
The present study was conducted according to the guidelines of the Declaration of Helsinki. The use of retrospectively collected archival diffuse gastric carcinoma formalin-fixed and paraffin-embedded (FFPE) tissue samples and control FFPE tissue samples obtained from patients without gastric cancer and H. pylori infection was approved by the Clinical Research Ethics Committee of the University Hospital Centre Zagreb, Zagreb, Croatia (approval no. 02/21/JG, class no. 8.1.-14/93/2; November 01, 2014) and the Research Ethics Committee of the School of Medicine, University of Zagreb, Zagreb, Croatia (approval no. 380-59-10106-21-111/186, class no. 641/01/21-02/01). The inclusion of several tissue sections, obtained from one placental and one clear cell renal cell carcinoma FFPE tissue block, used as positive controls for immunohistochemical staining was approved by the Clinical Research Ethics Committee of the Clinical Hospital ‘Sveti Duh’, Zagreb, Croatia (approval no. 01-4685; November 20, 2017.), Clinical Hospital ‘Merkur’ (approval no. 03/1-11088; December 7, 2017) and the Research Ethics Committee of the School of Medicine University of Zagreb (approval no. 380-59-10106-19-111/181, class 641-01/19-02/01 and approval no. 380-59-10106-21-111/18, class no. 641-01/21-02/01). Renal cell carcinomas and placental tissue FFPE sections were obtained from the Department of Pathology, School of Medicine University of Zagreb (Zagreb, Croatia) and from the Department of Pathology, Clinical Hospital ‘Merkur’, Zagreb, Croatia, respectively. Written informed consent was obtained from all participants involved in the present study.
Patient consent for publication
Not applicable.
Competing interests
The authors declare that they have no competing interests.
Glossary
Abbreviations
Abbreviations:
|
APC
|
adenomatous polyposis coli
|
|
At
|
test area
|
|
CDH1
|
cadherin 1
|
|
COD
|
core diffuse-type of diffuse gastric carcinoma
|
|
CTNNB1
|
β-catenin
|
|
DGC
|
diffuse gastric carcinoma
|
|
DVL2
|
dishevelled segment polarity protein 2
|
|
DVL3
|
dishevelled segment polarity protein 3
|
|
EMT
|
epithelial-to-mesenchymal transition
|
|
EP
|
epithelial phenotype
|
|
FFPE
|
formalin-fixed and paraffin-embedded
|
|
IGC
|
intestinal gastric carcinoma
|
|
IHC
|
immunohistochemistry
|
|
IQR
|
interquartile range
|
|
lncRNA
|
long non-coding RNA
|
|
miRNA/miR
|
microRNA
|
|
MP
|
mesenchymal phenotype
|
|
nt
|
nucleotide
|
|
Nv
|
numerical density
|
|
Pc
|
P-value after Bonferroni's correction was applied
|
|
qPCR
|
quantitative PCR
|
|
RHOA
|
ras homolog family member A
|
|
SFRP1
|
secreted frizzled-related protein 1
|
|
SFRP3
|
secreted frizzled-related protein 3
|
|
Vv
|
volume density
|
|
WHO
|
World Health Organization
|
References
|
1
|
Venerito M, Link A, Rokkas T and Malfertheiner P: Review: Gastric cancer-clinical aspects. Helicobacter. 24 (Suppl 1):e126432019. View Article : Google Scholar : PubMed/NCBI
|
|
2
|
Machlowska J, Baj J, Sitarz M, Maciejewski R and Sitarz R: Gastric cancer: Epidemiology, risk factors, classification, genomic characteristics and treatment strategies. Int J Mol Sci. 21:40122020. View Article : Google Scholar : PubMed/NCBI
|
|
3
|
Rawla P and Barsouk A: Epidemiology of gastric cancer: Global trends, risk factors and prevention. Prz Gastroenterol. 14:26–38. 2019.PubMed/NCBI
|
|
4
|
Lauren P: The two histological main types of gastric carcinoma: Diffuse and so-called intestinal-type carcinoma. An attempt at a histoclinical classification. Acta Pathol Microbiol Scand. 64:31–49. 1965. View Article : Google Scholar : PubMed/NCBI
|
|
5
|
Waldum HL and Fossmark R: Types of gastric carcinomas. Int J Mol Sci. 19:41092018. View Article : Google Scholar : PubMed/NCBI
|
|
6
|
Yakirevich E and Resnick MB: Pathology of gastric cancer and its precursor lesions. Gastroenterol Clin North Am. 42:261–284. 2013. View Article : Google Scholar : PubMed/NCBI
|
|
7
|
Yuasa Y: Control of gut differentiation and intestinal-type gastric carcinogenesis. Nat Rev Cancer. 3:592–600. 2003. View Article : Google Scholar : PubMed/NCBI
|
|
8
|
Garcia-Pelaez J, Barbosa-Matos R, Gullo I, Carneiro F and Oliveira C: Histological and mutational profile of diffuse gastric cancer: Current knowledge and future challenges. Mol Oncol. Mar 16–2021.(Online ahead of print). View Article : Google Scholar
|
|
9
|
Ansari S, Gantuya B, Tuan VP and Yamaoka Y: Diffuse gastric cancer: A summary of analogous contributing factors for its molecular pathogenicity. Int J Mol Sci. 19:24242018. View Article : Google Scholar : PubMed/NCBI
|
|
10
|
Tsai JH, Jeng YM, Chen KH, Lee CH, Yuan CT and Liau JY: An integrative morphomolecular classification system of gastric carcinoma with distinct clinical outcomes. Am J Surg Pathol. 44:1017–1030. 2020. View Article : Google Scholar : PubMed/NCBI
|
|
11
|
Lim B, Kim JH, Kim M and Kim SY: Genomic and epigenomic heterogeneity in molecular subtypes of gastric cancer. World J Gastroenterol. 22:1190–1201. 2016. View Article : Google Scholar : PubMed/NCBI
|
|
12
|
Tan IB, Ivanova T, Lim KH, Ong CW, Deng N, Lee J, Tan SH, Wu J, Lee MH, Ooi CH, et al: Intrinsic subtypes of gastric cancer, based on gene expression pattern, predict survival and respond differently to chemotherapy. Gastroenterology. 141:476–485.e1-11. 2011. View Article : Google Scholar : PubMed/NCBI
|
|
13
|
Petrovchich I and Ford JM: Genetic predisposition to gastric cancer. Semin Oncol. 43:554–559. 2016. View Article : Google Scholar : PubMed/NCBI
|
|
14
|
Shenoy S: CDH1 (E-cadherin) mutation and gastric cancer: Genetics, molecular mechanisms and guidelines for management. Cancer Manag Res. 11:10477–10486. 2019. View Article : Google Scholar : PubMed/NCBI
|
|
15
|
Machado JC, Oliveira C, Carvalho R, Soares P, Berx G, Caldas C, Seruca R, Carneiro F and Sobrinho-Simöes M: E-cadherin gene (CDH1) promoter methylation as the second hit in sporadic diffuse gastric carcinoma. Oncogene. 20:1525–1528. 2001. View Article : Google Scholar : PubMed/NCBI
|
|
16
|
Tedaldi G, Molinari C, São José C, Barbosa-Matos R, André A, Danesi R, Arcangeli V, Ravegnani M, Saragoni L, Morgagni P, et al: Genetic and epigenetic alterations of CDH1 regulatory regions in hereditary and sporadic gastric cancer. Pharmaceuticals (Basel). 14:4572021. View Article : Google Scholar : PubMed/NCBI
|
|
17
|
Gamble LA, Heller T and Davis JL: Hereditary diffuse gastric cancer syndrome and the role of CDH1: A review. JAMA Surg. 156:387–392. 2021. View Article : Google Scholar : PubMed/NCBI
|
|
18
|
Cho SY, Park JW, Liu Y, Park YS, Kim JH, Yang H, Um H, Ko WR, Lee BI, Kwon SY, et al: Sporadic early-onset diffuse gastric cancers have high frequency of somatic CDH1 alterations, but low frequency of somatic RHOA mutations compared with late-onset cancers. Gastroenterology. 153:536–549.e26. 2017. View Article : Google Scholar : PubMed/NCBI
|
|
19
|
Kakiuchi M, Nishizawa T, Ueda H, Gotoh K, Tanaka A, Hayashi A, Yamamoto S, Tatsuno K, Katoh H, Watanabe Y, et al: Recurrent gain-of-function mutations of RHOA in diffuse-type gastric carcinoma. Nat Genet. 46:583–587. 2014. View Article : Google Scholar : PubMed/NCBI
|
|
20
|
Zhou J, Hayakawa Y, Wang TC and Bass AJ: RhoA mutations identified in diffuse gastric cancer. Cancer Cell. 26:9–11. 2014. View Article : Google Scholar : PubMed/NCBI
|
|
21
|
Nam S, Kim JH and Lee DH: RHOA in gastric cancer: Functional roles and therapeutic potential. Front Genet. 10:4382019. View Article : Google Scholar : PubMed/NCBI
|
|
22
|
MacDonald BT, Tamai K and He X: Wnt/beta-catenin signaling: Components, mechanisms, and diseases. Dev Cell. 17:9–26. 2009. View Article : Google Scholar : PubMed/NCBI
|
|
23
|
Tian X, Liu Z, Niu B, Zhang J, Tan TK, Lee SR, Zhao Y, Harris DC and Zheng G: E-cadherin/β-catenin complex and the epithelial barrier. J Biomed Biotechnol. 2011:5673052011. View Article : Google Scholar : PubMed/NCBI
|
|
24
|
Liu X and Chu KM: E-cadherin and gastric cancer: Cause, consequence, and applications. Biomed Res Int. 2014:6373082014. View Article : Google Scholar : PubMed/NCBI
|
|
25
|
Korourian A, Roudi R, Shariftabrizi A, Kalantari E, Sotoodeh K and Madjd Z: Differential role of Wnt signaling and base excision repair pathways in gastric adenocarcinoma aggressiveness. Clin Exp Med. 17:505–517. 2017. View Article : Google Scholar : PubMed/NCBI
|
|
26
|
Reya T and Clevers H: Wnt signalling in stem cells and cancer. Nature. 434:843–850. 2005. View Article : Google Scholar : PubMed/NCBI
|
|
27
|
Zhang Y and Wang X: Targeting the Wnt/β-catenin signaling pathway in cancer. J Hematol Oncol. 13:1652020. View Article : Google Scholar : PubMed/NCBI
|
|
28
|
Krausova M and Korinek V: Wnt signaling in adult intestinal stem cells and cancer. Cell Signal. 26:570–579. 2014. View Article : Google Scholar : PubMed/NCBI
|
|
29
|
Koushyar S, Powell AG, Vincan E and Phesse TJ: Targeting Wnt signaling for the treatment of gastric cancer. Int J Mol Sci. 21:39272020. View Article : Google Scholar : PubMed/NCBI
|
|
30
|
Ooi CH, Ivanova T, Wu J, Lee M, Tan IB, Tao J, Ward L, Koo JH, Gopalakrishnan V, Zhu Y, et al: Oncogenic pathway combinations predict clinical prognosis in gastric cancer. PLoS Genet. 5:e10006762009. View Article : Google Scholar : PubMed/NCBI
|
|
31
|
Yoda Y, Takeshima H, Niwa T, Kim JG, Ando T, Kushima R, Sugiyama T, Katai H, Noshiro H and Ushijima T: Integrated analysis of cancer-related pathways affected by genetic and epigenetic alterations in gastric cancer. Gastric Cancer. 18:65–76. 2015. View Article : Google Scholar : PubMed/NCBI
|
|
32
|
Chiurillo MA: Role of the Wnt/β-catenin pathway in gastric cancer: An in-depth literature review. World J Exp Med. 5:84–102. 2015. View Article : Google Scholar : PubMed/NCBI
|
|
33
|
Nojima M, Suzuki H, Toyota M, Watanabe Y, Maruyama R, Sasaki S, Sasaki Y, Mita H, Nishikawa N, Yamaguchi K, et al: Frequent epigenetic inactivation of SFRP genes and constitutive activation of Wnt signaling in gastric cancer. Oncogene. 26:4699–4713. 2007. View Article : Google Scholar : PubMed/NCBI
|
|
34
|
Cheng YY, Yu J, Wong YP, Man EP, To KF, Jin VX, Li J, Tao Q, Sung JJ, Chan FK and Leung WK: Frequent epigenetic inactivation of secreted frizzled-related protein 2 (SFRP2) by promoter methylation in human gastric cancer. Br J Cancer. 97:895–901. 2007. View Article : Google Scholar : PubMed/NCBI
|
|
35
|
Shin H, Kim JH, Lee YS and Lee YC: Change in gene expression profiles of secreted frizzled-related proteins (SFRPs) by sodium butyrate in gastric cancers: Induction of promoter demethylation and histone modification causing inhibition of Wnt signaling. Int J Oncol. 40:1533–1542. 2012.PubMed/NCBI
|
|
36
|
Liu JB, Wu XM, Cai J, Zhang JY, Zhang JL, Zhou SH, Shi MX and Qiang FL: CpG island methylator phenotype and Helicobacter pylori infection associated with gastric cancer. World J Gastroenterol. 18:5129–5134. 2012. View Article : Google Scholar : PubMed/NCBI
|
|
37
|
To KF, Chan MW, Leung WK, Yu J, Tong JH, Lee TL, Chan FK and Sung JJ: Alterations of frizzled (FzE3) and secreted frizzled related protein (hsFRP) expression in gastric cancer. Life Sci. 70:483–489. 2001. View Article : Google Scholar : PubMed/NCBI
|
|
38
|
Guo Y, Guo W, Chen Z, Kuang G, Yang Z and Dong Z: Hypermethylation and aberrant expression of Wnt-antagonist family genes in gastric cardia adenocarcinoma. Neoplasma. 58:110–117. 2011. View Article : Google Scholar : PubMed/NCBI
|
|
39
|
Wang Z, Ye Y, Liu D, Yang X and Wang F: Hypermethylation of multiple Wnt antagonist genes in gastric neoplasia: Is H pylori infection blasting fuse? Medicine (Baltimore). 97:e137342018. View Article : Google Scholar : PubMed/NCBI
|
|
40
|
Nagasaka T, Tanaka N, Cullings HM, Sun DS, Sasamoto H, Uchida T, Koi M, Nishida N, Naomoto Y, Boland CR, et al: Analysis of fecal DNA methylation to detect gastrointestinal neoplasia. J Natl Cancer Ins. 101:1244–1258. 2009. View Article : Google Scholar : PubMed/NCBI
|
|
41
|
Zhao C, Bu X, Zhang N and Wang W: Downregulation of SFRP5 expression and its inverse correlation with those of MMP-7 and MT1-MMP in gastric cancer. BMC Cancer. 9:2242009. View Article : Google Scholar : PubMed/NCBI
|
|
42
|
Liu C, Li N, Lu H, Wang Z, Chen C, Wu L, Liu J, Lu Y and Wang F: Circulating SFRP1 promoter methylation status in gastric adenocarcinoma and esophageal square cell carcinoma. Biomed Rep. 3:123–127. 2015. View Article : Google Scholar : PubMed/NCBI
|
|
43
|
Yu J, Xie Y, Li M, Zhou F, Zhong Z, Liu Y, Wang F and Qi J: Association between SFRP promoter hypermethylation and different types of cancer: A systematic review and meta-analysis. Oncol Lett. 18:3481–3492. 2019.PubMed/NCBI
|
|
44
|
Kim SK, Kim HJ, Park JL, Heo H, Kim SY, Lee SI, Song KS, Kim WH and Kim YS: Identification of a molecular signature of prognostic subtypes in diffuse-type gastric cancer. Gastric Cancer. 23:473–482. 2020. View Article : Google Scholar : PubMed/NCBI
|
|
45
|
Liu D, Sun C, Kim N, Bhan C, Tuason JPW, Chen Y, Ma S, Huang Y, Cheng C, Zhou Q, et al: Comprehensive analysis of SFRP family members prognostic value and immune infiltration in gastric cancer. Life (Basel). 11:5222021.PubMed/NCBI
|
|
46
|
Baharudin R, Tieng FYF, Lee LH and Ab Mutalib NS: Epigenetics of SFRP1: The dual roles in human cancers. Cancers (Basel). 12:4452020. View Article : Google Scholar : PubMed/NCBI
|
|
47
|
Gao C and Chen YG: Dishevelled: The hub of Wnt signaling. Cell Signal. 22:717–727. 2010. View Article : Google Scholar : PubMed/NCBI
|
|
48
|
Katoh M: WNT/PCP signaling pathway and human cancer (review). Oncol Rep. 14:1583–1588. 2005.PubMed/NCBI
|
|
49
|
Liu Y, Zhang J, Yu W, Zhang X, Wang G and Zhao Z: Dapper homolog 1 alpha suppresses metastasis ability of gastric cancer through inhibiting planar cell polarity pathway. Oncotarget. 7:81423–81434. 2016. View Article : Google Scholar : PubMed/NCBI
|
|
50
|
Gnad T, Feoktistova M, Leverkus M, Lendeckel U and Naumann M: Helicobacter pylori-induced activation of beta-catenin involves low density lipoprotein receptor-related protein 6 and Dishevelled. Mol Cancer. 9:312010. View Article : Google Scholar : PubMed/NCBI
|
|
51
|
Bosman FT: WHO classification of tumours of the digestive system. World Health Organization classification of tumours. Bosman FT, Carneiro F, Hruban R H and Theise N: 4th edition. IARC Press; Lyon: 2010
|
|
52
|
Sadeghipour A and Babaheidarian P: Making formalin-fixed, paraffin embedded blocks. Methods Mol Biol. 1897:253–268. 2019. View Article : Google Scholar : PubMed/NCBI
|
|
53
|
Nikuševa-Martić T, Serman L, Zeljko M, Vidas Z, Gašparov S, Zeljko HM, Kosović M and Pećina-Šlaus N: Expression of secreted frizzled-related protein 1 and 3, T-cell factor 1 and lymphoid enhancer factor 1 in clear cell renal cell carcinoma. Pathol Oncol Res. 19:545–551. 2013. View Article : Google Scholar : PubMed/NCBI
|
|
54
|
Partl JZ, Fabijanovic D, Skrtic A, Vranic S, Martic TN and Serman L: Immunohistochemical expression of SFRP1 and SFRP3 proteins in normal and malignant reproductive tissues of rats and humans. Appl Immunohistochem Mol Morphol. 22:681–687. 2014. View Article : Google Scholar : PubMed/NCBI
|
|
55
|
Weibel ER: Stereological methods. 1. practical methods for biological morphometry. Academic press; London: pp. 1–415. 1979
|
|
56
|
Wicksell SD: The corpuscle problem A mathematical study of a biometric problem. Biometrika. 17:84–99. 1925. View Article : Google Scholar
|
|
57
|
Wicksell SD: The corpuscle problem Second memoir case of ellipsoidal corpuscles. Biometrika. 18:151–172. 1926. View Article : Google Scholar
|
|
58
|
Livak KJ and Schmittgen TD: Analysis of relative gene expression data using real-time quantitative PCR and the 2(-Delta Delta C(T)) method. Methods. 25:402–408. 2001. View Article : Google Scholar : PubMed/NCBI
|
|
59
|
Goldman MJ, Craft B, Hastie M, Repečka K, McDade F, Kamath A, Banerjee A, Luo Y, Rogers D, Brooks AN, et al: Visualizing and interpreting cancer genomics data via the Xena platform. Nat Biotechnol. 38:675–678. 2020. View Article : Google Scholar : PubMed/NCBI
|
|
60
|
Chandrashekar DS, Bashel B, Balasubramanya SAH, Creighton CJ, Ponce-Rodriguez I, Chakravarthi BVSK and Varambally S: UALCAN: A portal for facilitating tumor subgroup gene expression and survival analyses. Neoplasia. 19:649–658. 2017. View Article : Google Scholar : PubMed/NCBI
|
|
61
|
Aran D, Camarda R, Odegaard J, Paik H, Oskotsky B, Krings G, Goga A, Sirota M and Butte AJ: Comprehensive analysis of normal adjacent to tumor transcriptomes. Nat Commun. 8:10772017. View Article : Google Scholar : PubMed/NCBI
|
|
62
|
Zeng WZD, Glicksberg BS, Li Y and Chen B: Selecting precise reference normal tissue samples for cancer research using a deep learning approach. BMC Med Genomics. 12 (Suppl 1):S212019. View Article : Google Scholar
|
|
63
|
GTEx Consortium: The genotype-tissue expression (GTEx) project. Nat Genet. 45:580–585. 2013. View Article : Google Scholar : PubMed/NCBI
|
|
64
|
Ming SC: Gastric carcinoma. A pathobiological classification. Cancer. 39:2475–2485. 1977. View Article : Google Scholar : PubMed/NCBI
|
|
65
|
Nakamura K, Sugano H and Takagi K: Carcinoma of the stomach in incipient phase: Its histogenesis and histological appearances. Gan. 59:251–258. 1968.PubMed/NCBI
|
|
66
|
Patel MI, Rhoads KF, Ma Y, Ford JM, Visser BC, Kunz PL, Fisher GA, Chang DT, Koong A, Norton JA and Poultsides GA: Seventh edition (2010) of the AJCC/UICC staging system for gastric adenocarcinoma: Is there room for improvement? Ann Surg Oncol. 20:1631–1638. 2013. View Article : Google Scholar : PubMed/NCBI
|
|
67
|
Zhao CH, Bu XM and Zhang N: Hypermethylation and aberrant expression of Wnt antagonist secreted frizzled-related protein 1 in gastric cancer. World J Gastroenterol. 13:2214–2217. 2007. View Article : Google Scholar : PubMed/NCBI
|
|
68
|
Zhang T, Wu Y, Fang Z, Yan Q, Zhang S, Sun R, Khaliq J and Li Y: Low expression of RBMS3 and SFRP1 are associated with poor prognosis in patients with gastric cancer. Am J Cancer Res. 6:2679–2689. 2016.PubMed/NCBI
|
|
69
|
Kinoshita T, Nomoto S, Kodera Y, Koike M, Fujiwara M and Nakao A: Decreased expression and aberrant hypermethylation of the SFRP genes in human gastric cancer. Hepatogastroenterology. 58:1051–1056. 2011.PubMed/NCBIPubMed/NCBI
|
|
70
|
Katoh Y and Katoh M: WNT antagonist, SFRP1, is Hedgehog signaling target. Int J Mol Med. 17:171–175. 2006.PubMed/NCBI
|
|
71
|
Katoh M and Katoh M: Integrative genomic analyses of ZEB2: Transcriptional regulation of ZEB2 based on SMADs, ETS1, HIF1alpha, POU/OCT, and NF-kappaB. Int J Oncol. 34:1737–1742. 2009. View Article : Google Scholar : PubMed/NCBI
|
|
72
|
Kim JH, Shin HS, Lee SH, Lee I, Lee YS, Park JC, Kim YJ, Chung JB and Lee YC: Contrasting activity of Hedgehog and Wnt pathways according to gastric cancer cell differentiation: Relevance of crosstalk mechanisms. Cancer Sci. 101:328–335. 2010. View Article : Google Scholar : PubMed/NCBI
|
|
73
|
Peng JX, Liang SY and Li L: sFRP1 exerts effects on gastric cancer cells through GSK3β/Rac1-mediated restraint of TGFβ/Smad3 signaling. Oncol Rep. 41:224–234. 2019.PubMed/NCBI
|
|
74
|
Yang HJ, Kim SG, Lim JH, Choi JM, Kim WH and Jung HC: Helicobacter pylori-induced modulation of the promoter methylation of Wnt antagonist genes in gastric carcinogenesis. Gastric Cancer. 21:237–248. 2018. View Article : Google Scholar : PubMed/NCBI
|
|
75
|
Wu F, Li J, Guo N, Wang XH and Liao YQ: MiRNA-27a promotes the proliferation and invasion of human gastric cancer MGC803 cells by targeting SFRP1 via Wnt/β-catenin signaling pathway. Am J Cancer Res. 7:405–416. 2017.PubMed/NCBI
|
|
76
|
Feng C, She J, Chen X, Zhang Q, Zhang X, Wang Y, Ye J, Shi J, Tao J, Feng M, et al: Exosomal miR-196a-1 promotes gastric cancer cell invasion and metastasis by targeting SFRP1. Nanomedicine (Lond). 14:2579–2593. 2019. View Article : Google Scholar : PubMed/NCBI
|
|
77
|
Ouyang J, Xie Z, Lei X, Tang G, Gan R and Yang X: Clinical crosstalk between microRNAs and gastric cancer (Review). Int J Oncol. 58:72021. View Article : Google Scholar : PubMed/NCBI
|
|
78
|
Xu C, Cheng H, Li N, Zhou N and Tang X: Relationship between microRNA-27a and efficacy of neoadjuvant chemotherapy in gastric cancer and its mechanism in gastric cancer cell growth and metastasis. Biosci Rep. 39:BSR201811752019. View Article : Google Scholar : PubMed/NCBI
|
|
79
|
Ren J, Huang HJ, Gong Y, Yue S, Tang LM and Cheng SY: MicroRNA-206 suppresses gastric cancer cell growth and metastasis. Cell Biosci. 4:262014. View Article : Google Scholar : PubMed/NCBI
|
|
80
|
Alessandrini L, Manchi M, De Re V, Dolcetti R and Canzonieri V: Proposed molecular and miRNA classification of gastric cancer. Int J Mol Sc. 19:16832018. View Article : Google Scholar
|
|
81
|
Qu Y, Ray PS, Li J, Cai Q, Bagaria SP, Moran C, Sim MS, Zhang J, Turner RR, Zhu Z, et al: High levels of secreted frizzled-related protein 1 correlate with poor prognosis and promote tumourigenesis in gastric cancer. Eur J Cancer. 49:3718–3728. 2013. View Article : Google Scholar : PubMed/NCBI
|
|
82
|
Cui HB, Ge HE, Wang YS and Bai XY: miR-208a enhances cell proliferation and invasion of gastric cancer by targeting SFRP1 and negatively regulating MEG3. Int J Biochem Cell Biol. 102:31–39. 2018. View Article : Google Scholar : PubMed/NCBI
|
|
83
|
Peng JX, Liang SY and Li L: sFRP1 exerts effects on gastric cancer cells through GSK3β/Rac1-mediated restraint of TGFβ/Smad3 signaling. Oncol Rep. 41:224–234. 2019.PubMed/NCBI
|
|
84
|
Surana R, Sikka S, Cai W, Shin EM, Warrier SR, Tan HJ, Arfuso F, Fox SA, Dharmarajan AM and Kumar AP: Secreted frizzled related proteins: Implications in cancers. Biochim Biophys Acta. 1845:53–65. 2014.PubMed/NCBI
|
|
85
|
Lin K, Wang S, Julius MA, Kitajewski J, Moos M Jr and Luyten FP: The cysteine-rich frizzled domain of Frzb-1 is required and sufficient for modulation of Wnt signaling. Proc Natl Acad Sci USA. 94:11196–11200. 1997. View Article : Google Scholar : PubMed/NCBI
|
|
86
|
Qu Y, Li JF, Cai Q, Wang YW, Gu QL, Zhu ZG and Liu BY: Over-expression of FRZB in gastric cancer cell suppresses proliferation and induces differentiation. J Cancer Res Clin Oncol. 134:353–364. 2008. View Article : Google Scholar : PubMed/NCBI
|
|
87
|
Byun T, Karimi M, Marsh JL, Milovanovic T, Lin F and Holcombe RF: Expression of secreted Wnt antagonists in gastrointestinal tissues: Potential role in stem cell homeostasis. J Clin Pathol. 58:515–519. 2005. View Article : Google Scholar : PubMed/NCBI
|
|
88
|
Qin S, Zhang Z, Li J and Zang L: FRZB knockdown upregulates β-catenin activity and enhances cell aggressiveness in gastric cancer. Oncol Rep. 31:2351–2357. 2014. View Article : Google Scholar : PubMed/NCBI
|
|
89
|
Uematsu K, He B, You L, Xu Z, McCormick F and Jablons DM: Activation of the Wnt pathway in non small cell lung cancer: Evidence of dishevelled overexpression. Oncogene. 22:7218–7221. 2003. View Article : Google Scholar : PubMed/NCBI
|
|
90
|
Sareddy GR, Panigrahi M, Challa S, Mahadevan A and Babu PP: Activation of Wnt/β-catenin/Tcf signaling pathway in human astrocytomas. Neurochem Int. 55:307–317. 2009. View Article : Google Scholar : PubMed/NCBI
|
|
91
|
You XJ, Bryant PJ, Jurnak F and Holcombe RF: Expression of Wnt pathway components frizzled and disheveled in colon cancer arising in patients with inflammatory bowel disease. Oncol Rep. 18:691–694. 2007.PubMed/NCBI
|
|
92
|
Hegazy SA, Alshareef A, Gelebart P, Anand M, Armanious H, Ingham RJ, Ingham RJ and Lai R: Disheveled proteins promote cell growth and tumorigenicity in ALK-positive anaplastic large cell lymphoma. Cell Signal. 25:295–307. 2013. View Article : Google Scholar : PubMed/NCBI
|
|
93
|
Kafka A, Karin-Kujundžić V, Šerman L, Bukovac A, Njirić N, Jakovčević A and Pećina-Šlaus N: Hypermethylation of secreted frizzled related protein 1 gene promoter in different astrocytoma grades. Croat Med J. 59:213–223. 2018. View Article : Google Scholar : PubMed/NCBI
|
|
94
|
Astudillo P: Wnt5a signaling in gastric cancer. Front Cell Dev Biol. 8:1102020. View Article : Google Scholar : PubMed/NCBI
|
|
95
|
Ara H, Takagishi M, Enomoto A, Asai M, Ushida K, Asai N, Shimoyama Y, Kaibuchi K, Kodera Y and Takahashi M: Role for Daple in non-canonical Wnt signaling during gastric cancer invasion and metastasis. Cancer Sci. 107:133–139. 2016. View Article : Google Scholar : PubMed/NCBI
|
|
96
|
Peng Q, Chen L, Wu W, Wang J, Zheng X, Chen Z, Jiang Q, Han J, Wei L, Wang L, et al: EPH receptor A2 governs a feedback loop that activates Wnt/β-catenin signaling in gastric cancer. Cell Death Dis. 9:11462018. View Article : Google Scholar : PubMed/NCBI
|
|
97
|
Gao J, Zhao C, Liu Q, Hou X, Li S, Xing X, Yang C and Luo Y: Cyclin G2 suppresses Wnt/β-catenin signaling and inhibits gastric cancer cell growth and migration through Dapper1. J Exp Clin Cancer Res. 37:3172018. View Article : Google Scholar : PubMed/NCBI
|
|
98
|
Peng Y and Wang HH: Cir-ITCH inhibits gastric cancer migration, invasion and proliferation by regulating the Wnt/β-catenin pathway. Sci Rep. 101:174432020. View Article : Google Scholar : PubMed/NCBI
|
|
99
|
Deng YZ, Yao F, Li JJ, Mao ZF, Hu PT, Long LY, Li G, Ji XD, Shi S, Guan DX, et al: RACK1 suppresses gastric tumorigenesis by stabilizing the β-catenin destruction complex. Gastroenterology. 142:812–823.e15. 2012. View Article : Google Scholar : PubMed/NCBI
|
|
100
|
Demirci U, Örenay Boyacıoğlu S, Kasap E, Bilgiç F, Gerçeker E, Yıldırım H, Baykan A, Ellidokuz E, Yüceyar M and Korkmaz M: P-014 are RHOA, CSNK1A1, DVL2, FZD8 and LRP5 genes novel biomarkers in the conversion from intestinal metaplasia to gastric Cancer? Ann Oncol. 27 (Suppl 2):ii42016. View Article : Google Scholar
|
|
101
|
Chong Y, Mia-Jan K, Ryu H, Abdul-Ghafar J, Munkhdelger J, Lkhagvadorj S, Jung SY, Lee M, Ji SY, Choi E and Cho MY: DNA methylation status of a distinctively different subset of genes is associated with each histologic Lauren classification subtype in early gastric carcinogenesis. Oncol Rep. 31:2535–2544. 2014. View Article : Google Scholar : PubMed/NCBI
|
|
102
|
Cancer Genome Atlas Research Network, . Comprehensive molecular characterization of gastric adenocarcinoma. Nature. 513:202–209. 2014. View Article : Google Scholar : PubMed/NCBI
|
|
103
|
Cristescu R, Lee J, Nebozhyn M, Kim KM, Ting JC, Wong SS, Liu J, Yue YG, Wang J, Yu K, et al: Molecular analysis of gastric cancer identifies subtypes associated with distinct clinical outcomes. Nat Med. 2:449–456. 2015. View Article : Google Scholar : PubMed/NCBI
|
|
104
|
Katona BW and Rustgi AK: Gastric cancer genomics: Advances and future directions. Cell Mol Gastroenterol Hepatol. 3:211–217. 2017. View Article : Google Scholar : PubMed/NCBI
|
|
105
|
Oh SC, Sohn BH, Cheong JH, Kim SB, Lee JE, Park KC, Lee SH, Park JL, Park YY, Lee HS, et al: Clinical and genomic landscape of gastric cancer with a mesenchymal phenotype. Nat Commun. 9:17772018. View Article : Google Scholar : PubMed/NCBI
|
|
106
|
Carino A, Graziosi L, Marchianò S, Biagioli M, Marino E, Sepe V, Zampella E, Distrutti E, Donini A and Fiorucci S: Analysis of gastric cancer transcriptome allows the identification of histotype specific molecular signatures with prognostic potential. Front Oncol. 11:6637712021. View Article : Google Scholar : PubMed/NCBI
|
|
107
|
Sexton RE, Hallak MNA, Uddin MH, Diab M and Azmi AS: Gastric cancer heterogeneity and clinical outcomes. Technol Cancer Res Treat. 19:15330338209354772020. View Article : Google Scholar : PubMed/NCBI
|
|
108
|
Li L and Wang X: Identification of gastric cancer subtypes based on pathway clustering. NPJ Precis Oncol. 5:462021. View Article : Google Scholar : PubMed/NCBI
|
|
109
|
Wong SS, Kim KM, Ting JC, Yu K, Fu J, Liu S, Cristescu R, Nebozhyn M, Gong L, Yue YG, et al: Genomic landscape and genetic heterogeneity in gastric adenocarcinoma revealed by whole-genome sequencing. Nat Commun. 5:54772014. View Article : Google Scholar : PubMed/NCBI
|


