Introduction
Acute myeloid leukemia (AML) is a malignant disease originating from myeloid hematopoietic stem or progenitor cells. It is characterized by abnormal proliferation of primitive and juvenile myeloid cells in the bone marrow and peripheral blood (1,2). The clinical manifestations of this disease are anemia, hemorrhage, infection, fever, organ infiltration and abnormal metabolism. If not treated in time, AML can often be life-threatening (3–5). AML remains a disease with variable prognosis and high mortality. The median overall survival for patients with relapsed AML ranges from 4–6 months, and the long-term survival rate from the time of relapse ranges from 5–20% (6,7). The pathogenesis of AML is associated with two types of genetic abnormalities. The first type involves gene mutation or rearrangement in tyrosine kinases, such as FLT3, C-KIT or RAS (8,9). The second type involves mutation or rearrangement in transcription factors associated with hematopoietic regulation, such as PML-RARα, AML1-ETO, GATA1 and GATA2 (10,11). With the development of genome sequencing, an increasing number of studies has suggested that some genes are closely related to the occurrence, development and recurrence of AML. For instance, a previous study has demonstrated that the m6A demethylase, alpha-ketoglutarate dependent dioxygenase (FTO), plays an oncogenic role in the development of AML (12). Another study has suggested that R(−)-2-hydroxyglutarate plays a tumor-suppressive role in leukemia by competitively inhibiting the activity of FTO (13). Therefore, the identification of molecules related to the prognosis of AML and the characterization of their gene expression levels are important for individualized risk assessment in different patients. The prognostic level of AML patients was thus predicted by establishing a diagnostic risk scoring system.
Disease risk models are statistical models based on the risk factors for an individual that can be used to evaluate the probability of the occurrence of a disease over a certain period of time (14,15). Typical tumor risk prediction models are usually based on demographic characteristics, environmental risk factor exposure, lifestyle and clinical indicators. With advances in the field of genomics, multigene risk scores have been developed that can quantify the cumulative effect of multiple genes and condense a large amount of genomic variation information into a score that can measure individual disease susceptibility (16). Scoring systems play an important role in the prediction, screening and intervention of high-risk groups to achieve the precise prevention of complex diseases (17). Therefore, the discovery of new AML biomarkers and the development of novel prognostic risk score systems may help improve our understanding of the molecular basis of AML and provide a more accurate individualized auxiliary diagnosis method for patients with AML.
In the present study, an mRNA-based risk score system was used to predict disease prognosis using sample-matched mRNA expression profiles from patients with AML. Differentially expressed mRNA (DEmRNA) molecules were identified between normal and AML blood. Among these DEmRNA transcripts, signature mRNA transcripts associated with prognosis were screened using univariate and least absolute shrinkage and selection operator (LASSO) regression. Using multivariate Cox regression analysis, the family with sequence similarity 124 member B (FAM124B), 4-hydroxyphenylpyruvate dioxygenase-like protein (HPDL), myeloperoxidase (MPO) and purinergic receptor P2Y1 (P2RY1) genes were found to be associated with AML prognosis, and a prognostic scoring system was developed. The expression levels of these four genes were also determined in the blood from healthy individuals or patients with AML.
Materials and methods
Data collection
The RNA expression data (read counts) of patients with AML (n=132) and available clinical and demographic data (including sex, age, race, vital status and survival time) were obtained from The Cancer Genome Atlas (TCGA) via the University of California Santa Cruz (UCSC) Xena database (https://xenabrowser.net/datapages/?dat-aset=TCGA-LAML.htseq_counts.tsv) (18). The RNA expression data (read counts) from healthy blood samples (n=337) were obtained from the Genotype-Tissue Expression database (https://gtexportal.org/) (19).
Clinical sample collection
A total of 40 peripheral blood samples were obtained from patients with AML (n=20) and healthy controls (n=20) between November 2019 and November 2020 in Kunming Yan'an Hospital (Kunming, China). This study was approved by The Ethics Committee of Kunming Yan'an Hospital (Kunming, China; approval no. 2021-03-01). All patients and healthy controls signed informed consent forms. Clinical information was collected for all patients and controls. The clinical variables of the patients, including age, sex, French-American-British (FAB) classification (20), white blood cell count, hemoglobin content, platelet count and ratio of bone marrow blasts were collected from their medical records. The clinical features recorded for the healthy individuals included age and sex, as well as red blood cell, white blood cell and platelet counts.
Cell lines and culture
The human TK6 lymphoblastoid and the human AML cell lines (OCI-AML2 and MOLM-13) were obtained from Cobioer Biosciences Co., Ltd. (Nanjing, China). The cells were cultured in RPMI-1640 medium (cat. no. AH411-0272400047; Thermo Fisher Scientific, Inc.) containing penicillin-streptomycin (100 IU/ml and 100 mg/ml respectively) and 20% FBS (cat. no. 10100147; Thermo Fisher Scientific, Inc.). The cells were cultured at 37°C in an incubator with 5% CO2 (cat. no. OM-80A-II; Shanghai Huaiyu Instrument Equipment Co., Ltd). White blood cell isolation from the peripheral blood was performed using a Human Peripheral Blood Leukocyte Isolation kit (cat. no. P8670; Beijing Solarbio Science & Technology Co., Ltd.), according to the manufacturer's instructions.
Protein extraction and western blot analysis
Total protein in the white blood cells was extracted using RIPA lysis buffer (cat. no. R0278-50ML; Sigma-Aldrich; Merck KGaA) on ice for 30 min. Equal masses of protein (15 µg) were separated using SDS-PAGE (12% resolving gel and 5% stacking gel), then transferred to a PVDF membrane (cat. no. FFP24; Beyotime Biotechnology Inc.) and blocked in 5% BSA (cat. no. SW3015; Beijing Solarbio Science & Technology Co., Ltd.) at room temperature for 2 h. The membranes were incubated with the primary antibodies at room temperature for 2 h. After washing with Tris-buffered saline +0.05% Tween (TBST) six times (for 5 min each time), the membrane was incubated with the secondary antibodies at room temperature for 1 h. After washing with TBST six times (for 5 min each time), ECL western blotting substrate (cat. no. PE0010; Beijing Solarbio Science & Technology Co., Ltd.) was added to the membranes in the dark for 10 min. The protein bands were visualized using a Gel Doc XR+ gel imaging system (Bio-Rad Laboratories, Inc.). The relative expression levels of the proteins were determined by the gray value of the bands using Adobe Photoshop software (version 6.0; Adobe Systems Software Ireland Ltd). Antibodies against the following proteins were used: FAM124B (cat. no. 21313-1-AP; 1:600; ProteinTech Group, Inc.), HPDL (cat. no. ab246986; 1:1,000; Abcam), P2RY1 (cat. no. 67654-1-Ig; 1:5,000; ProteinTech Group Inc.), MPO (cat. no. ab134132; 1:1,000; Abcam) and β-actin (cat. no. WL01372; 1:3,000; Wanleibio Inc.). HRP-conjugated goat anti-rabbit (cat. no. A32731; 1:5,000; Thermo Fisher Scientific, Inc.) and HRP-conjugated goat anti-mouse (cat. no. A32723; 1:5,000; Thermo Fisher Scientific, Inc.) were used as secondary antibodies.
Reverse transcription-quantitative PCR (RT-qPCR)
Total RNA was extracted from white blood cells or from the cell lines using a total RNA extraction kit (cat. no. R1200; Beijing Solarbio Science & Technology Co., Ltd.) according to the manufacturer's instructions. The relative concentration of RNA was detected using a NanoDrop 2000 spectrophotometer (Thermo Fisher Scientific, Inc.). Total RNA was reverse transcribed into cDNA using the One Step Super RT-PCR Mix kit (cat. no. T2240; Beijing Solarbio Science & Technology Co., Ltd.). The reaction condition of RT-qPCR was at 50°C or 20 min. qPCR was subsequently performed using the BeyoFast™ SYBR Green qPCR Mix (cat. no. D7265-5ml; Beyotime Institute of Biotechnology) in an ABI7500 real-time fluorescent quantitative PCR instrument (Thermo Fisher Scientific, Inc.). The reaction condition of qPCR was as following: 95°C for 2 min; 95°C for 15 sec, 60°C for 20 sec (40 cycle); 95°C for 15 sec, 60°C for 15 sec and 95°C for 15 sec. The following primer sequences were used: i) FAM124B forward, 5′-GAGGTCCGGCTCTTTCAGG-3′ and reverse, 5′-GCGAAATAGCCTATCCTCTCCC-3′; ii) MPO forward, 5′-GCAATGGTTCAAGCGATTCTT-3′ and reverse, 5′-CGGTATAGGCACACAATGGTGAG-3′; iii) P2RY1 forward, 5′-CTCATTGTGGTGGTGGCG-3′ and reverse, 5′-GTACTCGTCTGAGGTGGTGTCG-3′; iv) HPDL forward, 5′-CGGCTGGCGGCAGCTAGCCCTGCGC-3′ and reverse, AACCCGGGAGCTGGCAGCGCTG; and v) GAPDH forward, 5′-ATGACATCAAGAAGGTGGTGAAGCAGG-3′ and reverse, GCGTCAAAGGTGGAGGAGTGGGT. The relative mRNA expression levels were calculated using the 2−ΔΔCq method (21). GAPDH was used as a reference for standardization.
DEmRNA screening
The protein-coding genes from RNA expression data were screened against the reference genome Homo_sapiens.GRCh38.94 using the dplyr and tidyr packages in the R programming language (version: 3.6.2; http://www.r-project.org/). DEmRNA molecules identified in normal and AML samples were screened using the limma and edgeR packages in R3.6.2. P<0.01 and |log2foldchange|>4 were used as thresholds. The ggplot and pheatmap R3.6.2 packages were used to graphically present the DEmRNA.
Gene Ontology (GO) and the Kyoto Encyclopedia of Genes and Genomes (KEGG) pathway enrichment analysis
GO and KEGG pathways were selected to annotate the biological functions of the DEmRNA molecules. The significant enrichment results (P<0.05) were obtained using the database for annotation, visualization and integrated discovery 6.8 (https://david.ncifcrf.gov/).
Development of the predictive model
Univariate Cox regression analysis was used to examine the correlation between the overall survival (OS) of patients with AML and the expression of DEmRNA molecules using the survival R.3.6.2 package. P<0.05 and |z-score|>2 were set as the thresholds. The Volcano map and ggplot packages in R3.6.2 were used to graphically present the DEmRNA molecules. LASSO Cox regression analysis is a common method for the regression of high-dimensional predictors. Selection of the tuning parameter (λ) in the LASSO model through 10-fold cross-validation procedure was plotted as a function of log(λ). The most powerful prognostic predictors were selected according to the best λ value (minimum of partial likelihood deviation). LASSO Cox regression analysis was then performed to further screen mRNAs using the glmnet R3.6.2 package. The individual patient risk score was a linear combination of regression coefficient-weighted mRNA expression levels derived from multivariate Cox regression analysis. The patient-specific risk score was calculated using the following formula: Risk score=(α mRNA1 × exp mRNA1) + (α mRNA2 × exp mRNA) + ··· + (α mRNAn × exp mRNAn), where α is the coefficient specific to each mRNA in the multivariate Cox regression analysis and exp is the expression level of each mRNA. An independent RNA sequencing dataset from the Gene Expression Omnibus (accession no. GSE12417) was used to validate the prognostics score developed in the present study. The GSE12417 dataset was generated in a gene expression profiling study aiming to develop a gene signature that predicts OS in cytogenetically normal acute myeloid leukemia. A total of 79 patients was included in the original study (22).
Nomogram graph
A nomogram was constructed according to the aforementioned prognostic scoring system using the RMS package in R3.6.2. Nomogram predicted the 1-year, 2-year and 5-year OS for AML patients. The nomogram summed the points identified on the scale for risk scores in different AML patients. The points projected on the bottom scales indicate the probabilities of 1-year, 2-year and 5-year OS for AML patients.
Estimation of stromal and immune scores
In tumor microenvironment, immune cells and stromal cells are two main types of non-tumor cell. The estimation of stromal and immune cells in malignant tumor tissues using expression data by ESTIMATE R package, which predicts the composition of tumor tissue using mRNA expression data and consists of three scores: Stromal, immune and estimate scores (23). Stromal and immune scores were evaluated for the expression matrix according to the ESTIMATE algorithm. The stromal score, immune score and estimate score (sum of stromal score and immune score) of each gene in a single sample were calculated, and an enrichment analysis was carried out. For each of the three categories (stromal, immune and estimate), the AML samples were then divided into high- and low-score groups according to cut off value (median). The association between the expression levels of the screened mRNA candidates and these scores was evaluated.
Survival analysis
Survival data were obtained from UCSC Xena (https://xenabrowser.net/datapages/). The AML samples were divided into ‘high’ and ‘low’ groups according to the median mRNA expression, as well as risk, stromal, estimate or immune scores. Kaplan-Meier OS curves were generated using the survival R package. Moreover, receiver operating characteristic (ROC) curves were produced using the survivalROC R package. P<0.05 was considered to indicate a statistically significant difference.
Statistical analysis
The R Programming Language (version: 3.6.2, http://www.r-project.org/) and SPSS 15.0 software (SPSS, Inc.) were used for statistical analysis. mRNA molecules associated with prognosis were screened using univariate and multivariate Cox using the survival R package. The experimental results are presented as the mean ± standard deviation of three independent experiments. The unpaired two-tailed Student's t test was used for statistical analysis of two independent samples. P<0.05 was considered to indicate a statistically significant difference.
Results
Patient characteristics from the TCGA samples
The RNA sequencing results of 132 patients with AML were used in the present study. The median age of all the patients was 53 years (age range, 21–88 years). The number of male patients was higher than that of female patients. The average OS time of the patients was 20.56±19.94 months. Patient follow-up time was <21 months, during which 84 (63.63%) patients died and 48 (36.37%) survived. The patient's FAB classification was as follows: M0 (9.09%), M1 (24.24%), M2 (24.24%), M3 (10.61%), M4 (20.45%), M5 (9.09%), M6 (24.24%) and M7 (0.76%). Detailed demographic and clinical information is presented in Table I.
 |
Table I.
Clinical and demographic characteristics of patients with acute myeloid leukemia from The Cancer Genome Atlas (n=132).
|
Table I.
Clinical and demographic characteristics of patients with acute myeloid leukemia from The Cancer Genome Atlas (n=132).
| Clinical characteristics |
Number of cases, n (%) |
| Age, years |
|
| >60 |
55 (41.67) |
| ≤60 |
77 (58.33) |
| Sex |
|
| Female |
61 (46.21) |
| Male |
71 (53.79) |
| Ethnicity |
|
| Asian |
1 (0.76) |
| Black or African American |
11 (8.33) |
| White |
118 (89.4) |
| Unknown |
2 (1.51) |
| Vital status |
|
| Deceased |
80 (60.61) |
| Living |
52 (38.39) |
| Survival time, months |
|
| >21 |
84 (63.63) |
| ≤21 |
48 (36.37) |
| FAB classification |
|
| M0 |
12 (9.09) |
| M1 |
32 (24.24) |
| M2 |
32 (24.24) |
| M3 |
14 (10.61) |
| M4 |
27 (20.45) |
| M5 |
12 (9.09) |
| M6 |
2 (1.52) |
| M7 |
1 (0.76) |
Differential expression of mRNA transcripts
In total, 284 mRNA transcripts were differentially expressed in the normal and the AML samples. Compared with the normal samples, 245 (86.27%) transcripts were upregulated in the AML samples, while 39 (13.73%) were downregulated (Table SI). Differences in the expression of mRNA molecules among the samples are presented as a hierarchical heatmap and a volcano plot in Fig. 1A and B.
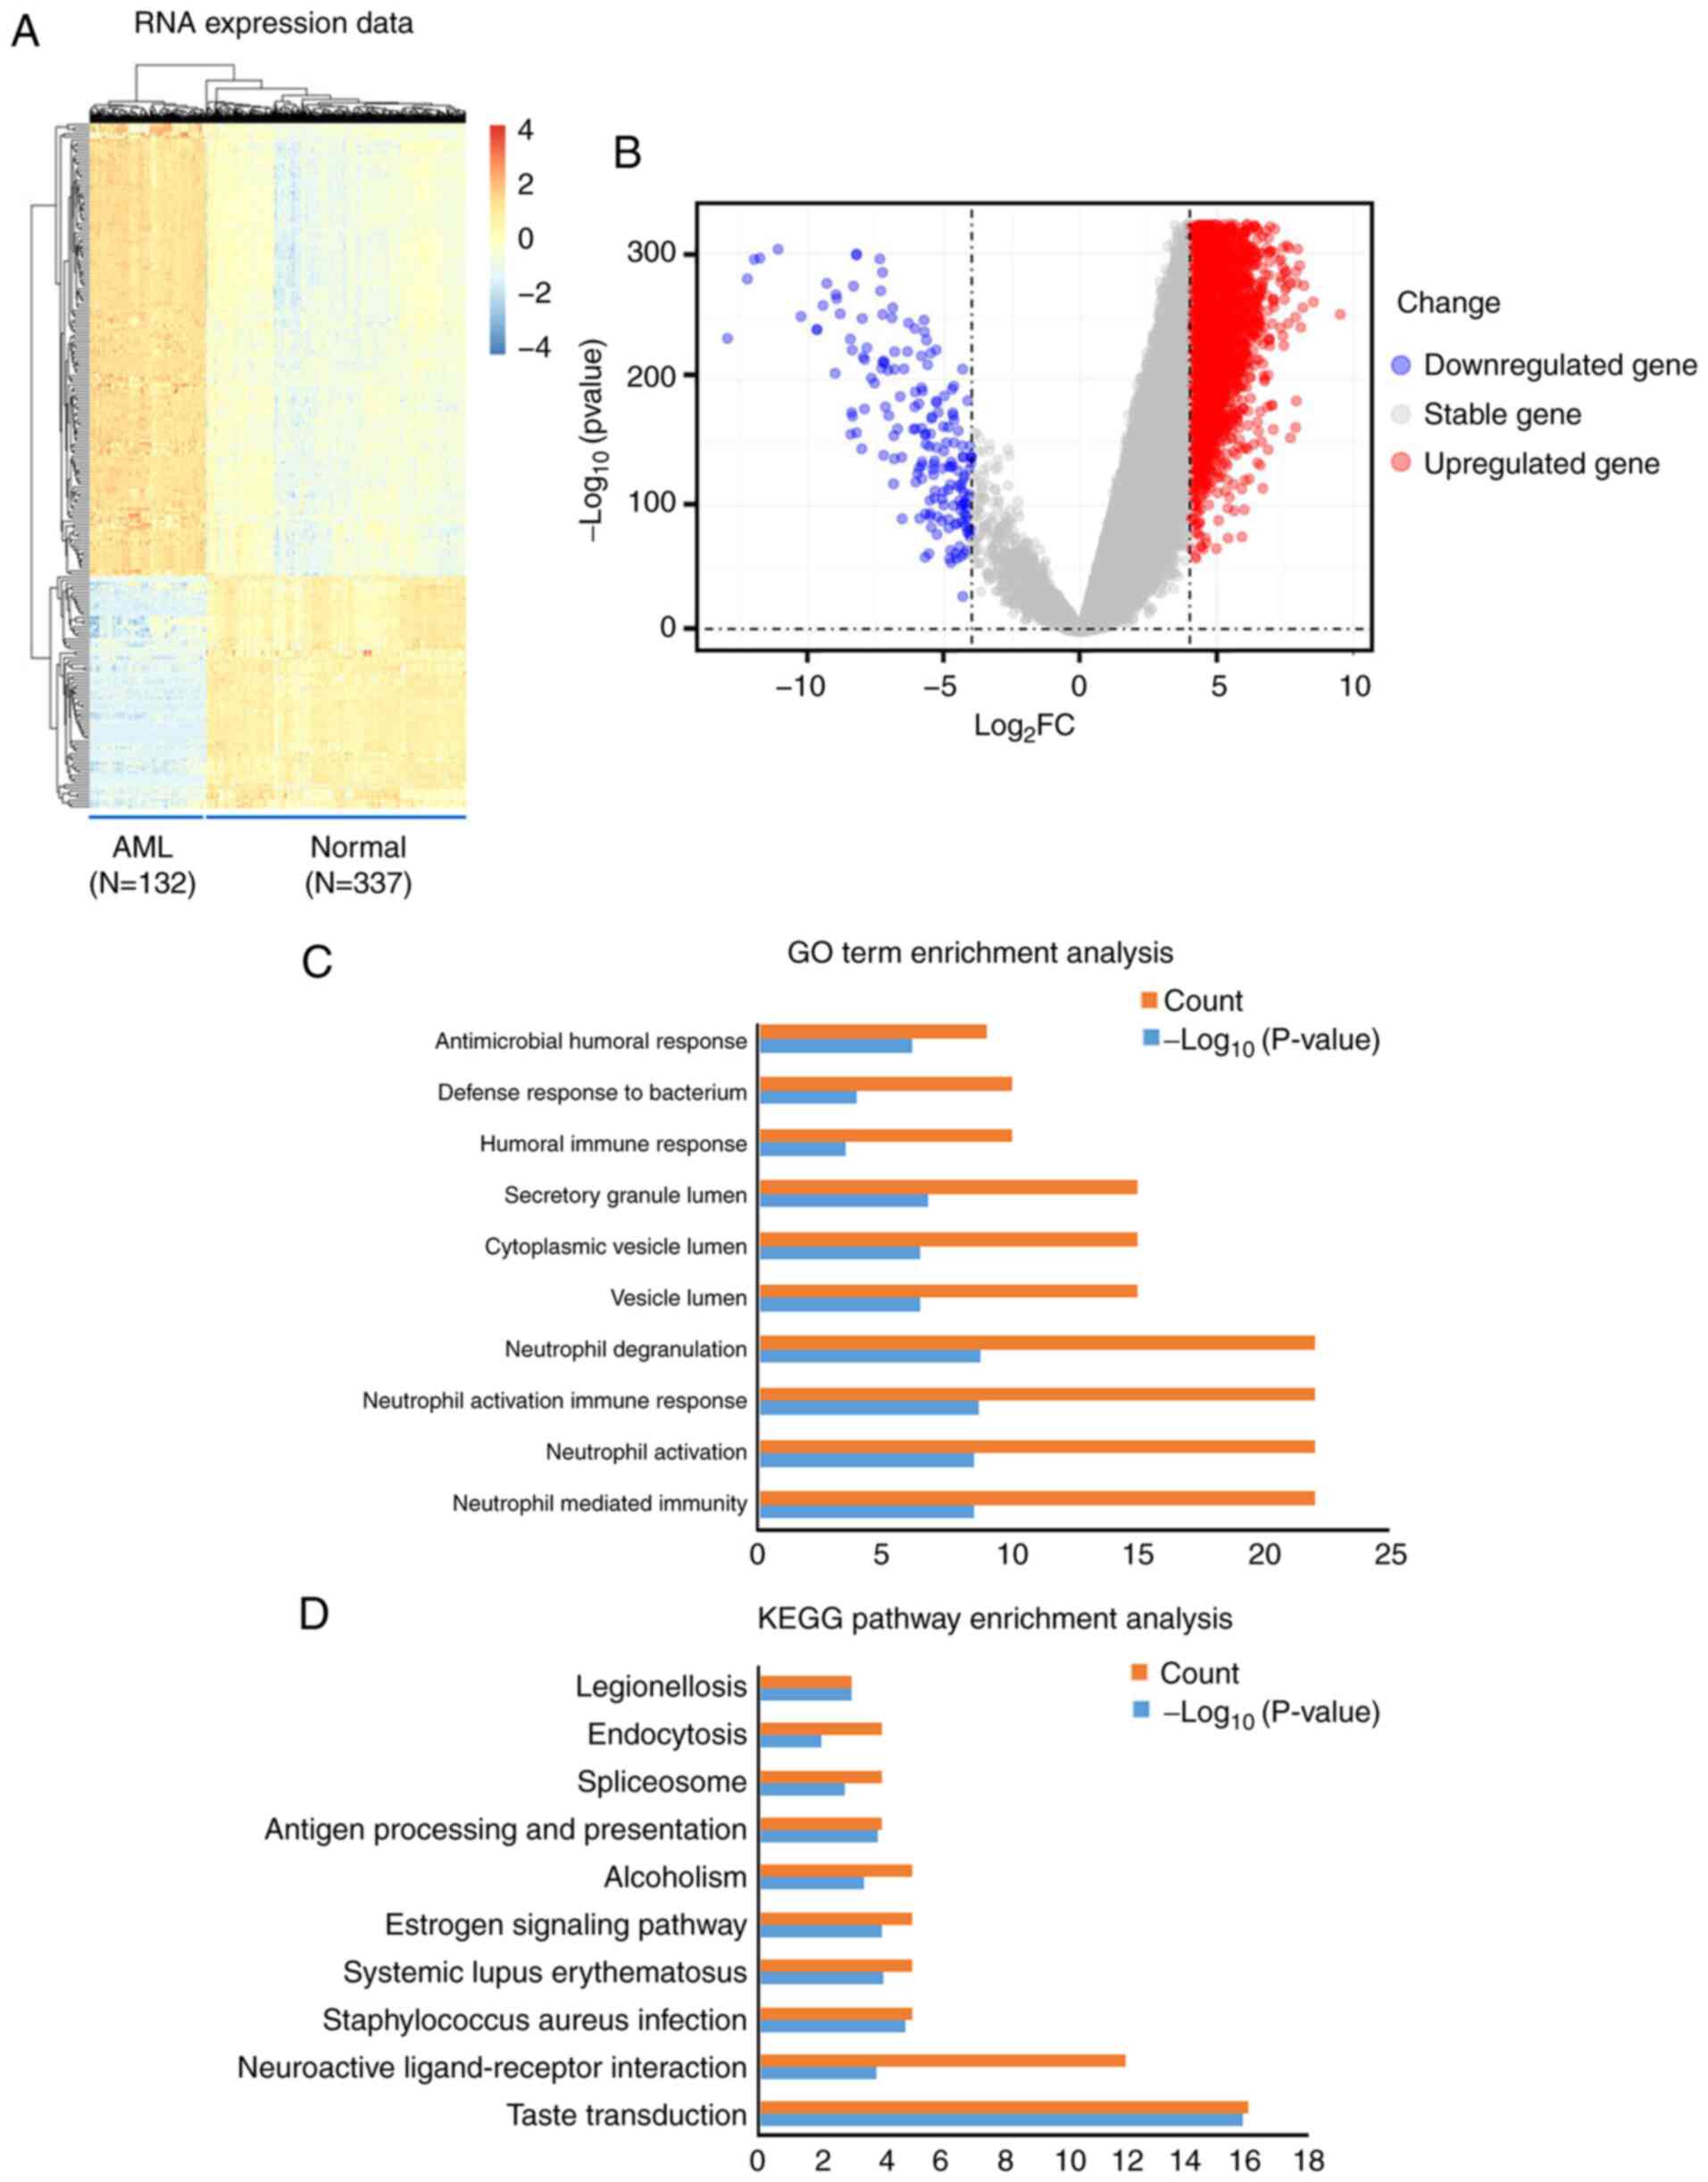 |
Figure 1.
Visualization and functional annotation DEmRNA molecules. (A) Hierarchical clustering map of the DEmRNA molecules based on the expression value. Blue indicates downregulation, whereas red indicates upregulation. (B) Volcano plots of the DEmRNA molecules. (C) Top 10 (count) GO biological process terms of the upregulated and downregulated DEmRNA molecules. P<0.05. (D) Top 10 (count) KEGG pathways of the upregulated and downregulated DEmRNA molecules. P<0.05. AML, acute myeloid leukemia; DEmRNA, differentially expressed mRNA; GO, Gene Ontology; KEGG, Kyoto Encyclopedia of Genes and Genomes; FC, fold change.
|
Functional analysis of the DEmRNA molecules
In order to explore the biological role of DEmRNA in the development of AML, GO biological processes and KEGG pathways were obtained using functional annotation and pathway enrichment analysis. The significant GO biological process terms of the DEmRNA molecules (Top 5) included ‘Neutrophil mediated immunity’, ‘Neutrophil activation’, ‘Neutrophil activation involved in immune response’, ‘Neutrophil degranulation’ and ‘Vesicle lumen’ (Table II; Fig. 1C). In addition, the significant KEGG pathway terms the DEmRNA molecules (Top 5) included ‘Taste transduction’, ‘Neuroactive ligand-receptor interaction’, ‘Staphylococcus aureus infection’, ‘Systemic lupus erythematosus’, and ‘Estrogen signaling pathway’ (Table III; Fig. 1D).
|
Table II.
GO annotation of differentially expressed mRNA transcripts.
|
Table II.
GO annotation of differentially expressed mRNA transcripts.
| GO ID |
GO term |
P-value |
Counta |
| GO:0002446 |
Neutrophil mediated immunity |
3.00×10⁻⁹ |
22 |
| GO:0042119 |
Neutrophil activation |
3.00×10⁻⁹ |
22 |
| GO:0002283 |
Neutrophil activation involved in immune response |
1.99×10⁻⁹ |
22 |
| GO:0043312 |
Neutrophil degranulation |
1.78×10⁻⁹ |
22 |
| GO:0031983 |
Vesicle lumen |
4.08×10⁻⁷ |
15 |
| GO:0060205 |
Cytoplasmic vesicle lumen |
3.93×10⁻⁷ |
15 |
| GO:0034774 |
Secretory granule lumen |
2.03×10⁻⁷ |
15 |
| GO:0006959 |
Humoral immune response |
3.60×10⁻⁴ |
10 |
| GO:0042742 |
Defense response to bacterium |
1.38×10⁻⁴ |
10 |
| GO:0019730 |
Antimicrobial humoral response |
8.73×10⁻⁷ |
9 |
| GO:0101002 |
Ficolin-1-rich granule |
4.41×10⁻⁵ |
9 |
| GO:0070820 |
Tertiary granule |
1.70×10⁻⁵ |
9 |
| GO:0042581 |
Specific granule |
9.74×10⁻⁵ |
8 |
| GO:1904724 |
Tertiary granule lumen |
2.94×10⁻⁸ |
8 |
| GO:1904813 |
Ficolin-1-rich granule lumen |
1.58×10⁻⁵ |
8 |
| GO:0061844 |
Antimicrobial humoral immune response mediated by antimicrobial peptide |
9.53×10⁻⁷ |
7 |
| GO:0032993 |
Protein-DNA complex |
1.50×10⁻³ |
7 |
| GO:0035580 |
Specific granule lumen |
1.31×10⁻⁶ |
7 |
| GO:0044815 |
DNA packaging complex |
5.36×10⁻⁴ |
6 |
| GO:0000786 |
Nucleosome |
3.81×10⁻⁴ |
6 |
| GO:0019731 |
Antibacterial humoral response |
6.35×10⁻⁵ |
5 |
| GO:0050832 |
Defense response to fungus |
3.97×10⁻⁵ |
5 |
| GO:0031640 |
Killing of cells of other organism |
2.82×10⁻⁴ |
5 |
| GO:0044364 |
Disruption of cells of other organism |
2.82×10⁻⁴ |
5 |
| GO:0002251 |
Organ or tissue specific immune response |
2.35×10⁻⁵ |
5 |
| GO:0002385 |
Mucosal immune response |
1.51×10⁻⁵ |
5 |
| GO:0090307 |
Mitotic spindle assembly |
1.43×10⁻⁴ |
5 |
| GO:0009620 |
Response to fungus |
1.30×10⁻⁴ |
5 |
| GO:0044110 |
Growth involved in symbiotic interaction |
5.45×10⁻⁴ |
3 |
| GO:0044116 |
Growth of symbiont involved in interaction with host |
5.45×10⁻⁴ |
3 |
| GO:0070431 |
Nucleotide-binding oligomerization domain containing 2 signaling pathway |
2.36×10⁻⁴ |
3 |
| GO:0050786 |
RAGE receptor binding |
1.38×10⁻⁴ |
3 |
| GO:0002879 |
Positive regulation of acute inflammatory response to non-antigenic stimulus |
9.27×10⁻⁵ |
2 |
| GO:0090063 |
Positive regulation of microtubule nucleation |
5.49×10⁻⁴ |
2 |
| GO:0097013 |
Phagocytic vesicle lumen |
4.71×10⁻⁴ |
2 |
| GO:0002525 |
Acute inflammatory response to non-antigenic stimulus |
2.76×10⁻⁴ |
2 |
| GO:0002877 |
Regulation of acute inflammatory response to non-antigenic stimulus |
2.76×10⁻⁴ |
2 |
| GO:0010286 |
Heat acclimation |
2.76×10⁻⁴ |
2 |
| GO:0070370 |
Cellular heat acclimation |
2.76×10⁻⁴ |
2 |
| GO:0070426 |
Positive regulation of nucleotide-binding oligomerization domain containing signaling pathway |
2.76×10⁻⁴ |
2 |
| GO:0098758 |
Response to interleukin-8 |
2.76×10⁻⁴ |
2 |
| GO:0098759 |
Cellular response to interleukin-8 |
2.76×10⁻⁴ |
2 |
|
Table III.
KEGG pathway analysis of the differentially expressed mRNA transcripts.
|
Table III.
KEGG pathway analysis of the differentially expressed mRNA transcripts.
| KEGG ID |
KEGG pathway |
P-value |
Counta |
| hsa04742 |
Taste transduction |
1.52×10⁻¹⁶ |
16 |
| hsa04080 |
Neuroactive ligand-receptor interaction |
0.000152 |
12 |
| hsa05150 |
Staphylococcus aureus infection |
1.69×10⁻⁵ |
5 |
| hsa05322 |
Systemic lupus erythematosus |
9.05×10⁻⁵ |
5 |
| hsa04915 |
Estrogen signaling pathway |
9.70×10⁻⁵ |
5 |
| hsa05034 |
Alcoholism |
0.000402 |
5 |
| hsa04612 |
Antigen processing and presentation |
0.000138 |
4 |
| hsa03040 |
Spliceosome |
0.001695 |
4 |
| hsa04144 |
Endocytosis |
0.01051 |
4 |
| hsa05134 |
Legionellosis |
0.000964 |
3 |
| hsa04213 |
Longevity regulating pathway-multiple species |
0.001231 |
3 |
| hsa05145 |
Toxoplasmosis |
0.006609 |
3 |
| hsa05162 |
Measles |
0.011934 |
3 |
| hsa00601 |
Glycosphingolipid biosynthesis-lacto and neolacto series |
0.030336 |
2 |
mRNA screening using univariate and LASSO Cox regression analysis
The DEmRNA candidates were further screened using univariate and LASSO Cox regression analysis in order to examine the association between their expression levels and OS. Univariate Cox regression analysis indicated that the expression levels of 46 genes were associated with OS and could represent potential prognostic factors (Table IV). The results are presented as a volcano plot and a bubble diagram based on the z-score and P-value (Fig. 2A and B). As shown in Fig. 42, when lambda.min=0.05461219, there was a minimum of partial likelihood deviation. The final prognostic mRNAs screened using LASSO analysis were presented in Fig. 2C as follows: ACER2 (coefficient was −0.089403751), AQP11 (coefficient was −0.059480539), EBLN2 (coefficient was −0.364833846), FAM124B (coefficient was 0.149939194), FFAR2 (coefficient was 0.041310604), HOXA10 (coefficient was 0.005494029), HPDL (coefficient was 0.169134128), KLHL11 (coefficient was −0.191801822), KRT1 (coefficient was −0.036254336), LY6G6F (coefficient was 0.029249458), MPO (coefficient was −0.081176390), MPV17L (coefficient was 0.058822069), P2RY1 (coefficient was 0.048969293), POU5F2 (coefficient was −0.212188153), SLC45A3 (coefficient was −0.075187165), SPDYE3 (coefficient was −0.153921022), YY2 (coefficient was −0.010861848), ZBTB12 (coefficient was −0.025082532) and ZNF750 (coefficient was −0.033000344).
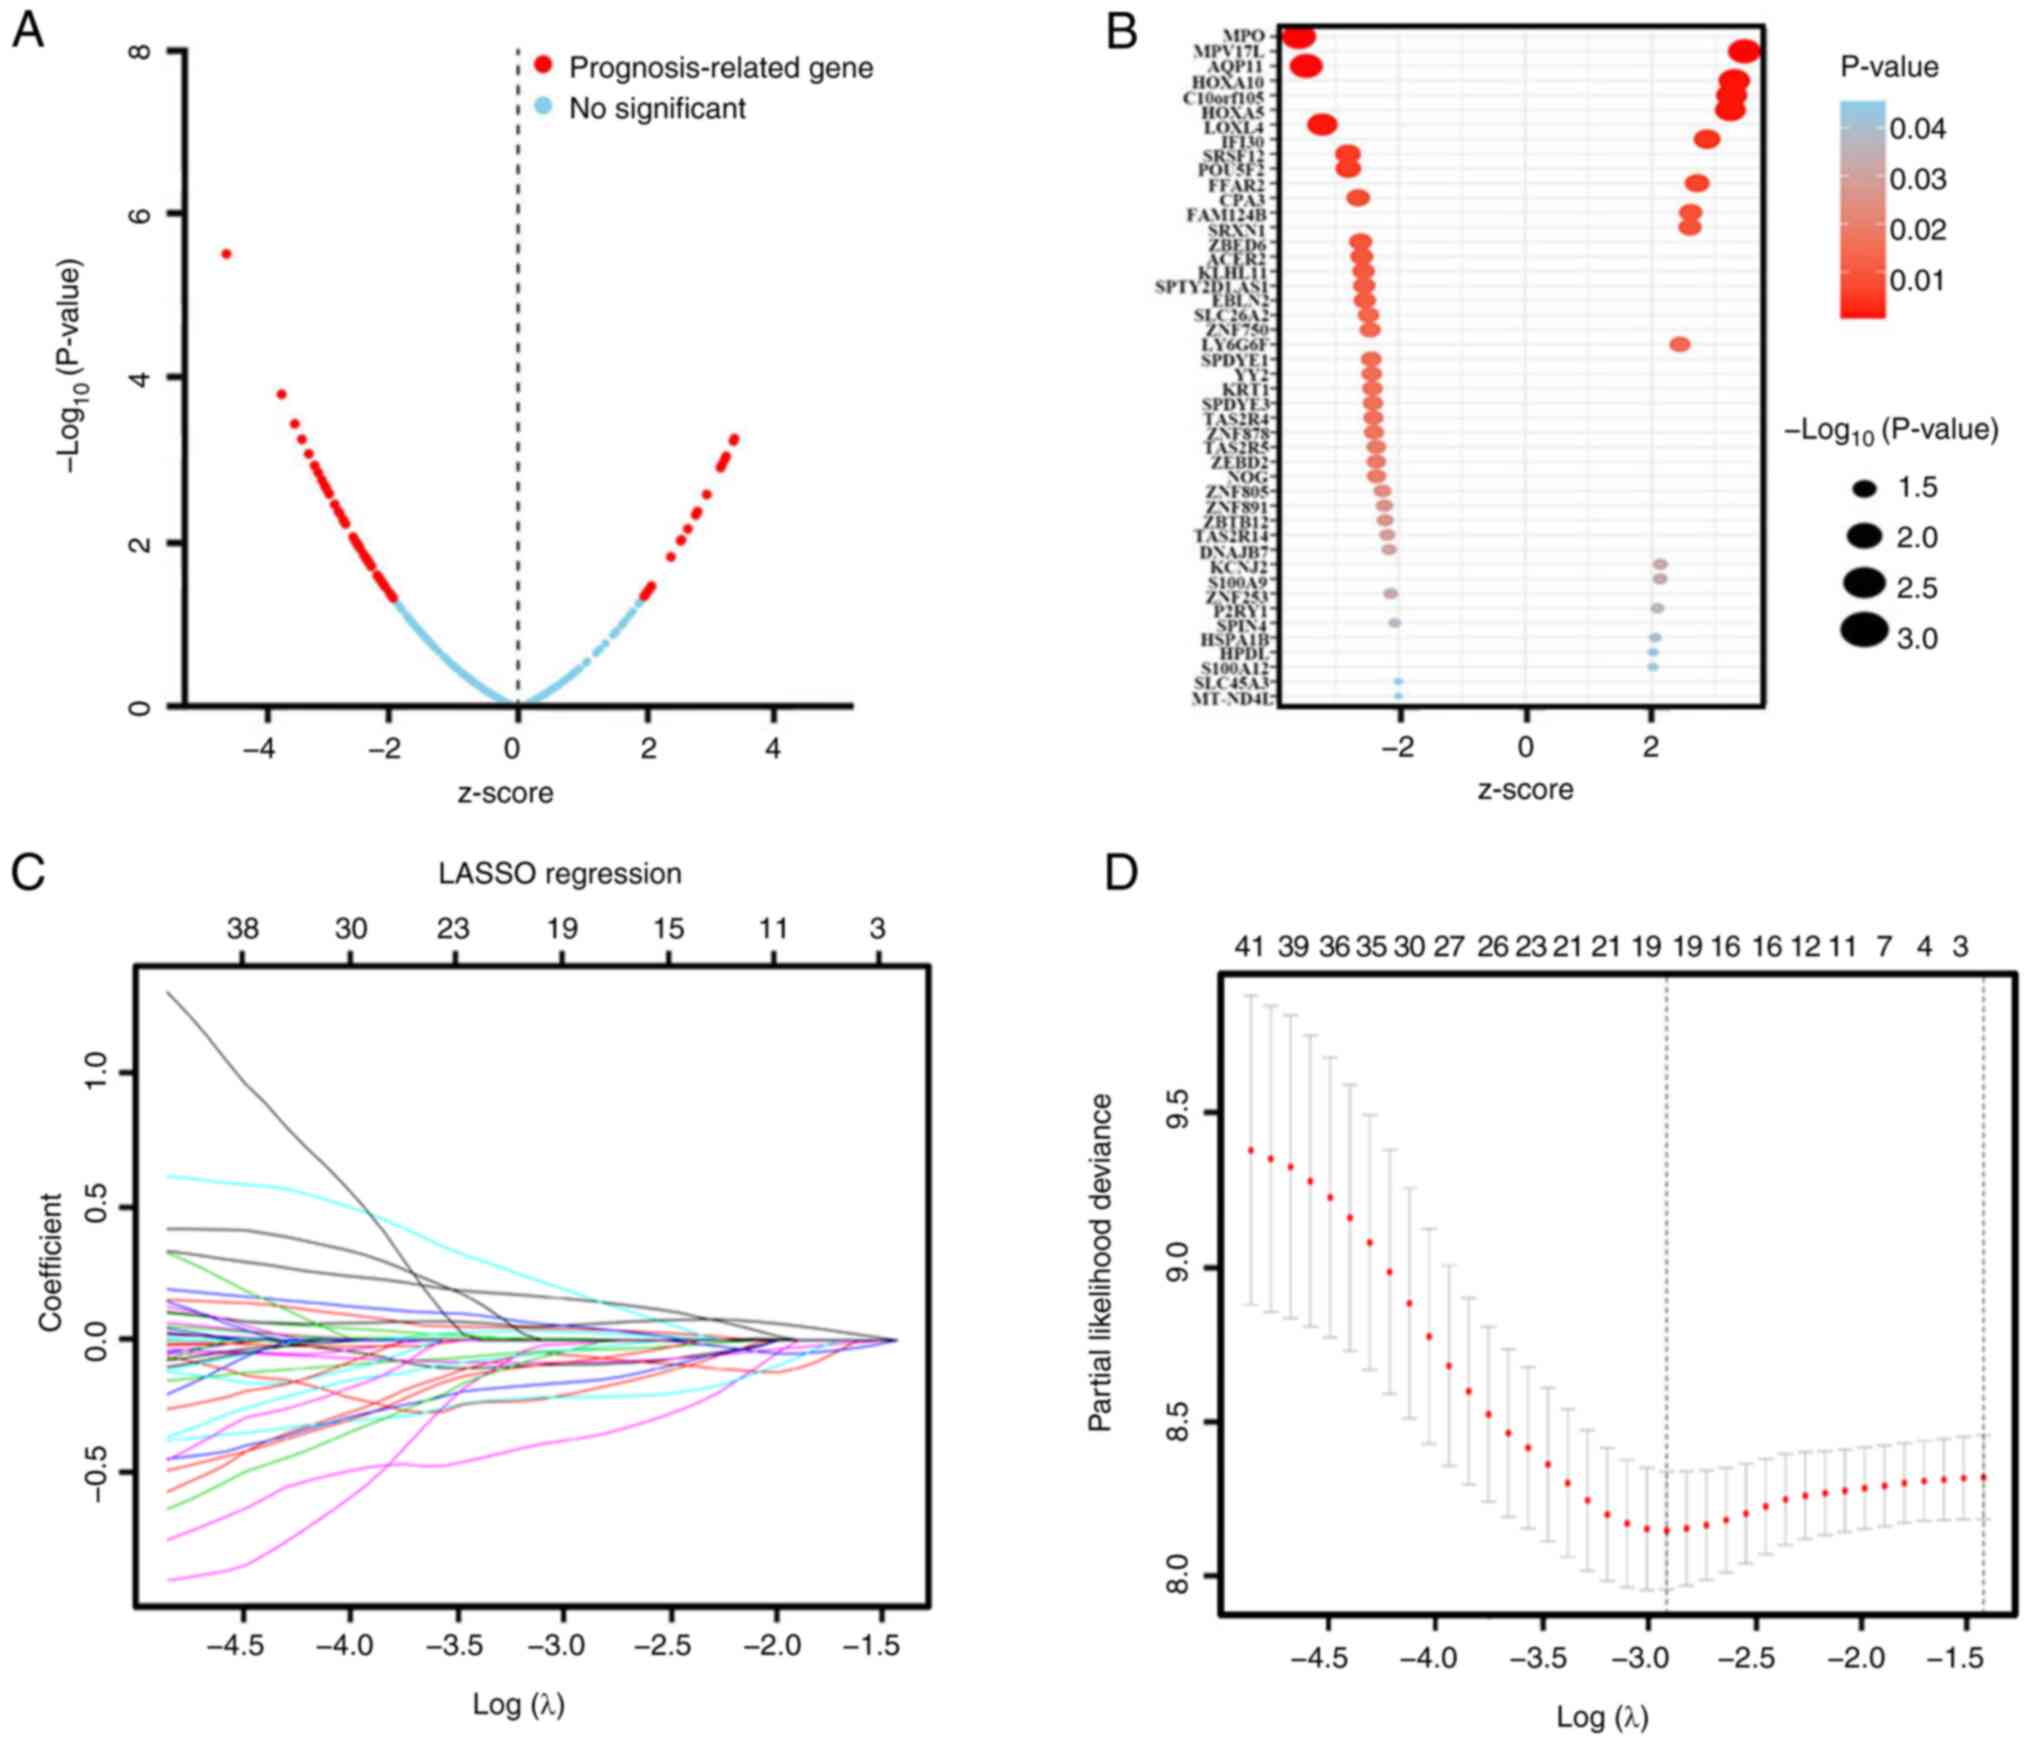 |
Figure 2.
DEmRNAs were further screened through univariate Cox and LASSO regression analysis. (A) Survival-associated DEmRNAs were screened by univariate Cox and visualized by volcanic map. The red dots represent DEmRNA molecules that were significantly correlated with patient survival. The blue dots represent DEmRNA molecules without correlation. A total of 46 mRNA molecules were associated with overall survival. P<0.05; |Z-score|>2. (B) Bubble diagram of the 46 significantly survival-associated DEmRNA molecules. (C) LASSO coefficient profiles of the survival- associated mRNA transcripts. The y-axis represents the partial likelihood deviance and the x-axis represents the log (λ). Numbers along the upper x-axis represent the average number of predictors. Red dots represent average deviance values for different log (λ). Two dashed lines indicate two special λ values, one is λ.min (minimum) and the other is λ.1se (1-standard error). The best log (λ)= −2.91. (D) Dotted vertical lines were drawn at the optimal values using the λ.min. DEmRNA, differentially expressed mRNA; LASSO, least absolute shrinkage and selection operator.
|
|
Table IV.
Univariate factor regression analysis.
|
Table IV.
Univariate factor regression analysis.
| Gene symbol |
Z-score |
HR (95% CI) |
P-value |
| HPDL |
2.020562 |
1.336966 (1.008747–1.771977) |
0.043325 |
| SRXN1 |
2.603306 |
1.322869 (1.071593–1.633067) |
0.009233 |
| C10orf105 |
3.260314 |
1.292048 (1.107599–1.507214) |
0.001113 |
| FAM124B |
2.612856 |
1.274911 (1.062568–1.529687) |
0.008979 |
| P2RY1 |
2.089863 |
1.259619 (1.014453–1.564041) |
0.036631 |
| MPO |
2.57379 |
1.257714 (1.024216–1.589134) |
0.027316 |
| HSPA1B |
2.051886 |
1.238036 (1.009612–1.518140) |
0.040181 |
| MPV17L |
3.46339 |
1.226998 (1.092864–1.377594) |
0.000533 |
| IFI30 |
2.871828 |
1.163941 (1.049384–1.291004) |
0.004081 |
| FFAR2 |
2.715637 |
1.152658 (1.040325–1.277119) |
0.006615 |
| HOXA10 |
3.302104 |
1.124714 (1.048929–1.205975) |
0.000960 |
| HOXA5 |
3.2402 |
1.101344 (1.038877–1.167566) |
0.001194 |
| KCNJ2 |
2.135027 |
1.098921 (1.007765–1.198323) |
0.032759 |
| S100A9 |
2.131387 |
1.080554 (1.006250–1.160344) |
0.033057 |
| S100A12 |
2.017188 |
1.070960 (1.001947–1.144727) |
0.043676 |
| CPA3 |
−2.63684 |
0.897505 (0.828188–0.972623) |
0.008368 |
| NOG |
−2.34828 |
0.891834 (0.810568–0.981248) |
0.018860 |
| KRT1 |
−2.41044 |
0.890778 (0.810823–0.978617) |
0.015933 |
| ZBED2 |
−2.35064 |
0.871339 (0.776811–0.977370) |
0.018741 |
| SLC45A3 |
−2.00193 |
0.842103 (0.711697–0.996404) |
0.045293 |
| SPIN4 |
−2.06124 |
0.800266 (0.647476–0.989112) |
0.039280 |
| TAS2R4 |
−2.39681 |
0.779280 (0.635518–0.955564) |
0.016538 |
| ZNF253 |
−2.12396 |
0.765366 (0.598006–0.979565) |
0.033673 |
| LOXL4 |
−3.2022 |
0.760204 (0.642764–0.899102) |
0.001364 |
| TAS2R5 |
−2.35111 |
0.749635 (0.589550–0.953190) |
0.018718 |
| SRSF12 |
−2.79951 |
0.722048 (0.574840–0.906954) |
0.005118 |
| ZNF750 |
−2.44682 |
0.719873 (0.553241–0.936694) |
0.014412 |
| ACER2 |
−2.57922 |
0.716421 (0.556045–0.923053) |
0.009902 |
| ZNF878 |
−2.38729 |
0.715298 (0.543277–0.941788) |
0.016973 |
| MT-ND4L |
−2.00006 |
0.699167 (0.492354–0.992852) |
0.045494 |
| ZNF891 |
−2.22299 |
0.696751 (0.506667–0.958149) |
0.026217 |
| SLC26A2 |
−2.47371 |
0.693930 (0.519502–0.926924) |
0.013372 |
| POU5F2 |
−2.79357 |
0.691119 (0.533314–0.895617) |
0.005213 |
| ZBTB12 |
−2.21169 |
0.682746 (0.486836–0.957494) |
0.026988 |
| DNAJB7 |
−2.14893 |
0.668002 (0.462342–0.965143) |
0.031640 |
| SPTY2D1AS1 |
−2.54099 |
0.662182 (0.481826–0.910049) |
0.011054 |
| TAS2R14 |
−2.17785 |
0.648317 (0.438939–0.957568) |
0.029417 |
| SPDYE1 |
−2.42966 |
0.635537 (0.440898–0.916102) |
0.015113 |
| SPDYE3 |
−2.40341 |
0.629404 (0.431478–0.918123) |
0.016243 |
| KLHL11 |
−2.55082 |
0.626862 (0.437850–0.897466) |
0.010747 |
| ZNF805 |
−2.25392 |
0.616572 (0.404909–0.938879) |
0.024201 |
| YY2 |
−2.42275 |
0.599926 (0.396810–0.907012) |
0.015404 |
| AQP11 |
−3.45816 |
0.531384 (0.371347–0.760392) |
0.000544 |
| EBLN2 |
−2.53238 |
0.463530 (0.255644–0.840467) |
0.011329 |
Analysis of mRNA transcripts associated with OS and risk stratification
A total of 4 mRNA molecules (FAM124B, HPDL, MPO and P2RY1) were identified as statistically significant using multivariate Cox regression analysis (Table V). In TCGA data, the expression levels of FAM124B, HPDL, MPO and P2RY1 were significantly upregulated in AML compared with normal samples (Fig. 3A). Moreover, the 4 mRNA candidates were associated with OS (FAM124B, P=0.019; HPDL, P=0.023; MPO, P=0.0091; P2RY1, P=0.021; Fig. 3B). The corresponding area under the curve (AUC) in the ROC analysis was 0.69, 0.68, 0.71 and 0.72, indicating that the survival model had moderate sensitivity and specificity (Fig. 3C). Based on the expression levels of FAM124B, HPDL, MPO and P2RY1 and the correlation coefficient in the multivariate Cox regression analysis, a risk factor prediction linear model was constructed as: Risk score=(0.1814 × exp FAM124B) + (0.3634 × exp HPDL) + (0.2312 × exp MPO) + (0.342 × exp P2RY1). The patients were then divided into high- and low-risk groups using the median risk factor as a cutoff point (n=66/group). The risk score of the high-risk group was 9.35±9.51-fold greater than that of the low-risk group (P<0.001; Fig. 4A). As shown in Fig. 4B, the survival time in patients with AML decreased with increasing risk score (Fig. 4B). There was a significant difference in OS between the high- and low-risk groups (log-rank P<0.001). The area under the curve (AUC) in the ROC analysis was 0.851, indicating that the risk score model had high sensitivity and specificity (Fig. 4C). An independent RNA sequencing dataset from the GEO database (accession no. GSE12417) was used to validate the model. According to the risk factor prediction linear model, the samples were divided into high- and low-risk groups. As shown in Fig. 4D. The OS time of the low-risk group was longer than that of high-risk group (P<0.001; AUC=0.759). A nomogram was then generated for the prognostic scoring system. Patients with lower risk scores had a higher survival time, which confirmed that the prognostic score could predict the survival rate (Fig. 4E).
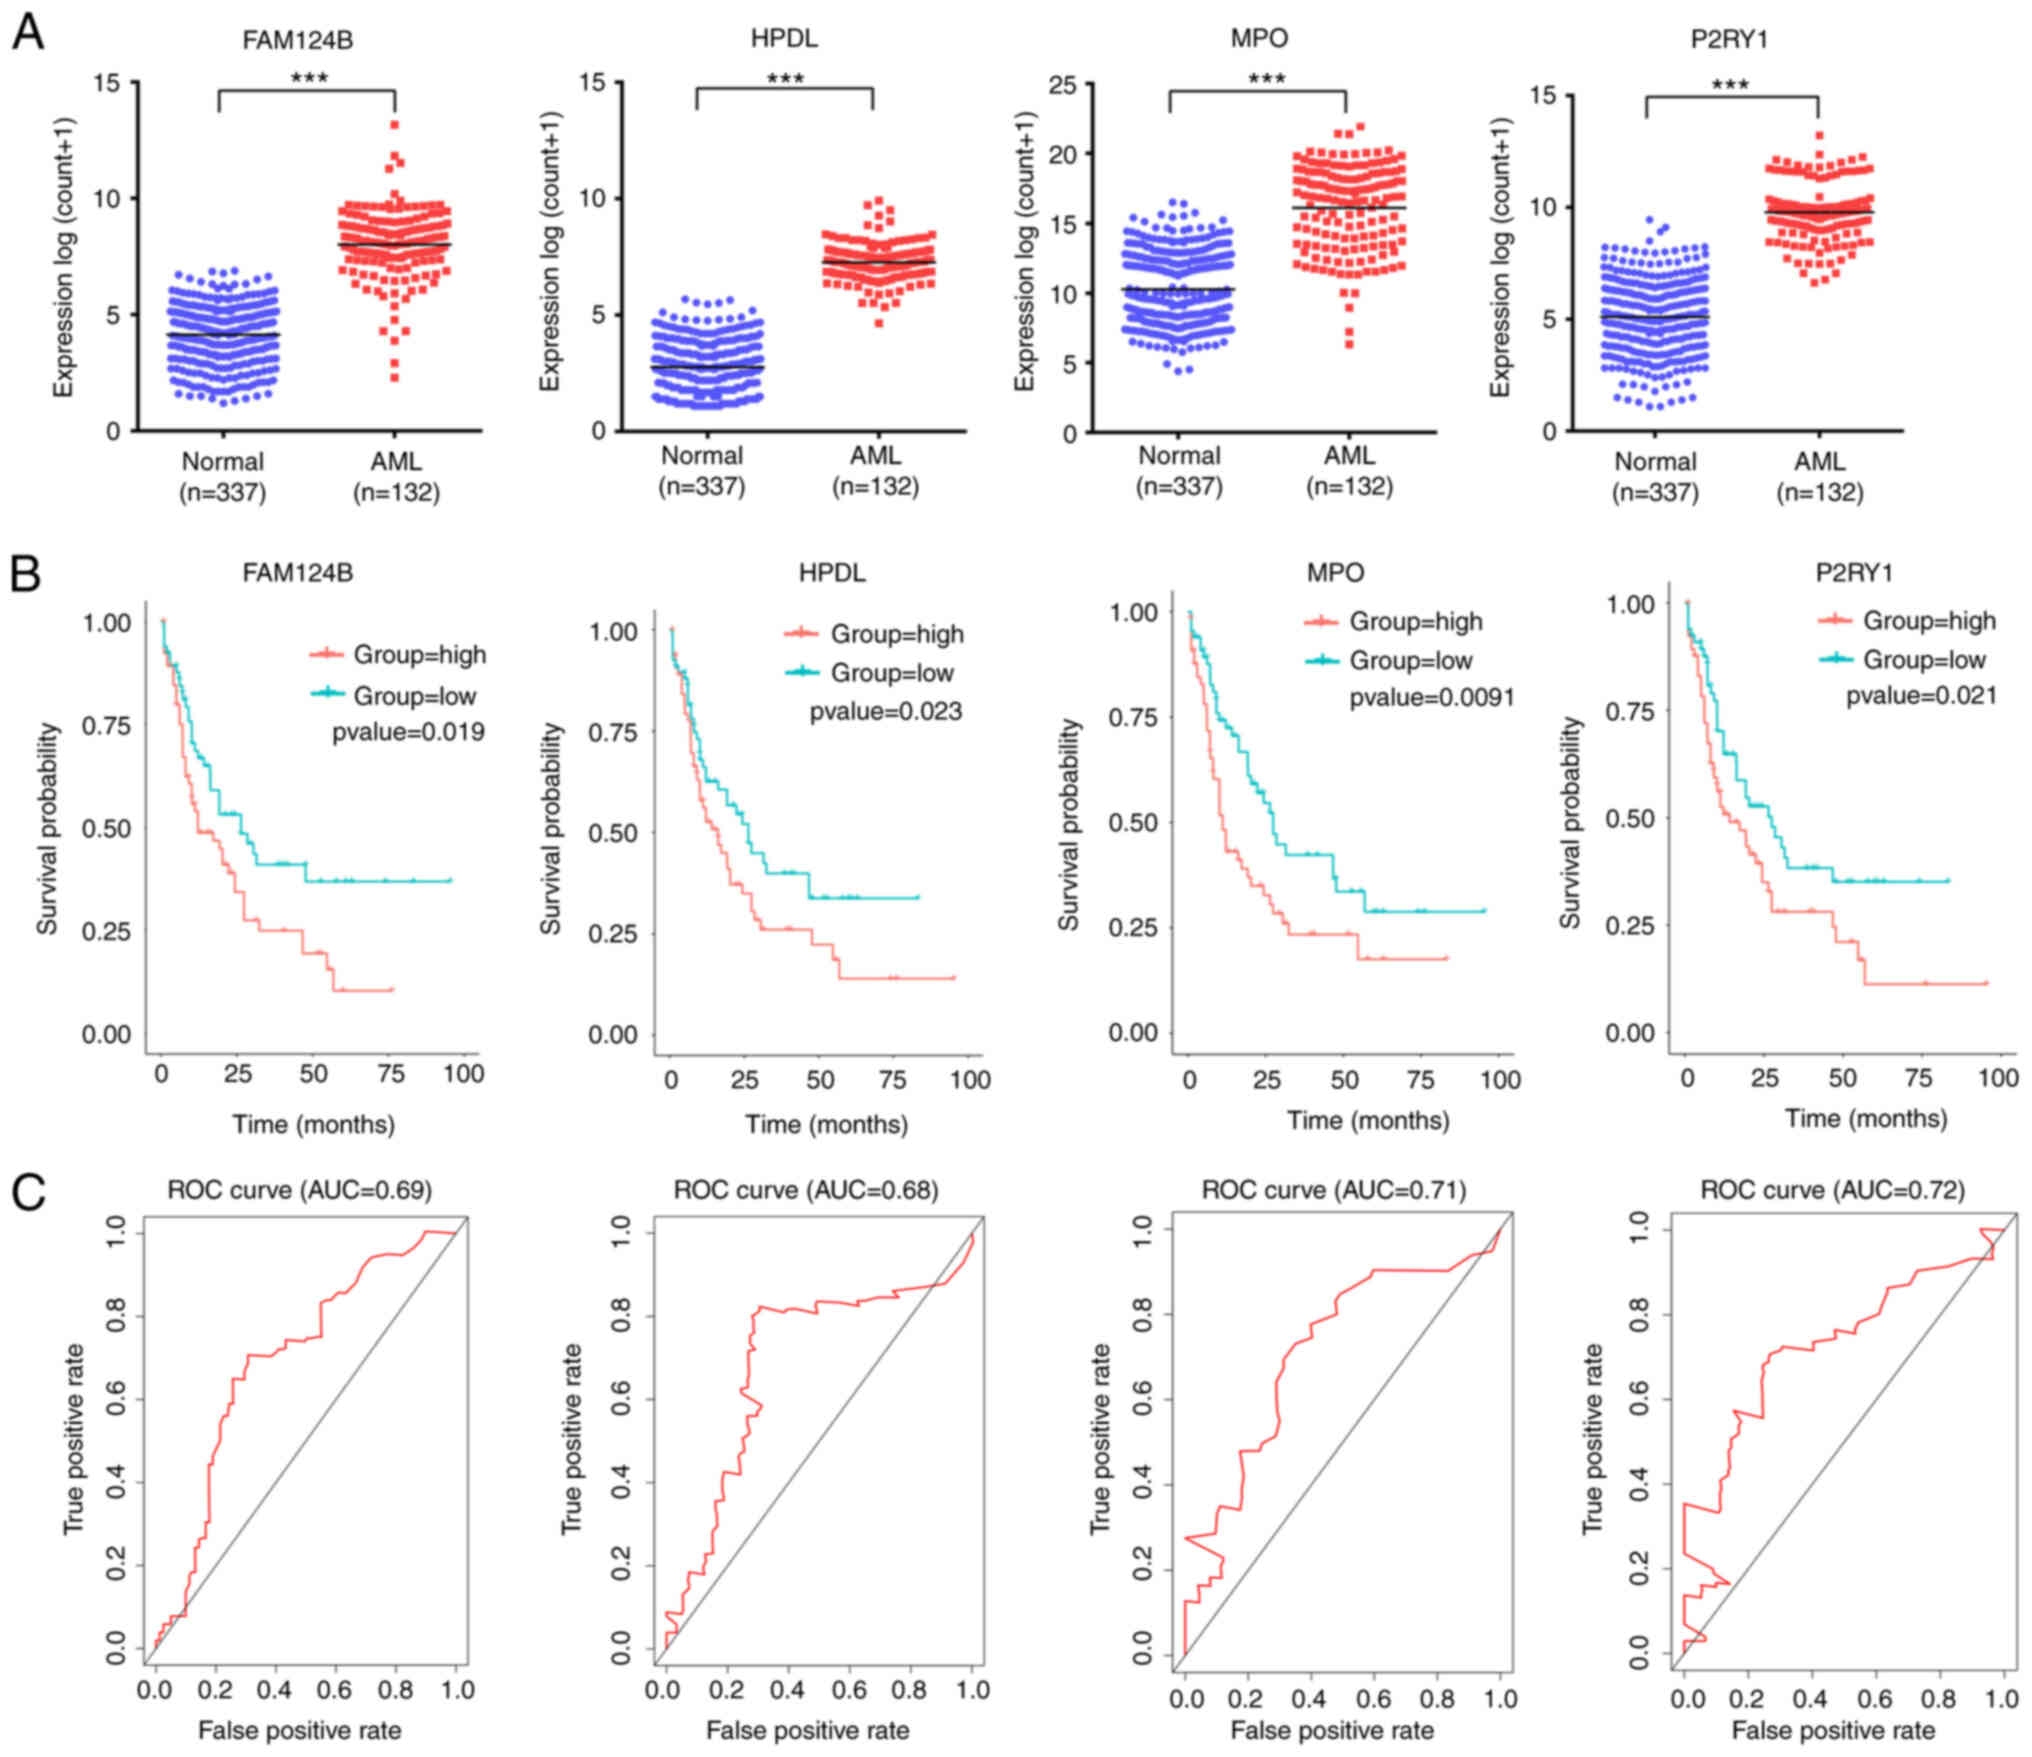 |
Figure 3.
FAM124B, HPDL, MPO and P2RY1 were upregulated in AML and significantly associated with survival. (A) FAM124B, HPDL, MPO and P2RY1 were upregulated in AML blood (The Cancer Genome Atlas dataset). ***P<0.001. (B) Kaplan-Meier survival curves of patients with AML stratified according to FAM124B, HPDL, MPO and P2RY1 expression. (C) ROC curves with AUCs for FAM124B, HPDL, MPO and P2RY1 expression in patients with AML. AML, acute myeloid leukemia; DEmRNA, differentially expressed mRNA; ROC, receiver operating characteristic; AUC, area under the curve; FAM124B, family with sequence similarity 124 member B; HPDL, 4-hydroxyphenylpyruvate dioxygenase-like protein; MPO, myeloperoxidase; P2RY1, purinergic receptor P2Y1.
|
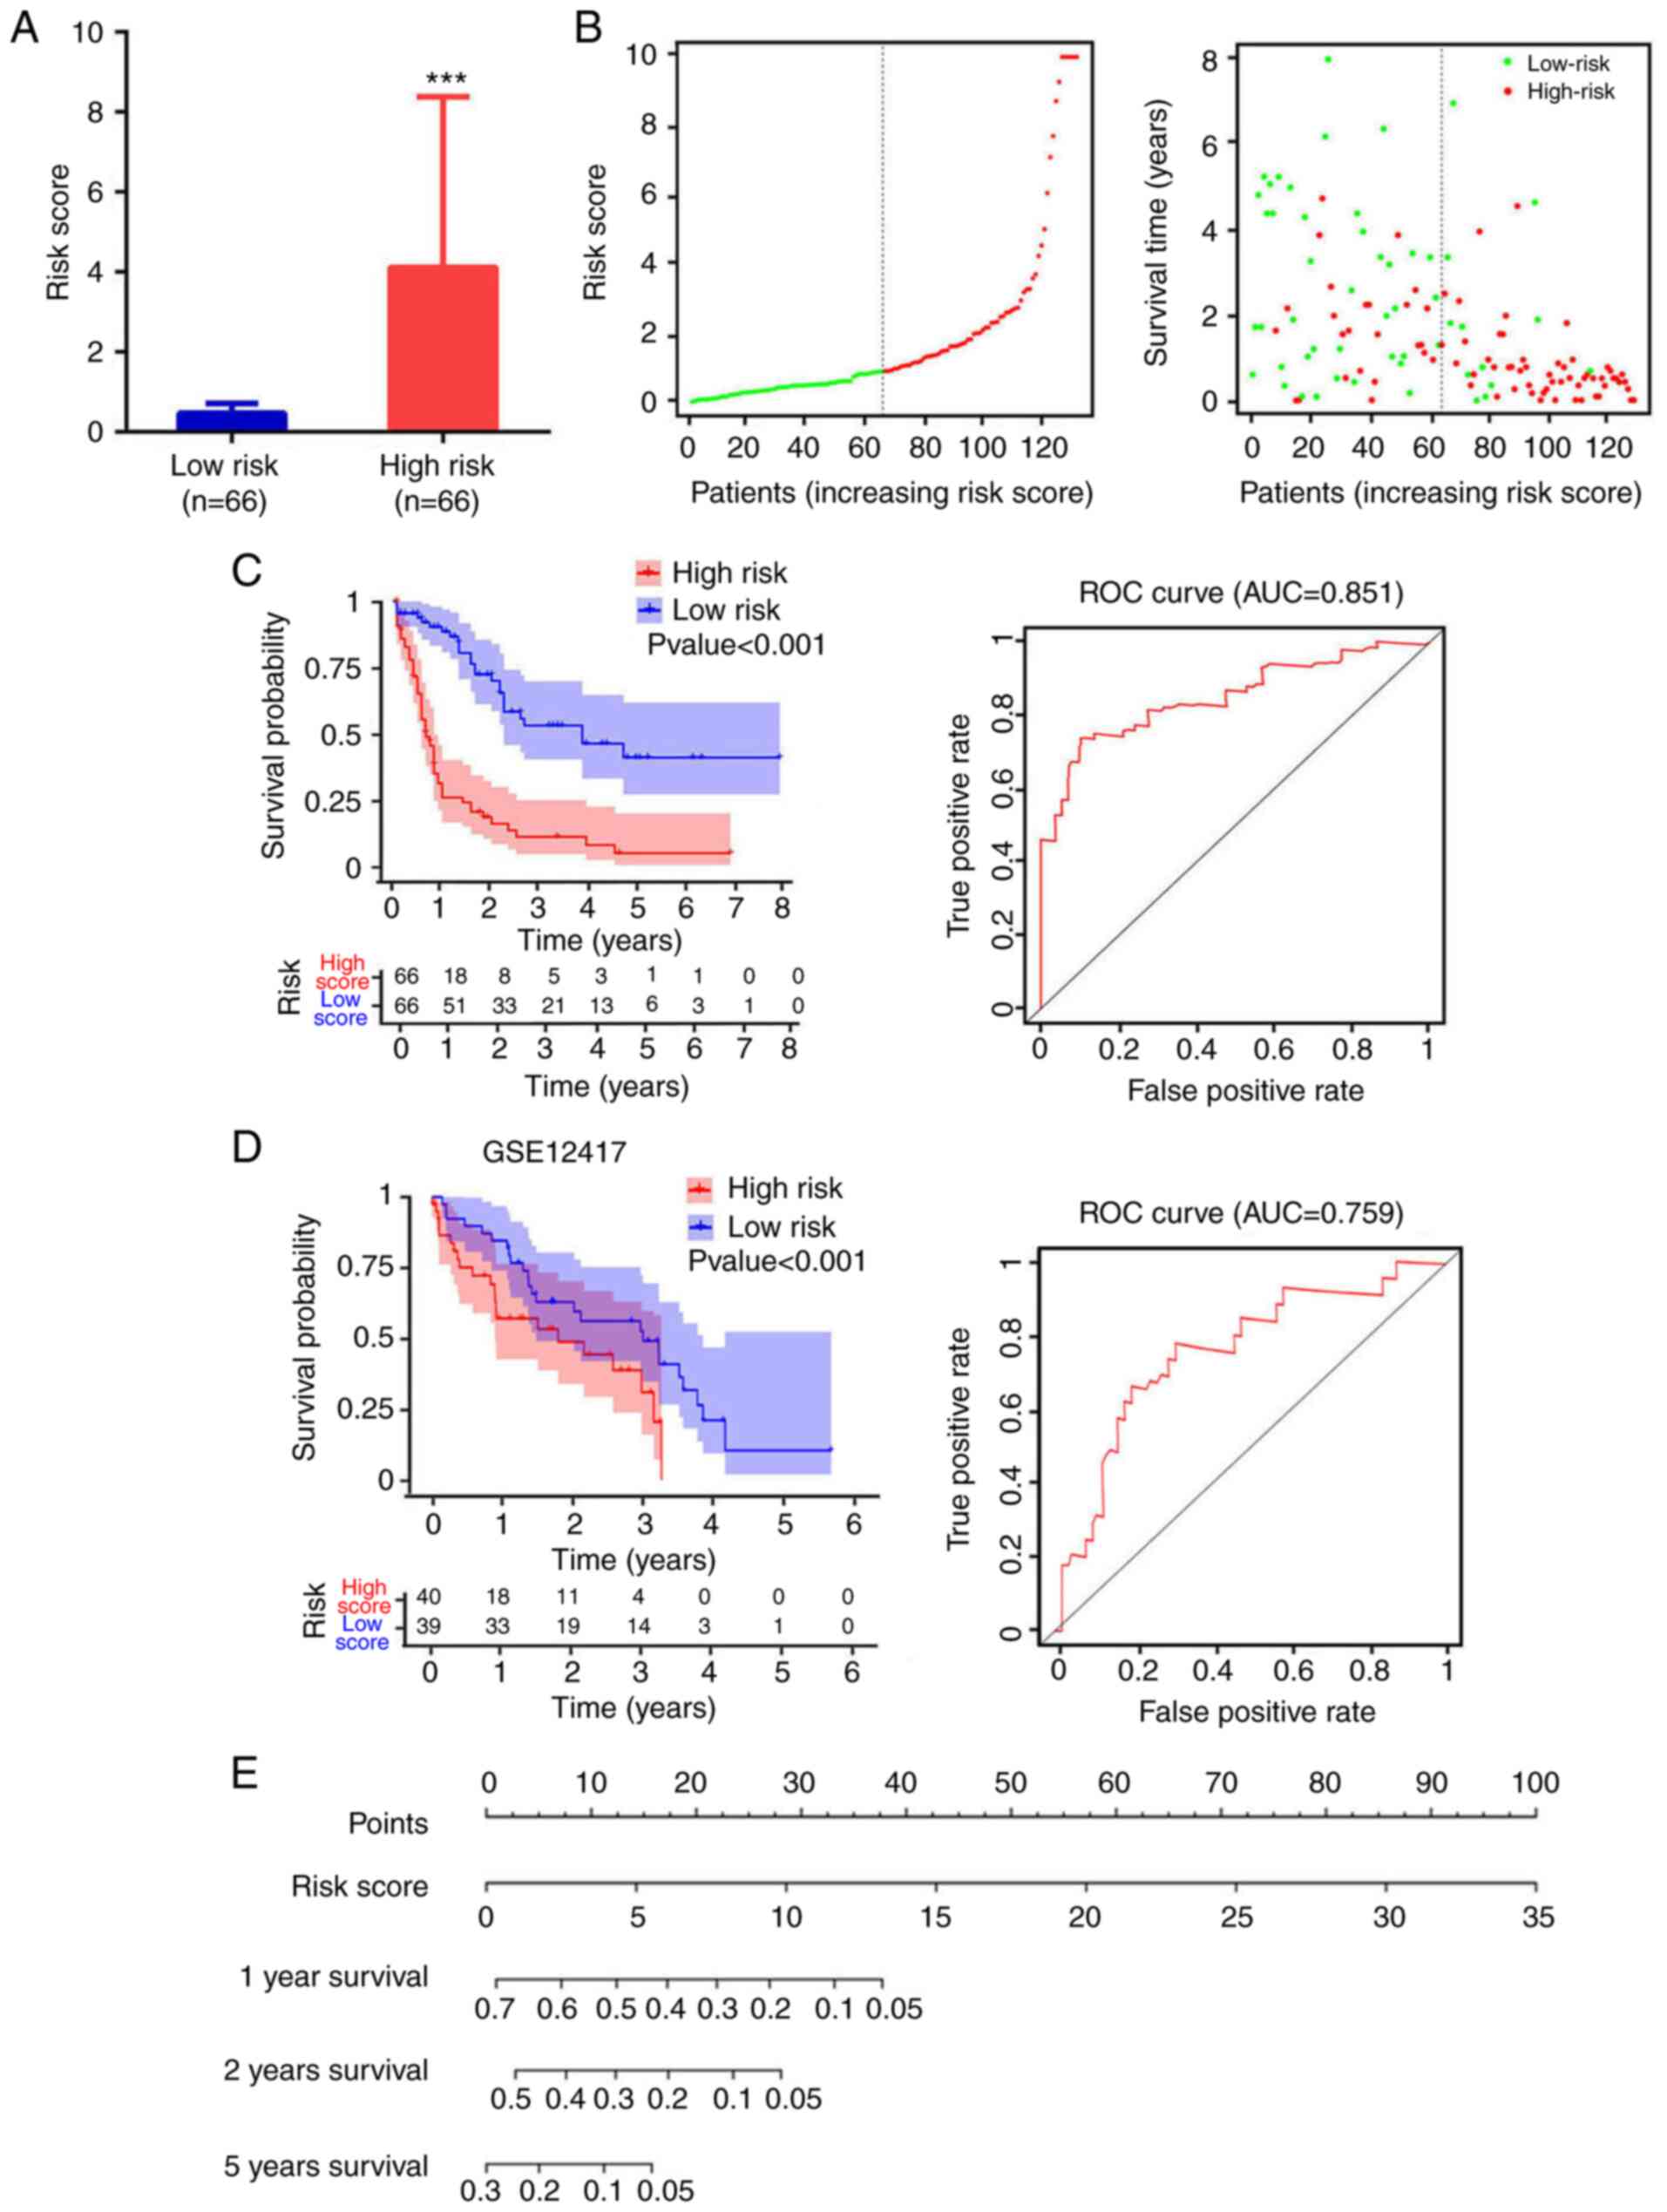 |
Figure 4.
Analysis of risk score distribution and survival time using a prediction model based on four mRNA molecules. (A) Number of low-risk or high-risk patients (left). Risk score of low- or high-risk patients (right). ***P<0.001. (B) Distribution of the risk score (left). Patient survival time and risk score (right). The black dotted line represents the optimum cut-off point dividing patients into low- and high-risk groups. (C) Kaplan-Meier curves for high- and low-risk groups in TCGA data (left). ROC curves with AUCs for overall survival constructed with high- and low-risk groups (right). (D) Kaplan-Meier curves for high- and low-risk groups in GSE12417 (left). Low-risk group, n=40; high-risk group, n=39. ROC curves with AUCs for overall survival in the high- and low-risk groups (right). (E) Nomogram-based risk scores from TCGA data. Nomogram predicted the 1-year, 2-year and 5-year OS for AML patients. The nomogram summed the points identified on the scale for risk scores in different AML patients. The points projected on the bottom scales indicate the probabilities of 1-year, 2-year and 5-year OS for AML patients. ROC, receiver operating characteristic; AUC, area under the curve; TCGA, The Cancer Genome Atlas.
|
|
Table V.
Multivariate Cox regression analysis.
|
Table V.
Multivariate Cox regression analysis.
| Gene symbol |
Coefficient |
HR (95% CI) |
P-value |
| FAM124B |
0.181431 |
1.298932 (1.154716–1.305619) |
0.018476 |
| HPDL |
0.363443 |
1.438273 (1.055875–1.959161) |
0.021181 |
| MPO |
0.231234 |
1.312346 (1.124210–1.514532) |
0.023234 |
| P2RY1 |
0.342021 |
1.407790 (1.058439–1.872449) |
0.012327 |
Estimation of infiltrating cell distribution using stromal and immune scores
The infiltrating cell distributions and composition of the tumor samples were estimated using the ESTIMATE algorithm. A ‘stromal score’ was designed to estimate the presence of stromal cells in tumor samples and an ‘immune score’ was designed to estimate the infiltration of immune cells in tumor samples. The estimate score was the sum of stromal score and immune score. The patients were divided into high and low stromal, immune or estimate score groups using the median of each score as cut-off. There was a significant difference in score between the high-score and the low-score groups (P<0.001 in all three cases, Fig. 5A). As shown in Fig. 5B, the low-score groups were associated with significantly higher OS than the high-score groups (P=0.046, P=0.021 and P=0.008 for stromal, immune and estimate scores, respectively). The AUCs in the ROC analysis were 0.541, 0.726 and 0.674, for the stromal, immune and estimate scores, respectively, indicating that the survival model had low to moderate sensitivity and specificity. The relationship between the expression of the four aforementioned mRNA candidates (FAM124B, HPDL, MPO and P2RY1) and the stromal, immune and estimate scores was then evaluated. The mRNA expression of HPDL in the low-stromal-score group represented 93.25±13.21% (P<0.001) of that in the high-stromal-score group (Fig. 5C). For the immune scores, the mRNA expression of HPDL and MPO in the low-immune-score group was equivalent to 93.94±13.76% (P<0.001) and 94.59±25.2% (P<0.05) of that in the respective high-immune score groups (Fig. 5D). Moreover, HPDL and MPO mRNA expression levels in the low-estimate-score group represented 93.58±13.76% (P<0.001) and 94.59±25.2% (P<0.05) of those in the respective high-estimate-score group (Fig. 5E). Altogether, these results indicated that the OS time of patients with AML was associated with stromal, estimate and immune scores. Patients with low scores experienced longer OS time. Moreover, the mRNA expression of HPDL and MPO in the high-immune or estimate score group was higher than that in the low-immune or estimate score group. This suggests that of HPDL and MPO expression is associated with the purity of AML cells.
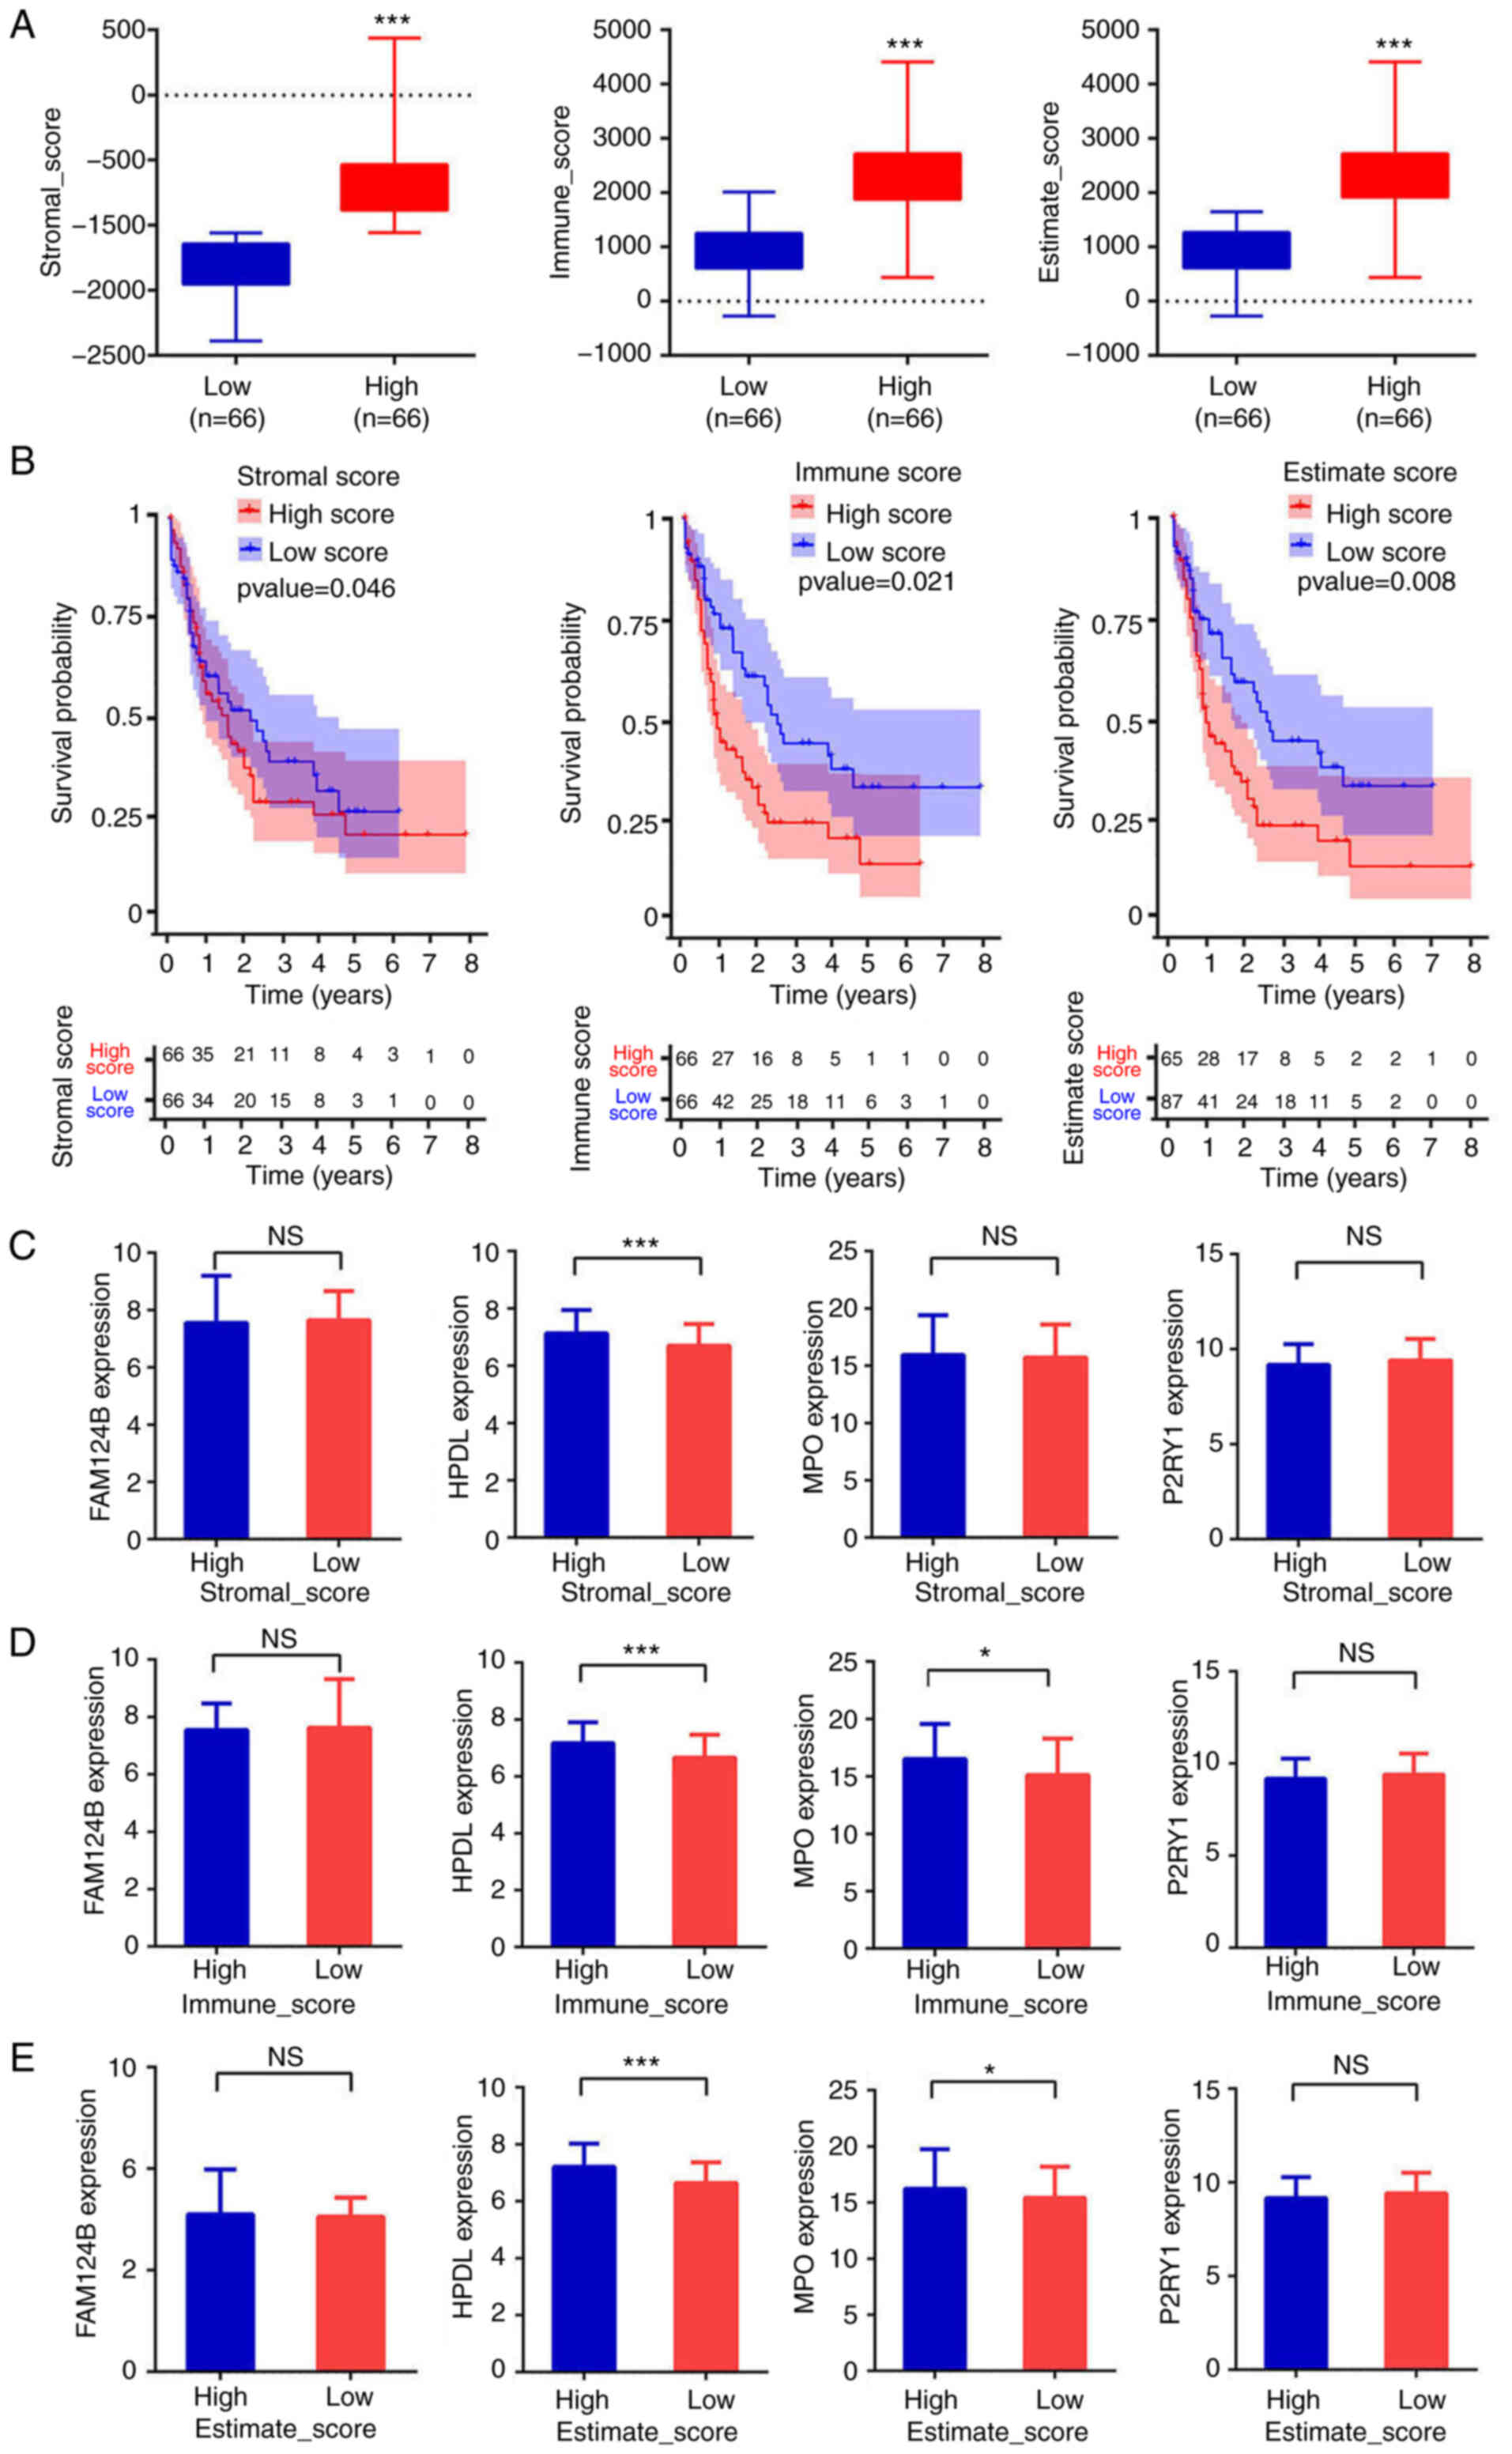 |
Figure 5.
Estimation of infiltrating cells and stromal and immune scores. (A) Patients were divided into high- or low-score groups according to stromal, immune or estimate score. ***P<0.001. (B) Kaplan-Meier curves for high- and low-risk groups. (C-E) Expression of FAM124B, HPDL, MPO and P2RY1 between the high score groups and low score groups according to stromal, immune or estimate scores. ***P<0.001, *P<0.05. FAM124B, family with sequence similarity 124 member B; HPDL, 4-hydroxyphenylpyruvate dioxygenase-like protein; MPO, myeloperoxidase; P2RY1, purinergic receptor P2Y1; NS, not significant.
|
Validation of dysregulated mRNA using RT-qPCR
To validate the bioinformatics analysis results, RT-qPCR was used to detect the expression levels of FAM124B, HPDL, MPO and P2RY1 in clinical AML samples and healthy controls. Clinical information is shown in Tables VI and SII. As shown in Fig. 6A, the mRNA expression of FAM124B, HPDL, MPO and P2RY1 was significantly upregulated in AML compared with normal samples (P<0.001 in all cases). This was also the case at the protein level (Fig. 6B). The mRNA expression levels of FAM124B, HPDL, MPO and P2RY1 were also examined in the TK6, OCI-AML2 and MOLM-13 cell lines. As shown in Fig. 6C, the mRNA expression of FAM124B, HPDL, MPO and P2RY1 was significantly upregulated in OCI-AML2 and MOLM-13 cells compared with that of TK6 cells. The relative quantitative expression (Δcq) of FAM124B, HPDL, MPO and P2RY1 was detected in peripheral blood of 20 AML patients. The corresponding Δcq value was substituted into the Risk Factor Prediction Linear model to calculate the risk value of each sample. According to the risk value, patients with AML were divided into high-risk and low-risk groups according to the median (cutoff point=8.41). As shown in Fig. 6D, the ΔCq values of the four mRNA candidates in the high-risk group were lower than that of the low-risk group (P<0.05).
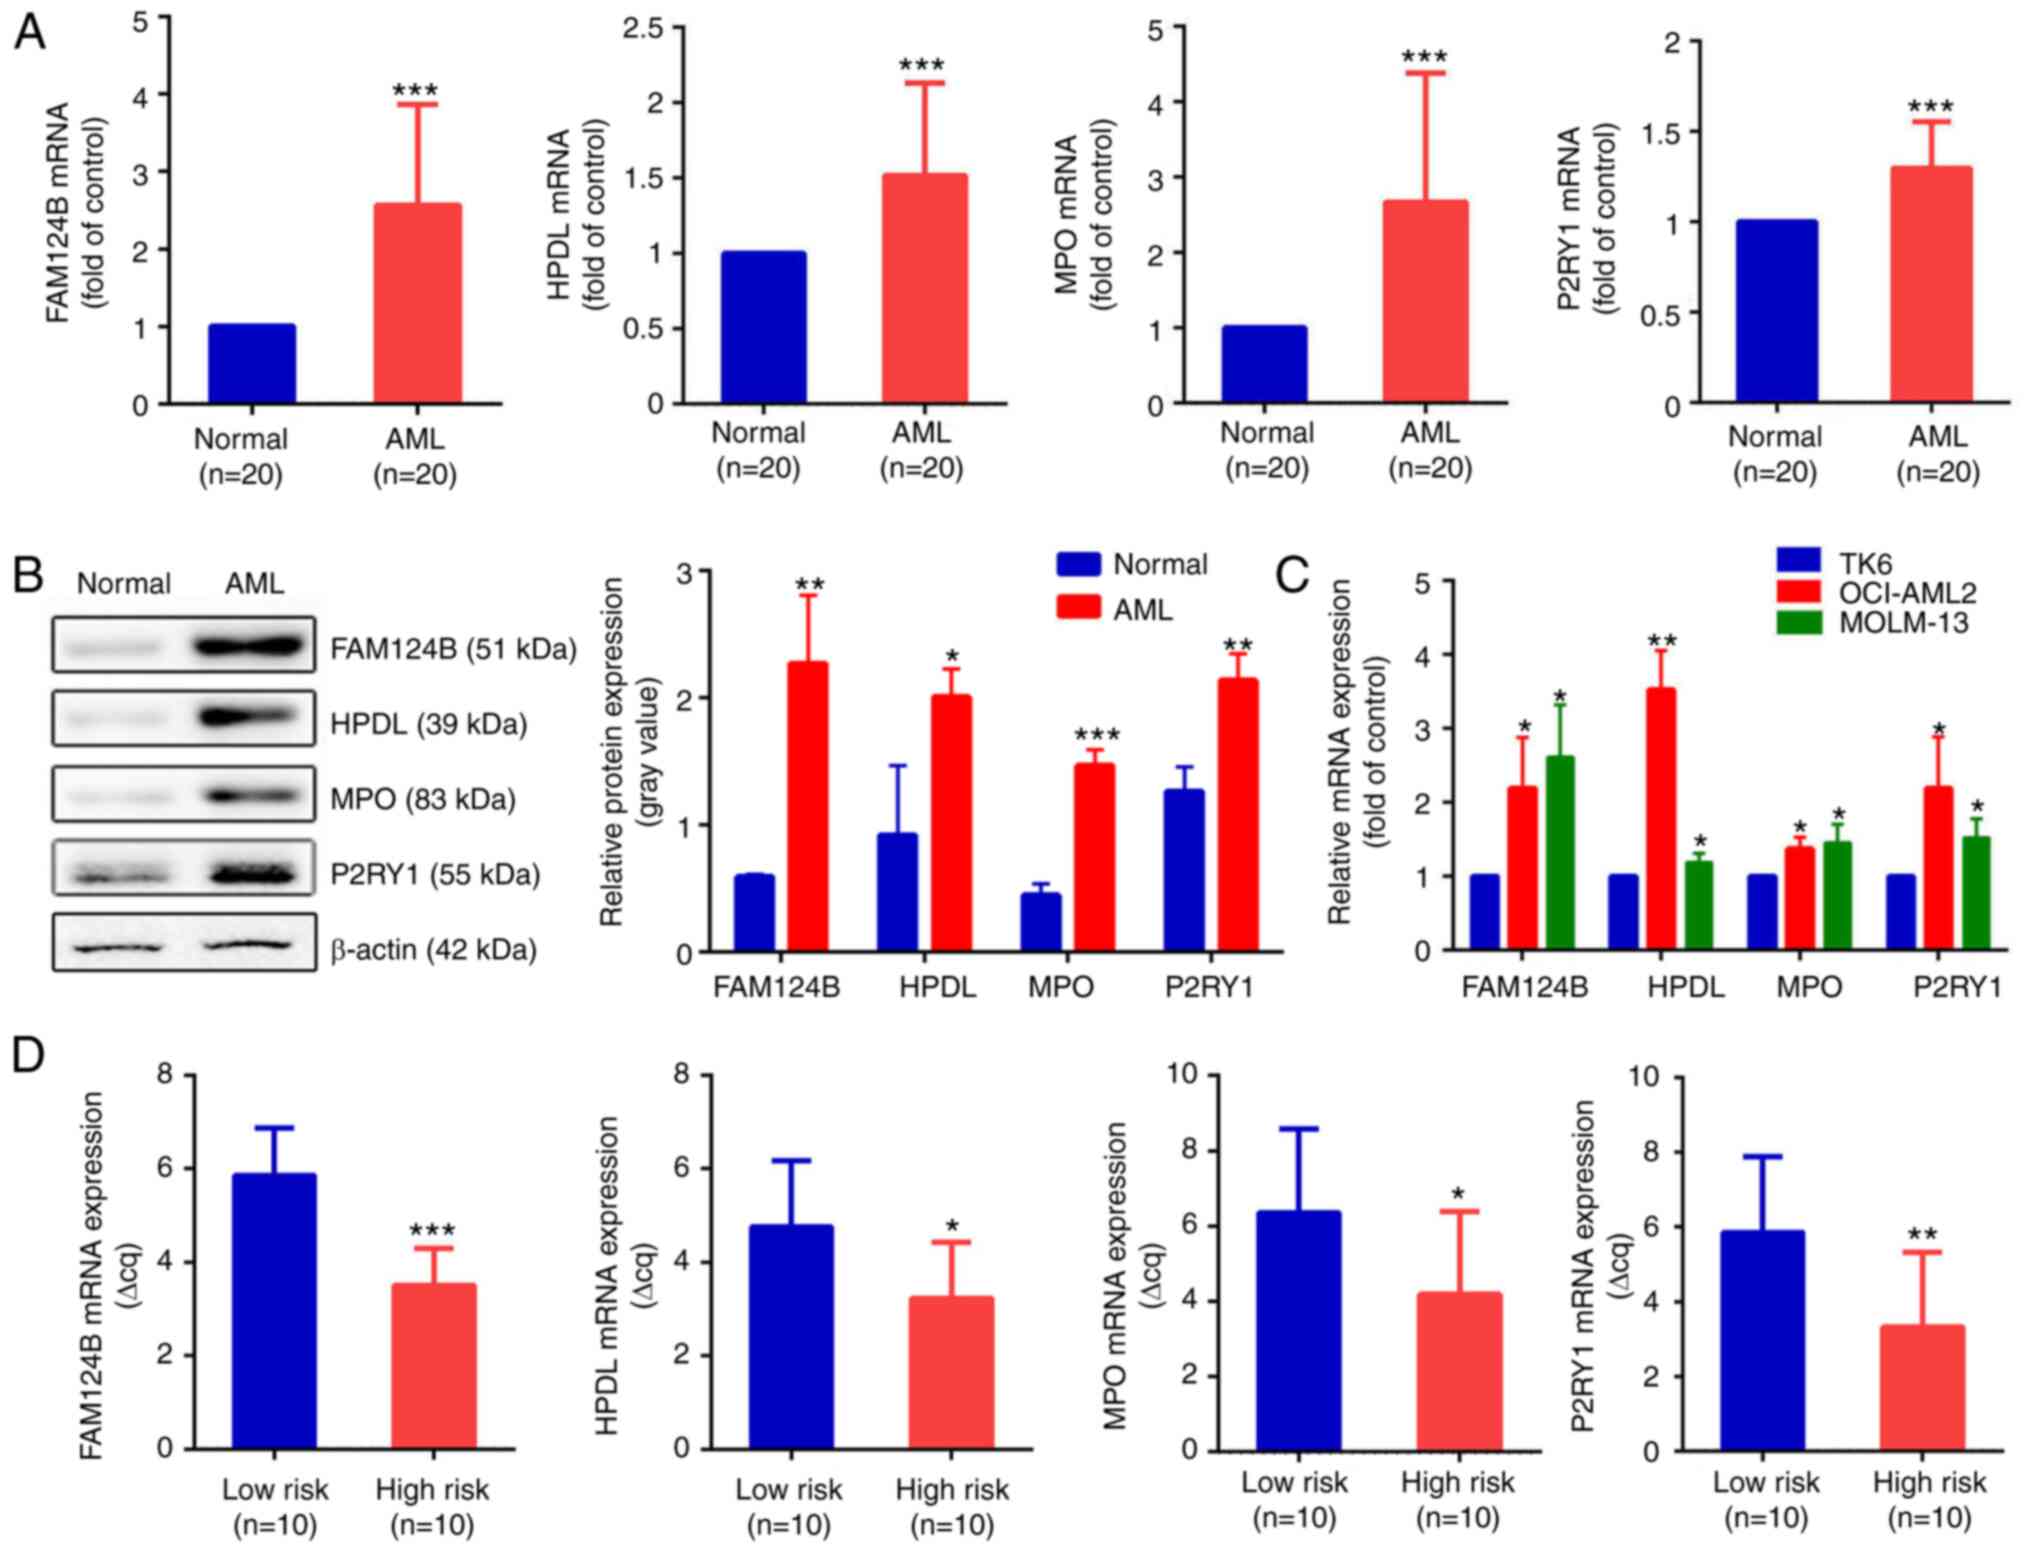 |
Figure 6.
Validation of dysregulated mRNA transcripts in AML. (A) mRNA expression of FAM124B, HPDL, MPO and P2RY1 in the healthy control and the AML groups. ***P<0.001. (B) Protein expression levels of FAM124B, HPDL, MPO and P2RY1 in the healthy control and the AML groups (left). The relative protein expression levels are shown as a gray values normalized to β-actin (right). *P<0.05, **P<0.01, ***P<0.001. (C) Relative mRNA expression of FAM124B, HPDL, MPO and P2RY1 in the TK6, MOLM-13 and OCI-AML2 cell lines. *P<0.05, **P<0.01 vs. TK6 cells. (D) Relative mRNA expression of FAM124B, HPDL, MPO and P2RY1 in the low- and high-risk groups. *P<0.05, **P<0.01, ***P<0.001. ΔCq values were normalized to GAPDH. FAM124B, family with sequence similarity 124 member B; HPDL, 4-hydroxyphenylpyruvate dioxygenase-like protein; MPO, myeloperoxidase; P2RY1, purinergic receptor P2Y1; Cq, quantification cycle.
|
|
Table VI.
Clinical features of collected tissue samples from patients with acute myeloid leukemia.
|
Table VI.
Clinical features of collected tissue samples from patients with acute myeloid leukemia.
| Clinical characteristics |
Values |
| Age, years |
|
| Median |
41 |
| Mean |
41.8 |
| Range |
8-79 |
| Sex, n |
|
| Female |
10 |
| Male |
10 |
| FAB classification, n |
|
| M0 |
1 |
| M1 |
2 |
| M2 |
3 |
| M3 |
4 |
| M4 |
4 |
| M5 |
3 |
| M6 |
2 |
| M7 |
1 |
| White blood cell count, ×109/l |
|
| Median |
38.3 |
| Mean |
50.4 |
| Range |
1-230 |
| Hemoglobin, g/l, n |
|
| <80 |
14 |
| ≥80 |
6 |
| Platelet, ×109/l, n |
|
| <50 |
16 |
| ≥50 |
4 |
| Ratio of bone marrow blasts |
|
| <60% |
9 |
| ≥60% |
11 |
Discussion
Acute myeloid leukemia (AML) is a hematological malignancy characterized by high heterogeneity of clinical cytogenetics and molecules, with an incidence rate of 3.7/100,000 person-years (24). Clinical manifestations of AML include fever, hemorrhage, anemia and enlargement of lymph nodes, liver and spleen. In addition, abnormal proliferation of leukemic cells also has corresponding manifestations of organ and tissue infiltration (25–27). Currently, it is generally thought that the biological characteristics of AML are caused and determined by genetic abnormalities (28). At present, different karyotypes have been found in over one-half of patients with AML using cytogenetic detection methods, which serve a guiding role when evaluating the risk of AML recurrence (29). In addition to cytogenetic differences, molecular factors also affect the prognosis of AML. In recent years, great progress has been made in the search for prognostic markers at the genetic level for restratification of AML (30,31). Screening of novel molecular markers, such as gene mutations/abnormal gene expression, has further improved our understanding of the pathogenesis of AML and refined the prognostic risk grading of AML.
In the present study, an mRNA-based risk score was developed in order to predict the prognosis of patients AML with sample-matched mRNA expression profiles. DEmRNA transcripts in normal blood and AML blood were first identified. Among these, prognosis-associated signature mRNA candidates were screened using univariate Cox regression and LASSO Cox regression. A total of four mRNA candidates (FAM124B, HPDL, MPO and P2RY1) associated with the prognosis of AML were identified. Multivariate Cox regression analysis of these four candidates was used to construct a prognostic scoring system. Moreover, the expression of HPDL and MPO was lower in samples with low immunity and stromal scores. Lastly, the differences in mRNA expression of these potential markers were analyzed in clinical AML blood samples and healthy controls.
The prognostic value of the four protective genes (FAM124B, HPDL, MPO and P2RY1) expressed in AML has not been identified in previous studies. FAM124B is a protein-coding gene. Li et al (32) revealed that FAM124B has a higher DNA methylation level in ER+/PR+ breast cancer compared with ER-/PR-breast cancers. HPDL is an iron-dependent dioxygenase involved in tyrosine catabolism (33). Ye et al (34) reported that HPDL promoted the proliferation of pancreatic cancer cells and was associated with glutamine-mediated redox balance. MPO is a dimeric protein consisting of two 15-kDa light chains and two variable-weight glycosylated heavy chains bound to a prosthetic heme group (35). Yuzhalin and Kutikhin (36) demonstrated that gene polymorphisms in MPO (rs11079344, rs8178406 and rs2243828) may represent important tumor-associated biomarkers. P2RY1 is a membrane-bound protein receptor that is activated by ADP or its analogs (37). P2RY1 is closely associated with the proliferation of gastric adenocarcinoma cells and the drug resistance of pancreatic cancer (38).
In conclusion, the study identified an mRNA expression signature that could predict the survival of patients with AML. These findings may have potential clinical research value.
Supplementary Material
Supporting Data
Acknowledgements
Not applicable.
Funding
This work was supported by The Key Laboratory of Tumor Immunological Prevention and Treatment of Yunnan Province (grant no. 2017DG004), The Joint Special Program of Applied Basic Research of Kunming Medical University Young Doctor Program (grant no. 202001AY070001-153) and The Kunming Health Research Project (grant no. 2020-21-01-111).
Availability of data and materials
The datasets used and analyzed during the current study are available from the corresponding author on reasonable request.
Authors' contributions
YK and HG designed the experiment and wrote the manuscript; YW contributed to the cell experiments; CP performed the statistical and bioinformatics analysis; XC performed the RT-PCR and western blot assays. All authors read and approved the final manuscript. YK and HG confirmed the authenticity of all the raw data.
Ethics approval and consent to participate
This study was approved by The Ethics Committee of the Kunming Yan'an hospital (approval no. 2021-03-01), and all patients signed informed consent forms.
Patient consent for publication
Not applicable.
Competing interests
The authors declare that they have no competing interests.
References
|
1
|
Pelcovits A and Niroula R: Acute myeloid leukemia: A review. R I Med J (2013). 103:38–40. 2020.
|
|
2
|
De Kouchkovsky I and Abdul-Hay M: ‘Acute myeloid leukemia: A comprehensive review and 2016 update’. Blood Cancer J. 6:e4412016. View Article : Google Scholar
|
|
3
|
Rose-Inman H and Kuehl D: Acute leukemia. Emerg Med Clin North Am. 32:579–596. 2014. View Article : Google Scholar
|
|
4
|
Narayanan D and Weinberg OK: How I investigate acute myeloid leukemia. Int J Lab Hematol. 42:3–15. 2020. View Article : Google Scholar
|
|
5
|
Infante MS, Piris MÁ and Hernández-Rivas JÁ: Molecular alterations in acute myeloid leukemia and their clinical and therapeutical implications. Med Clin (Barc). 151:362–367. 2018.(In English, Spanish). View Article : Google Scholar
|
|
6
|
Döhner H, Estey E, Grimwade D, Amadori S, Appelbaum FR, Büchner T, Dombret H, Ebert BL, Fenaux P, Larson RA, et al: Diagnosis and management of AML in adults: 2017 ELN recommendations from an international expert panel. Blood. 129:424–447. 2017. View Article : Google Scholar
|
|
7
|
Medeiros BC: Is there a standard of care for relapsed AML? Best Pract Res Clin Haematol. 31:384–386. 2018. View Article : Google Scholar
|
|
8
|
Daver N, Schlenk RF, Russell NH and Levis MJ: Targeting FLT3 mutations in AML: Review of current knowledge and evidence. Leukemia. 33:299–312. 2019. View Article : Google Scholar
|
|
9
|
Fernandez S, Desplat V, Villacreces A, Guitart AV, Milpied N, Pigneux A, Vigon I, Pasquet JM and Dumas PY: Targeting tyrosine kinases in acute myeloid leukemia: Why, who and how? Int J Mol Sci. 20:34292020. View Article : Google Scholar
|
|
10
|
Li K, Wang F and Hu ZW: Targeting TRIB3 and PML-RARα interaction against APL. Oncotarget. 8:52012–52013. 2017. View Article : Google Scholar
|
|
11
|
Sportoletti P, Celani L, Varasano E, Rossi R, Sorcini D, Rompietti C, Strozzini F, Del Papa B, Guarente V, Spinozzi G, et al: GATA1 epigenetic deregulation contributes to the development of AML with NPM1 and FLT3-ITD cooperating mutations. Leukemia. 33:1827–1832. 2019. View Article : Google Scholar
|
|
12
|
Li Z, Weng H, Su R, Weng X, Zuo Z, Li C, Huang H, Nachtergaele S, Dong L, Hu C, et al: FTO plays an oncogenic role in acute myeloid leukemia as a N6-Methyladenosine RNA demethylase. Cancer Cell. 31:127–141. 2017. View Article : Google Scholar
|
|
13
|
Su R, Dong L, Li C, Nachtergaele S, Wunderlich M, Qing Y, Deng X, Wang Y, Weng X, Hu C, et al: R-2HG exhibits anti-tumor activity by targeting FTO/m6A/MYC/CEBPA signaling. Cell. 172:90–105.e23. 2018. View Article : Google Scholar
|
|
14
|
Damen JA, Hooft L, Schuit E, Debray TP, Collins GS, Tzoulaki I, Lassale CM, Siontis GC, Chiocchia V, Roberts C, et al: Prediction models for cardiovascular disease risk in the general population: Systematic review. BMJ. 353:i24162016. View Article : Google Scholar
|
|
15
|
Alaa AM, Bolton T, Di Angelantonio E, Rudd JH and van der Schaar M: Cardiovascular disease risk prediction using automated machine learning: A prospective study of 423,604 UK Biobank participants. PLoS One. 14:e02136532019. View Article : Google Scholar
|
|
16
|
Khera AV, Chaffin M, Aragam KG, Haas ME, Roselli C, Choi SH, Natarajan P, Lander ES, Lubitz SA, Ellinor PT and Kathiresan S: Genome-wide polygenic scores for common diseases identify individuals with risk equivalent to monogenic mutations. Nat Genet. 50:1219–1224. 2018. View Article : Google Scholar
|
|
17
|
Campbell DD, Li Y and Sham PC: Multifactorial disease risk calculator: Risk prediction for multifactorial disease pedigrees. Genet Epidemiol. 42:130–133. 2018. View Article : Google Scholar
|
|
18
|
Wang Z, Jensen MA and Zenklusen JC: A practical guide to The Cancer Genome Atlas (TCGA). Methods Mol Biol. 1418:111–141. 2016. View Article : Google Scholar
|
|
19
|
eGTEx Project: Enhancing GTEx by bridging the gaps between genotype, gene expression, and disease. Nat Genet. 49:1664–1670. 2017. View Article : Google Scholar
|
|
20
|
Bennett JM, Catovsky D, Daniel MT, Flandrin G, Galton DA, Gralnick HR and Sultan C: Proposals for the classification of the acute leukaemias. French-American-British (FAB) co-operative group. Br J Haematol. 33:451–458. 1976. View Article : Google Scholar
|
|
21
|
Livak KJ and Schmittgen TD: Analysis of relative gene expression data using real-time quantitative PCR and the 2(-Delta Delta C(T)) method. Methods. 25:402–408. 2011. View Article : Google Scholar
|
|
22
|
Metzeler KH, Hummel M, Bloomfield CD, Spiekermann K, Braess J, Sauerland MC, Heinecke A, Radmacher M, Marcucci G, Whitman SP, et al: Cancer and leukemia group B; German AML cooperative group. An 86-probe-set gene-expression signature predicts survival in cytogenetically normal acute myeloid leukemia. Blood. 112:4193–4201. 2008. View Article : Google Scholar
|
|
23
|
Wang H, Wu X and Chen Y: Stromal-immune score-based gene signature: A prognosis stratification tool in gastric cancer. Front Oncol. 9:12122019. View Article : Google Scholar
|
|
24
|
Wojcicki AV, Kasowski MM, Sakamoto KM and Lacayo N: Metabolomics in acute myeloid leukemia. Mol Genet Metab. 130:230–238. 2020. View Article : Google Scholar
|
|
25
|
Seth R and Singh A: Leukemias in children. Indian J Pediatr. 82:817–824. 2015. View Article : Google Scholar
|
|
26
|
Skarsgård LS, Andersson MK, Persson M, Larsen AC, Coupland SE, Stenman G and Heegaard S: Clinical and genomic features of adult and paediatric acute leukaemias with ophthalmic manifestations. BMJ Open Ophthalmol. 4:e0003622019. View Article : Google Scholar
|
|
27
|
Papaemmanuil E, Gerstung M, Bullinger L, Gaidzik VI, Paschka P, Roberts ND, Potter NE, Heuser M, Thol F, Bolli N, et al: Genomic classification and prognosis in acute myeloid leukemia. N Engl J Med. 374:2209–2221. 2016. View Article : Google Scholar
|
|
28
|
Klepin HD, Rao AV and Pardee TS: Acute myeloid leukemia and myelodysplastic syndromes in older adults. J Clin Oncol. 32:2541–2552. 2014. View Article : Google Scholar
|
|
29
|
Yang JJ, Park TS and Wan TS: Recurrent cytogenetic abnormalities in acute myeloid leukemia. Methods Mol Biol. 1541:223–245. 2017. View Article : Google Scholar
|
|
30
|
Kayser S and Levis MJ: Clinical implications of molecular markers in acute myeloid leukemia. Eur J Haematol. 102:20–35. 2019. View Article : Google Scholar
|
|
31
|
Yang X, Wong MP and Ng RK: Aberrant DNA methylation in acute myeloid leukemia and its clinical implications. Int J Mol Sci. 20:45762019. View Article : Google Scholar
|
|
32
|
Li L, Lee KM, Han W, Choi JY, Lee JY, Kang GH, Park SK, Noh DY, Yoo KY and Kang D: Estrogen and progesterone receptor status affect genome-wide DNA methylation profile in breast cancer. Hum Mol Genet. 19:4273–4277. 2010. View Article : Google Scholar
|
|
33
|
Ghosh SG, Lee S, Fabunan R, Chai G, Zaki MS, Abdel-Salam G, Sultan T, Ben-Omran T, Alvi JR, McEvoy-Venneri J, et al: Biallelic variants in HPDL, encoding 4-hydroxyphenylpyruvate dioxygenase-like protein, lead to an infantile neurodegenerative condition. Genet Med. 23:524–533. 2021. View Article : Google Scholar
|
|
34
|
Ye X, Wei X, Liao J, Chen P, Li X, Chen Y, Yang Y, Zhao Q, Sun H, Pan L, et al: 4-Hydroxyphenylpyruvate dioxygenase-like protein promotes pancreatic cancer cell progression and is associated with glutamine-mediated redox balance. Front Oncol. 10:6171902021. View Article : Google Scholar
|
|
35
|
Reiding KR, Franc V, Huitema MG, Brouwer E, Heeringa P and Heck AJ: Neutrophil myeloperoxidase harbors distinct site-specific peculiarities in its glycosylation. J Biol Chem. 294:20233–20245. 2019. View Article : Google Scholar
|
|
36
|
Yuzhalin AE and Kutikhin AG: Common genetic variants in the myeloperoxidase and paraoxonase genes and the related cancer risk: A review. J Environ Sci Health C Environ Carcinog Ecotoxicol Rev. 30:287–322. 2012. View Article : Google Scholar
|
|
37
|
von Kügelgen I and Wetter A: Molecular pharmacology of P2Y-receptors. Naunyn Schmiedebergs Arch Pharmacol. 362:310–323. 2000. View Article : Google Scholar
|
|
38
|
Michael IP, Saghafinia S and Hanahan D: A set of microRNAs coordinately controls tumorigenesis, invasion, and metastasis. Proc Natl Acad Sci USA. 116:24184–24195. 2019. View Article : Google Scholar
|


