Introduction
Endometrial cancer (EC) is the most common gynecological carcinoma among women worldwide. In 2018, The American Cancer Society estimated there to be 63,230 new cases and 11,350 EC-related deaths in the United States (1), and almost 500,000 cases will be diagnosed worldwide by 2035 (2). EC is rare in women under the age of 45, as 75% of cases are found in women aged 55 and above (3). EC is categorized according to its etiology and clinical behavior (4). Type-1 EC is a low-grade tumor associated with long-duration unopposed estrogenic stimulation and has a favorable prognosis, while type-2 EC is a high-grade tumor, either poorly differentiated endometrioid or non-endometrioid, with high risk of relapse (5). In both types, progressive invasion and metastasis remain the key hallmarks for advanced stage, where the primary tumor typically spreads to the cervix, lymph nodes and abdomen, as well as distant organs such as the lung, liver and brain (6). According to the National Institutes of Health, EC can be divided into four molecular subtypes: Polymerase ε ultramutated, microsatellite instability hypermutated, copy number low and copy number high (7). A previous study (8) suggested that uterine serous tumors and ~25% of high-grade endometrioid tumors had extensive copy number alterations, few DNA methylation changes, low estrogen receptor/progesterone receptor levels and frequent TP53 mutations, as well as mutations in PTEN, catenin β1, PIK3 catalytic subunit α, AT-rich interaction domain 1A and K-RAS.
EC cells must acquire motile capabilities to successfully disseminate to distant sites (9,10). Cancer cell migration is often triggered by extracellular cues, such as soluble factors and signals from the tumor microenvironment (11). Surrounding the tumor, various effectors are released from the immune system (such as platelets) and from neighboring host cells (including fibroblasts) (12). It has been reported that fibroblasts in the tumor microenvironment are activated, and these are known as cancer-associated fibroblasts (CAFs) (13,14). CAFs have a significant impact on cancer progression by remodeling the ECM, inducing angiogenesis, recruiting inflammatory cells and directly stimulating cancer cell proliferation and cell migration (15). Our previous study demonstrated that CAFs isolated from human EC tissue secreted high levels of IL-6, which promoted EC growth via the activation of the IL-6/STAT-3/c-Myc pathway (16). However, the mechanistic roles of CAFs in EC cell motility and migration remain unknown.
The aim of the present study was to examine the effect of CAFs on EC cells motility in an in vitro 3D tumor-fibroblast co-culture model.
Materials and methods
Chemical and reagents
Matrigel® was obtained from Corning, Inc. The ROCK1 inhibitor Y-27632 was purchased from Merck & Co., Inc.
Human EC cell line and primary culture establishment
The human EC cell line, ECC-1 was purchased from American Type Culture Collection (cat. no. CRL-2923) and was cultured in medium consisting of RPMI-1640 (Thermo Fisher Scientific, Inc.) supplemented with 10% FBS and 1% penicillin/streptomycin. The ECC-1 cell line was authenticated using STR profiling. The immortalized human normal endometrial fibroblast cell line, T-HESC (ATCC® CRL-4003™), was purchased from the American Type Culture Collection and cultured with Dulbecco's modified Eagle's medium supplemented with 10% fetal bovine serum and 1% penicillin/streptomycin.
The sources of CAFs and BAFs and patient age are shown in Table I. All samples were collected from women undergoing surgery at University of Malaya Medical Centre. The study was approved by The Ethical Committee of University of Malaya Medical Centre (approval no. 865.19). Written informed consent was obtained from all participants. The fibroblast lines were labelled using an arbitrary number assigned to each recruited patient. CAF and BAF cultures were established as previously described (16). First, ~1 g of tissue samples was transported to the laboratory in RPMI-1640 supplemented with 10% FBS and 1% penicillin/streptomycin. The samples were washed twice with PBS and minced to 1-mm3 size, then digested with 2 mg/ml collagenase (Worthington Biochemical Corporation) in a rotator for 1 h at 37°C. After digestion, the tissue samples were washed with PBS and cultured in RPMI-1640 supplemented with 10% FBS and 1% penicillin/streptomycin at 37°C. The medium was changed every 72 h, and the cells were subcultured when they reached confluence.
 |
Table I.
CAF and BAF origin and patient age.
|
Table I.
CAF and BAF origin and patient age.
| A, CAFs |
|
| Fibroblast line |
Tissue origin |
Patient age (years) |
| EC48Fib |
Endometrial cancer |
51 |
| EC49Fib |
Endometrial cancer |
53 |
| EC50Fib |
Endometrial cancer |
40 |
|
| B, BAFs |
|
| Fibroblast line |
Tissue origin |
Patient age (years) |
|
| EF2Fib |
Endometrial Fibroid |
51 |
| EH6Fib |
Endometrial hyperplasia |
42 |
| NE14Fib |
Normal endometrium |
46 |
Second, CAFs or BAFS were further isolated from the primary cell culture using human anti-fibroblast magnetic microbeads (cat. no. 130-050-601; Miltenyi Biotec GmbH). Briefly, 1×10⁶ cells were centrifuged at 300 × g for 10 min, at room temperature. The cell pellets were resuspended in 100 µl calcium- and magnesium-free PBS (pH 7.2) containing a final concentration of 0.5% BSA and 2 mM EDTA dissolved, then incubated with 20 µl human anti-fibroblast microbeads for 1 h. The cells were then separated using MiniMACS™ cell separator (Miltenyi Biotec, Inc.). The isolated cells were cultured in the aforementioned medium and maintained below passage 10, to maintain a phenotype close to that of the primary tissues. These fibroblasts were characterized by high expression of fibroblast markers (vimentin and α-SMA) and low expression of epithelial markers (EpCAM and E-cadherin) (Fig. S1).
Reverse transcription-quantitative PCR (RT-qPCR)
Total RNA was extracted from cultured cells using TRIzol® (Invitrogen; Thermo Fisher Scientific, Inc.). A total of 1 µg RNA was converted into cDNA using Revert Aid RT Kit (Thermo Fisher Scientific, Inc.), according to the manufacturer's instructions. The primer sequences used to quantify the mRNA expression levels of Rho GTPases, fibroblast markers and epithelial markers are listed in Table II. GAPDH was used as the internal control gene. The specificity of the primer sequences was validated using Primer-BLAST (National Center for Biotechnology Information). The qPCR was performed using ABI StepOne Plus (Applied Biosystems) in 40 cycles using 5X HOT FIREPol EvaGreen qPCR Mix (Solis Biodyne), 10 pmol/µl forward and reverse primer, 10 ng/µl cDNA template and PCR-grade water. The following thermocycling conditions were used for qPCR: Initial denaturation for 10 min at 95°C, followed by 40 cycles of denaturation at 95°C for 15 sec and annealing/extension at 55°C for 45 sec. The relative expression levels were calculated using the 2−∆∆Cq method (17). For ECC-1 and CAF monoculture, the relative fold-changes in gene expression were normalized to the non-Matrigel cultures (2D cultures), whereas for the ECC-1 and CAF co-cultures, the relative fold changes in gene expression were normalized to those of the ECC-1 monoculture to obtain the expression levels of the CAFs. The relative fold changes from three different CAF lines were averaged (EC48Fib, EC49Fib, and EC50Fib).
|
Table II.
Primer sequences.
|
Table II.
Primer sequences.
| Gene name |
Orientation |
Sequence, 5′-3′ |
| RhoA |
Forward |
AATCTGGGTGCCTTGTCTTG |
| |
Reverse |
GTGCAGAGGAGGGCTGTTAG |
| ROCK1 |
Forward |
AGGAAAATCGAAAGCTGCAA |
| |
Reverse |
GTTTAGCACGCAATTGCTCA |
| Vimentin |
Forward |
GGCACGTCTTGACCTTGAA |
| |
Reverse |
GGTCATCGTGATGCTGAGAA |
| α-SMA |
Forward |
GACGAAGCACAGAGCAAAAGAG |
| |
Reverse |
TGGTGATGATGCCATGTTCTATCG |
| EpCAM |
Forward |
AATGTGTGTGCGTGGGA |
| |
Reverse |
TTCAAGATTGGTAAAGCCAGT |
| E-cadherin |
Forward |
TTTGTACAGATGGGGTCTTGC |
| |
Reverse |
AAGCCCACTTTTCATAGTTCC |
| GAPDH |
Forward |
CCCATCACCATCTTCCAGGAG |
| |
Reverse |
GTTGTCATGGATGACCTTGGC |
Cell isolation from 3D culture
The spheroids formed at day 1 and day 14 were digested with 2 mg/ml collagenase (Worthington Biochemical Corporation) in a rotator for 1 h at 37°C. After digestion, the cells were centrifuged at 300 × g for 10 min, at room temperature. The cell pellets were resuspended in 100 µl calcium- and magnesium-free PBS (pH 7.2) containing a final concentration of 0.5% BSA and 2 mM EDTA dissolved, then incubated with 20 µl human anti-fibroblast microbeads and 20 µl human CD326 (EpCAM) microbeads (cat. no. 130-061-101, Miltenyi Biotec, Inc.) for 1 h at 4°C. The cells were then separated using MiniMACS™ cell separator (Miltenyi Biotec, Inc.).
Lentiviral transduction
ECC-1 cells and fibroblasts were transduced with pre-made lentiviral particles for red fluorescence protein (RFP; cat. no. LVP429) and green fluorescence protein (GFP; cat. no. LVP426) obtained from GenTarget Inc., respectively. Briefly, the cells were seeded at a density of 5×10⁴ cells/well in a 24-well plate. After 24 h, 15 µl pre-made lentiviral particles (1×10⁷ IFU/ml) were added, together with 235 µl of serum-free medium. A 250 µl volume of complete medium was added after 6 h. Selection was carried out by supplementing the cultures with a final concentration of puromycin of 1 µg/ml (MilliporeSigma) for 2 weeks.
3D culture establishment
RFP-expressing ECC-1 cells were co-cultured with GFP-expressing fibroblasts at 1:1 ratio (2×10⁴ cells per dish) each on Matrigel® (Corning, Inc.)-precoated glass bottom cell culture dish (WillCo Wells B.V.). The cells were cultured using DMEM F12 (Thermo Fisher Scientific, Inc.) supplemented with 10% FBS and 1% penicillin/streptomycin. The culture medium was changed every 3–4 days over a period of 14 days.
Immunofluorescence staining
Immunofluorescence staining was performed on ECC-1 and CAF monocultures, as well as ECC-1 and CAF co-cultures on day 1 and day 14. The 3D spheroids were fixed with 4% paraformaldehyde at 4°C for 20 min, followed by permeabilization with 0.01% Triton-X at 4°C for 20 min. The spheroids were stained with anti-phosphorylated (p-) MLC primary antibody at 4°C, overnight (cat. no. 3671S; diluted 1:500; Cell Signaling Technology, Inc.), and then with Alexa Fluor® 647-conjugated secondary antibody at 4°C for 1 h (cat. no. A32733; diluted 1:1,000, Thermo Fisher Scientific, Inc.). The primary and secondary antibodies were diluted with ImmunoDetector Protein Blocker/Antibody Diluent (BIOTnA), which included bovine serum albumin as the blocking reagent. The slides were mounted with Vectashield Antifade Mounting Medium with DAPI (Vector Laboratories, Inc.). The images were analysed using a DeltaVersion deconvolution microscope (GE Healthcare).
Confocal microscopy and 3D projection analysis
Fluorescence images of the 3D spheroids were analyzed using a Leica TCS SP5 II laser confocal microscope (Leica Microsystems GmbH). The Helium-Neon (543 nm) and Argon (488 nm) lasers were used to detect RFP and GFP signals, respectively. The images were acquired sequentially to avoid crosstalk between fluorescence channels. A stack of optical sections was acquired by changing the position of the focal plane in the z-direction with a step size of 2.98 µm using a 10X air objective. Images taken in each z-plane were combined into one single picture using the maximum intensity projection function. The 3D reconstruction of z-planes was then analyzed using LAS X 3D Visualization version 3.1.0.15537 (Leica Microsystems GmbH). The 3D reconstruction of the x, y and z planes of the 3D sphere were adjusted to the center of the plane in the cross-section analysis. The distance between the outermost edges of the z-plane was measured as the diameter of spheroids.
Live cell imaging
Live cell imaging was performed using a Nikon Eclipse Ti fluorescence microscope (Nikon Corporation). The hardware was controlled using NIS Element version 4.30. To maintain cell viability during imaging, an environmental chamber at 37°C with 5% CO2 supply was mounted on the microscope. A z-stack of images with a step size of 8 µm was taken at 1-h intervals using a 10X S plane Fluor dry objective. The entire imaging process was performed over 16 h. To create videos illustrating of cell motility, a sharp and focused single z-plane image was selected at each time point. The velocity (µm/h) of the cells was calculated as the distance travelled by the cells (µm) divided by time (h) (18).
Wound healing assay
ECC-1 cells were cultured in RPMI1640 supplemented with 10% FBS and 1% penicillin/streptomycin in a 24-well plate until they reached 100% confluence. A small linear scratch was created in the middle of the well using a 10 µl pipette tip. The ECC-1 cells were treated with 2% FBS medium or conditioned medium collected from the CAFs over 3 days. The wound width was measured using a Nikon Eclipse Ti fluorescence microscope (Nikon Corporation).
Phalloidin staining
ECC-1, CAFs and BAFs were seeded at 5×10⁴ cells/well on fibronectin pre-coated coverslips in 24-well plates. After overnight incubation, the cells were treated with Y-27632 at 50, 75 or 100 µM for 24 h. The cells were washed with PBS and fixed for 20 min in 3.7% formaldehyde solution in PBS at 4°C. The cells were further permeabilized with 0.1% Triton X-100 in PBS. The cells were stained with 50 µg/ml phalloidin-TRITC (MilliporeSigma) in PBS for 40 min at room temperature. The cells were washed with PBS three times. The slides were mounted with Vectashield Antifade Mounting Medium with DAPI (Vector Laboratories). The cells were analyzed using a Nikon Eclipse Ti fluorescence microscope (Nikon Corporation).
MTT assay
Cell viability was assessed using an MTT assay. ECC-1, CAFs and BAFs were seeded at 5×10³ cells/well in 96-well plate overnight. The cells were treated with Y-27632, at concentrations ranging from 0.2 to 100 µM or vehicle (0.01% DMSO) for 24 h. At the end of treatment, 20 µl MTT solution (5 mg/ml) was added to each well. Following 4 h of incubation at 37°C, 100 µl 10% sodium dodecyl sulfate was added to dissolve the formazan crystals in an additional 4 h of incubation at 37°C. Absorbance was measured using a spectrometer at 575 nm, with a reference of 650 nm.
ROCK1 inhibitor Y-27632 treatment for cell motility assessment
In cell seeding, RFP-expressing ECC-1 cells were co-cultured with GFP-expressing fibroblasts at a 1:1 ratio (2×10⁴ cells per dish) on a Matrigel® (Corning, Inc.)-precoated glass bottom cell culture dish (WillCo Wells B.V.). A total of 100 µM Y-27632 and control (10% FBS) was added during cell seeding. Live cell imaging was performed as aforementioned.
Statistical analysis
Statistical analysis was carried out to assess the differences between the means of the control and test groups using unpaired Student's t-test. One-way ANOVA followed by Tukey's post hoc test or Bonferroni's correction was performed when there were >2 comparison groups. All statistical analyses were performed using GraphPad Prism version 6 (GraphPad Software, Inc.). P<0.05 was considered to indicate a statistically significant difference.
Results
CAFs enhance the motility of ECC-1 cells in 3D culture models
The isolated fibroblast cells were first characterized for the expression of fibroblast and epithelial markers. Both isolated CAFs (EC48Fib, EC49Fib and EC50Fib) and BAFs (EF2Fib, EH6Fib and NE14Fib) showed high expression of vimentin and α-SMA, with low expression of EpCAM and E-cadherin (Fig. S1). The effects of these fibroblasts on EC cell motility were examined using wound healing assays. ECC-1 tumor cells were treated with conditioned medium collected from CAFs. As shown in Fig. S2, there was no significant ECC-1 cell migration following treatment with conditioned medium treatment, except that the conditioned medium collected from EC48Fib led to a small but significant increase in migration at day 3. Thus, the effects of CAFs on EC cell motility were further investigated using live cell imaging of the ECC-1 and CAF co-cultures in Matrigel®-coated dishes over 16 h.
In order to visualize the individual movement of EC cells and fibroblasts in 3D co-culture, the cells were transduced with RFP and GFP lentivirus, respectively. Selection was performed by supplementing the cultures with puromycin with a final concentration of 1 µg/ml for 2–8 weeks. Fig. 1A demonstrates that the EC cells and fibroblasts expressed RFP and GFP, respectively, following puromycin selection. Approximately 80% of ECC-1 cells and fibroblasts expressed RFP and GFP, respectively.
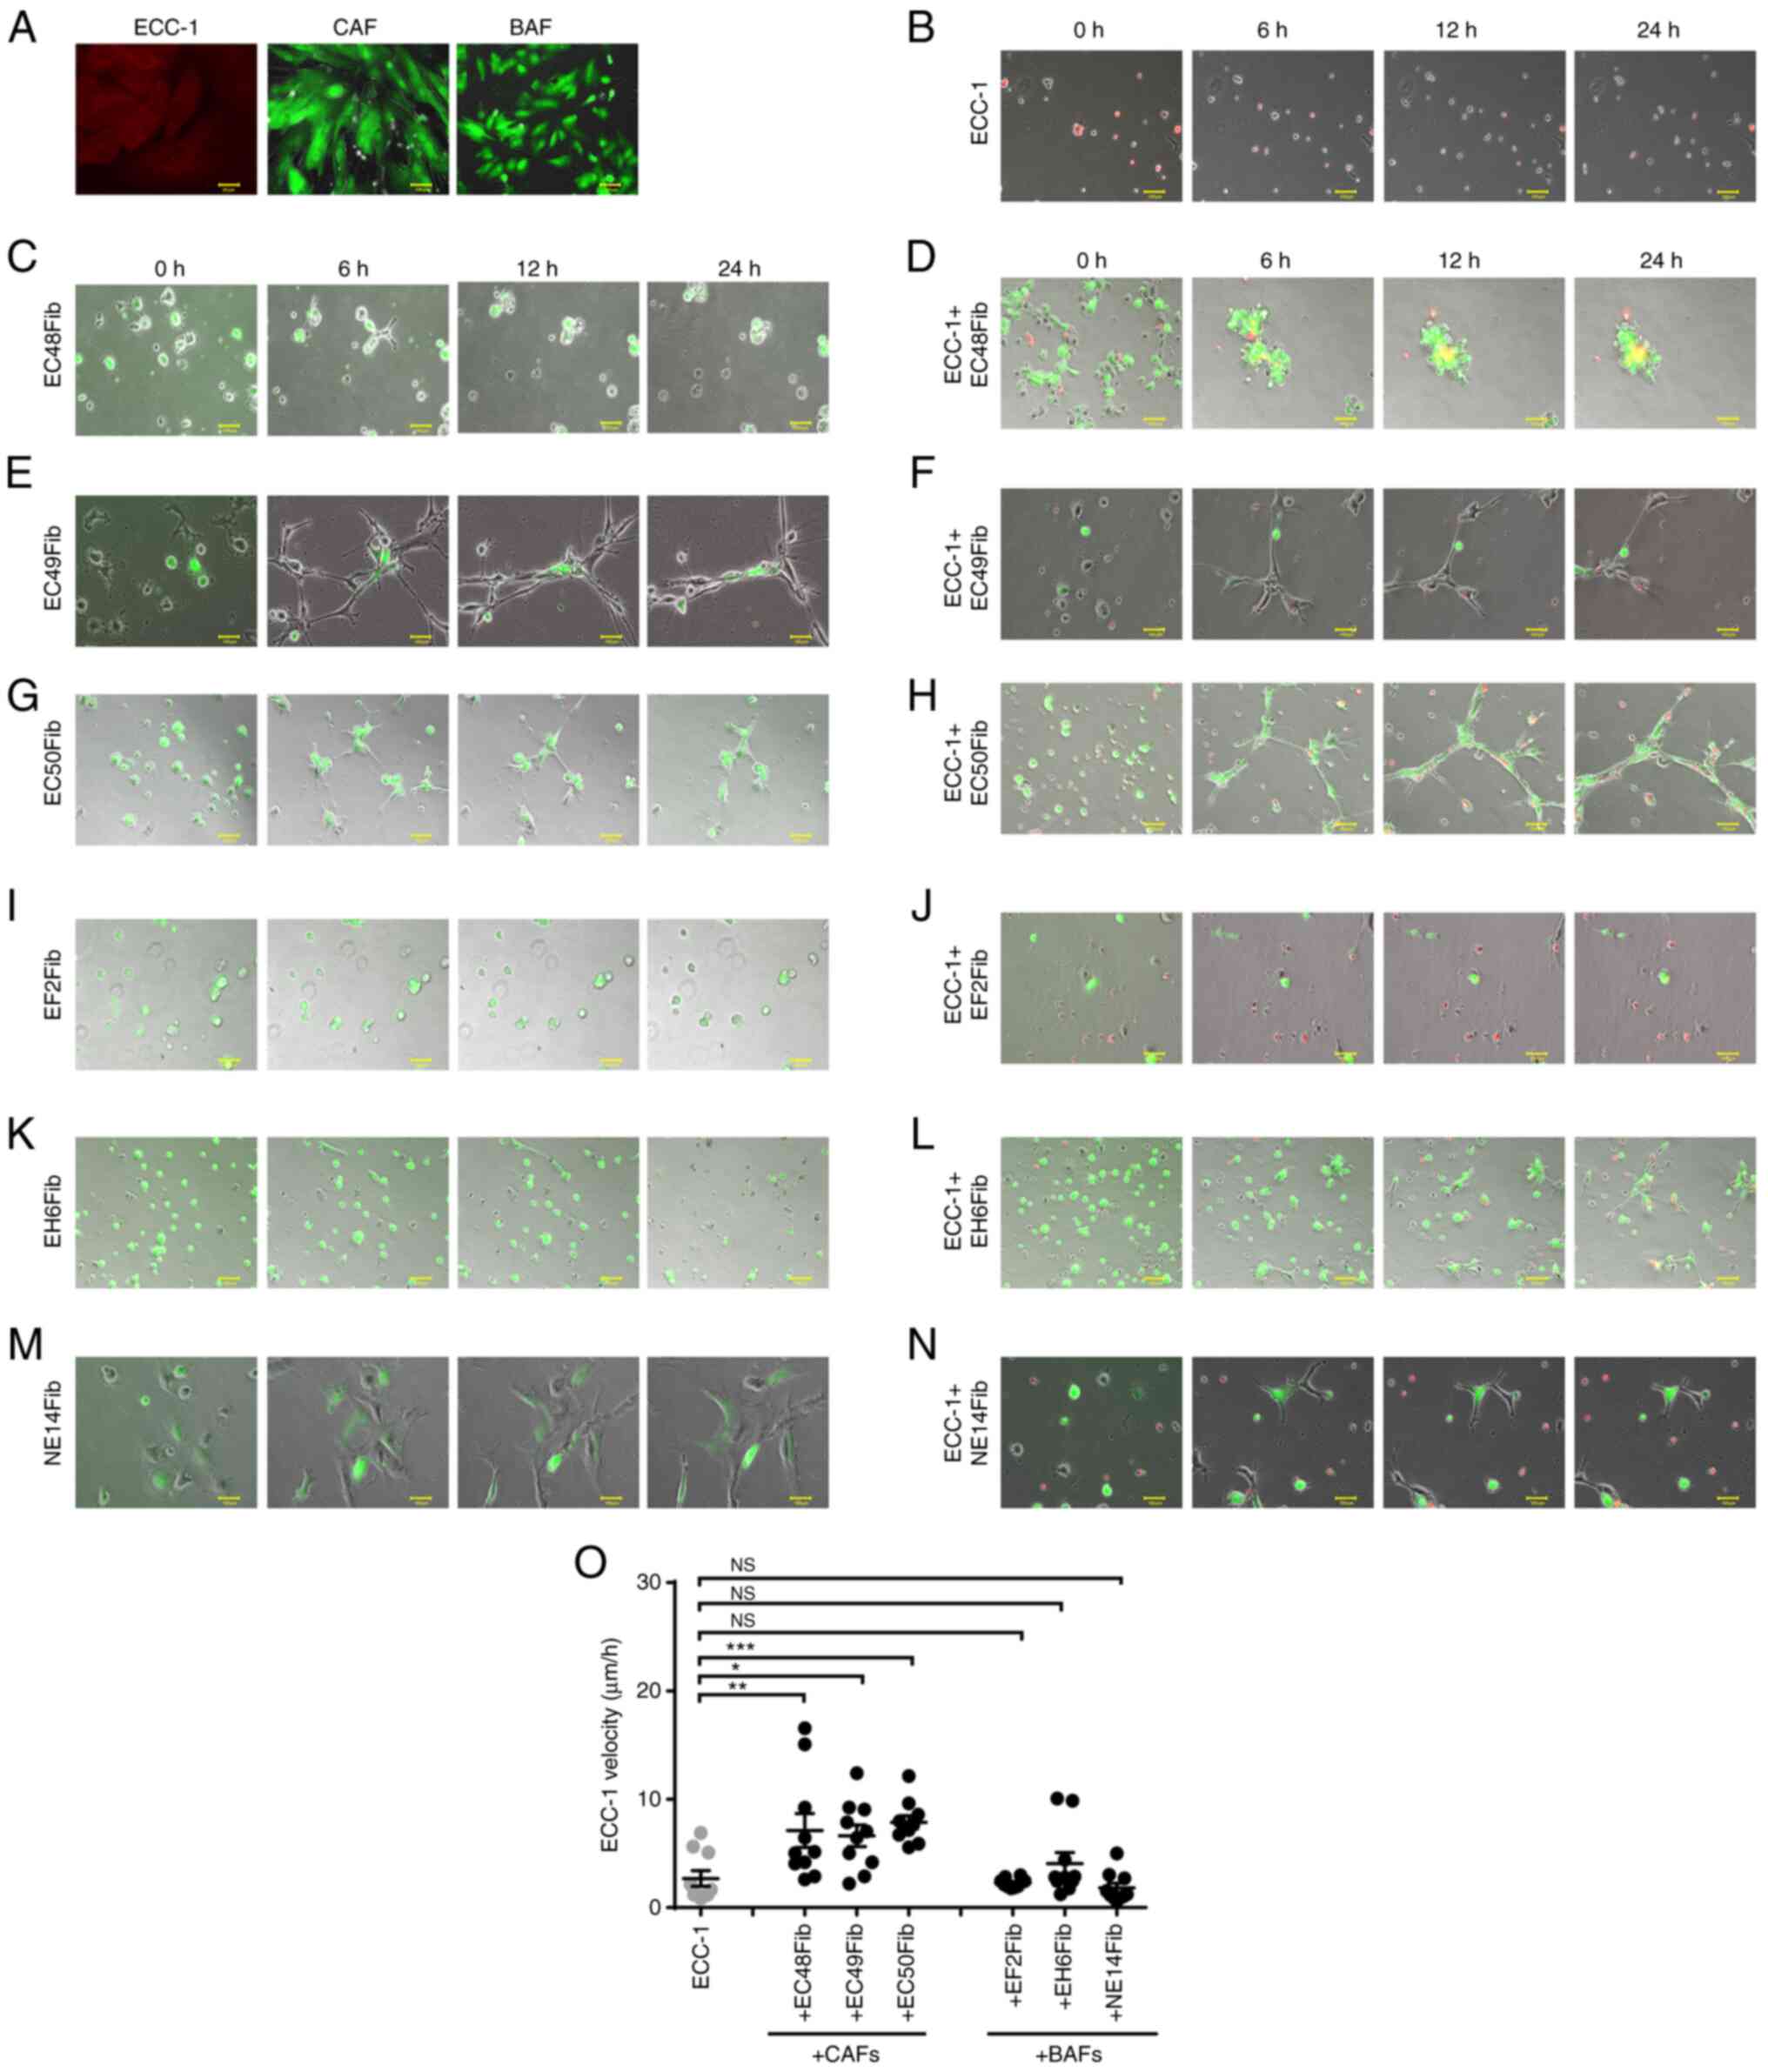 |
Figure 1.
CAFs enhance ECC-1 cell motility in a 3D environment. (A) Efficiency of RFP and GFP transduction was assessed using fluorescence microscopy following 2 weeks of puromycin selection. (B) RFP-labeled ECC-1 cells were cultured individually on Matrigel®. The monocultures of CAFs or co-cultures with RFP-labeled ECC-1 on Matrigel® are shown for (C) EC48Fib monoculture, (D) ECC-1 co-cultured with EC48Fib, (E) EC49Fib monoculture, (F) ECC-1 co-cultured with EC49Fib, (G) EC50Fib monoculture and (H) ECC-1 co-cultured with EC50Fib. All fibroblasts were labeled with GFP. The monocultures of BAFs or co-cultures with RFP-labeled ECC-1 on Matrigel® are shown for (I) EF2Fib monoculture, (J) ECC-1 co-cultured with EF2Fib, (K) EH6Fib monoculture, (L) ECC-1 co-cultured with EH6Fib, (M) NE14Fib monoculture and (N) ECC-1 co-cultured with NE14Fib. Scale bar, 100 µm. (O) The velocity of the cells was measured using live cell imaging for 24 h. ECC-1 monoculture was used as baseline in statistical analysis. Data are representative of three independent experiments and shown as the mean ± SEM. *P<0.05, **P<0.01, ***P<0.001 vs. ECC-1 monoculture; one-way ANOVA followed by Bonferroni's correction. CAF, cancer-associated fibroblast; BAF, benign tissue-associated fibroblast; RFP/GFP, red/green fluorescence protein; NS, not significant.
|
In the monoculture, the ECC-1 tumor cells migrated in an amoeboid mode without forming cell projections, with an average velocity of 2.68±0.72 µm/h (Fig. 1B and O; Table III; Data S1). The CAFs formed long projections, and ECC-1 cells could move on top of these projections. The ability of CAFs to form long cell projections was not influenced by the tumor cells (Fig. 1C, E and G), with an average velocity of 9.39±1.30 µm/h (Fig. S3A; Table III; Data S2, S3 and S4). However, in the presence of CAFs, the velocity of ECC-1 increased 3-fold (7.86±0.6 µm/h, P<0.0001) (Fig. 1D, F, H and O; Table III; Data S5, S6 and S7). The pro-migratory effects were not observed with BAFs. The tumor cells could not move on top of the BAFs, likely due to the lack of cell projections (Fig. 1I, K and M). There were no significant changes observed in tumor cell velocity when co-cultured with BAFs (4.06±1.01 µm/h, P=0.28) (Fig. 1J, L, N and O; Table III; Data S8, S9 and S10). To examine whether the tumor cells affect fibroblast motility, the velocity of CAFs and BAFs was examined in the presence of ECC-1 cells. The motility of the CAFs was not affected by the tumor cells. Indeed, there was no significant change in CAF velocity when co-cultured with ECC-1 (7.14±0.97, P=0.71) compared with monocultures (9.39±1.30 µm/h) (Fig. S3A; Table III; Data S2, S3 and S4). Similarly, the velocity of the BAFs did not change significantly when co-cultured with tumor cells (2.95±0.61 µm/h, P=0.47) compared with monocultures (3.56±0.51 µm/h), except that the EH6Fib line showed an increase in velocity from 2.26±0.52 in monoculture to 4.53±0.85 µm/h (P=0.0349) in the presence of tumor cells (Fig. S3B; Table III; Data S11, S12 and S13). Altogether, these findings indicated that the ability of CAFs to mobilize EC cells through cell projections was likely a CAF-specific property and not the result of reciprocal interactions with the tumor cells.
|
Table III.
Velocity of ECC-1 cells, CAFs and BAFs.
|
Table III.
Velocity of ECC-1 cells, CAFs and BAFs.
| A, ECC-1 cells |
|
| Group |
Velocity (µm/h) |
P-value (vs. monoculture) |
| Monoculture |
2.68±0.72 |
|
| Co-culture with CAFs |
7.86±0.6 |
P<0.001 |
| Co-culture with BAFs |
4.0±1.01 |
P=0.28 |
|
| B, CAFs |
|
| Group |
Velocity (µm/h) |
P-value (vs. monoculture) |
|
| Monoculture |
9.39±1.30 |
|
| Co-culture with ECC-1 |
7.14±0.97 |
P=0.71 |
|
| C, BAFs |
|
| Group |
Velocity (µm/h) |
P-value (vs. monoculture) |
|
| Monoculture |
3.56±0.51 |
|
| Co-culture with ECC-1 |
2.95±0.61 |
P=0.47 |
CAFs promote EC spheroid formation
To examine the effects of enhanced EC cell motility in the presence of CAFs, the 3D tumor-fibroblast co-culture duration was prolonged. Tumor spheroid formation was observed 24 h post co-culture, and the cells within the spheroids began to dissociate after 14 days of co-culture. Thus, the diameter and number of tumor spheroids were examined between day 1 and 14 in the presence or absence of CAFs.
In ECC-1 monocultures, tumor spheroids were observed on day 1 with a mean diameter of 66.67±4.17 µm, which gradually increased from day 7 to 14 (191.7±18.16 µm) (Fig. 2A and D). The number of tumor spheroids in this monoculture decreased from 49.00±3.21 to 26.00±4.50 from day 1 to 14 (Fig. 2F). According to the 3D image reconstruction, from day 7 to 14, the ECC-1 spheroids formed were compact (Fig. 2A). This may explain the consistent RFP signal observed from ECC-1 spheroid throughout this time period. However, in CAF (EC48Fib) monocultures, the cells grouped and formed clusters. The GFP signal from CAFs gradually decreased, and the cells were loosely packed as seen from the 3D reconstruction analysis (Fig. 2B).
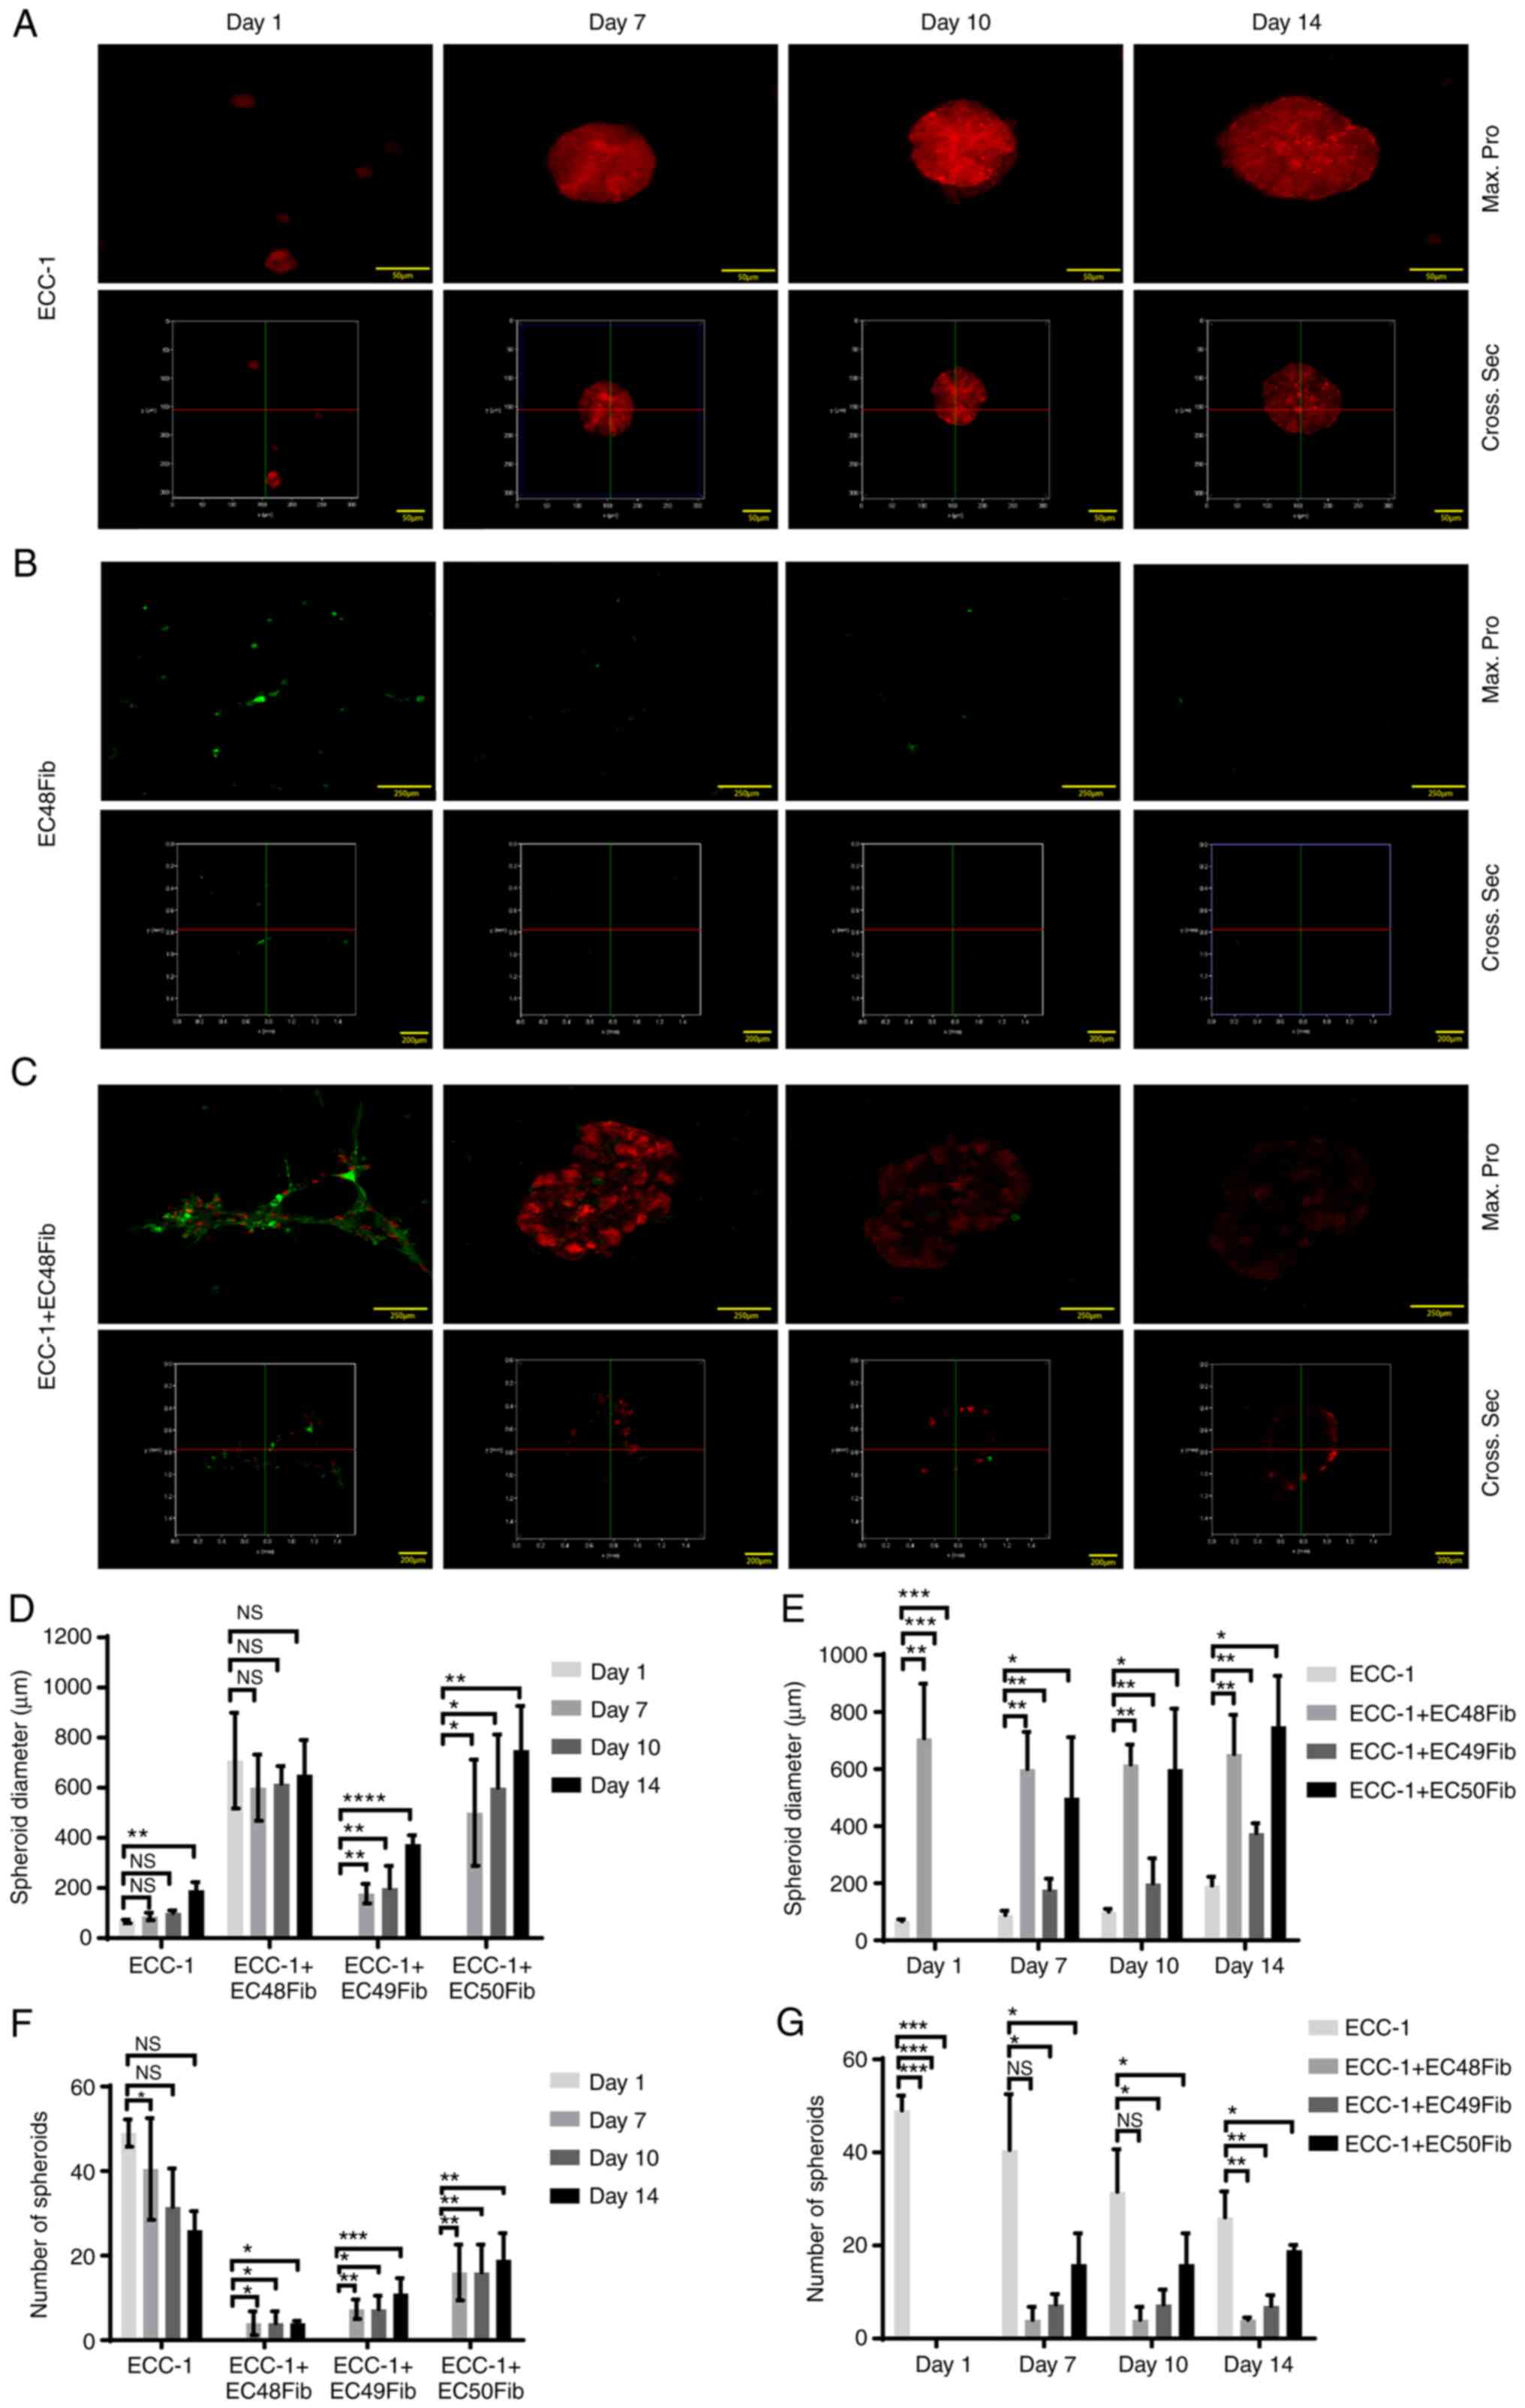 |
Figure 2.
CAFs promote ECC-1 tumor cell spheroid formation in 3D culture. (A) ECC-1, (B) EC48Fib and (C) ECC-1 and EC48Fib in combination were cultured on Matrigel® for 14 days. The formation of spheroids was analyzed using confocal analysis (Max. Pro, upper panel) and 3D reconstruction analysis (Cross Sec., bottom panel). Scale bar, 50, 200 and 250 µm. (D) The diameter of the spheroids was measured on day 1, 7, 10 and 14 using LAS X 3D Visualization. (E) The diameters of the spheroids were compared between the ECC-1 monoculture and the ECC-1 and CAF co-cultures on day 1, 7, 10 and 14. (F) The number of spheroids was calculated on day 1, 7, 10, and 14 using NIS Element version 4.30. (G) The number of spheroids was compared between the ECC-1 monoculture and the ECC-1 and CAF co-cultures on day 1, 7, 10 and 14. *P<0.05, **P<0.01, ***P<0.001, ****P<0.0001; one-way ANOVA followed by Bonferroni's correction. Data are representative of two independent experiments and shown as the mean ± SEM. CAF, cancer-associated fibroblast; NS, not significant; Max pro, maximum projection; Cross Sec, cross section.
|
Interestingly, when co-cultured with EC48Fib, some ECC-1 cells were observed along the protrusions and projections of EC48Fib. ECC-1 and EC48Fib formed at least 10-fold larger spheroids on day 7, with a mean diameter 708.3±110.2 µm, compared with that of ECC-1 monocultures. From the 3D reconstruction analysis, the cells in the co-culture formed irregular spheroids (Fig. 2C). The diameter of the spheroids remained stable, as no apparent change in mean diameter was observed from day 7 to 14 (652±97.25 µm; Fig. 2A), although GFP signals from the EC48Fib within the spheroids was reduced substantially. For ECC-1 and EC48Fib, the mean diameter of the spheroids from the co-cultures was significantly higher than that of ECC-1 monoculture on day 1 (708.33±110.2 µm) and day 14 (652±97.25 µm), respectively. Interestingly, ECC-1 and EC49Fib or EC50Fib co-culture only formed spheroids from day 7 onwards, with a mean diameter of 177.6±38.68 and 500±212 µm, respectively (Fig. 2D and E; Fig. S4A). On day 1, ECC-1 and CAF co-culture did not show an increase the number of spheroids compared with the ECC-1 monoculture (49.00±3.21) (Fig. 2F and G). On day 14, the number of spheroids in ECC-1 and CAF co-cultures slightly increased (4.0±0.58), although there were no significant changes compared with the ECC-1 monoculture (26.00±4.50) (Fig. 2F and G). Similar observations were obtained when the experiment was repeated with other CAF lines (EC49Fib and EC50Fib), as the CAFs promoted EC spheroid formation over 14 days (Fig. S4A). These observations indicated that CAFs may facilitate EC spheroid formation because of their pro-migratory effects on EC cells.
BAFs did not promote EC spheroid formation
To further determine whether the observed effects on spheroid formation were specific to CAFs, the aforementioned experiments were carried out using BAFs. Similar with the previous section, in ECC-1 monoculture, tumor spheroids were observed on day 1, and gradually increased from day 7 to 14 (Fig. 3A). In BAF monocultures, the EF2Fib protruded from the cellular membrane and formed clusters at day 1 (141.7±8.33 µm), with no significant change in the mean diameter from day 1 to 14 (125.0±0.00 µm) (Fig. 3B). Interestingly, in ECC-1 and EF2Fib co-cultures, some ECC-1 cells were detected along the protrusion and projection of the fibroblasts (Fig. 3C). The spheroid diameters increased only slightly from day 1 to 14 (152.9±27.92 µm). However, there was no significant change compared with the ECC-1 monoculture at day 14 (Fig. 3D and E). The number of spheroids did not significantly change between day 1 and 14. Interestingly, BAFs suppressed the number of spheroids compared with the ECC-1 monoculture (Fig. 3F and G). Similar observations were obtained when the experiments were repeated with the NE14Fib line (Fig. S5A and B).
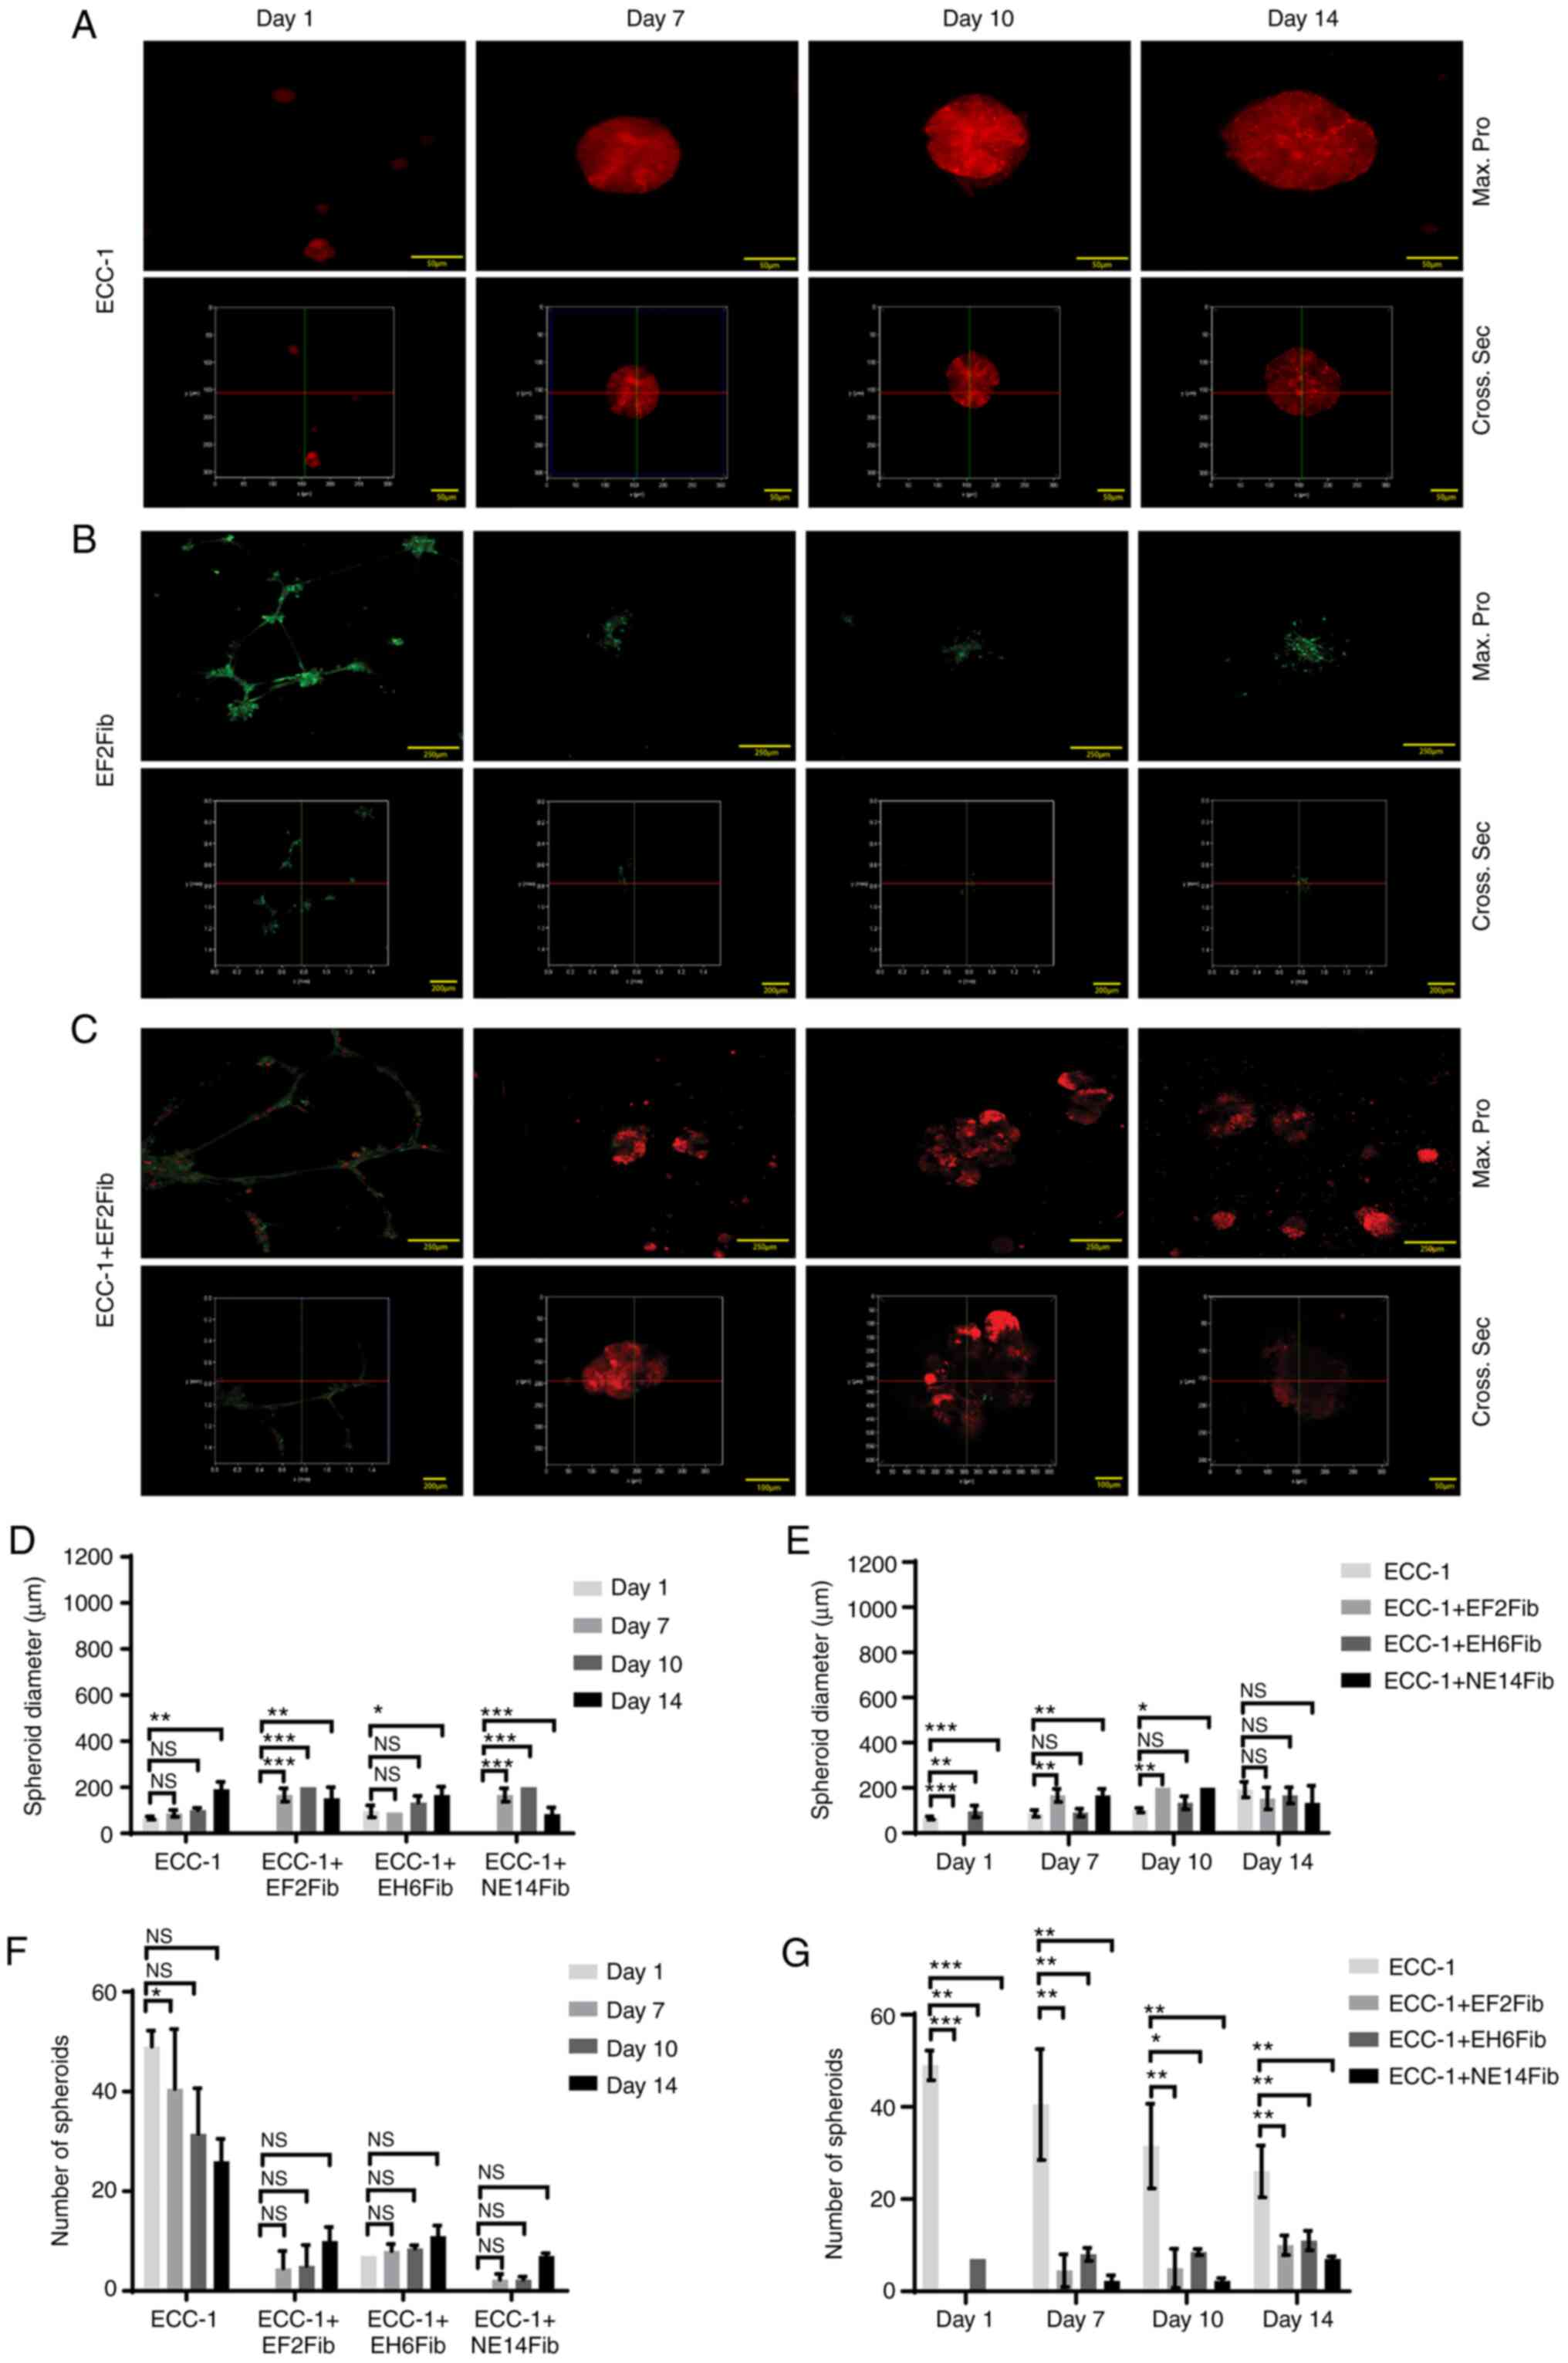 |
Figure 3.
BAFs did not promote EC spheroid formation in 3D culture. (A) ECC-1, (B) EF2Fib or (C) ECC-1 and EF2Fib were cultured on Matrigel® for 14 days. Confocal analysis (Max. Pro, upper panel) and 3D reconstruction analysis (Cross Sec, bottom panel) were performed over 14 days. Scale bar, 50, 200 and 250 µm. (D) The diameter of the spheroids was measured on day 1, 7, 10 and 14 using LAS X version 2.0. (E) The diameter of the spheroids were compared between the ECC-1 monoculture and the ECC-1 and BAFs co-culture on day 1, 7, 10 and 14. (F) The number of spheroids was calculated on day 1, 7, 10 and 14 using NIS Element version 4.30. (G) The number of spheroids was compared between the ECC-1 monoculture and ECC-1 and BAFs co-culture on day 1, 7, 10 and 14. *P<0.05, **P<0.01, ***P<0.001; one-way ANOVA followed by Bonferroni correction. Data are representative of two independent experiments and shown as the mean ± SEM. BAF, benign tissue-associated fibroblast; NS, not significant; max. pro, maximum protection; cross sec, cross section.
|
Co-culture of ECC-1 with another BAF line (EH6Fib) resulted in spheroids with an average diameter of 95.83±15.02 µm on day 1 (Fig. S5D). There was a slight increase in diameter at day 14 (166.7±20.83 µm) (Fig. 3D and E) but no significant change in the number of spheroids compared with day 1 (Fig. 3F and G). However, unlike EF2Fib and NE14Fib, EH6Fib did not form cell protrusions and projections (Fig. S5C). Altogether, our data suggested that BAFs were not able to promote EC spheroid formation.
Upregulation of RhoA expression and activation of RhoA/ROCK1 signaling in CAF-mediated motility and spheroid formation
To delineate the mechanisms underlying CAF-mediated EC tumor cell motility and spheroid formation, the expression of RhoA was examined. The primary function of this protein is to govern actin cytoskeleton reorganization (11). The involvement of these proteins was examined on day 1 when the tumor cells were actively migrating towards each other, and for spheroid formation on day 14 when the tumor cells had formed spheroids.
A previous study showed that the presence of the basement membrane in Matrigel® culture may affect the expression of RhoA (19). Compared with the non-Matrigel® cultures (2D cultures), the ECC-1 3D monoculture showed a 1.5-fold upregulation of RhoA mRNA expression on day 1, and that increased to 3-fold on day 14 (Fig. 4A). Moreover, when compared with the non-Matrigel cultures (2D cultures), in the CAF monocultures, RhoA expression was upregulated 4-fold on both day 1 and 14. In the ECC-1 and CAF co-cultures, a 5-fold upregulation of RhoA expression was observed on day 14 compared with the ECC-1 monoculture on day 1 (P<0.05; Fig. 4A).
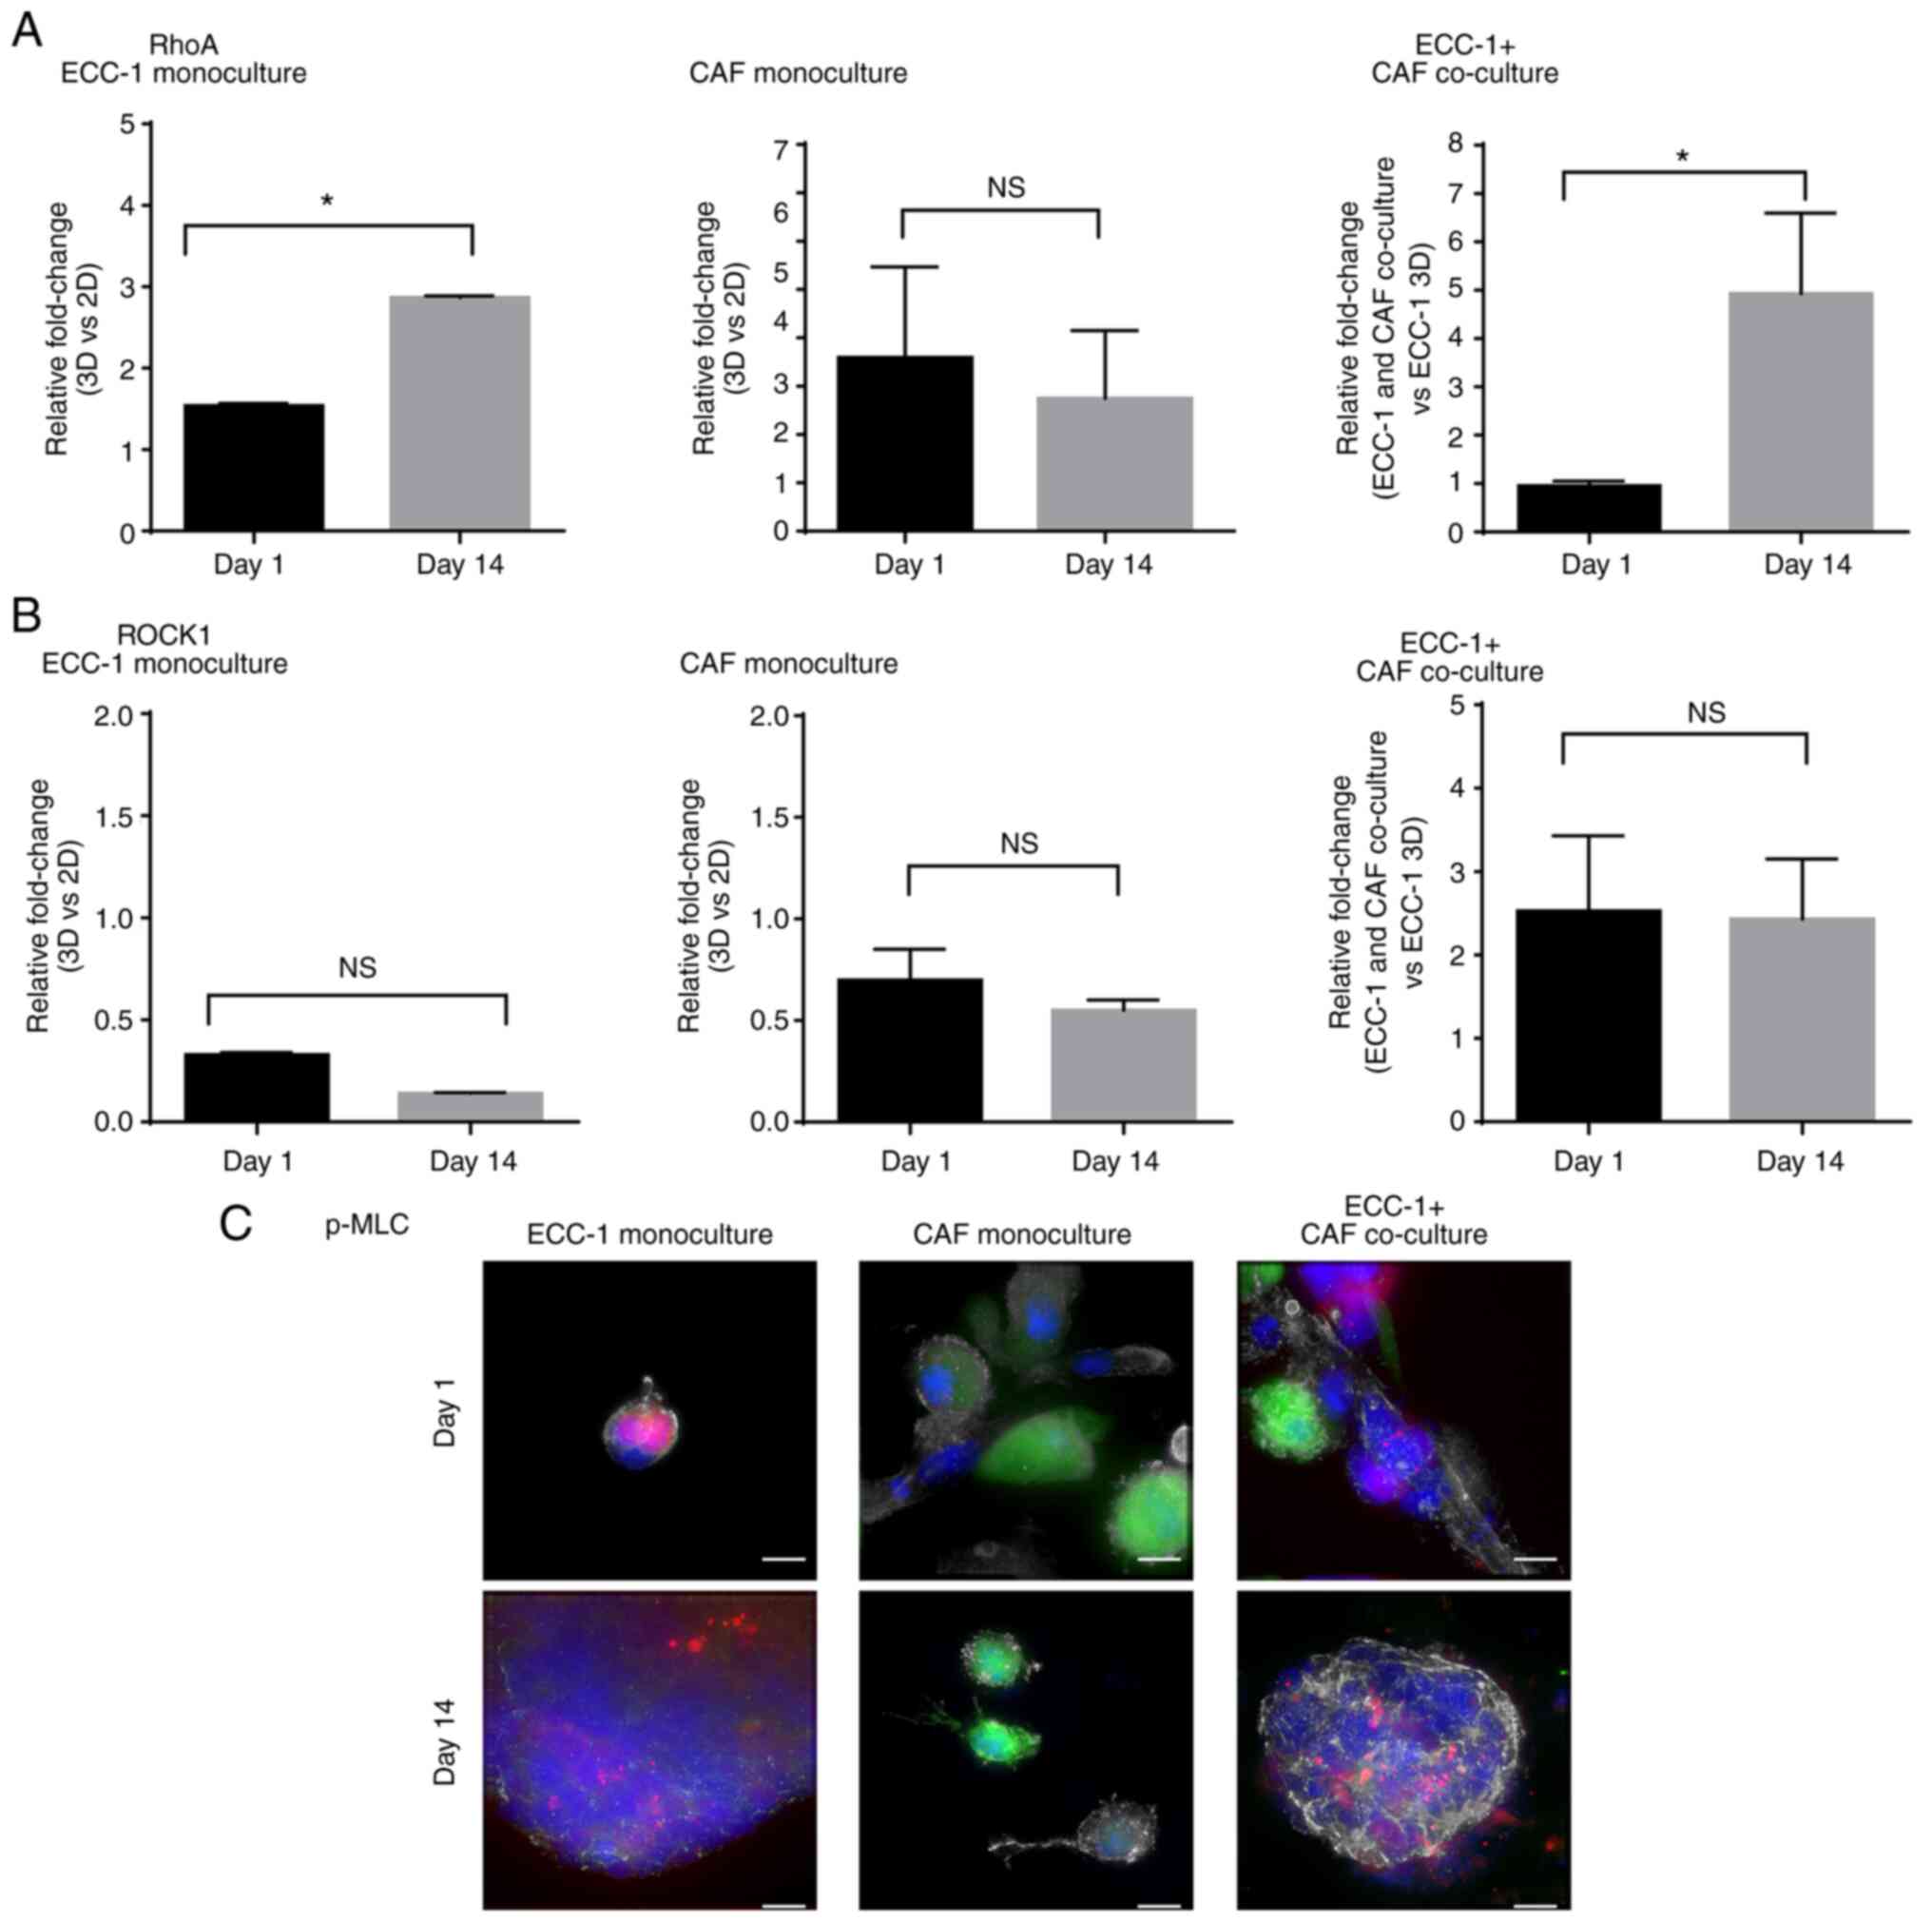 |
Figure 4.
RhoA expression and RhoA/ROCK1 signaling activation in ECC-1 cells, CAFs and ECC-1 and CAF co-cultures. Total RNA from ECC-1 monocultures, CAF monocultures and ECC-1 and CAF co-cultures was used for reverse transcription-quantitative PCR analysis of (A) RhoA and (B) ROCK1 mRNA expression on day 1 and 14. mRNA expression levels in the ECC-1 and CAF monocultures were normalized to those of ECC-1 and CAF 2D monocultures, respectively, whereas mRNA expression in ECC-1 and CAF co-culture was normalized to that of the ECC-1 3D monoculture. GAPDH was used as housekeeping gene. *P<0.05; two-tailed Student's t-test. Data are representative of two independent experiments and shown as the mean ± SEM. (C) The expression of p-MLC, a downstream effector of ROCK1 was examined using immunofluorescence in the ECC-1 monoculture, CAF monoculture, and the ECC-1 and CAF co-cultures on day 1 and 14. ECC-1 (RFP, red); CAFs (GFP, green); nucleus (DAPI, blue), p-MLC (Alexa Fluor® 647, grey). Images shown are representative of two independent experiments. Scale bar, 10 µm. CAF, cancer-associated fibroblast; RFP/GFP, red/green fluorescence protein; NS, not significant; ROCK1, Rho-associated, coiled-coil containing protein kinase 1; p-MLC, phosphorylated myosin light chain.
|
The expression of ROCK1, a downstream effector of RhoA (11), was then evaluated. ROCK1 was not upregulated in ECC-1 and CAF monocultures on day 1 and 14 (Fig. 4B). Surprisingly, in the presence of CAFs, the expression of ROCK1 increased 2.5-fold on day 1, and this was maintained on day 14 (Fig. 4B). Immunofluorescence staining was then performed to evaluate the expression of p-MLC, a downstream effector of ROCK1 in RhoA/ROCK1 signaling (14,15). The p-MLC protein was highly expressed in ECC-1 and CAF co-cultures at day 14 compared with day 1 (Fig. 4C). However, the expression of p-MLC observed in ECC-1 monoculture and CAF monocultures was low in day 1 and 14 when compared to that in ECC-1 and CAF co-culture, respectively. Collectively, these data suggested that RhoA/ROCK1 signaling in fibroblasts was likely involved in EC motility and spheroid formation in the 3D culture system.
ROCK1 inhibitor Y-27632 abrogated CAF-mediated ECC-1 cell motility and spheroid formation
Y-27632, a selective ROCK1 inhibitor that targets ATP-competitive p160ROCK and ROCK1, was used to determine whether RhoA/ROCK1 signaling was required for the CAF-mediated increase in EC motility. Cell viability assays and phalloidin-TRITC staining were carried out in ECC-1, CAFs and BAFs in order to determine the optimal concentration of Y-27632 to be used. When Y-27632 was used at concentrations ranging from 0.2 to 50 µM, the viability of ECC-1 cells did not significantly change compared with vehicle-treated cells. However, at 100 µM, ECC-1 cell viability was reduced to 67.20±4.75% (Fig. S6A). CAFs and BAFs treated with concentrations ranging from 0.2 to 100 µM did not show significant changes in cell viability when compared with vehicle-treated cells (Fig. S6B and C). Moreover, ECC-1 cells showed no changes in morphology or in actin structures from concentration of 50 to 100 µM (Fig. S6D). Interestingly, fine and elongated cytoplasmic processes from the cell body were observed in CAFs, possibly due to the inhibition of stress fiber formation following Y-27632 treatment. Such an inhibitory effect was shown in a concentration-dependent manner and stress fiber formation was completely inhibited following treatment with 100 µM of Y-27632 (Fig. S6E-G). Similar observations were made in BAFs (Fig. S6H-J).
ECC-1 cells did not show significant changes in mean velocity following 16-h treatment with 100 µM Y-27632 (0.82±0.07 µm/h) compared with vehicle-treated cells (1.24±0.07 µm/h, P=0.0866) (Fig. 5A). However, this treatment significantly inhibited the mean velocity of the EC48Fib, EC49Fib and EC50Fib CAF lines, resulting in 63.52, 53.33 and 50.42% inhibition, respectively (Fig. 5B). In some of the ECC-1 and CAF co-cultures, Y-27632 significantly inhibited tumor cell velocity with an average 86.36 and 78.3% reduction, in ECC-1 and EC49Fib and ECC-1 and EC50Fib co-cultures, respectively (Fig. 5C). The inhibition was predominantly mediated by CAFs, as motility of ECC-1 cells alone were not affected.
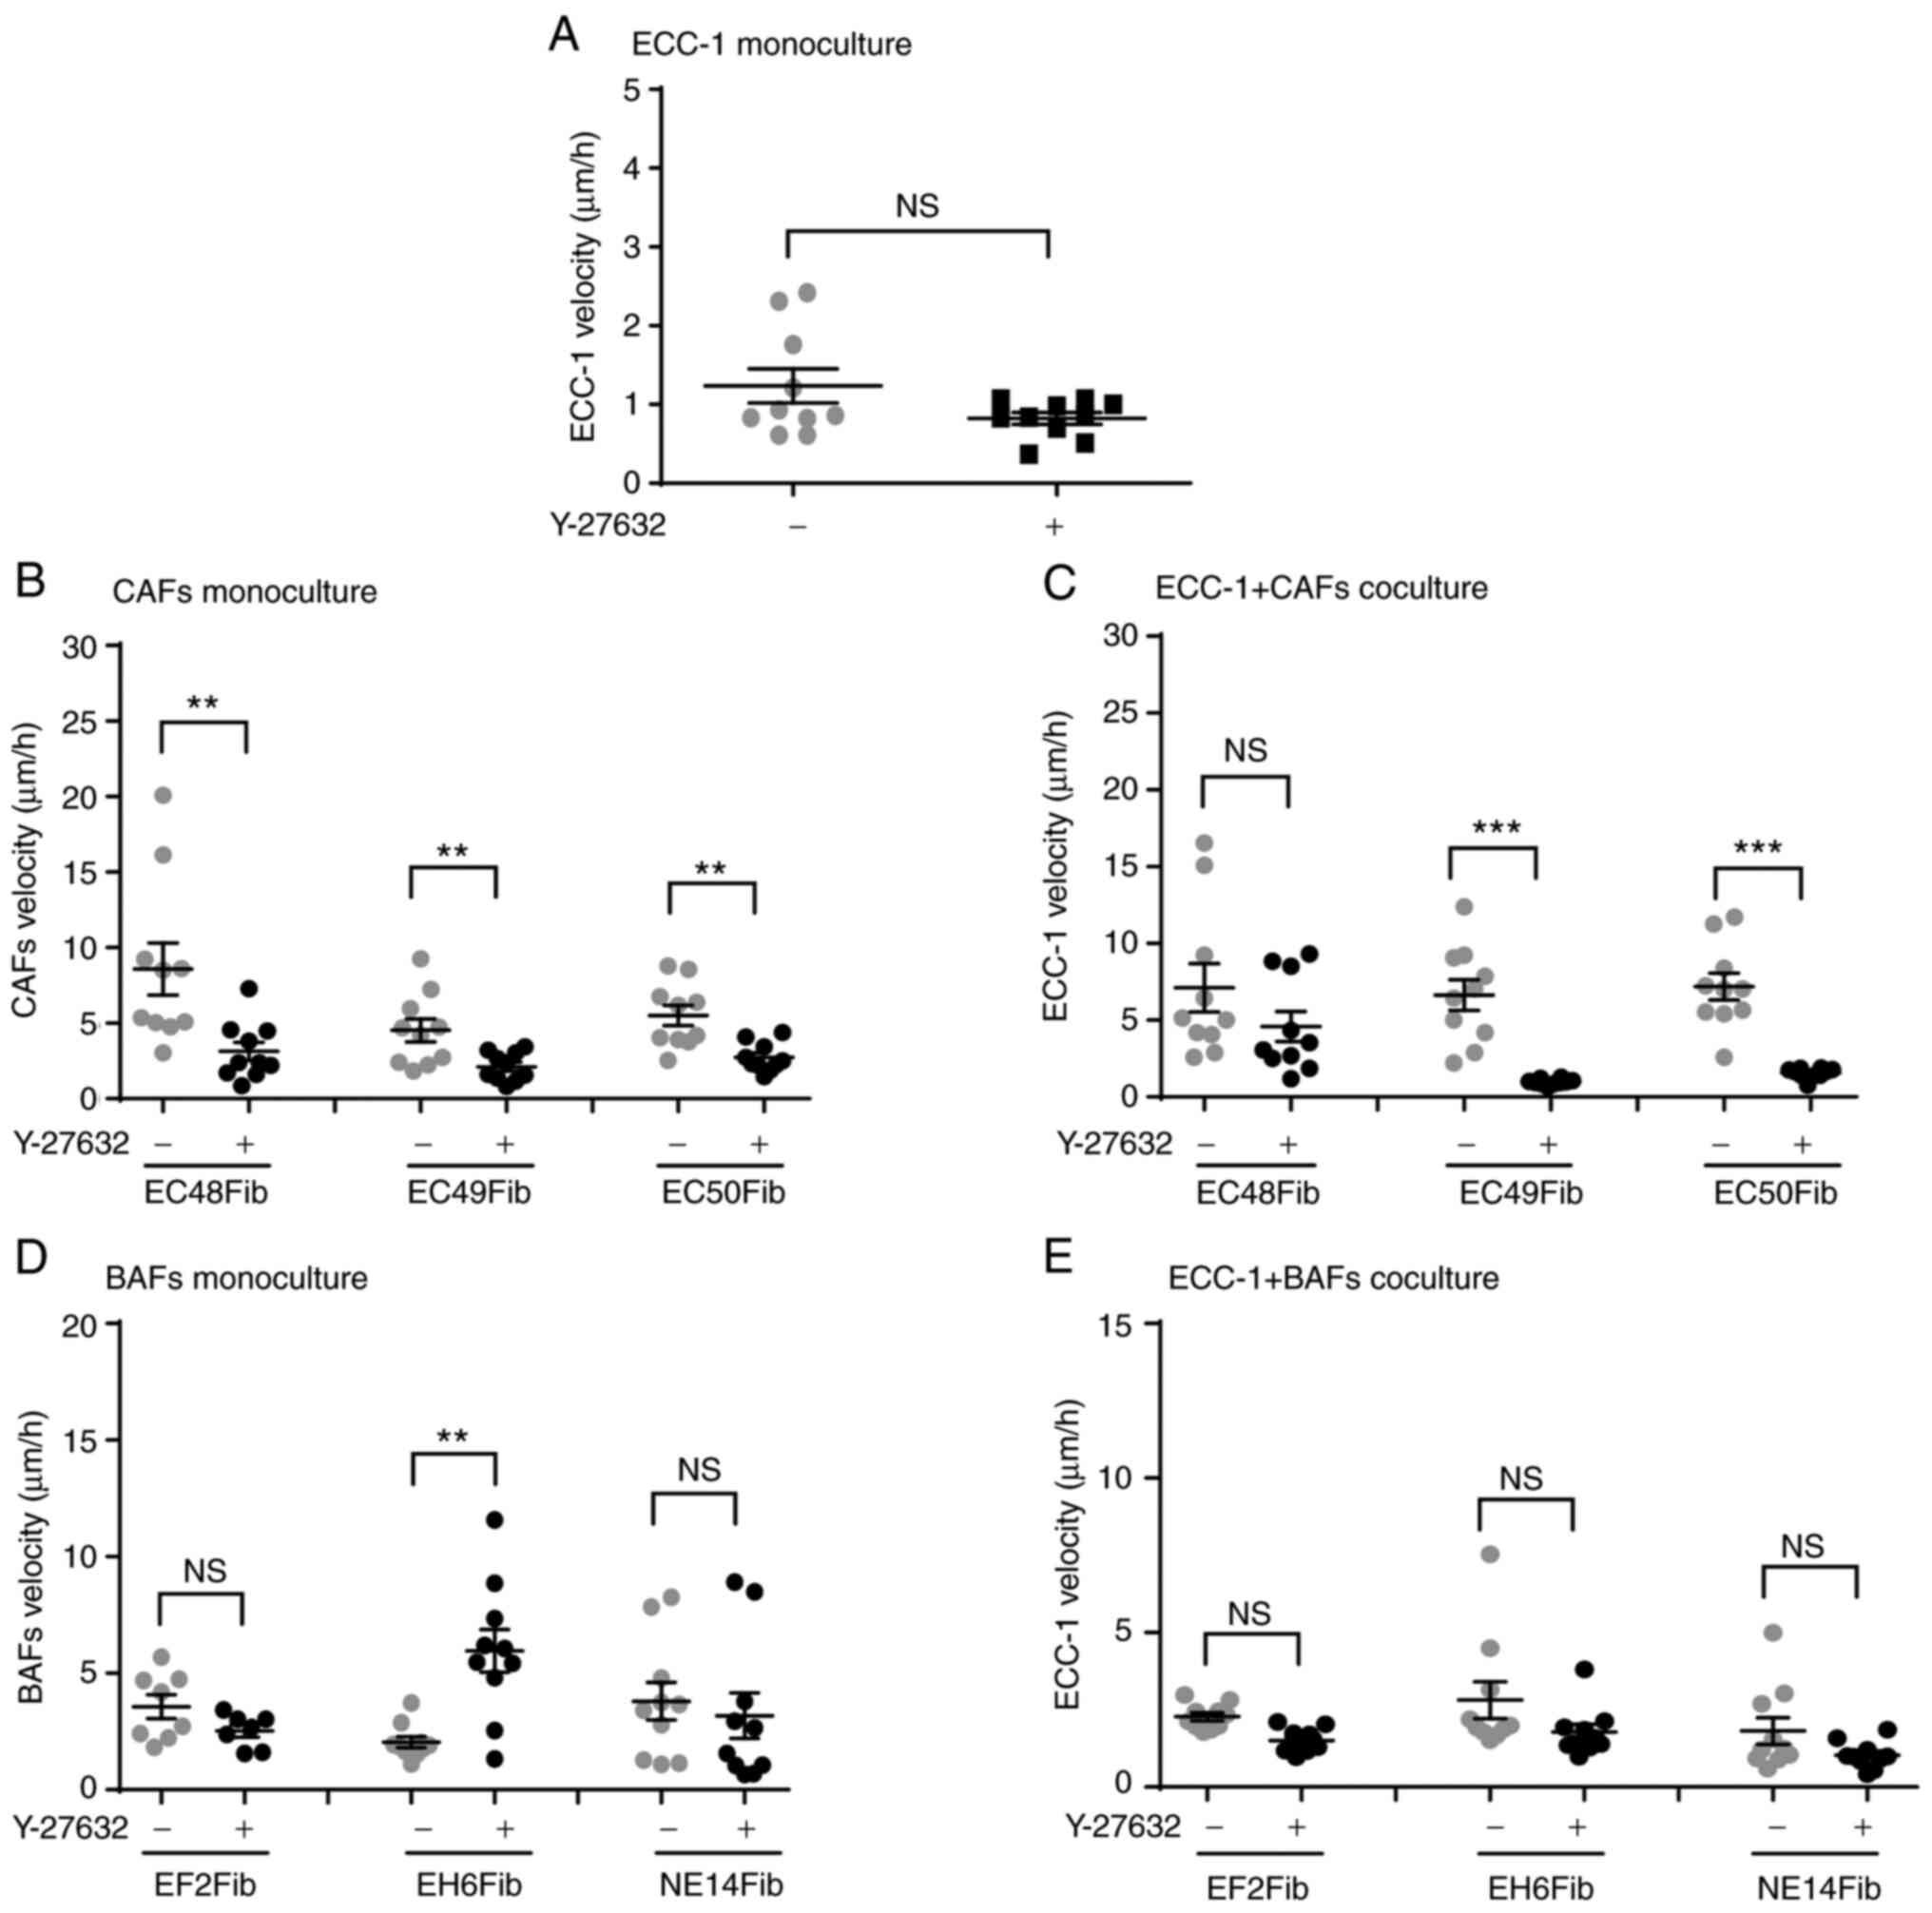 |
Figure 5.
ROCK1 inhibitor Y-27632 reduces ECC-1 and CAF velocity in 3D co-cultures. ECC-1 and fibroblasts 3D cultures were treated with the ROCK1 inhibitor Y-27632 (100 µM) for 16 h, then velocity was measured using live cell imaging software. (A) ECC-1 monoculture. (B) CAF monoculture. (C) ECC-1 and CAF co-culture. (D) BAF monoculture. (E) ECC-1 and BAF co-culture. **P<0.01, ***P<0.001; unpaired Student's t-test. Data are representative of two independent experiments and shown as the mean ± SEM. Each data point represents an individual cell. CAF, cancer-associated fibroblast; BAF, benign tissue-associated fibroblast; ROCK1, Rho-associated, coiled-coil containing protein kinase 1.
|
Inhibition of ROCK1 did not alter BAF velocity in monoculture compared with the vehicle-treated cells, except in EH6Fib, resulting in a 33.35% increase (Fig. 5D). There was no significant change observed in ECC-1 velocity in the co-culture with BAFs (Fig. 5E). Taken together, these results suggested that activation of ROCK1 signaling was required for CAF motility, which subsequently also affected EC cell motility in the co-culture model.
The next experiments further assessed whether RhoA/ROCK1 signaling was required for tumor spheroid formation. Compared with the control (10% FBS culture medium), in CAFs treated with 100 µM Y-27632 for 24 h, fine and elongated cytoplasmic processes from the cell body were observed, likely due to inhibition of stress fiber formation (Fig. 6A-C; Data S14, S15 and S16). Although there was no change in ECC-1 monoculture morphology following Y-27632 treatment (Fig. 6D; Data S17), the formation of tumor spheroids in the ECC-1 and CAF co-culture model was markedly inhibited (Fig. 6E-G; Data S18, S19 and S20). The formation of fine cytoplasmic processes from CAFs restricted ECC-1 movement across CAF cell projections, thus inhibiting spheroid formation. Although BAFs also formed cytoplasmic processes upon treatment with Y-27632 (Fig. 6H-J; Data S21, S22 and S23), no spheroid formation was observed in ECC-1 and BAF co-cultures (Fig. 6K-M; Data S24, S25 and S26). Altogether, these data suggested that RhoA/ROCK1 signaling was required for CAF motility and formation of tumor spheroids in 3D cultures.
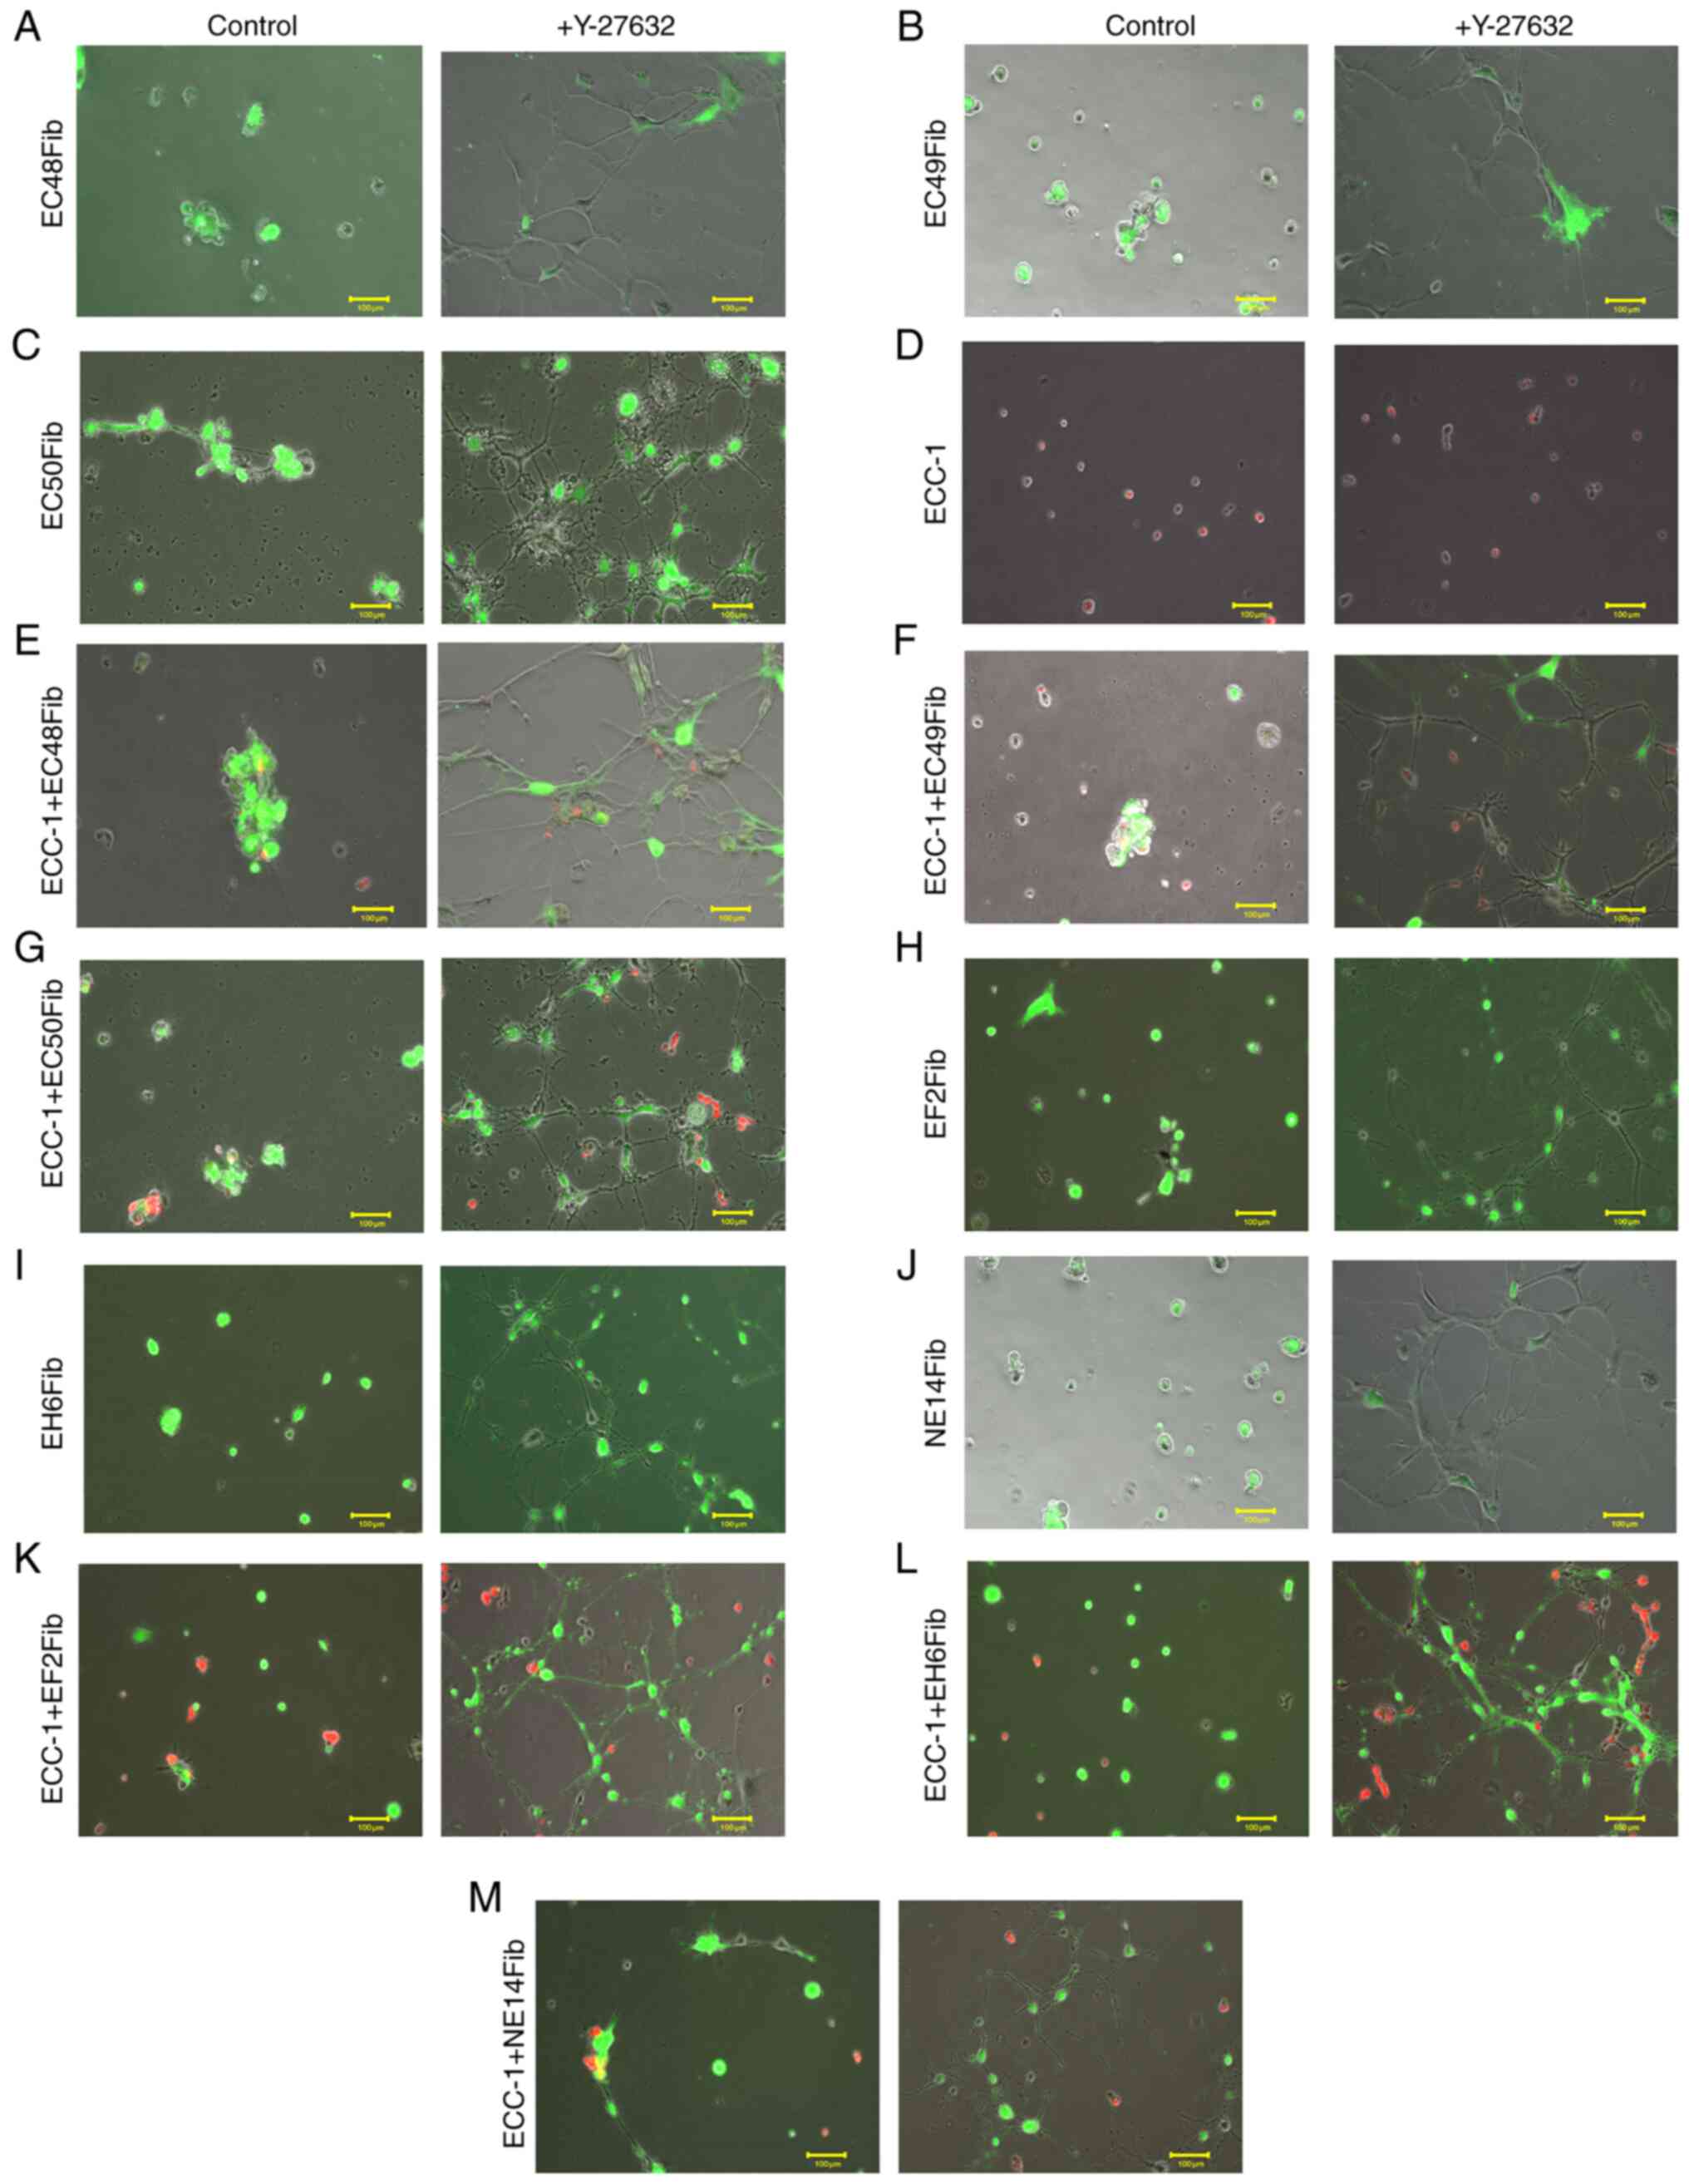 |
Figure 6.
Inhibition of RhoA/ROCK1 signaling inhibits CAF-mediated spheroid formation. ECC-1 and fibroblast 3D cultures were used for spheroid formation analysis using live cell imaging following treatment with the ROCK1 inhibitor Y-27632 (100 µM) for 24 h. (A) EC48Fib, (B) EC49Fib and (C) EC50Fib CAF monoculture. (D) ECC-1 monoculture. (E) ECC-1 and EC48Fib co-culture. (F) ECC-1 and EC49Fib co-culture. (G) ECC-1 and EC50Fib co-culture. (H) EF2Fib, (I) EH6 Fib, (J) NE14Fib monoculture. (K) ECC-1 and EF2Fib co-culture. (L) ECC-1 and EH6Fib co-culture. (M) ECC-1 and NE14Fib co-culture. Scale bar, 100 µm. The images shown are representative of two independent experiments. CAF, cancer-associated fibroblast; ROCK1, Rho-associated, coiled-coil containing protein kinase 1.
|
Discussion
The present study evaluated the effect of CAFs on EC cell motility and spheroid formation in a 3D culture system. The findings demonstrated that i) CAFs, but not BAFs, provided contact guidance to EC cells to move along their long axes in 3D cultures; ii) CAFs enhanced EC cell motility and promoted spheroid formation in 3D cultures; and iii) RhoA/ROCK1 signaling pathway was partly involved in CAF-mediated EC cell motility. This supports the notion that CAFs may have an important role in the EC metastatic cascade by enabling the tumor cells to move towards each other in forming spheroids in a 3D environment.
It has long been recognized that crosstalk between tumor cells and their microenvironment alters the mechanistic property of tumor cells in proliferation, motility and metastasis (20). Secretion of exosomes and microRNA from cancer cells can turn normal fibroblasts into CAFs (21). CAFs govern epithelial-to-mesenchymal transition (EMT) by remodeling the ECM and secreting growth factors or cytokines to stimulate cancer cell growth (21). CAFs also secrete pro-tumorigenic factors, including IL-6, IL-8, stromal-derived factor-1 α, VEGF, tenascin C, and matrix metalloproteinases, which recruit additional tumor and pro-tumorigenic cells to the developing microenvironment (21). CAFs have been shown to exhibit pro-malignant properties and to promote EC tumor growth, migration and invasion (16,22,23). In the present study, BAFs served as a control fibroblast type originating from benign endometrial tissue. Using similar experimental settings, it was observed that, when co-cultured with EC cells for 24 h, CAFs exhibited a very different phenotype and could migrate top of EC cells on the basement membrane. However, this observation was not seen with BAFs, indicating that the co-culture duration was not sufficient to induce a change from BAFs to CAFs to show similar migratory phenotype.
In previous studies, despite the different levels of CAF activation and the heterogeneity between patients (24,25), CAFs isolated from patients with EC have been suggested to promote tumor cell proliferation by regulating the secretory cytokine IL-6 to activate STAT3/c-Myc signaling in EC cells (16,26). However, fibroblasts isolated from proliferative normal endometrium could suppress the growth of the Ishikawa EC cell line, even in the presence of estrogen and in cultures on basement membranes (27,28). In BAFs, Luo et al (29) showed that the proliferation activity of fibroblast isolated from uterine fibroid was enhanced post estrogen stimulation. The estrogen-mediated MEK, ERK1/2 and AKT signaling pathways involved in cell proliferation were also activated.
Pineda et al (30) suggested that treatment of benign stromal cells with estrogen and progesterone significantly inhibited stromal cells proliferation. In contrast, proliferation of stromal cells from high-grade EC was minimally affected by the addition of estrogen and progesterone. Stromal cells from low-grade EC exhibited a more varied proliferative response. In CAFs, the effect of estrogen alone on CAFs growth remains unclear. In EC cells, estrogen alone promoted tumor growth over a period of 32 days in vivo (30). Similarly, Yang et al (31) demonstrated that estrogen could promote EC cell proliferation in a dose-dependent manner by upregulating prohibitin expression.
The present study identified another pro-tumorigenic role for CAFs: Mediating EC cell motility and spheroid formation. In the present study, the 3D tumor-fibroblast co-culture model used Matrigel® as a surrogate basement membrane. This method promoted direct cell-to-cell contact, allowing CAFs to make cellular networks via cell projections and provided contact guidance for EC cells to move towards each other during spheroid formation. Such observations are novel in EC, as fibroblasts were previously shown to facilitate cancer cell migration either via secretory factors to induce EMT in tumor cells (32–34) or to generate tracks in the ECM for collective tumor cell migration (35). In 3D spheroid formation, concentration gradients of nutrients, oxygen and catabolites are generated in necrotic areas (36–38). As the ECC-1 and CAF co-cultures form 3D spheres, hypoxic cores were generated in the center of the spheres. This may explain the loss of GFP signal from the fibroblasts over time, whereby the hypoxic core may induce necrosis or apoptosis in CAFs encapsulated in the core.
The present findings suggested that direct cell-to-cell contact between fibroblasts and cancer cells is crucial in enhancing cancer cell motility. In non-small cell lung cancer (NSCLC), Choe et al (39) showed that CAFs could enhance the motility of NSCLC cells through direct cell-to-cell contact via the Hedgehog signaling pathway. Interestingly, increased tumor cell migration was only shown in a direct co-culture system, suggesting that CAF-mediated NSCLC cell migration is mediated by direct cell-to-cell contact (33). Henriksson et al (40) further demonstrated that, in cell-to-cell contact, a heterotypic E-cadherin/N-cadherin adhesion complex between CAFs and squamous cell carcinoma cells is crucial for CAF-mediated cancer cell migration and invasion. This occurs through the ECM via integrin-mediated cytoskeleton remodeling and actomyosin reassembly, while dragging tumor cells through CAF-cancer cell interactions (40). Compared with their benign counterparts, CAFs from the EC tissue exhibit migratory phenotypes.
However, it is unknown why CAFs acquire these phenotypes differently from BAFs, including the ability to form cellular networks via cell projection to facilitate tumor cell migration. Reciprocal influence between cancer cells and fibroblasts may alter certain molecular and functional characteristics related to cell adhesion, induction of membrane fluidity, migration velocity and directionality (41). For example, an increase in N-cadherin was observed in breast cancer cells after interacting with CAFs, but not with BAFs (41). It is indeed an interesting observation that BAF velocity increased following co-culture with tumor cells. This may be explained by evidence from Bussard et al (21) that show certain cytokines secreted from cancer cells promote the conversion of resident fibroblast into highly migrating fibroblasts. Treatment with conditioned medium from colon cancer cells activates fibroblasts, as revealed by increased fibroblast activation protein α expression, a marker of fibroblast activation (40). Indeed, direct cell-to-cell physical contact and interaction with the basement membrane endow tumor cells with metastatic behavior (35,42), including formation of spheroids to survive the extravasation process into the bloodstream (43,44). It may then be worthwhile to investigate the profile of cell adhesion molecules in BAFs and CAFs and determine their effects on the metastatic potential of EC cells.
Our 3D model reveals that the regulation of stress fiber in cell projection formation may be a key factor in CAF-mediated motility in EC cells. Initially, ECC-1 tumor cells and fibroblasts were isolated from the mixed co-culture using human CD90 anti-fibroblast and human CD326 (EpCAM) magnetic microbeads, with the aim of analyzing the gene expression in each cell type separately. Due to the limited quantity and quality of the RNA obtained, gene expression from isolated single cell types was not possible. Thus, the level of gene expression shown was from mixed RNA from the two cell types in ECC-1 and CAF co-culture.
Reorganization of actin cytoskeleton during cell motility is governed by the Rho family of GTPases (11). In terms of single-cell motility, these GTPases are required for membrane protrusion in the cell front (lamellipodia, filopodia and/or membrane blebs), formation of new adhesion, cell body contraction and detachment of the cell tails (45). The Rho/ROCK1 signaling pathway can be activated by various activated membrane receptors, such as G protein-coupled receptors, tyrosine kinase receptors, and intracellular receptors (46). RhoA has also been shown to be activated by several cytokines and inflammatory mediators (46). Both IL-4 and −13 upregulate RhoA via activator transcription factor 6 in smooth muscle cells (47,48). In addition, angiotensin II can activate the Rho/ROCK1 signaling pathway (49).
Overexpression of the Rho family of GTPases, RhoA, Rac1 and CDC42 in human tumors has been associated with cytoskeleton rearrangements for cell motility (50). Among them, ROCK1 is one of the most important effector molecules downstream of RhoA. There are two homologous isomers in the cell: ROCK1 and ROCK2. Although ROCK1 and ROCK2 have different upstream signals, their substrates include myosin light chain (MLC). However, in gene silencing experiments, Yoneda et al (51) and Wang et al (52) suggested different cellular functions for these two proteins. ROCK1 appears to be essential for the formation of stress fibers, whereas ROCK2 appears to be necessary for phagocytosis and cell contraction. In fact, the formation of stress fiber in CAFs requires activation of ROCK1 by RhoA (53). Thus, one of the aims of the present study was to examine the role of stress fiber formation in CAF cell projection on EC cell motility. The inhibition of ROCK1 activity using Y-27632 resulted in a complete loss of stress fiber formation and development of long cytoplasmic processes in endometrial CAFs, in accordance with previous studies (54,55). Ishizaki et al (56) suggested that Y-27632 inhibited ROCK1 by competing with ATP for its binding to the kinase, causing induction of thin processes extending over the original size of the cells, as evidenced by ROCK1 protein inactivation. Currently, there is no treatment with ROCK1 inhibition or clinical trial conducted on EC. However, in a phase-1 clinical study, ROCK inhibition using K-115, a Rho kinase inhibitor, lowered intraocular pressure in health adult eyes (57). Furthermore, Okumura et al (58) also demonstrated that ROCK1 inhibitors treatment improved corneal endothelial diseases in preclinical and clinical study (58). Lastly, two ROCK1 inhibitors have been licensed for clinical use in Japan; fasudil for the treatment of cerebral vasospasms and ripasudil for glaucoma treatment (59,60).
ROCK1 signaling is also crucial for CAF-mediated physical remodeling of the ECM, a process favoring tumor aggressiveness and dissemination. Gaggioli et al (61) showed that CAFs utilize the Rho/ROCK1 pathway to create force-dependent movements, in which they migrate and form tracks in the matrix for the neighboring neoplastic cells to follow. Stimulated by extracellular signals such as Yes-associated protein, ROCK1-driven actomyosin contractility is also required to promote transformation of fibroblasts into CAFs (62). This may explain how interferences on Rho/ROCK1 pathway could lead to the inhibition of breast cancer cell migration and proliferation in vitro and bone metastasis in vivo (63).
In conclusion, the present study described how CAFs can support processes in EC early dissemination. Using a 3D model, it was demonstrated that CAFs facilitate EC cell motility, via their cell projections, to allow EC cells migration towards each other in forming spheroids. These processes were in part dependent on RhoA/ROCK1 signaling pathway, as chemical inhibition of ROCK1 diminished CAF-mediated EC motility and subsequently the spheroid formation in a 3D in vitro model. Thus, it is worth exploring the therapeutic potential of RhoA/ROCK1 pathway inhibitors in metastatic EC in vivo models, in which their application may provide a new paradigm in treating aggressive EC.
Supplementary Material
Supporting Data
Supporting Data
Supporting Data
Supporting Data
Supporting Data
Supporting Data
Supporting Data
Supporting Data
Supporting Data
Supporting Data
Supporting Data
Supporting Data
Supporting Data
Supporting Data
Supporting Data
Supporting Data
Supporting Data
Supporting Data
Supporting Data
Supporting Data
Supporting Data
Supporting Data
Supporting Data
Supporting Data
Supporting Data
Supporting Data
Supporting Data
Acknowledgements
Not applicable.
Funding
This work was supported by a Frontier Research Grant (grant no. FG022-17AFR) from the University of Malaya.
Availability of data and materials
The datasets used and/or analyzed during the current study are available from the corresponding author on reasonable request.
Authors' contributions
YCV, NABMS and IC conceived and designed the experiments. YCV and ISO, MHW performed the experiments and analyzed the data. YCV, ISO, MHW, NABMS and IC wrote the main manuscript text. YCV, ISO and IC confirmed the authenticity of all the raw data. All authors have read and approved the final manuscript.
Ethics approval and consent to participate
This study was approved by The University of Malaya Medical Centre Ethics Committee (approval no. 865.19). All experiments were performed in accordance with relevant guidelines and regulations. Written informed consent was obtained from all participants.
Patient consent for publication
Not applicable.
Competing interests
The authors declare that they have no competing interests.
Glossary
Abbreviations
Abbreviations:
|
BAF
|
benign tissue-associated fibroblast
|
|
CAF
|
cancer-associated fibroblast
|
|
EC
|
endometrial cancer
|
|
ECM
|
extracellular matrix
|
|
GFP
|
green fluorescence protein
|
|
MLC
|
myosin light chain
|
|
NS
|
not significant
|
|
RFP
|
red fluorescence protein
|
|
ROCK1
|
Rho-associated, coiled-coil containing protein kinase 1
|
|
TRITC
|
tetramethylrhodamine
|
References
|
1
|
American Cancer Society, . Key statistics for endometrial cancer. Journal. 2018.
|
|
2
|
World Cancer Research Fund International, . Endometrial cancer (cancer of the lining of the womb) statistics. Journal. 2018.
|
|
3
|
American Cancer Society, . Cancer facts & figures 2015. https://oralcancerfoundation.org/wp-content/uploads/2016/03/Us_Cancer_Facts.pdf
|
|
4
|
Bokhman JV: Two pathogenetic types of endometrial carcinoma. Gynecol Oncol. 15:10–17. 1983. View Article : Google Scholar : PubMed/NCBI
|
|
5
|
Amant F, Moerman P, Neven P, Timmerman D, Van Limbergen E and Vergote I: Endometrial cancer. Lancet. 366:491–505. 2005. View Article : Google Scholar : PubMed/NCBI
|
|
6
|
Bansal N, Yendluri V and Wenham RM: The molecular biology of endometrial cancers and the implications for pathogenesis, classification, and targeted therapies. Cancer Control. 16:8–13. 2009. View Article : Google Scholar : PubMed/NCBI
|
|
7
|
Baiden-Amissah REM, Annibali D, Tuyaerts S and Amant F: Endometrial cancer molecular characterization: The key to identifying high-risk patients and defining guidelines for clinical decision-making? Cancers (Basel). 13:39882021. View Article : Google Scholar : PubMed/NCBI
|
|
8
|
Cancer Genome Atlas Research Network, ; Kandoth C, Schultz N, Cherniack AD, Akbani R, Liu Y, Shen H, Robertson AG, Pashtan I, Shen R, et al: Integrated genomic characterization of endometrial carcinoma. Nature. 497:67–73. 2013. View Article : Google Scholar : PubMed/NCBI
|
|
9
|
Welch DR and Hurst DR: Defining the hallmarks of metastasis. Cancer Res. 79:3011–3027. 2019. View Article : Google Scholar : PubMed/NCBI
|
|
10
|
Kurra V, Krajewski KM, Jagannathan J, Giardino A, Berlin S and Ramaiya N: Typical and atypical metastatic sites of recurrent endometrial carcinoma. Cancer Imaging. 13:113–122. 2013. View Article : Google Scholar : PubMed/NCBI
|
|
11
|
Ridley AJ: Rho GTPase signalling in cell migration. Curr Opin Cell Biol. 36:103–112. 2015. View Article : Google Scholar : PubMed/NCBI
|
|
12
|
Goubran HA, Kotb RR, Stakiw J, Emara ME and Burnouf T: Regulation of tumor growth and metastasis: The role of tumor microenvironment. Cancer Growth Metastasis. 7:9–18. 2014. View Article : Google Scholar : PubMed/NCBI
|
|
13
|
Cirri P and Chiarugi P: Cancer associated fibroblasts: The dark side of the coin. Am J Cancer Res. 1:482–497. 2011.PubMed/NCBI
|
|
14
|
Dvorak HF: Tumors: Wounds that do not heal-redux. Cancer Immunol Res. 3:1–11. 2015. View Article : Google Scholar : PubMed/NCBI
|
|
15
|
Kalluri R and Zeisberg M: Fibroblasts in cancer. Nat Rev Cancer. 6:392–401. 2006. View Article : Google Scholar : PubMed/NCBI
|
|
16
|
Subramaniam KS, Tham ST, Mohamed Z, Woo YL, Mat Adenan NA and Chung I: Cancer-associated fibroblasts promote proliferation of endometrial cancer cells. PLoS One. 8:e689232013. View Article : Google Scholar : PubMed/NCBI
|
|
17
|
Livak KJ and Schmittgen TD: Analysis of relative gene expression data using real-time quantitative PCR and the 2(-Delta Delta C(T)) method. Methods. 25:402–408. 2001. View Article : Google Scholar : PubMed/NCBI
|
|
18
|
Jain P, Worthylake RA and Alahari SK: Quantitative analysis of random migration of cells using time-lapse video microscopy. J Vis Exp. e35852012.PubMed/NCBI
|
|
19
|
Vega FM, Fruhwirth G, Ng T and Ridley AJ: RhoA and RhoC have distinct roles in migration and invasion by acting through different targets. J Cell Biol. 193:655–665. 2011. View Article : Google Scholar : PubMed/NCBI
|
|
20
|
Baghban R, Roshangar L, Jahanban-Esfahlan R, Seidi K, Ebrahimi-Kalan A, Jaymand M, Kolahian S, Javaheri T and Zare P: Tumor microenvironment complexity and therapeutic implications at a glance. Cell Commun Signal. 18:592020. View Article : Google Scholar : PubMed/NCBI
|
|
21
|
Bussard KM, Mutkus L, Stumpf K, Gomez-Manzano C and Marini FC: Tumor-associated stromal cells as key contributors to the tumor microenvironment. Breast Cancer Res. 18:842016. View Article : Google Scholar : PubMed/NCBI
|
|
22
|
Orimo A, Tomioka Y, Shimizu Y, Sato M, Oigawa S, Kamata K, Nogi Y, Inoue S, Takahashi M, Hata T and Muramatsu M: Cancer-associated myofibroblasts possess various factors to promote endometrial tumor progression. Clin Cancer Res. 7:3097–3105. 2001.PubMed/NCBI
|
|
23
|
Teng F, Tian WY, Wang YM, Zhang YF, Guo F, Zhao J, Gao C and Xue FX: Cancer-associated fibroblasts promote the progression of endometrial cancer via the SDF-1/CXCR4 axis. J Hematol Oncol. 9:82016. View Article : Google Scholar : PubMed/NCBI
|
|
24
|
Neuzillet C, Tijeras-Raballand A, Ragulan C, Cros J, Patil Y, Martinet M, Erkan M, Kleeff J, Wilson J, Apte M, et al: Inter- and intra-tumoural heterogeneity in cancer-associated fibroblasts of human pancreatic ductal adenocarcinoma. J Pathol. 248:51–65. 2019. View Article : Google Scholar : PubMed/NCBI
|
|
25
|
Costa A, Kieffer Y, Scholer-Dahirel A, Pelon F, Bourachot B, Cardon M, Sirven P, Magagna I, Fuhrmann L, Bernard C, et al: Fibroblast heterogeneity and immunosuppressive environment in human breast cancer. Cancer Cell. 33:463–479.e10. 2018. View Article : Google Scholar : PubMed/NCBI
|
|
26
|
Subramaniam KS, Omar IS, Kwong SC, Mohamed Z, Woo YL, Mat Adenan NA and Chung I: Cancer-associated fibroblasts promote endometrial cancer growth via activation of interleukin-6/STAT-3/c-Myc pathway. Am J Cancer Res. 6:200–213. 2016.PubMed/NCBI
|
|
27
|
Arnold JT, Lessey BA, Seppälä M and Kaufman DG: Effect of normal endometrial stroma on growth and differentiation in Ishikawa endometrial adenocarcinoma cells. Cancer Res. 62:79–88. 2002.PubMed/NCBI
|
|
28
|
Shi M, Zhang H, Li M, Xue J, Fu Y, Yan L and Zhao X: Normal endometrial stromal cells regulate survival and apoptosis signaling through PI3K/AKt/Survivin pathway in endometrial adenocarcinoma cells in vitro. Gynecol Oncol. 123:387–392. 2011. View Article : Google Scholar : PubMed/NCBI
|
|
29
|
Luo N, Guan Q, Zheng L, Qu X, Dai H and Cheng Z: Estrogen-mediated activation of fibroblasts and its effects on the fibroid cell proliferation. Transl Res. 163:232–241. 2014. View Article : Google Scholar : PubMed/NCBI
|
|
30
|
Pineda MJ, Lu Z, Cao D and Kim JJ: Influence of cancer-associated endometrial stromal cells on hormone-driven endometrial tumor growth. Horm Cancer. 6:131–141. 2015. View Article : Google Scholar : PubMed/NCBI
|
|
31
|
Yang B, Chen R, Liang X, Shi J, Wu X, Zhang Z and Chen X: Estrogen enhances endometrial cancer cells proliferation by upregulation of prohibitin. J Cancer. 10:1616–1621. 2019. View Article : Google Scholar : PubMed/NCBI
|
|
32
|
Kim SA, Lee EK and Kuh HJ: Co-culture of 3D tumor spheroids with fibroblasts as a model for epithelial-mesenchymal transition in vitro. Exp Cell Res. 335:187–196. 2015. View Article : Google Scholar : PubMed/NCBI
|
|
33
|
Yu Y, Xiao CH, Tan LD, Wang QS, Li XQ and Feng YM: Cancer-associated fibroblasts induce epithelial-mesenchymal transition of breast cancer cells through paracrine TGF-β signalling. Br J Cancer. 110:724–732. 2014. View Article : Google Scholar : PubMed/NCBI
|
|
34
|
Baulida J: Epithelial-to-mesenchymal transition transcription factors in cancer-associated fibroblasts. Mol Oncol. 11:847–859. 2017. View Article : Google Scholar : PubMed/NCBI
|
|
35
|
Gaggioli C: Collective invasion of carcinoma cells: When the fibroblasts take the lead. Cell Adh Migr. 2:45–47. 2008. View Article : Google Scholar : PubMed/NCBI
|
|
36
|
Däster S, Amatruda N, Calabrese D, Ivanek R, Turrini E, Droeser RA, Zajac P, Fimognari C, Spagnoli GC, Iezzi G, et al: Induction of hypoxia and necrosis in multicellular tumor spheroids is associated with resistance to chemotherapy treatment. Oncotarget. 8:1725–1736. 2017. View Article : Google Scholar : PubMed/NCBI
|
|
37
|
Riffle S and Hegde RS: Modeling tumor cell adaptations to hypoxia in multicellular tumor spheroids. J Exp Clin Cancer Res. 36:1022017. View Article : Google Scholar : PubMed/NCBI
|
|
38
|
Zanoni M, Piccinini F, Arienti C, Zamagni A, Santi S, Polico R, Bevilacqua A and Tesei A: 3D tumor spheroid models for in vitro therapeutic screening: A systematic approach to enhance the biological relevance of data obtained. Sci Rep. 6:191032016. View Article : Google Scholar : PubMed/NCBI
|
|
39
|
Choe C, Shin YS, Kim SH, Jeon MJ, Choi SJ, Lee J and Kim J: Tumor-stromal interactions with direct cell contacts enhance motility of non-small cell lung cancer cells through the hedgehog signaling pathway. Anticancer Res. 33:3715–3723. 2013.PubMed/NCBI
|
|
40
|
Henriksson ML, Edin S, Dahlin AM, Oldenborg PA, Öberg Å, Van Guelpen B, Rutegård J, Stenling R and Palmqvist R: Colorectal cancer cells activate adjacent fibroblasts resulting in FGF1/FGFR3 signaling and increased invasion. Am J Pathol. 178:1387–1394. 2011. View Article : Google Scholar : PubMed/NCBI
|
|
41
|
Angelucci C, Lama G, Proietti G, Fabbri C, Masetti R, Sica S and Maulucci G: Breast cancer cells and fibroblasts in co-culture: Reciprocal influences on cell adhesion, membrane fluidity and migration. Ital J Anat Embryol. 116:122011.
|
|
42
|
Wolf K, Wu YI, Liu Y, Geiger J, Tam E, Overall C, Stack MS and Friedl P: Multi-step pericellular proteolysis controls the transition from individual to collective cancer cell invasion. Nat Cell Biol. 9:893–904. 2007. View Article : Google Scholar : PubMed/NCBI
|
|
43
|
Djamgoz MB, Coombes RC and Schwab A: Ion transport and cancer: From initiation to metastasis. Philos Trans R Soc Lond B Biol Sci. 369:201300922014. View Article : Google Scholar : PubMed/NCBI
|
|
44
|
MacDonald IC, Groom AC and Chambers AF: Cancer spread and micrometastasis development: Quantitative approaches for in vivo models. Bioessays. 24:885–893. 2002. View Article : Google Scholar : PubMed/NCBI
|
|
45
|
Spiering D and Hodgson L: Dynamics of the Rho-family small GTPases in actin regulation and motility. Cell Adh Migr. 5:170–180. 2011. View Article : Google Scholar : PubMed/NCBI
|
|
46
|
Liu J, Gao HY and Wang XF: The role of the Rho/ROCK signaling pathway in inhibiting axonal regeneration in the central nervous system. Neural Regen Res. 10:1892–1896. 2015. View Article : Google Scholar : PubMed/NCBI
|
|
47
|
Chiba Y, Goto K, Momata M, Kobayashi T and Misawa M: Induction of RhoA gene expression by interleukin-4 in cultured human bronchial smooth muscle cells. J Smooth Muscle Res. 46:217–224. 2010. View Article : Google Scholar : PubMed/NCBI
|
|
48
|
Chiba Y, Nakazawa S, Todoroki M, Shinozaki K, Sakai H and Misawa M: Interleukin-13 augments bronchial smooth muscle contractility with an up-regulation of RhoA protein. Am J Respir Cell Mol Biol. 40:159–167. 2009. View Article : Google Scholar : PubMed/NCBI
|
|
49
|
Villar-Cheda B, Dominguez-Meijide A, Joglar B, Rodriguez-Perez AI, Guerra MJ and Labandeira-Garcia JL: Involvement of microglial RhoA/Rho-kinase pathway activation in the dopaminergic neuron death. Role of angiotensin via angiotensin type 1 receptors. Neurobiol Dis. 47:268–279. 2012. View Article : Google Scholar : PubMed/NCBI
|
|
50
|
Etienne-Manneville S and Hall A: Rho GTPases in cell biology. Nature. 420:629–635. 2002. View Article : Google Scholar : PubMed/NCBI
|
|
51
|
Yoneda A, Multhaupt HA and Couchman JR: The Rho kinases I and II regulate different aspects of myosin II activity. J Cell Biol. 170:443–453. 2005. View Article : Google Scholar : PubMed/NCBI
|
|
52
|
Wang Y, Zheng XR, Riddick N, Bryden M, Baur W, Zhang X and Surks HK: ROCK isoform regulation of myosin phosphatase and contractility in vascular smooth muscle cells. Circ Res. 104:531–540. 2009. View Article : Google Scholar : PubMed/NCBI
|
|
53
|
Matsubara M and Bissell MJ: Inhibitors of Rho kinase (ROCK) signaling revert the malignant phenotype of breast cancer cells in 3D context. Oncotarget. 7:31602–31622. 2016. View Article : Google Scholar : PubMed/NCBI
|
|
54
|
Anderson S, DiCesare L, Tan I, Leung T and SundarRaj N: Rho-mediated assembly of stress fibers is differentially regulated in corneal fibroblasts and myofibroblasts. Exp Cell Res. 298:574–583. 2004. View Article : Google Scholar : PubMed/NCBI
|
|
55
|
Kolega J: Cytoplasmic dynamics of myosin IIA and IIB: Spatial ‘sorting’ of isoforms in locomoting cells. J Cell Sci. 111:2085–2095. 1998. View Article : Google Scholar : PubMed/NCBI
|
|
56
|
Ishizaki T, Uehata M, Tamechika I, Keel J, Nonomura K, Maekawa M and Narumiya S: Pharmacological properties of Y-27632, a specific inhibitor of rho-associated kinases. Mol Pharmacol. 57:976–983. 2000.PubMed/NCBI
|
|
57
|
Tanihara H, Inoue T, Yamamoto T, Kuwayama Y, Abe H and Araie M; K-115 Clinical Study Group, : Phase 1 clinical trials of a selective Rho kinase inhibitor, K-115. JAMA Ophthalmol. 131:1288–1295. 2013. View Article : Google Scholar : PubMed/NCBI
|
|
58
|
Okumura N, Kinoshita S and Koizumi N: Application of Rho kinase inhibitors for the treatment of corneal endothelial diseases. J Ophthalmol. 2017:26469042017. View Article : Google Scholar : PubMed/NCBI
|
|
59
|
Mueller BK, Mack H and Teusch N: Rho kinase, a promising drug target for neurological disorders. Nat Rev Drug Discov. 4:387–398. 2005. View Article : Google Scholar : PubMed/NCBI
|
|
60
|
Garnock-Jones KP: Ripasudil: First global approval. Drugs. 74:2211–2215. 2014. View Article : Google Scholar : PubMed/NCBI
|
|
61
|
Gaggioli C, Hooper S, Hidalgo-Carcedo C, Grosse R, Marshall JF, Harrington K and Sahai E: Fibroblast-led collective invasion of carcinoma cells with differing roles for RhoGTPases in leading and following cells. Nat Cell Biol. 9:1392–1400. 2007. View Article : Google Scholar : PubMed/NCBI
|
|
62
|
Rodriguez-Hernandez I, Cantelli G, Bruce F and Sanz-Moreno V: Rho, ROCK and actomyosin contractility in metastasis as drug targets. F1000Res 5 (F1000 Faculty Rev). 7832016. View Article : Google Scholar
|
|
63
|
Liu S, Goldstein RH, Scepansky EM and Rosenblatt M: Inhibition of rho-associated kinase signaling prevents breast cancer metastasis to human bone. Cancer Res. 69:8742–8751. 2009. View Article : Google Scholar : PubMed/NCBI
|


