Introduction
Melanoma, a deadly malignant cancer originating from
melanocytes, accounts for 5% of all skin cancers but 75% of skin
cancer-associated mortality (1,2). The
prognosis of patients with high tumor burden, brain metastasis or
elevated lactate dehydrogenase is poor with 3-year survival rate
<10% (3,4). Advances have been made in drug
therapy for advanced melanoma, especially in checkpoint inhibitor
immunotherapy including anti-programmed cell death protein 1 and
anti-cytotoxic T-lymphocyte antigen 4 (5). However, most patients with metastatic
melanoma achieve only short-term benefits from immune therapy or
show no response at all, potentially due to the low level of immune
activation in the tumor microenvironment (6,7).
Therefore, it is necessary to gain a broader view of cancer
immunity and identify reliable biomarkers and therapeutic targets
associated with clinical prognosis and immune activation.
Long non-coding RNAs (lncRNAs) are a group of ncRNAs
>200 nucleotides in length that have no protein-coding capacity
due to the lack of open reading frames (8). Numerous studies have illustrated that
lncRNAs function as key regulatory molecules of tumor-causing
pathways and tumor suppressors in cutaneous melanoma (9–13).
For example, Leucci et al (14) demonstrated that a melanoma-specific
lncRNA, survival-associated mitochondrial melanoma-specific
oncogenic ncRNA, is a biomarker of malignancy and a highly
selective and broad-spectrum anti-melanoma therapeutic target.
Moreover, overexpression of BRAF-associated non-protein coding RNA
is associated with worse prognosis and lower survival rate in
patients with melanoma (11). Most
lncRNAs are considered to function as tumor-promoting factors due
to their roles in facilitating melanoma cell growth and metastasis;
to the best of our knowledge, there are few reports of
tumor-inhibiting lncRNAs (15).
To date, melanoma has been regarded as a highly
immunogenic tumor because of the key role of the immune system in
its development and progression. For example, it demonstrates
immunogenicity attributed to the recognition of antigens expressed
by melanocytes (16). Recently,
emerging evidence has suggested that lncRNAs regulate cancer
immunity by participating in diverse processes such as tumor
antigen release/presentation, immune cell activation and
infiltration and recognition and attack of cancer cells (17,18).
Accordingly, lncRNAs are considered to be prognostic biomarkers and
potential novel therapeutic targets to improve response to
immunotherapy (19).
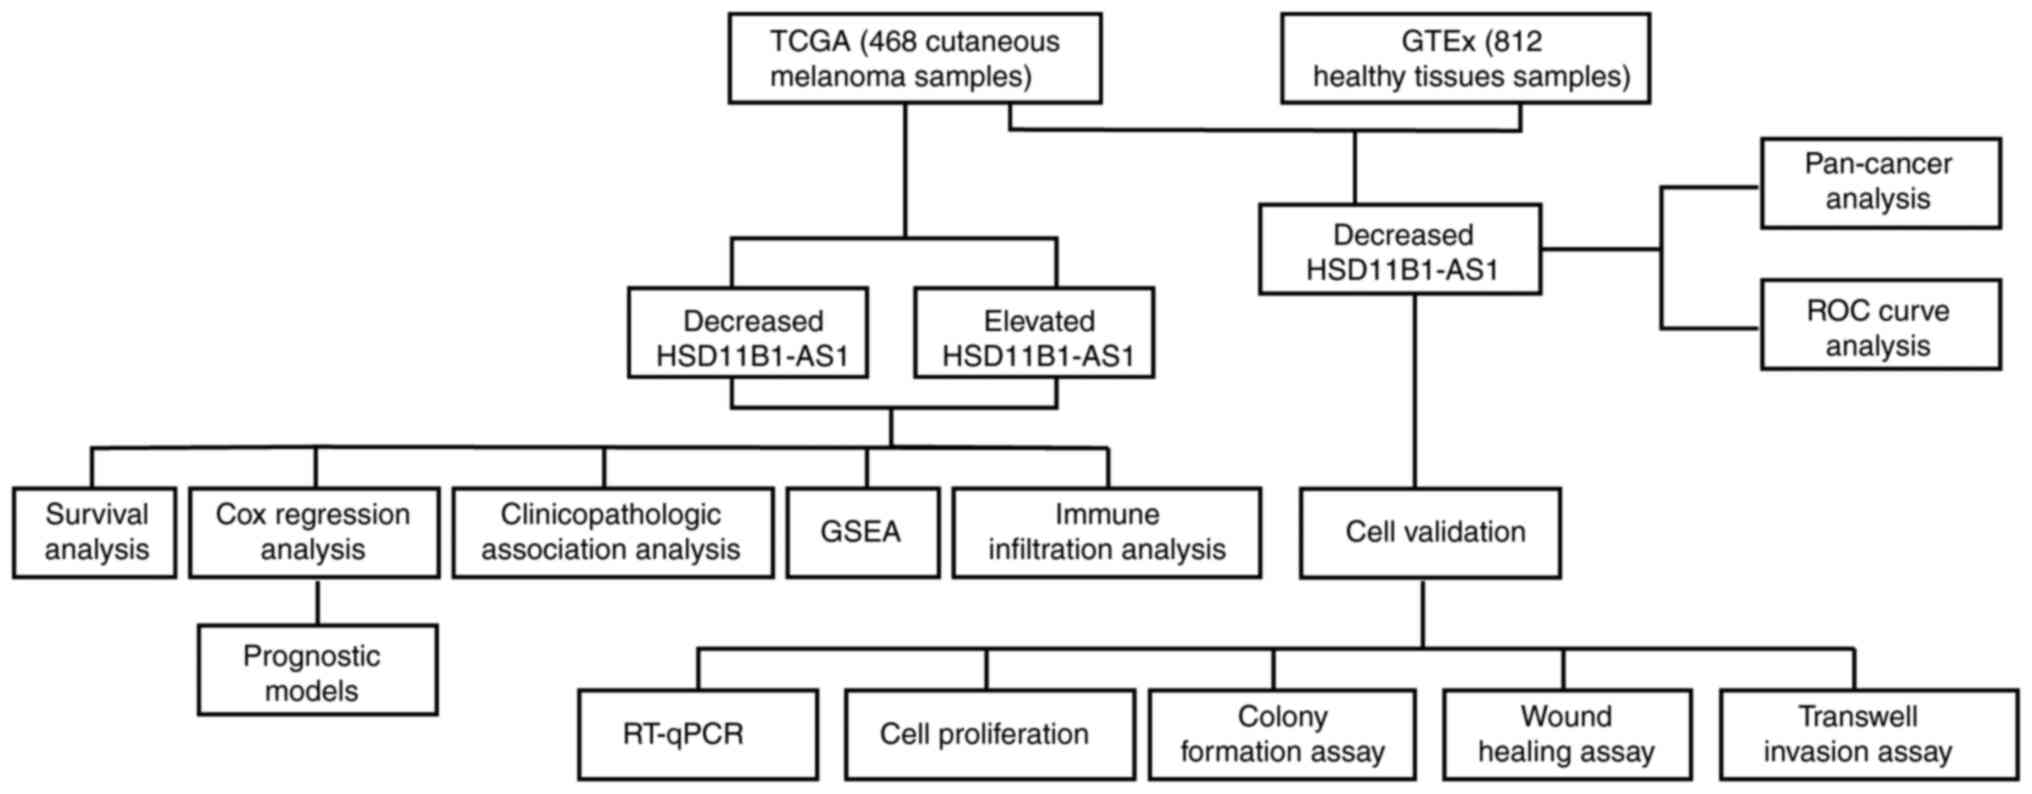
The present study used publicly available microarray
data to identify a novel tumor-suppressing lncRNA,
11β-hydroxysteroid dehydrogenase type 1-antisense RNA 1
(HSD11B1-AS1), which was validated via reverse
transcription-quantitative PCR (RT-qPCR) to detect
HSD11B1-AS1 expression in melanoma cell lines and
melanocytes. Bioinformatic analysis was performed to determine
differential expression, diagnostic and prognostic efficacy of
HSD11B1-AS1 in cutaneous melanoma, which was validated in
melanoma cell lines A375 and SK-MEL-1. The potential molecular
mechanism and underlying signaling pathways were investigated using
Gene Set Enrichment Analysis (GSEA) and immune infiltration
analysis. The study design is presented in Fig. 1.
Materials and methods
RNA sequencing (seq) data and clinical
characteristics
RNA-Seq data and clinical information were obtained
from University of California Santa Cruz Xena databases
(xenabrowser.net/datapages/). Cases without clinical features were
excluded. In clinical information, the Clark Level, which has five
levels from Level 1 to Level 5, is a staging system that describes
the depth of melanoma as it grows in the skin, and the Breslow
Depth is a more standardized method to measure how far melanoma has
invaded the body, which requires an optical micrometer fitted to
the ocular position of a standard microscope (20). A total of 812 healthy tissues and
468 cutaneous melanoma samples were included. Because the data was
obtained from The Cancer Genome Atlas (TCGA) and Genotype-Tissue
Expression (GTEx), it was not necessary to obtain informed consent
or ethics approval. Expression of HSD11B1-AS1 was compared
in unpaired healthy tissue and melanoma. Then, receiver operating
characteristic (ROC) curve analysis was performed to determine the
diagnostic value of HSD11B1-AS1 in discriminating melanoma
from healthy tissue. Moreover, a pan-cancer analysis including 33
types of human cancer was performed to compare differential
expression of HSD11B1-AS1 between cancer and healthy tissue
using TCGA and GTEx gene expression data. Fig. 1 shows the experimental design.
Cell culture and transfection
Cutaneous melanoma cell lines and normal human
epidermal melanocytes (HEMs) were cultured in RPMI-1640 medium
containing 10% fetal bovine serum (HyClone; Thermo Fisher
Scientific, Inc.), 100 U/ml penicillin and 100 µg/ml streptomycin
in a sterile and humidified incubator at 37°C with 5%
CO2. The constructed HSD11B1-AS1 overexpression
(pcDNA3.1-HSD11B1-AS1) and pcDNA3.1 empty vectors were
obtained from Shanghai GenePharma Co., Ltd. To construct the
pcDNA3.1-HSD11B1-AS1, primers (containing part of sequence
of the pcDNA3.1 vector) were used as follows: Forward,
5′-ACCGAGCTCGGATCCCACACTCTGCTCACCACCCT-3′ and reverse,
5′-ATATCTGCAGAATTCGCAGCTTAACATAACAAAAG-3′. The melanoma cell lines
A375 and SK-MEL-1 were transiently transfected using Lipofectamine
2000 reagent (Invitrogen; Thermo Fisher Scientific, Inc.) according
to the manufacturer's protocol at concentration of 1 µg/ml at 37°C
for 24 h. Transfection efficiency was confirmed by reverse
transcription-quantitative (RT-q)PCR at 48 h
post-transcription.
RT-qPCR
Total RNA was extracted from the A375, AK-MEL-1 and
HEM cell lines using the TRIzol® reagent (Invitrogen;
Thermo Fisher Scientific, Inc.) after which the RNA concentration
was measured using NanoDrop 2000 (Thermo Fisher Scientific, Inc.).
Total RNA was reverse transcribed (10 µl reaction system) according
to the instructions of PrimeScript™ RT reagent kit and SYBR Premix
Ex Taq II (both Takara Biotechnology Co., Ltd.) was used to assess
gene expression. The thermocycling conditions for RT-qPCR were as
follows: Preheating for 10 min at 95°C; followed by 40 cycles at
95°C for 15 sec and 60°C for 60 sec. The following primers were
used: HSD11B1-AS1 forward, 5′-GACAGCCTGAAGTGCTGGAC-3′ and
reverse, 5′-GATAGGGCATGGCAGACCTC-3′ and GAPDH forward,
5′-GGAGCGAGATCCCTCCAAAAT-3′ and reverse,
5′-GGCTGTTGTCATACTTCTCATGG-3′. The relative expression level of
HSD11B1-AS1 was calculated using the 2−ΔΔCq
formula (21).
Cell Counting Kit (CCK)-8 assay
Cell proliferation was assessed by CCK-8 assay (BBI
Life Sciences Corporation) according to the manufacturer's
protocol. At 0, 24, 48, 72 and 96 h after transfection, A375 and
SK-MEL-1 cells (2×10⁴/ml) were seeded in 96-well plates
overnight and 10 µl CCK-8 reagent was added to each well before
cells were incubated for 1 h. The absorbance value at 450 nm was
detected using a microplate reader (EL800; BioTek Instruments,
Inc.).
Colony formation assay
At 6 h after transfection, A375 and SK-MEL-1
melanoma cell lines were seeded into a 6 cm plastic culture dish
(1,000 cells/plate). Following 14 days incubation at 37°C with 5%
CO2, the colonies were fixed with 4% paraformaldehyde at
room temperature for 10 min and stained with 0.1% crystal violet at
room temperature for 5 min. Then, the number of colonies (>50
cells) was counted manually under an Olympus IX71 inverted
microscope (magnification, ×40; Olympus Corporation).
Wound healing assay
A375 and SK-MEL-1 cell migration was assessed using
scratch wound healing assay. In brief, when the monolayer reached
~70% confluence, a 1-ml sterile pipetting tip was used to
vertically scratch a 6-well plate with a cell monolayer adhered to
the wall. Then, the plates were washed three times with PBS to
remove the detached serum-starved cells. Images were captured under
an Olympus IX71 inverted microscope (magnification, ×100; Olympus
Corporation) at 0 and 48 h, and the wound closure ratio was
calculated.
Transwell invasion assay
Transwell assay was performed using Transwell
chambers (Costar; Corning, Inc.; pore size, 8 µm) coated with
Matrigel (Sigma-Aldrich; Merck KGaA) at 37°C for 4 h. For the
assay, 100 µl A375 or SK-MEL-1 cell suspensions
(5×10⁵/ml) in serum-free medium was seeded into the
upper chamber and 600 µl DMEM containing 10% fetal bovine serum
(HyClone; Thermo Fisher Scientific, Inc.) was added to the bottom
chamber at 37°C. After 24 h cell culture at 37°C with 5%
CO2, the migrated cells were fixed with 4%
paraformaldehyde at room temperature for 30 min and stained with 1%
crystal violet solution at room temperature for 30 min. Cells in 10
random fields of view were counted and images were captured under
an Olympus IX71 inverted microscope (magnification, ×100; Olympus
Corporation).
Gene Set Enrichment Analysis
(GSEA)
GSEA was performed using a gene expression matrix of
melanoma extracted from RNA-Seq TCGA datasets to identify the
distinct hallmarks of HSD11B1-AS1 (22). GSEA was performed using R package
ClusterProfiler (version 3.14.3) (23), and each analysis included 1,000
permutations of the gene set. The HSD11B1-AS1 expression
level was used as a phenotype label. H.all.v7.0.symbols.gmt
(Hallmarks) (https://www.gsea-msigdb.org/gsea/msigdb/collections.jsp#C2)
was used as a gene set.
Immune infiltration analysis by
single-sample gene set enrichment analysis
Immune infiltration analysis was performed by
single-sample GSEA method using the R package Gene Set Variation
Analysis (GSVA) (24) to examine
the association between HSD11B1-AS1 expression and
infiltration of immune cells reported by Bindea et al
(25). Pearson's correlation
coefficient was used to assess the association between
HSD11B1-AS1 expression and the relative enrichment score of
24 types of immune cell. Wilcoxon rank sum test was performed to
analyze the differential immune infiltration between high and low
HSD11B1-AS1 expression groups.
Statistical analysis
All data were presented as the mean ± standard
deviation and all tests were performed in triplicate. The
comparison of the mean values between two factors was performed
using an independent sample t-test when variances were homogeneous.
When variances were not homogeneous, rank sum statistical analysis
was performed. The comparison of the mean values of multiple
factors was performed using one-way ANOVA followed by a Bonferroni
post hoc test. All bioinformatics analysis was performed in R
(v.3.6.2). Kaplan-Meier method using the R package Survminer and
univariate and multivariate Cox regression analyses were used to
assess the prognostic value of HSD11B1-AS1. All prognostic
data, including overall survival, progression-free interval and
disease-specific survival, were collected from an article published
in Cell (26). Median age, years
(inter-quartile range) was analyzed using Wilcoxon rank sum test,
and Melanoma Clark levels were analyzed using a Fisher's exact
test. Pearson's correlation coefficient was used to assess the
association between HSD11B1-AS1 expression and the relative
enrichment score of immune cells. Nomogram models were constructed
using the R package rms based on independent prognostic factors
identified in the multivariate Cox regression analysis. The
accuracy of the nomograms was determined using the concordance
index (C-index) and calibration curve. GraphPad Prism (version 7.0;
GraphPad Software, Inc.) was used to assess the role of
HSD11B1-AS1 in cell proliferation, invasion and migration.
P<0.05 was considered to indicate a statistically significant
difference. All hypothesis testing was two tailed.
Results
HSD11B1-AS1 is downregulated in
melanoma and other types of malignancy
Significantly lower expression levels of
HSD11B1-AS1 were observed in cutaneous melanoma than in
healthy tissue (Fig. 2A).
Furthermore, ROC curve analysis revealed that HSD11B1-AS1
had the potential to discriminate melanoma from healthy tissue,
with an area under the curve of 0.785 (95% CI, 0.759-0.811;
Fig. 2B). A pan-cancer analysis
demonstrated that HSD11B1-AS1 expression was significantly
lower in 19 other types of cancer, including breast, brain, and
lung cancer and other types of tumor compared with melanoma
(Fig. 2C).
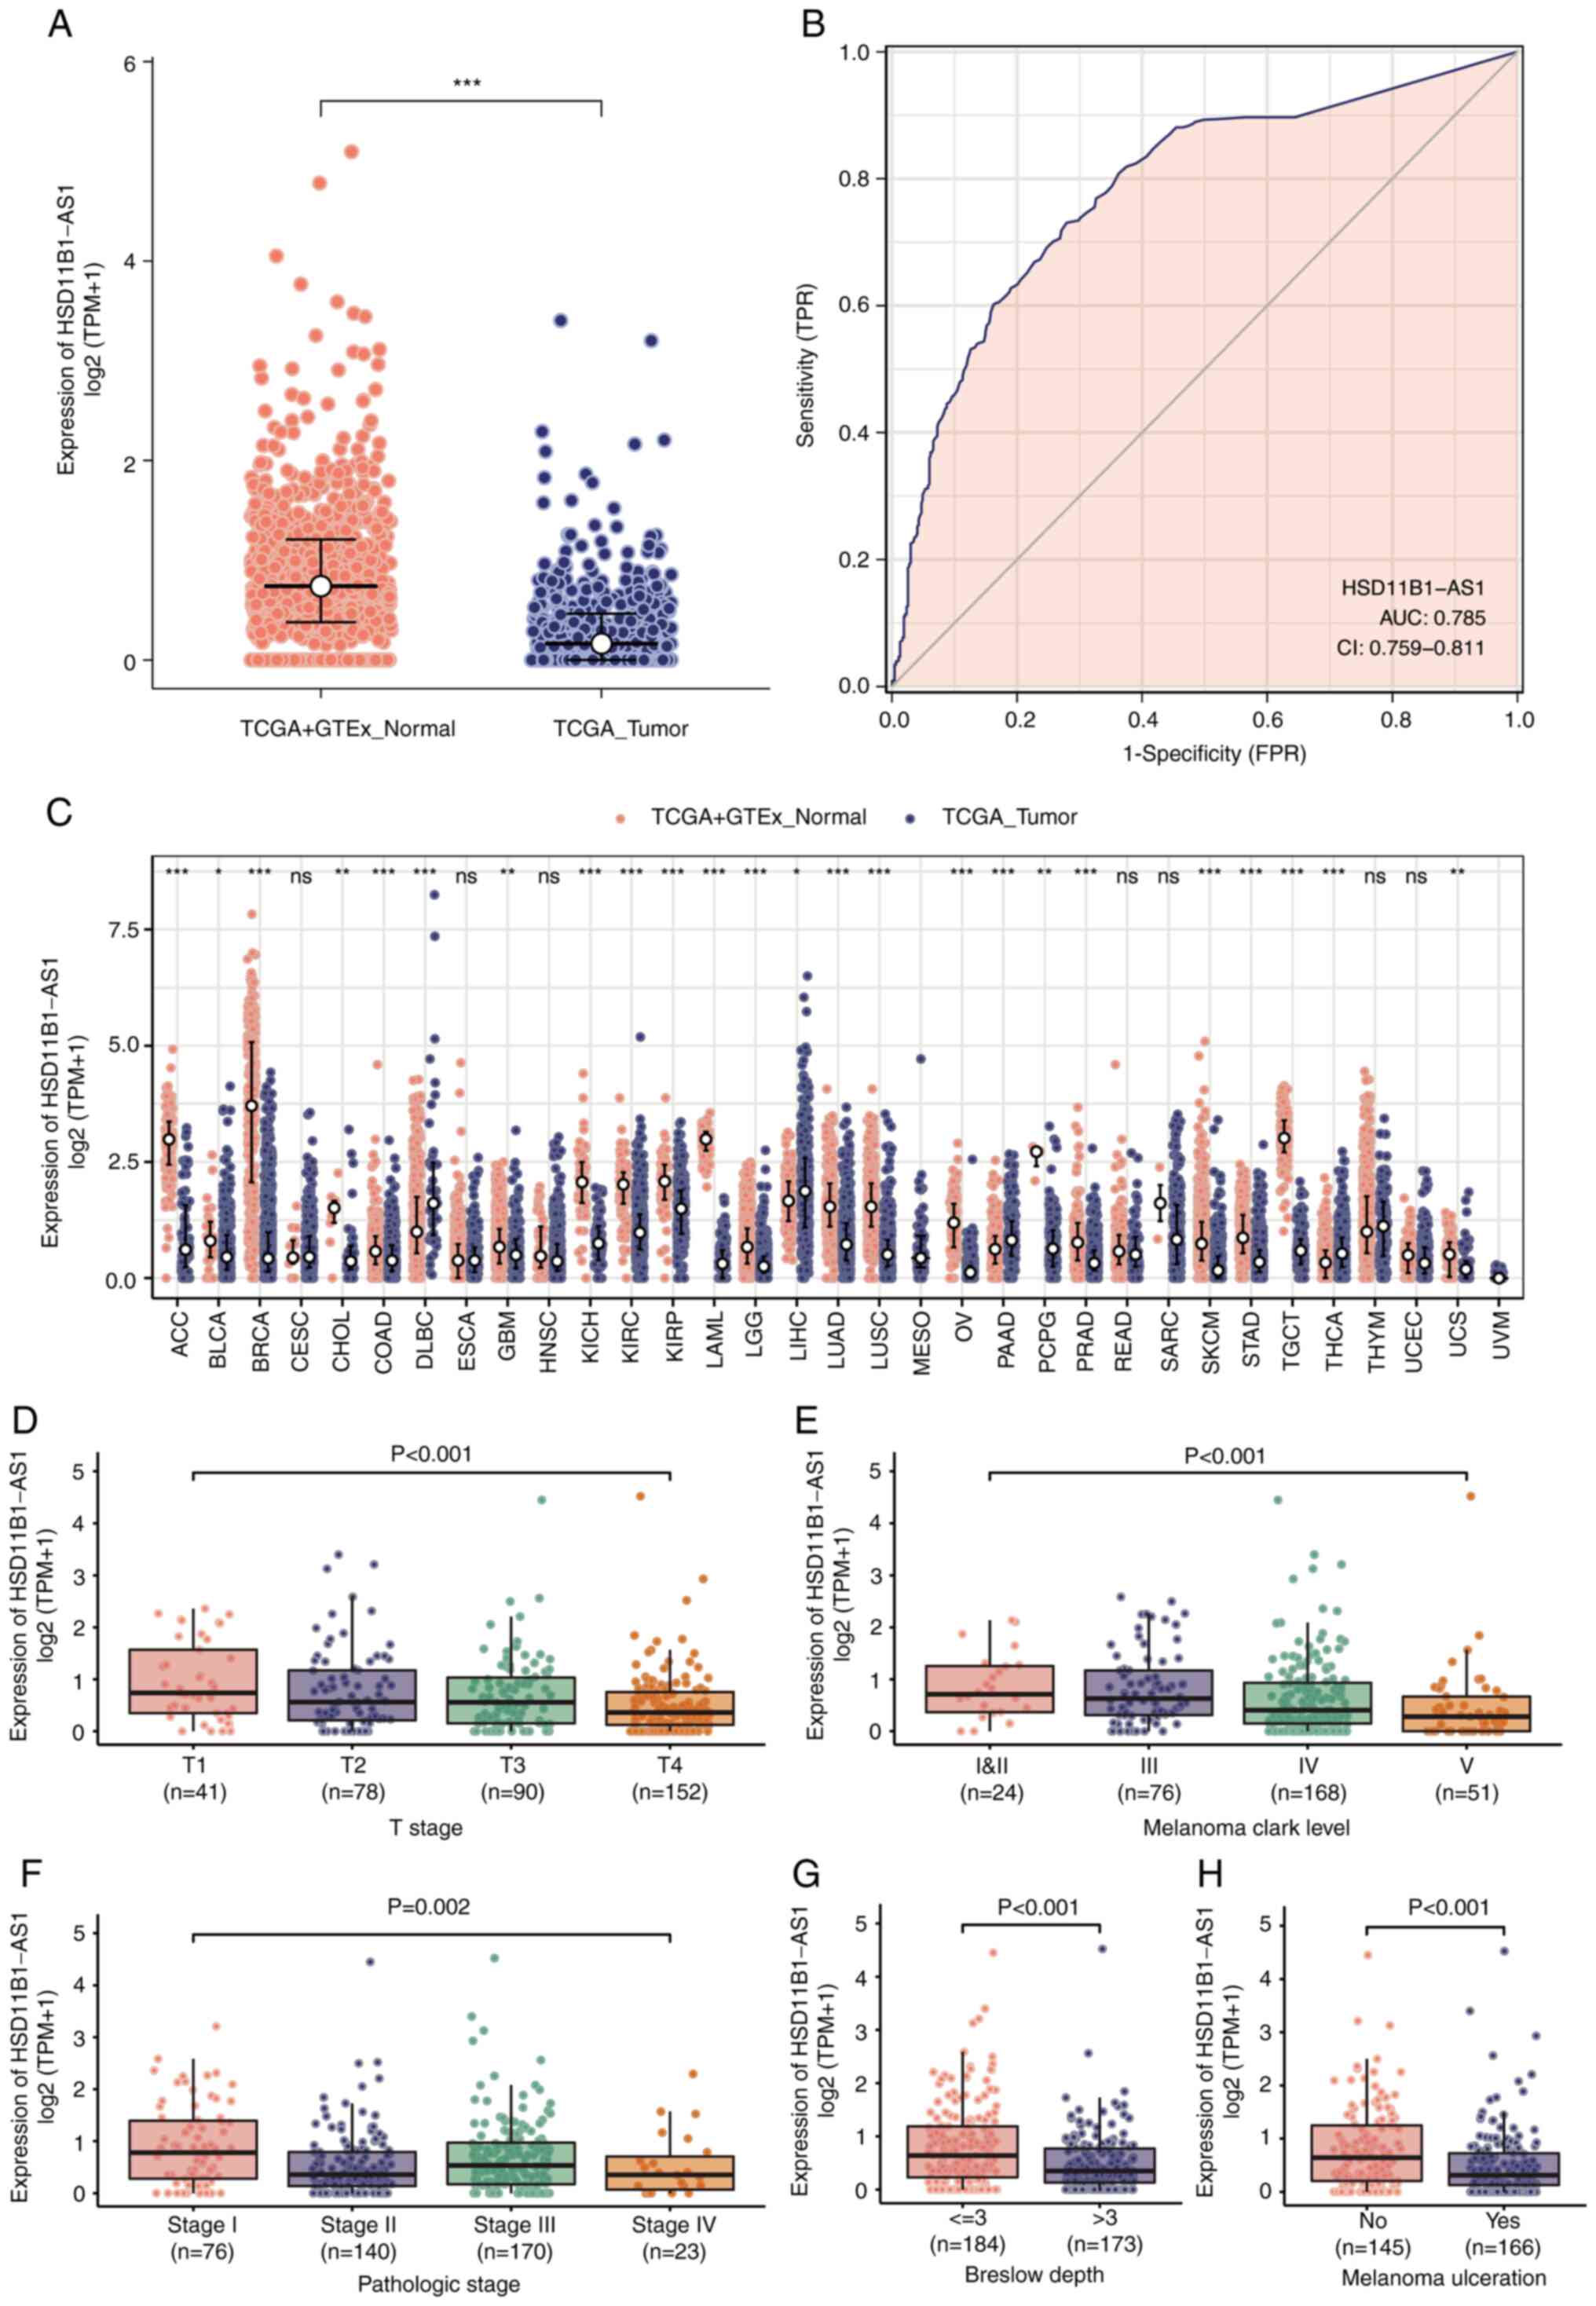 | Figure 2.Differential expression of
HSD11B1-AS1 and its association with patient
clinicopathological characteristics. (A) Significantly decreased
HSD11B1-AS1 levels were demonstrated in cutaneous melanoma
compared with healthy tissues. (B) Receiver operating
characteristic curve of HSD11B1-AS1 predicting a good
diagnostic performance in discriminating melanoma from healthy
tissues. (C) HSD11B1-AS1 expression levels were assessed in
various types of human cancer. Decreased expression of
HSD11B1-AS1 was significantly associated with advanced (D) T
stage, (E) Clark levels, (F) pathological stage, (G) Breslow depth
and (H) melanoma ulceration. *P<0.05, **P<0.01 and
***P<0.001. HSD11B1-AS1, 11β-hydroxysteroid dehydrogenase
type 1-antisense RNA 1; AUC, area under the curve; CI, confidence
interval; TCGA, The Cancer Genome Atlas; GSEA, Gene Set Enrichment
Analysis; TPM, transcripts per million; TPR, true positive rate;
FPR, false positive rate. |
Decreased HSD11B1-AS1 expression is
associated with poor clinicopathological variables
Association analysis of clinicopathological
characteristics in low- and high-HSD11B1-AS1 expression
groups demonstrated that HSD11B1-AS1 expression was
significantly associated with age, Breslow depth, melanoma
ulceration, T and pathological stage and Clark level. No
significant differences between groups were observed for other
clinicopathological characteristics (Table I).
 | Table I.Association between
HSD11B1-AS1 expression and clinicopathological
characteristics in patients with cutaneous melanoma. |
Table I.
Association between
HSD11B1-AS1 expression and clinicopathological
characteristics in patients with cutaneous melanoma.
|
| HSD11B1-AS1
expression |
|
|---|
|
|
|
|
|---|
| Characteristic | Low (n=234) | High (n=234) | P-value |
|---|
| Sex |
|
| 0.849 |
|
Female | 88.00 (37.60)
(%) | 91.00 (38.90)
(%) |
|
|
Male | 146.00 (62.40)
(%) | 143.00 (61.10)
(%) |
|
| Median age, years
(IQR) | 60.00
(48.25-72.00) | 58.00
(47.00-68.00) | 0.036a |
| Breslow depth |
|
| 0.005a |
| ≤3
mm | 77.00 (43.80)
(%) | 107.00 (59.10)
(%) |
|
| >3
mm | 99.00 (56.20)
(%) | 74.00 (40.90)
(%) |
|
| Melanoma
ulceration |
|
| 0.003a |
| No | 62.00 (38.30)
(%) | 83.00 (55.70)
(%) |
|
|
Yes | 100.00 (61.70)
(%) | 66.00 (44.30)
(%) |
|
| T stage |
|
| 0.015a |
| T1 | 13.00 (7.30)
(%) | 28.00 (15.30)
(%) |
|
| T2 | 37.00 (20.80)
(%) | 41.00 (22.40)
(%) |
|
| T3 | 40.00 (22.50)
(%) | 50.00 (27.30)
(%) |
|
| T4 | 88.00 (49.40)
(%) | 64.00 (35.00)
(%) |
|
| N stage |
|
| 0.717 |
| N0 | 120.00 (59.10)
(%) | 114.00 (54.80)
(%) |
|
| N1 | 36.00 (17.70)
(%) | 38.00 (18.30)
(%) |
|
| N2 | 24.00 (11.80)
(%) | 25.00 (12.00)
(%) |
|
| N3 | 23.00 (11.30)
(%) | 31.00 (14.90)
(%) |
|
| M stage |
|
| 0.305 |
| M0 | 206.00 (93.20)
(%) | 210.00 (95.90)
(%) |
|
| M1 | 15.00 (6.80)
(%) | 9.00 (4.10)
(%) |
|
| Pathological
stage |
|
| 0.003a |
| I | 27.00 (13.50)
(%) | 49.00 (23.40)
(%) |
|
| II | 83.00 (41.50)
(%) | 57.00 (27.30)
(%) |
|
|
III | 76.00 (38.00)
(%) | 94.00 (45.00)
(%) |
|
| IV | 14.00 (7.00)
(%) | 9.00 (4.30)
(%) |
|
| Melanoma Clark
level |
|
| 0.002a |
| I | 3.00 (1.90)
(%) | 3.00 (1.90)
(%) |
|
| II | 4.00 (2.50)
(%) | 14.00 (8.70)
(%) |
|
|
III | 29.00 (18.40)
(%) | 47.00 (29.20)
(%) |
|
| IV | 88.00 (55.70)
(%) | 80.00 (49.70)
(%) |
|
| V | 34.00 (21.50)
(%) | 17.00 (10.60)
(%) |
|
| Radiation
therapy |
|
| 0.213 |
| No | 194.00 (85.10)
(%) | 187.00 (80.30)
(%) |
|
|
Yes | 34.00 (14.90)
(%) | 46.00 (19.70)
(%) |
|
Decreased HSD11B1-AS1 expression was
significantly associated with poorer pathological staging,
including T stage, Clark level, presence of melanoma ulceration and
Breslow depth >3 mm (Fig.
2D-F). Moreover, univariate logistic regression indicated that
lower HSD11B1-AS1 expression was significantly associated
with negative features, including T stage [odds ratio (OR)=0.44 for
T2, T3 and T4 vs. T1), pathological stage (OR=0.51 for stages IV,
III and II vs. stage I), Clark level (OR=0.45 for IV and V vs. I,
II and III), Breslow depth (OR=0.54 for >3 vs. ≤3) and melanoma
ulceration (OR=0.49 for Yes vs. No; Table II). These results were consistent
with those shown in Fig. 2D-F,
indicating that tumors with lower HSD11B1-AS1 expression
were more prone to progress to more advanced and invasive
stages.
| Table II.HSD11B1-AS1 expression is
associated with clinicopathological features (logistic
regression). |
Table II.
HSD11B1-AS1 expression is
associated with clinicopathological features (logistic
regression).
| Characteristic | Total number of
cases | OR | P-value |
|---|
| Sex, female vs.
male | 468 | 1.06
(0.73-1.53) | 0.775 |
| Age, ≤60 vs. >60
years | 460 | 1.29
(0.90-1.87) | 0.170 |
| T stage, T2, 3 and
4 vs. 1 | 361 | 0.44
(0.21-0.86) | 0.019a |
| N stage, N1, 2 and
3 vs. 0 | 411 | 1.19
(0.81-1.76) | 0.378 |
| M stage, M1 vs.
0 | 440 | 0.59
(0.24-1.35) | 0.221 |
| Pathological stage,
IV, III and II vs. I | 409 | 0.51
(0.30-0.85) | 0.011a |
| Melanoma Clark
level, IV and V vs. I, II and III | 319 | 0.45
(0.27-0.72) | 0.001a |
| Breslow depth,
>3 vs. ≤3 mm | 357 | 0.54
(0.35-0.82) | 0.004a |
| Melanoma
ulceration, yes vs. no | 311 | 0.49
(0.31-0.77) | 0.002a |
| Radiation therapy,
no vs. yes | 461 | 0.71
(0.44-1.16) | 0.172 |
Increased HSD11B1-AS1 expression
predicts favorable prognosis
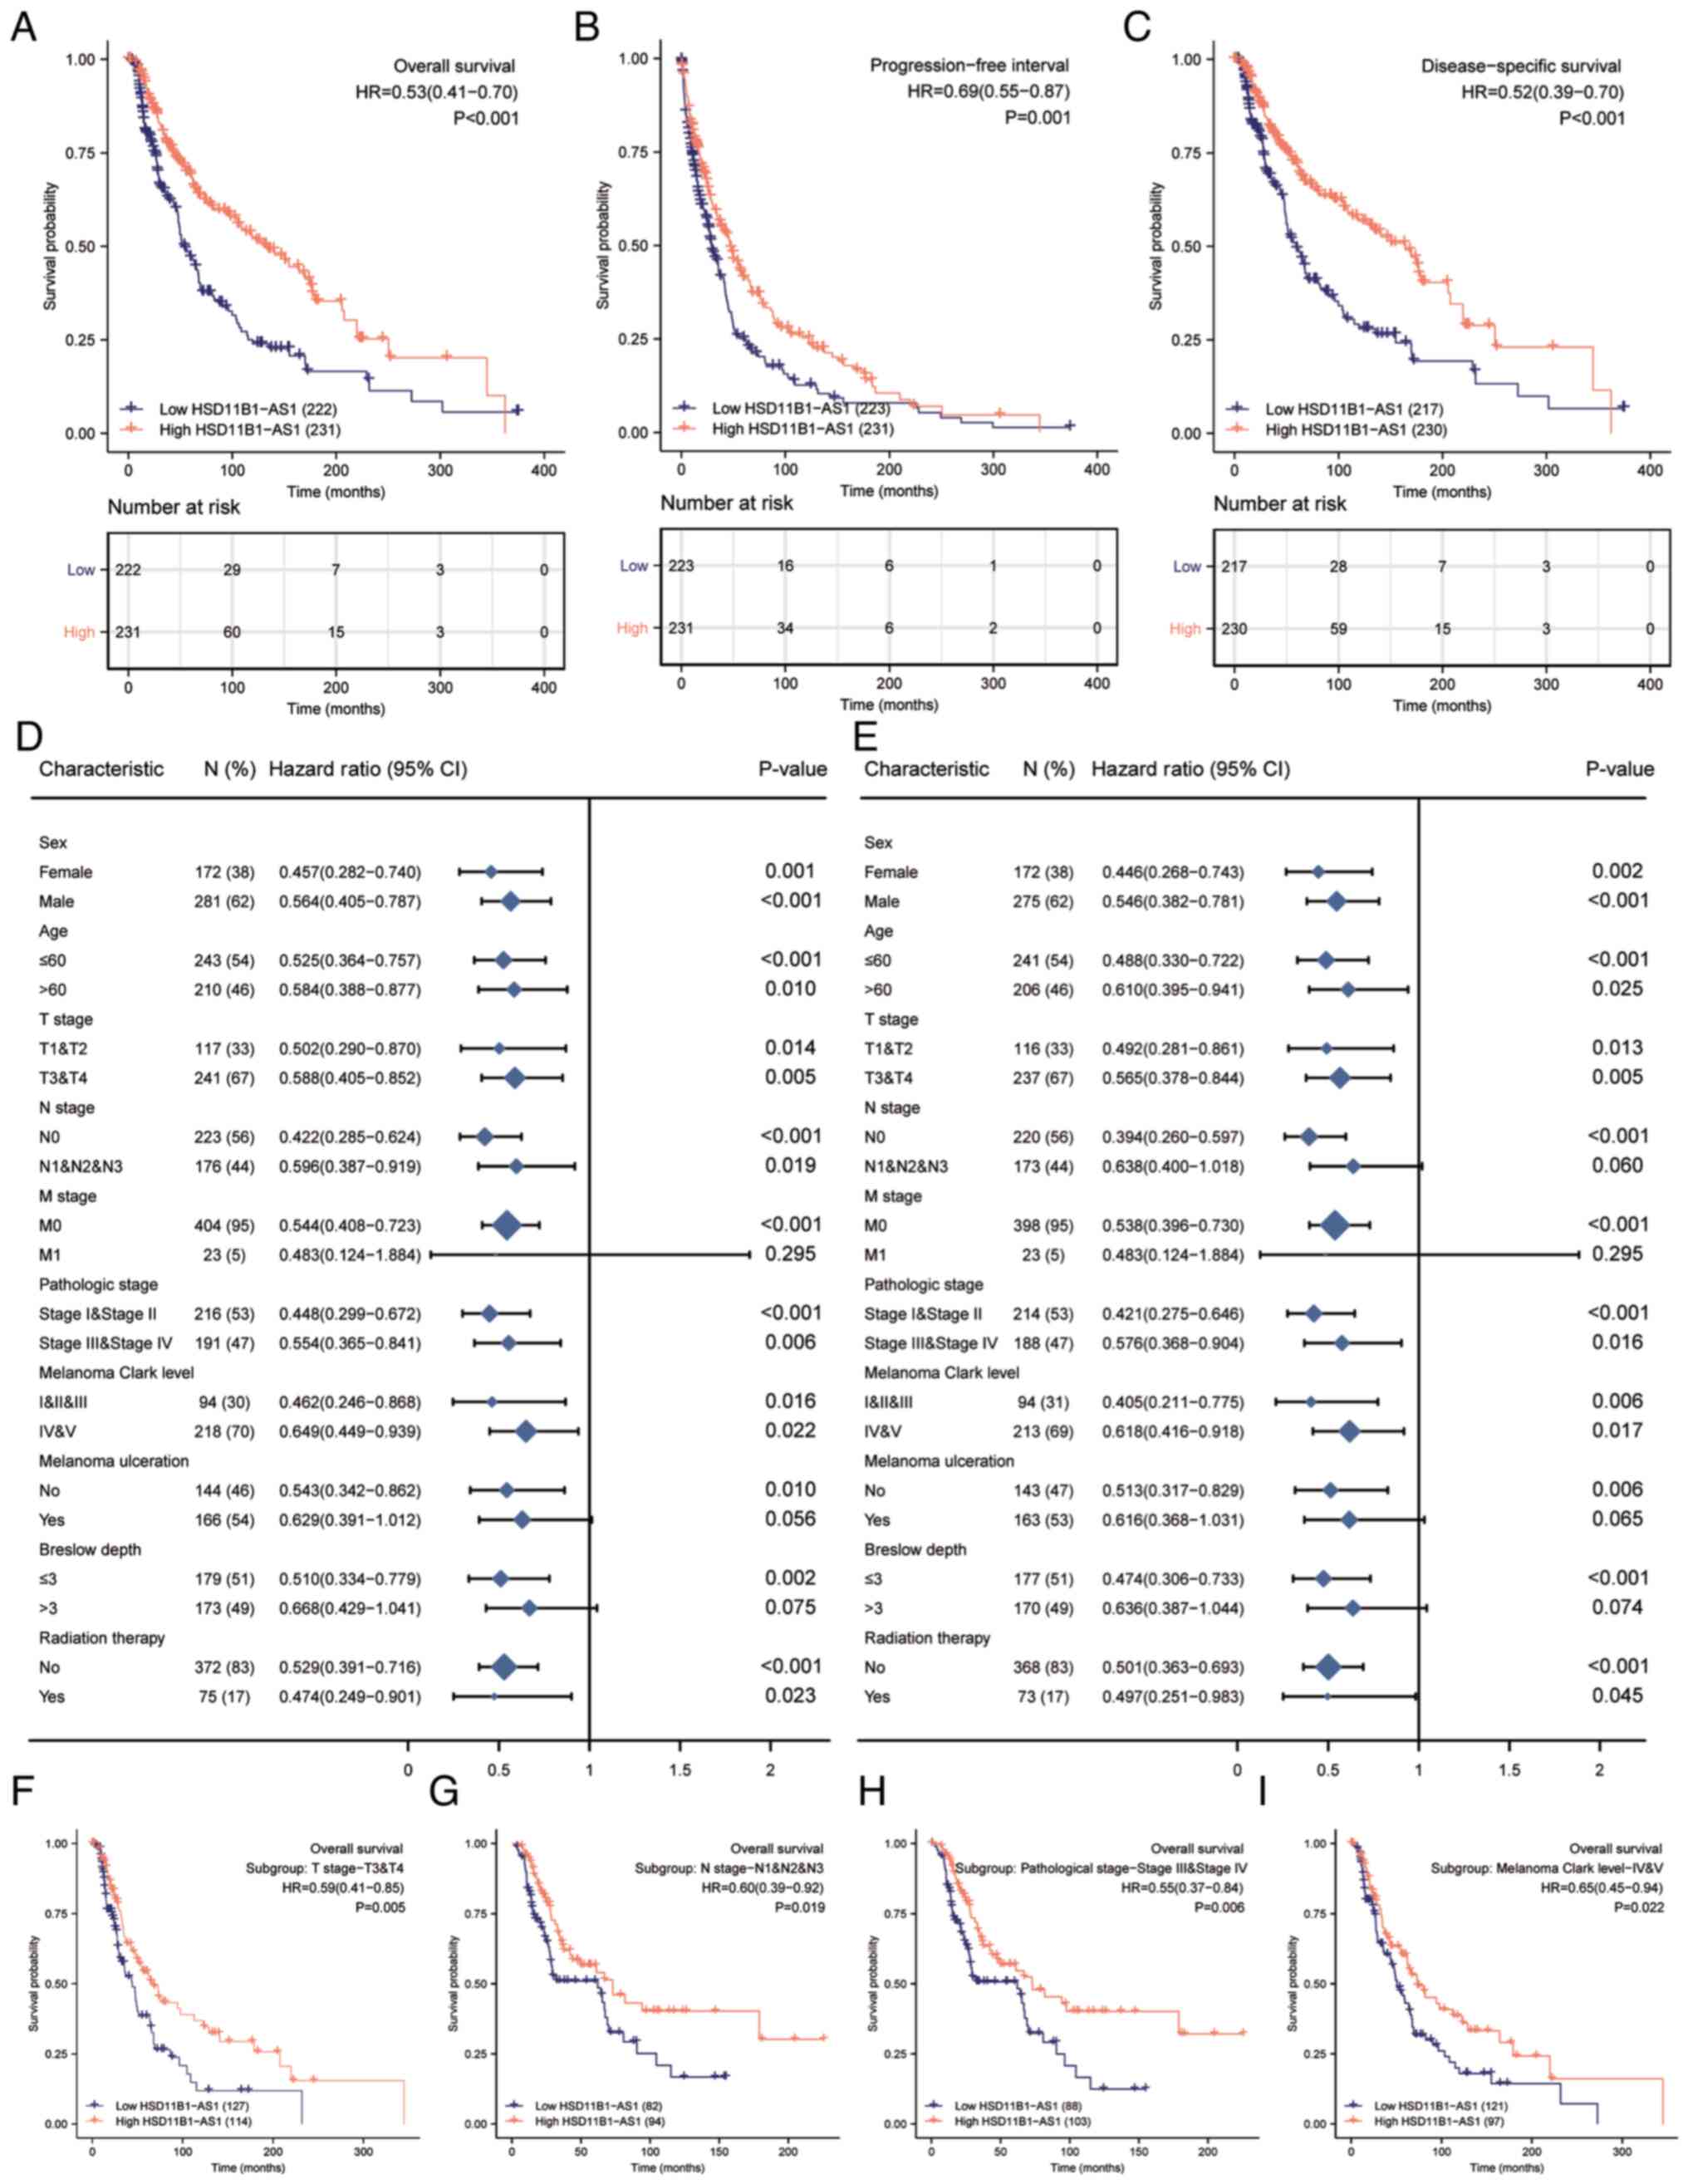
Kaplan-Meier survival analysis indicated that
increased HSD11B1-AS1 expression was associated with better
overall survival [OS; hazard ratio (HR)=0.53; Fig. 3A], progression-free interval (PFI;
HR=0.69; Fig. 3B) and
disease-specific survival (DSS; HR=0.52; Fig. 3C). Increased HSD11B1-AS1
expression affected patient prognosis (OS and DSS) in different
clinicopathological subsets, including sex, age, T and pathological
stage and Clark level (Fig. 3D and
E). Specifically, overexpression of HSD11B1-AS1 was
significantly associated with favorable OS in advanced clinical
stage subsets, including T3/4 [HR=0.59 (0.41-0.85)], N1, 2 and 3
[HR=0.60 (0.39-0.92)] and pathological stages III and IV [HR=0.55
(0.37-0.84)] and Clark level IV and V [HR=0.65 (0.45-0.94);
Fig. 3F-I]. These findings
indicated that HSD11B1-AS1 affected the prognosis of
patients with melanoma with advanced clinicopathological
features.
Development of prognostic models based
on HSD11B1-AS1 expression and other clinicopathological
characteristics
The univariate Cox regression analysis demonstrated
that elevated HSD11B1-AS1 expression was significantly
associated with favorable OS; other clinicopathological factors,
such as age, T, N and pathological stage, Clark level, Breslow
depth and melanoma ulceration were also significantly associated
with OS (Table III).
Furthermore, multivariate Cox regression analysis revealed that,
similar to N stage and Breslow depth, HSD11B1-AS1 expression was
independently associated with OS. Moreover, both the univariate and
multivariate analyses showed that HSD11B1-AS1 expression was
associated with PFI (Table IV)
and DSS (Table V) as an
independent prognostic factor. The contributions of other
clinicopathological features to PFI and DSS are shown in Tables IV and V, respectively.
| Table III.Association between overall survival
and clinicopathological features using univariate and multivariate
Cox regression. |
Table III.
Association between overall survival
and clinicopathological features using univariate and multivariate
Cox regression.
|
|
| Univariate
analysis | Multivariate
analysis |
|---|
|
|
|
|
|
|---|
| Characteristic | Total | HR (95% CI) | P-value | HR (95% CI) | P-value |
|---|
| Sex, male vs.
female | 453 | 1.164
(0.872-1.554) | 0.301 | - | - |
| Age, >60 vs. ≤60
years | 453 | 1.678
(1.266-2.225) |
<0.001a | 1.166
(0.781-1.741) | 0.452 |
| T stage, T3 and 4
vs. 1 and 2 | 358 | 2.040
(1.468-2.836) |
<0.001a | 0.909
(0.517-1.600) | 0.742 |
| N stage, N1, 2 and
3 vs. 0 | 399 | 1.711
(1.271-2.304) |
<0.001a | 3.764
(1.140-12.425) | 0.030a |
| M stage, M1 vs.
0 | 427 | 1.734
(0.915-3.287) | 0.092 | - | - |
| Pathological stage,
III and IV vs. I and II | 407 | 1.579
(1.177-2.118) | 0.002a | 0.598
(0.182-1.968) | 0.398 |
| Melanoma Clark
level, IV and V vs. I, II and III | 312 | 2.117
(1.472-3.045) |
<0.001a | 1.291
(0.797-2.090) | 0.299 |
| Melanoma
ulceration, yes vs. no | 310 | 2.087
(1.494-2.916) |
<0.001a | 1.315
(0.865-1.999) | 0.201 |
| Breslow depth, ≤3
vs. >3 mm | 352 | 0.386
(0.281-0.528) |
<0.001a | 0.537
(0.314-0.916) | 0.023a |
| Radiation therapy,
yes vs. no | 447 | 0.953
(0.674-1.348) | 0.785 | - | - |
| HSD11B1-AS1
expression, high vs. low | 453 | 0.534
(0.407-0.700) |
<0.001a | 0.618
(0.423-0.903) | 0.013a |
| Table IV.Association between with
progression-free interval and clinicopathological features using
univariate and multivariate Cox regression. |
Table IV.
Association between with
progression-free interval and clinicopathological features using
univariate and multivariate Cox regression.
|
|
| Univariate
analysis | Multivariate
analysis |
|---|
|
|
|
|
|
|---|
| Characteristic | Total | HR (95% CI) | P-value | HR (95% CI) | P-value |
|---|
| Sex, male vs.
female | 454 | 1.027
(0.813-1.298) | 0.821 | - | - |
| Age, >60 vs. ≤60
years | 454 | 1.600
(1.258-2.035) |
<0.001a | 1.398
(0.988-1.978) | 0.059 |
| T stage, T3 and 4
vs. 1 and 2 | 359 | 1.655
(1.259-2.175) |
<0.001a | 0.903
(0.569-1.433) | 0.665 |
| N stage, N1, 2 and
3 vs. 0 | 400 | 1.853
(1.451-2.365) |
<0.001a | 2.611
(0.991-6.880) | 0.052 |
| M stage, M1 vs.
0 | 428 | 1.942
(1.188-3.175) | 0.008a | 1.176
(0.481-2.877) | 0.722 |
| Pathological stage,
III and IV vs. I and II | 408 | 1.717
(1.349-2.187) |
<0.001a | 0.868
(0.322-2.343) | 0.781 |
| Melanoma Clark
level, IV and V vs. I, II and III | 312 | 1.762
(1.302-2.386) |
<0.001a | 0.956
(0.628-1.455) | 0.832 |
| Melanoma
ulceration, yes vs. no | 310 | 1.635
(1.233-2.169) |
<0.001a | 1.182
(0.831-1.681) | 0.351 |
| Breslow depth, ≤3
vs. >3 mm | 352 | 0.498
(0.378-0.655) |
<0.001a | 0.566
(0.359-0.892) | 0.014a |
| Radiation therapy,
yes vs. no | 448 | 1.201
(0.906-1.593) | 0.203 | - | - |
| HSD11B1-AS1
expression, high vs. low | 454 | 0.691
(0.552-0.866) | 0.001a | 0.704
(0.507-0.978) | 0.036a |
| Table V.Association between disease-specific
survival and clinicopathological features using univariate and
multivariate Cox regression. |
Table V.
Association between disease-specific
survival and clinicopathological features using univariate and
multivariate Cox regression.
|
|
| Univariate
analysis | Multivariate
analysis |
|---|
| Characteristic | Total | HR (95% CI) | P-value | HR (95% CI) | P-value |
|---|
| Sex, male vs.
female | 447 | 1.151
(0.847-1.564) | 0.368 |
|
|
| Age, >60 vs. ≤60
years | 447 | 1.728
(1.278-2.337) |
<0.001a | 1.096
(0.715-1.681) | 0.674 |
| T stage, T3 and 4
vs. 1 and 2 | 353 | 1.842
(1.308-2.594) |
<0.001a | 0.913
(0.513-1.625) | 0.757 |
| N stage, N1, 2 and
3 vs. 0 | 393 | 1.620
(1.179-2.227) | 0.003a | 5.961
(1.369-25.957) | 0.017a |
| M stage, M1 vs.
0 | 421 | 2.013
(1.059-3.828) | 0.033a | 2.244
(0.755-6.665) | 0.146 |
| Pathological stage,
III and IV vs. I and II | 402 | 1.495
(1.093-2.045) | 0.012a | 0.345
(0.078-1.536) | 0.163 |
| Melanoma Clark
level, IV and V vs. I, II and III | 307 | 2.075
(1.419-3.035) |
<0.001a | 1.382
(0.829-2.304) | 0.215 |
| Melanoma
ulceration, yes vs. no | 306 | 1.949
(1.369-2.775) |
<0.001a | 1.349
(0.871-2.089) | 0.179 |
| Breslow depth, ≤3
vs. >3 mm | 347 | 0.452
(0.323-0.633) |
<0.001a | 0.571
(0.331-0.985) | 0.044a |
| Radiation therapy,
yes vs. no | 441 | 0.966
(0.667-1.400) | 0.856 |
|
|
| HSD11B1-AS1
expression, high vs. low | 447 | 0.520
(0.389-0.695) |
<0.001a | 0.623
(0.418-0.928) | 0.020a |
Nomograms for 1-, 3-, and 5-year OS, PFI and DSS
were constructed based on the independent variables obtained from
the multivariable analysis (Fig.
4A-C). The accuracy of the nomograms was validated using the
C-index and calibration plots. The C-index values were 0.692 (95%
CI, 0.671-0.713) for OS, 0.614 (95% CI, 0.595-0.634) for PFI and
0.675 (95% CI, 0.652-0.699) for DSS, indicating that the
constructed nomograms had good predictive value. Calibration plots
for the probability of 1-, 3- and 5-year OS, PFI, and DSS indicated
notable agreement between the nomogram-predicted and observed
survival.
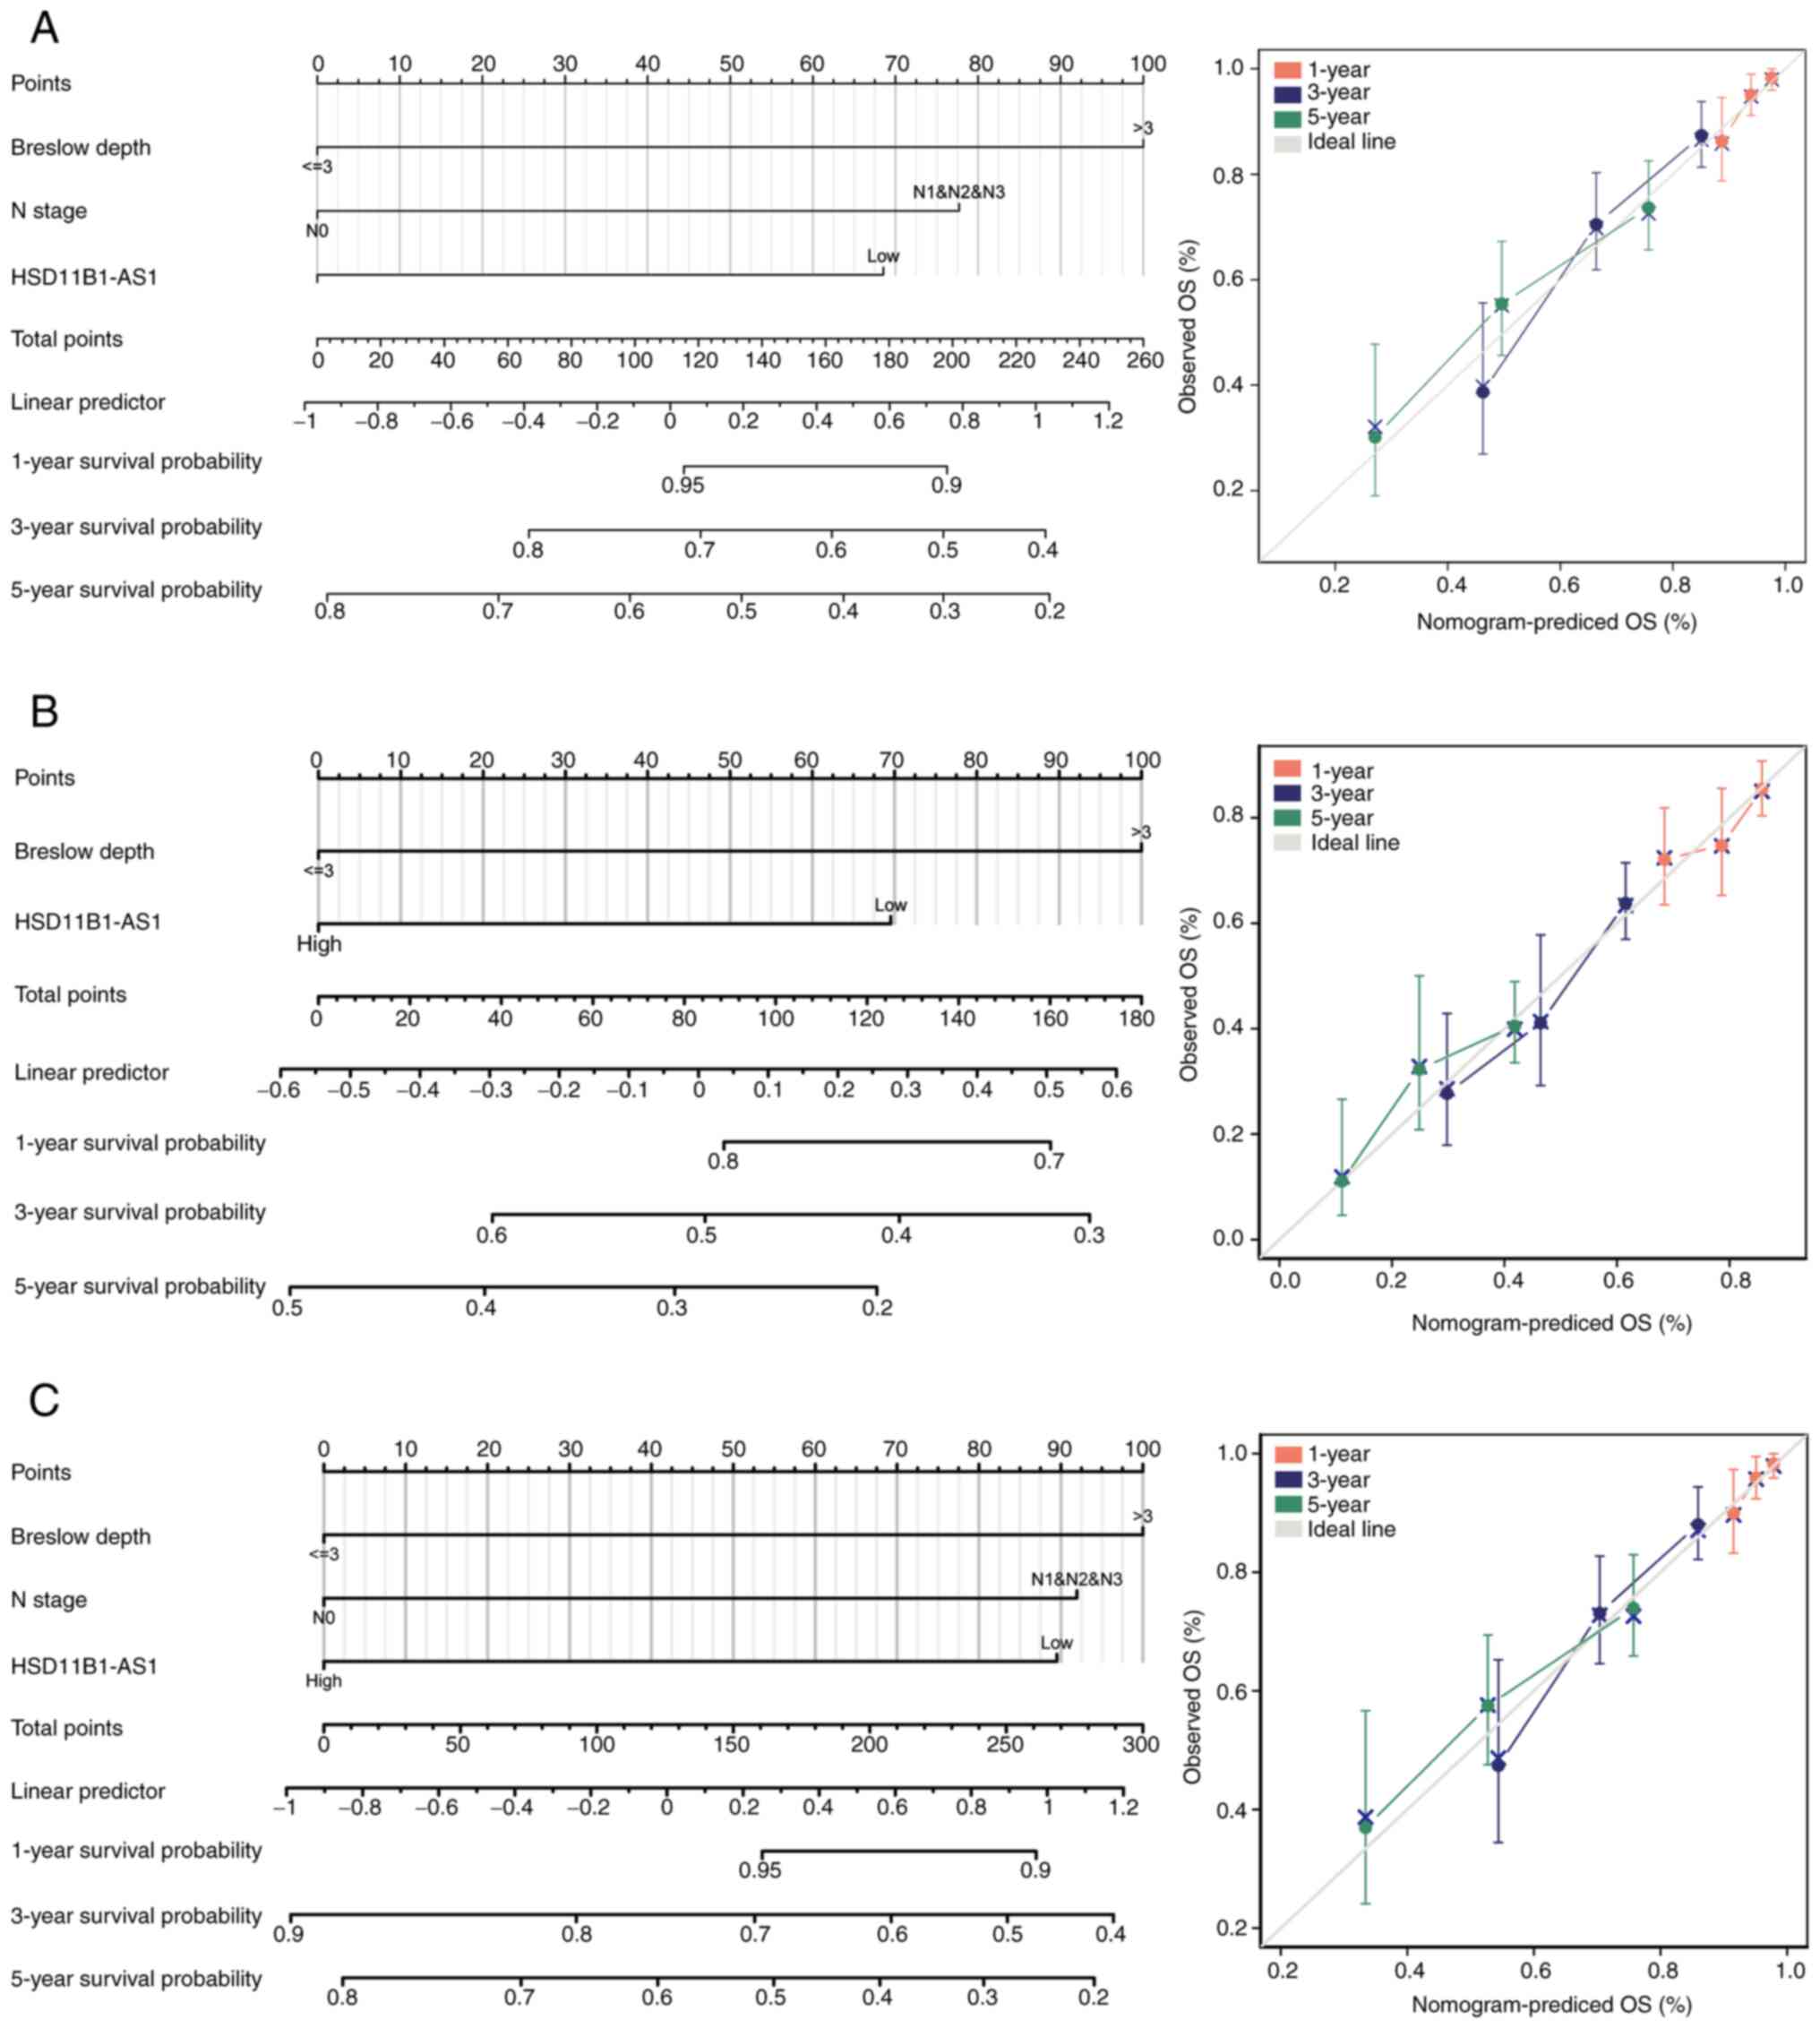 | Figure 4.Prognostic nomogram and calibration
plot to predict the 1-, 3- and 5-year OS, PFI and DSS probabilities
in patients with cutaneous melanoma. Nomograms for predicting the
probability of 1-, 3-, and 5-year (A) OS, (B) PFI and (C) DSS.
Calibration curves of the prognostic nomograms for predicting OS,
PFI and DSS at 1, 3, and 5 years demonstrated no distinct departure
from the ideal lines. OS, overall survival; PFI, progression free
interval; DSS, disease specific survival. |
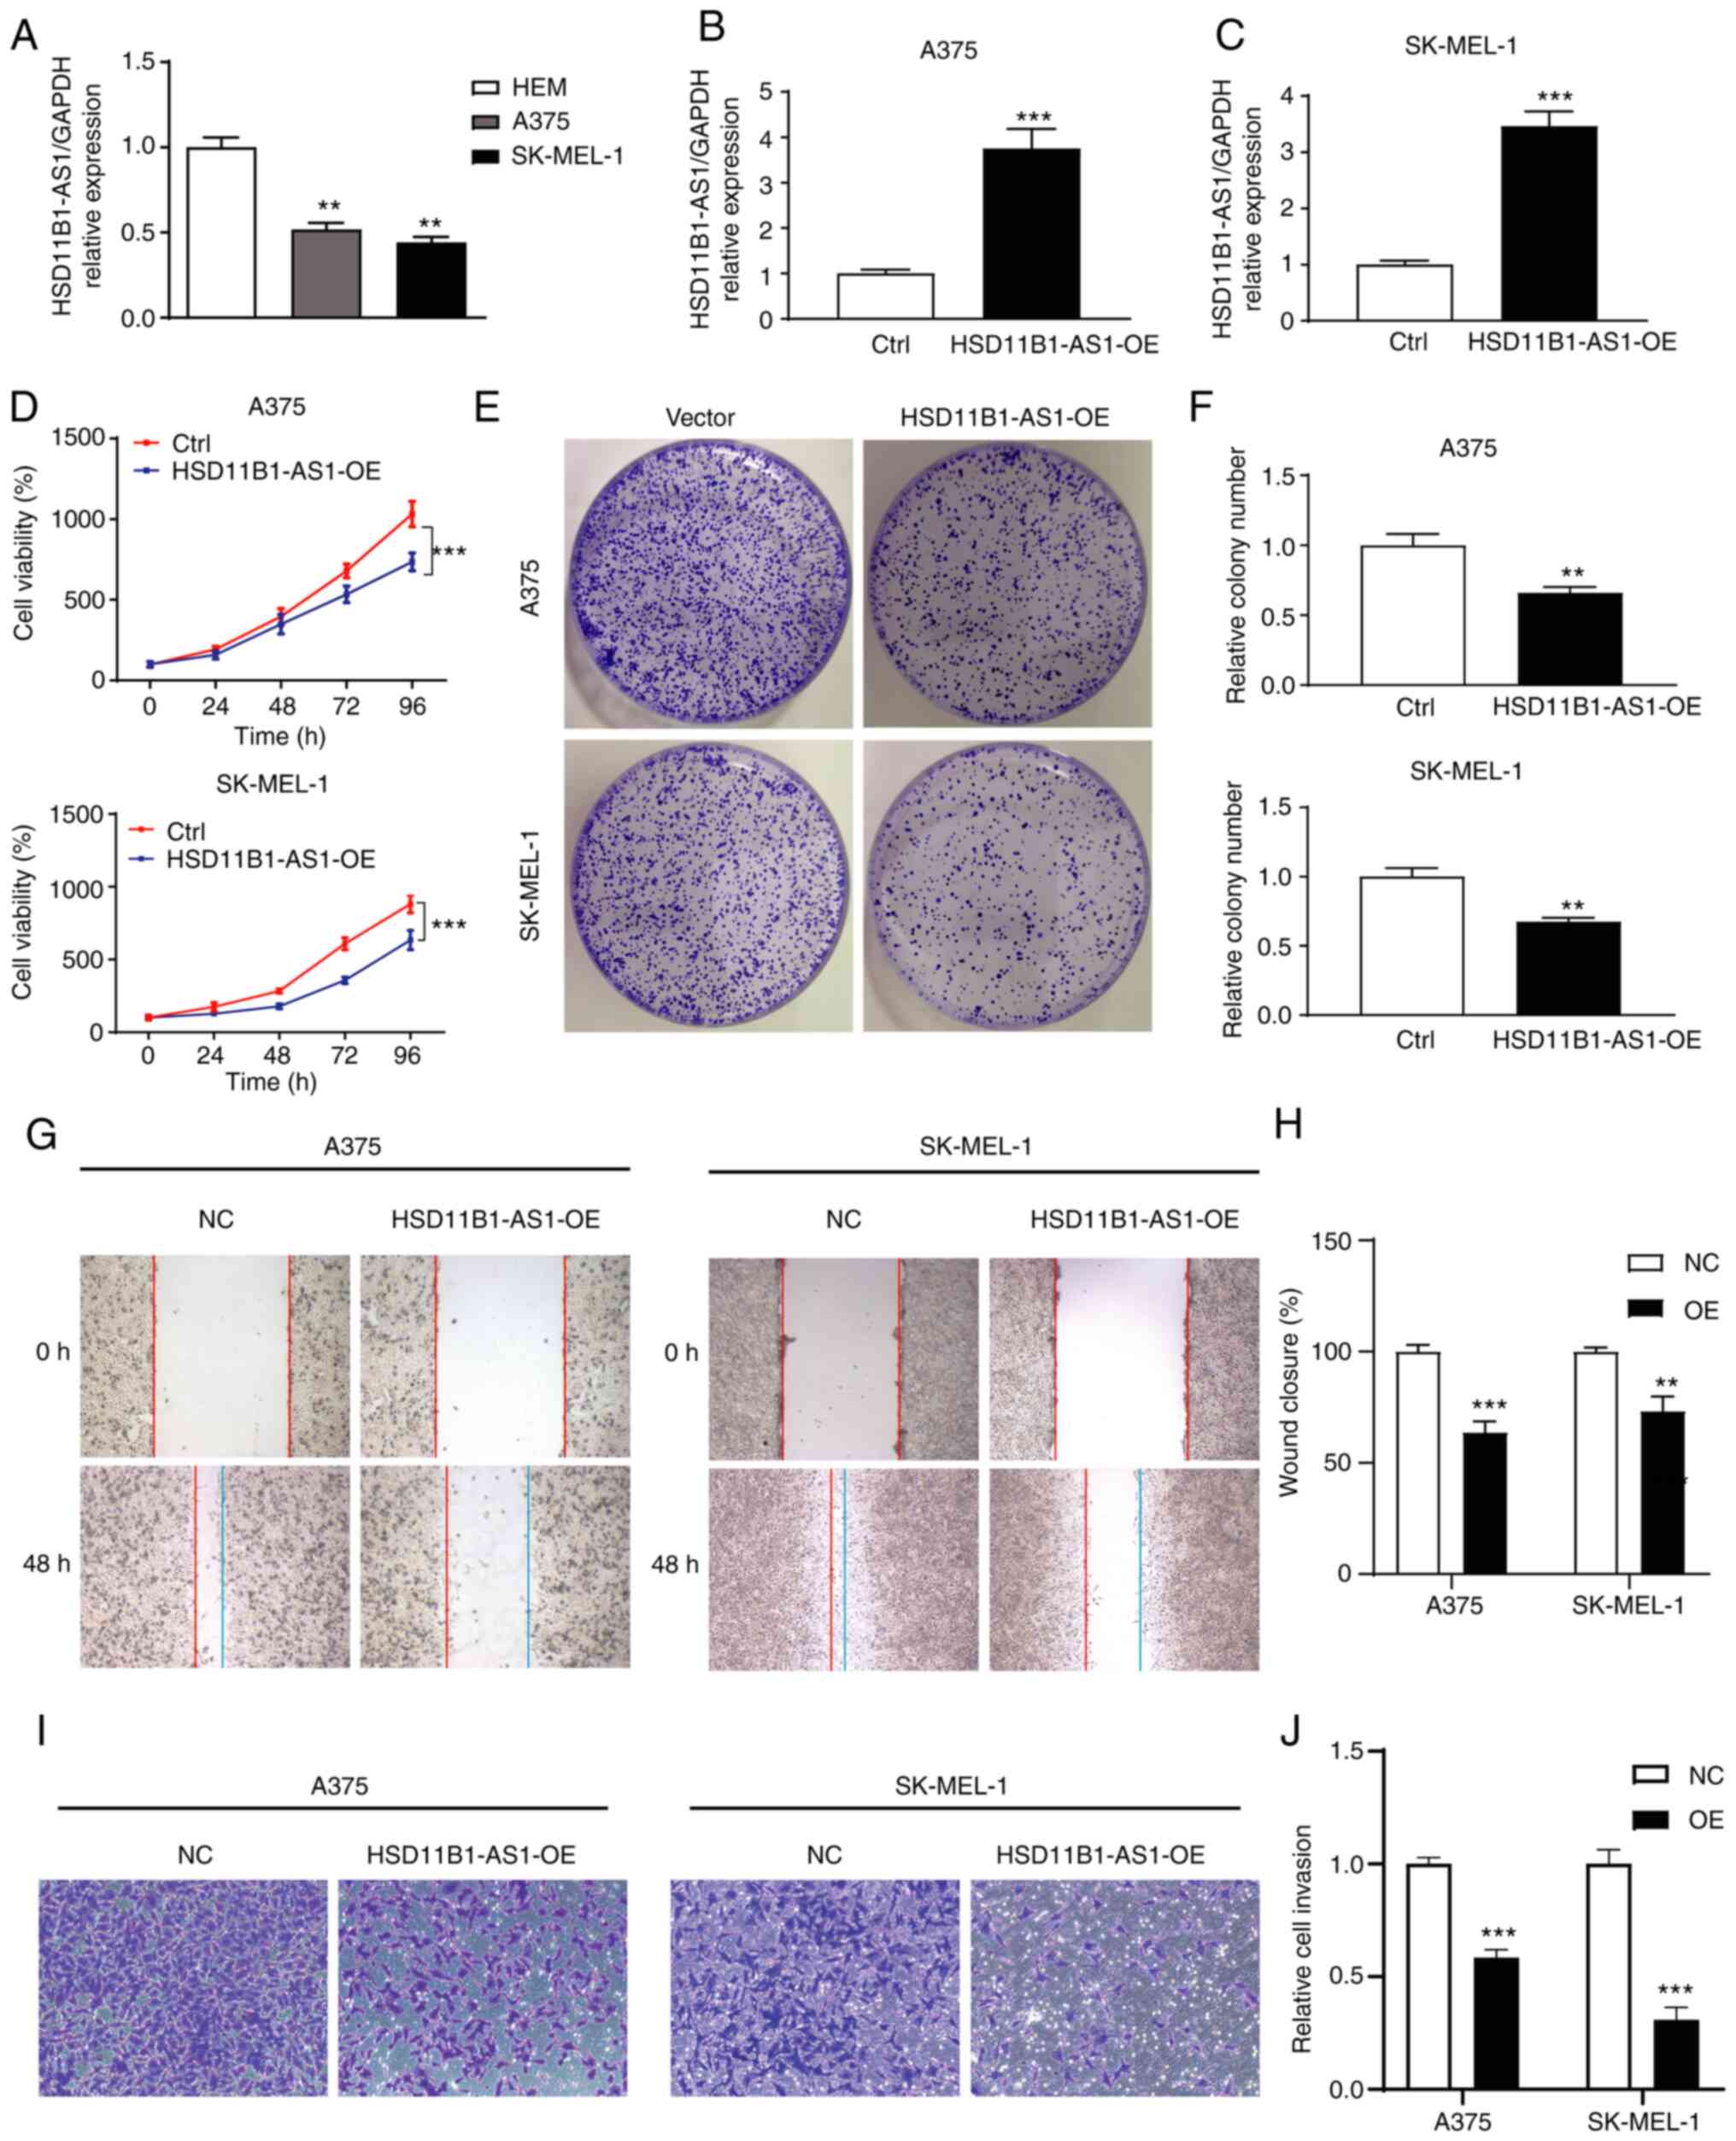
Expression levels of HSD11B1-AS1 in
melanoma cell lines and determination of transfection
efficiency
In vitro assay showed that the expression
levels of HSD11B1-AS1 in melanoma cell lines were
significantly lower than those in normal HEMs (Fig. 5A). Gain-of-function assays were
performed by overexpressing HSD11B1-AS1 in A375 and SK-MEL-1
cell lines and transfection efficiency was determined using
RT-qPCR. Transfection of pcDNA3.1-HSD11B1-AS1 significantly
increased HSD11B1-AS1 expression levels compared with
transfection of pcDNA3.1 empty vector (Fig. 5B and C).
Effect of HSD11B1-AS1 on proliferation
of melanoma cells
CCK-8 assay showed that HSD11B1-AS1
overexpression significantly decreased proliferation of A375 and
SK-MEL-1 cells (Fig. 5D). Colony
formation assay showed that the number of A375 and SK-MEL-1 cell
clones in the HSD11B1-AS1 overexpression group was
significantly lower than in the control group (Fig. 5E and F). These results suggested
that HSD11B1-AS1 inhibited the proliferation of melanoma
cells.
Upregulation of HSD11B1-AS1 suppresses
the metastatic ability of melanoma cells
Wound healing and Transwell migration assays were
performed to assess the effect of HSD11B1-AS1 on the
metastatic ability of A375 and SK-MEL-1 cells. Wound healing assay
revealed that cells in the HSD11B1-AS1 overexpression group
migrated a significantly shorter distance than cells in the control
group (Fig. 5G and H). In the
Transwell assay, the number of invading cells in the
HSD11B1-AS1 overexpression group was significantly lower
compared with cells transfected with empty vector (Fig. 5I and J).
HSD11B1-AS1-associated signaling
pathways were associated with immunity and inflammation, as
identified by GSEA
GSEA analysis revealed that 12 pathways were
significantly enriched: ‘Interferon gamma response’,
‘IL-6/JAK/STAT-3 signaling’, ‘allograft rejection’, ‘inflammatory
response’, ‘KRAS signaling up’, ‘complement’, ‘epithelial
mesenchymal transition’, ‘TNF-α signaling via NF-κB, IL-2/STAT-5
signaling’, ‘coagulation’, ‘IFN-α response’, and ‘apoptosis’
(Fig. 6).
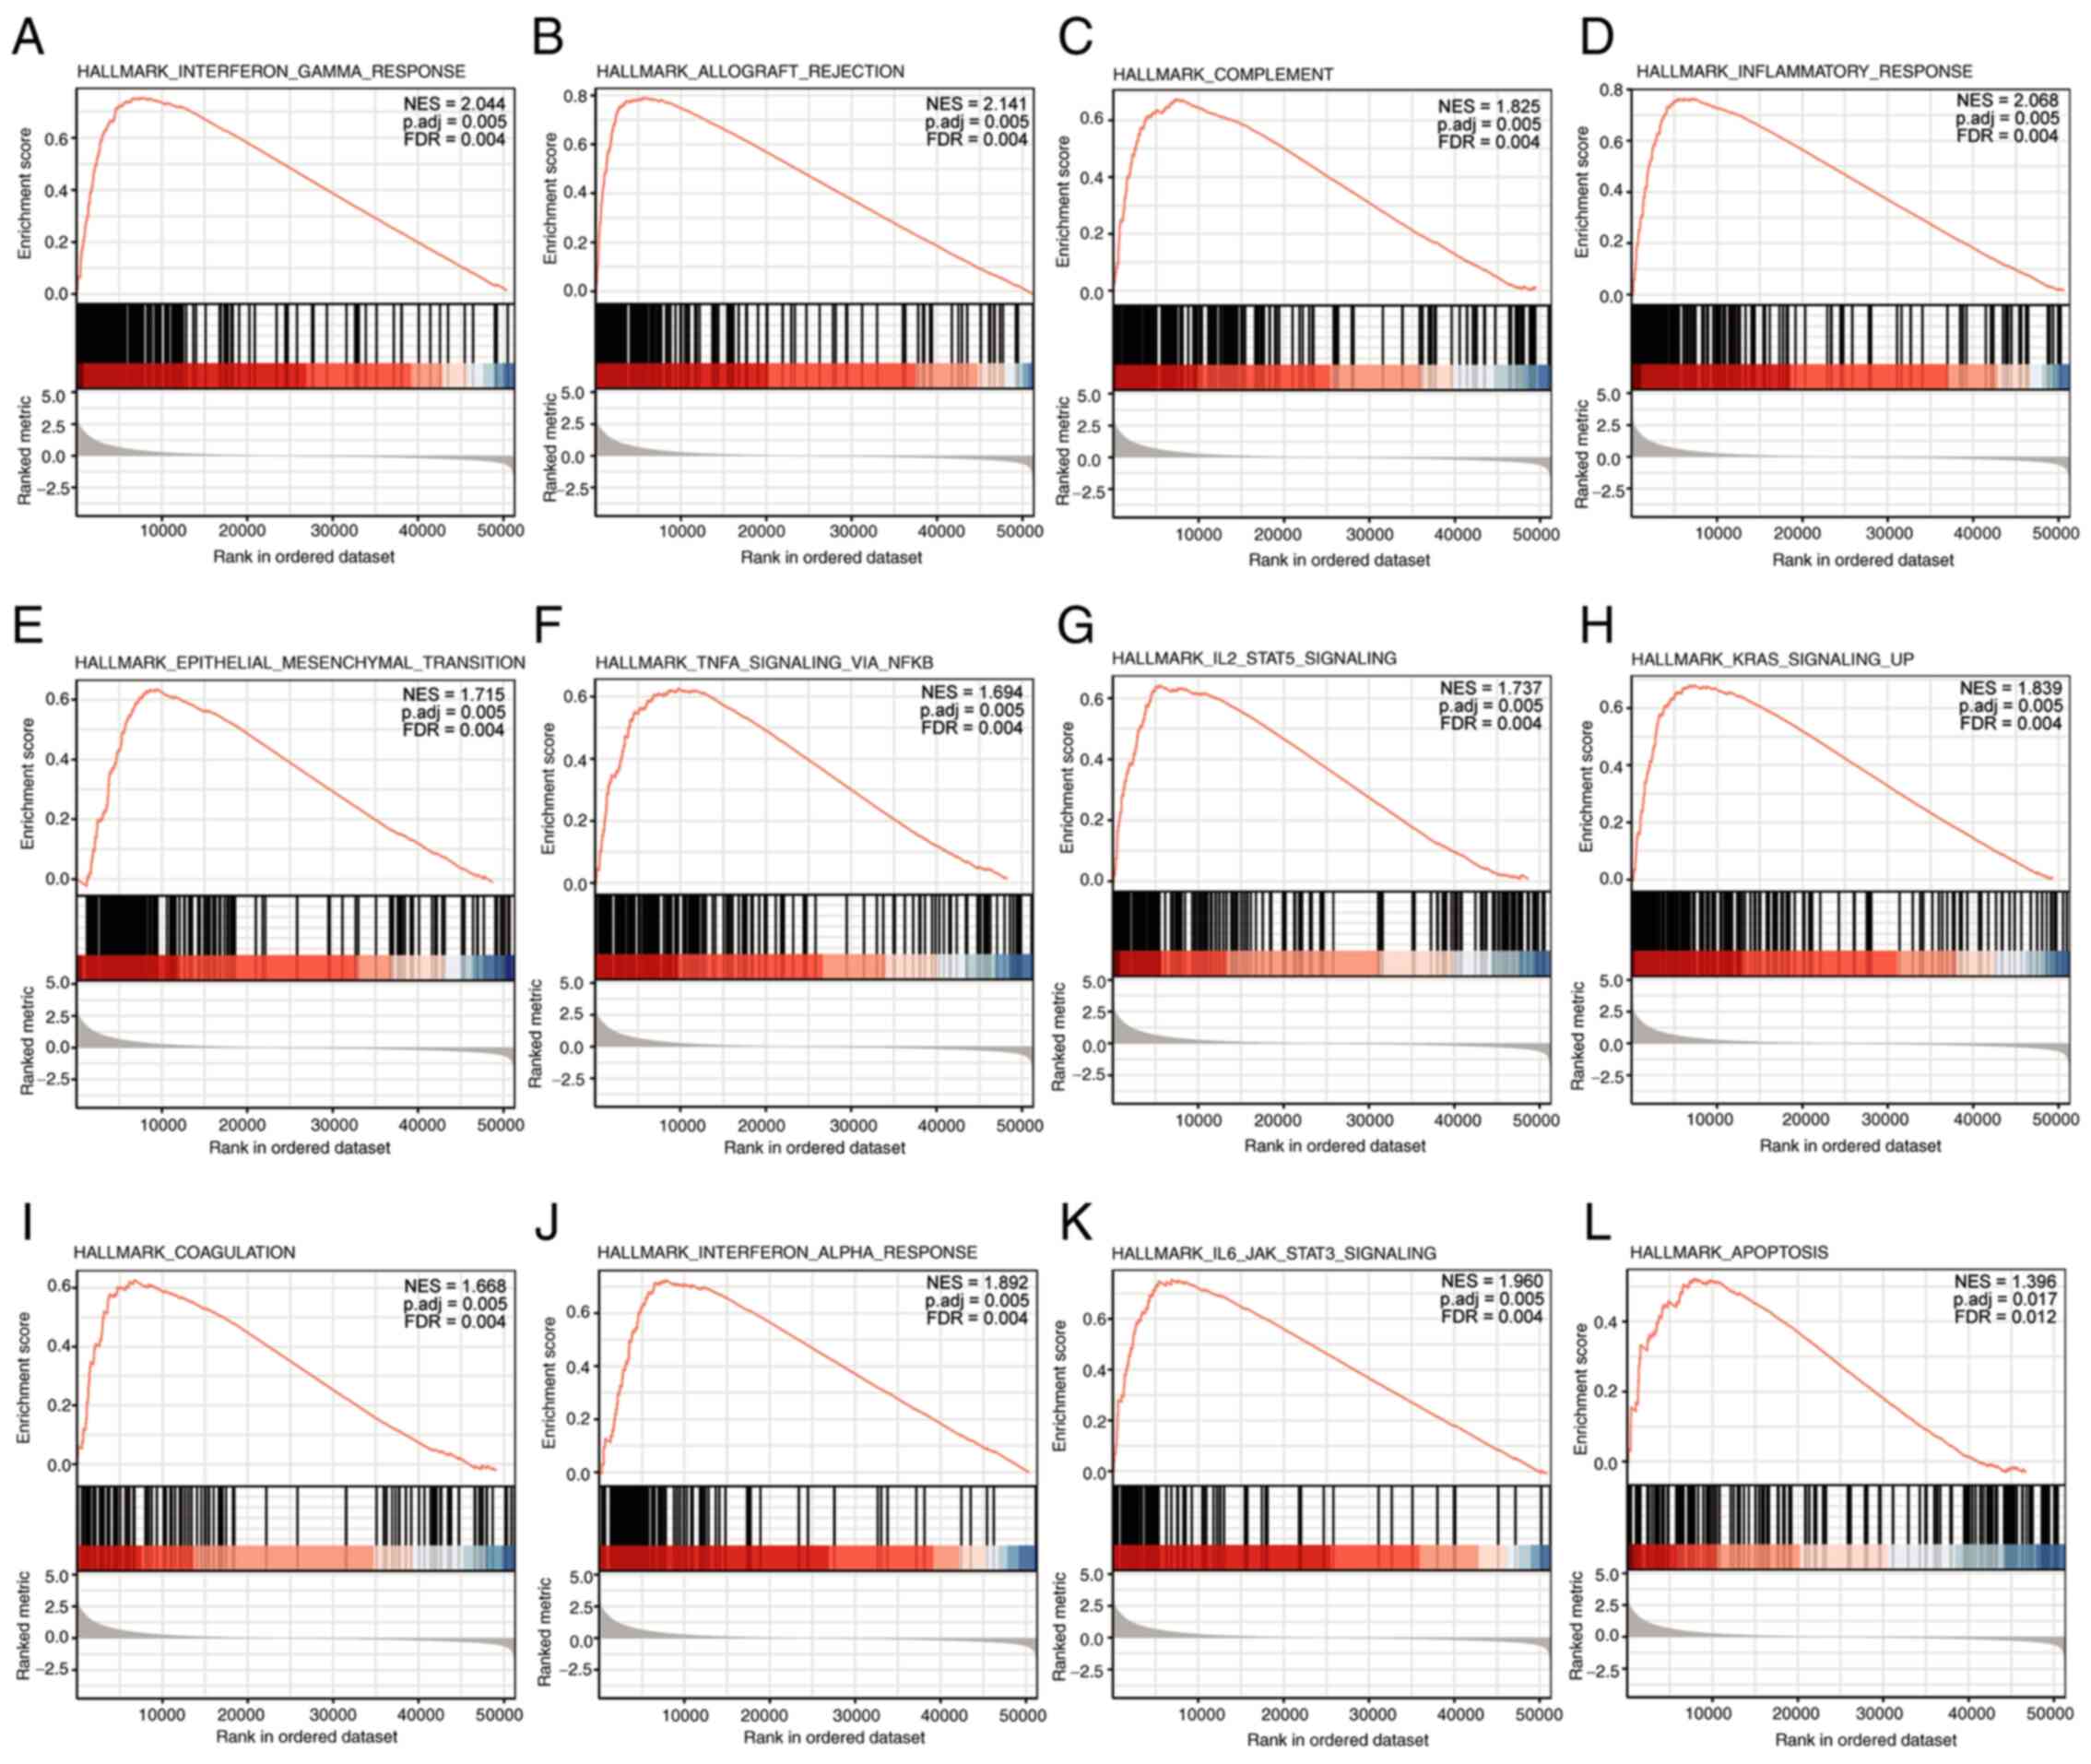 | Figure 6.Enrichment plots from Gene Set
Enrichment Analysis. (A) Interferon gamma response, (B) allograft
rejection, (C) complement, (D) inflammatory response, (E)
epithelial mesenchymal transition, (F) TNF-α signaling via NF-κB,
(G) IL-2/STAT-5 signaling, (H) KRAS signaling up, (I) coagulation,
(J) IFN-α response, (K) IL-6/JAK/STAT-3 signaling, and (L)
apoptosis were significantly enriched. The top 12 are presented and
ordered by ascending adjusted P-value. Adj., adjusted. NES,
normalized enrichment score; FDR, false discovery rate. |
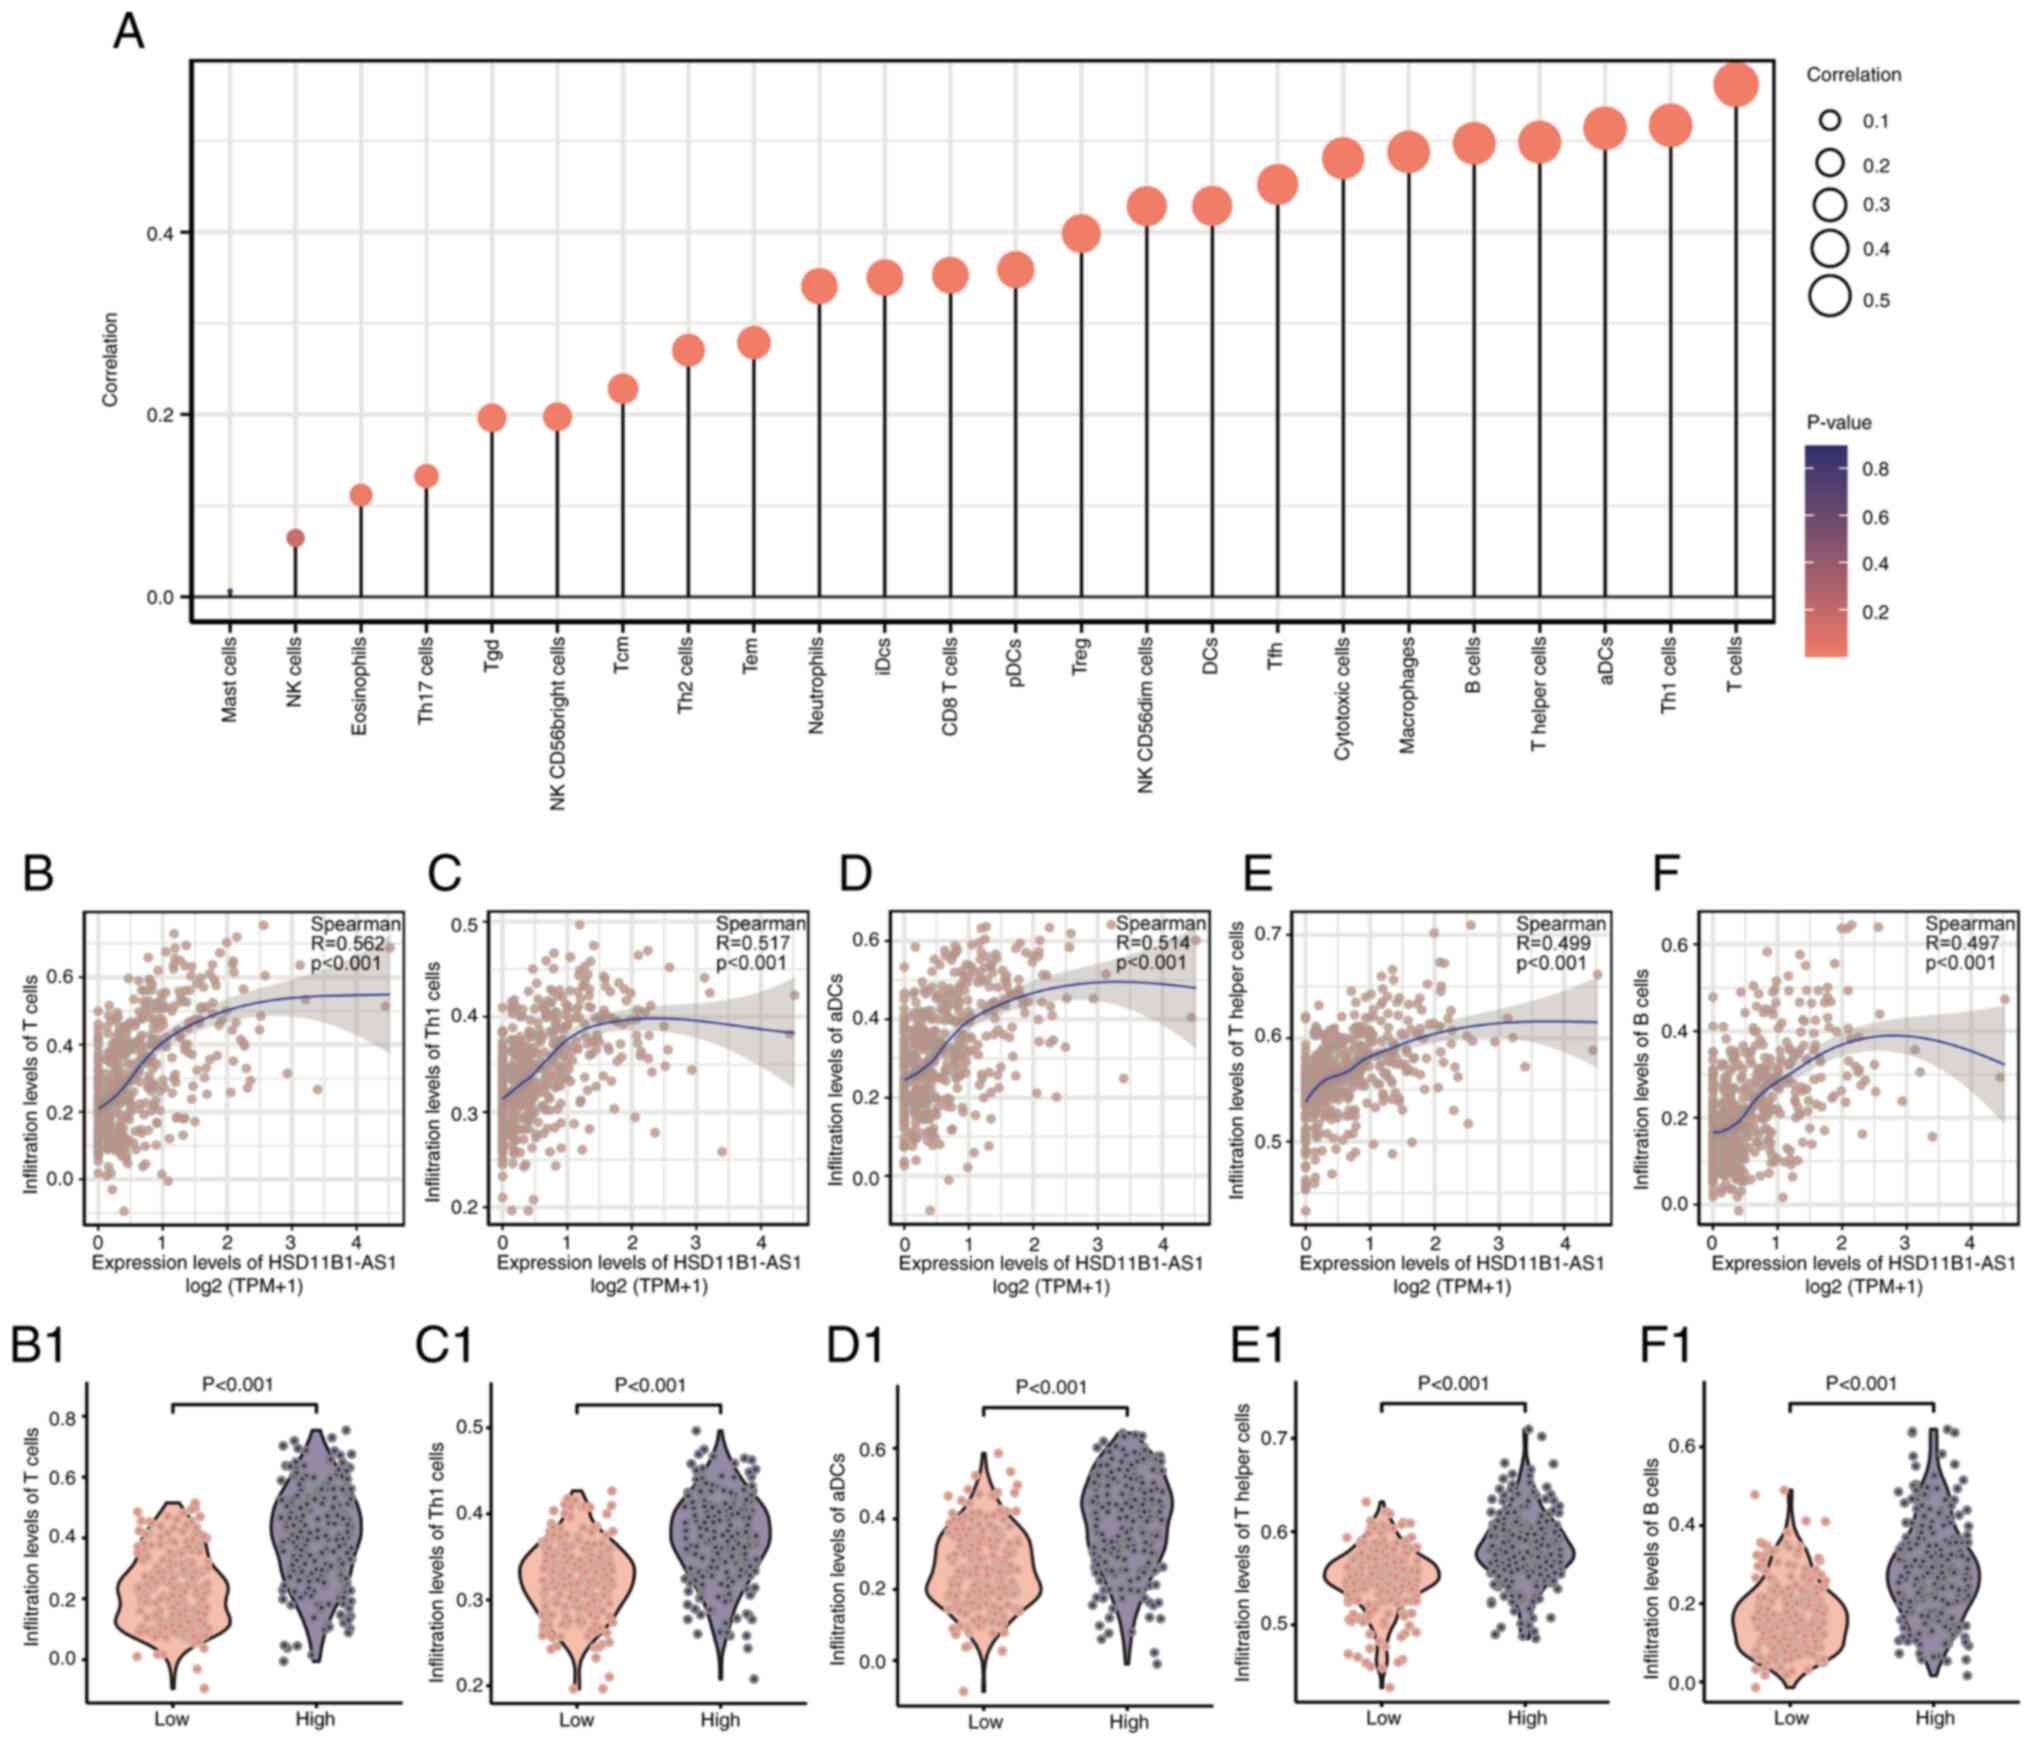
Association between HSD11B1-AS1
expression and immune infiltration
HSD11B1-AS1 expression levels exhibited a
significant positive correlation with infiltrating immune cells,
including T, T helper (h)1, activated dendritic cells (aDCs), Th,
B, cytotoxic, T follicular h (Tfh), DCs, and natural killer (NK)
CD56dim cells, as well as macrophages (R>0.40; Fig. 7A). The abundance of NK and mast
cells was not significantly correlated with HSD11B1-AS1
expression levels. The association between HSD11B1-AS1
expression and the five most abundant infiltrating immune cells
including T (R=0.562; Fig. 7B),
Th1 (R=0.517; Fig. 7C), aDCs
(R=0.514; Fig. 7D), Th (R=0.499;
Fig. 7E) and B cells (R=0.497;
Fig. 7F) was determined (Fig. 7B-F). T cells were most strongly
associated with HSD11B1-AS1 expression (R=0.562; Fig. 7B); likewise, Wilcoxon rank sum test
revealed a significantly higher enrichment score for T cells in the
HSD11B1-AS1 overexpression group (Fig. 7B1). These findings illustrated that
HSD11B1-AS1 was associated with immune cell infiltration in
cutaneous melanoma.
Discussion
Increasing evidence has suggested that lncRNAs serve
as tumor suppressors or oncogenes and may be targets for developing
selective anti-cancer therapeutic strategies owing to their cell
type- and disease-specific expression profiles and their key role
in tumor proliferation, migration and invasion (27,28).
Identification of key biomarkers or therapeutic targets associated
with cutaneous melanoma progression may contribute to better
outcomes for patients with melanoma. Accordingly, using public
data, the present study identified a novel immune-associated
lncRNA, HSD11B1-AS1, which served as a tumor suppressor in
cutaneous melanoma. HSD11B1-AS1, also known as
lnc-LAMB3-1, was previously reported to be associated with
better DFS in breast cancer (29),
but its expression level, biological function and potential roles
in prognosis of cutaneous melanoma are unknown. To the best of our
knowledge, the present study is the first description of
HSD11B1-AS1 in cutaneous melanoma.
The present study demonstrated that
HSD11B1-AS1 is a valuable biomarker for diagnosis and
prognosis and may serve as a therapeutic target in cutaneous
melanoma. TCGA data demonstrated significantly decreased
HSD11B1-AS1 expression levels in both cutaneous melanoma and
other types of malignancy; this was validated in cutaneous melanoma
cell lines and HEMs using RT-qPCR. The present study showed
downregulated HSD11B1-AS1 was associated with poor
clinicopathological characteristics, shorter survival time and
worse prognosis in patients with melanoma. Moreover, elevated
HSD11B1-AS1 expression was shown to affect the survival rate
of patients with melanoma, including those with advanced
clinicopathological variables. In vitro cell function
experiments verified the role of HSD11B1-AS1 in cutaneous
melanoma progression and metastasis. Overexpression of
HSD11B1-AS1 was found to significantly inhibit cell
proliferation, migration and invasion in melanoma cell lines A375
and SK-MEL-1. Therefore, HSD11B1-AS1 may be a promising
biomarker and therapeutic target worthy of further investigation
and clinical validation.
To assess the accuracy of HSD11B1-AS1 as a
prognostic biomarker, nomogram and calibration plots were
established based on multivariate Cox regression analysis. In the
present study, a nomogram was established by combination of
HSD11B1-AS1 with other independent clinical risk factors (N
stage and Breslow depth). The C-index of nomogram was 0.692 (95%
CI, 0.671-0.713) for OS, 0.614 (0.595-0.634) for PFI, and 0.675
(0.652-0.699) for DSS, indicating that the constructed nomograms
had a good predictive value. Moreover, calibration plots for the
probability of 1-, 3- and 5-year OS, PFI and DSS indicated notable
agreement between the predicted and actual values. These results
further demonstrated that HSD11B1-AS1 may serve as a
valuable biomarker for the prognosis of patients with cutaneous
melanoma.
To the best of our knowledge, the present study is
the first to report that HSD11B1-AS1 mediated antitumor
ability by regulating signaling pathways associated with immunity
and inflammation, such as IFN-γ and -α response and IL-2/STAT-5 and
IL-6/JAK/STAT-3 signaling. IFNs are pleiotropic cytokines critical
for cancer immunosurveillance, quality of antitumor response and
response to immunotherapy (30,31).
Numerous studies have demonstrated that IFN signaling is
downregulated in melanoma and decreased IFN-γ signaling limits
immune cell recruitment and recognition of tumor cells by
suppressing the production of IFN-γ-dependent chemokines and
decreasing antigen presentation (32,33).
IL-2 and IL-6 are also pleiotropic cytokines that serve key roles
in inflammatory and immune response. IL-2 promotes proliferation of
T cells and immunoglobulin synthesis by B cells; IL-6 exerts its
effects via activation and differentiation of T and B lymphocytes
(34). lncRNAs regulate innate and
adaptive immunity in cancer by mediating the functional state of
immunological cells, pathways and genes (35). For example, lncRNA colorectal
neoplasia differentially expressed exacerbates IgA nephropathy
progression by restraining the ubiquitination and degradation of
NLRP3, and facilitating NLRP3 inflammasome activation in
macrophages (36). Therefore,
immune infiltration analysis was performed to assess tumor immune
surveillance in cutaneous melanoma.
Immune infiltration analysis revealed that
HSD11B1-AS1 overexpression exhibited a strong positive
association with infiltration of various types of immune cell, most
notably T (R=0.562), Th1 (R=0.517), aDCs (R=0.514), Th (R=0.499)
and B cells (R=0.497). Studies have reported that immune cell
infiltration, particularly high peritumoral levels of activated T
cells, B lymphocytes, and mature DCs, is associated with favorable
prognosis in melanoma (37,38).
T cells are important in antitumor immune response and are the most
abundant infiltrating cells in melanoma; increased infiltration of
CD8+ T and Th1 cells is associated with favorable
clinical outcomes in various types of cancer (37,39).
B cells account for 15–20% of infiltrating lymphocytes, but growing
evidence indicates that B cells are correlated with activated T
cells and may promote tumor immunity by facilitating T cell
infiltration into tumors, thus improving survival in melanoma
(40,41). In addition to adaptive immune
cells, DCs, as innate immune cells, serve an important role in
bridging the innate and adaptive immune responses and exert their
functions via antigen presentation to T cells. Similar to B cell
infiltration, increased DC infiltration is associated with
activated T cells and better prognosis (42). These results indicate a potential
mechanism by which elevated HSD11B1-AS1 expression increases
survival, which is consistent with results of the present study.
Together, these findings suggest that overexpression of
HSD11B1-AS1 may improve the prognosis of patients with
melanoma by promoting immune response and cell infiltration.
Although the findings of the present study provide
understanding about the functions of HSD11B1-AS1 in
cutaneous melanoma, certain limitations should be noted. First of
all, the present study focused on bioinformatics analysis; further
studies should validate the molecular mechanism of
HSD11B1-AS1 both in vitro and in vivo. Second,
HSD11B1-AS1 was shown to have the potential to be a
diagnostic and prognostic biomarker for cutaneous melanoma using
expression profiles and clinical information obtained from TCGA,
but large-sample, multicenter, randomized controlled trials need to
be performed to determine whether HSD11B1-AS1 is a suitable
molecular marker in practice.
To the best of our knowledge, the present study was
the first to demonstrate that HSD11B1-AS1, which was
significantly decreased in cutaneous melanoma compared with normal
cells, may be a valuable diagnostic and prognostic biomarker and
therapeutic target in cutaneous melanoma. Overexpression of
HSD11B1-AS1 significantly suppressed melanoma cell
proliferation, migration and invasion in melanoma cell lines A375
and SK-MEL-1. Elevated HSD11B1-AS1 in melanoma was
correlated with favorable clinicopathological features and better
prognosis, which may be caused by increased immune response and
infiltration of immunocytes, particularly T and B cells and
aDCs.
Acknowledgements
Not applicable.
Funding
Funding: No funding was received.
Availability of data and materials
The datasets used and/or analyzed during the current
study are available from the corresponding author on reasonable
request.
Authors' contributions
KL and LZ conceived and designed the present study.
JZ and XL performed the literature review and analyzed the data.
KL, LZ and XL drafted the initial manuscript and confirmed the
authenticity of all the raw data. All authors have read and
approved the final manuscript.
Ethics approval and consent to
participate
Not applicable.
Patient consent for publication
Not applicable.
Competing interests
The authors declare that they have no competing
interests.
References
|
1
|
McCarthy M: US melanoma prevalence has
doubled over past 30 years. BMJ. 350:h30742015. View Article : Google Scholar : PubMed/NCBI
|
|
2
|
Rebecca VW, Somasundaram R and Herlyn M:
Pre-clinical modeling of cutaneous melanoma. Nat Commun.
11:28582020. View Article : Google Scholar : PubMed/NCBI
|
|
3
|
Long GV, Grob JJ, Nathan P, Ribas A,
Robert C, Schadendorf D, Lane SR, Mak C, Legenne P, Flaherty KT and
Davies MA: Factors predictive of response, disease progression, and
overall survival after dabrafenib and trametinib combination
treatment: A pooled analysis of individual patient data from
randomised trials. Lancet Oncol. 17:1743–1754. 2016. View Article : Google Scholar : PubMed/NCBI
|
|
4
|
Siegel R, Ma J, Zou Z and Jemal A: Cancer
statistics, 2014. CA Cancer J Clin. 64:9–29. 2014. View Article : Google Scholar : PubMed/NCBI
|
|
5
|
Garbe C, Peris K, Hauschild A, Saiag P,
Middleton M, Bastholt L, Grob JJ, Malvehy J, Newton-Bishop J,
Stratigos AJ, et al: Diagnosis and treatment of melanoma. European
consensus-based interdisciplinary guideline-Update 2016 = Eur J
Cancer. 63:201–217. 2016.PubMed/NCBI
|
|
6
|
Luther C, Swami U, Zhang J, Milhem M and
Zakharia Y: Advanced stage melanoma therapies: Detailing the
present and exploring the future. Crit Rev Oncol Hematol.
133:99–111. 2019. View Article : Google Scholar : PubMed/NCBI
|
|
7
|
Zaretsky JM, Garcia-Diaz A, Shin DS,
Escuin-Ordinas H, Hugo W, Hu-Lieskovan S, Torrejon DY,
Abril-Rodriguez G, Sandoval S, Barthly L, et al: Mutations
associated with acquired resistance to PD-1 blockade in melanoma. N
Engl J Med. 375:819–829. 2016. View Article : Google Scholar : PubMed/NCBI
|
|
8
|
Liang Y, Song X, Li Y, Chen B, Zhao W,
Wang L, Zhang H, Liu Y, Han D, Zhang N, et al: LncRNA BCRT1
promotes breast cancer progression by targeting miR-1303/PTBP3
axis. Mol Cancer. 19:852020. View Article : Google Scholar : PubMed/NCBI
|
|
9
|
Yu X, Zheng H, Tse G, Zhang L and Wu WKK:
CASC2: An emerging tumour-suppressing long noncoding RNA in human
cancers and melanoma. Cell Prolif. 51:e125062018. View Article : Google Scholar : PubMed/NCBI
|
|
10
|
Xu W, Yan Z, Hu F, Wei W, Yang C and Sun
Z: Long non-coding RNA GAS5 accelerates oxidative stress in
melanoma cells by rescuing EZH2-mediated CDKN1C downregulation.
Cancer Cell Int. 20:1162020. View Article : Google Scholar : PubMed/NCBI
|
|
11
|
Yu X, Zheng H, Tse G, Chan MT and Wu WK:
Long non-coding RNAs in melanoma. Cell Prolif. 51:e124572018.
View Article : Google Scholar : PubMed/NCBI
|
|
12
|
Richtig G, Ehall B, Richtig E,
Aigelsreiter A, Gutschner T and Pichler M: Function and clinical
implications of long Non-Coding RNAs in melanoma. Int J Mol Sci.
18:7152017. View Article : Google Scholar : PubMed/NCBI
|
|
13
|
Riefolo M, Porcellini E, Dika E,
Broseghini E and Ferracin M: Interplay between small and long
non-coding RNAs in cutaneous melanoma: A complex jigsaw puzzle with
missing pieces. Mol Oncol. 13:74–98. 2019. View Article : Google Scholar : PubMed/NCBI
|
|
14
|
Leucci E, Vendramin R, Spinazzi M,
Laurette P, Fiers M, Wouters J, Radaelli E, Eyckerman S, Leonelli
C, Vanderheyden K, et al: Melanoma addiction to the long non-coding
RNA SAMMSON. Nature. 531:518–522. 2016. View Article : Google Scholar : PubMed/NCBI
|
|
15
|
Wu K, Wang Q, Liu YL, Xiang Z, Wang QQ,
Yin L and Liu SL: LncRNA POU3F3 contributes to dacarbazine
resistance of human melanoma through the MiR-650/MGMT Axis. Front
Oncol. 11:6436132021. View Article : Google Scholar : PubMed/NCBI
|
|
16
|
Attrill GH, Ferguson PM, Palendira U, Long
GV, Wilmott JS and Scolyer RA: The tumour immune landscape and its
implications in cutaneous melanoma. Pigment Cell Melanoma Res.
34:529–549. 2021. View Article : Google Scholar : PubMed/NCBI
|
|
17
|
Wu M, Fu P, Qu L, Liu J and Lin A: Long
noncoding RNAs, new critical regulators in cancer immunity. Front
Oncol. 10:5509872020. View Article : Google Scholar : PubMed/NCBI
|
|
18
|
Zhang K, Zhang L, Mi Y, Tang Y, Ren F, Liu
B, Zhang Y and Zheng P: A ceRNA network and a potential regulatory
axis in gastric cancer with different degrees of immune cell
infiltration. Cancer Sci. 111:4041–4050. 2020. View Article : Google Scholar : PubMed/NCBI
|
|
19
|
Li G, Kryczek I, Nam J, Li X, Li S, Li J,
Wei S, Grove S, Vatan L, Zhou J, et al: LIMIT is an immunogenic
lncRNA in cancer immunity and immunotherapy. Nat Cell Biol.
23:526–537. 2021. View Article : Google Scholar : PubMed/NCBI
|
|
20
|
Appelbaum EN, Gross ND, Diab A, Bishop AJ,
Nader ME and Gidley PW: Melanoma of the external auditory canal: A
review of seven cases at a tertiary care referral center.
Laryngoscope. 131:165–172. 2021. View Article : Google Scholar : PubMed/NCBI
|
|
21
|
Livak KJ and Schmittgen TD: Analysis of
relative gene expression data using real-time quantitative PCR and
the 2(−Delta Delta C(T)) method. Methods. 25:402–408. 2001.
View Article : Google Scholar : PubMed/NCBI
|
|
22
|
Subramanian A, Tamayo P, Mootha VK,
Mukherjee S, Ebert BL, Gillette MA, Paulovich A, Pomeroy SL, Golub
TR, Lander ES and Mesirov JP: Gene set enrichment analysis: A
knowledge-based approach for interpreting genome-wide expression
profiles. Proc Natl Acad Sci USA. 102:15545–15550. 2005. View Article : Google Scholar : PubMed/NCBI
|
|
23
|
Yu G, Wang LG, Han Y and He QY:
clusterProfiler: An R package for comparing biological themes among
gene clusters. OMICS. 16:284–287. 2012. View Article : Google Scholar : PubMed/NCBI
|
|
24
|
Hänzelmann S, Castelo R and Guinney J:
GSVA: Gene set variation analysis for microarray and RNA-seq data.
BMC Bioinformatics. 14:72013. View Article : Google Scholar : PubMed/NCBI
|
|
25
|
Bindea G, Mlecnik B, Tosolini M,
Kirilovsky A, Waldner M, Obenauf AC, Angell H, Fredriksen T,
Lafontaine L, Berger A, et al: Spatiotemporal dynamics of
intratumoral immune cells reveal the immune landscape in human
cancer. Immunity. 39:782–795. 2013. View Article : Google Scholar : PubMed/NCBI
|
|
26
|
Liu J, Lichtenberg T, Hoadley KA, Poisson
LM, Lazar AJ, Cherniack AD, Kovatich AJ, Benz CC, Levine DA, Lee
AV, et al: An integrated TCGA pan-cancer clinical data resource to
drive high-quality survival outcome analytics. Cell.
173:400–416.e11. 2018. View Article : Google Scholar : PubMed/NCBI
|
|
27
|
Leucci E, Coe EA, Marine JC and Vance KW:
The emerging role of long non-coding RNAs in cutaneous melanoma.
Pigment Cell Melanoma Res. 29:619–626. 2016. View Article : Google Scholar : PubMed/NCBI
|
|
28
|
Ma W, Qiao J, Zhou J, Gu L and Deng D:
Characterization of novel LncRNA P14AS as a protector of ANRIL
through AUF1 binding in human cells. Mol Cancer. 19:422020.
View Article : Google Scholar : PubMed/NCBI
|
|
29
|
Vishnubalaji R, Shaath H, Elkord E and
Alajez NM: Long non-coding RNA (lncRNA) transcriptional landscape
in breast cancer identifies LINC01614 as non-favorable prognostic
biomarker regulated by TGFbeta and focal adhesion kinase (FAK)
signaling. Cell Death Discov. 5:1092019. View Article : Google Scholar : PubMed/NCBI
|
|
30
|
Dunn GP, Koebel CM and Schreiber RD:
Interferons, immunity and cancer immunoediting. Nat Rev Immunol.
6:836–848. 2006. View Article : Google Scholar : PubMed/NCBI
|
|
31
|
von Locquenghien M, Rozalen C and
Celia-Terrassa T: Interferons in cancer immunoediting: Sculpting
metastasis and immunotherapy response. J Clin Invest.
131:e1432962021. View Article : Google Scholar : PubMed/NCBI
|
|
32
|
Alavi S, Stewart AJ, Kefford RF, Lim SY,
Shklovskaya E and Rizos H: Interferon signaling is frequently
downregulated in melanoma. Front Immunol. 9:14142018. View Article : Google Scholar : PubMed/NCBI
|
|
33
|
Garcia-Diaz A, Shin DS, Moreno BH, Saco J,
Escuin-Ordinas H, Rodriguez GA, Zaretsky JM, Sun L, Hugo W, Wang X,
et al: Interferon receptor signaling pathways regulating PD-L1 and
PD-L2 expression. Cell Rep. 19:1189–1201. 2017. View Article : Google Scholar : PubMed/NCBI
|
|
34
|
Lin JX and Leonard WJ: The role of Stat5a
and Stat5b in signaling by IL-2 family cytokines. Oncogene.
19:2566–2576. 2000. View Article : Google Scholar : PubMed/NCBI
|
|
35
|
Yu Y, Zhang W, Li A, Chen Y, Ou Q, He Z,
Zhang Y, Liu R, Yao H and Song E: Association of long noncoding RNA
biomarkers with clinical immune subtype and prediction of
immunotherapy response in patients with cancer. JAMA Netw Open.
3:e2021492020. View Article : Google Scholar : PubMed/NCBI
|
|
36
|
Shen M, Pan X, Gao Y, Ye H, Zhang J, Chen
Y, Pan M, Huang W, Xu X, Zhan Y and Jin L: LncRNA CRNDE exacerbates
IgA nephropathy progression by promoting NLRP3 inflammasome
activation in macrophages. Immunol Invest. 7:1–13. 2021. View Article : Google Scholar
|
|
37
|
Ladányi A: Prognostic and predictive
significance of immune cells infiltrating cutaneous melanoma.
Pigment Cell Melanoma Res. 28:490–500. 2015. View Article : Google Scholar : PubMed/NCBI
|
|
38
|
Ladányi A, Kiss J, Somlai B, Gilde K,
Fejos Z, Mohos A, Gaudi I and Tímár J: Density of DC-LAMP(+) mature
dendritic cells in combination with activated T lymphocytes
infiltrating primary cutaneous melanoma is a strong independent
prognostic factor. Cancer Immunol Immunother. 56:1459–1469. 2007.
View Article : Google Scholar : PubMed/NCBI
|
|
39
|
Fridman WH, Pagès F, Sautès-Fridman C and
Galon J: The immune contexture in human tumours: Impact on clinical
outcome. Nat Rev Cancer. 12:298–306. 2012. View Article : Google Scholar : PubMed/NCBI
|
|
40
|
Kobayashi T, Hamaguchi Y, Hasegawa M,
Fujimoto M, Takehara K and Matsushita T: B cells promote tumor
immunity against B16F10 melanoma. Am J Pathol. 184:3120–3129. 2014.
View Article : Google Scholar : PubMed/NCBI
|
|
41
|
Garg K, Maurer M, Griss J, Brüggen MC,
Wolf IH, Wagner C, Willi N, Mertz KD and Wagner SN:
Tumor-associated B cells in cutaneous primary melanoma and improved
clinical outcome. Hum Pathol. 54:157–164. 2016. View Article : Google Scholar : PubMed/NCBI
|
|
42
|
Monti M, Consoli F, Vescovi R, Bugatti M
and Vermi W: Human plasmacytoid dendritic cells and cutaneous
melanoma. Cells. 9:4172020. View Article : Google Scholar : PubMed/NCBI
|