Introduction
Keloids are abnormal fibrous hyperplasias that
exceed the initial injury area and invade adjacent healthy skin
(1–3). Due to limitations in the
understanding of the pathogenesis of keloids, clinical research
progress into the prevention and treatment of keloids has been
relatively slow. All current treatments are associated with
recurrence. Therefore, it is necessary to further examine keloid
pathogenesis and lay the foundation for the clinical exploration of
new treatment options. The study of disease-causing genes is
indispensable in this regard. The genetic theory of keloids has
mainly been founded on the discovery that keloids run in families
(1,2). Keloids are highly prevalent among
certain ethnic groups (1,2). However, numerous patients with
keloids have no family history of this condition (3,4).
Thus, the characteristics of genes associated with keloid formation
require further exploration.
Keloid scars may result from skin lesions and
irritants, including trauma, insect bites, burns, surgery, skin
punctures, acne, hair folliculitis and herpes zoster infection
(5). Infection is also an
important pathogenic factor in keloid formation (5). Keloids often arise from skin
infections, such as acne. It has also been revealed that the number
of inflammatory cells and fibroblasts in the reticular layer of
keloids is elevated (5). In
addition, pro-inflammatory cytokines, such as IL-1, IL-6 and TNF-α,
are upregulated in keloid tissue, suggesting that pro-inflammatory
gene expression is increased and localized inflammation is present
in patients with keloids (6). The
involvement of other pro-inflammatory cytokines, such as IL-4,
IL-10 and IL-13, has also been reported in the literature (7,8).
However, the association between the expression of various
inflammatory factors and local gene expression is not well
understood.
In the present study, an analysis of immune-related
genes, the expression profiles and differentially expressed genes
(DEGs) found at different stages of keloid development was used to
identify hub genes. To describe the tumor gene expression
characteristics of keloid development, healthy skin tissue,
inflamed tissue and keloid tissue samples were collected from
patients with keloids. A bioinformatics approach was adopted to
explore the differences in the expression of immune-related genes
in these samples and to identify potential hub genes at different
stages of keloid development.
Materials and methods
Patients
The present study was approved (approval no.
JS-2907) by The Medical Ethics Committee of Peking Union Medical
College Hospital in Beijing, China. Written and photographic
informed consents were obtained from all participants. A total of 9
patients with keloids and inflammation next to their keloid mass
and healthy tissue around the keloid mass were enrolled between
January 2019 and March 2020. Basic demographic information (sex and
age) of the participants was collected, and the condition of their
keloids was assessed using the modified Vancouver scar scale
(9) according to the type of
keloid lesions they had (Tables I
and II). Patients <18 or
>60 years of age were excluded. Patients with severe systemic
disease were also excluded. No patients had other systemic
disorders, or received any drugs or other treatments that may
affect the study results (such as corticosteroids, 5-fluorouracil
injection or radiotherapy). There were 4 male and 5 female
patients, and their ages ranged from 24-37 years. The patients were
divided into two groups. Group 1 included 5 patients whose tissue
samples were used for high-throughput sequencing (Table I). Group 2 included 4 patients
whose tissue samples were used for experimental verification
(Table II). All samples were
collected from the chest region. Keloid samples (K group; K7, K8,
K9, K14, K36) were obtained from the inner zone of the keloid
tissue removed after surgery. Healthy skin samples (N group; N7,
N8, N9, N14, N36) were obtained from healthy skin tissue that had
to be removed during keloid resection. Inflamed tissue samples (I
group; I7, I8, I9, I14, I36) were obtained from the inflamed skin
tissue after acute-stage in patients with keloids and inflammatory
lesions (Fig. S1) occurring
outside the keloid mass, which were removed during keloid
resection. The distance between the keloid and the surrounding
healthy skin tissue was 2-3 mm.
 | Table I.Characteristics of patients of group
1. |
Table I.
Characteristics of patients of group
1.
|
Patientsa | Age of onset
(years) | Sex | mVSS | Onset time
(years) |
|---|
| K7, N7, I7 | 24 | Female | 11 | 11 |
| K8, N8, I8 | 32 | Male | 10 | 8 |
| K9, N9, I9 | 37 | Female | 10 | 16 |
| K14, N14, I14 | 21 | Male | 9 | 6 |
| K36, N36, I36 | 30 | Female | 10 | 9 |
| Table II.Characteristic of patients of group
2. |
Table II.
Characteristic of patients of group
2.
|
Patientsa | Age of onset
(years) | Sex | mVSS | Onset time
(years) |
|---|
| K1, N1, I1 | 25 | Female | 8 | 7 |
| K2, N2, I2 | 37 | Male | 10 | 9 |
| K3, N3, I3 | 26 | Female | 9 | 13 |
| K4, N4, I4 | 33 | Male | 11 | 10 |
Hematoxylin and eosin (H&E)
staining
H&E staining was performed on the tissue
samples. Following 10% formaldehyde (Thermo Fisher Scientific,
Inc.) fixation (12 h, 25°C), alcohol dehydration, xylene
transparency and paraffin embedding, the tissue was cut into thin
slices (5–8 µm in thickness). The slices were then blanched in hot
water, fixed to slides and dried at 45°C in an incubator. Before
staining, the paraffin wax was gradually removed using xylene.
Following another dehydration process, the slides were stained (3
min, 25°C) with H&E.
Expression levels of immune-associated
genes
The samples from Group 1 were used for
high-throughput sequencing. The Oncomine Immune Response Research
Assay kit (10) (Thermo Fisher
Scientific, Inc.; cat. no. A32881), was used according to the
manufacturer's protocol. TaqMan® Quantitation kit
(Thermo Fisher Scientific, Inc.; cat. No. 4468802) was used for
quantification and dilution of the sample to 100 pM. Agarose gel
electrophoresis was used to identify RNA integrity. Ion 520™ &
Ion 530™ kit (Thermo Fisher Scientific, Inc.; cat. no. A27751) was
used for sequencing. The nucleotide length was 100-200 bp and the
sequencing direction was non-specific. The data were analyzed by R
package (Version 3.6.1, rstudio.com/products/rstudio/download/)
(11). incipal component
analysis (PCA). The analysis of DEG profiles using R package
(version 3.4.3, R Foundation for Statistical Computing) and then
dimension reduction analysis was performed. PCA is one of the most
widely used data dimension reduction algorithms. PCA maps
N-dimensional features to K-dimensional features, which are new
orthogonal features, also known as principal components, and are
K-dimensional features reconstructed on the basis of the original
N-dimensional features. The aim of PCA is to identify a set of
mutually orthogonal coordinate axes sequentially from the original
space. The selection of new coordinate axes is closely related to
the data itself. This is equivalent to retaining only the dimension
features containing most of the variance, while ignoring the
feature dimensions containing almost 0 variance, so as to realize
the dimensionality reduction processing of data features. The DEGs
based on the I, K and N groups were analyzed.
Identification and functional
annotation of DEGs
DEGs were introduced into Kyoto Encyclopedia of
Genes and Genomes (KEGG) (12) and
enriched into the signaling pathway map. Significant DEGs in the
three datasets were defined as genes with P<0.05 and
log2 (fold change) >1.5 or <1.5. The R package was
used to create the volcano map. The Database for Annotation,
Visualization and Integrated Discovery (DAVID) (13) was used for functional and pathway
enrichment analysis of DEGs. KEGG is a database used to help
understand complex biological processes.
Determination of the hub genes
‘Multiple proteins’ option was selected to input
proteins. Then the ‘SEARCH’ option was selected to obtain the PPI
map. STRING (14) is a database
that can predict protein-protein interactions (PPIs). It has
powerful protein performance retrieval functions and is usually
used for proteomics research, research into the molecular
mechanisms of disease and the discovery of new drug targets.
Cytoscape software (version 3.5.1) was initially used to establish
a PPI network (15). MCODE
(16) (version 3.5.1) and
Cytohubba (version 3.5.1) was then used to further identify modules
(17,18). A hub gene is a gene that plays a
crucial role in biological processes. In related pathways, the
regulation of other genes is often affected by this gene (19). Therefore, a hub gene is often an
important target and research hotspot. Subsequently, the hub genes
were screened according to the network topology.
Reverse transcription-quantitative PCR
(RT-qPCR)
Tissue samples from the I, K and N groups (n=4 in
each group) were used for RT-qPCR validation in three independent
experimental repeats. The primers used in this study are revealed
in Table III. Each tissue sample
(200 mg) was placed into a 1.5-ml Eppendorf tube, and 1 ml
TRIzol® (Invitrogen; Thermo Fisher Scientific, Inc.) was
added to the tube. After blending vigorously for 30 sec, 0.2 ml
chloroform was added, and the tube was shaken vigorously for 30
sec. The samples were incubated at room temperature for 3 min, then
centrifuged at 12,000 × g at 4°C for 15 min. In total, ~0.5 ml of
the colorless, upper aqueous phase was transferred into a fresh
Eppendorf tube. An equal volume of isopropanol was added, and the
samples were incubated at −20°C for 30 min. The samples were then
centrifuged at 12,000 × g at 4°C for 10 min. Traces of precipitated
RNA could be observed at the bottom of the tube. A volume of 1 ml
75% ethanol was added, and the tubes were shaken. The samples were
then centrifuged at 7,500 × g at 4°C for 10 min. The supernatant
was discarded. The residual liquid was carefully absorbed using
filter paper, and the tube was then dried at room temperature for
5-10 min. The precipitate was dissolved in 20 µl DEPC-treated water
(Thermo Fisher Scientific, Inc.). The concentration and purity of
RNA were then measured, and each sample was then stored at −70°C.
The following steps were completed according to the instructions of
the HiScript® II One Step RT-PCR kit (Vazyme Biotech
Co., Ltd.): 50°C for 30 min; 94°C for 3 min; 94°C for 10 sec, 55°C
for 1 min, 35 cycles; 72°C for 5 min, 4°C hold. The fluorophore was
SYBR Green kit (Vazyme Biotech Co., Ltd.). The expression levels of
the target genes were then obtained using 2−ΔΔCq method
(20).
| Table III.Primers and their sequences for PCR
analysis. |
Table III.
Primers and their sequences for PCR
analysis.
| Primer | Sequence
(5′-3′) |
|---|
| GAPDH-F |
GGAAGCTTGTCATCAATGGAAATC |
| GAPDH-R |
TGATGACCCTTTTGGCTCCC |
| CCR1-F |
GACTATGACACGACCACAGAGT |
| CCR1-R |
CCAACCAGGCCAATGACAAATA |
| CCR7-F |
TGAGGTCACGGACGATTACAT |
| CCR7-R |
GTAGGCCCACGAAACAAATGAT |
| CD40LG-F |
ACATACAACCAAACTTCTCCCCG |
| CD40LG-R |
GCAAAAAGTGCTGACCCAATCA |
| CD86-F |
CTGCTCATCTATACACGGTTACC |
| CD86-R |
GGAAACGTCGTACAGTTCTGTG |
| CXCL9-F |
CCAGTAGTGAGAAAGGGTCGC |
| CXCL9-R |
AGGGCTTGGGGCAAATTGTT |
| IL-6-F |
GCAATAACCACCCCTGACCCA |
| IL-6-R |
CAGAAGAAGGAATGCCCATTAACAA |
| IL-10-F |
GACTTTAAGGGTTACCTGGGTTG |
| IL-10-R |
TCACATGCGCCTTGATGTCTG |
| MMP2-F |
TACAGGATCATTGGCTACACACC |
| MMP2-R |
GGTCACATCGCTCCAGACT |
| IL-13-F |
CCTCATGGCGCTTTTGTTGAC |
| IL-13-R |
TCTGGTTCTGGGTGATGTTGA |
Western blot analysis
Tissue samples from the patients in group 2 were
then extracted. The tissue blocks were washed 2-3 times with
pre-cooled PBS, and lysis buffer (Beijing Solarbio Science &
Technology Co., Ltd.) was added to isolate the total protein.
Protein samples (50–100 µg/lane) were resolved using SDS-PAGE on
10% gels, and then transferred to PVDF membranes. Subsequently, the
membranes were blocked with 5% skimmed milk for 1 h (room
temperature). The primary antibody [anti-C-C motif chemokine
receptor 7 (CCR7) polyclonal antibody; 1:600; cat. no. 25898-1-AP;
or anti-GAPDH (1:20,000; cat. no. 10494-1-AP)] was applied
dropwise, and the samples were incubated overnight at 4°C.
HRP-conjugated Affinipure Goat Anti-Rabbit IgG (H + L) secondary
antibody (1:2,500; cat. no. SA00001-2) was then added for 2 h at
room temperature. All the antibodies were from ProteinTech Group,
Inc. GAPDH was used as the internal reference protein. ImageJ
software (National Institutes of Health, version 1.8.0) was used to
analyze the gray values of the protein bands, which were normalized
to GAPDH.
Statistical analysis
The statistical analysis was carried out using SPSS
software version 22.0 (IBM Corp.). The unpaired t-test was used to
compare the differences between two groups. One-way ANOVA was used
to compare the differences between three groups. Following ANOVA,
Bonferroni's correction was used to reduce the uncertainty of the
results obtained. P-values were considered to be statistically
significant at a Bonferroni corrected P<0.017. P<0.017 was
considered to indicate a statistically significant difference.
Results
Histology of healthy, inflamed and
keloid tissue from patients with keloids
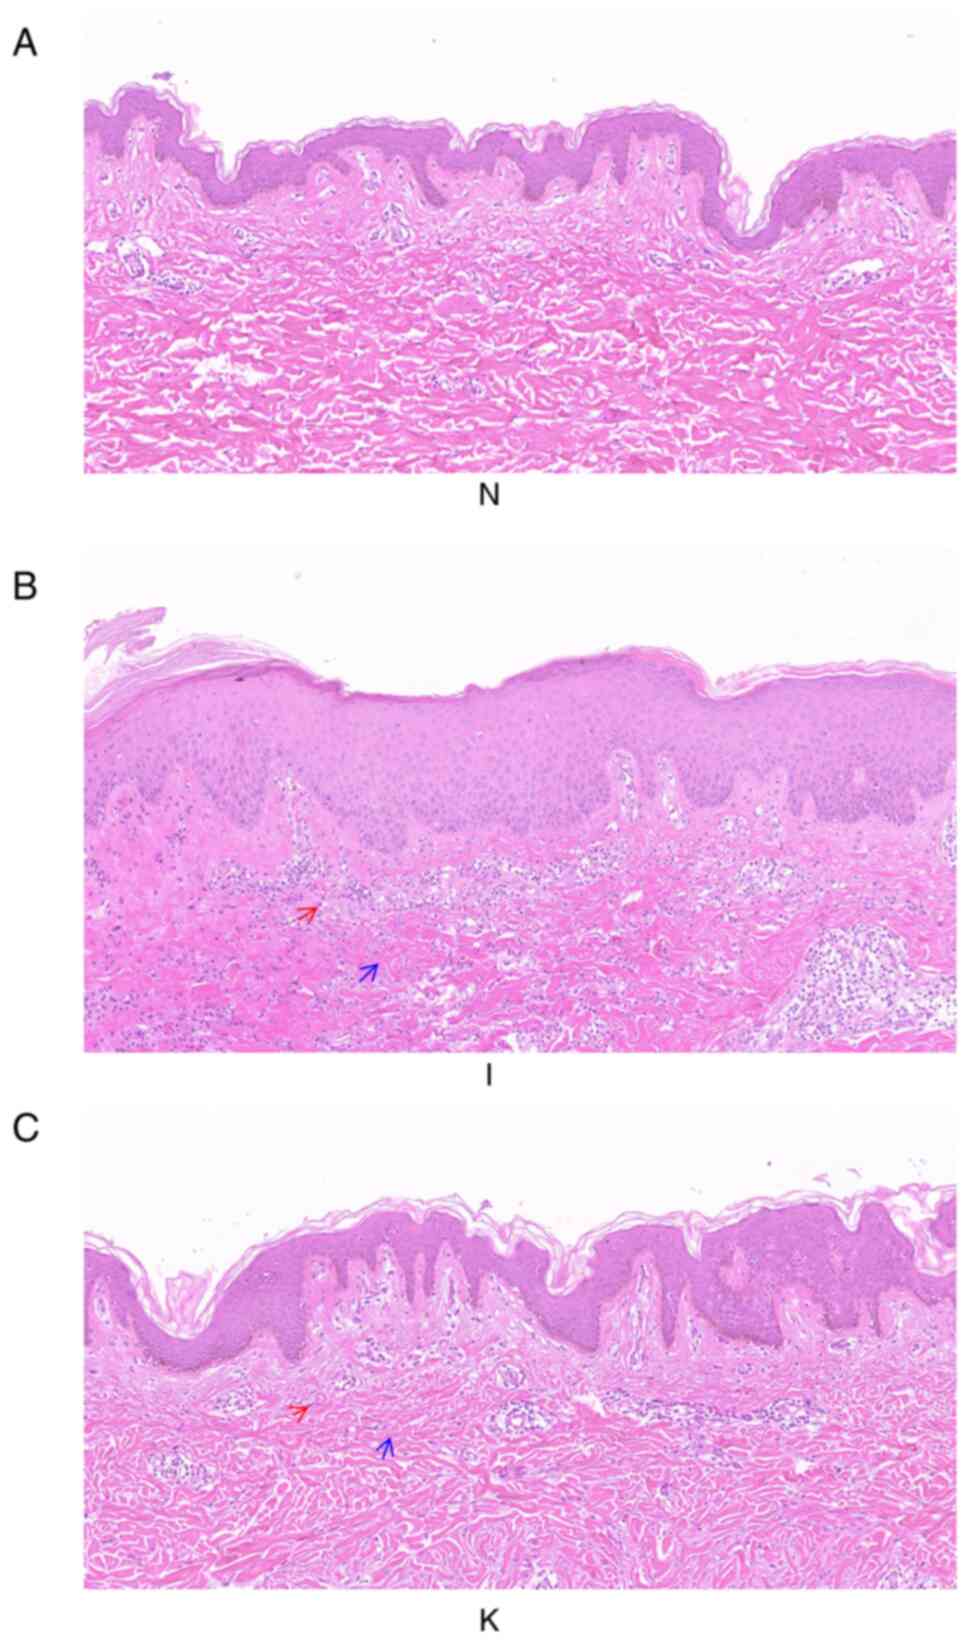
H&E staining of healthy, inflamed and keloid
tissue was analyzed to determine the tissue characteristics and any
morphological differences between the groups (Fig. 1). The three groups of samples were
not consistent in morphology, representing the morphological
changes of the disease from normal skin to inflammatory tissue, and
finally keloid formation. The epidermis of healthy skin tissue was
thinner, while the dermis of healthy skin tissue around the keloid
mass was relatively loose, with irregular collagenous bundles and
fewer cells. The skin capillaries were scattered throughout the
fibrous tissue (Fig. 1A). In the
inflamed tissue, the epidermal layer was thicker, and the number of
inflammatory cells increased considerably. The collagen in the
dermis was disordered and dense. Scattered blood vessels were
visible in the fibrous tissue and appeared dilated and congested
(Fig. 1B). In keloid tissue, there
were clear abnormalities and heterogeneity in the epidermal layer.
The peripheral epidermal layer was subdivided, branch-like and
visibly penetrated into the dermis, forming a deep canine
tooth-like appearance, while the central epidermal layer was thick
and flat. Collagen fibers in the superficial layer of keloids were
small and parallel to the epidermis. The deep layer of the keloid
was characterized by a dense extracellular matrix and disordered
collagen fibers. Microvascular congestion and dilatation were not
visible, although the number of blood vessels was greater than that
in healthy tissue. There were also fewer inflammatory cells than in
inflammatory tissue (Fig. 1C).
Data quality evaluation
PCA was used to verify the repeatability of the data
within the groups. This analysis demonstrated that the data in
groups I and N were repeatable (Fig.
2A). PCA also suggested that the distance between the samples
in the same group was very small and the that distance between
samples in different groups was relatively large in the PC1
dimension (Fig. 2B). There were
partial data intersections between the N and the K groups (Fig. 2C). Through dimension reduction
analysis, the three groups of data were grouped clearly, and
further gene expression analysis was carried out.
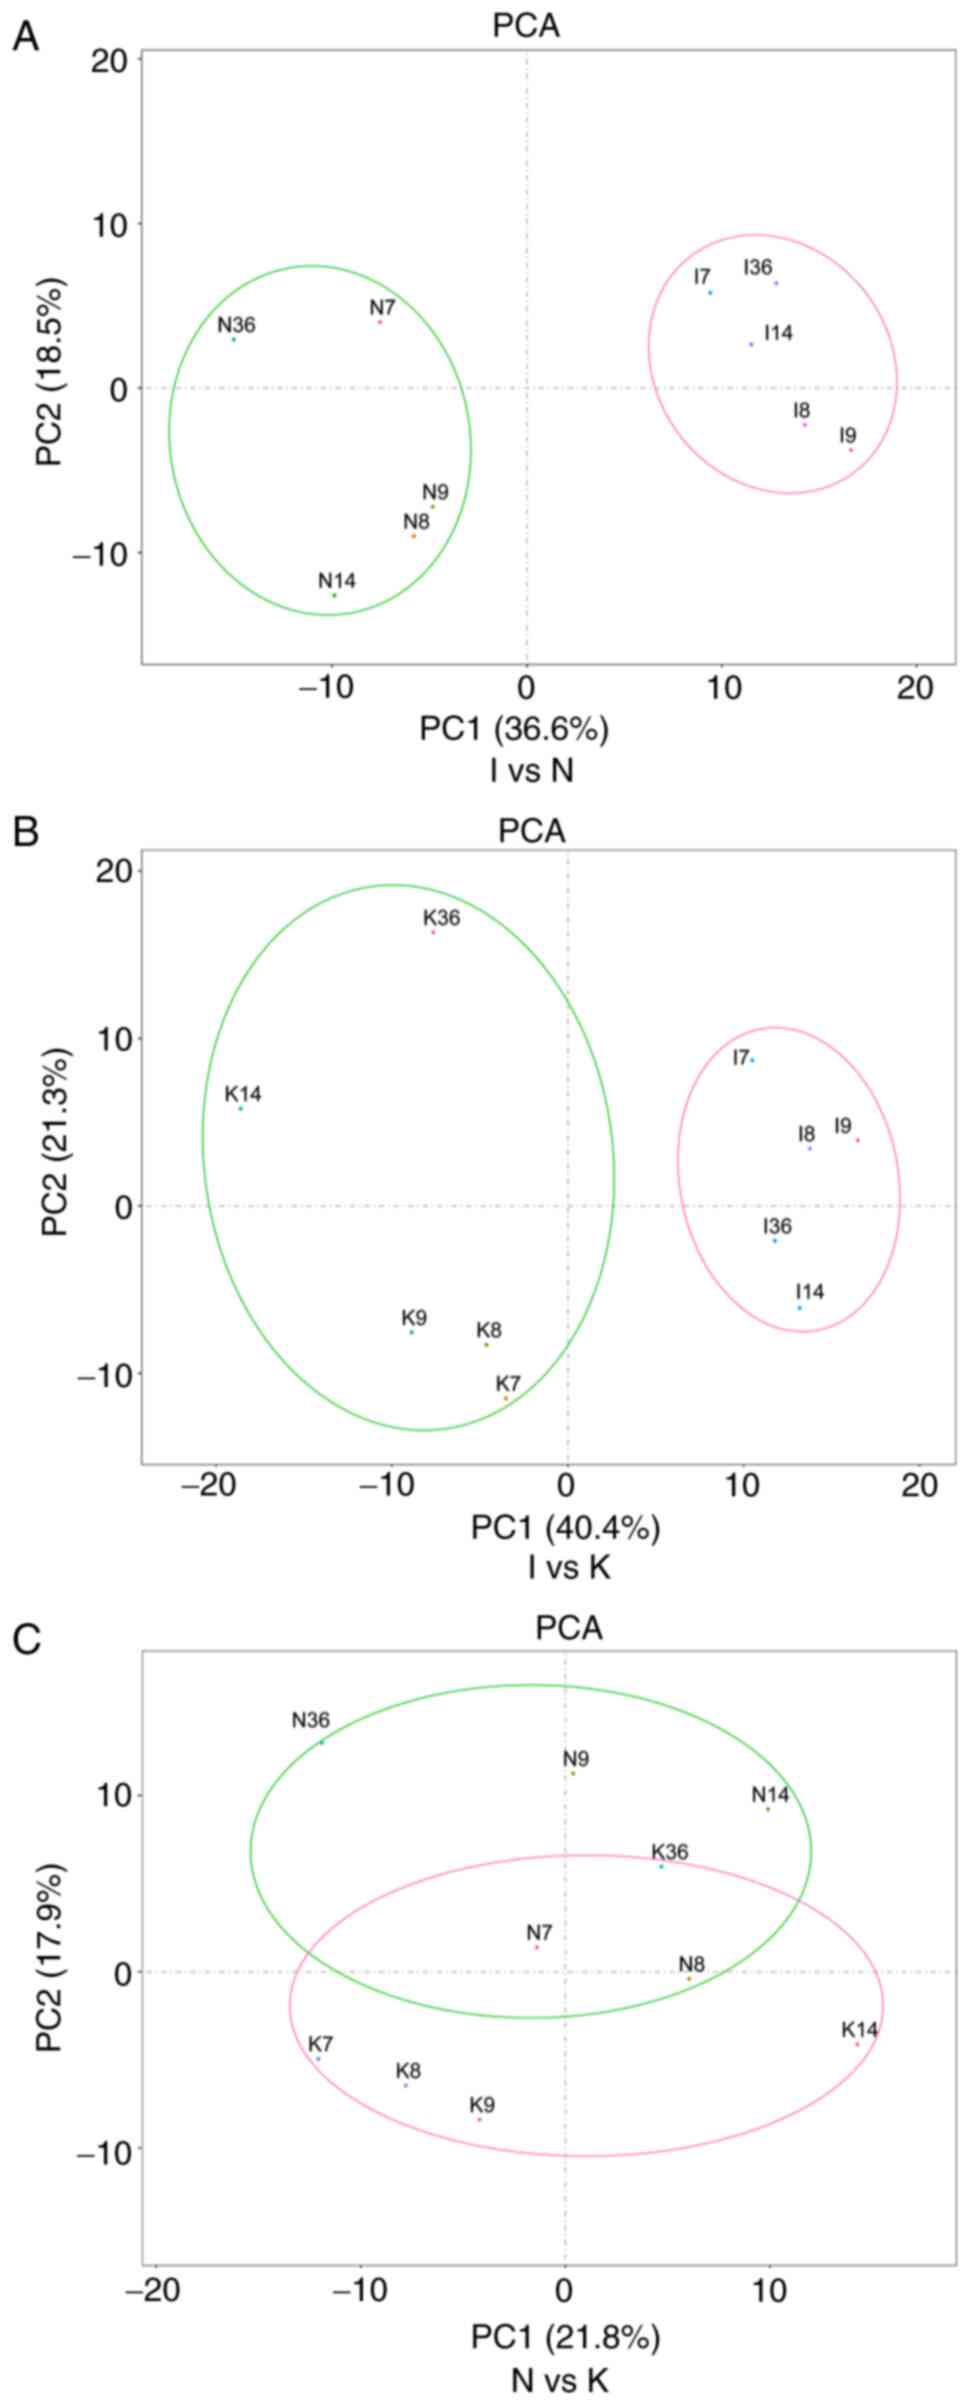 | Figure 2.PCA is one of the most widely used
data dimension reduction algorithms. By calculating the covariance
matrix of the data matrix, the eigenvalue eigenvector of the
covariance matrix is obtained, and the matrix composed of the
corresponding eigenvectors of k features with the largest
eigenvalue (i.e., the largest variance) is selected. In this way,
the data matrix can be transformed into the new space and the
dimension reduction of data features can be realized. (A) PCA of
samples between groups I and N. In the figure, principal component
1 (PC1) and principal component 2 (PC2) are used as the X-axis and
Y-axis, respectively, to draw the scatter diagram, where each point
represents a sample. In such a PCA diagram, the farther the two
samples are from each other, the greater the difference is between
the two samples in terms of gene expression patterns. (B) PCA of
groups I and K. (C) PCA of groups N and K. PCA, principal component
analysis. |
Identification of DEGs among the three
groups
To identify differences in tumor gene expression
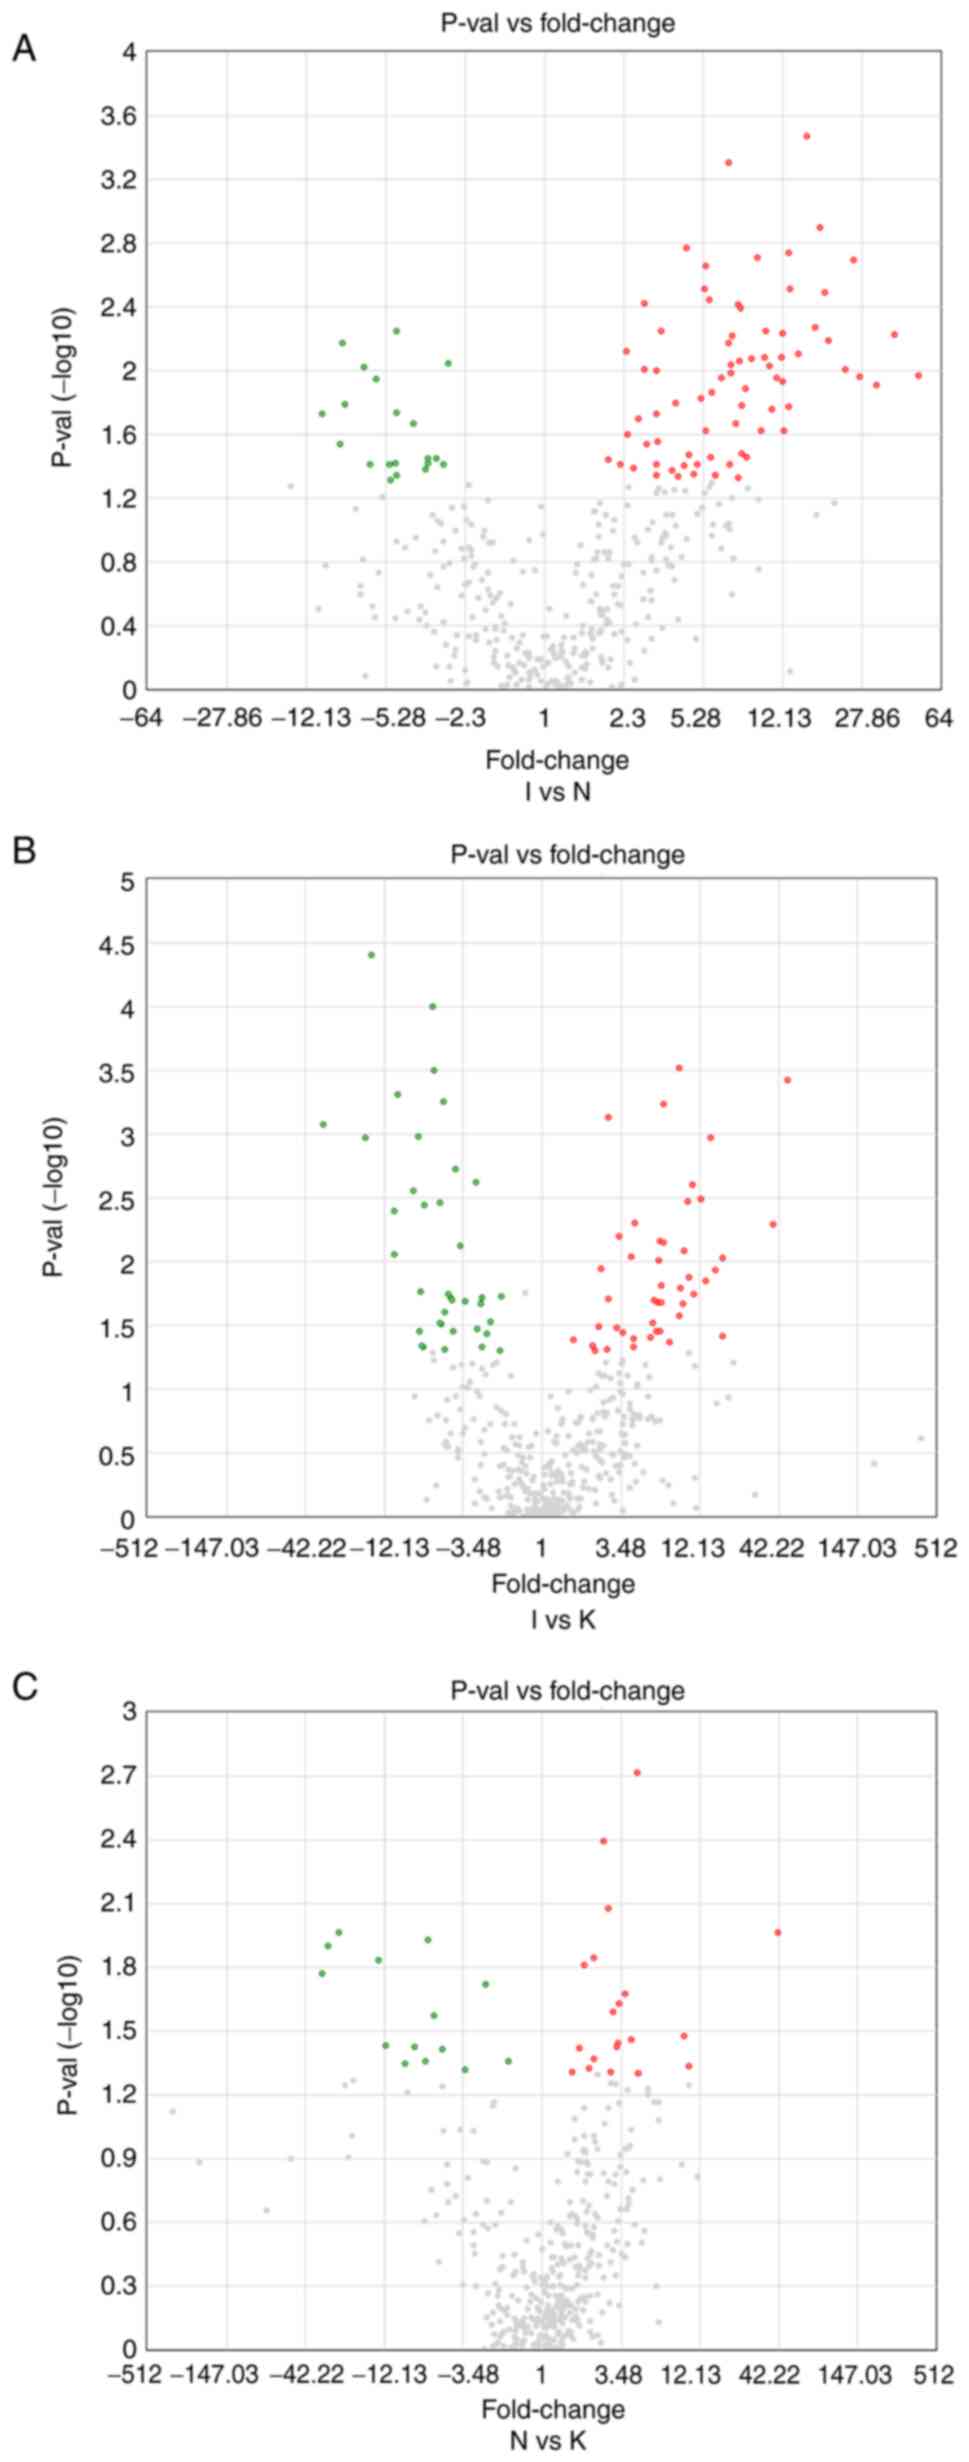
between the N, I and K groups, volcano maps were created (Fig. 3). There were 74 upregulated DEGs in
the I group compared with the N group, and 20 downregulated
(Fig. 3A). In addition, 45 DEGs
were upregulated in the I group compared with the K group, whereas
37 DEGs were downregulated (Fig.
3B). There were 20 upregulated and 14 downregulated DEGs in the
N group compared with the K group (Fig. 3C). Identification of DEGs among the
three groups was used to further identify hub genes. There were
several different hub genes in group I compared with group K and
group N, which may also indicate that tissue inflammation is an
important pathological stage in keloid formation.
Analysis of the PPI network and hub
genes
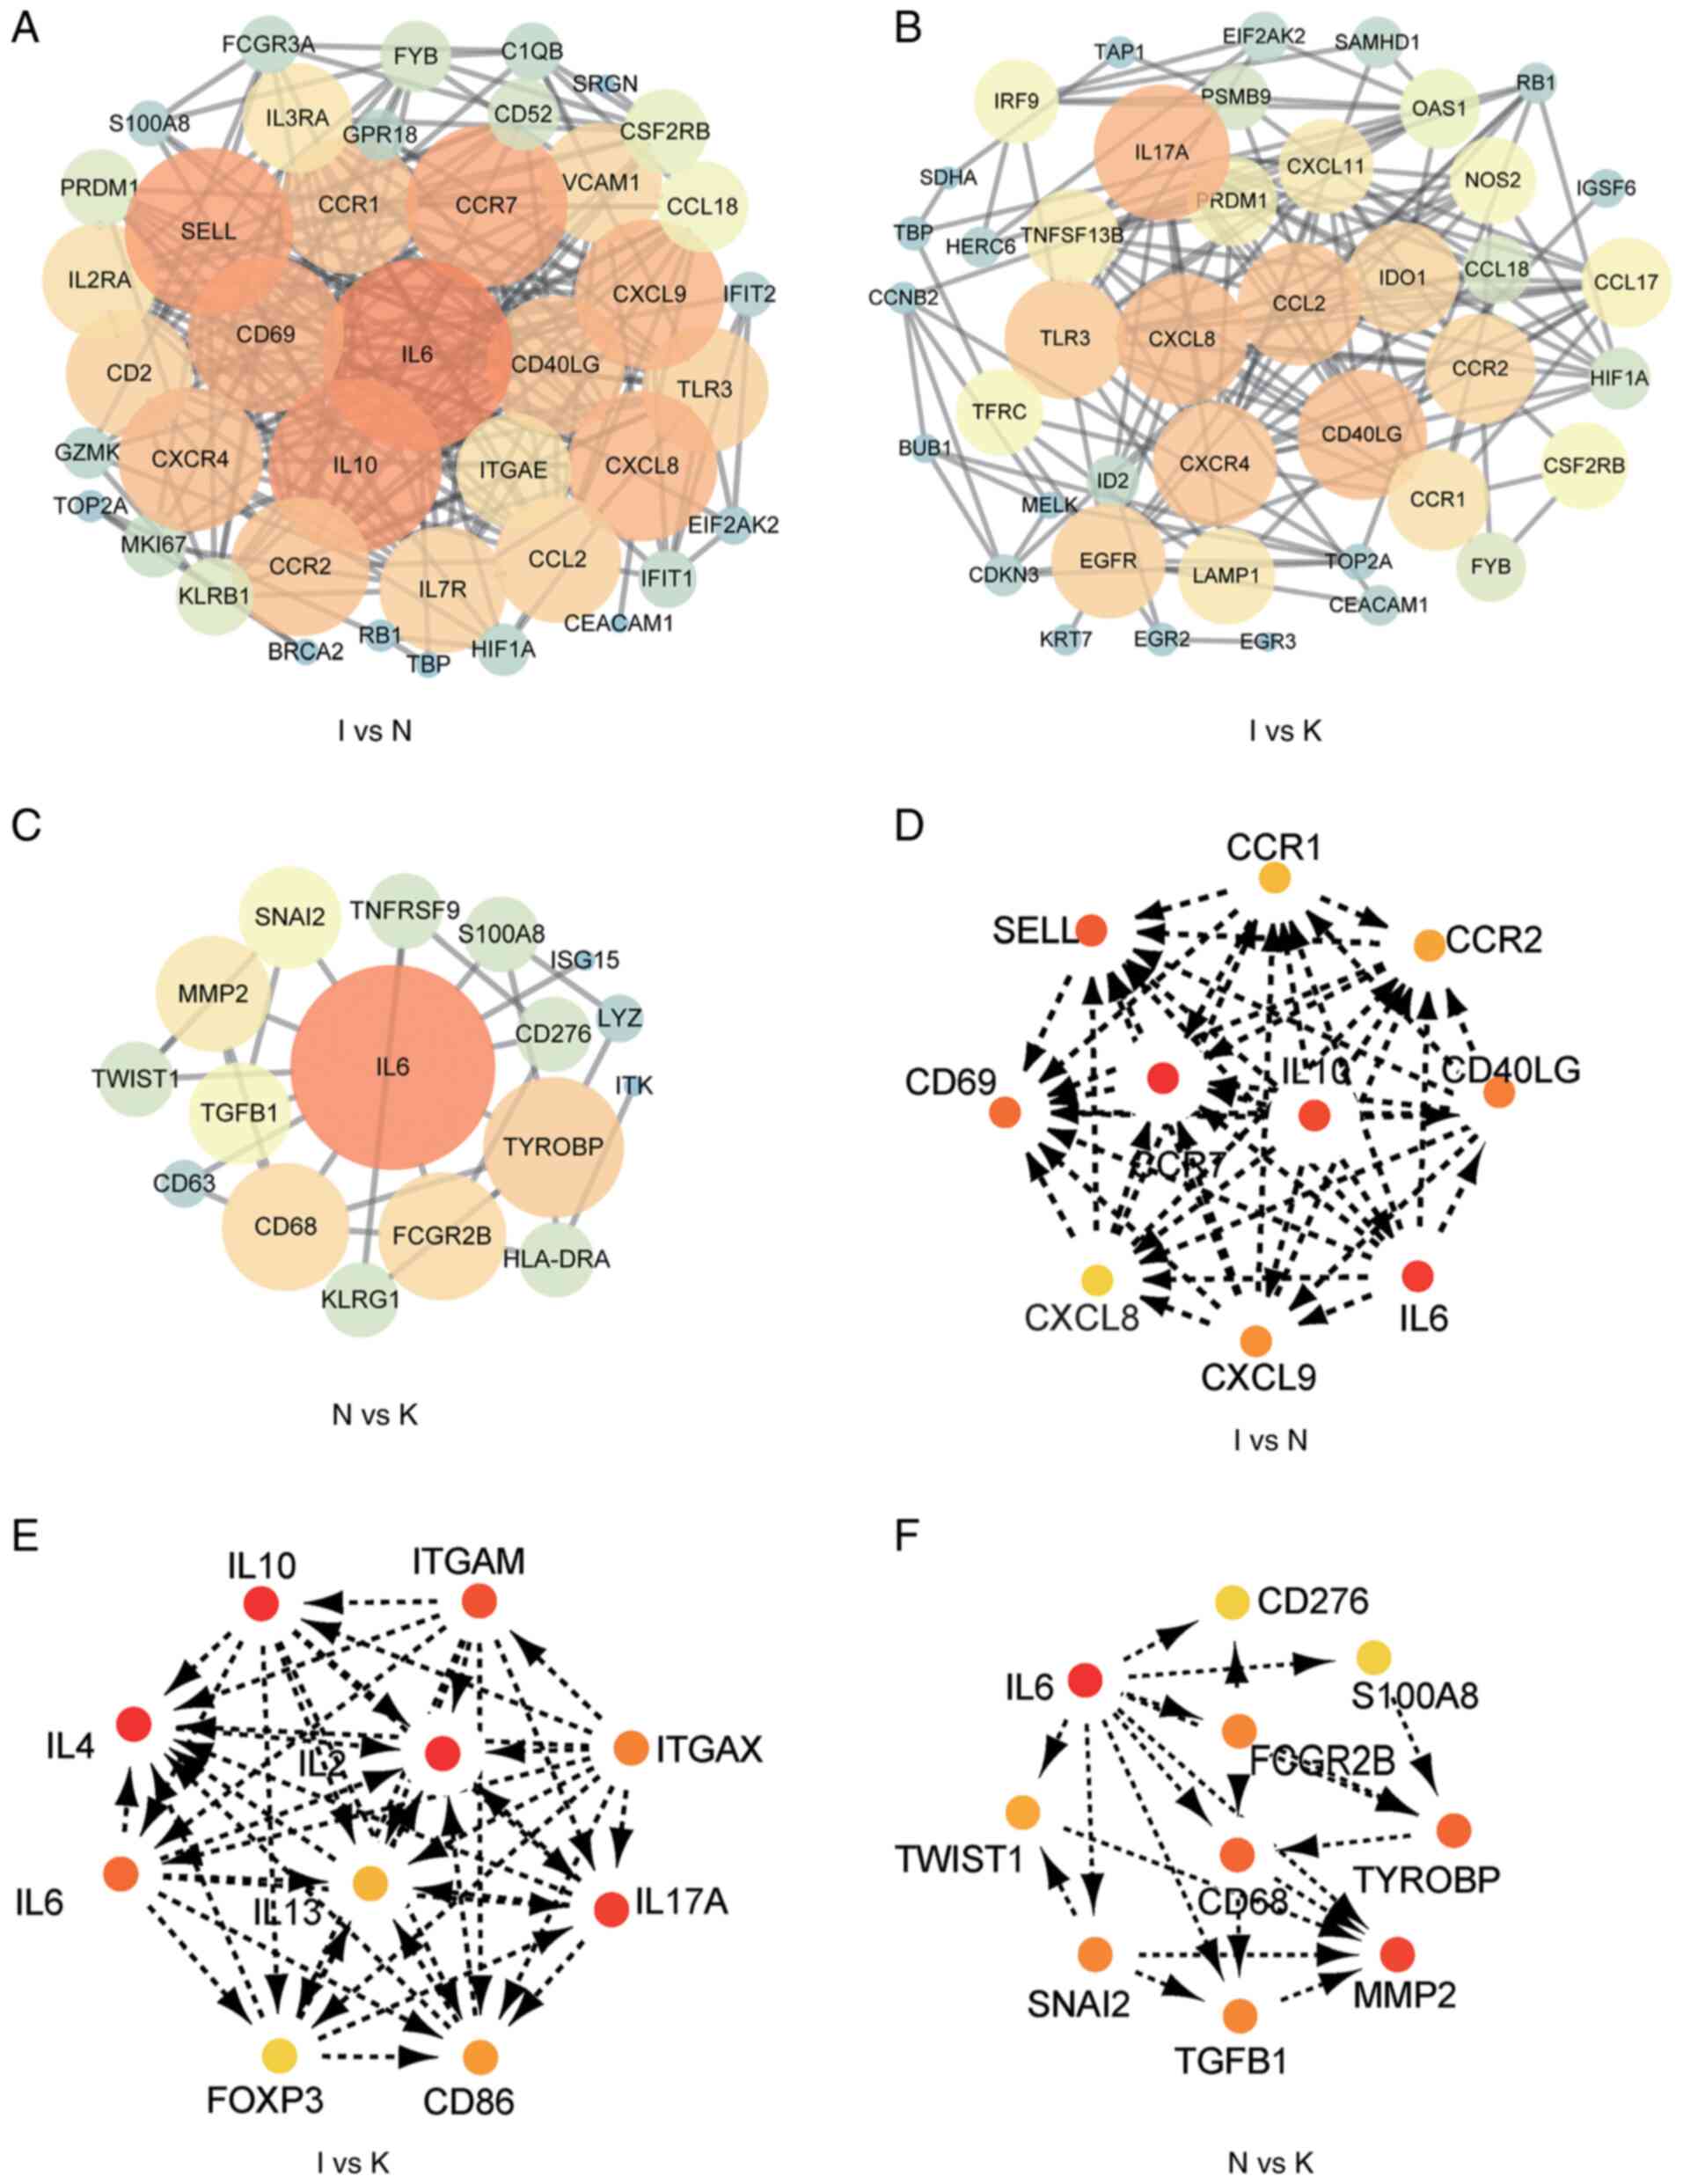
A PPI network of the DEGs was constructed (Fig. 4A-C), and the most significant
modules (Fig. S2) and networks of
hub genes (Fig. 4D-F) were
identified using Cytoscape software. MCODE and Cytohubba are two
algorithms that screen for potential hub genes. The most commonly
used algorithm is Cytohubba, and thus our subsequent validation was
based on this. A total of 10 genes were identified as hub genes
with a degree of ≥10. In order to provide more original data, the
promising hub genes obtained by bioinformatics algorithm analysis
listed in Table IV require
further PCR validation. The hub genes in the I and the N group
included CCR1, CCR2, SELL, IL10, CCR7, CD40LG, CD69, CXCL8, IL-6
and CXCL9 (Fig. 4D; Table IV). All 10 hub genes were
upregulated. The hub genes in the I and the K group included IL-10,
ITGAM, ITGAX, IL-2, IL-4, IL-6, IL-13, IL-17A, FOXP3 and CD86
(Fig. 4E; Table V). Of these, three were
downregulated, including ITGAM, ITGAX and FOXP3. The other seven
genes were upregulated. Hub genes in the N and the K group included
CD276, IL-6, S100A8, FCGR2B, TWIST1, CD68, TYROBP, MMP2, SNAI2 and
TGFB1 (Fig. 4F; Table VI). These 10 hub genes were
upregulated. MCODE detected densely connected regions of large PPI
networks that may represent molecular complexes (Fig. S1). These hub genes predicted using
bioinformatics may be important in keloid formation.
| Table IV.Differentially expressed genes
between group I and group N. |
Table IV.
Differentially expressed genes
between group I and group N.
| Gene symbol | Fold change | P-value | FDR P-value |
|---|
| CCR1 | 6.91 | 0.0005 | 0.0992 |
| SELL | 27.07 | 0.0109 | 0.1023 |
| CCR2 | 10.06 | 0.0083 | 0.1023 |
| CD69 | 50.44 | 0.0108 | 0.1023 |
| CCR7 | 8.33 | 0.0352 | 0.1858 |
| IL10 | 6.34 | 0.011 | 0.1023 |
| CD40LG | 25.48 | 0.002 | 0.1023 |
| CXCL8 | 15.68 | 0.0003 | 0.0992 |
| IL6 | 18.85 | 0.0032 | 0.1023 |
| CXCL9 | 9.34 | 0.0019 | 0.1023 |
| Table V.Differentially expressed genes
between group I and group K. |
Table V.
Differentially expressed genes
between group I and group K.
| Gene symbol | Fold change | P-value | FDR P-value |
|---|
| IL10 | 3.5 | 0.0632 | 0.2704 |
| ITGAM | −1.95 | 0.4047 | 0.6442 |
| IL4 | 1.03 | 0.4634 | 0.6933 |
| IL2 | 3.42 | 0.3898 | 0.6351 |
| ITGAX | −1.43 | 0.2395 | 0.5070 |
| IL6 | 4.15 | 0.1936 | 0.4479 |
| IL13 | 1.4 | 0.6538 | 0.8268 |
| IL17A | 3.55 | 0.0361 | 0.2111 |
| FOXP3 | −5.51 | 0.0598 | 0.2704 |
| CD86 | 4.52 | 0.0914 | 0.3307 |
| Table VI.Differentially expressed genes
between group N and group K. |
Table VI.
Differentially expressed genes
between group N and group K.
| Gene symbol | Fold change | P-value | FDR P-value |
|---|
| CD276 | 4.11 | 0.0347 | 0.5422 |
| IL6 | 4.54 | 0.0497 | 0.5422 |
| S100A8 | 9.49 | 0.0333 | 0.5422 |
| FCGR2B | 3.29 | 0.0363 | 0.5422 |
| TWIST1 | 2.65 | 0.004 | 0.5422 |
| CD68 | 2.25 | 0.0144 | 0.5422 |
| TYROBP | 3.22 | 0.0375 | 0.5422 |
| SNAI2 | 3.68 | 0.0212 | 0.5422 |
| MMP2 | 4.5 | 0.05 | 0.5422 |
| TGFB1 | 4.47 | 0.0019 | 0.5422 |
Functional annotation of DEGs using
Gene Ontology (GO) and KEGG analyses
Cutoff values of log2 fold change >1.5
or <-1.5 and P<0.05 were used as the screening criteria for
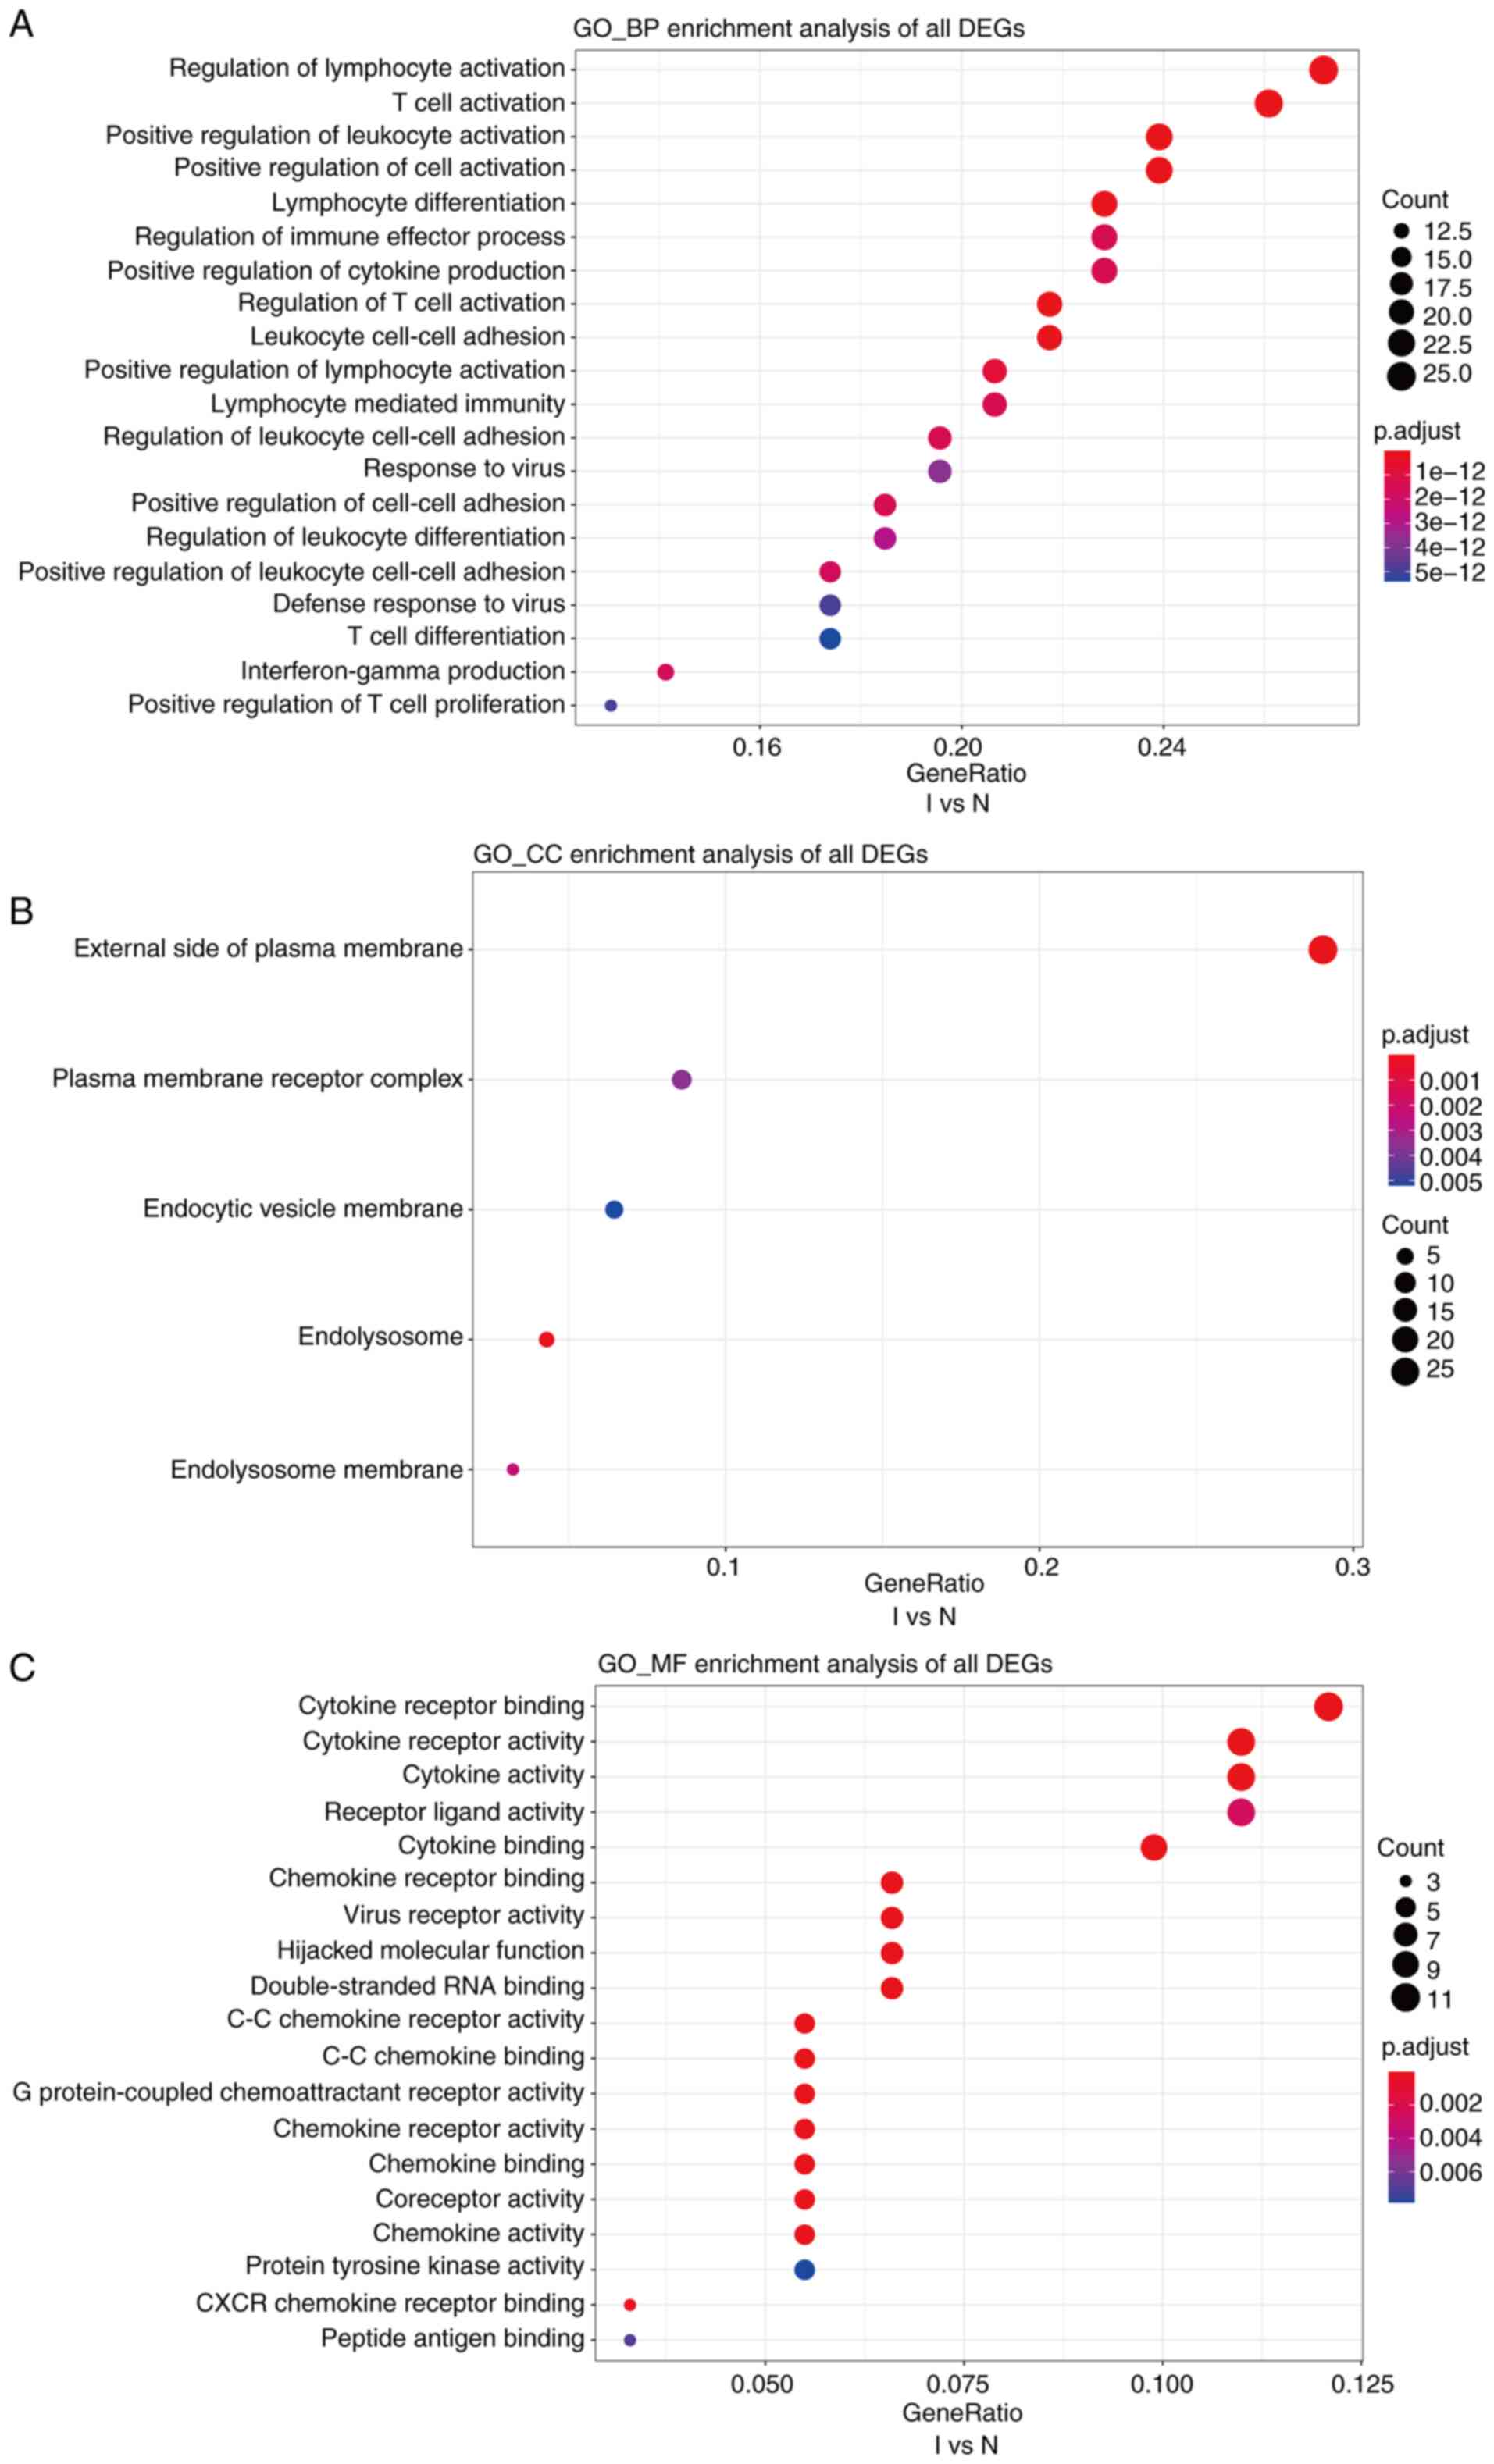
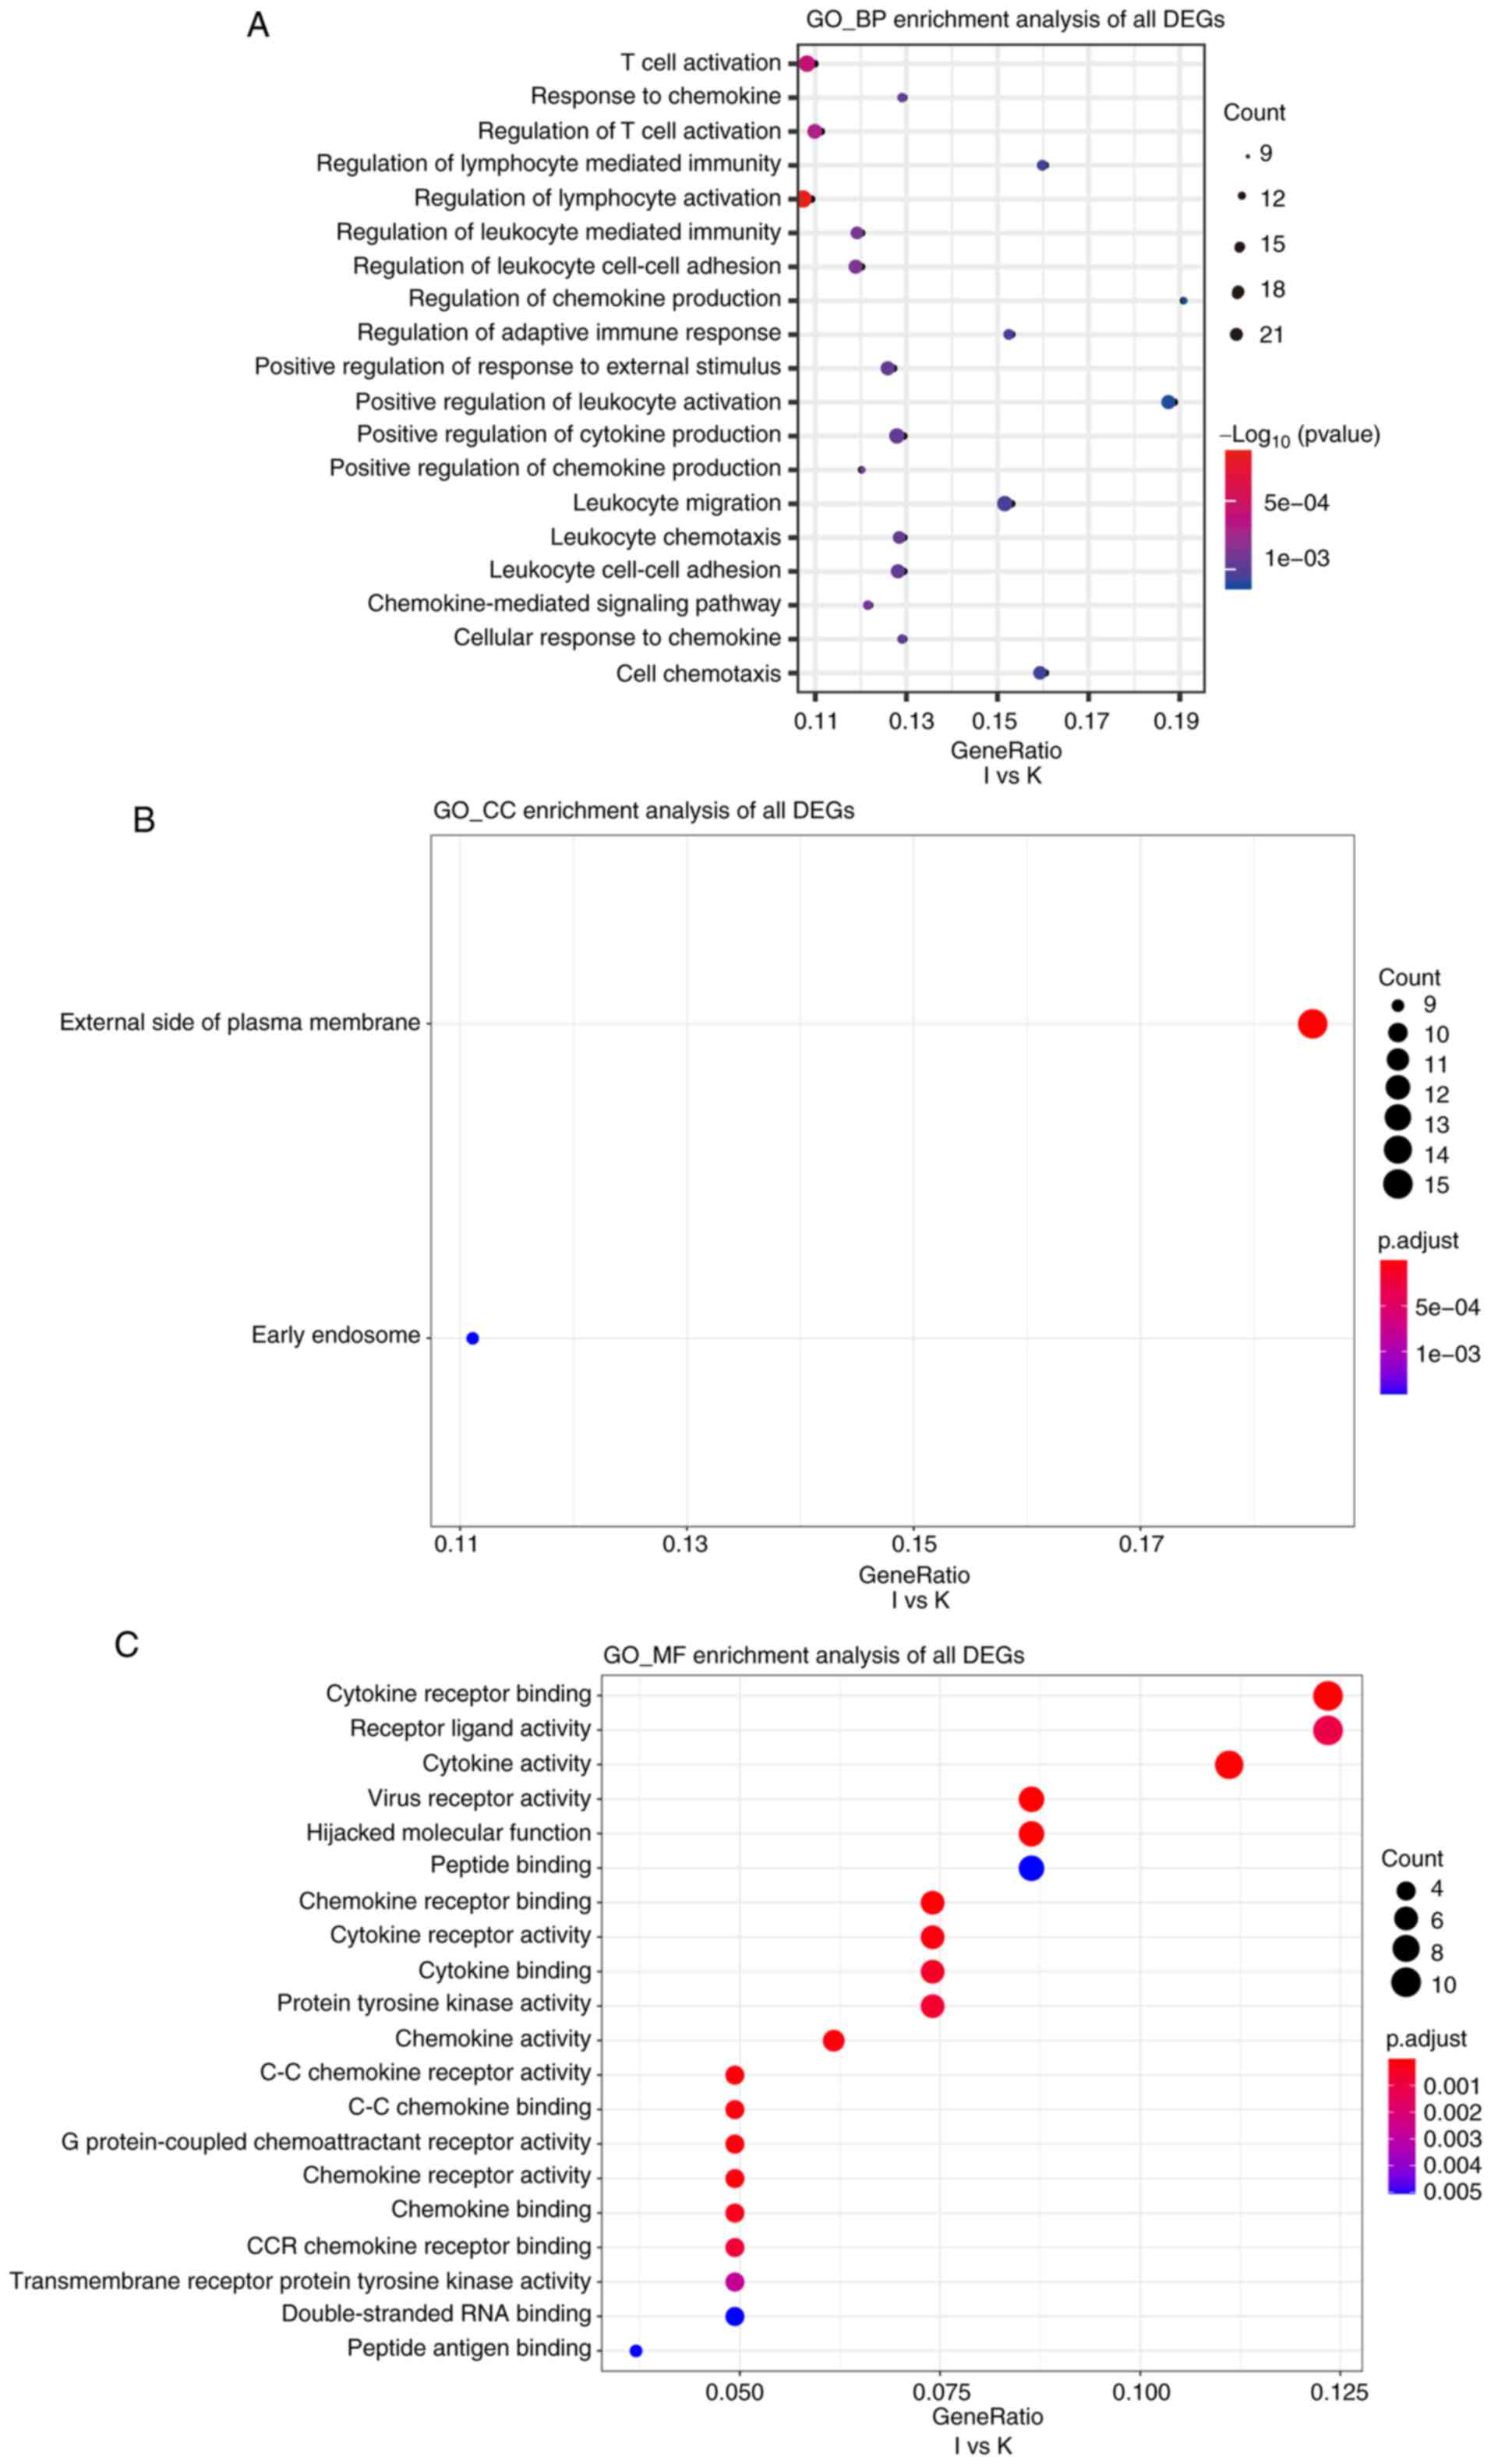
GO and KEGG analyses. GO analysis revealed that, compared with the
N group, the I group was enriched in DEGs associated with
biological process terms (BPs), such as ‘regulation of lymphocyte
activation’ and ‘T-cell activation’ (Fig. 5A). There was also enrichment for
DEGs associated with cell components (CCs) including ‘external side
of the plasma membrane’ and ‘plasma membrane receptor complex’
(Fig. 5B). Molecular function (MF)
terms were markedly enriched in ‘cytokine receptor binding and
cytokine receptor activity’ (Fig.
5C). In addition, compared with the K group, BPs in the I group
included ‘T-cell activation’ and ‘response to chemokine’ (Fig. 6A). This group was also enriched in
DEGs associated with the ‘external side of the plasma membrane’ and
‘early endosome’ CCs (Fig. 6B).
MFs were markedly enriched in ‘cytokine receptor binding’ and
‘receptor ligand activity’ (Fig.
6C). Several BP enrichments were also observed in the N
compared with the K group, including ‘regulation of lymphocyte
activation’ and ‘leukocyte cell-cell adhesion’ (Fig. S3A). CCs were also markedly
enriched in ‘secretory granule membrane’ and ‘late endosome’
(Fig. S3B). There was no MF
enrichment in the N compared with the K group.
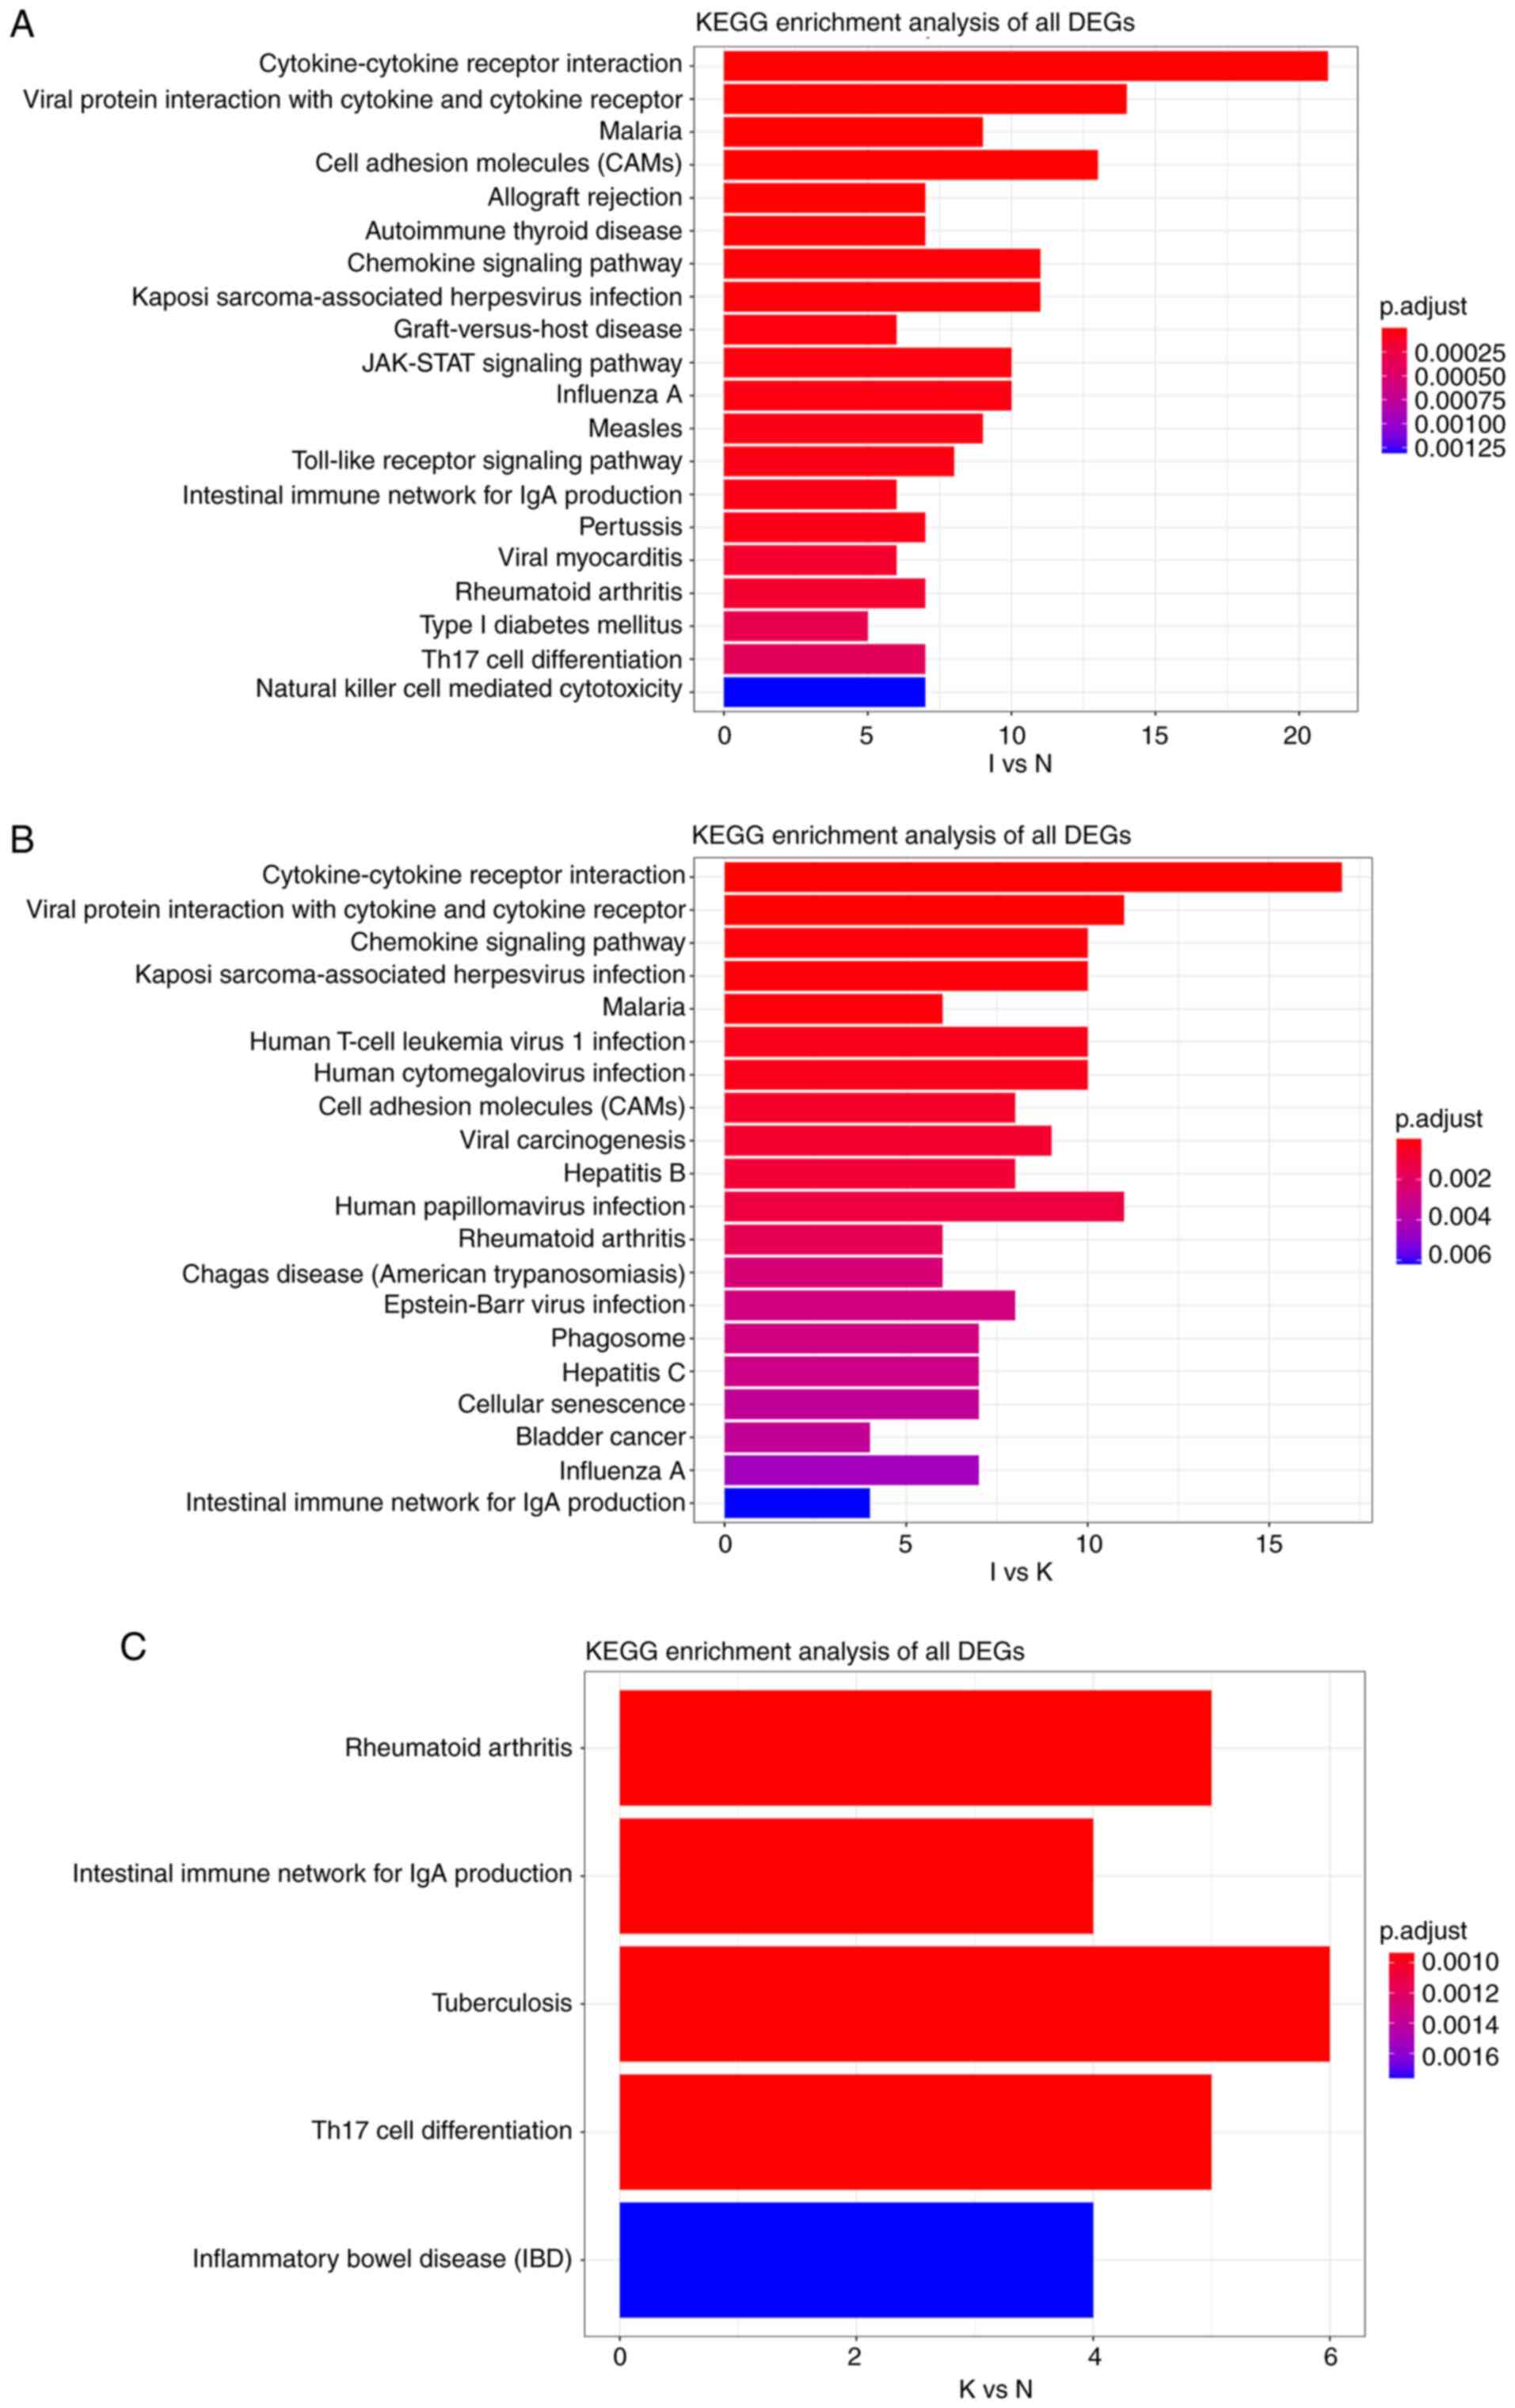
KEGG pathway analysis between groups I and N
revealed that all DEGs were primarily enriched in
‘cytokine-cytokine receptor interaction’ and ‘viral protein
interaction with cytokine and cytokine receptor’ (Fig. 7A). A similar result was obtained
for the I and K groups (Fig. 7B).
KEGG pathway analysis in the N and K groups indicated that all the
DEGs were primarily enriched in ‘rheumatoid arthritis’ and
‘intestinal immune network for IgA production’ (Fig. 7C). In general, these enrichments
were associated with immune activation, suggesting that changes in
gene expression during the inflammatory phase may affect the course
and severity of disease. The functional annotations obtained based
on different algorithms are roughly the same, because GO and
predictions of KEGG are based on screened genes.
Experimental validation of hub gene
expression
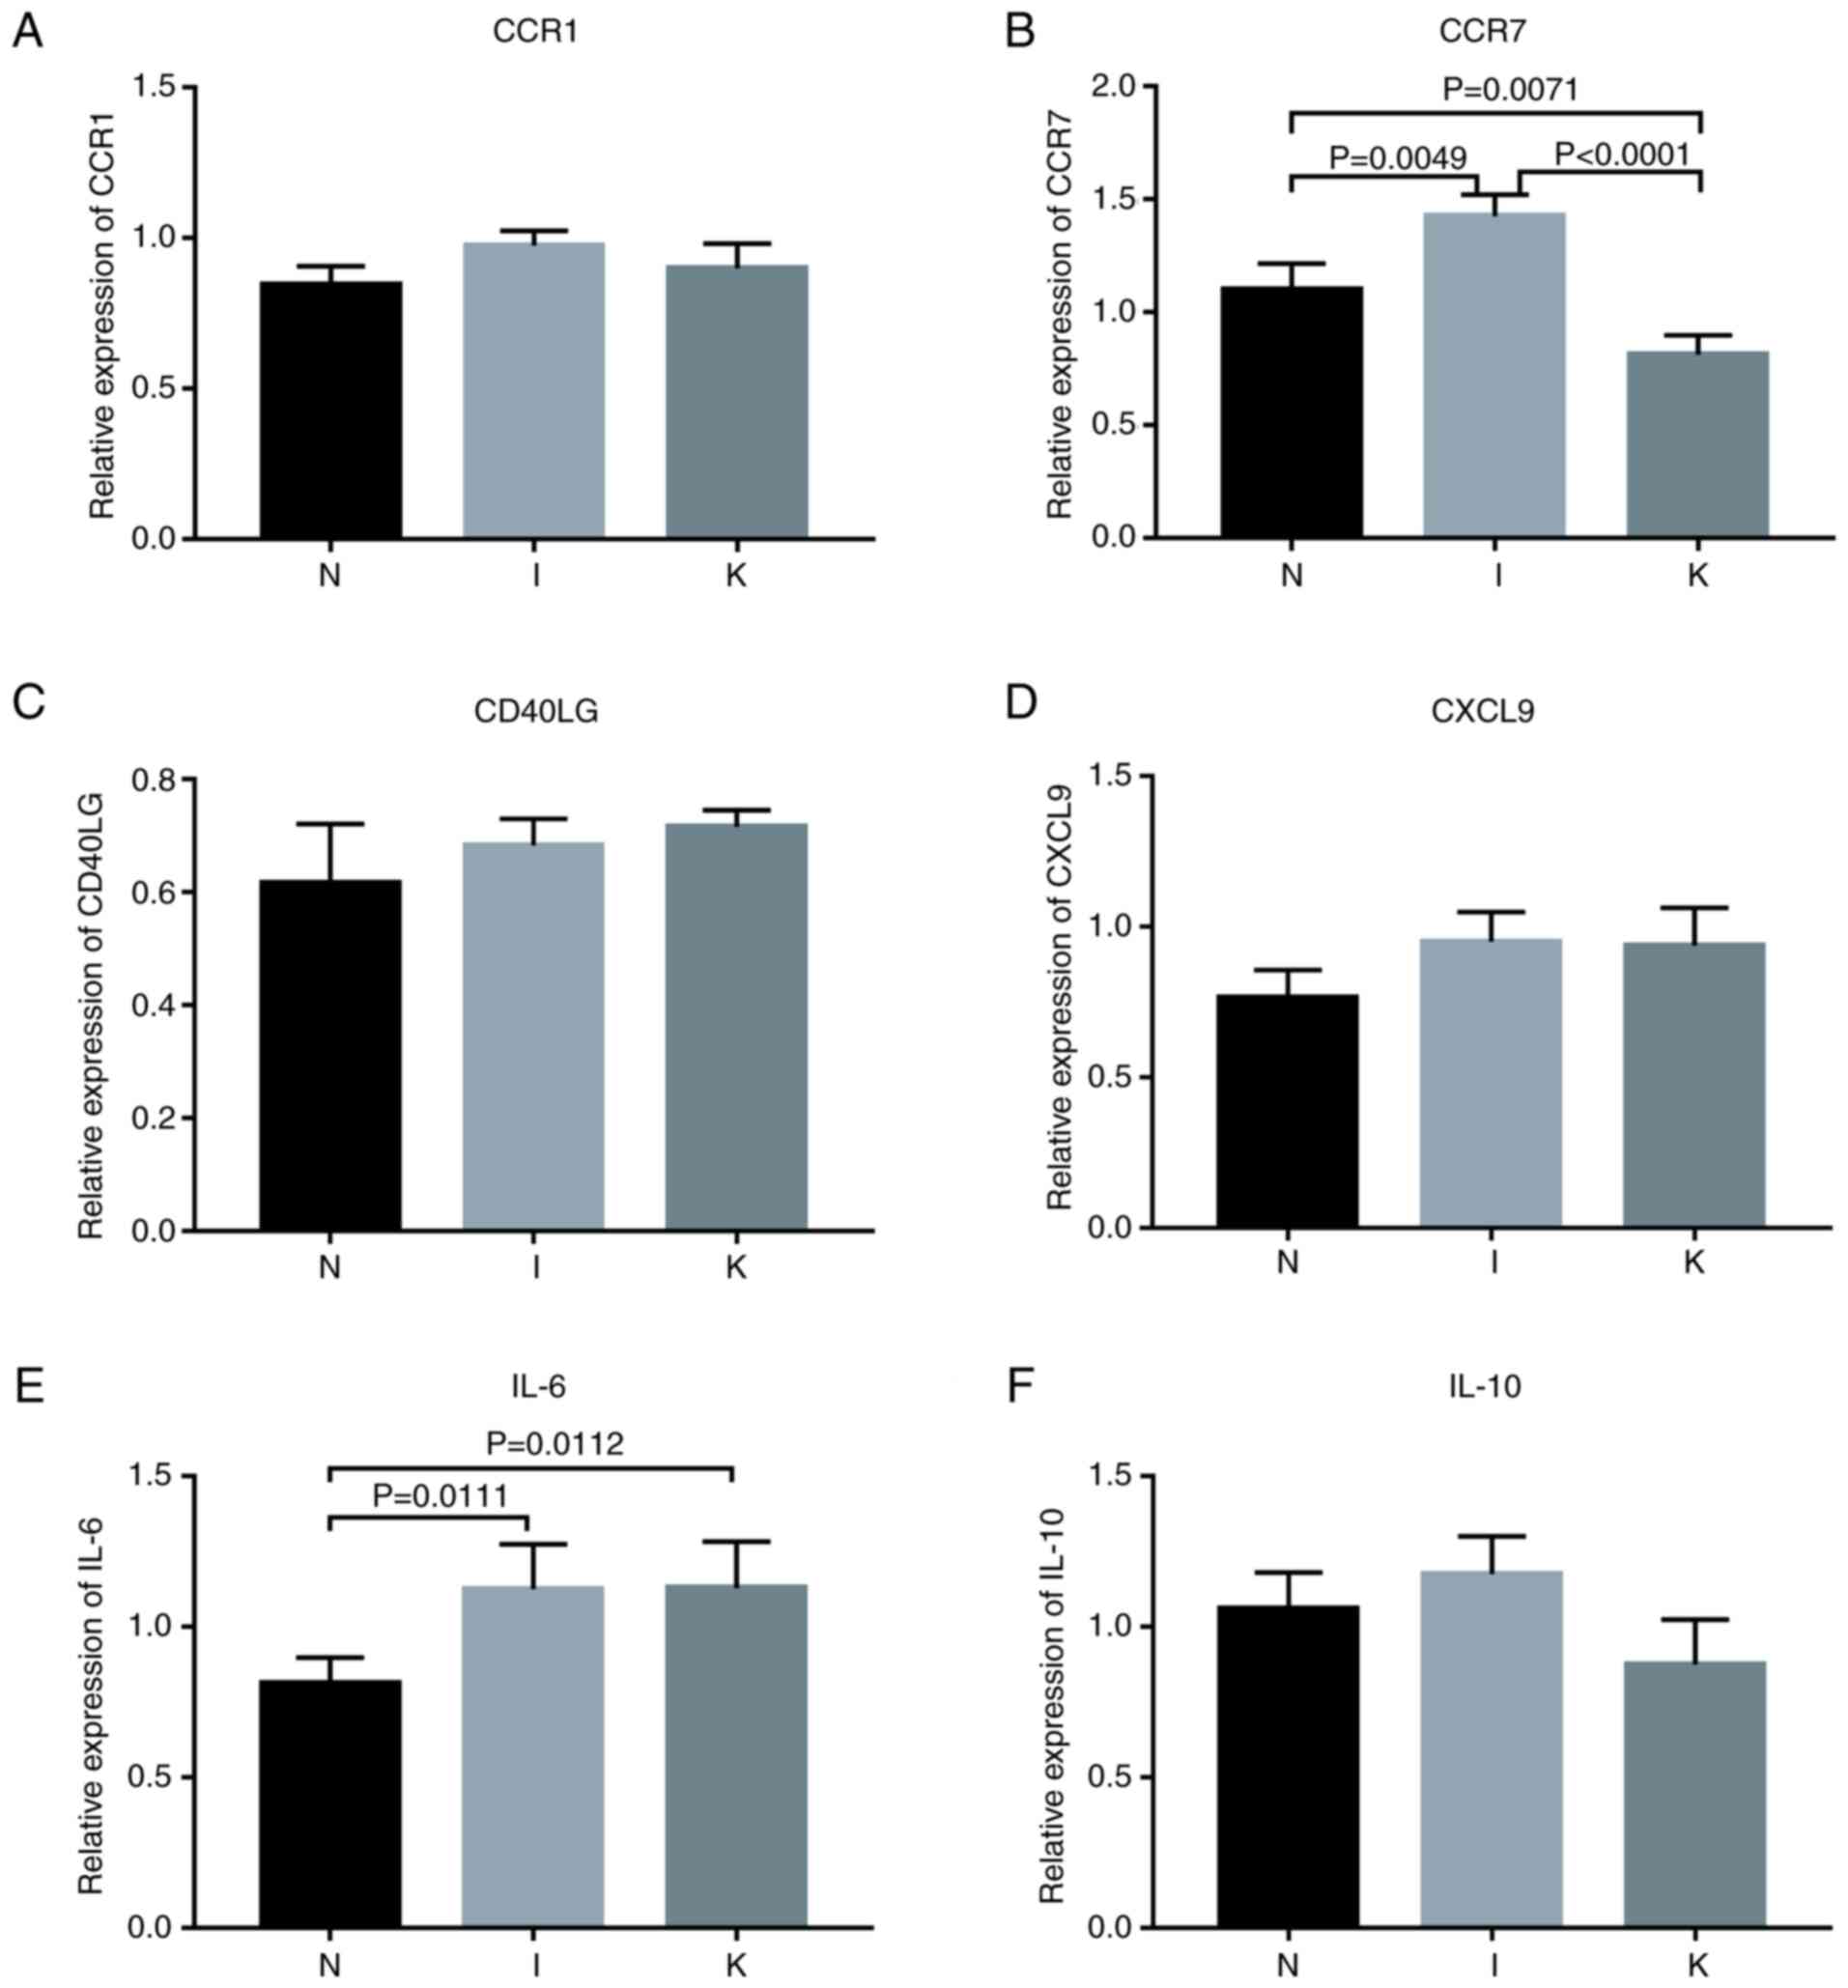
The expression of hub genes in the different groups
was validated using RT-qPCR. According to bioinformatics analysis,
primers were designed for the amplification of the top 10 hub genes
in each group (Fig. 4D-F). Hub
genes with Cq values ranging from 15-28 were considered highly
expressed. Cq values >28 were considered to indicate low
expression of the hub gene. The primers designed for the hub genes
in the I and the N groups were specific for CCR1, CCR2, SELL,
IL-10, CCR7, CD40LG, CD69, CXCL8, IL-6 and CXCL9. The genes with a
Cq value <28 included CCR1, CCR7, CD40LG, CXCL9, IL-6 and IL-10
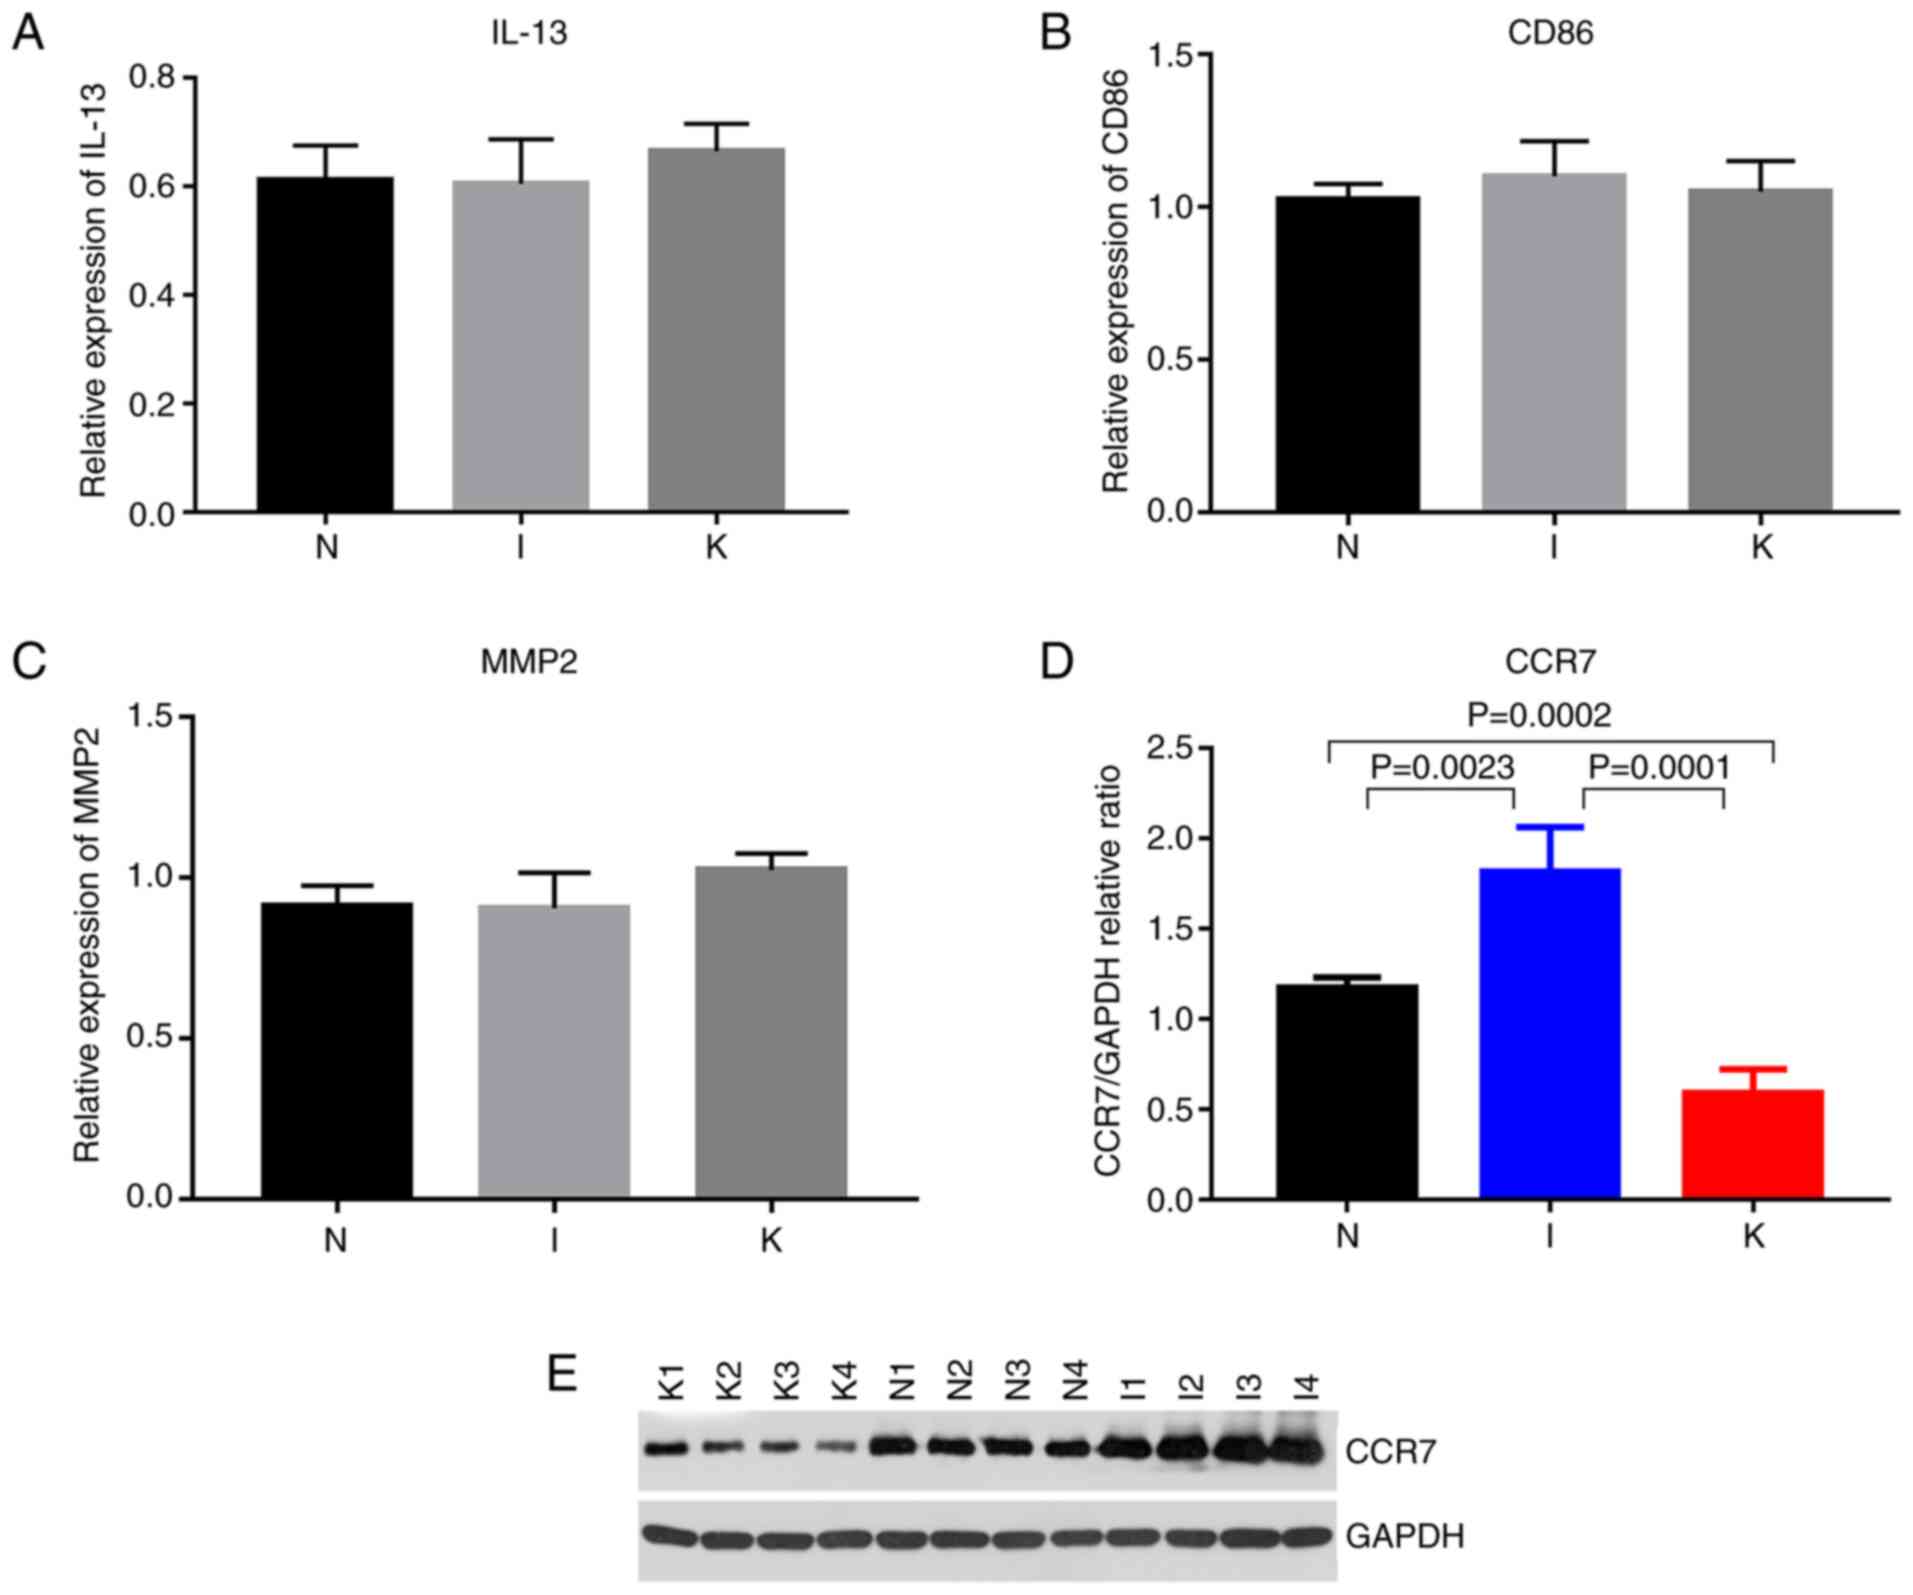
(Fig. 8). The primers designed for
the hub genes in the I and the K groups were specific for IL-10,
ITGAM, ITGAX, IL-2, IL-4, IL-6, IL-13, IL-17A, FOXP3 and CD86. The
genes with Cq values ranging from 15-28 included IL-10, IL-6, IL-13
and CD86 (Figs. 8 and 9; Table
VII). The hub genes analyzed in groups N and K included CD276,
IL-6, S100A8, FCGR2B, TWIST1, CD68, TYROBP, MMP2, SNAI2 and TGFB1.
The genes with Cq values ranging from 15-28 included CD68 and MMP2
(Fig. 9).
| Table VII.Comparison of the median level of hub
genes among various groups (N, I and K). |
Table VII.
Comparison of the median level of hub
genes among various groups (N, I and K).
|
| Mean value, IQR
for: |
|
|---|
|
|
|
|
|---|
| Hub genes | Group N | Group I | Group K | P-value |
|---|
| CCR1 | 0.85, 0.8-0.91 | 0.97,
0.90-1.00 | 0.90,
0.82-0.97 | 0.0600 |
| CCR7 | 1.10, 1-1.2 | 1.42, 1.32-1.5 | 0.81,
0.72-0.88 | <0.0001 |
| CD40LG | 0.63,
0.53-0.70 | 0.68,
0.65-0.72 | 0.71,
0.69-0.74 | 0.3030 |
| CXCL9 | 0.76,
0.70-0.86 | 0.95,
0.85-1.00 | 0.93,
0.81-1.00 | 0.0632 |
| IL-6 | 0.81,
0.73-0.89 | 1.13,
1.00-1.27 | 1.13,
1.11-1.28 | 0.0124 |
| IL-10 | 1.06,
1.00-1.18 | 1.18,
1.05-1.28 | 0.88,
0.73-1.00 | 0.0314 |
| IL-13 | 0.61,
0.56-0.67 | 0.60,
0.53-0.68 | 0.67,
0.61-0.71 | 0.4172 |
| CD86 | 1.03,
1.00-1.08 | 1.10,
1.00-1.20 | 1.05, 1.00-1.2 | 0.5320 |
| MMP2 | 0.91,
0.86-0.98 | 0.91,
0.80-1.00 | 1.03,
1.00-1.08 | 0.1072 |
Among the identified genes, IL-6 expression levels
were significantly upregulated in the I group compared with the N
group (P=0.0111). IL-6 expression levels were significantly
upregulated in the K group compared with the N (P=0.0112). Compared
with that in healthy skin tissue, CCR7 expression was upregulated
in inflamed tissue and downregulated in keloid tissue (Table VIII; Fig. 8). Western blot analysis revealed
that the relative expression levels of CCR7 were significantly
different in the normal, inflamed and keloid tissue (P<0.017;
Fig. 9D and E), indicating that
CCR7 may be important in keloid pathogenesis.
| Table VIII.Promising biomarkers of keloid via
reverse transcription-quantitative PCR. |
Table VIII.
Promising biomarkers of keloid via
reverse transcription-quantitative PCR.
|
|
| Bonferroni's
correctiona |
|---|
|
|
|
|
|---|
| Gene | Anova | N vs. I | I vs. K | N vs. K |
|---|
| CCR7 | P<0.0001 | 0.0049 | <0.0001 | 0.0071 |
| IL-6 | P=0.0124 | 0.0111 | NS | 0.0112 |
| IL-10 | P=0.0314 | NS | NS | NS |
Discussion
Tumors are regulated by their local immune
microenvironment (21–24), and keloids share certain
characteristics with tumors. Abnormal expression of immune-related
genes likely underlies the formation of keloids. Aberrant gene
expression often originates from congenital risks, although
external stimuli, such as inflammation, may also be a trigger.
In the present study, to examine the pathogenesis of
keloids, healthy skin, inflamed and keloid tissue were collected
from patients with keloids and analyzed. Hub genes were identified
in the N group compared with the I group, including CCR1, CCR7,
CD40LG, CXCL9, IL-6 and IL-10. Pro-inflammatory effects have
previously been demonstrated in animal models of CCR1 neurological
disease. For instance, Yan et al (17) demonstrated that CCR1 activation
could promote an intracerebral inflammatory response in mice via
the CCR1/topless-related protein 1/ERK1/2 signaling pathway. CCR1
may play a pro-inflammatory role in the formation of keloids.
CD40LG is expressed on the surface of T cells and regulates B-cell
function by activating CD40 on the surface of B cells.
Non-hematopoietic cells expressing CD40 can also activate CD40LG
and trigger a pro-inflammatory response (25). CD40LG may also play a
pro-inflammatory role in the formation of keloids. CXCL9 binds to
CXCR3, affecting the proliferation of cells involved in immune and
inflammatory responses and chemotaxis of activated T cells. The
CXCL9, −10 and −11/CXCR3 axis regulates the migration,
differentiation and activation of immune cells, such as cytotoxic T
lymphocytes, natural killer cells and macrophages. In addition, T
helper (Th) 1 polarization via this axis also activates immune
responses to IFN-γ (26). These
hub genes may be important in the early stages of keloid formation,
from healthy skin to the inflammation stage, although further
research is required to elucidate the role of each of these hub
genes.
The hub genes identified in the I group compared
with the K group included IL-10, IL-6, IL-13 and CD86. IL-10 has
been reported to significantly inhibit the proliferation of keloid
fibroblasts (6,8,27).
IL-10 expression was the highest in inflamed tissue samples and
lowest in the K group. The expression levels of IL-10 was firstly
increased, then decreased in the three groups. It may be
hypothesized that the occurrence and development of keloids may be
associated with changes in IL-10 expression, although the
underlying mechanism requires further study. High expression of
IL-10 in inflamed tissue may inhibit inflammatory damage in keloids
and slow down the progression of the disease. IL-13 and CD86 did
not differ significantly between the three groups, although there
was a trend towards increasing expression from healthy skin, to
inflamed and finally to keloid samples. Zhang et al
(21) suggested that the
expression levels of IL-6 and IL-17 in keloids were significantly
increased. Keloid lesions also exhibit enhanced IL-4/IL-13
signaling and a Th2-dominated immune response (7). In the present study, the expression
levels of IL-6 were the lowest in the N group and significantly
increased in the I group compared with the N group. There was no
significant change in the I and the K groups. IL-6 is a key
pro-inflammatory cytokine. Upregulation of IL-6 in keloid
fibroblasts leads to an increase in downstream target gene
expression, including in genes associated with cell proliferation
and matrix synthesis (28). IL-6
upregulation in keloids may lead to an intense inflammatory
response and subsequent production of more collagen fibers. The
frequency of Foxp3+ regulatory T cells (Tregs) in keloid
tissue is significantly higher than that in peripheral blood. In
addition, macrophages from keloid tissue have a strong ability to
induce Foxp3 expression in circulating CD3+ T-cells and
may promote Treg differentiation by upregulating Foxp3 expression
(29). CD86 is a T-lymphocyte
activation antigen that participates in T-lymphocyte proliferation
and IL-2 production by binding to CD28 or CTLA-4 (30). All these hub genes have different
functions in the initiation and regulation of immune responses.
They may be important in the later stages of keloid formation, from
the inflammatory stage to the keloid formation stage.
The roles played by several genes in keloid
development need to be explored further, including CCR1, CCR7,
CD40LG, CXCL9, IL-6, IL-10, IL-13, CD86 and MMP2. Inflammation is
an important mechanism in the pathogenesis of keloids. CCR7 is a
receptor protein with a seven-pass transmembrane structure
conjugated with allotrope G protein, which is expressed in a
variety of lymphoid tissue types (31). Under normal physiological
conditions, CCR7 could activate both B- and T-lymphocytes,
participate in the homing of T-lymphocytes, affect the transport of
T-lymphocytes in lymph nodes and stimulate the maturation of
dendritic cells (31). During the
inflammatory process, abnormal expression of CCR7 may occur. The
binding of chemokines to their receptors induces leukocytes to move
towards sites of inflammation. CCR7 is important in the process of
tumorigenesis and development by promoting the invasion and
migration of tumor cells. In response to inflammatory stimulation,
the expression of CCR7 increases to recruit more B- and T-cells to
participate in the immune response. In the present study,
expression of CCR7 tended to increase in the I group. In the late
stage of keloid formation, the expression of CCR7 in the K group
decreased to a lower level compared with the other two groups. CCR7
expression was significantly different between the I and K groups,
which represents a transition of the patient from an inflamed to a
keloid state (P<0.0001). This difference was more significant at
the protein level, with the highest CCR7 protein expression levels
being in the I group and the lowest in the K group. This suggested
that CCR7 may play an important role during the formation of
keloids. CCR7 may be a promising biomarker for the treatment of
keloid, although the specific mechanism of action still needs to be
further studied.
In the present study, BP terms were identified
between groups I and N, including ‘regulation of lymphocyte
activation’ and ‘T-cell activation’. A similar result was observed
between groups I and K. A study conducted by Huang et al
(32) suggested that upregulated
mRNA transcripts were involved in cell proliferation and tissue
repair, whereas downregulated transcripts were involved in
apoptosis.
In the present study, KEGG pathway analysis between
groups I and N revealed that the identified DEGs were primarily
enriched in ‘cytokine-cytokine receptor interactions’ and ‘viral
protein interactions with cytokines and cytokine receptors’,
indicating that these pathways may affect keloid formation. A study
performed by Zhong et al (27) identified target genes that were
associated with the MAPK and the hypoxia-inducible factor-1
signaling pathway. Immune regulation is crucial to the immune
response of the body, and cytokines are important in this process.
In the face of injury, inflammation or tumors, impaired activation
of the immune system through cytokines and their receptors could
dampen the immune response (33).
Conversely, excessively strong immune responses may trigger
autoimmune diseases. There are several important immune cytokines,
such as IL-2, −3, −4, −5, −6, −9, −10, −12, −13 and −14, as well as
IFN-γ (24,33). In the present study, IL-6, IL-10
and IL-13 were identified as playing an important role in patients
with keloids. In future, functional studies on these promising
biomarkers may be conducted via immune absorbent spot (ELISpot). In
addition, in future studies, cell functions of these promising
biomarkers may be studied. Furthermore, the ‘cytokine-cytokine
receptor interactions’ pathway was identified in the current KEGG
analysis. These results suggested that the pathogenesis of keloids
may be associated with ‘cytokine-cytokine receptor interactions’.
Future research into the molecular mechanisms of keloid
pathogenesis should explore these possibilities. KEGG analysis
suggested that the pathogenesis of keloids was associated with
‘viral protein interactions with cytokines and cytokine receptors’.
These results suggested that the pathogenesis of keloids may be
related to viral infections. Future research into the molecular
mechanisms of keloid pathogenesis should explore these
possibilities.
Despite the rigorous bioinformatics analysis
involved in the present study, there are some limitations. It was
difficult to obtain inflammatory tissue, which may have led to some
deviation of results. The remaining sample size was too small to
continue to use for PCR after sequencing, especially the
inflammatory tissue content, and considering, the result is more
general using other samples to perform the verification. The sample
size in the present study was small and should be increased in
future studies. Additionally, the present study lacks in-depth
functional experiments in cell and animal models.
In conclusion, immune-related DEGs were identified
in healthy skin, inflamed and keloid tissue samples from patients
with keloids. Certain of these hub genes may be key in the
formation of keloids, such as CCR7, IL-6 and IL-10 (Table VIII). These may represent
important targets for drug therapy and precise treatment of
keloids. Regulating these key genes may help prevent, alleviate or
even cure keloids. These results also provided further insight into
keloid pathogenesis.
Supplementary Material
Supporting Data
Acknowledgements
Not applicable.
Funding
The present study was supported by The National Natural Science
Foundation of China (grant no. 81871538).
Availability of data and materials
The datasets used and/or analyzed during the current
study are available from the corresponding author on reasonable
request. The data has been uploaded to the NCBI website
(SUB10443300).
Authors' contributions
MS performed the experiments, carried out the data
analysis and was a major contributor to preparation of the
manuscript. HL, KS, SL and YH collected samples and performed the
experiments. YW made substantial contributions to the design of the
study. KS, SL and YH were major contributors to the submission of
the manuscript and provided technical support in the experimental
methods. MS, HL and YW confirm the authenticity of all the raw
data. All authors read and approved the final manuscript.
Ethics approval and consent to
participate
The experimental plan for the present study was
approved (approval no. JS-2907) by The Medical Ethics Committee of
Peking Union Medical College Hospital (Beijing, China). Written and
photographic informed consents were obtained from all
participants.
Patient consent for publication
All patients or guardians of the patients provided
written informed consent for the publication of any associated data
and accompanying images.
Competing interests
The authors declare that they have no competing
interests.
Glossary
Abbreviations
Abbreviations:
|
DEG
|
differentially expressed gene
|
|
GO
|
Gene Ontology
|
|
KEGG
|
Kyoto Encyclopedia of Genes and
Genomes
|
|
H&E
|
hematoxylin and eosin
|
|
PPI
|
protein-protein interaction
|
|
BP
|
biological process
|
|
CC
|
cell component
|
|
MF
|
molecular function
|
References
|
1
|
Brown JJ, Ollier W, Arscott G, Ke X, Lamb
J, Day P and Bayat A: Genetic susceptibility to keloid scarring:
SMAD gene SNP frequencies in Afro-caribbeans. Exp Dermatol.
17:610–613. 2008. View Article : Google Scholar : PubMed/NCBI
|
|
2
|
Chung S, Nakashima M, Zembutsu H and
Nakamura Y: Possible involvement of NEDD4 in keloid formation; its
critical role in fibroblast proliferation and collagen production.
Proc Jpn Acad Ser B Phys Biol Sci. 87:563–573. 2011. View Article : Google Scholar : PubMed/NCBI
|
|
3
|
Glass DA II: Current understanding of the
genetic causes of keloid formation. J Investig Dermatol Symp Proc.
18:S50–S53. 2017. View Article : Google Scholar : PubMed/NCBI
|
|
4
|
Tsai CH and Ogawa R: Keloid research:
Current status and future directions. Scars Burn Heal.
5:20595131198686592019.PubMed/NCBI
|
|
5
|
Song KX, Liu S, Zhang MZ, Liang WZ, Liu H,
Dong XH, Wang YB and Wang XJ: Hyperbaric oxygen therapy improves
the effect of keloid surgery and radiotherapy by reducing the
recurrence rate. J Zhejiang Univ Sci B. 19:853–862. 2018.
View Article : Google Scholar : PubMed/NCBI
|
|
6
|
Ogawa R: Keloid and hypertrophic scars are
the result of chronic inflammation in the reticular dermis. Int J
Mol Sci. 18:6062017. View Article : Google Scholar : PubMed/NCBI
|
|
7
|
Diaz A, Tan K, He H, Xu H, Cueto I, Pavel
AB, Krueger JG and Guttman-Yassky E: Keloid lesions show increased
IL-4/IL-13 signaling and respond to Th2-targeting dupilumab
therapy. J Eur Acad Dermatol Venereol. 34:e161–e164. 2020.
View Article : Google Scholar : PubMed/NCBI
|
|
8
|
Shi CK, Zhao YP, Ge P and Huang GB:
Therapeutic effect of interleukin-10 in keloid fibroblasts by
suppression of TGF-β/Smad pathway. Eur Rev Med Pharmacol Sci.
23:9085–9092. 2019.PubMed/NCBI
|
|
9
|
Gankande TU, Wood FM, Edgar DW, Duke JM,
DeJong HM, Henderson AE and Wallace HJ: A modified vancouver scar
scale linked with TBSA (mVSS-TBSA): Inter-rater reliability of an
innovative burn scar assessment method. Burns. 39:1142–1149. 2013.
View Article : Google Scholar : PubMed/NCBI
|
|
10
|
Wang CH, Shan MJ, Liu H, Hao Y, Song KX,
Wu HW, Meng T, Feng C, Qi Z, Wang Z and Wang YB: Hyperbaric oxygen
treatment on keloid tumor immune gene expression. Chin Med J
(Engl). 134:2205–2213. 2021.PubMed/NCBI
|
|
11
|
Privé F, Luu K, Vilhjálmsson BJ and Blum
M: Performing highly efficient genome scans for local adaptation
with r package pcadapt version 4. Mol Biol Evol. 37:2153–2154.
2020. View Article : Google Scholar : PubMed/NCBI
|
|
12
|
Kanehisa M and Goto S: KEGG: Kyoto
encyclopedia of genes and genomes. Nucleic Acids Res. 28:27–30.
2000. View Article : Google Scholar : PubMed/NCBI
|
|
13
|
Huang DW, Sherman BT and Lempicki RA:
Systematic and integrative analysis of large gene lists using DAVID
bioinformatics resources. Nat Protoc. 4:44–57. 2009. View Article : Google Scholar : PubMed/NCBI
|
|
14
|
Szklarczyk D, Gable AL, Lyon D, Junge A,
Wyder S, Huerta-Cepas J, Simonovic M, Doncheva NT, Morris JH and
Bork P: STRING v11: Protein-protein association networks with
increased coverage, supporting functional discovery in genome-wide
experimental datasets. Nucleic Acids Res. 47:D607–D613. 2019.
View Article : Google Scholar : PubMed/NCBI
|
|
15
|
Shannon P, Markiel A, Ozier O, Baliga NS,
Wang JT, Ramage D, Amin N, Schwikowski B and Ideker T: Cytoscape: A
software environment for integrated models of biomolecular
interaction networks. Genome Res. 13:2498–2504. 2003. View Article : Google Scholar : PubMed/NCBI
|
|
16
|
Ni M, Liu X, Wu J, Zhang D, Tian J, Wang
T, Liu S, Meng Z, Wang K, Duan X, et al: Identification of
candidate biomarkers correlated with the pathogenesis and prognosis
of non-small cell lung cancer via integrated bioinformatics
analysis. Front Genet. 9:4692018. View Article : Google Scholar : PubMed/NCBI
|
|
17
|
Yan J, Zuo G, Sherchan P, Huang L, Ocak U,
Xu W Travis Z, Wang W, Zhang J and Tang J: CCR1 Activation Promotes
Neuroinflammation Through CCR1/TPR1/ERK1/2 Signaling Pathway After
Intracerebral Hemorrhage in Mice. Neurotherapeutics. 17:1170–1183.
2020. View Article : Google Scholar : PubMed/NCBI
|
|
18
|
Chin CH, Chen SH, Wu HH, Ho CW, Ko MT and
Lin CY: cytoHubba: Identifying hub objects and sub-networks from
complex interactome. BMC Syst Biol. 8 (Suppl 4):S112014. View Article : Google Scholar : PubMed/NCBI
|
|
19
|
Song X, Du R, Gui H, Zhou M, Zhong W, Mao
C and Ma J: Identification of potential hub genes related to the
progression and prognosis of hepatocellular carcinoma through
integrated bioinformatics analysis. Oncol Rep. 43:133–146.
2020.PubMed/NCBI
|
|
20
|
Livak KJ and Schmittgen TD: Analysis of
relative gene expression data using real-time quantitative PCR and
the 2-(Delta Delta C(T)) method. Methods. 25:402–408. 2001.
View Article : Google Scholar : PubMed/NCBI
|
|
21
|
Zhang Q, Yamaza T, Kelly AP, Shi S, Wang
S, Brown J, Wang L, French SW, Shi S and Le AD: Tumor-like stem
cells derived from human keloid are governed by the inflammatory
niche driven by IL-17/IL-6 axis. PLoS One. 4:e77982009. View Article : Google Scholar : PubMed/NCBI
|
|
22
|
Limandjaja GC, Niessen FB, Scheper RJ and
Gibbs S: The keloid disorder: Heterogeneity, histopathology,
mechanisms and models. Front Cell Dev Biol. 8:3602020. View Article : Google Scholar : PubMed/NCBI
|
|
23
|
van den Broek LJ, Limandjaja GC, Niessen
FB and Gibbs S: Human hypertrophic and keloid scar models:
Principles, limitations and future challenges from a tissue
engineering perspective. Exp Dermatol. 23:382–386. 2014. View Article : Google Scholar : PubMed/NCBI
|
|
24
|
Tan S, Khumalo N and Bayat A:
Understanding keloid pathobiology from a quasi-neoplastic
perspective: Less of a scar and more of a chronic inflammatory
disease with cancer-like tendencies. Front Immunol. 10:18102019.
View Article : Google Scholar : PubMed/NCBI
|
|
25
|
Karnell JL, Rieder SA, Ettinger R and
Kolbeck R: Targeting the CD40-CD40L pathway in autoimmune diseases:
Humoral immunity and beyond. Adv Drug Deliv Rev. 141:92–103. 2019.
View Article : Google Scholar : PubMed/NCBI
|
|
26
|
Tokunaga R, Zhang W, Naseem M, Puccini A,
Berger MD, Soni S, McSkane M, Baba H and Lenz HJ: CXCL9, CXCL10,
CXCL11/CXCR3 axis for immune activation-A target for novel cancer
therapy. Cancer Treat Rev. 63:40–47. 2018. View Article : Google Scholar : PubMed/NCBI
|
|
27
|
Zhong L, Bian L, Lyu J, Jin H, Liu Z, Lyu
L and Lu D: Identification and integrated analysis of microRNA
expression profiles in keloid. J Cosmet Dermatol. 17:917–924. 2018.
View Article : Google Scholar : PubMed/NCBI
|
|
28
|
Ghazizadeh M: Essential role of IL-6
signaling pathway in keloid pathogenesis. J Nippon Med Sch.
74:11–22. 2007. View Article : Google Scholar : PubMed/NCBI
|
|
29
|
Jin Q, Gui L, Niu F, Yu B, Lauda N, Liu J,
Mao X and Chen Y: Macrophages in keloid are potent at promoting the
differentiation and function of regulatory T cells. Exp Cell Res.
362:472–476. 2018. View Article : Google Scholar : PubMed/NCBI
|
|
30
|
Suzuki M, Yokota M, Matsumoto T and Ozaki
S: Synergic effects of CD40 and CD86 silencing in dendritic cells
on the control of allergic diseases. Int Arch Allergy Immunol.
177:87–96. 2018. View Article : Google Scholar : PubMed/NCBI
|
|
31
|
Mburu YK, Wang J, Wood MA, Walker WH and
Ferris RL: CCR7 mediates inflammation-associated tumor progression.
Immunol Res. 36:61–72. 2006. View Article : Google Scholar : PubMed/NCBI
|
|
32
|
Huang H, Fu S and Liu D: Detection and
analysis of the hedgehog signaling pathway-related long non-coding
RNA (lncRNA) expression profiles in keloid. Med Sci Monit.
24:9032–9044. 2018. View Article : Google Scholar : PubMed/NCBI
|
|
33
|
Spangler JB, Moraga I, Mendoza JL and
Garcia KC: Insights into cytokine-receptor interactions from
cytokine engineering. Annu Rev Immunol. 33:139–167. 2015.
View Article : Google Scholar : PubMed/NCBI
|