Introduction
Adrenocortical tumors are relatively common, with a
prevalence of 3–10% in the general population (1). These tumors can be categorized into
adrenocortical adenoma and adrenocortical carcinoma (ACC), which is
rare, with a reported incidence of only 2 cases per 1,000,000
individuals per year (2). ACC is
most common in women (55–60% of cases) in their 4th or 5th decade
of life. However, ACC can affect patients at any age, including
children (3). Geographical factors
also appear to serve a role, with a higher incidence in certain
regions of the world, such as in southern and southwestern Brazil
(4). The 5-year survival rate of
individuals with adrenocortical carcinoma is 50% (5).
The main drug currently approved for the treatment
of ACC is mitotane (2,4′-dichlorodiphenyl)dichloroethane,
1-(2-chlorophenyl)-1-(4-chlorophenyl)-2,2-dichloroethane). The
recommended therapeutic window for plasma mitotane levels is 14–20
mg/l (~50 µM) (6,7). However, the efficacy of this drug is
limited due to its low pharmacokinetic properties and dose-limiting
toxicity (8–10). Mitotane is an
insecticide-derivative lipophilic drug that accumulates in
lipoproteins, and dyslipidemia has been observed in certain
mitotane-treated patients with ACC (11). Mitotane raises the concentration of
cortisol-binding globulin hormone, steroid-binding globulin and
thyroxine-binding globulin, and it may also impair pituitary gland
function by reducing the secretion of thyroid stimulating hormone,
thus leading to hypothyroidism (12). The action of mitotane on adrenal
steroidogenesis has been associated with the inhibition of a number
of mitochondrial cytochrome P450-dependent enzymes, including
cholesterol side-chain cleavage, 11β-hydroxylase and
18β-hydroxylase, as well as P450-independent enzymes, such as
3β-hydroxysteroid-dehydrogenase (13). Mitotane contributes to the
induction of respiratory chain impairment, leading to decreased
aspartate and increased glutamate content (14). This drug has also been shown to
inhibit the expression of the voltage-dependent anion channel, a
protein anchored to the outer mitochondrial membrane (15,16).
A recent report described an unusual case of a
patient admitted to the Department of Endocrinology, Metabolism and
Internal Medicine at Poznan University of Medical Sciences (Poznan,
Poland) in September 2017 (17).
The patient was initially diagnosed with ACC and treated with
mitotane therapy. However, due to the unusual course of the
disease, an experienced pathologist re-analyzed all the tissue
samples, and noticed that all had the same immunophenotype and
morphology. As a result, the initial diagnosis of ACC was changed
to metastatic melanoma of unknown primary origin. The most notable
aspect of that case was the rapid disease progression after
mitotane withdrawal, which suggested that mitotane may play a
protective and stabilizing role in non-adrenal-derived tumors
(17).
Based on the aforementioned case report, the present
study aimed to compare the biological response of ACC and melanoma
cells after mitotane treatment. The cell proliferation rate was
determined, and cytometric analysis of key processes involved in
the response to cytostatic treatment [including mitochondrial
membrane potential, DNA double-strand breaks (DSBs), necrosis,
apoptosis and cell cycle] was performed, alongside gene expression
profiling.
Materials and methods
Cell culture of metastatic melanoma in
the left adrenal gland of unknown primary origin
To establish a primary culture of metastatic
melanoma, a sample from a specimen for which several
immunohistochemical analyses targeting melanoma markers were
previously performed, as described in detail in a previous
publication (17), was used.
Adrenal metastases of melanoma tumor samples
obtained during surgery, were cut into several small pieces, and
the fragments were further dissociated enzymatically in 25 ml DMEM
F12 (Thermo Fisher Scientific, Inc.) containing 0.1% type I
collagenase (cat. no. 17018029; Thermo Fisher Scientific, Inc.) for
45 min at 37°C in a water bath with intermittent mixing. After
digestion, the mixture was filtered through a 70-µM sieve. Next,
the tissue was centrifuged at 4°C and 300 × g for 7 min. The cell
pellet was resuspended in the DMEM F12 containing 0.5%
penicillin-streptomycin (cat. no. P4333; Merck KGaA) and 10% fetal
bovine serum (FBS; HyClone; Cytiva). The primary cell line was
cultured at 37°C in the presence of 5% CO2 in a
humidified atmosphere until reaching 70% confluence. The cells
exhibited key melanoma markers (18,19):
CSPG4, FN1, TYRP1, MCAM and SPP1 (selected by transcriptomic
studies using microarrays) (Fig.
S1).
Cell culture of commercially available
cells lines
The HAC15 cell line (cat. no. CRL-3301TM; American
Type Culture Collection) was cultured in a defined medium
consisting of DMEM/F12 without phenol red (Thermo Fisher
Scientific, Inc.), 10% Cosmic Calf Serum (HyClone; Cytiva), 1%
insulin-transferrin-selenium + Premix (cat. no. 25–800-CR; Corning,
Inc.) and 1% penicillin-streptomycin. Importantly, the HAC15 cell
line was authenticated using STR analysis by the supplier.
The metastatic human melanoma WM266-4 cell line
(Rockland Immunochemicals, Inc.) was cultured in medium consisting
of high-glucose DMEM (Thermo Fisher Scientific, Inc.), 10% FBS
(HyClone; Cytiva) and 1% P/S (MilliporeSigma). The wild-type TTP53
status of both commercial cell lines was previously confirmed
(20,21).
HAC15, WM266-4 and primary melanoma
cell treatment
These cells (2×10⁶) were incubated with
mitotane (50 µM) for 24 h (37°C in the presence of 5%
CO2 in a humidified atmosphere) and then subjected to
further analyses. Based on the opinion of clinicians (HK,
Department of Endocrinology, Metabolism and Internal Medicine,
Poznan University of Medical Sciences, Poznan, Poland; MK, General
and Transplantation Surgery, Poznan University of Medical Sciences,
Poznan, Poland; TW, General, Endocrinological and
Gastroenterological Surgery, Poznan University of Medical Sciences,
Poznan, Poland; and MareR, Department of Endocrinology, Metabolism
and Internal Medicine, Poznan University of Medical Sciences,
Poznan, Poland), a time point (24 h) that is both clinically and
biologically important was selected for this study. Specifically,
at this time point, the greatest changes in cell proliferation were
observed, which should reflect dynamic changes in gene expression
(22,23). Therefore, material collected after
24 h of mitotane treatment was selected for further microarray
analysis.
Real-time cell analyzer (RTCA)-based
cell proliferation assay
To verify the effect of a wide range of
concentrations of mitotane (10, 20, 40, 60 and 80 µM) on the
proliferation rate of the evaluated cells (n=6/group; 1,000 cells
per well), an RTCA electrical impedance-based cell proliferation
assay (xCELLigence RTCA; Roche Diagnostics GmbH) was used. The RTCA
system detects fluctuations in electrical impedance on the
integrated sensory electrodes, which are located at the bottom of
the 16-hole slide plates of the chamber (E-Plate 16), which are
covered by dividing cells. Electrical impedance is determined at
15-min intervals during the culture period (~40 h after mitotane
delivery). The main RTCA parameter is the cell index (CI), which
refers to the relative change in electrical impedance depending on
the rate of proliferation or apoptosis of the cultured cells. The
CI values were normalized to obtained a normalized cell index
(NCI), which was calculated for each time point according to the
following formula: NCI=CI time point/CI mitotane delivery.
The characteristic parameters of cell proliferation,
including doubling time and dose-dependent rate of decrease, and
the half-maximal response to mitotane, were calculated. Doubling
time is the time (in h) required to double NCI (positive values) or
to reduce it by half (negative values) based on the curve-fit from
the first 24 h after mitotane administration. All calculations,
such as R2 (regression line fit), rate of decrease and
slope were performed using RTCA software v.1.2.1.1002 according to
the manufacturer's protocol (Roche Diagnostics GmbH) and then
visualized in the ggplot2 package of the R programming language
(https://cran.r-project.org/web/packages/ggplot2/index.html).
The effect of mitotane on HAC15, WM266-4 and primary melanoma cell
proliferation was evaluated in two independent experiments.
Flow cytometry analysis of
phosphorylated at serine 139 version of histone H2AX (γH2AX) and
cleaved poly (ADP-ribose) polymerase 1 (PARP-1)
Cells (HAC15, WM266-4 and primary melanoma) were
stained for γH2AX with Alexa Fluor® 647 Mouse anti-H2AX
(cat. no. 560447; BD Biosciences) and cleaved PARP-1 with PE Mouse
anti-Cleaved PARP (Asp214) (cat. no. 562253; BD Biosciences)
antibodies according to the manufacturer's instructions. Briefly,
1×10⁶ untreated and mitotane-treated cells were fixed
and permeabilized with Cytofix/Cytoperm™ Fixation/Permeabilization
Solution (BD Biosciences) for 30 min at room temperature.
Additional permeabilization and fixation as recommended by the
manufacturer's protocol were then performed. The fixed cells were
once washed with 1 ml Perm/Wash Buffer (BD Biosciences) at room
temperature for 5 min and stained with an appropriate antibody (5
µl/assay in 20 µl BD Perm/Wash Buffer) for 20 min at room
temperature. Cells were then resuspended in 1 ml PBS and analyzed
with a flow cytometer (CytoFlex; Beckman Coulter, Inc.).
Fluorescence intensity in arbitrary units was represented in
histograms, and the mean fluorescence intensity was calculated.
Data were analyzed using FlowJo software v10 (FlowJo LLC).
Untreated cells served as a control. The mean fluorescence
intensity from three experiments was normalized to 1. Treated cells
were compared with the control.
Flow cytometry analysis of necrosis
and the cell cycle
Cell cycle analysis was performed using a propidium
iodide (cat. no. P1304MP; Thermo Fisher Scientific, Inc.). Briefly,
treated cells (1×10⁶) were fixed in cold (−20°C) 70%
ethanol by adding this dropwise to the cell suspension while
vortexing. Next, the cells were rinsed with PBS and incubated with
a mixture of 10 µl propidium iodide (1 mg/ml), 188 µl PBS and 2 µl
RNAse (10 mg/ml; Thermo Fisher Scientific, Inc.). Cells were
incubated at 37°C for 30 min, and then rinsed and resuspended in
200 µl PBS. The fluorescence intensity of the sample was determined
with a blue laser (488 nm) and detection filters 610/20 nm bandpass
for PI. The procedure to determine necrosis was similar to that
used for cell cycle analysis, with the following exceptions: i)
RNAse was not added to the unfixed cells and ii) incubation with
propidium iodide was performed at 4°C for 30 min.
Flow cytometry analysis of
mitochondrial membrane potential
Mitochondrial membrane potential analysis was
performed using JC-1 solution (cat. no. T3168; Thermo Fisher
Scientific, Inc.) at a final concentration of 100 µM. The
resuspended cells (1×10⁶) were stained for 20 min at
37°C. At low concentrations (low mitochondrial membrane potential),
JC-1 is predominantly a monomer that yields green fluorescence with
emission of 530 nm. In turn, at high concentrations (high
mitochondrial membrane potential), the dye aggregates yielding a
red to orange colored emission (590 nm). This correlates to the
FL-2 and FL-1 channels (24). The
results were depicted as mean fluorescence that was subsequently
normalized (the value of the control was set as 1).
Reverse transcription-quantitative PCR
(RT-qPCR)
Total RNA was extracted from cells with Direct-zol™
RNA MiniPrep columns (Zymo Research Corp.). Total RNA (1 µg per 20
µl reaction volume) was reverse transcribed using an iScript cDNA
Synthesis Kit (Bio-Rad Laboratories, Inc.). qPCR (Initial
denaturation at 95°C for 5 min; 44 cycles of denaturation at 95°C
for 10 sec, amplification at 60°C for 30 sec and elongation at 72°C
for 1 sec) was performed using the LightCycler® 480
Probes Master (Roche Diagnostics) and the appropriate probe for
each primer (5′-3′): TTP53 forward, 5′-CTTTCCACGACGGTGACA-3′ and
reverse, 5′-TCCTCCATGGCAGTGACC-3′; BRCA2 forward,
5′-CCTGATGCCTGTACACCTCTT-3′ and reverse,
5′-GCAGGCCGAGTACTGTTAGC-3′; RAD51 forward,
5′-ATCACTAATCAGGTGGTAGC-3′ and reverse, 5′-CCCCTCTTCCTTTCCTCAGA-3′;
XRCC4 forward, 5′-TGGTGAACTGAGAAAAGCATTG-3′ and reverse,
5′-TGAAGGAACCAAGTCTGAATGA-3′; PRKDC forward,
5′-AGAGGCTGGGAGCATCACT-3′ and reverse, 5′-CACCAAGGCTTCAAACACAA-3′;
BAX forward, 5′-ATGTTTTCTGACGGCAACTTC-3′ and reverse,
5′-ATCAGTTCCGGCACCTTG-3′; BCL-2 forward, 5′-GCACCTGCACACCTGGAAT-3′
and reverse, 5′-AGCCAGGAGAAATCAAACAGAG-3′; CDK2 forward,
5′-TGCTGGGAGAAATGGAAAAT-3′ and reverse, 5′-CAGGACTGCTGTGGGACATA-3′;
and CDK4 forward, 5′-AACCTCTGATTGACAGCTACAGTG-3′ and reverse,
5′-GGGTGGGATAGTTGAACACG-3′.
cDNA samples were analyzed for the following genes
of interest: BAX, BCL-2, CDK2, CDK4, TTP53, RAD51 recombinase
(RAD51), BRCA2 DNA repair associated (BRCA2), X-ray repair cross
complementing 4 (XRCC4) and protein kinase DNA-activated catalytic
subunit (PRKDC), and for the reference gene GAPDH (cat. no.
05–190-541-001; Roche Diagnostics). The expression level for each
target gene was calculated with the 2−ΔΔCq method
(25). The reaction was performed
in triplicate for each gene of interest. qPCR analysis was
performed using a LightCycler® 96 (Roche
Diagnostics).
Microarray expression analysis
Microarray analysis was conducted as previously
described (26–28). The isolated RNA (50–300 ng/µl and
not degraded) from melanoma and ACC cells was pooled into two
samples per group, and the following groups were established: i)
Untreated primary melanoma cell line; ii) mitotane-treated primary
melanoma cell line; iii) untreated WM266-4 cell line; iv)
mitotane-treated WM266-4 cell line; v) untreated HAC15 cell line;
and vi) mitotane-treated HAC15 cell line.
Cells were treated with mitotane (final
concentration, 50 µM) for 24 h. Transcription in vitro,
biotin labelling and cDNA fragmentation for further hybridization
were performed with an Affymetrix GeneChip IVT Express Kit
(Affymetrix; Thermo Fisher Scientific, Inc.) according to the
manufacturer's instructions. The biotin-labelled fragments were
hybridized with Affymetrix Gene Chip Human Genome U219 microarrays
(Affymetrix; Thermo Fisher Scientific, Inc.) together with control
cDNA and oligo B2 (Affymetrix; Thermo Fisher Scientific, Inc.).
Hybridization was performed with an AccuBlock™ Digital Dry Bath
Hybridization Oven (Labnet International, Inc.) at 45°C for 16 h.
The microarrays were then washed 3× at room temp. for 5′ and
stained using Affymetrix GeneAtlas™ Fluidics Station (Affymetrix;
Thermo Fisher Scientific, Inc.) according to the manufacturer's
protocol. The array strips were scanned using the imaging station
of the GeneAtlas™ system (Affymetrix; Thermo Fisher Scientific,
Inc.). Preliminary analysis of the scanned chips was performed
using GeneAtlas™ operating software (Affymetrix; Thermo Fisher
Scientific, Inc.). The quality of the gene expression data was
verified using the quality control criteria established by the
software. The obtained CEL files were imported for downstream data
analysis.
Microarray data analysis
All analyses were performed using the Bioconductor
repository (https://bioconductor.org) with the
relevant Bioconductor libraries as an extension of the statistical
R programming language. The robust multiarray average normalization
algorithm implemented in the ‘Affy’ Bioconductor library was used
for normalization, background correction and calculation of the
expression values of all examined genes (29). Biological annotation was obtained
from the Bioconductor ‘oligo’ library, where an annotated data
frame object was merged with a normalized data set to obtain a
complete gene data table (30).
Differential expression and statistical assessment were determined
by applying the linear models for microarray data implemented in
the ‘limma’ library (31). The
selection criteria for significant changes in gene expression were
based on absolute fold-change >1.5 and P-value with false
discovery rate (FDR) correction (adjusted P-value) of 0.05. The
result of this selection was presented as a volcano plot, showing
the total number of upregulated and downregulated genes affected by
mitotane. The top 10 upregulated and downregulated genes are
presented in tables. The raw data files were also deposited in the
Gene Expression Omnibus (GEO) repository at the National Center for
Biotechnology Information (http://www.ncbi.nlm.nih.gov/geo/) under the GEO
accession number GSE186870.
Assignment of differentially expressed
genes to relevant Gene Ontology (GO) biological process (BP)
terms
ENTREZ ids with fold-change values of differentially
expressed genes (DEGs) were subjected to GO enrichment analysis
using the Database for Annotation, Visualization and Integrated
Discovery (DAVID) bioinformatics tool (32). Gene symbols of DEGs were uploaded
to DAVID using the ‘RDAVIDWebService’ Bioconductor library
(33), where DEGs were assigned to
relevant GO terms, with subsequent selection of significantly
enriched GO terms from the GO-BP direct database. The P-values of
the selected GO terms were corrected using Benjamini-Hochberg
procedure and were described as adjusted P-values (34). Relevant GO ontological groups with
adjusted P<0.05 and N/group >5 were visualized using a bubble
plot. Detailed analysis of genes belonging to selected ontological
groups, with their fold-change in expression, were presented as
Circos plots using the ‘GOplot’ library (35).
Gene Set Enrichment Analysis
(GSEA)
GSEA was used to determine enrichment or depletion
in gene expression between two biological groups within gene sets
defined a priori (GO terms, pathways). The
Kolmogorov-Smirnov statistical test was used to identify
significantly enriched or depleted groups of genes (36). GSEA was conducted using the ‘fgsea’
library (37). The normalized
fold-change values of all the genes in the microarray were
log2-transformed. A predefined gene set from the GO-BP database
(from the Molecular Signatures Database) was selected (38). Genes belonging to the selected set
were ranked according to the difference in their expression level
using the signal-to-noise ratio with a 10,000-fold permutation. The
enrichment score was calculated for each selected gene set
(39). These scores were
normalized by their gene set size, and false-positives were
corrected according to their FDR. Gene sets with an adjusted
P<0.1 were exported to Cytoscape v.3.7.2 to generate links
between significantly enriched processes in the form of an
enrichment map (40). Enriched
terms were clustered and annotated using the AutoAnnotate v.1.3.2
Cytoscape plugin (41).
Identification of common
mitotane-regulated genes in all experimental models
To identify common mitotane-regulated genes, DEGs in
≥1 cell type were selected according to the aforementioned cut-off
criteria, with the additional requirement that their fold-change
values in other comparable groups were >1.2. This selection was
carried out in the R statistical programming language. The
expression values for the gene sets were transformed into z-scores,
hierarchically clustered and visualized as heat maps using the
pheatmap library (42). To
determine the BPs regulated by mitotane, enrichment analysis was
performed in the relevant ontological groups from the DAVID
Bioinformatics Resources 6.8 tool with the GOTERM BP DIRECT
database (https://david.ncifcrf.gov/tools.jsp). The procedure
was performed as aforementioned. Relevant GO ontological groups
with n/group >3 were visualized using a bubble plot.
Interactions between individual genes and relevant GO terms were
evaluated using Cytoscape v.3.7.2.
Clinically significant
mitotane-affected genes regulated in the studied cells
Clinical descriptions with RNA sequencing data from
94 cases of ACC and 470 cases of skin cutaneous melanoma (SKCM)
were downloaded from the public The Cancer Genome Atlas (TCGA)
database using the FireBrowse server (http://gdac.broadinstitute.org/) (43). Next, the ‘voom’ algorithm from the
‘limma’ package was used for data normalization (31). Normalized data for common
mitotane-regulated genes were extracted from the whole dataset. The
obtained expression set was divided into two separate populations
using median values as the cut-off point: Genes with expression
above and below the median value were assigned to the high or low
expression group, respectively. The hazard ratio (HR) value of the
selected genes was calculated using Gene Expression Profiling
Interactive Analysis 2 software (44). Genes with a statistically
significant HR in ACC and SKCM underwent Kaplan-Meier survival
analysis. Survival plots with log-rank P-value estimates were
performed using the ‘survival’ R library (45) based on mortality events described
in the clinical records.
Statistical analysis
The statistical analysis of microarray data was
described in detail in previous subsections. All other data were
statistically analyzed using GraphPad software v.5.0 (GraphPad
Software, Inc.). All experiments were performed ≥3 times. Results
are presented as the mean ± standard deviation. Differences between
two groups were analyzed using an unpaired Student's t-test
(treated cells were compared with the control). P<0.05 was
considered to indicate a statistically significant difference.
Results
Mitotane administered in a wide
concentration range (10–80 µM) inhibits the proliferation of
primary melanoma cells, and of the WM226-4 melanoma and HAC15 ACC
cell lines
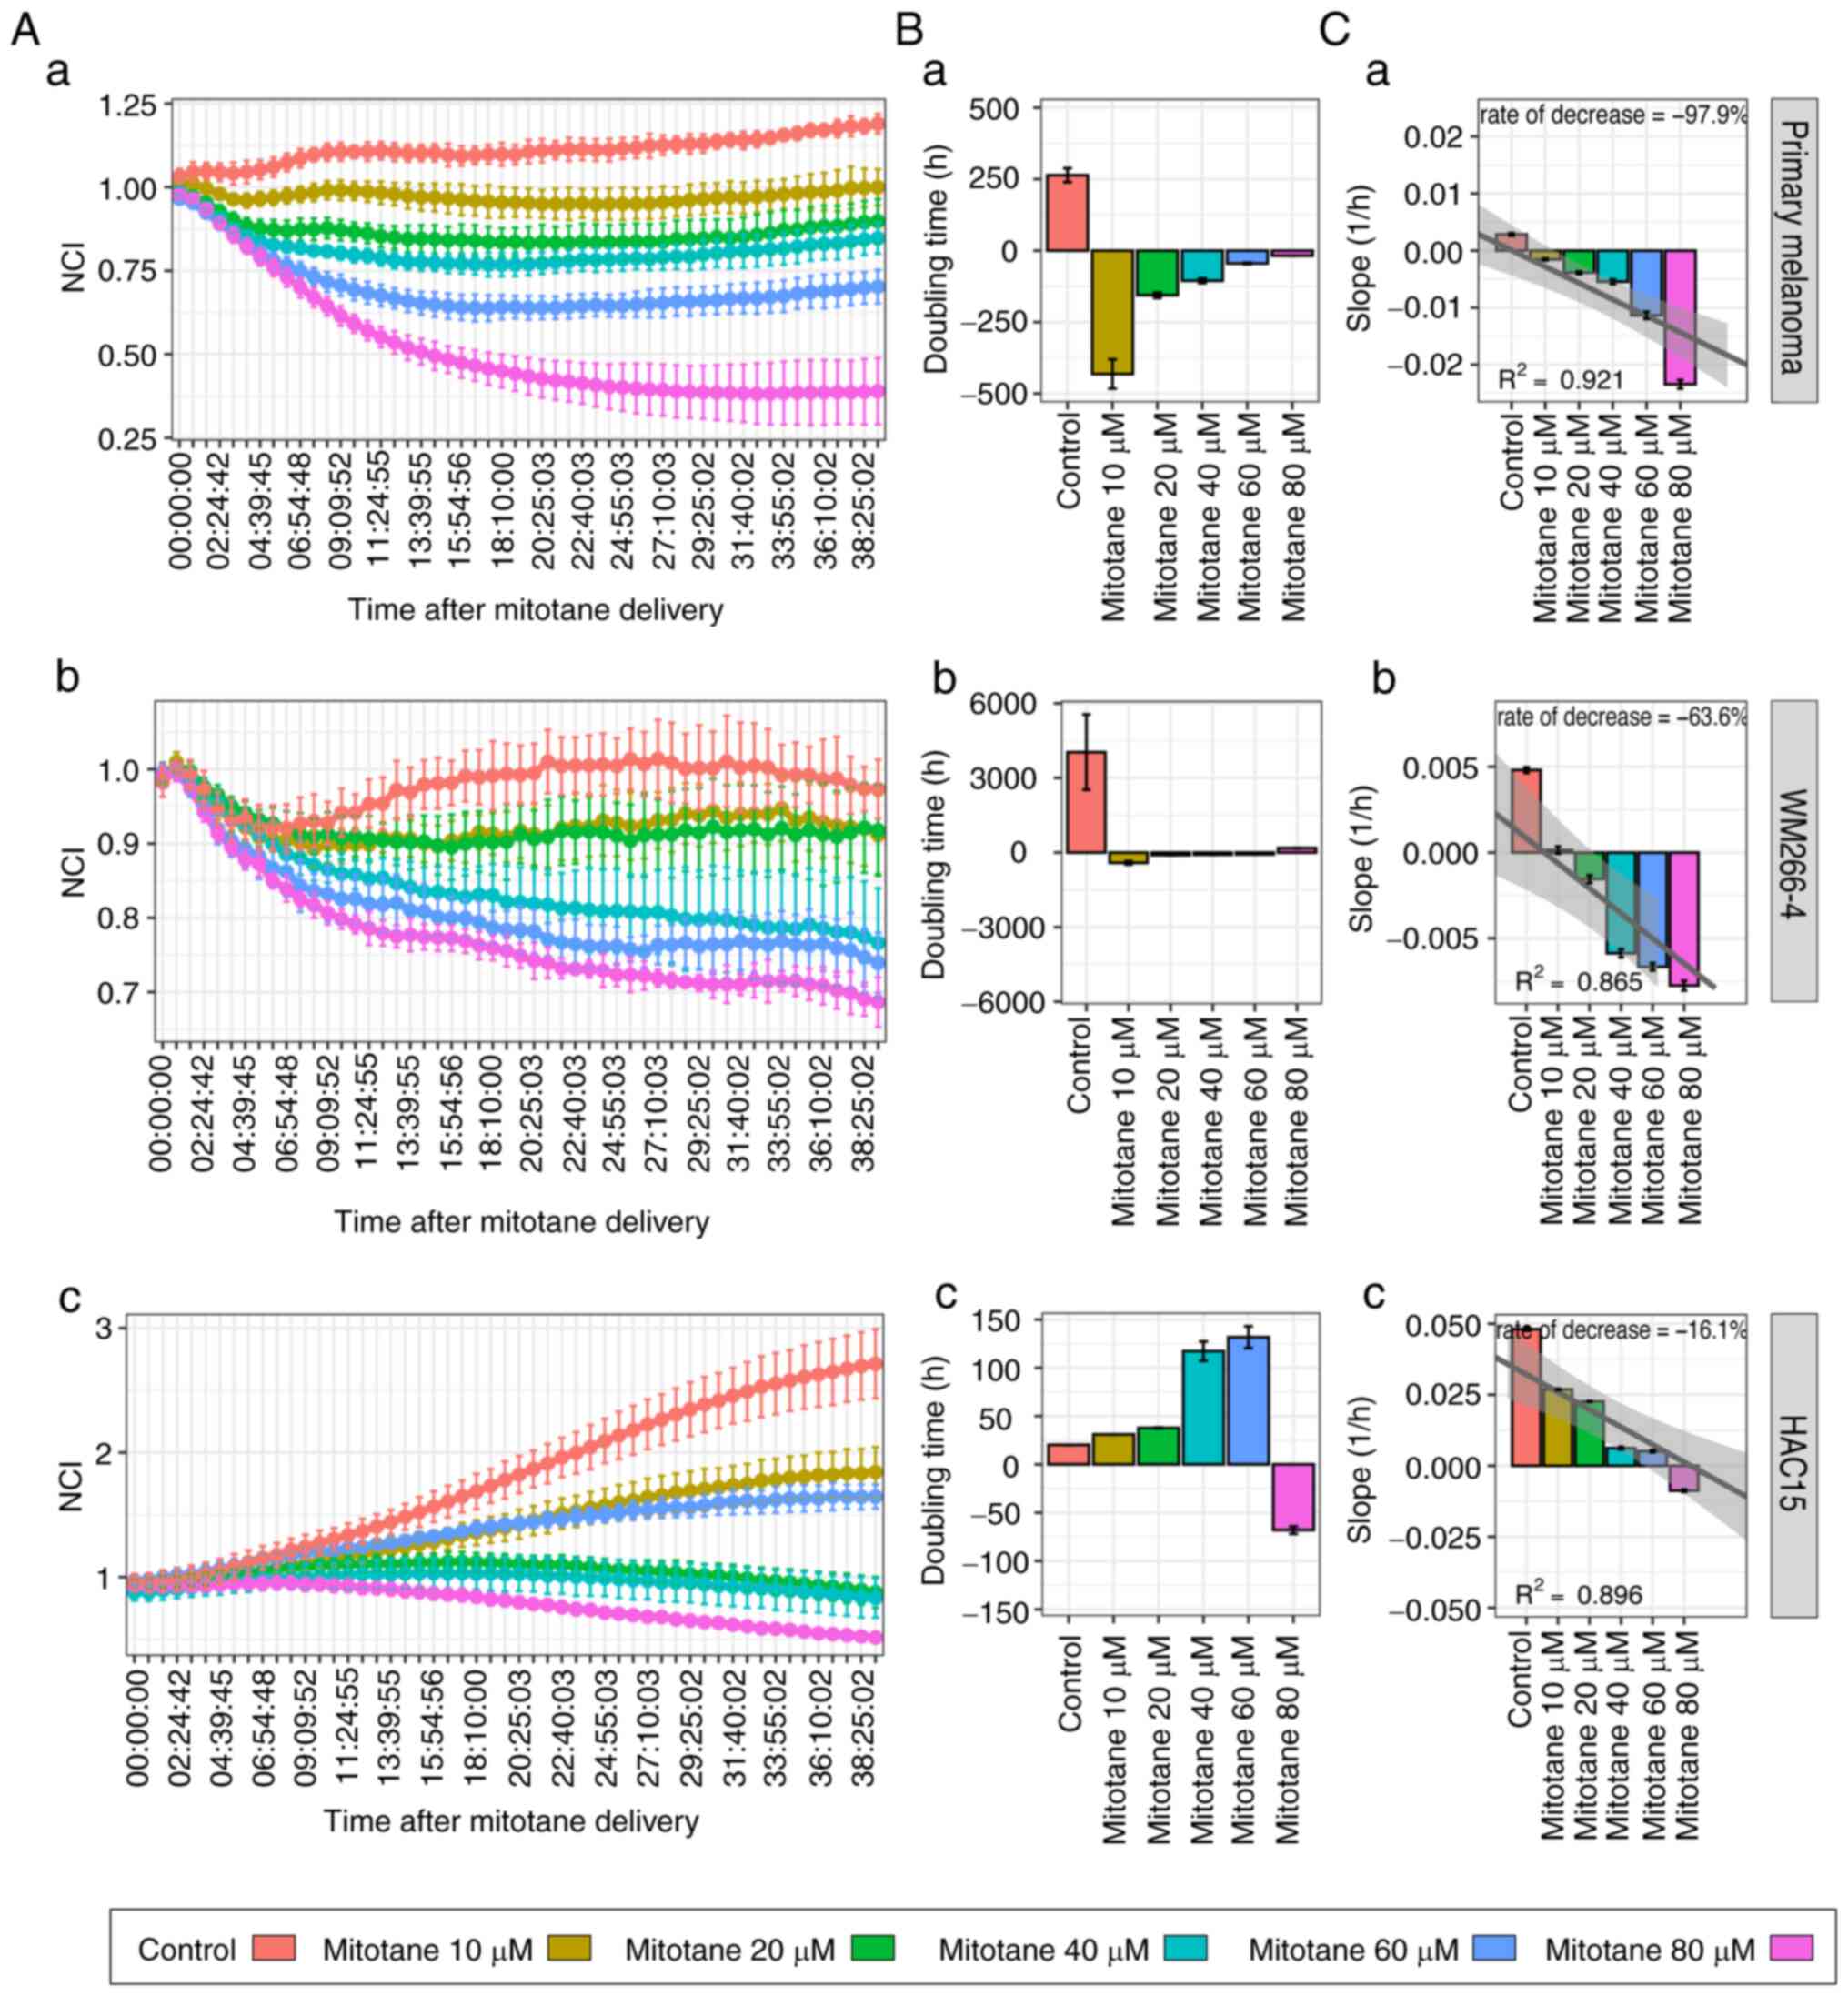
The effect of a wide concentration range (10–80 µM)
of mitotane on the proliferation of primary melanoma, WM266-4 and
HAC15 cells was determined by measuring the impedance of
proliferating cells. As shown in Fig.
1A, mitotane inhibited primary melanoma, WM226-4 and HAC15 cell
proliferation in a dose-dependent manner. The proliferation growth
curve profile based on data collected from the first 24 h of
culture after mitotane administration showed that mitotane
increased the doubling time of primary melanoma cells at each of
the evaluated doses (Fig. 1B). The
doubling time increased as the dose increased, confirming the
dose-specific effect of mitotane on the cultured cell population.
HAC15 cells continued to proliferate at mitotane doses ranging from
10 to 80 µM, but required a much longer time to double the cell
population compared with that of the controls. A linear regression
model was then used to calculate the proliferation decrease rate.
The proliferation profile of primary melanoma cells decreased the
most with increasing doses (decrease rate, 97.9%), followed by that
of the melanoma cell line (63.6%). A relatively small
dose-dependent decrease in cell proliferation was observed in HAC15
cells (decrease rate, 16.1%) (Fig.
1C).
Mitotane at a dose of 50 µM leads to
necrosis and cell cycle arrest in G1 phase in the cell
lines evaluated
First, it was confirmed that the mitochondrial
membrane potential decreased in both HAC15 and WM266-4 cells after
24 h of incubation with mitotane [~0.64 fold-change (P<0.05) and
~0.76 fold-change (P<0.001), respectively] (Fig. 2A). The slight changes observed in
the primary melanoma cell line (~0.94 fold-change) were not
statistically significant.
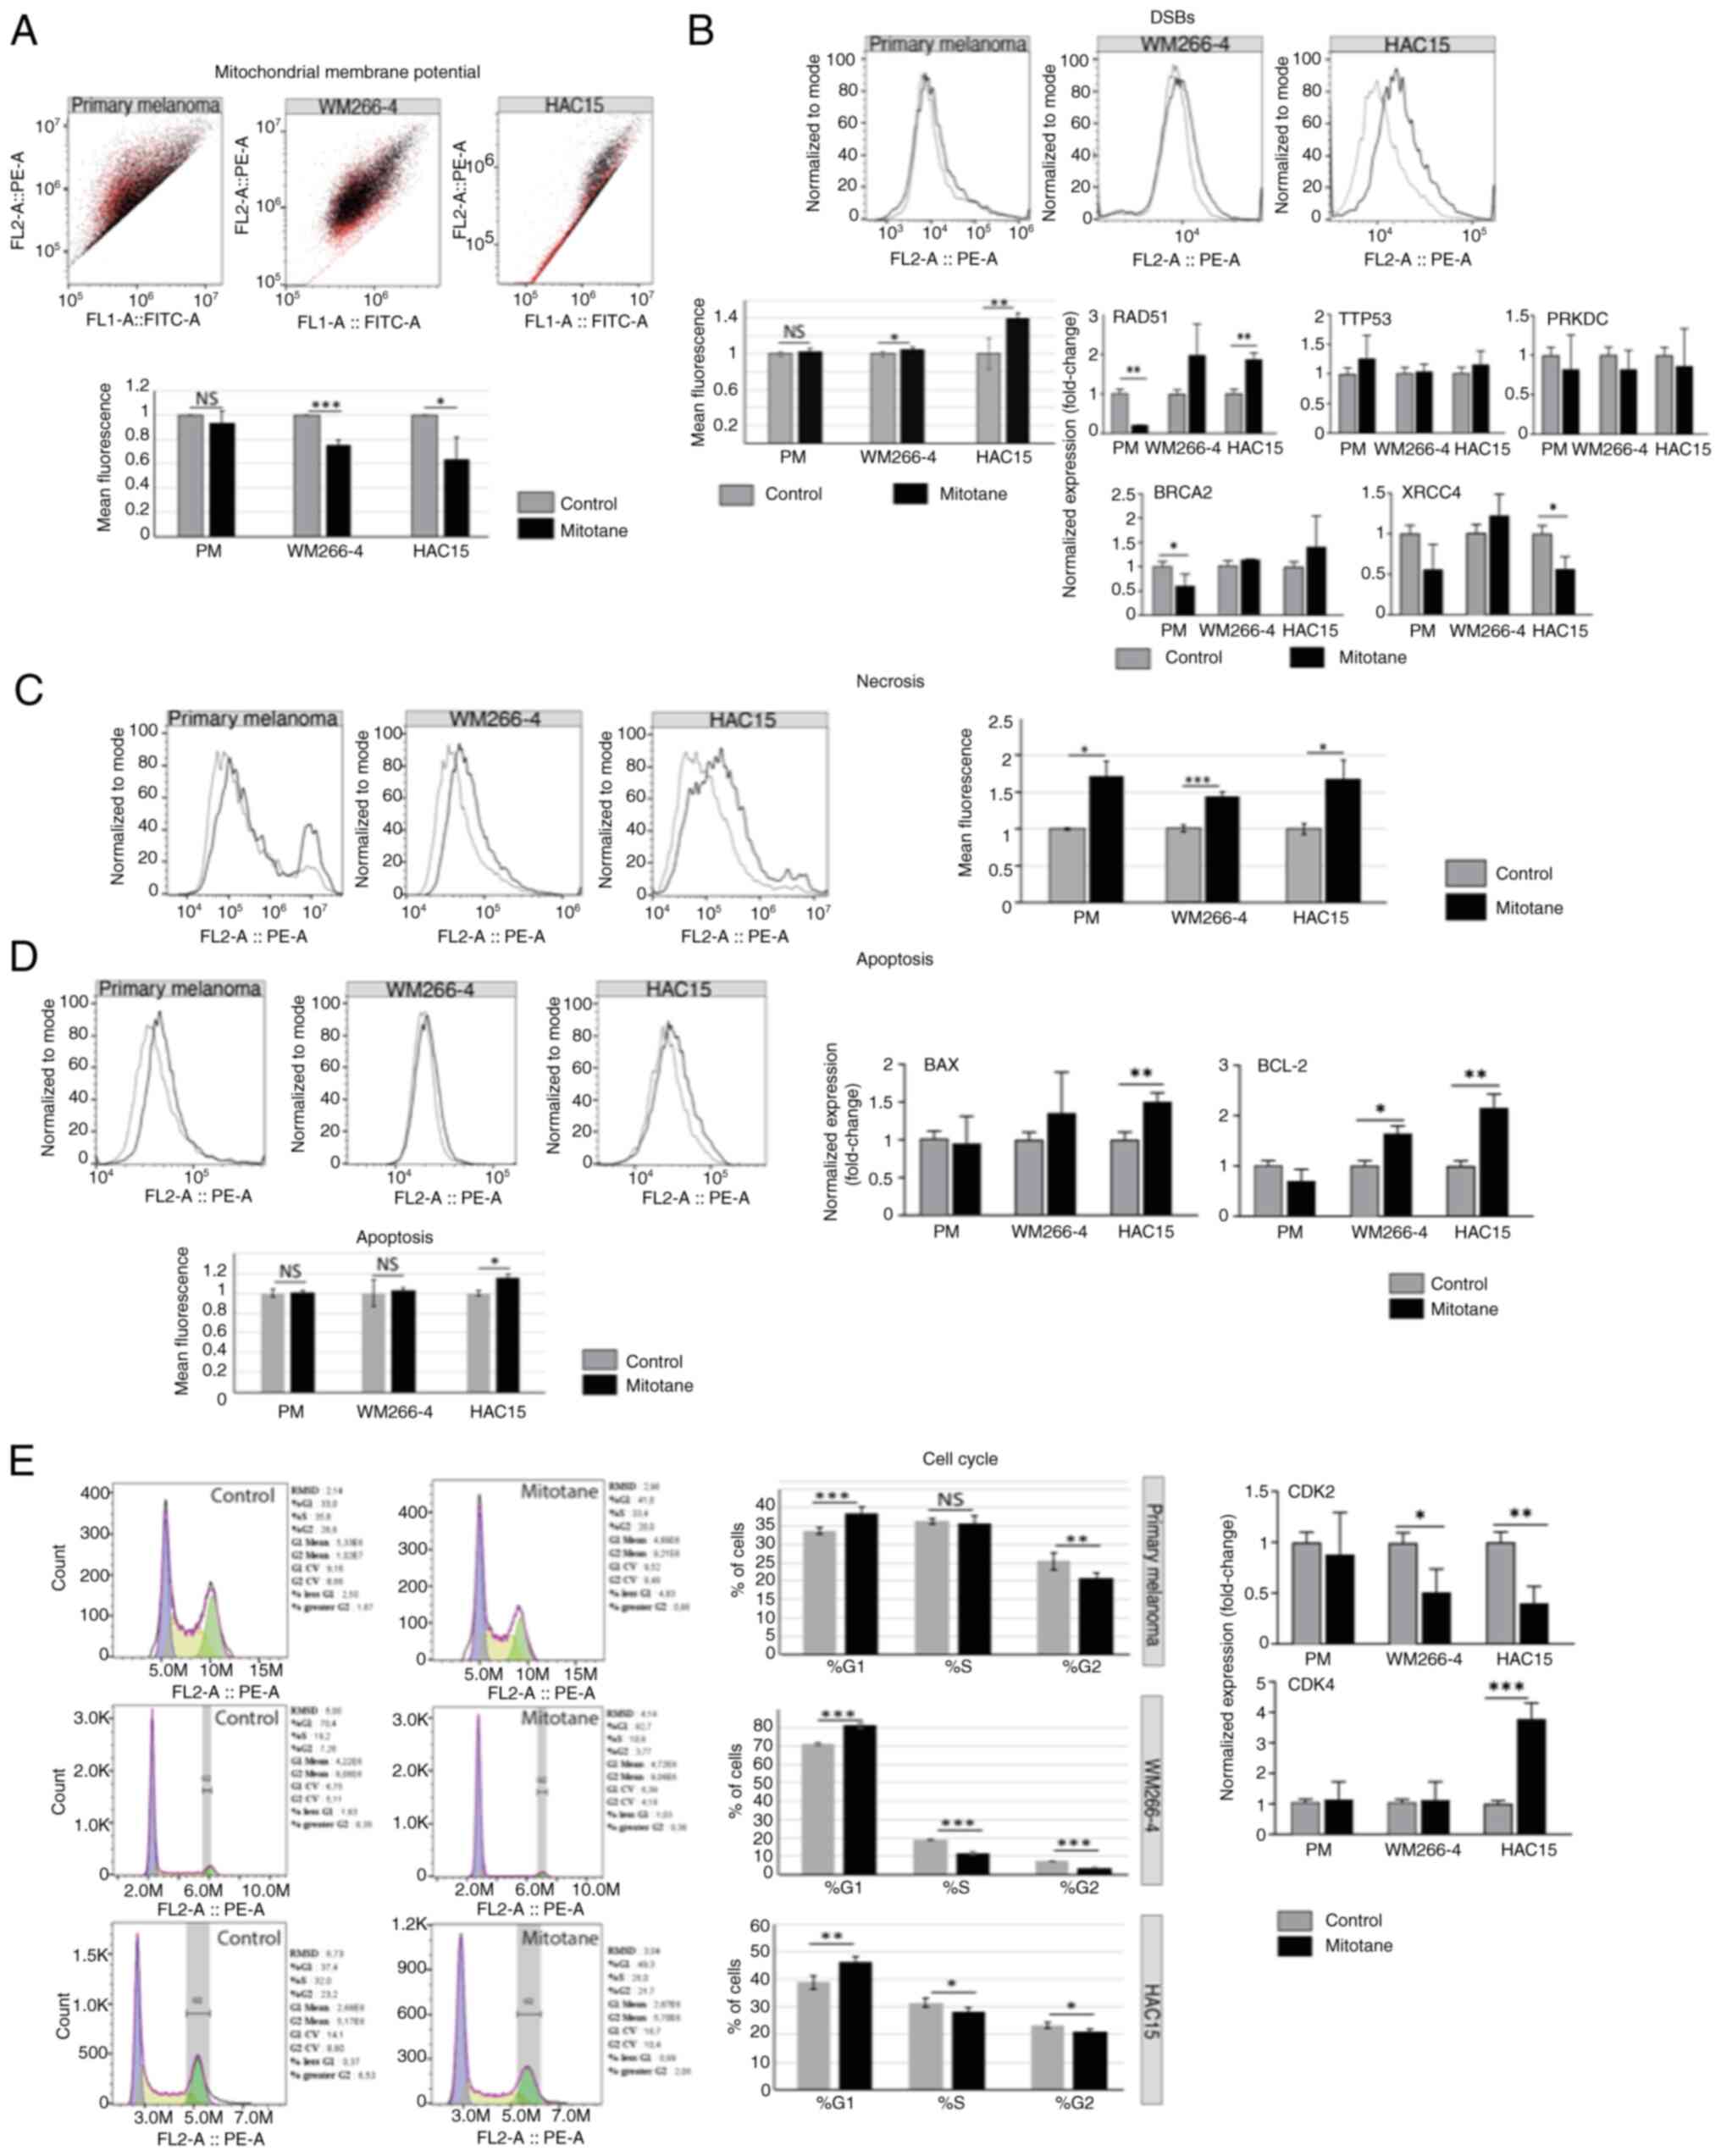 | Figure 2.Effect of mitotane on mitochondrial
membrane potential. (A) The black and red colors reflect the
changes shown in the chart below, where the black color corresponds
to the untreated control and the red color indicates changes in red
fluorescence after mitotane treatment. In the WM266-4 and HAC15
cell lines, significant changes in red fluorescence were observed
(P<0.001 and P<0.05, respectively). By contrast, primary
melanoma cells showed no significant changes in fluorescence
intensity. (B) The most significant change in DSBs (as reflected
γH2AX expression) was observed in the HAC15 cell line (~40%
increase; P<0.01). The WM266-4 cell line also showed a notable
increase in DSBs formation (~10%; P<0.05). Primary melanoma
cells showed no significant change in the number of DSBs. Analysis
of the expression of genes involved in DNA damage response showed
that the HAC15 cell line may promote homologous recombination
(RAD51, ~1.85 fold-change). Primary melanoma cells showed decreased
gene expression of BRCA2 (~0.6 fold-change) and RAD51 (~0.2
fold-change). No significant changes in gene expression of TTP53 or
PRKDC were observed in any of the cell types evaluated. (C) In all
the investigated cell types, an elevated level of necrosis was
observed: ~72% (primary melanoma), ~44% (WM266-4) and ~60% (HAC15).
(D) Apoptosis was analyzed via flow cytometry detecting cleaved
PARP-1. The HAC15 cell line presented significantly higher levels
of pro-apoptotic markers (BAX) and antiapoptotic markers (BCL-2)
compared with those of other cell types. Specifically, BAX and
BCL-2 gene expression was significantly increased in HAC15 cells
(~1.5 and ~2.16 fold-change, respectively). The WM266-4 cell line
also showed an elevated level of BCL-2 gene expression (~1.61
fold-change; P<0.05). (E) All the investigated cell types
(primary melanoma, WM266-4 and HAC15) showed a higher percentage of
cells in the G1 phase of the cell cycle, as follows: From ~33.72 to
~38.53% in primary melanoma cells; from ~71.22 to ~81.15% in
WM266-4 cells; and from ~38.95 to ~46.40% in HAC15 cells. The CDK2
and CDK4 genes showed, respectively, decreased and increased
expression levels. The most notable changes were observed in the
HAC15 and WM266-4 cell lines [CDK2, ~0.4 fold-change (HAC15) and
~0.5 fold-change (WM266-4); and CDK4, ~3.8 fold-change (HAC15)].
Primary melanoma cells did not show a significant change in the
expression of these genes. *P<0.05, **P<0.01, ***P<0.001.
DSB, DNA double-strand breaks; RAD51, RAD51 recombinase; BRCA2,
breast cancer type 2 susceptibility protein; PRKDC, protein kinase,
DNA-activated, catalytic subunit; PM, primary melanoma. |
DSBs were determined after mitotane administration
(50 µM for 24 h), and the results revealed that DSBs were most
abundant in the treated HAC15 cell line (Fig. 2B). A ~40% increase in DSBs was
observed in treated HAC15 cells compared with that in control
cells. In the WM266-4 cell line, a statistically significant
increase of almost 10% in DSBs was also observed (mean fluorescence
values). By contrast, primary melanoma cells did not show changes
in the formation of DSBs after 24 h of exposure to
chemotherapy.
Next, the expression of the key genes involved in
DNA repair as well as DNA damage response (DDR) was analyzed,
including TTP53, RAD51 [homologous recombination (HR)], BRCA2 (HR),
X-ray repair cross complementing 4 (XRCC4) [non-homologous end
joining (NHEJ)] and protein kinase DNA-activated catalytic subunit
(PRKDC) (NHEJ). However, no significant changes in TTP53 expression
in any of the cells evaluated were observed. Notably, after
mitotane treatment, the expression of the RAD51 gene was
significantly higher in the HAC15 cell line (~1.85 fold-change) but
lower in primary melanoma cells, suggesting that these cells may
have distinct DDR mechanisms. BRCA2 gene expression was
significantly decreased only in primary melanoma cells (P<0.05).
The expression of the XRCC4 gene was significantly reduced in HAC15
cells (~0.56 fold-change). No significant changes in the expression
of PRKDC were observed in any of the treated cells.
Next, the type of cell death that was most likely to
be activated after mitotane treatment was determined. The results
indicate that it is probable that all the cells evaluated undergo
necrosis more frequently than apoptosis (based on propidum iodide
and cPARP staining, respectively). In the HAC15 cell line, a ~60%
increase in the number of cells undergoing necrosis was observed.
The WM266-4 cell line also exhibited an elevated level of necrosis
(~44% of the mean fluorescence; P<0.01). A higher level of
necrosis was observed in the primary melanoma cells (~72%) compared
with that observed in the WM266-4 cell line (P<0.05) (Fig. 2C). The only cell line to
demonstrate an elevated level (16%) of apoptosis was HAC15
(P<0.05) (Fig. 2D). Similarly,
the primary melanoma cells appeared to be less sensitive to
mitotane, as evidenced by the absence of apoptosis. To confirm
these results, the expression of the pro-/antiapoptotic genes BAX
and BCL-2 was investigated. In the HAC15 cell line, these genes
showed an elevated expression level in treated cells (~1.5
fold-change for BAX and ~2.16 fold-change for BCL-2) compared with
that of the controls. WM266-4 cells were characterized by greater
expression of the BCL-2 gene (~1.61 fold-change; P<0.05).
Importantly, no significant changes were observed in BAX or BCL-2
gene expression in the primary melanoma cells.
Cell cycle arrest at G1 occurred after
mitotane administration in all the examined cell types, with ≤10%
more cells present in the G1 phase of the cell cycle.
Consequently, a smaller percentage of cells were detected in the S
and G2 phases of the cell cycle. The largest changes
(P<0.001) were observed in the WM266-4 cell line (Fig. 2E). These results were confirmed by
RT-qPCR analysis, which was employed to analyze the expression of
genes involved in the cell cycle (CDK2 and CDK4). An elevated level
of CDK4 gene expression (~3.8 fold-change) was observed in the
HAC15 cells, which is characteristic of the G1 phase.
The expression of the CDK2 gene was also found to be significantly
reduced in the HAC15 and WM266-4 cell lines, with 0.4 and ~0.5
fold-change, respectively. Since CDK2 is responsible for
G1/S and S/G2 transitions (46), the present findings suggest that
mitotane treatment reduces the number of cells in the S and
G2 phases of the cell cycle. No changes were observed in
the primary melanoma cells in terms of the expression of CDK2 or
CDK4. However, cell cycle analysis by flow cytometry indicated
arrest of these cells in the G1 phase of the cell cycle
(with a ~10% increase; Fig.
2E).
Mitotane at a dose of 50 µM
significantly modulates the transcriptomic profile of primary
melanoma, WM226-4 and HAC15 cells
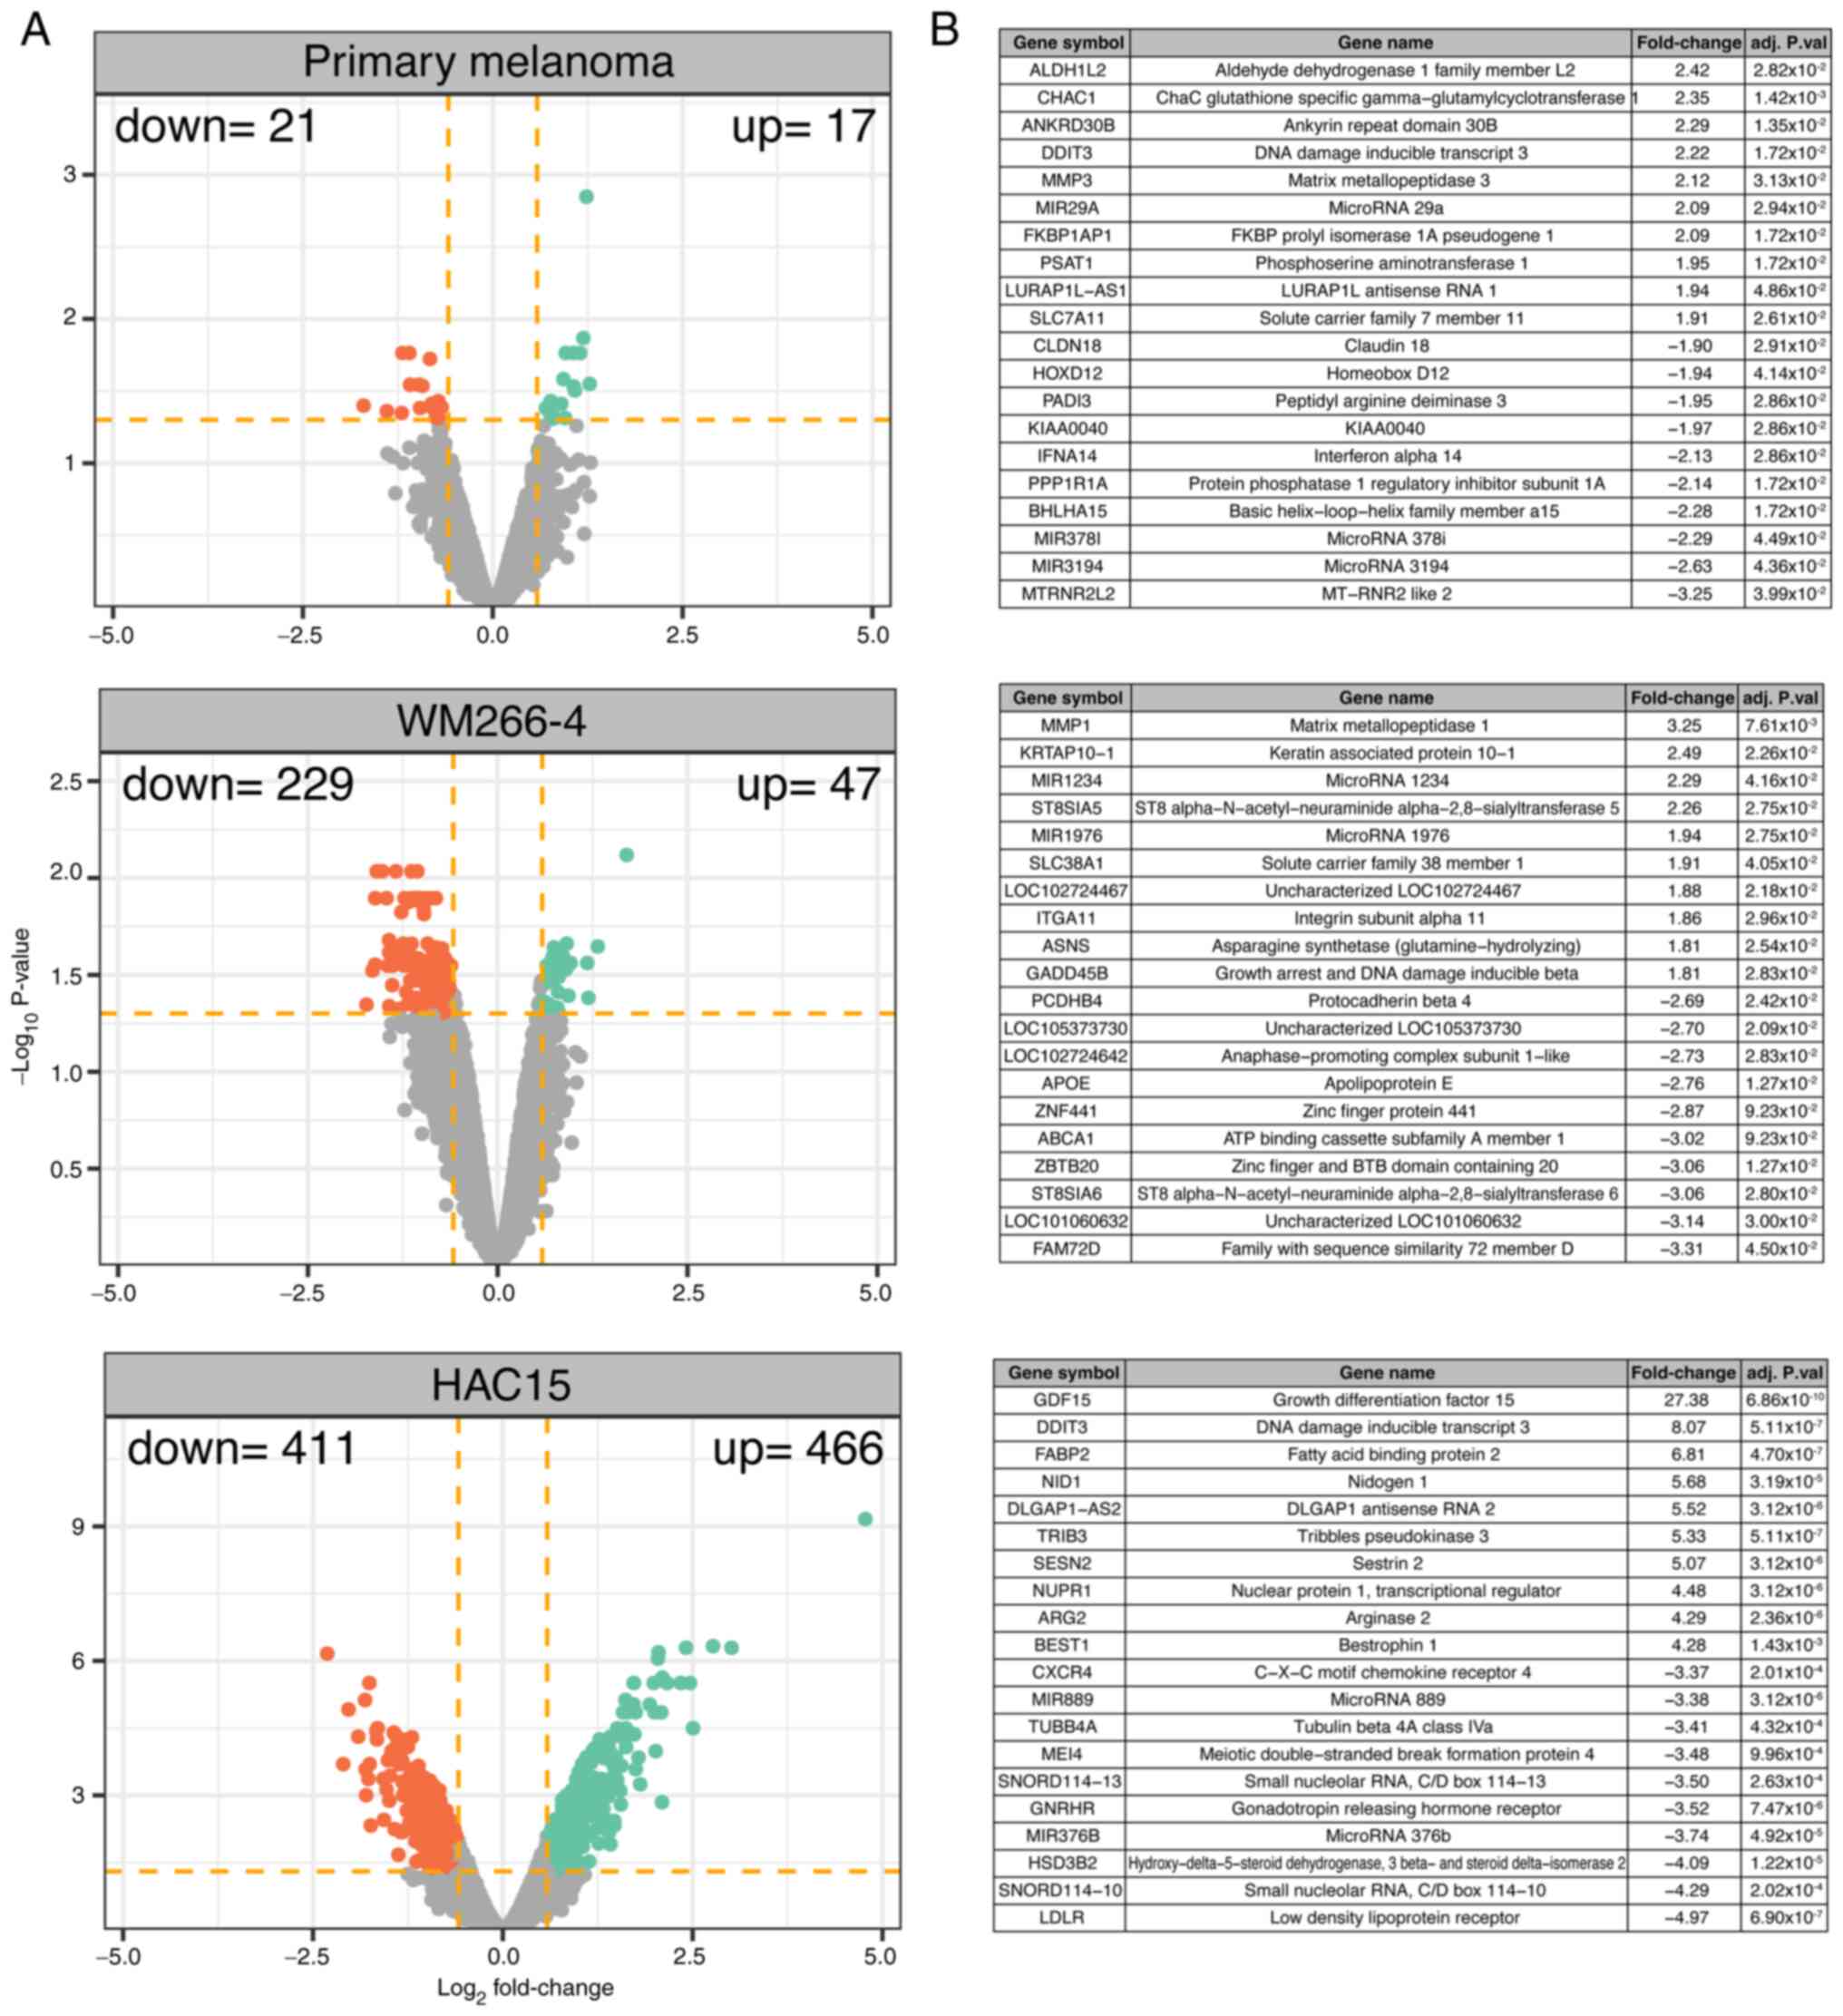
A transcriptome study was carried out after 24 h of
cell incubation with mitotane and the results of the treated cells
were compared with those of the untreated (control) group. The
overall transcriptome profiles are shown as volcano plots in
Fig. 3A. The following DEG
selection criteria were used: |Fold-change| (absolute value)
>1.5 and P-value with FDR correction <0.05. According to the
accepted cut-off criteria, in primary melanoma cells, mitotane
induced a significant decrease in the expression of 21 genes, while
it stimulated the expression of 17 genes. In the WM266-4 cell line,
47 genes were upregulated and 229 genes downregulated. The
strongest effect of mitotane on transcriptome modulation was
observed in HAC15 cells, where mitotane stimulated and inhibited
the expression of 466 and 411 genes, respectively.
The 10 genes with the highest and lowest fold-change
values are presented in a tabular format in Fig. 3B. In primary melanoma cells, this
group of genes includes aldehyde dehydrogenase 1 family member L2
(fold-change=2.42) and mitochondrial MT-RNR2-like 2 gene
(fold-change=−3.25). In the WM266-4 cell line, mitotane most
strongly influenced the expression of the following genes: Matrix
metallopeptidase 1 (fold-change=3.25), zinc finger and BTB domain
containing 20 (fold-change=−3.06) and ST8 α-N-acetyl-neuraminide
α-2,8-sialyltransferase 6 (fold-change=−3.06) (belonging to the
protein family that synthesizes sialyl glycoconjugates), which are
involved in multidrug resistance in cancer cells (47). In the ACC HAC15 cell line, mitotane
significantly stimulated the expression of growth differentiation
factor 15 (fold-change=27.38), a major secretory protein induced by
mitochondrial dysfunction (48),
and DNA damage inducible transcript 3 (DDIT3; fold-change=8.07), an
endoplasmic reticulum stress-induced apoptosis factor (49). In HAC15 cells, mitotane most
potently inhibited the expression of genes involved in adrenal
steroidogenesis, such as low-density lipoprotein receptor
(fold-change=−4.97).
Mitotane at dose of 50 µM exerts a
significant effect on genes involved in the cell division in both
WM266-4 and HAC15 cells
This analysis was performed separately for the
previously obtained DEGs from individual comparisons using the
DAVID bioinformatics tools. The results of this analysis are shown
as bubble plots in Fig. 4A, which
contain only those ontological groups that met the following
criteria: Adjusted P<0.05 and ≥5 genes in the group. In primary
melanoma cells, none of the ontological groups met these criteria;
however, in these cells, only a limited number of DEGs (21
upregulated and 17 downregulated) were used for the analysis. In
the WM266-4 cell line, mitotane inhibited genes belonging to
ontological groups associated with cell proliferation such as
‘GO:0007067~mitotic nuclear division’, (n=17;
P=7.83×10⁻⁶); ‘GO:0007062~sister chromatid cohesion’
(n=12; P=7.83×10⁻⁶); ‘GO:0051301~cell division’ (n=19;
P=1.74×10⁻⁵) and ‘GO:0007059~chromosome segregation’
(n=8; P=0.002). In HAC15 cells, decreased expression was also
observed in genes belonging to proliferation-related ontology
groups, including: ‘GO:0008203~cholesterol metabolic process’ (n=9;
P=4.14×10⁻⁴), ‘GO:0051301~cell division’ (n=24;
P=9.01×10⁻⁵) and ‘GO:0007067~mitotic nuclear division’
(n=19; P=3.11×10⁻⁴). In the HAC15 cell line, mitotane
also stimulated the expression of genes belonging to the following
ontology groups, which are key for the present study due to the
fact that they are directly involved in the processes associated
with the action of cytostatics: ‘GO:0070059~intrinsic apoptotic
signaling pathway in response to endoplasmic reticulum stress’
(n=9; P=0.0003), ‘GO:0034976~response to endoplasmic reticulum
stress’ (n=10; P=0.009) and ‘GO:0070373~negative regulation of ERK1
and ERK2 cascade’ (n=8; P=0.04). A detailed analysis of genes
assigned to several ontology groups is shown in two circos plots in
Fig. 4B. Several of these genes
exhibited expression changes above the cut-off threshold in the two
comparison groups, including DDIT3 (primary melanoma cells:
Fold-change=2.22; HAC15 cells: Fold-change=8.1); kinesin family
member 14 (KIF14; WM266-4 cells: Fold-change=−1.83; HAC15 cells:
Fold-change=−1.64); cyclin A2 (CCNA2; WM266-4 cells:
Fold-change=−1.84; HAC15 cells: Fold-change=−1.62); cyclin
dependent kinase 1 (CDK1; WM266-4 cells: Fold-change=−1.76; HAC15
cells: Fold-change=−1.51) and centromere protein I (CENPI; WM266-4
cells: Fold-change=−1.63; HAC15 cells: Fold-change=−1.74).
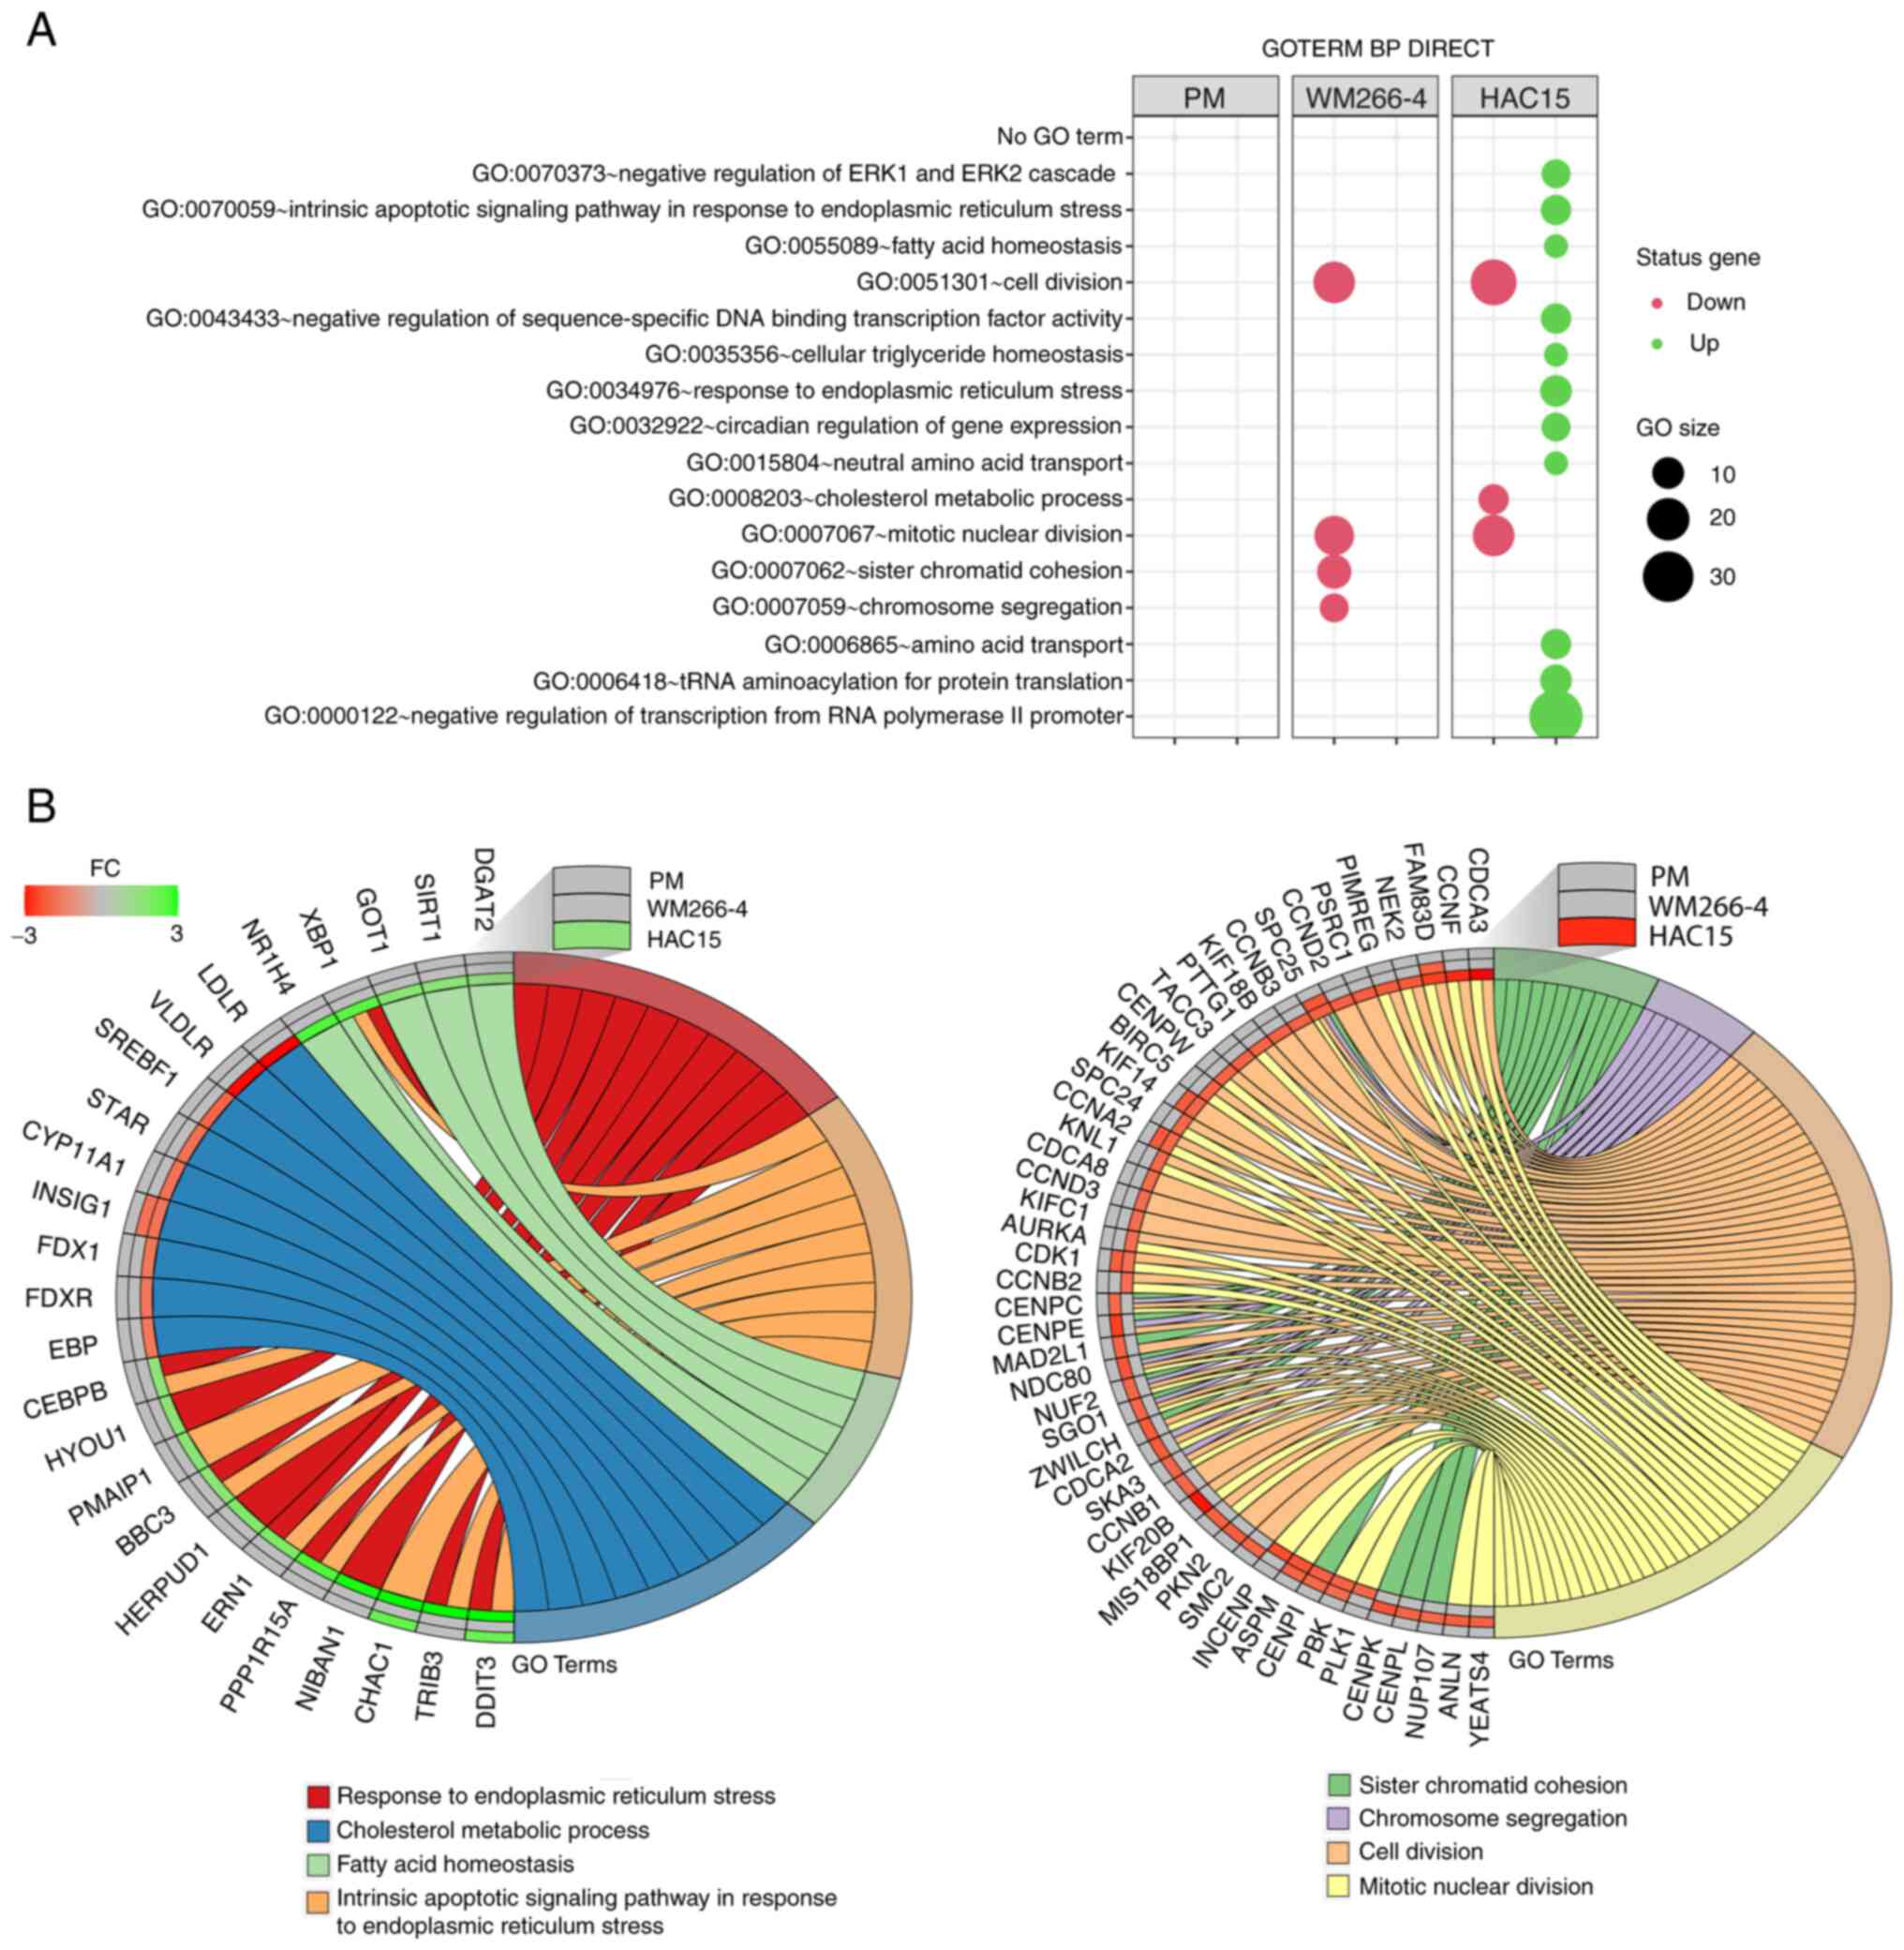 | Figure 4.(A) Bubble plot of DEG sets
overrepresented in the DAVID GO-BP DIRECT database. The graph shows
only the GO terms above the established cut-off criteria (corrected
P<0.05 and >5 genes per group). Each bubble's size reflects
the number of DEGs assigned to the GO-BP terms. The bubble's
transparency displays P-values (more transparent indicates closer
to the P=0.05 cut-off value). The red color indicates downregulated
expression of the genes comprising the relevant GO term, while the
green color indicates upregulation of such genes. (B) Detailed
analysis of eight enriched gene ontological groups selected from
the DAVID GO-BP DIRECT GO database, presented as Circos plots.
Symbols of DEGs are presented on the left side of the graph with
their fold-change values, mapped by color scale, where green
indicates higher expression, red indicates lower expression and
grey indicates expression levels below the cut-off value for a
given cell type. Colored connecting lines determine gene
involvement in the GO terms. GO, Gene Ontology; DAVID, Database for
Annotation, Visualization and Integrated Discovery; BP, biological
process; DEG, differentially expressed gene; PM, primary melanoma;
FC, fold-change. |
Only a relatively limited number of genes involved
in cell proliferation and apoptosis were regulated in a similar
manner by mitotane (regardless of the cell type). Consequently, an
alternative bioinformatic evaluation of transcriptome modulation
was performed by using GSEA. This approach was based on full
transcriptomic profile analysis regardless of the predefined
cut-off criteria (fold-change >2, P<0.05). In this approach,
genes pre-ranked by logarithmic fold-change values were employed to
determine enrichment [positive normalized enrichment score (NES)]
or depletion (negative NES) in the GO-BP database after mitotane
treatment.
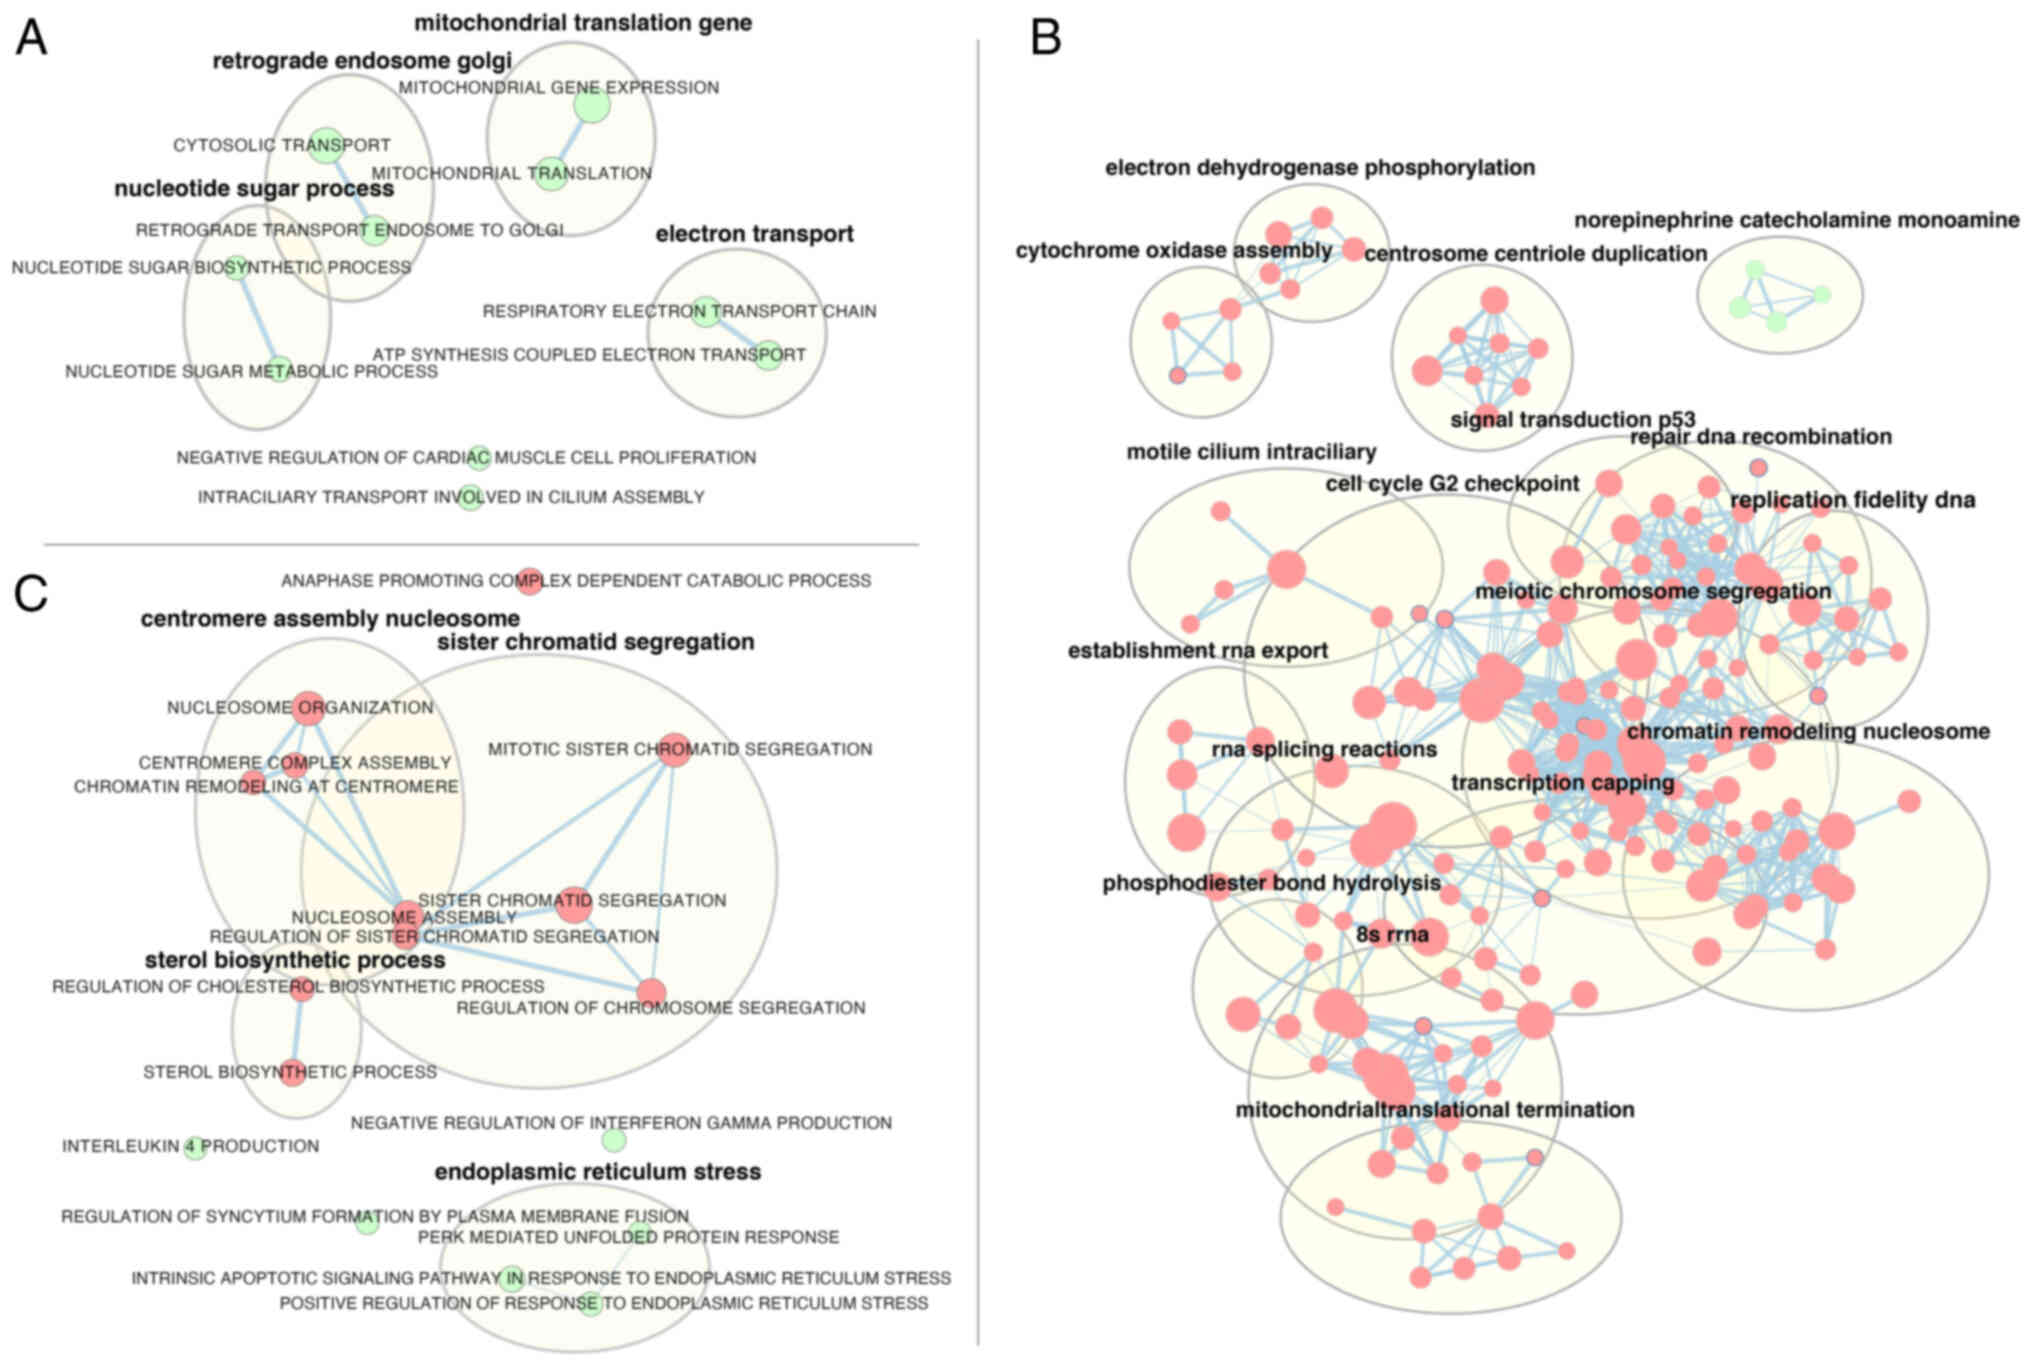
In primary melanoma cells (Fig. 5A), mitotane treatment led, inter
alia, to the enrichment of genes involved in the regulation of
mitochondrial gene expression (‘mitochondrial gene expression’,
NES=1.96; ‘mitochondrial translocation’, NES=2.02), as well as
genes responsible for electron transport (‘respiratory electron
transport’, NES=2; ATP synthesis coupled electron transport,
NES=1.98).
The largest number of significantly regulated
ontology groups obtained with GSEA analysis was observed in the
WM266-4 cell line; thus, only the names of ontology term clusters
obtained by using the AutoAnnotate Cytoscape plugin are shown in
Fig. 5B. The highest absolute NES
values were as follows: ‘Recombinational repair’ (NES=−2.73);
‘double strand break repair’ (NES=−2.65), ‘centromere complex
assembly’ (NES=−2.64) and ‘mitotic sister chromatid segregation’
(NES=−2.63).
Despite using a different methodological approach in
HAC15 cells, the GSEA analysis revealed relatively similar groups
to those shown after the analysis of ontological groups (DAVID),
with enrichment of genes belonging to apoptosis-related ontological
groups, including ‘intrinsic apoptotic signaling pathway in
response to endoplasmic reticulum stress’ (NES=2.1) and ‘positive
regulation of response to endoplasmic reticulum stress’
(NES=2.19).
In HAC15 cells, genes belonging to proliferation and
steroidogenesis-related ontology terms were depleted. The following
groups had the highest absolute NES values: ‘Anaphase promoting
complex dependent catabolic process’ (NES=−2.45), ‘sterol
biosynthetic process’ (NES=−2.24), ‘nucleosome assembly’
(NES=−2.2), ‘regulation of cholesterol biosynthetic process’
(NES=−2.18) and ‘mitotic sister chromatid segregation’ (NES=−2.09)
(Fig. 5C).
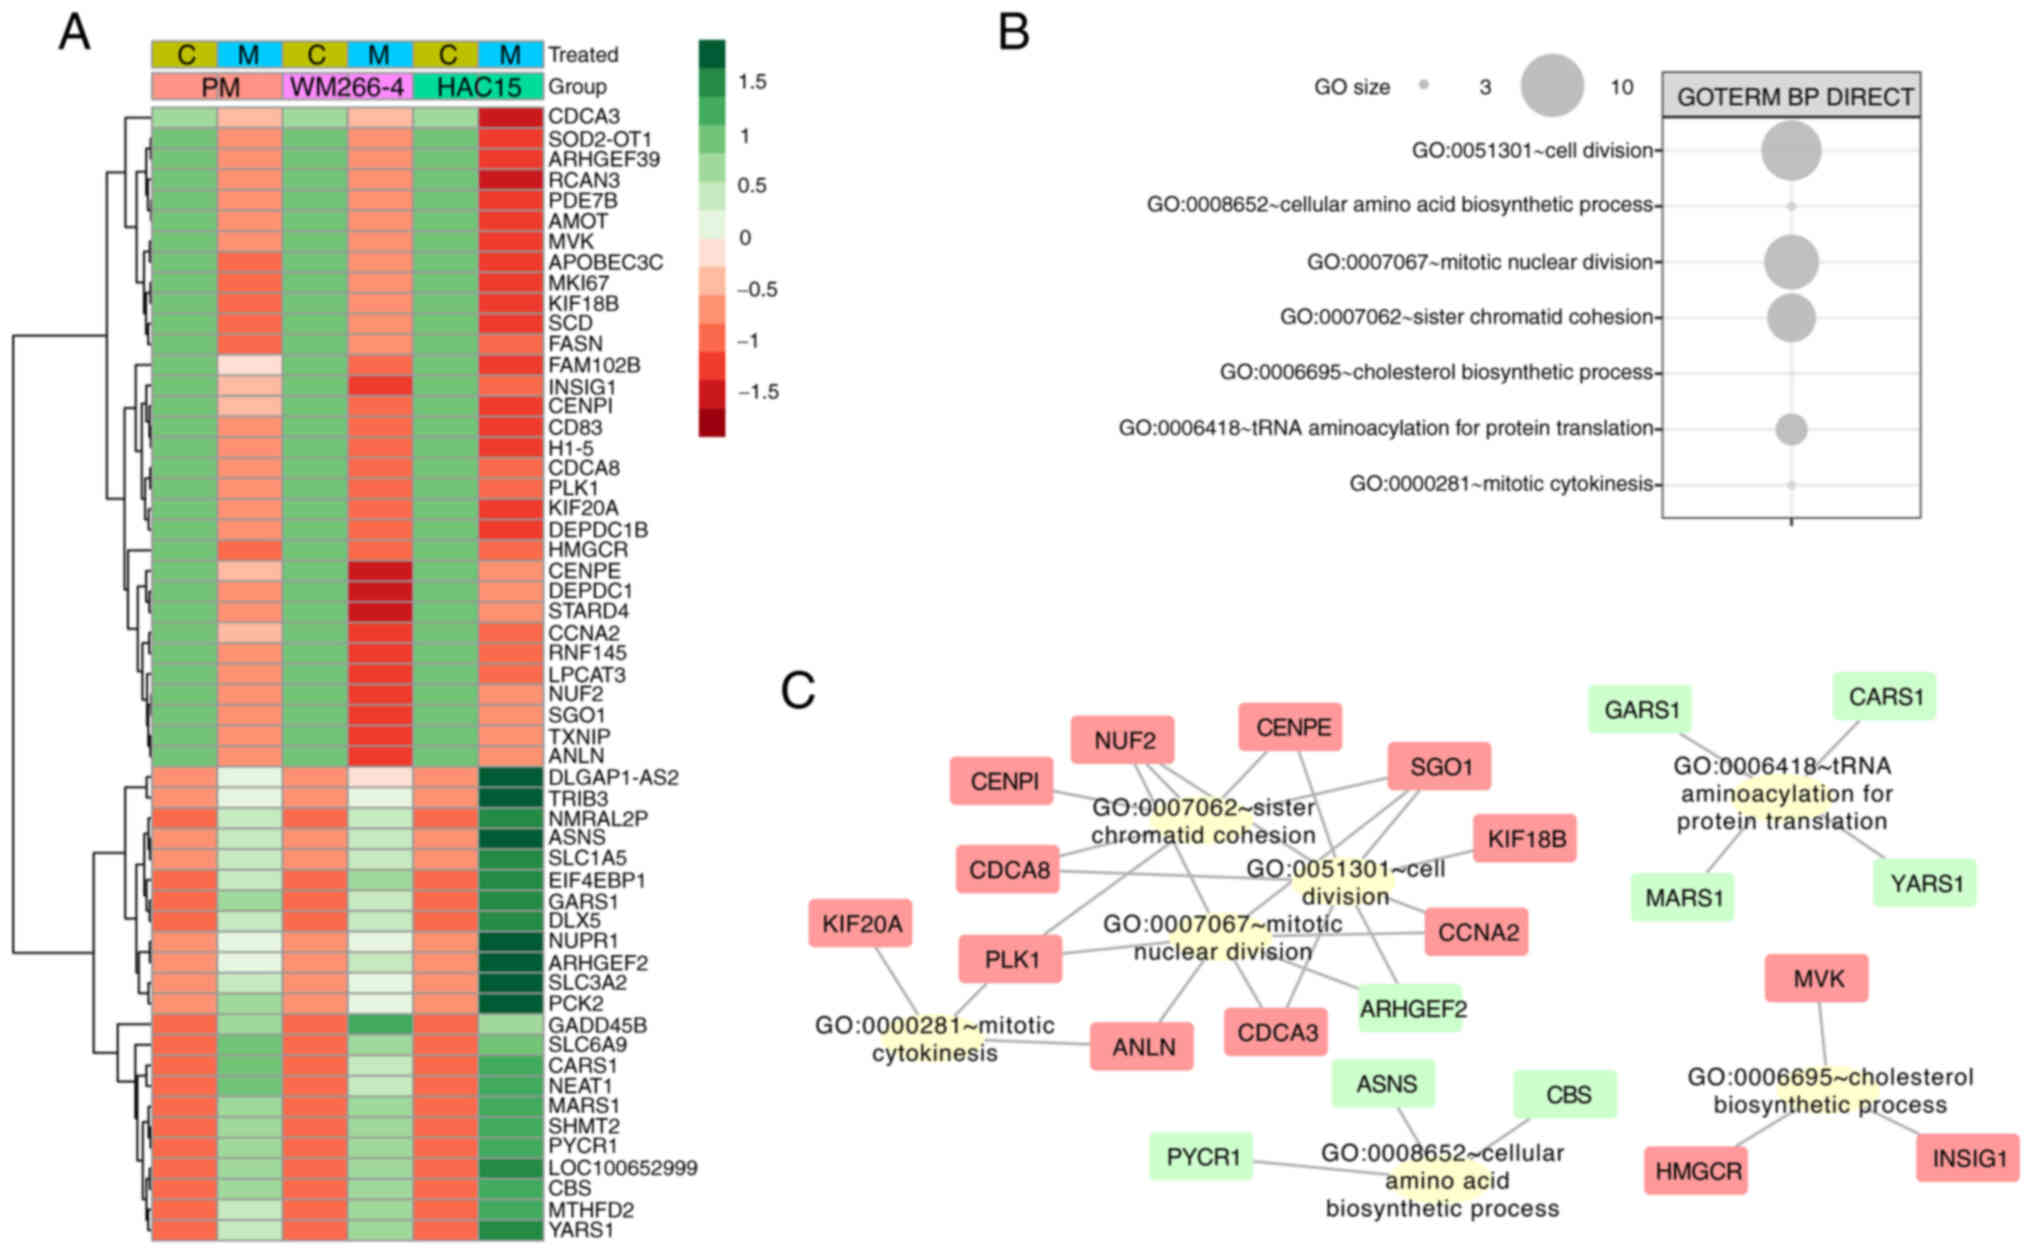
Since the GO analyses performed with DAVID and GSEA
indicated differences between cell types, similar gene regulation
under less restrictive selection conditions was evaluated. Genes
for which the fold-change value for ≥1 group was above the cut-off
value (|fold-change|>1.5), and the fold-change for the other
groups had the same direction (positive or negative) and was within
the range of 1.2 to 1.5 were selected. Fold-change values for these
genes were transformed into z-scores and presented on a heatmap in
Fig. 6A.
To identify the biological role of the selected
genes, another GO analysis was performed using DAVID. Interactions
between individual genes and relevant GO terms were evaluated with
Cytoscape v.3.7.2. The largest cluster of ontology terms involved
processes associated with cell division (‘sister chromatid
cohesion’, ‘cell division’, ‘mitotic nuclear division’, ‘nuclear
division’ and ‘mitotic cytokinesis’), where most genes were
downregulated (Fig. 6B). The
ontological groups included the following genes: KIF20A (primary
melanoma cells: Fold-change=−1.41; WM266-4 cells:
Fold-change=−1.67; HAC15 cells: Fold-change=−2.1), polo like kinase
1 (PLK1; primary melanoma cells: Fold-change=−1.32; WM266-4 cells:
Fold-change=−1.45; HAC15 cells: Fold-change=−1.62), cell division
cycle associated 8 (CDCA8; primary melanoma cells:
Fold-change=−1.22; WM266-4 cells: fold-change=−1.42; HAC15 cells:
Fold-change=−1.54), CENPI (primary melanoma cells:
Fold-change=−1.24; WM266-4 cells: Fold-change=−1.63; HAC15 cells:
Fold-change=−1.74), shugoshin 1 (SGO1; primary melanoma cells:
Fold-change=−1.23; WM266-4 cells: Fold-change=−1.66; HAC15 cells:
Fold-change=−1.24), KIF18B (primary melanoma cells:
Fold-change=−1.38; WM266-4 cells: Fold-change=−1.21; HAC15 cells:
Fold-change=−1.7), CCNA2 (primary melanoma cells:
Fold-change=−1.23; WM266-4 cells: Fold-change=−1.83; HAC15 cells:
Fold-change=−1.62), Rho/Rac guanine nucleotide exchange factor 2
(primary melanoma cells: Fold-change=1.24; WM266-4 cells:
Fold-change=1.39; HAC15 cells: Fold-change=3.3) and cell division
cycle-associated 3 (primary melanoma cells: Fold-change=−1.2;
WM266-4 cells: Fold-change=−1.27; HAC15 cells: Fold-change=−2.5)
(Fig. 6C).
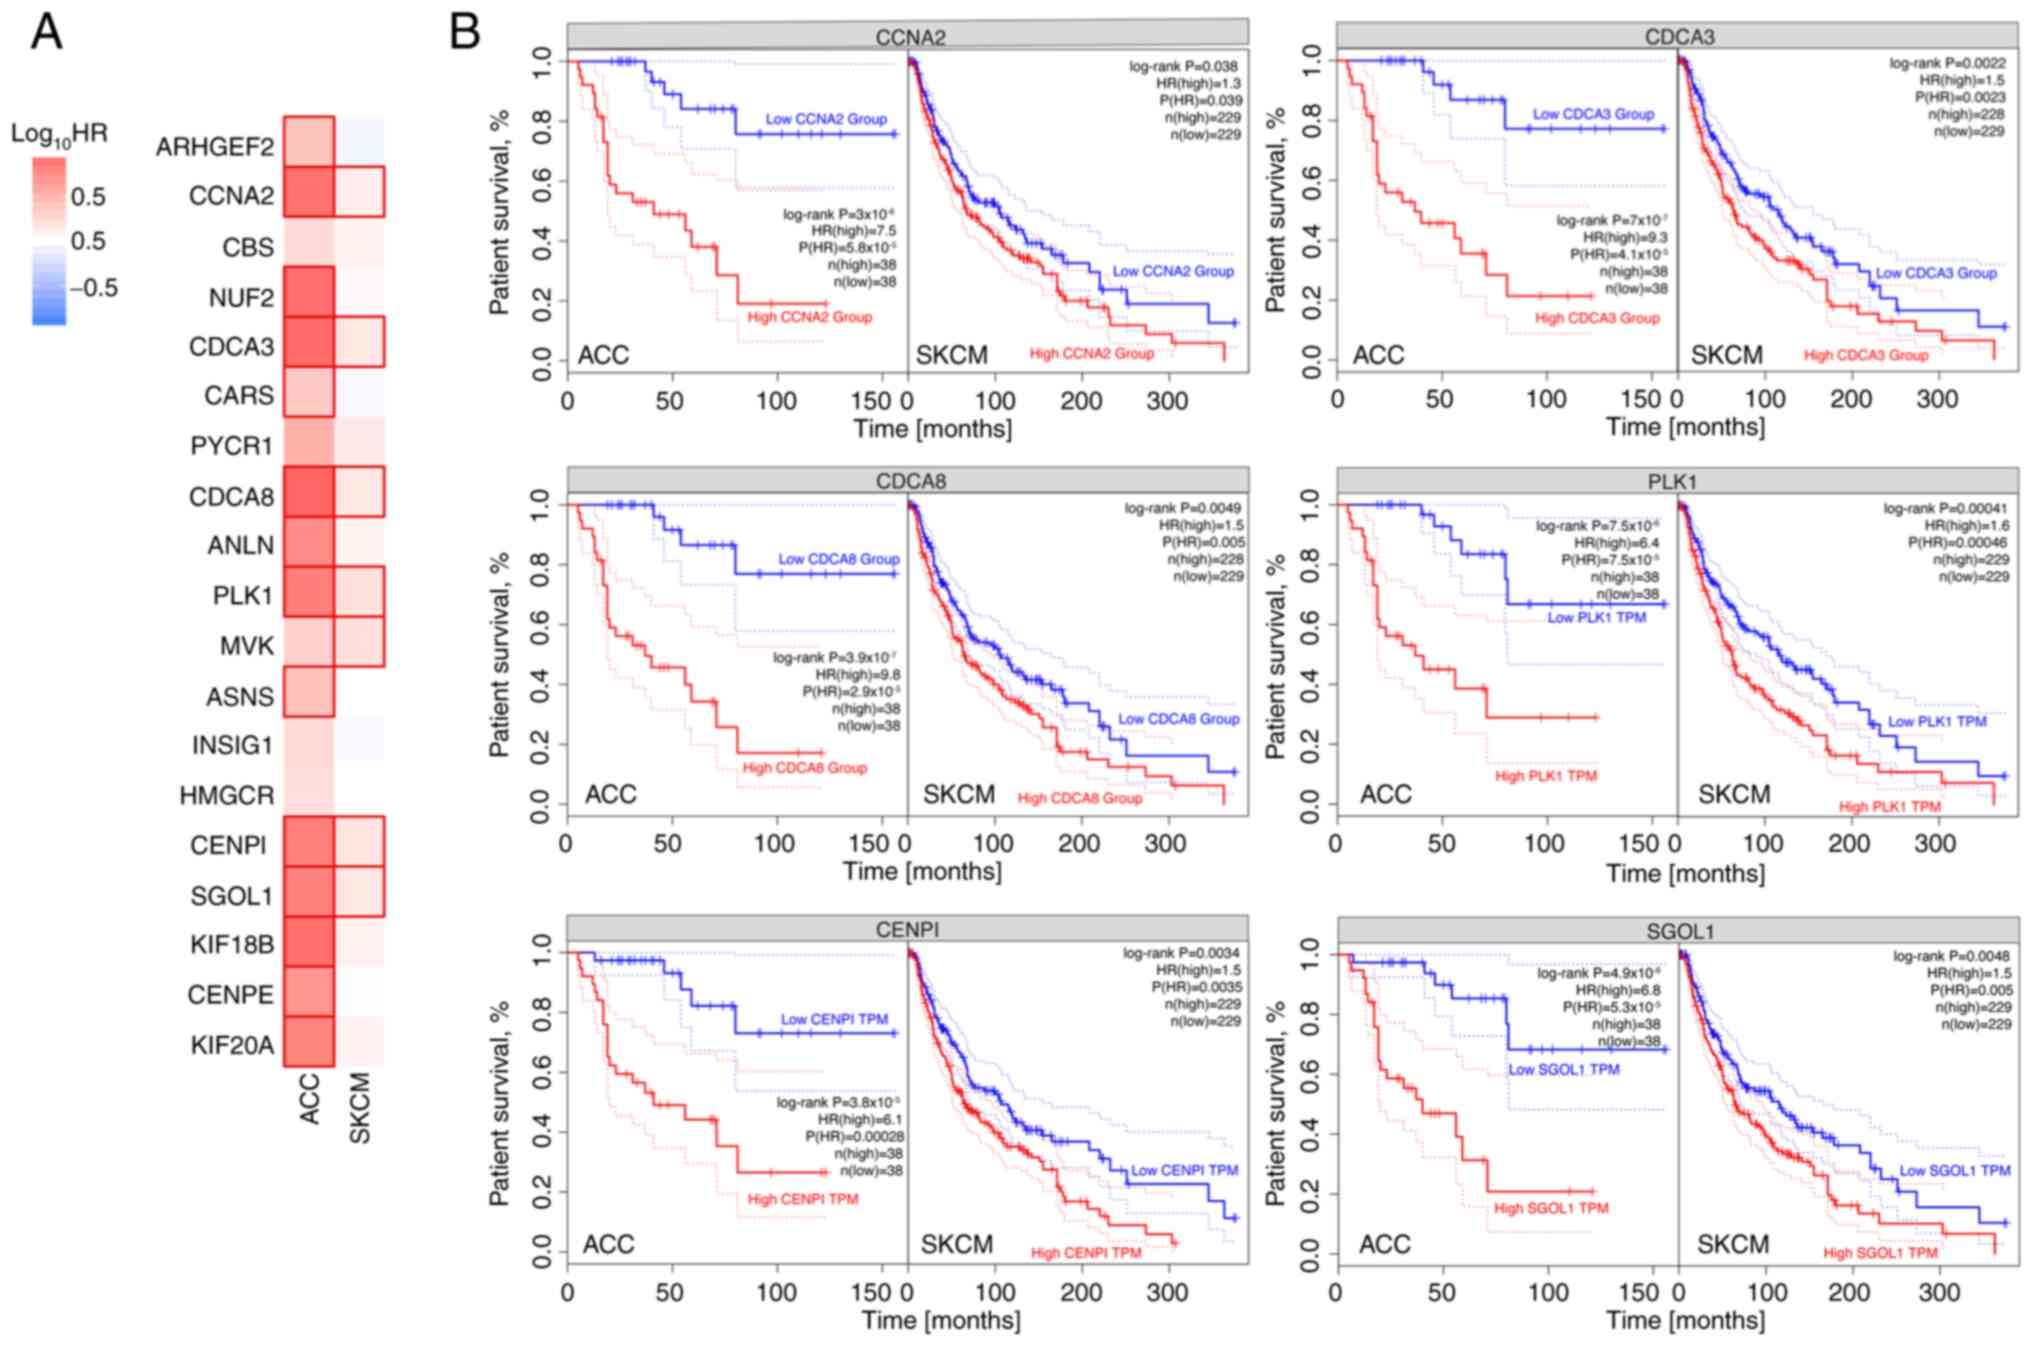
The hypothesis that there may be a link between the
expression of a potential biomarker and disease progression was
verified using expression data from TCGA database (94 and 470 cases
of ACC and SKCM, respectively), which were analyzed for the
predictive significance of genes commonly regulated by mitotane.
Fig. 7 shows genes for which
elevated expression may be a negative predictor of tumour
progression for both ACC and SKCM. These genes include CCNA2,
CDCA3, CDCA8, PLK1, CENPI and SGOL1.
Discussion
In our previous study (17), a patient was diagnosed with
metastatic melanoma in the left adrenal gland of unknown primary
origin and received mitotane treatment. On follow-up, there was no
sign of recurrence in the adrenal bed. At the 3-month follow-up
after mitotane withdrawal, multiple metastases were identified.
Thus, in the present study, experiments were conducted on an in
vitro model using HAC15 (adrenal carcinoma) and WM266-4
(metastatic melanoma) cell lines, and a primary melanoma cell line
derived from the previously described patient (17). The current study had three main
aims: i) To evaluate the impact of mitotane on the proliferation
rate of the investigated cells; ii) to examine the expression of a
wide panel of proteins and genes involved in DDR mechanisms; and
iii) to investigate the gene expression profile of the treated
cells.
The HAC15 cell line constitutes a suitable model for
defining the molecular mechanisms regulating aldosterone and
cortisol production, and can be applied to studies on normal
adrenal cell function or ACC (50). Furthermore, unlike the commonly
used NCI-H295R cell line, the HAC15 cell line responds to
stimulation with all major adrenal secretagogues such as
angiotensin II, K+ and adrenocorticotropic hormone
(ACTH), which lead to the stimulation of adrenal hormone
biosynthesis (51). Thus, this
cell line appears to closely reflect adrenal physiology and is
widely used in research. Additionally, the present microarray
results confirm the high expression of key adrenal steroidogenesis
genes in the HAC15 line, as well as its susceptibility to ACTH and
forskolin stimulation (26).
Poli et al (52) cultured NCI-H295R cells in the
presence of increasing concentrations of mitotane. Treatment with
mitotane reduced cell numbers in a dose- and time-dependent manner,
which was attributed to an inhibitory effect on cell viability and
proliferation. The data showed that mitotane levels in the
therapeutic window (30–50 µM) exerted a cytotoxic effect that was
associated with the inhibition of cell proliferation. The present
study has also demonstrated that mitotane reduces the proliferation
rate of both ACC and melanoma cells (Fig. 1). This effect was dose-dependent
(10–80 µM) and particularly noticeable in primary melanoma cells,
where inhibition of proliferation was evident even at low
concentrations of mitotane. After changing the medium (in the
control group) or administering the drug under investigation, a
rapid decrease in impedance is commonly observed, which then
stabilizes. Additionally, in the case of WM266-4 cells, the graph
shows a smaller range on the y-axis, which leads to the formation
of a less pronounced proliferation curve at the individual
values.
Seidel et al (53) generated a mitotane-resistant HAC15
cell line, and found that resistant clones had the ability to
maintain normal mitochondrial and nucleolar morphology during
treatment. Resistance was attributed to, among other factors,
altered intracellular lipid homeostasis and decreased steroid
production (53). This finding is
consistent with the present study result showing that mitochondrial
integrity plays a crucial role in response to mitotane treatment
(Fig. 2A). Bikas et al
(54) examined the effect of
mitotane on different histological subtypes of thyroid cancer,
using the same concentration (50 µM) and time point (24 h) as those
used in the present study. The study observed that treatment with
mitotane promoted DSBs and activated the apoptotic process, while
also reducing the mitochondrial membrane potential. Consistent with
these reports, the present study also found that mitotane-treated
adrenal cells presented higher levels of histone γH2AX expression
and cleaved PARP-1 based on flow cytometry reflecting DSBs and
apoptosis (Fig. 2B and 2D) as well
as necrosis (Fig. 2C). Cerquetti
et al (55) found that
mitotane interferes with the modulation of two DNA mismatch repair
protein enzymes (DNA mismatch repair protein MSH1 and DNA mismatch
repair protein MSH2), which form part of the mismatch DNA repair
mechanism, which could explain the radiosensitizing properties of
mitotane. In the current study, mitotane treatment promoted the
expression of numerous genes involved in DSB repair, including
BRCA2, XRCC4 and RAD51. Importantly, those genes were upregulated
or downregulated according to the type of cell, indicating that ACC
and melanoma cells appear to promote different DNA repair
mechanisms at different levels.
It has been reported that combined treatment with
mitotane and ionizing radiation (IR) induces accumulation of H295R
and SW13 cells in G2 phase (56). Mitotane can enhance the cytotoxic
effects of IR via the attenuation of DNA repair and interference in
the activation of mitosis-promoting factor, which is mainly
regulated by cyclin B1 degradation. This phenomenon may explain the
defective activation of CDC2, which is involved in G2/M
phase arrest, and probably induced by concurrent treatment with
mitotane and IR (56). However,
the present study found that mitotane administered alone triggered
the accumulation of cells (ACC and melanoma) in the G1
phase of the cell cycle (Fig. 2E),
leading to a smaller percentage of cells in the S and G2
phases. This finding was further confirmed by analyzing CDK2 and
CDK4 gene expression, since an inverse correlation between CDK2 and
CDK4 gene expression was observed, which is logical, considering
that each gene is characteristic of a different phase of the cell
cycle (namely, CDK2 of the G2/M transition and CDK4 of
the G1 phase).
Volante et al (57) evaluated the expression of
ribonucleotide reductase large subunit 1 (RRM1) in a cohort of
patients with ACC, and evaluated the association of gene expression
with clinical outcomes, finding that RRM1 gene expression was
functionally associated with mitotane sensitivity, thus supporting
a potential role for RRM1 determination as a novel molecular
biomarker to predict response to adjuvant mitotane in patients with
ACC. The present study analyzed the whole transcriptome of treated
cells using microarray analysis (Figs.
3–6). The results revealed
that primary melanoma, WM266-4 and HAC15 cells had distinct gene
expression profiles. The largest changes in gene expression
profiles after mitotane administration were observed in HAC15 cells
(Fig. 3). Next, it was
demonstrated that mitotane triggered changes in BPs involved in
DDR; more specifically, it decreased cell division activity with
mitotic nuclear division in adrenocortical cells (Fig. 4A and B). Seidel et al
(53) found that untreated
resistant HAC15 cells showed significant upregulation of genes
involved in apoptosis regulation and downregulation of pathways
associated with steroid metabolism, regulation of the ERK cascade,
apoptotic cell clearance and response to xenobiotics. In that
study, mitotane treatment (70 µM) of control cells upregulated
several pathways, including cell death and unfolded protein
response. By contrast, pathways related to lipid homeostasis and
transport were downregulated (53). In another study, GSEA of GO
categories revealed reduced expression of 36 gene sets 48 h after
mitotane treatment of NCI-H295R cells, reduced expression of 124
gene sets at 72 h of treatment, overexpression of 1 gene set at 48
h of treatment and overexpression of 21 gene sets at 72 h of
treatment. Reduced expression of lipid biosynthesis, steroid
biosynthesis, steroid metabolic process and several cell cycle
categories (such as mitosis and M phase) were typically observed at
48 and 72 h post-treatment (58).
By pathway analysis of expression genomics data,
Sbiera et al (16) revealed
activation of endoplasmic reticulum stress and marked alteration of
lipid-related genes caused by mitotane treatment in NCI-H295 cells.
To the best of our knowledge, there are no studies on the gene
expression profile of different types of cells treated with
mitotane. Based on GSEA, the present study obtained similar results
to those described by Sbiera et al (16). Mitotane caused ER stress, and
reduced the sterol biosynthetic process, mitotic sister chromatid
segregation and cell cycle G2 checkpoint, inter alia
(Fig. 5). In all the cell types
evaluated in the current study, common modifications in BPs were
observed, such as activation of cellular amino acid biosynthetic
process, and attenuation of cell division (Fig. 6A and B). Several genes, including
CCNA2, CDCA3, CDCA8, PLK1, CENP1, SGOL1, KIF18B, KIF20A, anillin
actin binding protein and NUF2 component of NDC80 kinetochore
complex, are of particular interest, as their expression was
attenuated in all cell types after mitotane treatment (Fig. 6C). These genes are all involved in
the control of the cell cycle and division.
Regarding cancer survival, the present study focused
on the role of the following genes, which are commonly regulated by
mitotane: CCNA2, CDCA3, CDCA8, PLK1, CENP1 and SGOL1 (Fig. 7). Expression of these genes below
the median levels correlates with higher survival rates in patients
diagnosed with ACC and SKCM. The role of these selected genes in
cancer prognosis has been reported. Liu et al (59) observed that PLK1 is a potential
target for cancer therapy, as it plays multiple roles in the cell
cycle, controlling mitotic entry and G2/M checkpoint,
and coordinates centrosome and cell cycle. In addition, PLK1 also
regulates spindle assembly and chromosome segregation, and
facilitates DNA replication. Overexpression of this gene is
associated with a poor prognosis in patients with cancer.
Similarly, KIF18B and KIF20A mediate basic cell physiology through
the regulation of the cell cycle, DNA replication, and biological
DNA repair processes and pathways. This explains why KIF18B and
KIF20A, both of which play an important role in cell cycle
regulation, influence clinical outcomes in patients with lung
adenocarcinoma (60). Furthermore,
overexpression of tumor-related KIFs is correlated with worse
outcomes in breast cancer and hepatocellular carcinoma; thus, KIFs
may serve as prognostic biomarkers in these cancer types (61,62).
The mRNA and protein levels of CENPI are significantly increased in
estrogen receptor (ER)-positive breast carcinoma, but not in
ER-negative breast carcinoma. Well-established prognostic tests,
such as Adjuvant! Online and the Nottingham Prognostic Index,
suggest that the overexpression of CENPI is a strong independent
marker for a poor prognosis and poor survival in patients with
ER-positive breast cancer (63). A
previous study showed that CCNA2 was a significant prognostic
indicator in ER-positive breast cancer progression and tamoxifen
resistance (64). CCNA2 is
overexpressed in numerous cancer types, which indicates its
potential role in cancer transformation and progression. CCNA2 may
also be involved in the processes of epithelial-mesenchymal
transition and metastasis (65).
Three members of the cell division cycle-associated gene family
(CDCA3, CDCA5 and CDCA8) are distinctly overexpressed in breast
cancer tumors and cell lines. This overexpression is associated
with a poor prognosis, with a low survival probability (66). Overall, decreased expression of
these genes after mitotane treatment in the present study appears
to be a reliable prognostic factor.
In conclusion, the present study aimed to clarify
the mechanism by which mitotane, which is routinely used to treat
ACC, affects other cell types. The current in vitro findings
suggest that mitotane is not as effective in melanoma as in adrenal
carcinoma. In the present study, mitotane had the greatest effect
on a human ACC cell line, followed by a medium effect on an
established metastatic human melanoma cell line. In the cell line
derived from metastatic human melanoma, the response to mitotane
was moderate. The three cell lines differed in terms of the
intensity of their response to mitotane (primary metastatic
melanoma cell line < established metastatic melanoma cell line
< human adrenal carcinoma cell line), and in their activation of
different signaling pathways.
It is important to emphasize that the patient
reported in the present study, who exhibited metastatic melanoma in
the adrenal glands, responded well to mitotane therapy, and this
real-world evidence is superior to the findings derived from in
vitro experiments, including those performed in the current
study. As a result, it is difficult to clarify the mechanism by
which mitotane affects different cell types, and therefore, further
studies are required. In conclusion, the present study provides a
detailed description of the mechanisms that appear to be activated
in response to mitotane treatment.
Supplementary Material
Supporting Data
Acknowledgements
Not applicable.
Funding
This research was supported by ‘Opus Grant’ program of the
National Science Center No. UMO-2017/25/B/ /NZ4/00065. Zhanat
Komekbai (WKMOMU) & Agnieszka Malinska (PUMS) were supported by
the Social Health Insurance Project, Republic of Kazakhstan
(Contract No. SHIP-2.3/CS-02).
Availability of data and materials
The microarray datasets generated and/or analyzed
during the current study are available in the Gene Expression
Omnibus repository at the National Center for Biotechnology
Information (http://www.ncbi.nlm.nih.gov/geo/) under GEO accession
number GSE186870. The remaining datasets used and/or analyzed
during the current study are available from the corresponding
author on reasonable request.
Authors' contributions
ES, HK and MR confirm the authenticity of all the
raw data. ES was involved in the performing experiments and writing
of the original draft; HK participated in conceptualization,
methodology, writing, reviewing and editing; KJ performed
experiments; AZ validated the data and took part in experiments
concerning cell culture and proliferation analysis; DI conducted
formal analysis of the data; AM was responsible for bioinformatic
data analysis and participated in flow cytometry analyses; BS
conducted experiments; ZK bioinformatic data analysis and was
engaged in qPCR analysis; MK and TW were responsible for obtaining
and handling primary material from the patient as well establishing
the primary cell line; WMS validated the data and performed
microarray analysis; MRuch was responsible for TCGA data analysis
and cell culture; and MRuci participated in project supervision and
took part in all experiments. All authors were involved in the
preparation and modification of the figures and manuscript. All
authors have read and approved the final manuscript.
Ethics approval and consent to
participate
The patient mentioned in the present study provided
written informed consent. The current study was approved by the
Bioethics Committee of Poznan University of Medical Sciences
(Poznan, Poland; approval no. 255/15).
Patient consent for publication
Not applicable.
Competing interests
The authors declare that they have no competing
interests.
References
|
1
|
Else T, Kim AC, Sabolch A, Raymond VM,
Kandathil A, Caoili EM, Jolly S, Miller BS, Giordano TJ and Hammer
GD: Adrenocortical carcinoma. Endocr Rev. 35:282–326. 2014.
View Article : Google Scholar : PubMed/NCBI
|
|
2
|
Bertazza L, Barollo S, Mari ME, Faccio I,
Zorzan M, Redaelli M, Rubin B, Armanini D, Mian C and Pezzani R:
Biological effects of EF24, a curcumin derivative, alone or
combined with mitotane in adrenocortical tumor cell lines.
Molecules. 24:22022019. View Article : Google Scholar : PubMed/NCBI
|
|
3
|
Libé R: Adrenocortical carcinoma (ACC):
Diagnosis, prognosis, and treatment. Front Cell Dev Biol. 3:452015.
View Article : Google Scholar : PubMed/NCBI
|
|
4
|
Pianovski MAD, Maluf EM, de Carvalho DS,
Ribeiro RC, Rodriguez-Galindo C, Boffetta P, Zancanella P and
Figueiredo BC: Mortality rate of adrenocortical tumors in children
under 15 years of age in Curitiba, Brazil. Pediatr Blood Cancer.
47:56–60. 2006. View Article : Google Scholar : PubMed/NCBI
|
|
5
|
Ayala-Ramirez M, Jasim S, Feng L, Ejaz S,
Deniz F, Busaidy N, Waguespack SG, Naing A, Sircar K, Wood CG, et
al: Adrenocortical carcinoma: Clinical outcomes and prognosis of
330 patients at a tertiary care center. Eur J Endocrinol.
169:891–899. 2013. View Article : Google Scholar : PubMed/NCBI
|
|
6
|
Boulate G, Amazit L, Naman A, Seck A, Paci
A, Lombes A, Pussard E, Baudin E, Lombes M and Hescot S:
Potentiation of mitotane action by rosuvastatin: New insights for
adrenocortical carcinoma management. Int J Oncol. 54:2149–2156.
2019.PubMed/NCBI
|
|
7
|
Łebek-Szatańska A, Nowak KM and Papierska
L: Pitfalls in the diagnostics of aldosterone-producing
adre-nocortical carcinoma. Endokrynol Pol. 71:575–576. 2020.
View Article : Google Scholar : PubMed/NCBI
|
|
8
|
Rubin B, Pilon C, Pezzani R, Rebellato A
and Fallo F: The effects of mitotane and 1α,25-dihydroxyvitamin
D3 on Wnt/beta-catenin signaling in human adrenocortical
carcinoma cells. J Endocrinol Invest. 43:357–367. 2020. View Article : Google Scholar : PubMed/NCBI
|
|
9
|
Cusato J, De Francia S, Allegra S,
Carrella S, Pirro E, Piccione FM, De Martino F, Ferrero A, Daffara
FC, Terzolo M, et al: Circannual variation of mitotane and its
metabolites plasma levels in patients with adrenocortical
carcinoma. J Pharm Pharmacol. 69:1524–1530. 2017. View Article : Google Scholar : PubMed/NCBI
|
|
10
|
Liu X, Fu Q, Tang Y, Deng JH, Mei D and
Zhang B: A case report of neurological adverse events caused by
short-term and low-dose treatment of mi-totane: The role of
therapeutic drug monitoring. Medicine (Baltimore). 99:e226202020.
View Article : Google Scholar : PubMed/NCBI
|
|
11
|
Hescot S, Seck A, Guerin M, Cockenpot F,
Huby T, Broutin S, Young J, Paci A, Baudin E and Lombès M:
Lipoprotein-free mitotane exerts high cytotoxic activity in
adrenocortical carcinoma. J Clin Endocrinol Metab. 100:2890–2898.
2015. View Article : Google Scholar : PubMed/NCBI
|
|
12
|
Almeida MQ, Bezerra-Neto JE, Mendonça BB,
Latronico AC and Fragoso MCBV: Primary malignant tumors of the
adrenal glands. Clinics (Sao Paulo). 73 (Suppl 1):e756s2018.
View Article : Google Scholar : PubMed/NCBI
|
|
13
|
Frycz BA and Jagodzinski PP: Expression of
genes encoding steroidogenic enzymes and their role in prostate
carcinogenesis. J Med Sci. 83:73–80. 2014. View Article : Google Scholar
|
|
14
|
Paragliola RM, Torino F, Papi G, Locantore
P, Pontecorvi A and Corsello SM: Role of mitotane in adrenocortical
carcinoma-review and state of the art. Eur Endocrinol. 14:62–66.
2018. View Article : Google Scholar : PubMed/NCBI
|
|
15
|
Hescot S, Amazit L, Lhomme M, Travers S,
DuBow A, Battini S, Boulate G, Namer IJ, Lombes A, Kontush A, et
al: Identifying mitotane-induced mitochondria-associated membranes
dysfunctions: Metabolomic and lipidomic approaches. Oncotarget.
8:109924–109940. 2017. View Article : Google Scholar : PubMed/NCBI
|
|
16
|
Sbiera S, Leich E, Liebisch G, Sbiera I,
Schirbel A, Wiemer L, Matysik S, Eckhardt C, Gardill F, Gehl A, et
al: Mitotane inhibits sterol-O-acyl transferase 1 triggering
lipid-mediated endoplasmic reticulum stress and apoptosis in
adrenocortical carcinoma cells. Endocrinology. 156:3895–3908. 2015.
View Article : Google Scholar : PubMed/NCBI
|
|
17
|
Komarowska H, Bromińska B,
Janicka-Jedyńska M and Ruchała M: Adrenal incidentaloma: Nothing is
ever as it seems. Am J Med. 133:1048–1050. 2020. View Article : Google Scholar : PubMed/NCBI
|
|
18
|
Luo X, Mitra D, Sullivan RJ, Wittner BS,
Kimura AM, Pan S, Hoang MP, Brannigan BW, Lawrence DP, Flaherty KT,
et al: Isolation and molecular characterization of circulating
melanoma cells. Cell Rep. 7:645–653. 2014. View Article : Google Scholar : PubMed/NCBI
|
|
19
|
Weinstein D, Leininger J, Hamby C and
Safai B: Diagnostic and prognostic biomarkers in melanoma. J Clin
Aesthet Dermatol. 7:13–24. 2014.PubMed/NCBI
|
|
20
|
Wassermann JD, Novokmet A, Eichler-Jonsson
C, Ribeiro RC, Rodriguez-Galindo C, Zambetti GP and Malkin D:
Prevalence and functional consequence of P53 mutations in pediatric
adrenocortical carcinoma: A children's oncology group study. J Clin
Oncol. 33:602–609. 2015. View Article : Google Scholar : PubMed/NCBI
|
|
21
|
Ji Z, Njauw CN, Taylor M, Neel V, Flaherty
KT and Tsao H: P53 rescue through HDM2 antagonism suppresses
melanoma growth and potentiates MEK inhibition. J Invest Dermatol.
132:356–364. 2012. View Article : Google Scholar : PubMed/NCBI
|
|
22
|
Lehmann TP, Wrzesiński T and Jagodziński
PP: The effect of mitotane on viability, steroidogenesis and gene
expression in NCI-H295R adrenocortical cells. Mol Med Rep.
7:893–900. 2013. View Article : Google Scholar : PubMed/NCBI
|
|
23
|
Dworakowska D, Drabarek A, Wenzel I,
Babińska A, Świątkowska-Stodulska R and Sworczak K: Adrenocortical
cancer (ACC)-literature overview and own experience. Endokrynol
Pol. 65:492–502. 2014.PubMed/NCBI
|
|
24
|
Sivandzade F, Bhalerao A and Cucullo L:
Analysis of the mitochondrial membrane potential using the cationic
JC-1 dyeas a sensitive fluorescent probe. Bio Protoc. 9:e31282019.
View Article : Google Scholar : PubMed/NCBI
|
|
25
|
Livak KJ and Schmittgen TD: Analysis of
relative gene expression data using real-time quantitative PCR and
the 2(−Delta Delta C(T)) method. Methods. 25:402–408. 2001.
View Article : Google Scholar : PubMed/NCBI
|
|
26
|
Stelcer E, Milecka P, Komarowska H, Jopek
K, Tyczewska M, Szyszka M, Lesniczak M, Suchorska W, Bekova K,
Szczepaniak B, et al: Adropin stimulates proliferation and inhibits
adrenocortial steroidogenesis in the human adrenal carcinoma
(HAC15) cell line. Front Endocrinol (Lausanne). 11:5613702020.
View Article : Google Scholar : PubMed/NCBI
|
|
27
|
Szyszka M, Paschke L, Tyczewska M, Jopek
K, Celichowski P, Milecka P, Sultanova G, Stelcer E, Malinska A,
Malendowicz LK and Rucinski M: Analysis of transcriptome, selected
intracellular signaling pathways, proliferation and apoptosis of
LNCaP cells exposed to high leptin concentrations. Int J Mol Sci.
20:54122019. View Article : Google Scholar : PubMed/NCBI
|
|
28
|
Jopek K, Celichowski P, Szyszka M,
Tyczewska M, Milecka P, Malendowicz LK and Rucinski M:
Transcriptome profile of rat adrenal evoked by gonadectomy and
testosterone or estradiol replacement. Front Endocrinol (Lausanne).
8:262017. View Article : Google Scholar : PubMed/NCBI
|
|
29
|
Gautier L, Cope L, Bolstad BM and Irizarry
RA: Affy-analysis of affymetrix genechip data at the probe level.
Bioinformatics. 20:307–315. 2004. View Article : Google Scholar : PubMed/NCBI
|
|
30
|
Carvalho BS and Irizarry RA: A framework
for oligonucleotide microarray preprocessing. Bioinformatics.
26:2363–2367. 2010. View Article : Google Scholar : PubMed/NCBI
|
|
31
|
Ritchie ME, Phipson B, Wu D, Hu Y, Law CW,
Shi W and Smyth GK: Limma powers differential expression analyses
for RNA-sequencing and microarray studies. Nucleic Acids Res.
43:e472015. View Article : Google Scholar : PubMed/NCBI
|
|
32
|
Dennis G Jr, Sherman BT, Hosack DA, Yang
J, Gao W, Lane HC and Lempicki RA: DAVID: Database for annotation,
visualization, and integrated discovery. Genome Biol. 4:P32003.
View Article : Google Scholar : PubMed/NCBI
|
|
33
|
Fresno C and Fernández EA:
RDAVIDWebService: A versatile R interface to DAVID. Bioinformatics.
29:2810–2811. 2013. View Article : Google Scholar : PubMed/NCBI
|
|
34
|
Benjamini Y and Cohen R: Weighted false
discovery rate controlling procedures for clinical trials.
Biostatistics. 18:91–104. 2017. View Article : Google Scholar : PubMed/NCBI
|
|
35
|
Walter W, Sánchez-Cabo F and Ricote M:
GOplot: An R package for visually combining expression data with
functional analysis. Bioinformatics. 31:2912–2914. 2015. View Article : Google Scholar : PubMed/NCBI
|
|
36
|
Damian D and Gorfine M: Statistical
concerns about the GSEA procedure. Nat Genet. 36:6632004.
View Article : Google Scholar : PubMed/NCBI
|
|
37
|
Sergushichev AA: An algorithm for fast
preranked gene set enrichment analysis using cumulative statistic
calculation. bioRxiv. Jun 20–2016.(Epub ahead of print).
|
|
38
|
Liberzon A, Birger C, Thorvaldsdóttir H,
Ghandi M, Mesirov JP and Tamayo P: The molecular signatures
database (MSigDB) hallmark gene set collection. Cell Syst.
1:417–425. 2015. View Article : Google Scholar : PubMed/NCBI
|
|
39
|
Subramanian A, Tamayo P, Mootha VK,
Mukherjee S, Ebert BL, Gillette MA, Paulovich A, Pomeroy SL, Golub
TR, Lander ES and Mesirov JP: Gene set enrichment analysis: A
knowledge-based approach for interpreting genome-wide expression
profiles. Proc Natl Acad Sci USA. 102:15545–15550. 2005. View Article : Google Scholar : PubMed/NCBI
|
|
40
|
Isserlin R, Merico D, Voisin V and Bader
GD: Enrichment map-a Cytoscape app to visualize and explore OMICs
pathway enrichment results. F1000Res. 3:1412014. View Article : Google Scholar : PubMed/NCBI
|
|
41
|
Kucera M, Isserlin R, Arkhangorodsky A and
Bader GD: AutoAnnotate: A Cytoscape app for summarizing networks
with semantic annotations. F1000Res. 5:17172016. View Article : Google Scholar : PubMed/NCBI
|
|
42
|
Kolde R: J.R.p.v: Pheatmap: Pretty
Heatmaps. p6172012.
|
|
43
|
Deng M, Brägelmann J, Kryukov I,
Saraiva-Agostinho N and Perner S: FirebrowseR: An R client to the
broad institute's Firehose Pipeline. Database (Oxford).
2017:baw1602017. View Article : Google Scholar : PubMed/NCBI
|
|
44
|
Tang Z, Kang B, Li C, Chen T and Zhang Z:
GEPIA2: An enhanced web server for large-scale expression profiling
and interactive analysis. Nucleic Acids Res. 47:W556–W560. 2019.
View Article : Google Scholar : PubMed/NCBI
|
|
45
|
Eaton A, Therneau T and Le-Rademacher J:
Designing clinical trials with (restricted) mean survival time
endpoint: Practical considerations. Clin Trials. 17:285–294. 2020.
View Article : Google Scholar : PubMed/NCBI
|
|
46
|
Hu B, Mitra J, van den Heuvel S and Enders
GH: S and G2 phase roles for Cdk2 revealed by inducible expression
of a dominant-negative mutant in human cells. Mol Cell Biol.
21:2755–2766. 2001. View Article : Google Scholar : PubMed/NCBI
|
|
47
|
Zhang X, Dong W, Zhou H, Li H, Wang N,
Miao X and Jia L: α-2,8-Sialyltransferase is involved in the
development of multidrug resistance via PI3K/Akt pathway in human
chronic myeloid leukemia. IUBMB Life. 67:77–87. 2015. View Article : Google Scholar : PubMed/NCBI
|
|
48
|
Fujita Y, Ito M and Ohsawa I:
Mitochondrial stress and GDF15 in the pathophysiology of sepsis.
Arch Biochem Biophys. 696:1086682020. View Article : Google Scholar : PubMed/NCBI
|
|
49
|
Li T, Su L, Lei Y and Liu X, Zhang Y and
Liu X: DDIT3 and KAT2A proteins regulate TNFRSF10A and TNFRSF10B
expression in endoplasmic reticulum stress-mediated apoptosis in
human lung cancer cells. J Biol Chem. 290:11108–11118. 2015.
View Article : Google Scholar : PubMed/NCBI
|
|
50
|
Parmar J, Key RE and Rainey WE:
Development of an Adrenocorticotropin-responsive human
adrenocortical carcinoma cell line. J Clin Endocrinol Metab.
93:4542–4546. 2008. View Article : Google Scholar : PubMed/NCBI
|
|
51
|
Wang T and Rainey WE: Human adrenocortical
cell lines. Mol Cell Endocrinol. 351:58–65. 2012. View Article : Google Scholar : PubMed/NCBI
|
|
52
|
Poli G, Guasti D, Rapizzi E, Fucci R, Canu
L, Bandini A, Cini N, Bani D, Mannelli M and Luconi M:
Morphofunctional effects of mitotane on mitochondria in human
adrenocortical cancer cells. Endocr Relat Cancer. 20:537–550. 2013.
View Article : Google Scholar : PubMed/NCBI
|
|
53
|
Seidel E, Walenda G, Messerschmidt C,
Obermayer B, Peitzsch M, Wallace P, Bahethi R, Yoo T, Choi M,
Schrade P, et al: Generation and characterization of a
mitotane-resistant adrenocortical cell line. Endocr Connect.
9:122–134. 2020. View Article : Google Scholar : PubMed/NCBI
|
|
54
|
Bikas A, Jensen K, Patel A, Costello J,
Kaltsas G, Hoperia V, Wartofsky L, Burman K and Vasko V: Mitotane
induces mitochondrial membrane depolarization and apoptosis in
thyroid cancer cells. Int J Oncol. 55:7–20. 2019.PubMed/NCBI
|
|
55
|
Cerquetti L, Sampaoli C, Amendola D, Bucci
B, Misiti S, Raza G, De Paula U, Marchese R, Brunetti E, Toscano V
and Stigliano A: Mitotane sensitizes adrenocortical cancer cells to
ionizing radiations by involvement of the cyclin B1/CDK complex in
G2 arrest and mismatch repair enzymes modulation. Int J Oncol.
37:493–501. 2010.PubMed/NCBI
|
|
56
|
Cerquetti L, Bucci B, Carpinelli G, Lardo
P, Proietti A, Saporito R, Rindi G, Petrangeli E, Toscano V and
Stigliano A: Antineoplastic effect of a combined mitotane
treatment/ionizing radiation in adrenocortical carcinoma: A
preclinical study. Cancers (Basel). 11:17682019. View Article : Google Scholar : PubMed/NCBI
|
|
57
|
Volante M, Terzolo M, Fassnacht M, Rapa I,
Germano A, Sbiera S, Daffara F, Sperone P, Scagliotti G, Allolio B,
et al: Ribonucleotide reductase large subunit (RRM1) gene
expression may predict efficacy of ad-juvant mitotane in
adrenocortical cancer. Clin Cancer Res. 18:3452–3461. 2012.
View Article : Google Scholar : PubMed/NCBI
|
|
58
|
Zsippai A, Szabó DR, Tömböl Z, Szabó PM,
Eder K, Pállinger E, Gaillard RC, Patócs A, Tóth S, Falus A, et al:
Effects of mitotane on gene expression in the adrenocortical cell
line NCI-H295R: A microarray study. Pharmacogenomics. 13:1351–1361.
2012. View Article : Google Scholar : PubMed/NCBI
|
|
59
|
Liu Z, Sun Q and Wang X: PLK1, a potential
target for cancer therapy. Transl Oncol. 10:22–32. 2017. View Article : Google Scholar : PubMed/NCBI
|
|
60
|
Zhang L, Zhu G, Wang X, Liao X, Huang R,
Huang C, Huang P, Zhang J and Wang P: Genomewide investigation of
the clinical significance and prospective molecular mechanisms of
kinesin family member genes in patients with lung adenocarcinoma.
Oncol Rep. 42:1017–1034. 2019.PubMed/NCBI
|
|
61
|
Li TF, Zeng HJ, Shan Z, Ye RY, Cheang TY,
Zhang YJ, Lu SH, Zhang Q, Shao N and Lin Y: Overexpression of
kinesin superfamily members as prognostic biomarkers of breast
cancer. Cancer Cell Int. 20:1232020. View Article : Google Scholar : PubMed/NCBI
|
|
62
|
Li X, Huang W, Huang W, Wei T, Zhu W, Chen
G and Zhang J: Kinesin family members KIF2C/4A/10/11/14/18B/20A/23
predict poor prognosis and promote cell proliferation in
hepatocellular carcinoma. Am J Transl Res. 12:1614–1639.
2020.PubMed/NCBI
|
|
63
|
Thangavelu PU, Lin CY, Vaidyanathan S,
Nguyen THM, Dray E and Duijf PHG: Overexpression of the E2F target
gene CENPI promotes chromosome instability and predicts poor
prognosis in estrogen receptor-positive breast cancer. Oncotarget.
8:62167–62182. 2017. View Article : Google Scholar : PubMed/NCBI
|
|
64
|
Gao T, Han Y, Yu L, Ao S, Li Z and Ji J:
CCNA2 is a prognostic biomarker for ER+ breast cancer and tamoxifen
resistance. PLoS One. 9:e917712014. View Article : Google Scholar : PubMed/NCBI
|
|
65
|
Bendris N, Arsic N, Lemmers B and
Blanchard JM: Cyclin A2, Rho GTPases and EMT. Small GTPases.
3:225–228. 2012. View Article : Google Scholar : PubMed/NCBI
|
|
66
|
Phan NN, Wang CY, Li KL, Chen CF, Chiao
CC, Yu HG, Huang PL and Lin YC: Distinct expression of CDCA3,
CDCA5, and CDCA8 leads to shorter relapse free survival in breast
cancer patient. Oncotarget. 9:6977–6992. 2018. View Article : Google Scholar : PubMed/NCBI
|