Introduction
Glioblastoma multiforme (GBM) is the most frequent
malignant brain tumor leading to 225,000 deaths per year (according
to the data from 2018), which translates into 30% of all central
nervous system tumors (CNST), 45% of malignant CNST as well as 80%
of primary malignant CNST (1).
Although the global GBM incidence rate is less than 10 per 100,000
people, the survival rate after diagnosis is only 14–15 months,
which makes it a crucial public health issue (2). The primary treatment for glioblastoma
is surgery (maximal safe resection) followed by radiotherapy and
chemotherapy using temozolomide (TMZ), which increases patient
survival up to 18 months (1).
During glioblastoma therapy one of the goals is to
alter epidermal growth factor receptor (EGFR)/phosphoinositide
3-kinase (PI3K)/phosphatase and tensin homolog deleted on
chromosome ten (PTEN)/neurofibromatosis type 1 (NF1)/rat sarcoma
oncogene (RAS), tumor protein p53 (TP53)/mouse double minute 2
homolog (MDM2)/mouse double minute 4 homolog (MDM4)/alternate open
reading frame encoding protein p14 (p14ARF), retinoblastoma protein
1 (RB1)/cyclin-dependent kinase 4 (CDK4)/cyclin-dependent kinase
inhibitor 4A (p16INK4A)/cyclin-dependent kinase inhibitor 2B
(CDKN2B), and isocitrate dehydrogenase 1 (IDH1)/isocitrate
dehydrogenase 2 (IDH2) pathways to limit the development and growth
of the tumor. Drug therapy may also inhibit DNA repair mechanisms,
tumor invasion, vascular endothelial growth factor (VEGF), dopamine
receptors, epidermal growth factor receptor (EGFR), and
platelet-derived growth factor receptor (PDGFR)α (3–5).
The key role in the regulation of cellular adhesion,
migration, and invasion is played by integrins, which as cell
surface receptors activate also intracellular signaling proteins
(5,6). Moreover, integrins have a role in
metastasis and angiogenesis of various tumors, which makes the
integrin inhibitors potentially useful in glioblastoma therapy
(5). The up-regulation of such
integrins as α6β4, α5β1, αvβ6, αvβ3, αvβ5, and α7 is related to
poor patient prognosis in different tumors, including glioblastoma
(6). Furthermore, α3β1, α5β1,
α9β1, and β8 integrins affect migration and/or invasion of
glioblastoma cells (7,8). Alpha-tubulin, by controlling dynamics
of focal adhesion for lamellipodial extension after the tubulin
acetylation, also influences cellular migration (9). E-cadherin epithelial cell adhesion
protein has the main role in tumor metastasis (10) and is a negative regulator of
cellular invasion, including glioblastoma. Thus, this study
explores the impact of phenothiazine derivatives (perphenazine,
prochlorperazine) on migration and invasion of glioblastoma by the
analysis of E-cadherin, α-tubulin, and integrins (α3, α5, and β1)
level. The delivery of drugs during therapy of intracranial tumors
is problematic due to parameters that need to be taken into
account, such as intratumor pressure, blood supply to the tumor,
the state of blood-brain barrier (BBB) (3). Drugs used in the treatment of newly
diagnosed or recurrent glioblastoma should penetrate the BBB or
exhibit intracerebral activity (11). Perphenazine and prochlorperazine
used in this study penetrate BBB (12), and they have different biological
activities such as sedative, antiemetic (13,14),
anticancer activities (15).
Therefore, we decided to continue the previous investigation of an
anticancer activity of perphenazine and prochlorperazine against
U-87 MG cells in the present study. The influence of those drugs on
the level of ATP-binding cassette drug efflux transporters, i.e.
ATP-binding cassette subfamily B member 1 (ABCB1) and ATP-binding
cassette subfamily G member 2 (ABCG2), was analyzed. ABCB1 is also
called glycoprotein P (P-gp) or multi-drug resistance 1 (MDR1),
while ABCG2 is also referred to as a breast cancer resistance
protein (BCRP). Those transporters are responsible for moving
biologically important substrates (amino acids, cholesterol) across
the cell membranes, and for impeding the penetration of the BBB by
many chemotherapeutic agents, actively transporting them back into
the bloodstream (16).
Materials and methods
Cell culture and reagents
The human glioblastoma cells U-87 MG were obtained
from the Sigma Aldrich (USA)-European Collection of Authenticated
Cell Cultures (ECACC) 89081402. The U-87 MG cell line was
authenticated by ECACC by STR profiling with the use of PowerPlex
16 HS PCR amplification kit. Glioblastoma cells were cultured in
Dulbecco's modified Eagle medium (DMEM), constituting a basal
medium, which was supplemented with fetal bovine serum (FBS) (10%),
neomycin (10 µg/ml), amphotericin B (0.25 µg/ml), and penicillin G
(100 U/ml) at 37°C in 5% CO2. Perphenazine,
prochlorperazine dimaleate, bacitracin, elacridar, dimethyl
sulfoxide (DMSO), phosphate-buffered saline (PBS), amphotericin B,
and penicillin G were purchased from Sigma-Aldrich Inc. (USA).
Neomycin sulfate was obtained from Amara (Poland). Trypsin/EDTA
0.25/0.02% in PBS, FBS EU professional heat-inactivated and growth
medium DMEM with 4.5 g/l Glucose, L-glutamine, and 3.7 g/l
NaHCO3 were obtained from PAN Biotech GmbH (Germany).
Geltrex LDEV-Free reduced growth factor basement membrane matrix
without Phenol Red was obtained from Gibco (USA). Methanol, acetic
acid, and crystal violet were obtained from POCH S.A. (Poland).
Buffered formalin was obtained from Chempur (Poland).
Western blot analysis of ABCB1 and
ABCG2
The ABCB1, ABCG2 protein, and β-actin amounts were
determined by western blotting according to the slightly modified
method described earlier (17).
The negative control was elacridar (5.0 µM in growth medium with
0.5% DMSO) and it was compared to DMSO control (growth medium with
0.5% DMSO). In short, 1×10⁶ cells were seeded on tissue
culture dish of 35 mm in diameter (Sarstedt, Germany) and incubated
to about 80–90% confluence. Then the cells were treated with
various concentrations of perphenazine, prochlorperazine,
elacridar, or medium for 24 h. Elacridar was used as an inhibitor
of the ABCB1 transporter.
After cell lysis in ice-cold Pierce RIPA buffer
(Thermo Fischer Scientific, USA) and a Halt Protease Inhibitor
(Thermo Fischer Scientific, USA) and protein concentrations
analysis by Pierce BCA Protein Assay Kit (Thermo Fischer
Scientific, USA) samples were stored at −80°C. Proteins were
separated on 6% SDS-PAGE along with color pre-stained protein
standard 11–245 kDa (New England BioLabs, USA) and transferred onto
nitrocellulose membranes (Thermo Scientific, USA) using a semi-dry
Trans-Blot Turbo Transfer System (Bio-Rad., USA). Then the
membranes were blocked for 1 h at room temperature in a blocking
buffer.
Proteins were detected by incubation with primary
antibodies: MDR1/ABCB1 (E1Y7B) Rabbit monoclonal antibody (mAb),
ABCG2 rabbit Ab, and β-actin rabbit Ab (Cell Signaling Technology,
USA) at 1:1,000 dilution in blocking buffer overnight at 4°C.
β-actin was used as an internal control protein for loading
normalization of the quantification analysis. The membranes were
washed with TBST solution and then incubated with secondary
peroxidase antibody (goat anti-rabbit IgG whole molecule) diluted
at 1:2,500 (Sigma Aldrich, USA) at room temperature according to
the manufacturers' instructions. Immunoreactive bands were
visualized using a Pierce ECL Western Blotting Substrate (Thermo
Fischer Scientific, USA) for ABCG2 and β-actin visualization as
well as Clarity Max Western ECL Substrate (Bio-Rad, USA) for ABCB1
visualization following the manufacturer's protocol. The signals
were detected with ChemiDoc MP (Bio-Rad, USA) and expressed as the
percentage of the controls. In case of ABCG2, protein densitometry
of two bands was used to calculate a relative amount of the
protein.
Wound healing assay
The assay was performed according to the method
described previously Otręba et al (2019) with a slight
modification (17). In brief, some
1×10⁶ U-87 MG were incubated with supplemented growth
medium for 24 h to approximately 80–90% confluence (18–20)
on a 35-mm plate (Sarstedt, Germany). Then the wound area was
generated by scratching cells with a sterile 200 µl pipette tip.
The used medium was carefully aspirated with cell debris, and fresh
growth medium containing 10% FBS (21), perphenazine, or prochlorperazine
solutions were added. The wound area was photographed after 0, 3,
6, 9, 12, and 24 h after scratching with the use an inverted
microscope Nikon TS100F (Nikon Corporation, Japan) equipped with a
Canon EOS 450D digital camera (Canon Inc, Japan). At each time
point, three photos of each dish were taken and dishes were
immediately placed in the incubator. 10% FBS was used during the
wound healing assay because cell viability would be affected by
serum starvation-the analyzed drugs used in concentration of 1.0
µM, causing about 50% decrease of viability. The scratch areas were
measured at each time point using ImageJ 1.51j8 software (National
Institute of Health, USA) with the MRI wound healing tool plugin
(Montpellier RIO Imaging, France) (22). The wound closure was calculated
using the following formula (23,24):
At=0h is the area of the
wound measured at time t0, immediately
after the scratch
At=Δh is the area of the
wound measured h hours after the scratch
The rate of cell migration after 24 h was calculated
using the formula (24):
Wi is the initial wound width [nm]
Wf is the final wound width [nm]
t is the time duration [hours]
Transwell chemotaxis and invasion
assay
The Transwell migration and invasion assay was
performed according to a slightly modified method described by
Bernhart et al (2013), Limame et al (2012) and the
Corning assay protocol for cell migration, chemotaxis, and invasion
was used (25,26). In the migration assay, we used
Sarsted TC-inserts with 8 µm pore diameter and 11 µm polyethylene
terephthalate membrane thickness (Sarstedt, Germany) as well as 24
well culture plates (Sarstedt, Germany). In the case of the
invasion assay, the insert membrane was covered by 45 µl of the
geltrex diluted at 1:1 v/v in medium with 1% FBS. Inserts with
geltrex were kept for 45 min at 37°C before the use. Then 25,000
U-87 MG cells were seeded into inserts for 48 h in 100 µl of
starvation medium (medium with 1% FBS) or a starvation medium
containing bacitracin (2.5 mM), perphenazine (0.5 µM), or
prochlorperazine (0.5 µM). Bacitracin was used as an inhibitor of
U-87 MG cell migration and invasion (27). The lower compartment was filled
with 600 µl of the normal growth medium (medium with 10% FBS),
starvation medium, as well as normal growth or starvation medium
containing perphenazine (0.5 µM), and prochlorperazine (0.5 µM).
After 48 h of incubation at 37°C, the medium was aspirated from the
upper surface of the membrane, cells were washed in PBS and fixed
in 2% buffered formalin for 20 min. After fixation, the inserts
were washed in PBS and incubated with methanol for 20 min. The
cells were next washed in PBS and stained with 0.1% crystal violet
for 10 min. Then, the inserts were washed in PBS until the water
ran clear, and non-migrated cells from the upper part of the insert
were removed with a cotton swab. Finally, the insert was put into a
24 well plate filled with 700 µl of 10% acetic acid for 30 min to
wash out the crystal violet. Then 200 µl of each sample was
transferred into a 96-well plate (Sarstedt, Germany) and absorbance
was measured at λ=590 nm using the microplate reader UVM-340
(Biogenet, Poland).
As a part of the procedure, we made a standard curve
using the inserts without geltrex as a control to calculate total
invasion according to the Corning assay protocol of cell migration,
chemotaxis, and invasion. The standard curve was constructed
according to the above description, but with the use of a different
number of cells: 0, 500, 1,000, 2,500, 5,000, 1,000, 15,000,
20,000, 25,000, 30,000, 35,000, 40,000, 45,000, and 50,000 cells.
Moreover, the standard curve was determined in two different
manners using invasion from the normal growth medium to the normal
growth medium, and from the starvation medium to the starvation
medium.
The results were shown as % of migrated and/or
invaded cells after calculation using the standard curve equation
from Fig. S1. Relative cell
migration and invasion were normalized by the subtraction of
negative control (results of cells which migrated/invaded from the
starvation medium to the starvation medium was called random
migration) from results of cells which migrated/invaded from the
starvation medium with 1% FBS to the normal growth medium with 10%
FBS.
Western blot analysis of E-cadherin,
α-tubulin, integrin α3, integrin α5, and integrin β1
The E-cadherin, α-tubulin, integrin α3, integrin α5,
integrin β1, and β-actin amounts were determined by western
blotting according to the method described in western blot analysis
of ABCB1 and ABCG2 section with a slight modification. The positive
control of E-cadherin, α-tubulin levels was bacitracin (1.25, 2.5,
and 5.0 mM in growth medium) and it was compared to the control
(growth medium). The obtained proteins were separated on 10%
SDS-PAGE and visualized using a Pierce ECL Western Blotting
Substrate (Thermo Fischer Scientific, USA). Proteins were detected
by incubation with primary antibodies: E-cadherin (4A2) mouse mAb,
α-tubulin rabbit Ab, integrin α5 rabbit Ab, integrin β1 (D2E5),
β-actin rabbit Ab (Cell Signaling Technology, USA), and
anti-integrin α3 rabbit Ab (St. John's Laboratory, USA) at 1:1,000
dilution in blocking buffer overnight at 4°C. β-actin was used as
an internal control protein for loading normalization of the
quantification analysis. The used secondary peroxidase antibodies
were anti-rabbit IgG and anti-mouse IgG (Sigma Aldrich, USA).
Proteins were expressed as the percentage of the controls.
Statistical analysis
The R2 values were determined using the
Excel 2013 RSQ function (Microsoft Corporation); the RSQ function
returns the square of the Pearson product-moment correlation
coefficient through data points in known y's and x's. In migration
experiments, mean values of at least three separate experiments
(n=3) performed in triplicate ± standard error of the mean (S.E.M)
were calculated. In the western blot analysis, mean values of at
least three separate experiments (n=3) ± standard deviation (SD)
were calculated. Statistical analysis was performed with one-way
ANOVA with Dunnett's multiple comparison test and two-way ANOVA
(the influence of cell line and time or drug concentration)
followed by the Tukey post-hoc test using GraphPad Prism 8
software. The significance level was established at the value of
P<0.05 (*) or P<0.01 (**).
Results
The effect of perphenazine and
prochlorperazine on ABCB1 and ABCG2 content in glioblastoma
(U87-MG)
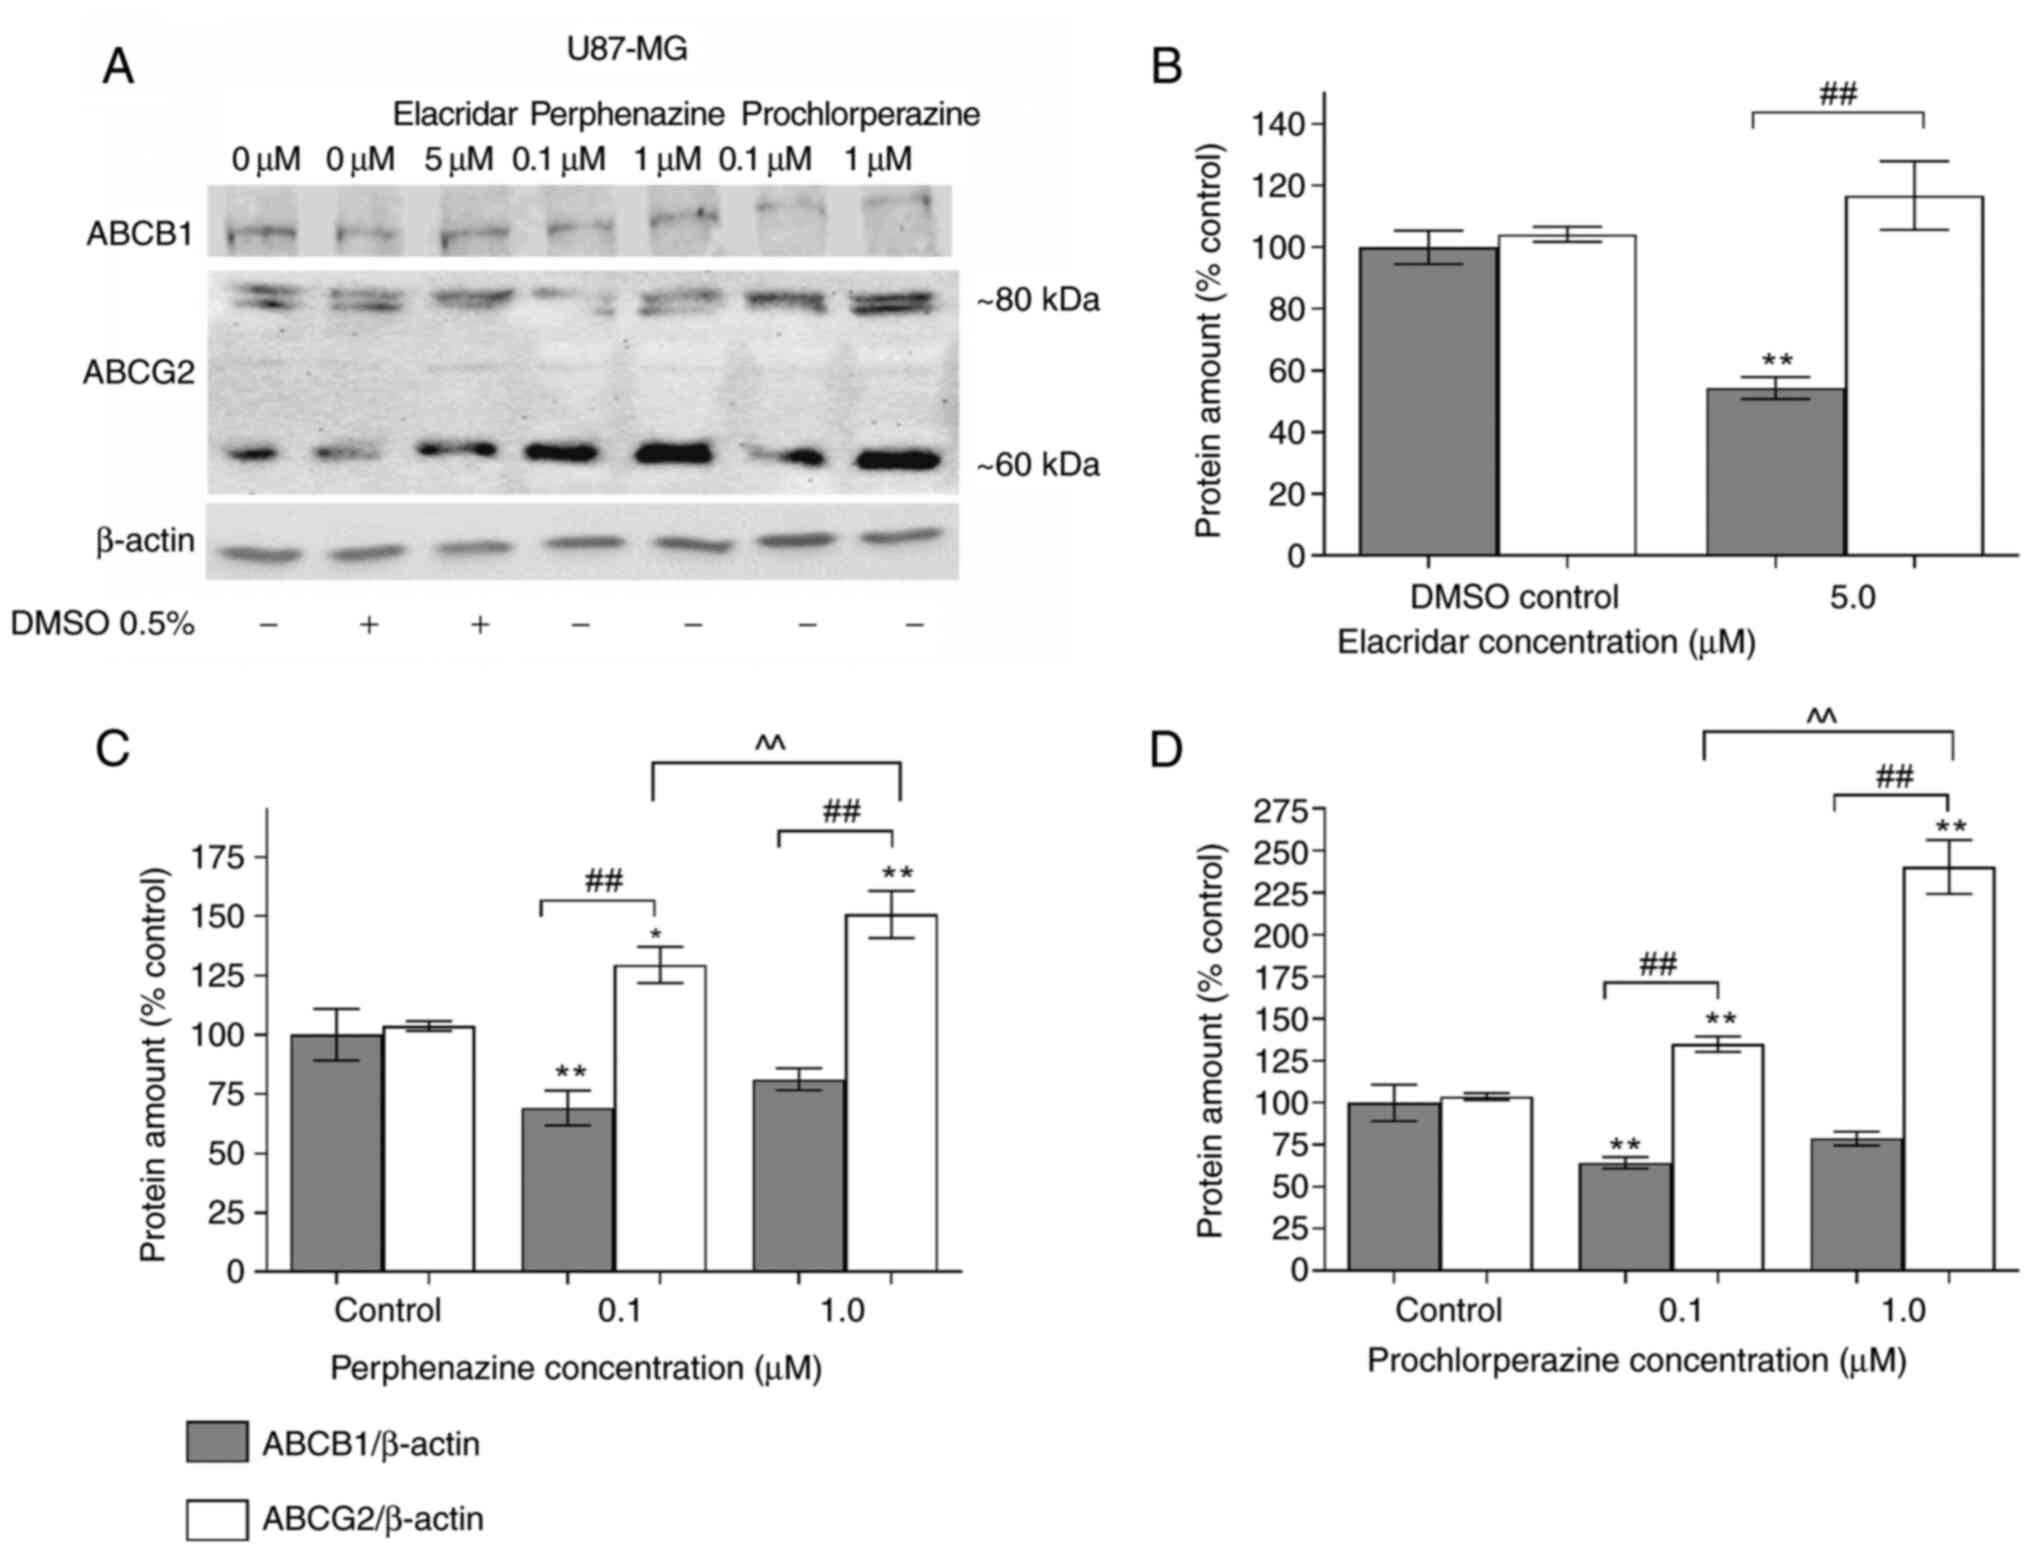
ABCB1 and ABCG2 proteins analyses were performed
with the western blot after a 24 h-treatment of glioblastoma cells
under different concentrations of perphenazine, prochlorperazine,
and elacridar (as a negative control) (Fig. 1A). The full-length immunoblots with
a molecular mass marker are shown in Fig. S2.
Elacridar significantly decreased the ABCB1 level by
45.7% in comparison to DMSO control (Fig. 1B). Perphenazine only in the
concentration of 0.1 µM significantly reduced the ABCB1 amount by
30.9%, and increased ABCG2 amount by 29.4 and 50.7% in 0.1 and 1.0
µM concentrations, respectively (Fig.
1C). A similar situation was observed in the case of
prochlorperazine: significant reduction of the ABCB1 amount by
30.9% only in the concentration of 0.1 µM, and a significant
increase of ABCG2 amount in the concentration of 0.1 and 1.0 µM by
34.9 and 140.2% respectively, when compared with its control group
(Fig. 1D).
Perphenazine and prochlorperazine
impact on wound closure and rate of cell migration
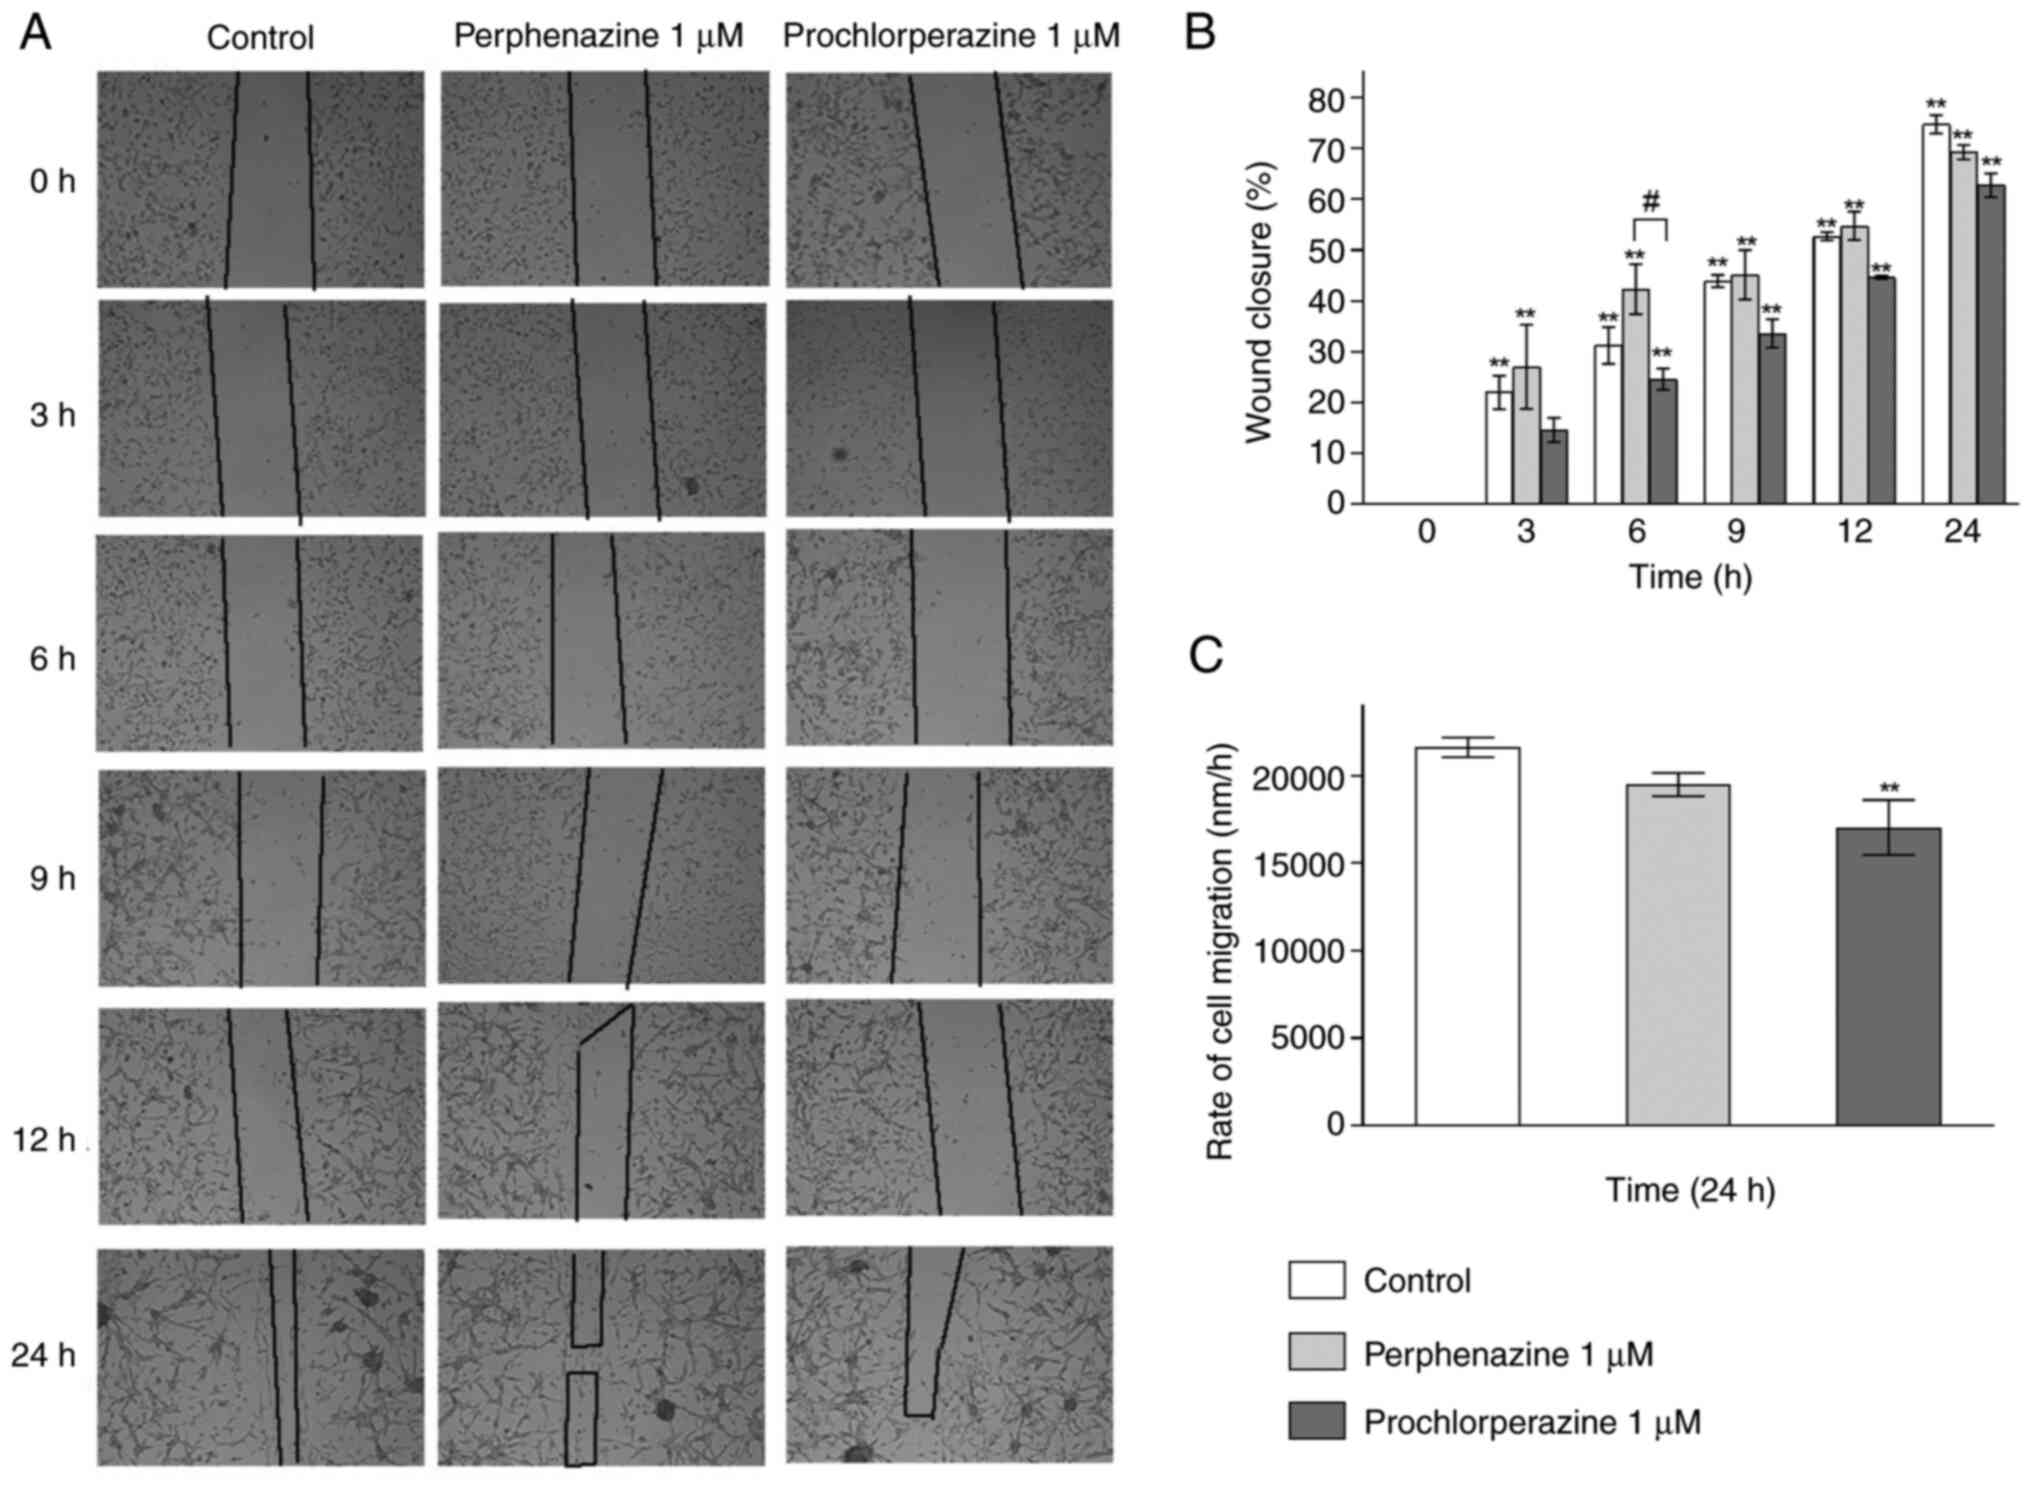
The effect of perphenazine and prochlorperazine on
wound closure and the rate of cell migration is presented in
Fig. 2A-C.
Fig. 2A shows
original photos of wound healing after a given period of time, i.e.
0, 3, 6, 9, 12, and 24 h. In all the cases the calculations showed
an increase in wound closure (Fig.
2B). After 6, 9, 12 and 24 h of treatment with 1.0 µM
prochlorperazine, the wound closure in human glioblastoma cell
cultures increased from 24.6 to 62.7% in comparison to
t0. For the control and perphenazine (1.0 µM), after 3
to 24 h of incubation, significant stimulation of wound closure and
reduction of total wound area from 22.0 to 74.7% as well as from
27.0 to 69.3% were observed, respectively, in comparison to
t0 group (Fig. 2B). The
significant difference between the effect of perphenazine and
prochlorperazine on wound closure was observed only after 6 h. The
analysis of the rate of cell migration showed a significant
difference between the control and prochlorperazine after 24
h-incubation. The calculated rate of cell migration for the
control, perphenazine, and prochlorperazine were 21613.24±969.53,
19489.18±1134.90, and 17045.01±1567.25 nm/h, respectively.
Perphenazine and prochlorperazine
impact on migration and invasion determined with the Transwell
assay
As long as invasion from the growth medium with 1%
FBS to the growth medium with 1% FBS, in 45,000 cells and 50,000
cells samples is concerned, we observed a high decrease in the cell
amount, thus we finished constructing the standard curve at 40,000
cells when it was still linear. The standard curves are presented
in supplementary Fig. S1.
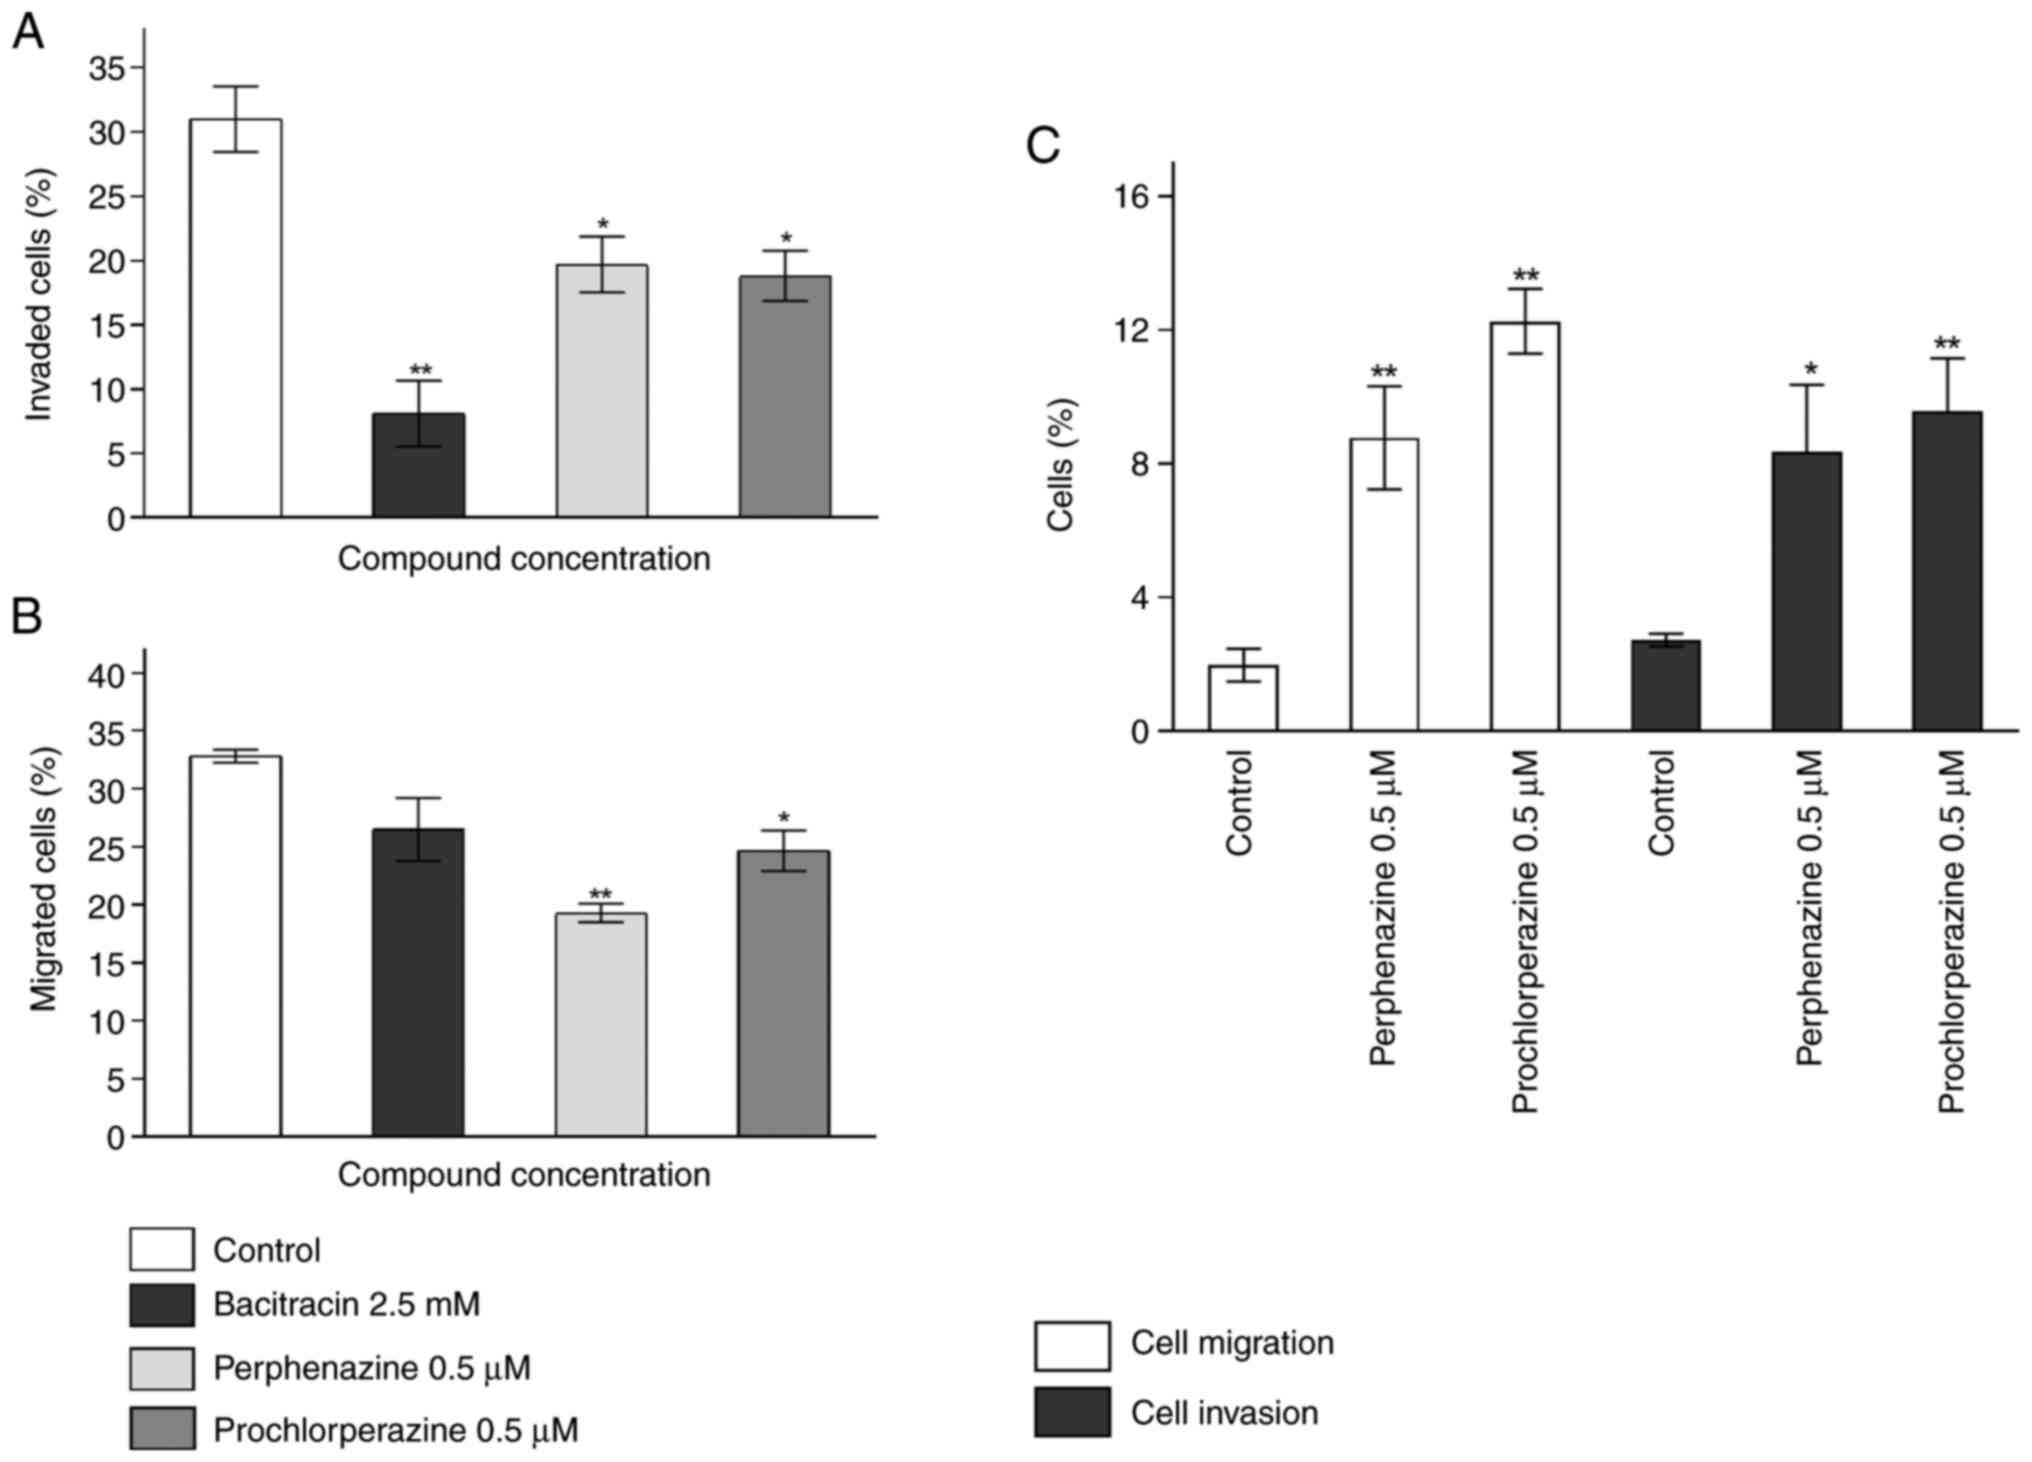
The Transwell invasion assay showed a significant
decrease in invasion by 22.91, 11.31, and 12.19% for bacitracin
(2.5 mM), perphenazine (0.5 µM), and prochlorperazine (0.5 µM) in
comparison to the control, respectively (Fig. 3A). The analysis of internal control
showed that 2.71% of cells invaded randomly. Moreover, perphenazine
and prochlorperazine significantly increased the percentage of
invaded cells by 5.65 and, 6.85% respectively, in comparison to the
control (Fig. 3C). For the
Transwell migration assay, only perphenazine (0.5 µM), and
prochlorperazine (0.5 µM) significantly decreased the percentage of
migrated cells by 13.49 and 8.15%, respectively, in comparison to
the control (Fig. 3B). The
observed decrease of U-87 MG cell migration caused by bacitracin
was not significant. The level of random migration was 1.97%.
Moreover, perphenazine and prochlorperazine significantly increased
the percentage of invasion by 6.80 and 10.30% respectively, in
comparison to the control (Fig.
3C).
The effect of perphenazine and
prochlorperazine on E-cadherin, α-tubulin, integrin α3, integrin
α5, and integrin β1 content in glioblastoma (U87-MG)
E-cadherin, α-tubulin, and integrins (α3, α5, and
β1) levels analyzed with western blot after a 24 h-treatment of
glioblastoma cells with different concentrations of perphenazine,
prochlorperazine, and bacitracin (as the negative control) are
presented in Fig. 4A. The
full-length immunoblots with a molecular mass marker are shown in
Fig. S3.
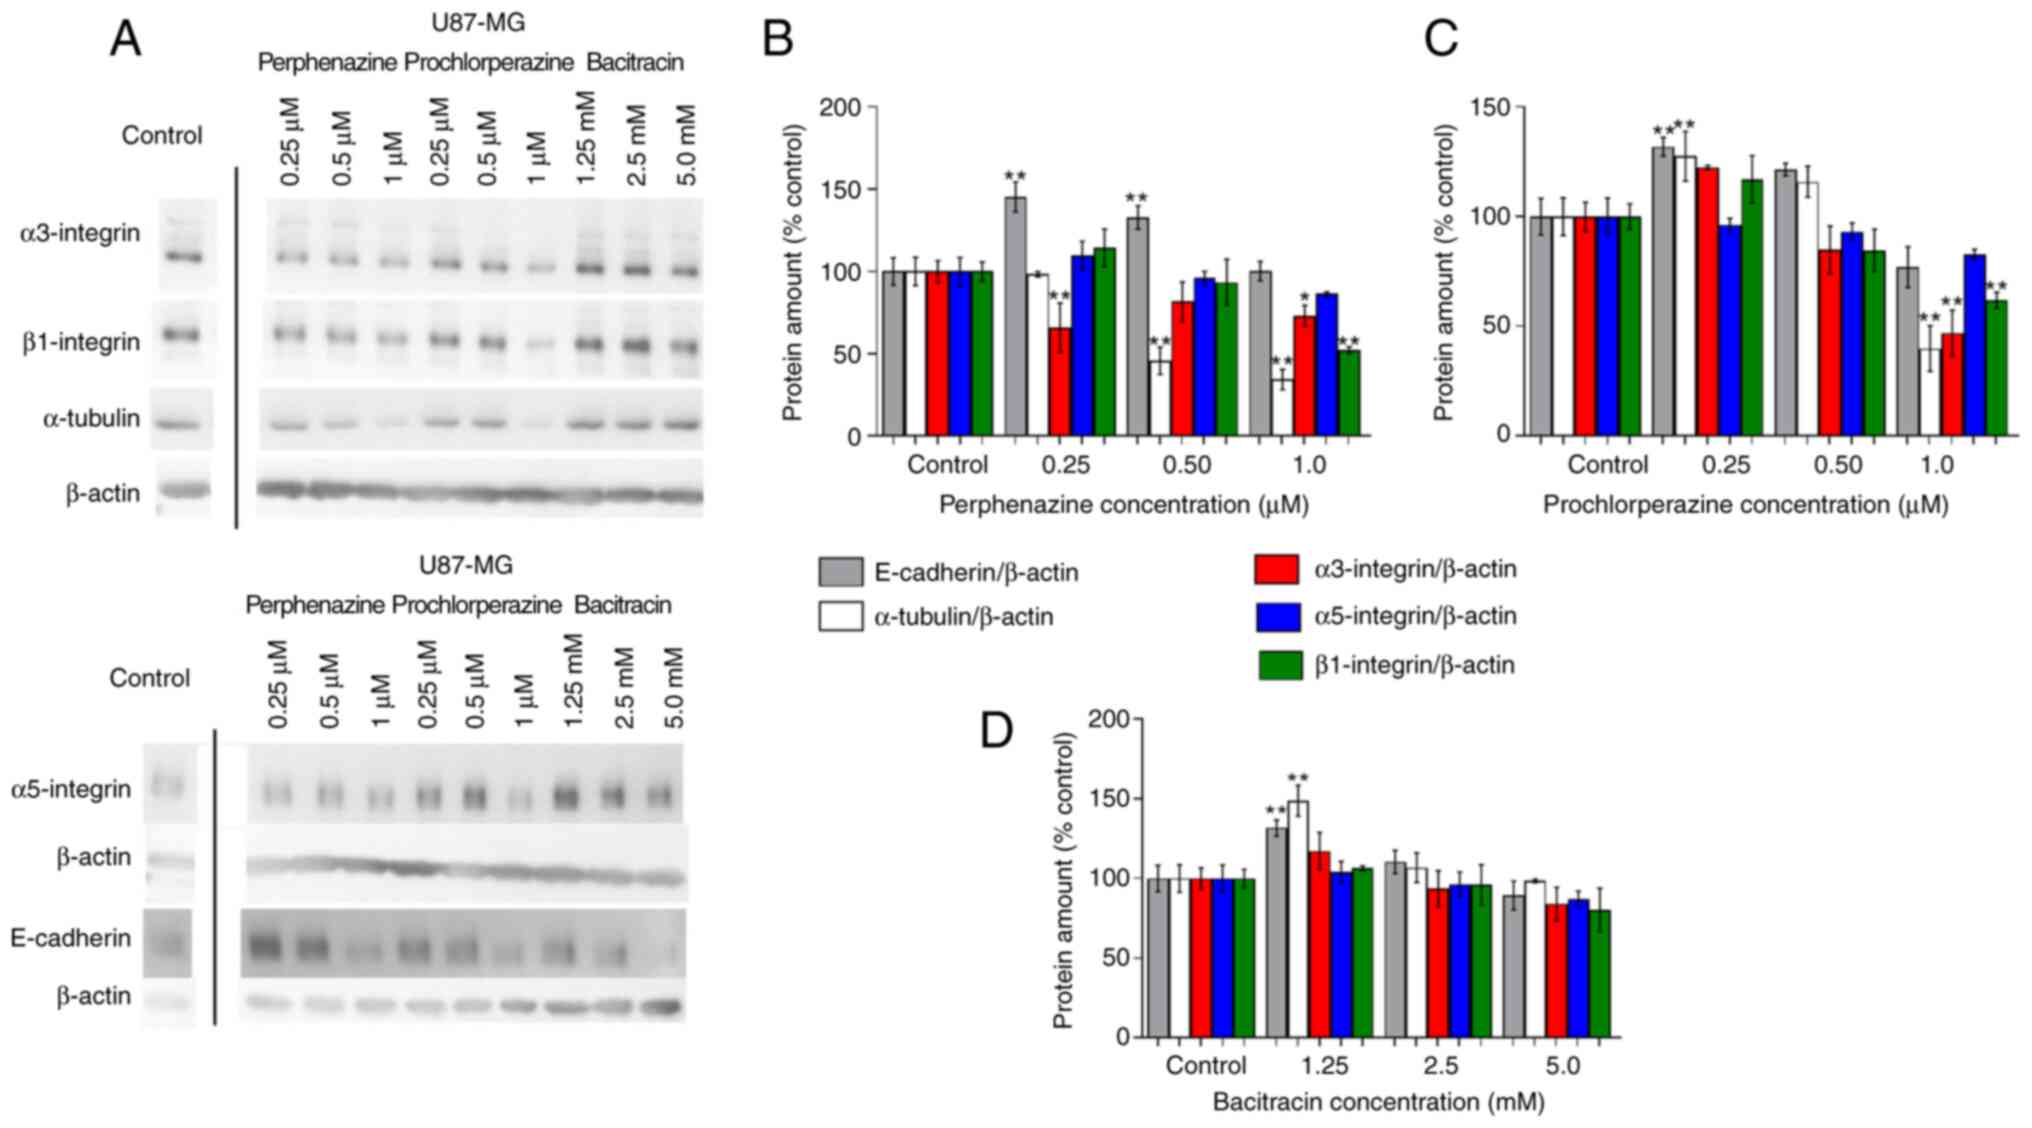 | Figure 4.Western blot analysis and a graph of
the relative amounts of selected proteins, including loading
controls in U-87 MG cells. (A) Representative blots of E-cadherin,
α-tubulin, integrins (α3, α5, and β1), and β-actin. E-cadherin,
α-tubulin, integrins (α3, α5, and β1) relative amounts after (B) 24
h perphenazine treatment, (C) 24 h prochlorperazine treatment, (D)
24 h bacitracin treatment, expressed as % of the control. Lanes
were not continuous on the gel. Mean values ± SD from three
independent experiments (n=3) are presented. *P<0.05,
**P<0.01 vs. the control samples. |
The western blot analysis of E-cadherin showed a
significant increase of the protein amount by 45.3 and 32.8% after
treating U-87 MG cells with perphenazine in the concentration of
0.25 and 0.5 µM, respectively (Fig.
4B). Prochlorperazine in the concentration of 0.25 µM also
significantly increased the level of E-cadherin by 31.8%, while
incubation of the cells with prochlorperazine in the concentration
of 1.0 µM caused a decrease of E-cadherin amount by 23.9% (Fig. 4C). Bacitracin, which was used as an
inhibitor of cellular migration, significantly increased the
E-cadherin amount by 31.7% only in the concentration of 1.25 mM
(Fig. 4D).
The analysis of α-tubulin showed a significant
decrease of 54.3 and 65.7% in U-87 MG cells with perphenazine in
the concentration of 0.5 and 1.0 µM, respectively (Fig. 4B). In the case of prochlorperazine,
the significant increase of α-tubulin by 27.5% was observed with
perphenazine in the concentration of 0.25 µM, while a significant
decrease by 60.2% was observed in the concentration of 1.0 µM
(Fig. 4C). Bacitracin, which was
used as an inhibitor of cellular migration, significantly increased
the α-tubulin amount by 48.7% only in the concentration of 1.25 mM
(Fig. 4D).
The analysis of integrins (α3, α5, and β1) showed a
significant decrease of α3 integrin by 34.2 and 27.1% after
incubation of U-87 MG cells with perphenazine in the concentration
of 0.25 and 1.0 µM, respectively. Moreover, a significant decrease
of β1 integrin by 47.8% was also observed after incubation of U-87
MG cells with perphenazine in the concentration of 1.0 µM. The
analysis of α5 integrin showed that perphenazine did not
significantly decrease the level of α5 integrin (Fig. 4B). In the case of prochlorperazine,
only its concertation of 1.0 µM significantly decreased α3 and β1
integrins by 53.1 and 38.1%, respectively. The analysis of α5
integrin showed that prochlorperazine also did not significantly
decrease the level of α5 integrin (Fig. 4C). Moreover, bacitracin also did
not significantly influence the level of all analyzed integrins
(Fig. 4D).
Discussion
In glioblastoma therapy, many factors should be
taken into consideration. These factors include therapy goals
(regulation of invasion as well as dopamine receptors, VEGF, EGFR,
and PDGFR suppression), and the ability of drugs to penetrate the
blood-brain-barrier. The small populations of glioblastoma cells
can survive the therapy despite surgery, radiation therapy, or
chemotherapy because of their ability to invade the surrounding
brain tissue at any stage of tumor progression (28). Thus, the current study focused on
the impact of phenothiazine derivatives (perphenazine and
prochlorperazine) on migration, invasion, and the ABC transporters
levels in human glioblastoma U-87 MG cells.
Previously, Otręba and Buszman (2018) showed that
perphenazine and prochlorperazine in the concentration of 0.5 and
1.0 µM reduced U-87 MG cells viability by 32 and 54.5% as well as
30.5 and 56.3%, respectively after 24 h-incubation (29). In the present study, we observed a
decrease in ABCB1 amount after 24 h-incubation with perphenazine
and prochlorperazine in the concentration of 1.0 µM. It is worth
noting that ABCB1 also regulates cell proliferation and the
knockdown of ABCB1 suppresses cell proliferation (30). Therefore, a similar cytotoxicity
effect of perphenazine and prochlorperazine (1.0 µM) observed in
the previous study by Otręba and Buszman (2018) can be explained
now by the decrease in ABCB1 amount. Interestingly, in the case of
perphenazine and prochlorperazine in the concentration of 0.1 µM,
the observed significant decrease of ABCB1 amount was not caused by
cell death or proliferation disturbances, since our previous
results of the WST-1 assay (29)
showed that perphenazine in the concentration of 0.1 µM did not
affect U-87 MG cells viability.
The main role of ABCB1 (P-gp) and ABCG2 (BCRP)
transporters, localized in the brain endothelial capillaries
(16), is related to multidrug
resistance (31). The ABCG2
transporter protects tissues against deadly xenobiotic exposures by
the contribution to the absorption, distribution, and elimination
of the drugs and endogenous compounds (32). Thus, high expression of ABCB1 and
ABCG2 has been reported to be related with poor prognosis in
certain glioblastomas (31). Lin
et al (2014) and Wijaya et al (2017) noticed that the
resistance to temozolomide (TMZ) treatment of glioblastoma could be
related to the excretion of the drug from the brain by ABCB1 and
ABCG2 transporters (33,34). Additionally, in 2017, Pan et
al measured ABCG2 protein level and gene expression in four
different human malignant glioma cell lines (A172, U-87, SHG-44,
and U-251). The western blot analysis showed that U87 cells had the
lowest ABCG2 amount among all the cell lines, whereas no
significant differences were found in the mRNA expression levels of
MRP1 and MDR1 in the four GBM cell lines (35). Interestingly, phenothiazine
derivatives such as chlorpromazine (36–38),
prochlorperazine (38),
thioridazine (39), and
fluphenazine (36) impair drug
efflux mediated by P-gp or BCRP. Inhibition properties of those
drugs in the mentioned mechanism has their own significance due to
the possibility of using phenothiazine derivatives in glioblastoma
treatment. Moreover, elacridar inhibits ABC transport activity, but
it can also downregulate the expression of P-gp and BCRP. Abdallah
et al (2021) observed that elacridar (5 µM) significantly
downregulated the expression of P-gp by 40% and BCRP by 53%
(Fig. 4), and suggested NF-κB
pathway as a potential mechanism for BBB disruption. Data from the
in vivo studies showed downregulation of P-gp and BCRP, and
upregulation of the receptor for advanced glycation end products
(RAGE), which accompanied activation of NF-κB pathway in mouse
brains (40). Our study has
confirmed that elacridar impairs P-gp and BCRP levels. We also
observed two bands of ABCG2 protein. It may be assumed that two
bands could be visible on western blot of ABCG2 due to different
glycosylated forms of the protein. Diop and Hrycyna (2005) found
that replacing asparagine with glycine in three possible N-linked
glycosylation sites of ABCG2 (418, 557, and 596) changed molecular
mass. ABCG2 (N418Q) and ABCG2 (N557Q) migrated as a range of bands
between the 50 and 75 kDa, while ABCG2 (N596Q) migrated as a single
species at about 60 kDa. On the other hand, the authors noticed
that the presence of two bands might be caused by the time of
incubation. The half-lives of each of the ABCG2 proteins are
similar in analyzed cells (about 4 to 5 h). Interestingly, the
incubation time up to 3 h resulted in 1 visible band of ABCG2,
while 9 to 20 h of incubation resulted in 2 visible bands
confirming different varieties of ABCG2 (41). In our study cells were incubated
for 24 h before the western blot analysis, consequently 2 bands 60
and 80 kDa could be visible. We also evaluated the effect of
perphenazine and prochlorperazine on wound closure, invasion and
migration of human glioblastoma cell line, determined with the
Transwell assay, since migrating cells at the marginal zones of GBM
tumors are less sensitive to apoptosis, leading in consequence to
the frequent recurrences (42).
The wound-healing assay showed a time-dependent increase in wound
area closure. The significant differences were observed between the
time t0 and 3 h only for the control and perphenazine
(P<0.01), while statistically significant differences were
recorded between t0 and 6, 9, 12 and 24 h for the
control, perphenazine, and prochlorperazine (P<0.01). Moreover,
stronger stimulation of U-87 MG migration after perphenazine (1.0
µM) treatment was observed after 6 h-treatment in comparison to the
use of prochlorperazine. The analysis of the rate of cell migration
after 24 h-incubation showed that the U-87 MG cells in perphenazine
or prochlorperazine tended to migrate more slowly in comparison to
the control. Interestingly, only in the case of prochlorperazine,
the difference is statistically significant (P<0.01) and
suggests that the cells migrate 1.3 times more slowly in
prochlorperazine (1.0 µM) in comparison to the control. The
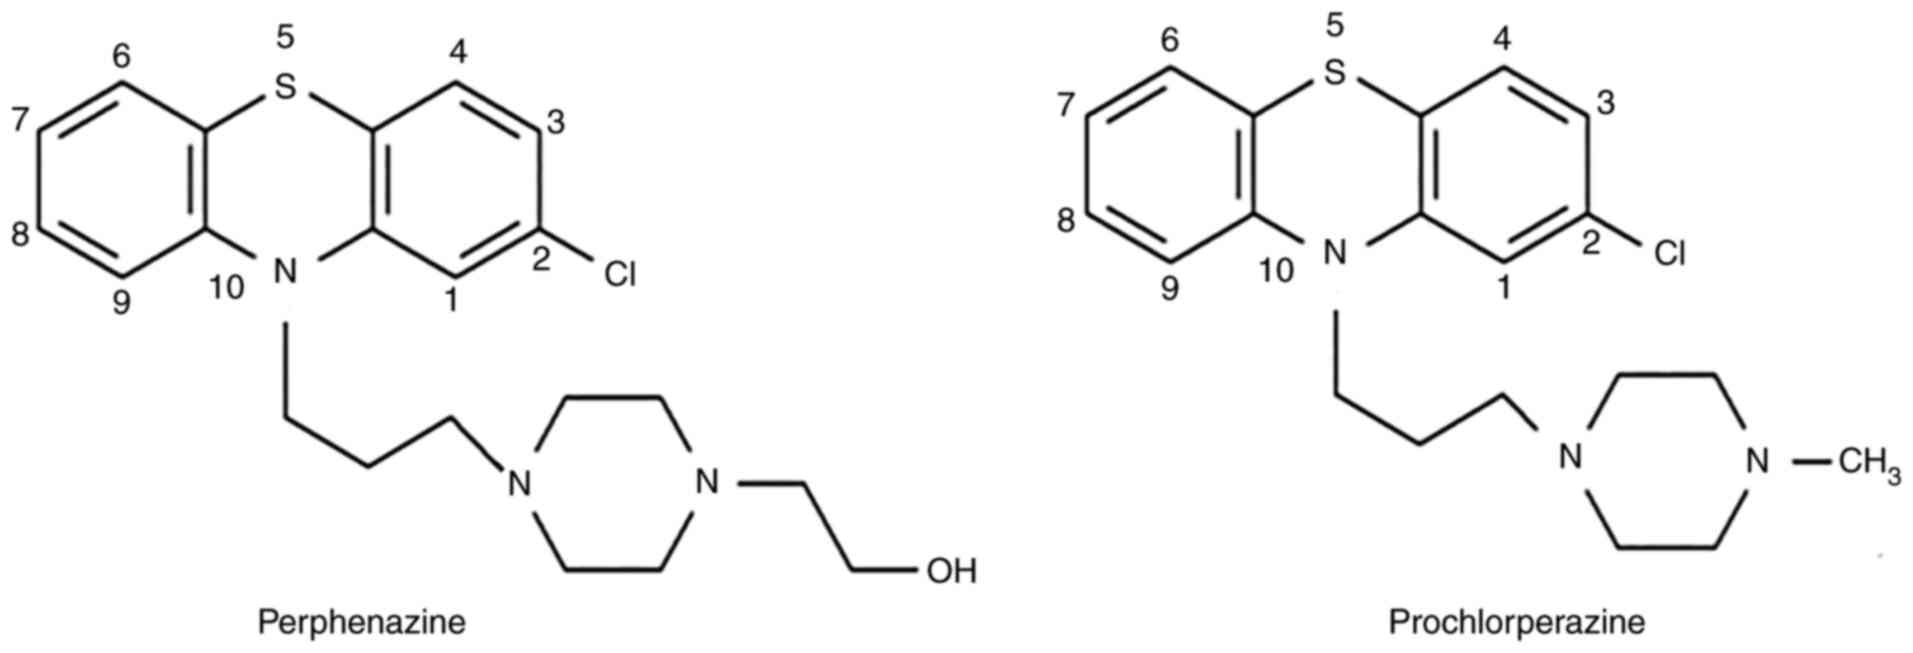
observed difference between perphenazine and prochlorperazine
concerning the rate of cell migration may be caused by differences
in their chemical structure (Fig.
5) and interaction with dopamine receptors. According to the
International Union of Basic and Clinical Pharmacology (IUPHAR) the
main target of perphenazine is DRD2, while DRD2 and DRD3 are the
targets of prochlorperazine (43).
Perphenazine has a 3-[4-(2-hydroxyethyl)piperazin-1-yl]propyl group
at N-10 which interacts mainly with D2 receptor. On the other hand,
prochlorperazine has a 3-(4-methylpiperazin-1-yl)propyl group at
the N-10 position and interacts mainly with D2 and D3. Thus,
prochlorperazine may stimulate more strongly the rate of migration
than perphenazine since the migration of glioblastoma cells depends
on D2 and D3 receptors.
Since regulation of invasion is an important
objective in glioblastoma treatment, by employing the Transwell
assay we analyzed migration and invasion of U-87 MG cells using the
drug concentration (0.5 µM) which caused about a 30% decrease of
cell viability according to our previous study results (29). We decided to use such a
concentration to minimalize the cytotoxicity effect, since we used
growth medium with 1% of FBS. In this case using the concentration
of 1.0 µM, causing about 50% decrease of viability (29), would be very risky because it could
result in death of majority or all analyzed cells. Using of 0.5 µM
concentration is a potential limitation of the study since the
results of migration/invasion could have been affected by the
effect of the drugs on cell viability. The present study showed
that both of the analyzed drugs could decrease migration and
invasion of the cells. It is worth observing that the analysis of
internal control showed that perphenazine (0.5 µM) and
prochlorperazine (0.5 µM) may be a chemoattractant for cellular
invasion and migration but 5–6 times weaker and 3–4 times weaker
than the growth medium with 10% FBS, respectively. This may also
explain the fact that lower percentage of the cells invaded and/or
migrated from the growth medium with 1% FBS and perphenazine or
prochlorperazine to the growth medium with 10% FBS in comparison to
the number of cells which migrated/invaded from the growth medium
with 1% FBS to the growth medium with 10% FBS.
Our findings may be confirmed and explained by the
results of other groups. In 2014, Kast et al suggested that
the migration of subventricular zone (SVZ) cells to glioblastoma as
well as glioblastoma to SVZ was regulated by the D3 dopamine
receptor (4), while in 2020 the
same authors showed that perphenazine reduced migration of
malignant or non-malignant SVZ cells to glioblastoma (44). Thus, the ability of phenothiazines
(perphenazine and prochlorperazine) to decrease migration and
invasion of U-87 MG cells may be related to dopamine receptors
activity, which was confirmed, by Aaberg-Jessen (2013) (45), Bartek and Hodny (2014) (12), Caragher et al (2019)
(46), Weissenrieder et al
(2020) (47), Bhat et al
(2020) (48), and Agrawal et
al (2021) (49). Bartek and
Hodny (2014) described in detail the anti-glioblastoma activity
mechanism of the dopamine receptor subtype 2 (DRD2) antagonists in
combination with epidermal growth factor receptor (EGFR)
inhibitors, which impair cellular growth and survival by
mitogen-activated protein kinase (MEK)/extracellular
signal-regulated kinase (ERK) signaling cascade (12). In 2013 Aaberg-Jessen et al
observed that primary glioblastoma spheroids limited glioma
invasion (45). Caragher et
al (2019) showed that glioblastoma cells such as U251 human
glioblastoma, patient-derived xenograft (PDX), and glioma specimens
(GBM43, GBM12, GBM6, GBM5, and GBM39) could activate DRD2 due to
dopamine generation. The authors noticed also that anti-glioma
chemotherapy may increase DRD2 protein expression, leading to a
four times higher increase in sphere formation capacity (46). In 2020, Weissenrieder et al
reported that they saw clear spheroid formation effects at
selective concentrations of DRD2 modulators. The authors found that
7-day treatment of U-87 MG cells with thioridazine (0.1 µM)
decreased spheroid proliferation and invasive capacity as well as
reduced spheroid formation, and significantly reduced Sox2
expression. Thus, the ability of DRD2 to form spheres in U-87 MG
cell line may be due to other factors (cell-cell adhesion or EGFR
signaling) that may contribute to spheroid formation, but it does
not depend on alteration of marker expression (47). Furthermore, Bhat et al
(2020) used trifluoperazine (phenothiazine derivative) in an in
vivo study to prevent the conversion of glioma cells into
glioma-initiating cells, which led to lengthening of mouse
survival. The authors observed the loss of radiation-induced Nanog
mRNA expression, GSK3 activation, and reduction in p-Akt, Sox2, and
β-catenin levels. In the in vivo study the authors noted
reduction of the sphere-forming capacity in the surviving tumor
cells after trifluoperazine treatment, while the in vitro
study using HK-308 and HK-374 cells showed that trifluoperazine (1
µM) treatment combined with radiation had an additive inhibitory
effect on self-renewal, and formed as many spheroids as saline used
during radiation. The therapy including trifluoperazine and a
single dose of radiation reduced the number of glioma-initiating
cells in vivo, which suggests that this kind of a therapy
increases the efficacy of radiotherapy in glioblastoma treatment
(48). Agrawal et al (2021)
found that dopamine induces the formation of microglia
extracellular traps in glioblastoma multiforme formed by monocytes,
macrophages, eosinophils, basophils, and mast cells. Thus, the
traps play a significant role in sterile neuroinflammation
(49).
Therefore, it is possible that the first generation
of antipsychotics (perphenazine and prochlorperazine), which
penetrate the blood-brain-barrier (12), as DRD2 receptors antagonists
(44) block the receptor
protecting against DRD2 protein expression leading to the increase
in glioblastoma invasion. Our findings confirmed that perphenazine
and prochlorperazine reduced cellular invasion, and this hypothesis
was confirmed by Liu et al (2019), Arrillaga-Romany et
al (2020), and He et al (2021) (50–52).
Liu et al (2019) analyzed the combined effect
of temozolomide and dopamine receptor inhibitors (haloperidol or
risperidone) in glioblastoma therapy. The authors observed that
inhibition of glioblastoma proliferation was more effective in
comparison to monotherapy. It is possible since dopamine inhibitors
can inhibit the extracellular signal-related kinase signaling
pathway and block temozolomide-induced protective autophagy.
Moreover, the authors noticed the increase of the levels of DNA
damage marker (γH2AX) and expression of DRD2 transcripts in U251
glioma and glioblastoma stem cells (50). Interestingly, in 2020 Abbruzzese
et al designed a Phase II clinical trial involving the
combination of chlorpromazine and temozolomide in glioblastoma
treatment. The authors mentioned that chlorpromazine impacted
glioblastoma multiforme growth and survival by the induction of
cancer cell death, nuclear aberrations, autophagy as well as the
inhibition of AKT/mTOR axis, glutamate receptors (AMPA, NMDA), and
D2 dopamine receptors (53).
Arrillaga-Romany et al (2020) used a small-molecule DRD2
antagonist (ONC201) that penetrated the BBB in the treatment of
adult recurrent glioblastoma patients. ONC201 is well tolerated and
induces biomarkers of pharmacodynamic signaling/apoptosis, which
suggests that the DRD2 antagonist may be biologically active in a
subset of glioblastoma patients (51). A recent study He et al
(2021) using patient-derived xenograft (PDX) glioblastoma models
and 25 glioblastoma cell lines showed that EGFR and DRD2 expression
anti-correlates in glioblastoma. Thus, low EGFR expression
glioblastoma is most sensitive to DRD2 inhibition. Moreover, high
EGFR expression is correlated with poor DRD2 expression in
glioblastoma (52).
The observed strong effect of perphenazine and
prochlorperazine on viability, migration, and invasion of human
glioblastoma may be also related to ABCB1 and/or ABCG2 amount and
bone morphogenetic proteins (BMP) family protein BMP4. The Pim-1
protein in ABCB1 influence tumor cell growth by promoting cell
cycle progression, cell migration, and protein translation as well
as by the suppression of apoptosis (54). The overexpression of the
serine/threonine protein kinase Pim-1 is often observed in
different human malignancy tumors including glioblastoma multiforme
(55). Thus, the observed
significant decrease in the ABCB1 level may explain a decrease in
U-87 MG migration. In the case of ABCG2, Liang et al (2015)
showed that in lung cancer ABCG2 (56), localized also in the nucleus of
glioblastoma multiforme (57), was
involved in a transcription regulation of the E-cadherin-encoding
gene (CDH1), which is a key cell-cell adhesion gene. The authors
observed that the ABCG2 overexpression enhanced E-cadherin
expression as well as increased nuclear ABCG2 expression (56). E-cadherin prevents the loss of
cell-cell adhesion and cell junctions, which promotes cellular
invasion and migration (10). The
relative expression of E-cadherin with the use of western blot was
shown in U-87 MG cells by Zhang et al (2015) (58). Another possible mechanism leading
to the increase of E-cadherin and suppression of glioblastoma cells
was found by Zhao et al (2019). The authors observed that
BMP4 protein increased E-cadherin and claudin expression in human
U-251 and U-87 cells through activation of SMAD signaling, which
finally leads to the suppression of tumor cell invasion (28). Therefore, a significant increase in
ABCG2 level after perphenazine and prochlorperazine (0.1 and 1.0
µM) treatment of U-87 MG cells, observed in our study, may explain
the recorded increase in E-cadherin after perphenazine (0.25 and
0.5 µM) and prochlorperazine treatment (0.25 µM), which can lead
finally to a decrease in the migration and invasion of the analyzed
glioblastoma cells. Our results confirm also that E-cadherin is a
negative regulator of U-87 MG migration since the decrease in
E-cadherin level is accompanied by a decline in the cellular
invasion. Although we cannot conclude that E-cadherin expression
regulates invasion of other glioma cells based on these studies
alone, our results do lend further support for this view.
Microtubules as dynamic tubular polymers of α- and
β-tubulin provide structural integrity, promote migration,
transport of molecules, vesicles, and organelles and play important
role in cell division. This makes microtubule polymerization
inhibitors as well as stabilizing and/or destabilizing agents a
good target for the anticancer therapy (59). Zhou et al (2020) found that
sulforaphane-cysteine disrupted microtubules by ERK1/2
phosphorylation-mediated downregulation of α-tubulin and Stathmin-1
leading to the inhibition of U-87 MG and U-373 MG cells migration
and invasion. The authors noticed also lower expressions of
α-tubulin-mediated mitophagy-associated proteins (60). This confirms our results since we
observed a decrease in the α-tubulin level after perphenazine (1.0
µM) and prochlorperazine (0.5 and 1.0 µM) treatment of U-87 MG
cells accompanied by a decline in the U-87 MG migration and
invasion.
Nakada et al (2013) found that the
overexpression of α3 integrin in glioblastoma cells: U87-MG,
surgical neurology branch-19 (SNB19), and U251 increased cellular
migration and/or invasion via the ERK 1/2 pathway, while the
decrease of α3 integrin inhibited glioma invasion. The authors also
observed that the invasion of U-87 MG cells was stronger in α3
integrin overexpressing cells, which suggests that α3 integrin may
be an invasion promotor (61).
This is in line with our results since we observed a decrease in α3
integrin level as well as inhibition of migration and invasion of
U-87 MG cells after 24 h incubation with perphenazine (0.25 and 1.0
µM) and prochlorperazine (1.0 µM).
The α5β1 integrin is called the critical regulator
of cell migration and invasion of many tumors including
glioblastoma since it affects cytoskeleton rearrangement, cell
adhesion, and the production of matrix metalloproteinase (MMP). The
expression of α5β1 integrin is significantly higher in glioblastoma
tissue than in normal brain tissue. The activation of the integrin
stimulates migration, invasion, angiogenesis, and drug resistance
of glioma cells. The stimulation of cellular invasion and
metastasis is possible by the activation of the
c-Met/FAK/Src-dependent signaling pathway or regulation of the
expression and activity of MMPs (62). Mallawaartchy et al (2015)
showed a high level of α5 integrin in U-87 MG cells. The authors
also identified 49 proteins connected with cell invasion. Moreover,
the gene expression data of α5 integrin showed ‘prognostic
significance in independent glioblastoma cohorts’ (63). Renner et al (2016) found
that α5β1 integrin also precipitated the aggressiveness of solid
tumors. Thus, the high expression of the protein may decrease
patient survival, which makes it an important factor in the therapy
(64). Those observations are in
line with our results. We observed a decrease in migration and
invasion of U-87 MG cells after treatment with perphenazine or
prochlorperazine in the concentration of 0.5 µM and a
non-significant decrease in the level of α5 and β1 integrins at the
same concentration. This confirms that α3 integrin is more
important than α5 and β1 integrins for the migration and invasion
of U-87 MG cells. In the case of perphenazine and prochlorperazine
(1.0 µM), only the decrease in α5 integrin is non-significant,
which suggests that the level of α3 and β1 integrins are important
in the regulation of U-87 MG migration and invasion.
In the future, we are planning to use polymerase
chain reaction (PCR) assay to confirm variations of the proteins as
well as to use more human glioblastoma cell lines to get more
generalized conclusions about the possibility of using
phenothiazine derivatives in glioblastoma treatment. Since
phenothiazine derivatives decrease viability, migration, and
invasion of U-87 MG glioblastoma next studies determining the type
of cell death should be performed in near future.
In conclusion, we have found that perphenazine and
prochlorperazine modulate multidrug resistance proteins (decrease
in ABCB1 and cause an increase in ABCG2) amount, increase in
E-cadherin level as well as a decrease in α-tubulin, and integrins
(α3, α5, and β1) levels as well as inhibit migration and invasion
of U-87 MG cells. Our study showed correlation between the cellular
migration and/or invasion and cellular levels of ABCB1, ABCG2,
E-cadherin, α-tubulin, and integrins (α3, α5, and β1). The level of
the analyzed proteins corresponds to the decrease in cellular
migration and/or invasion. Here presented data and previous results
show that perphenazine and prochlorperazine exhibit the anticancer
effects against U-87 MG cells. These findings provided additional
insights into a potential use of phenothiazine derivatives in the
treatment of glioblastoma, and suggested the purpose of the next
research which should include other glioblastoma cell lines and new
methods in order to draw more general conclusions about
anti-glioblastoma effects of phenothiazine derivates.
Supplementary Material
Supporting Data
Acknowledgements
Not applicable.
Funding
This study was funded by the Medical University of Silesia in
Katowice, Poland (grant nos. KNW-2-024-N/9/N, KNW-1-034/K/7/O,
PCN-1-065/K/1/F, and PCN-2-034/K/0/F).
Availability of data and materials
The datasets used and/or analyzed during the
current study are available from the corresponding author on
reasonable request.
Authors' contributions
MO, JS, AKD and ARS conceived and designed the
research. MO, JS and ARS contributed reagents and/or analytical
tools. MO conducted experiments, analyzed data and wrote the
manuscript. MO, JS, AKD and ARS edited the manuscript. MO, JS, AKD
and ARS have read and approved the manuscript. MO and ARS confirm
the authenticity of all the raw data. All authors read and approved
the final manuscript.
Ethics approval and consent to
participate
Not applicable.
Patient consent for publication
Not applicable.
Competing interests
The authors declare that they have no competing
interests.
References
|
1
|
Alphandéry E: Glioblastoma treatments: An
account of recent industrial developments. Front Pharmacol.
9:8792018. View Article : Google Scholar : PubMed/NCBI
|
|
2
|
Hanif F, Muzaffar K, Perveen K, Malhi SM
and Simjee SU: Glioblastoma multiforme: A review of its
epidemiology and pathogenesis through clinical presentation and
treatment. Asian Pacific J Cancer Prev. 18:3–9. 2017.PubMed/NCBI
|
|
3
|
Bai RY, Staedtke V and Riggins GJ:
Molecular targeting of glioblastoma: Drug discovery and therapies.
Trends Mol Med. 17:301–312. 2011. View Article : Google Scholar : PubMed/NCBI
|
|
4
|
Kast RE, Ellingson BM, Marosi C and
Halatsch ME: Glioblastoma treatment using perphenazine to block the
subventricular zone's tumor trophic functions. J Neurooncol.
116:207–212. 2014. View Article : Google Scholar : PubMed/NCBI
|
|
5
|
Wick W, Weller M, Weiler M, Batchelor T,
Yung AW and Platten M: Pathway inhibition: Emerging molecular
targets for treating glioblastoma. Neuro Oncol. 13:566–579. 2011.
View Article : Google Scholar : PubMed/NCBI
|
|
6
|
Masoumi KC, Huang X, Sime W, Mirkov A,
Munksgaard Thorén M, Massoumi R and Lundgren-Åkerlund E: Integrin
α10-antibodies reduce glioblastoma tumor growth and cell migration.
Cancers. 13:11842021. View Article : Google Scholar : PubMed/NCBI
|
|
7
|
Ellert-Miklaszewska A, Poleszak K,
Pasierbinska M and Kaminska B: Integrin signaling in glioma
pathogenesis: From biology to therapy. Int J Mol Sci. 21:8882020.
View Article : Google Scholar : PubMed/NCBI
|
|
8
|
Malric L, Monferran S, Gilhodes J, Boyrie
S, Dahan P, Skuli N, Sesen J, Filleron T, Kowalski-Chauvel A,
Cohen-Jonathan Moyal E, et al: Interest of integrins targeting in
glioblastoma according to tumor heterogeneity and cancer stem cell
paradigm: An update. Oncotarget. 8:86947–86968. 2017. View Article : Google Scholar : PubMed/NCBI
|
|
9
|
Lee CC, Cheng YC, Chang CY, Lin CM and
Chang JY: Alpha-tubulin acetyltransferase/MEC-17 regulates cancer
cell migration and invasion through epithelial-mesenchymal
transition suppression and cell polarity disruption. Sci Rep.
8:174772018. View Article : Google Scholar : PubMed/NCBI
|
|
10
|
Na TY, Schecterson L, Mendonsa AM and
Gumbiner BM: The functional activity of E-cadherin controls tumor
cell metastasis at multiple steps. Proc Natl Acad Sci USA.
117:5931–5937. 2020. View Article : Google Scholar : PubMed/NCBI
|
|
11
|
Wick W, Osswald M, Wick A and Winkler F:
Treatment of glioblastoma in adults. Ther Adv Neurol Disord.
11:17562864187904522018. View Article : Google Scholar : PubMed/NCBI
|
|
12
|
Bartek J and Hodny Z: Dopamine signaling:
Target in glioblastoma. Oncotarget. 5:1116–1117. 2014. View Article : Google Scholar : PubMed/NCBI
|
|
13
|
Motohashi N, Kawase M, Satoh K and
Sakagami H: Cytotoxic potential of phenothiazines. Curr Drug
Targets. 7:1055–1066. 2006. View Article : Google Scholar : PubMed/NCBI
|
|
14
|
Sudeshna G and Parimal K: Multiple
non-psychiatric effects of phenothiazines: A review. Eur J
Pharmacol. 648:6–14. 2010. View Article : Google Scholar : PubMed/NCBI
|
|
15
|
Otręba M and Kośmider L: In vitro
anticancer activity of fluphenazine, perphenazine and
prochlorperazine. A review. J Appl Toxicol. 41:82–94. 2021.
View Article : Google Scholar : PubMed/NCBI
|
|
16
|
Balça-Silva J, Matias D, Carmo AD,
Sarmento-Ribeiro AB, Lopes MC and Moura-Neto V: Cellular and
molecular mechanisms of glioblastoma malignancy: Implications in
resistance and therapeutic strategies. Semin Cancer Biol.
58:130–141. 2018. View Article : Google Scholar : PubMed/NCBI
|
|
17
|
Otręba M, Pajor M and Warncke JD:
Antimelanoma activity of perphenazine and prochlorperazine in human
COLO829 and C32 cell lines. Naunyn Schmiedebergs Arch Pharmacol.
392:1257–1264. 2019. View Article : Google Scholar : PubMed/NCBI
|
|
18
|
Atif F, Patel NR, Yousuf S and Stein DG:
The synergistic effect of combination progesterone and temozolomide
on human glioblastoma cells. PLoS One. 10:e01314412015. View Article : Google Scholar : PubMed/NCBI
|
|
19
|
Yelskaya Z, Carrillo V, Dubisz E, Gulzar
H, Morgan D and Mahajan SS: Synergistic inhibition of survival,
proliferation, and migration of U87 cells with a combination of
LY341495 and Iressa. PLoS One. 8:e645882013. View Article : Google Scholar : PubMed/NCBI
|
|
20
|
Haque S, Norbert CC, Acharyya R, Mukherjee
S, Kathirvel M and Patra CR: Biosynthesized silver nanoparticles
for cancer therapy and in vivo bioimaging. Cancers. 13:61142021.
View Article : Google Scholar : PubMed/NCBI
|
|
21
|
Sengul E and Elitas M: Single-cell
mechanophenotyping in microfluidics to evaluate behavior of U87
glioma cells. Micromachines (Basel). 11:8452020. View Article : Google Scholar : PubMed/NCBI
|
|
22
|
Kabała-Dzik A, Rzepecka-Stojko A, Kubina
R, Jastrzębska-Stojko Ż, Stojko R, Wojtyczka RD and Stojko J:
Migration rate inhibition of breast cancer cells treated by caffeic
acid and caffeic acid phenethyl ester: An in vitro comparison
study. Nutrients. 9:11442017. View Article : Google Scholar : PubMed/NCBI
|
|
23
|
Grada A, Otero-Vinas M, Prieto-Castrillo
F, Obagi Z and Falanga V: Research techniques made simple: Analysis
of collective cell migration using the wound healing assay. J
Invest Dermatol. 137:e11–e16. 2017. View Article : Google Scholar : PubMed/NCBI
|
|
24
|
Devereaux J, Dargahi N, Fraser S, Nurgali
K, Kiatos D and Apostolopoulos V: Leucocyte-rich platelet-rich
plasma enhances fibroblast and extracellular matrix activity:
Implications in wound healing. Int J Mol Sci. 21:65192020.
View Article : Google Scholar : PubMed/NCBI
|
|
25
|
Bernhart E, Damm S, Wintersperger A,
DeVaney T, Zimmer A, Raynham T, Ireson C and Sattler W: Protein
kinase D2 regulates migration and invasion of U87MG glioblastoma
cells in vitro. Exp Cell Res. 319:2037–2048. 2013. View Article : Google Scholar : PubMed/NCBI
|
|
26
|
Limame R, Wouters A, Pauwels B, Fransen E,
Peeters M, Lardon F, De Wever O and Pauwels P: Comparative analysis
of dynamic cell viability, migration and invasion assessments by
novel real-time technology and classic endpoint assays. PLoS One.
7:e465362012. View Article : Google Scholar : PubMed/NCBI
|
|
27
|
Li S, Li C, Ryu HH, Lim SH, Jang WY and
Jung S: Bacitracin inhibits the migration of U-87 MG glioma cells
via interferences of the integrin outside-in signaling pathway. J
Korean Neurosurg Soc. 59:106–116. 2016. View Article : Google Scholar : PubMed/NCBI
|
|
28
|
Zhao X, Sun Q, Dou C, Chen Q and Liu B:
BMP4 inhibits glioblastoma invasion by promoting E-cadherin and
claudin expression. Front Biosci (Landmark Ed). 24:1060–1070. 2019.
View Article : Google Scholar : PubMed/NCBI
|
|
29
|
Otręba M and Buszman E: Perphenazine and
prochlorperazine induce concentration-dependent loss in human
glioblastoma cells viability. Die Pharmazie. 73:19–21.
2018.PubMed/NCBI
|
|
30
|
Muriithi W, Macharia LW, Heming CP,
Echevarria JL, Nyachieo A, Filho PN and Neto VM: ABC transporters
and the hallmarks of cancer: Roles in cancer aggressiveness beyond
multidrug resistance. Cancer Biol Med. 17:253–269. 2020. View Article : Google Scholar : PubMed/NCBI
|
|
31
|
Liu Y, Li Q, Zhou L, Xie N, Nice EC, Zhang
H, Huang C and Lei Y: Cancer drug resistance: Redox resetting
renders a way. Oncotarget. 7:42740–42761. 2016. View Article : Google Scholar : PubMed/NCBI
|
|
32
|
Gupta SK, Singh P, Ali V and Verma M: Role
of membrane-embedded drug efflux ABC transporters in the cancer
chemotherapy. Oncol Rev. 14:4482020. View Article : Google Scholar : PubMed/NCBI
|
|
33
|
Lin F, de Gooijer MC, Roig EM, Buil LC,
Christner SM, Beumer JH, Würdinger T, Beijnen JH and van Tellingen
O: ABCB1, ABCG2, and PTEN determine the response of glioblastoma to
temozolomide and ABT-888 therapy. Clin Cancer Res. 20:2703–2713.
2014. View Article : Google Scholar : PubMed/NCBI
|
|
34
|
Wijaya J, Fukuda Y and Schuetz JD:
Obstacles to brain tumor therapy: Key ABC transporters. Int J Mol
Sci. 18:25442017. View Article : Google Scholar : PubMed/NCBI
|
|
35
|
Pan L, Lin H, Tian S, Bai D, Kong Y and Yu
L: The sensitivity of glioma cells to pyropheophorbide-αmethyl
ester-mediated photodynamic therapy is enhanced by inhibiting
ABCG2. Lasers Surg Med. 49:719–726. 2017. View Article : Google Scholar : PubMed/NCBI
|
|
36
|
Abdallah HM, Al-Abd AM, El-Dine RS and
El-Halawany AM: P-glycoprotein inhibitors of natural origin as
potential tumor chemo-sensitizers: A review. J Adv Res. 6:45–62.
2015. View Article : Google Scholar : PubMed/NCBI
|
|
37
|
Wang JS, Zhu HJ, Markowitz JS, Donovan JL,
Yuan HJ and Devane CL: Antipsychotic drugs inhibit the function of
breast cancer resistance protein. Basic Clin Pharmacol Toxicol.
103:336–341. 2008. View Article : Google Scholar : PubMed/NCBI
|
|
38
|
Wesołowska O: Interaction of
phenothiazines, stilbenes and flavonoids with multidrug
resistance-associated transporters, P-glycoprotein and MRP1. Acta
Biochim Pol. 58:433–448. 2011. View Article : Google Scholar : PubMed/NCBI
|
|
39
|
Spengler G, Csonka Á, Molnár J and Amaral
L: The anticancer activity of the old neuroleptic
phenothiazine-type drug thioridazine. Anticancer Res. 36:5701–5706.
2016. View Article : Google Scholar : PubMed/NCBI
|
|
40
|
Abdallah IM, Al-Shami KM, Yang E and
Kaddoumi A: Blood-brain barrier disruption increases
amyloid-related pathology in TgSwDI mice. Int J Mol Sci.
22:12312021. View Article : Google Scholar : PubMed/NCBI
|
|
41
|
Diop NK and Hrycyna CA: N-Linked
glycosylation of the human ABC transporter ABCG2 on asparagine 596
is not essential for expression, transport activity, or trafficking
to the plasma membrane. Biochemistry. 44:5420–5429. 2005.
View Article : Google Scholar : PubMed/NCBI
|
|
42
|
Sarafian V, Koev I and Staykov D:
Mechanisms of cell resistance in glioblastoma multiforme. J IMAB.
1:6–8. 2009.
|
|
43
|
Web page of International Union of Basic
and Clinical Pharmacology. https://www.guidetopharmacology.org/(access
08.02.2022).
|
|
44
|
Kast RE: Adding perphenazine to increase
effectiveness of standard glioblastoma chemoirradiation. J BUON.
25:1676–1686. 2020.PubMed/NCBI
|
|
45
|
Aaberg-Jessen C, Nørregaard A, Christensen
K, Pedersen CB, Andersen C and Kristensen BW: Invasion of primary
glioma- and cell line-derived spheroids implanted into
corticostriatal slice cultures. Int J Clin Exp Pathol. 6:546–560.
2013.PubMed/NCBI
|
|
46
|
Caragher SP, Shireman JM, Huang M, Miska
J, Atashi F, Baisiwala S, Hong Park C, Saathoff MR, Warnke L, Xiao
T, et al: Activation of dopamine receptor 2 prompts transcriptomic
and metabolic plasticity in glioblastoma. J Neurosci. 9:1982–1993.
2019. View Article : Google Scholar : PubMed/NCBI
|
|
47
|
Weissenrieder JS, Reed JL, Green MV,
Moldovan GL, Koubek EJ, Neighbors JD and Hohl RJ: The dopamine D2
receptor contributes to the spheroid formation behavior of U87
glioblastoma cells. Pharmacology. 105:19–27. 2020. View Article : Google Scholar : PubMed/NCBI
|
|
48
|
Bhat K, Saki M, Vlashi E, Cheng F,
Duhachek-Muggy S, Alli C, Yu G, Medina P, He L, Damoiseaux R, et
al: The dopamine receptor antagonist trifluoperazine prevents
phenotype conversion and improves survival in mouse models of
glioblastoma. Proc Natl Acad Sci USA. 117:11085–11096. 2020.
View Article : Google Scholar : PubMed/NCBI
|
|
49
|
Agrawal I, Sharma N, Saxena S, Arvind S,
Chakraborty D, Chakraborty DB, Jha D, Ghatak S, Epari S, Gupta T
and Jha S: Dopamine induces functional extracellular traps in
microglia. iScience. 24:1019682021. View Article : Google Scholar : PubMed/NCBI
|
|
50
|
Liu Z, Jiang X, Gao L, Liu X, Li J, Huang
X and Zeng T: Synergistic suppression of glioblastoma cell growth
by combined application of temozolomide and dopamine D2 receptor
antagonists. World Neurosurg1. 28:e468–e477. 2019. View Article : Google Scholar
|
|
51
|
Arrillaga-Romany I, Odia Y, Prabhu VV,
Tarapore RS, Merdinger K, Stogniew M, Oster W, Allen JE, Mehta M,
Batchelor TT and Wen PY: Biological activity of weekly ONC201 in
adult recurrent glioblastoma patients. Neuro Oncol. 22:94–102.
2020. View Article : Google Scholar : PubMed/NCBI
|
|
52
|
He Y, Li J, Koga T, Ma J, Dhawan S, Suzuki
Y, Furnari F, Prabhu VV, Allen JE and Chen CC: Epidermal growth
factor receptor as a molecular determinant of glioblastoma response
to dopamine receptor D2 inhibitors. Neuro Oncol. 23:400–411. 2021.
View Article : Google Scholar : PubMed/NCBI
|
|
53
|
Abbruzzese C, Matteoni S, Persico M,
Villani V and Paggi MG: Repurposing chlorpromazine in the treatment
of glioblastoma multiforme: Analysis of literature and forthcoming
steps. J Exp Clin Cancer Res. 39:262020. View Article : Google Scholar : PubMed/NCBI
|
|
54
|
Brasó-Maristany F, Filosto S, Catchpole S,
Marlow R, Quist J, Francesch-Domenech EA, Plumb D, Zakka L,
Gazinska P, Liccardi G, et al: PIM1 kinase regulates cell death,
tumor growth and chemotherapy response revealing a novel target in
triple-negative breast cancer. Nat Med. 22:1303–1313. 2016.
View Article : Google Scholar : PubMed/NCBI
|
|
55
|
Herzog S, Fink MA, Weitmann K, Friedel C,
Hadlich S, Langner S, Kindermann K, Holm T, Böhm A, Eskilsson E, et
al: Pim1 kinase is upregulated in glioblastoma multiforme and
mediates tumor cell survival. Neuro Ooncol. 17:223–242. 2015.
View Article : Google Scholar : PubMed/NCBI
|
|
56
|
Liang SC, Yang CY, Tseng JY, Wang HL, Tung
CY, Liu HW, Chen CY, Yeh YC, Chou TY, Yang MH, et al: ABCG2
localizes to the nucleus and modulates CDH1 expression in lung
cancer cells. Neoplasia. 17:265–278. 2015. View Article : Google Scholar : PubMed/NCBI
|
|
57
|
Bhatia P, Bernier M, Sanghvi M, Moaddel R,
Schwarting R, Ramamoorthy A and Wainer IW: Breast cancer resistance
protein (BCRP/ABCG2) localises to the nucleus in glioblastoma
multiforme cells. Xenobiotica. 42:748–755. 2012. View Article : Google Scholar : PubMed/NCBI
|
|
58
|
Zhang S, Han L, Wei J, Shi Z, Pu P, Zhang
J, Yuan X and Kang C: Combination treatment with doxorubicin and
microRNA-21 inhibitor synergistically augments anticancer activity
through upregulation of tumor suppressing genes. Int J Oncol.
46:1589–1600. 2015. View Article : Google Scholar : PubMed/NCBI
|
|
59
|
Calinescu AA and Castro MG: Microtubule
targeting agents in glioma. Transl Cancer Res. 5 (Suppl 1):S54–S60.
2016. View Article : Google Scholar : PubMed/NCBI
|
|
60
|
Zhou Y, Wang Y, Wu S, Yan Y, Hu Y, Zheng
Z, Li J and Wu W: Sulforaphane-cysteine inhibited migration and
invasion via enhancing mitophagosome fusion to lysosome in human
glioblastoma cells. Cell Death Dis. 11:8192020. View Article : Google Scholar : PubMed/NCBI
|
|
61
|
Nakada M, Nambu E, Furuyama N, Yoshida Y,
Takino T, Hayashi Y, Sato H, Sai Y, Tsuji T, Miyamoto KI, et al:
Integrin α3 is overexpressed in glioma stem-like cells and promotes
invasion. Br J Cancer. 108:2516–2524. 2013. View Article : Google Scholar : PubMed/NCBI
|
|
62
|
Hou J, Yan D, Liu Y, Huang P and Cui H:
The roles of integrin α5β1 in human cancer. Onco Targets Ther.
13:13329–13344. 2020. View Article : Google Scholar : PubMed/NCBI
|
|
63
|
Mallawaaratchy DM, Buckland ME, McDonald
KL, Li CC, Ly L, Sykes EK, Christopherson RI and Kaufman KL:
Membrane proteome analysis of glioblastoma cell invasion. J
Neuropathol Exp Neurol. 74:425–441. 2015. View Article : Google Scholar : PubMed/NCBI
|
|
64
|
Renner G, Janouskova H, Noulet F, Koenig
V, Guerin E, Bär S, Nuesch J, Rechenmacher F, Neubauer S, Kessler
H, et al: Integrin α5β1 and p53 convergent pathways in the control
of anti-apoptotic proteins PEA-15 and survivin in high-grade
glioma. Cell Death Differ. 23:640–653. 2016. View Article : Google Scholar : PubMed/NCBI
|