Introduction
As the most prevalent type solid renal tumors, the
prevalence of renal cell carcinoma (RCC) has been increasing with a
prevalence of 2–4% over recent decades (1). Among other subtypes of renal cancers,
clear cell renal cell carcinoma (ccRCC) has become of increasing
concern due to its high rate of occurrence (>90% of all RCC
cases) and declining overall survival rate (2,3).
Effective adjuvant therapy remains an urgent unfulfilled
requirement for reducing the risk of recurrence whilst improving
outcomes. Previous studies have explored the possibility of
chemotherapy, radiotherapy, cytokine therapy, hormonal treatment
therapy and tumor cell vaccines as potential adjuvant options
(4,5). However, all of these studies yielded
disappointing results (4,5). Therefore, tailored treatment
strategies are becoming increasingly reliant on accurate
risk-stratification approaches (6–8),
which offer hope to patients with ccRCC for improving the curative
effects of implemented interventions and the long-term survival
rate.
For making clinical intervention decisions, recent
risk-stratification characteristics remain insufficient, since and
20–30% patients who were diagnosed with T1-2 stages ccRCC suffered
from metastasis within 1–2 years following surgery (6,9).
Emerging biomarkers have been previously proposed based on
multi-gene signatures or clinical features (7–9).
However, due to the technological bias across the high-throughput
platforms and difference among normalization methods, their
predictive ability remains limited and will scarcely be used for
the individualized therapy of patients with ccRCC in the
foreseeable future (6–8). Therefore, novel biomarkers with
higher prognostic predictive potential are urgently required for
optimizing the tailored clinical management protocol for patients
with ccRCC to achieve significant tumor remission.
Biomarkers based on inflammatory responses or
signaling pathways are showing promise for survival estimation and
for guiding the design of personalized treatment for patients with
ccRCC (10–12). This is mainly due to the impact of
inflammation on tumor phenotype and efficacy of clinical treatment
(10–12). Inflammation has emerged as one of
the main hallmarks of cancer progression (13,14)
and has been reported to serve a key role in tumor occurrence and
outcome (15,16). Tumor-associated macrophages have
been indicated to be stimulators of tumor cell proliferation and
facilitators of angiogenesis, invasion and metastasis (17,18).
A previous study has shown that inflammatory cytokines and
chemokines generated by tumor cells and/or tumor-associated white
blood cells and platelets may directly lead to malignant
progression in human cancer, including cervix, and head and neck
cancers (19). For ccRCC, IL-6 is
an inflammatory cytokine with multiple biological effects that has
been reported to enhance the proliferation of ccRCC cells (20,21).
These reports support the application of anti-inflammatory
therapeutics or agents for ccRCC, which have generally demonstrated
satisfactory efficacy (10).
Simvastatin, which is an inhibitor of the AKT, mTOR and ERK
signaling pathways in addition to being an inhibitor of
IL-6-induced JAK2/STAT3 activation, was shown to be able to inhibit
the proliferation and migration of ccRCC cells (10,22).
However, knowledge gaps remain in the field of clinical management
regarding the ability of an inflammation-specific prognostic
signature to predict the long-term survival rate of patients with
ccRCC.
In the present study, the prognostic potential of
inflammation-associated molecules in ccRCC was systematically
assessed, based on which an inflammation-associated prognostic
signature (IPS) was developed using a multi-step process. The IPS
was confirmed as being a highly effective and robust biomarker for
the prognostic prediction and risk stratification of patients with
ccRCC. Of note, the underlying immune mechanisms, dysregulated
biological functions and pathways within the interactive network of
identified inflammation-associated genes (IGs) were clarified to
understand the processes that can impact the overall survival time
in the low- and high-risk groups. To facilitate clinical
application, a nomogram combining IPS and clinical characteristics
was developed.
Materials and methods
Data retrieval and processing
RNA expression data obtained by RNA sequencing and
the clinical records of 607 patients with ccRCC were acquired from
The Cancer Genome Atlas (www.tcga.org).
Only patients with complete clinical records were included in the
study, which resulted in the study's sample size being reduced to
522.
In addition, six clinical samples of ccRCC (mean ±
SD age, 51±13.48 years; 5 males and, 1 female) were collected from
patients at the Renmin Hospital of Wuhan University (Wuhan, China)
between March 2017 and May 2018. Inclusion criteria: Only ccRCC was
included. Low-grade ccRCC: No lymph node metastasis and distant
metastasis. High-grade ccRCC: Lymph node metastasis or distant
metastasis occurred. Exclusion criteria: Exclusion papillary
carcinoma and chromophobe renal carcinoma. Low-grade ccRCC: Lymph
node metastasis and distant metastasis occurred. High-grade ccRCC:
No lymph node metastasis or distant metastasis. Full informed
consent in written form was provided by those subjects and the
Ethics Committee of Renmin Hospital of Wuhan University issued the
ethical approval (approval no. 2017K-C015). The clinicopathological
data of these 6 patients are presented at Table SI.
RNA expression data were standardized using
fragments per kilobase of exon model per million mapped fragments
(FPKM) and then converted using the following formula to facilitate
further analysis: Gene expression=log2(FPKM +1).
Public data for the present study were acquired in
October 2020 and analyzed between November and December 2020. For
further prognostic signature modeling and validation, the overall
study cohort was randomly divided 1:1 into the training cohort and
validation cohort.
Identification of IGs impacting the
prognosis of patients with ccRCC
According to the dataset provided by the Gene
Ontology (GO) database (geneontology.org), genes involved in
inflammatory responses and pathways considered to be IGs were
retrieved by filtering terms containing ‘inflammatory’ or
‘inflammation’ (Table SII). The
IG expression profiles were extracted from the converted RNA
expression profiles of patients with ccRCC. Iterative univariate
Cox regression and log-rank tests were then performed via R
software (version 4.0.2) for each extracted IG of a clinical sample
of ccRCC. IGs with P<0.05 from both Cox regression and log-rank
tests were considered to be those that significantly impacted the
prognosis of patients with ccRCC (IGPs). In the present study,
prognosis is represented by overall survival (OS).
IPS modeling
To minimize the risk of overfitting, least absolute
shrinkage and selection operator (LASSO) regression was used to
create subsets of candidate IGPs. LASSO regression was performed
using the ‘glmnet’ package (version 4.0) in R (23). Upon completion, multicollinear IGPs
and IGPs that had little influence on ccRCC prognosis were
eliminated using the stepwise method (24). With this typical method, the Akaike
information criterion (AIC) approach (24) was used for eliminating independent
variables that share little association with the dependent
variable. The model with the smallest AIC during the stepwise
process was considered to be the best model. Therefore, the IPS was
constructed using a multivariate Cox proportional-hazards
regression model, which was calculated using the following formula
(24):
Where n represents the total number of IGPs included
in the IPS, βi represents the regression coefficient of
gene i and Ei represents the converted expression level
of gene i. For the present study, the ‘survival’ package (25) in R software was used for
constructing the IPS.
Validation of the IPS
A receiver operating characteristic (ROC) curve was
used to calculate the area under the ROC curve (AUC), which was
then applied to evaluate the accuracy of prognosis prediction by
IPS. As previously reported (26),
an optimal cut-off value of the IPS score was derived using the
Youden index in the ROC curve from the training cohort for
classifying patients with ccRCC into the high- or low-risk groups.
Kaplan-Meier curve and log-rank test were then used to detect any
potential difference between the high- and low-risk groups in the
training and validation cohort. To validate whether the IPS is able
to independently predict the prognosis of patients with ccRCC,
univariate and multivariate Cox regression analyses were performed
in the training and validation cohort. For further investigation of
the correlation between the IPS score and overall survival time of
patients with ccRCC, Pearson's correlation analysis was performed.
The Kaplan-Meier, log-rank, ROC curve and Cox regression were all
performed using the ‘rms’, ‘survival’ and ‘survminer’ packages in R
software, where the results of each were visualized in R
software.
Functional annotation and
analysis
For clarifying the biological roles of the IGPs in
the development of ccRCC, GO and Kyoto Encyclopedia of Genes and
Genomes (KEGG) enrichment analyses were performed in R software to
elucidate the biological processes, cellular components, molecular
functions and pathways regulated by the IGPs; an adjusted P-value
of <0.05 was deemed as statistically significant. To further
determine the interactive networks among the IGPs, a
protein-protein interaction (PPI) network analysis was performed
using the STRING dataset (string-db.org; version 11.5, interaction
score >0.4) and visualized using Cytoscape software (version
3.0.1).
Differences in immune cell
infiltration between risk groups
Cell type identification through the estimation of
relative subsets of RNA transcripts (CIBERSORT) is a deconvolution
algorithm that was developed by Newman et al (27). It was used for the calculation of
the abundance of infiltrating immune cells for each sample included
in the study, based on 22 sets of data containing the profiles of
infiltrating immune cell-associated genes (27). The degree of immune cell
infiltration in the low- and high-risk groups was estimated using
CIBERSORT and its provided gene set LM22 (27). According to a previous study
(24), the CIBERSORT algorithm was
applied with 1,000 simulations and the results were filtered with
P<0.05.
Reverse transcription-quantitative PCR
(RT-qPCR)
In line with the protocol of a previous study
(28), reverse transcription and
qPCR were performed according to the instructions provided by the
manufacturer [PrimeScript™ RT reagent kit with gDNA Eraser; cat no.
RR047A; TB Green Premix Ex Taq II (Tli RNase H Plus); cat. no.
RR820A; both from Takara Bio, Inc.]. In brief, total RNAs were
purified from six clinical ccRCC samples using TRIzol®
agent (cat. no. R0016; Beyotime Institute of Biotechnology), and
then the purified RNAs were incubated with gDNA Eraser for 2 min at
42°C to erase gDNA and then transcribed into cDNA by using the
PrimeScript™ RT Enzyme Mix I and RT Primer Mix (37°C for 15 min and
then 85°C for 5 sec). Subsequently, real-time fluorescent qPCR was
used to measure the relative corresponding gene expression relative
to GAPDH using the following conditions: 40 cycles of 95°C for 5
sec and 60°C for 35 sec. Quantification was performed using the
2−ΔΔCq method (29).
The primers were as follows (30–41):
ADCY1 forward, 5′-CAGCACTTCCTCATGTCCAA-3′ and reverse,
5′-CCAGTGCTATCCATCCGACT-3′; ADIPOQ forward,
5′-TGGTGAGAAGGGTGAGAA-3′ and reverse, 5′-AGATCTTGGTAAAGCGAATG-3′;
ADORA2B forward, 5′-TGCACTGACTTCTACGGCTG-3′ and reverse,
5′-GGTCCCCGTGACCAAACTT-3′; CCL7 forward, 5′-GCCTCTGCAGCACTTCTGTG-3′
and reverse, 5′-CACTTCTGTGTGGGGTCAGC-3′; CXCL3 forward,
5′-GCAGGGAATTCACCTCAAGA-3′ and reverse, 5′-GGTGCTCCCCTTGTTCAGTA-3′;
GPS2 forward, 5′-AGTGACCTGACCACCCTAACA-3′ and reverse,
5′-CCTGGGCGATTGTGTCCTC-3′; HGF forward, 5′-TGGGACAAGAACATGGAAGA-3′
and reverse, 5′-GCATCATCATCTGGATTTCG-3′; IL1RL2 forward,
5′-TCTTATACCCCAAGTACCCG-3′ and reverse, 5′-ACTGCTCTGTGAAGTCCCC-3′;
IL4 forward, 5′-TCTCACCTCCCAACTGCTTCCCC-3′ and reverse,
5′-AGAGGTTCCTGTCGAGCCGTTTCA-3′; IL17C forward,
5′-CAACCGATCCACCTCACCTT-3′ and reverse, 5′-GGCACTTTGCCTCCCAGAT-3′;
IL22 forward, 5′-CACTGCAGGCTTGACAAG-3′ and reverse,
5′-CTTAGCCTGTTGCTGAGC-3′; LIPA forward, 5′-TCTGGACCCTGCATTCTGAG-3′
and reverse, 5′-CACTAGGGAATCCCCAGTAAGAG-3′; LRRC19 forward,
5′-ATGAAAGTCACAGGCATCACAATCC-3′ and reverse,
5′-'ATTTTCTTCACATAATTCATGGATA-3′; LTB4R2 forward,
5′-GGGTGTAAAGGGACGTGCACAG-3′ and reverse,
5′-GCTTGTGCTGTTTCCTGGCAAG-3′; RORA forward,
5′-AAAAACATGGAGTCAGCTCCG-3′ and reverse,
5′-AGTGTTGGCAGCGGTTTCTA-3′; SOCS3 forward,
5′-ACAATCTGCCTCAATCACTCTG-3′ and reverse,
5′-TTGACTTGGATTGGGATTTTG-3′; TPSB2 forward,
5′-GTGAAGGTCCCCATAATGGAAAA-3′ and reverse,
5′-CACAGCATGTCGTCACGGA-3′; WNT5A forward,
5′-CGCCCAGGTTGTAATTGAAG-3′ and reverse,
5′-GCATGTGGTCCTGATACAAGT-3′; and GAPDH forward,
5′-GGTGAAGGTCGGAGTCAACG-3′ and reverse,
5′-TGGGTGGAATCATATTGGAACA-3′.
H&E staining and
immunohistochemistry (IHC)
H&E staining and IHC were performed according to
a previous study (1). The renal
cancer tissue was fixed with 4% paraformaldehyde, embedded in
paraffin, and cut into slices (3-µm thick per specimen). The slices
were baked at 60°C for 1 h, followed by deparaffinizing; the slices
were placed in xylene 3 times for 10 min each and wash with ethanol
gradient for 5 min. Slices were then stained with hematoxylin for
10 min at 25°C, and rinsed back to blue, before staining with eosin
for 5 min at 25°C, and then rehydrating (rinse and dehydrate with
gradient alcohol 3 times for 3 min each, and place in xylene 3
times for 5 min each). Finally, the slides were sealed with neutral
gum, and observed and imaged under an orthophoto microscope (BX63;
Olympus Corporation). For IHC, the sections were deparaffinized,
hydrated, subjected to heat for antigen retrieval in 10 mM sodium
citrate (pH, 6.0) for 15 min at 95°C and treated with 3% hydrogen
peroxide for 10 min to inactivate the endogenous peroxidase. After
blocking with 5% goat serum (Beyotime Institute of Biotechnology)
for 30 min at 25°C, the sections were incubated overnight with
primary antibodies against IL22 (1:100; cat. no. ab227033; Abcam),
IL4 (1:400; cat. no. ab62351; Abcam), CCL7 (1:200; cat. no.
ab228979; Abcam) and LTB4R2 (1:200; cat. no. ab84600; Abcam) at
4°C. The sections were then incubated with horseradish
peroxidase-conjugated secondary antibody (1:200; cat. no. GB23303;
Wuhan Servicebio Technology Co., Ltd.) for 1 h at 25°C, washed with
PBS for 10 min and stained with diaminobenzidine (cat. no. A600140;
Sangon Biotech, Co., Ltd.). Images were obtained under an
orthophoto microscope (BX63; Olympus Corporation). Next, R software
(version 4.0.2) was used for visualization. The total and
positively stained cells of the tissue sections were counted at
×200 magnification (scale bar, 50 µm), and the percentage of
positive cells was calculated using ImageJ software (version
1.8.0).
Statistical analysis
R software (version 4.0.2; www.R-project.org/) was used for bioinformatics and
statistical analyses. For experimental validation, ≥ three
biological repetitions were performed. To perform grouped
comparisons, Kruskal-Wallis test (H-test, a pairwise comparison
using Dwass-Steel-Critchlow-Fligner test and P-value adjustment
using the Benjamini and Hochberg method) was applied using the
‘ggstatplot’ package in R (42).
Results
Construction and definition of the
IPS
A total of 522 cases of ccRCC were included in the
present study. Their demographic data and clinical characteristics
are provided in Table I, including
age (210 patients >61 years and 312 patients ≤61 years) and sex
(369 males and 153 females). Regarding the list of genes associated
with the inflammatory responses and pathways that were provided by
the GO dataset, the expression profiles of 626 IGs were extracted
from the 56,753 genes analyzed in each sample. Feature selection
and IPS modeling were then performed for the training cohort. IGPs
were detected using iterative univariate Cox regression and the
log-rank test. As presented in Table
SIII, a total of 43 IGPs were detected and used for further IPS
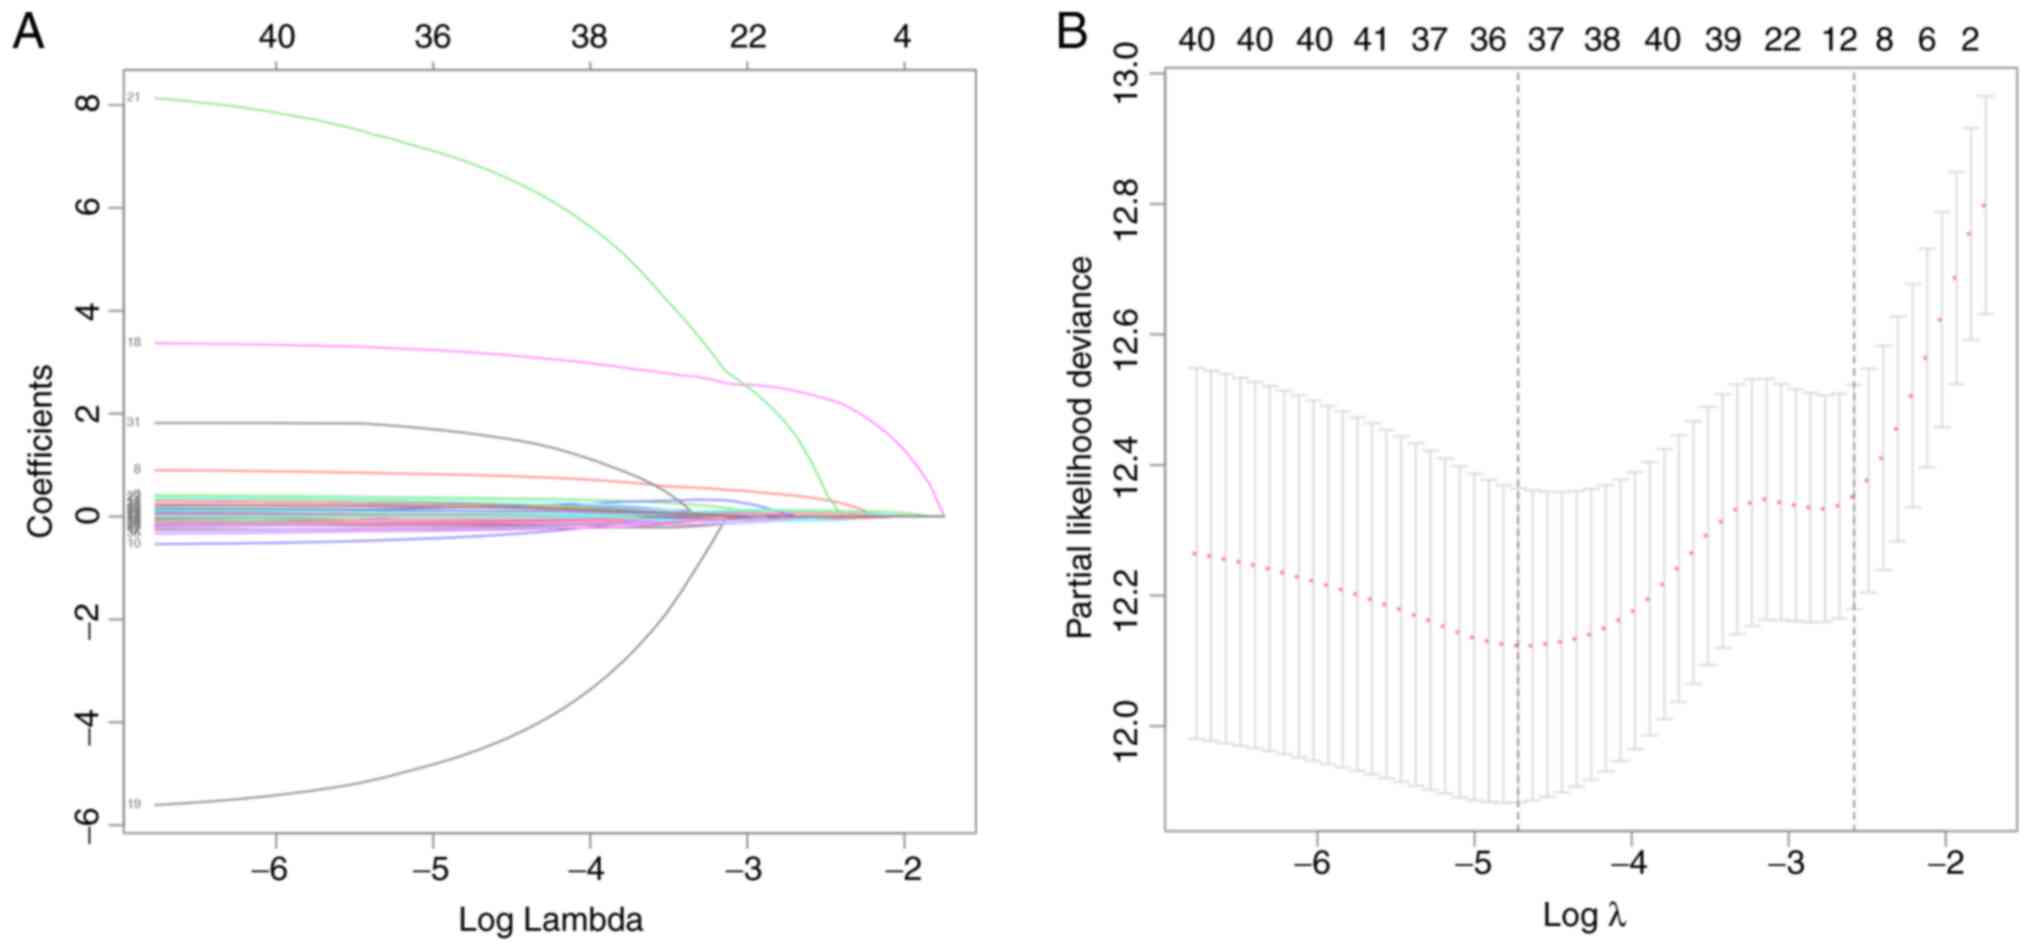
modeling. In order to minimize the risk of overfitting, LASSO
regression was performed, as well as the gene selection process,
optimal λ calculation and coefficient changes (Fig. 1A and B). After screening, 36 IGPs
remained for final IPS modeling. Cox proportional hazards model was
trained using the AIC-based stepwise method to generate IPS, which
contained 18 IGPs (Table II).
 | Table I.Demographic characteristics of the
included patients. |
Table I.
Demographic characteristics of the
included patients.
| Parameter | Patients, n |
|---|
| Age, years |
|
|
>61 | 210 |
|
≤61 | 312 |
| Sex |
|
|
Male | 369 |
|
Female | 153 |
| Neoplasm
histological grade |
|
| G1 | 11 |
| G2 | 188 |
| G3 | 179 |
| G4 | 144 |
| Pathologic
T-stage |
|
| T1 | 19 |
|
T1a | 115 |
|
T1b | 95 |
| T2 | 46 |
|
T2a | 10 |
|
T2b | 2 |
| T3 | 4 |
|
T3a | 105 |
|
T3b | 43 |
|
T3c | 1 |
| T4 | 82 |
| Pathological
N-stage |
|
| N0 | 208 |
| N1 | 314 |
| Pathological
M-stage |
|
| M0 | 335 |
| M1 | 187 |
| Table II.Coefficients of genes included in the
inflammatory prognostic signature. |
Table II.
Coefficients of genes included in the
inflammatory prognostic signature.
| Genes | Coefficient | Hazard ratio | 95% CI | P-value |
|---|
| ADCY1 | −0.551 | 0.576 | 0.364-0.911 | 0.018408 |
| ADIPOQ | 0.353 | 1.424 | 1.033-1.962 | 0.031072 |
| ADORA2B | 0.323 | 1.381 | 0.995-1.917 | 0.053474 |
| CCL7 | 0.993 | 2.699 | 1.772-4.112 |
3.80×10⁻⁶ |
| CXCL3 | −0.657 | 0.518 | 0.361-0.744 | 0.000368 |
| GPS2 | 0.335 | 1.399 | 0.925-2.115 | 0.112054 |
| HGF | 0.171 | 1.186 | 1.020-1.379 | 0.026637 |
| IL1RL2 | −0.355 | 0.701 | 0.513-0.958 | 0.025736 |
| IL4 | 3.465 | 31.968 | 5.549-184.154 | 0.000105 |
| IL17C | −5.383 | 0.005 | 0.000-0.072 | 0.000126 |
| IL22 | 8.456 | 4705.498 |
33.107-668798.685 | 0.000826 |
| LIPA | −0.266 | 0.767 | 0.601-0.977 | 0.031965 |
| LRRC19 | −0.170 | 0.844 | 0.708-1.005 | 0.057198 |
| LTB4R2 | 0.463 | 1.589 | 0.917-2.753 | 0.098503 |
| RORA | −0.585 | 0.557 | 0.347-0.894 | 0.015301 |
| SOCS3 | 0.257 | 1.293 | 1.105-1.513 | 0.001324 |
| TPSB2 | −0.306 | 0.736 | 0.626-0.866 | 0.000217 |
| WNT5A | 0.282 | 1.326 | 0.968-1.817 | 0.079332 |
Validation of IPS as an independent
prognostic factor
For the classification of patients with ccRCC, ROC
curve analysis was used to derive an optimal cut-off value for the
IPS score, which was 1.14 in the training cohort. Based on this,
patients with an IPS score >1.14 were classified as members of
the high-risk group, whilst others were classified as low-risk
group members (Fig. 2A). The
distribution of IPS scores and outcomes for each patient in the
different risk groups in the training cohort are presented in
Fig. 2A. It was observed that the
overall survival time of patients in the high-risk group was
shorter compared with that of patients in the low-risk group
(Fig. 2A). In addition, the number
of events (deaths) in the high-risk group was higher compared with
that in the low-risk group (Fig.
2A). Similar trends could also be observed in the validation
cohort (Fig. 2B). The differential
expression profiles of IGPs constituting the IPS in the low- and
high-risk groups are provided in Fig.
2C. For evaluating the prediction accuracy of the IPS, ROC
curves and their AUC were calculated in the training and validation
cohort. As presented in Fig. 2D,
regarding the reported judgment criteria (AUC >0.7) for the
predictive ability of the prognostic model (43), IPS achieved high accuracy for the
prediction of the prognosis of patients with ccRCC (AUC=0.811 in
the training cohort). A similar trend in AUC was also observed in
the validation cohort (AUC=0.799), suggesting further that this IPS
is robust. Kaplan-Meier curve analysis with the log-rank test was
subsequently applied for detecting the difference in overall
survival probability between the low- and high-risk groups. As
indicated by the results in Fig.
2E, high-risk patients with ccRCC had a significantly lower
overall survival probability compared with that in patients in the
low-risk group in the training cohort (P<0.001). Similar results
were found in the validation cohort (Fig. 2F). In terms of progression-free
survival (PFS), high-risk patients according to IPS also
demonstrated a lower probability of PFS in the training (Fig. S1) and validation cohorts (Fig. S2). The resultant data demonstrated
the viability of this developed IPS for the risk-stratification of
patients with ccRCC. This IPS score exhibited a negative
correlation with the overall survival time in both the training
cohort (ρ=−0.32, P<0.001; Fig.
2G) and the validation cohort (ρ=−0.22, P<0.001; Fig. 2H). These data suggest that the
overall survival time of patients with ccRCC decreased as the IPS
score increased.
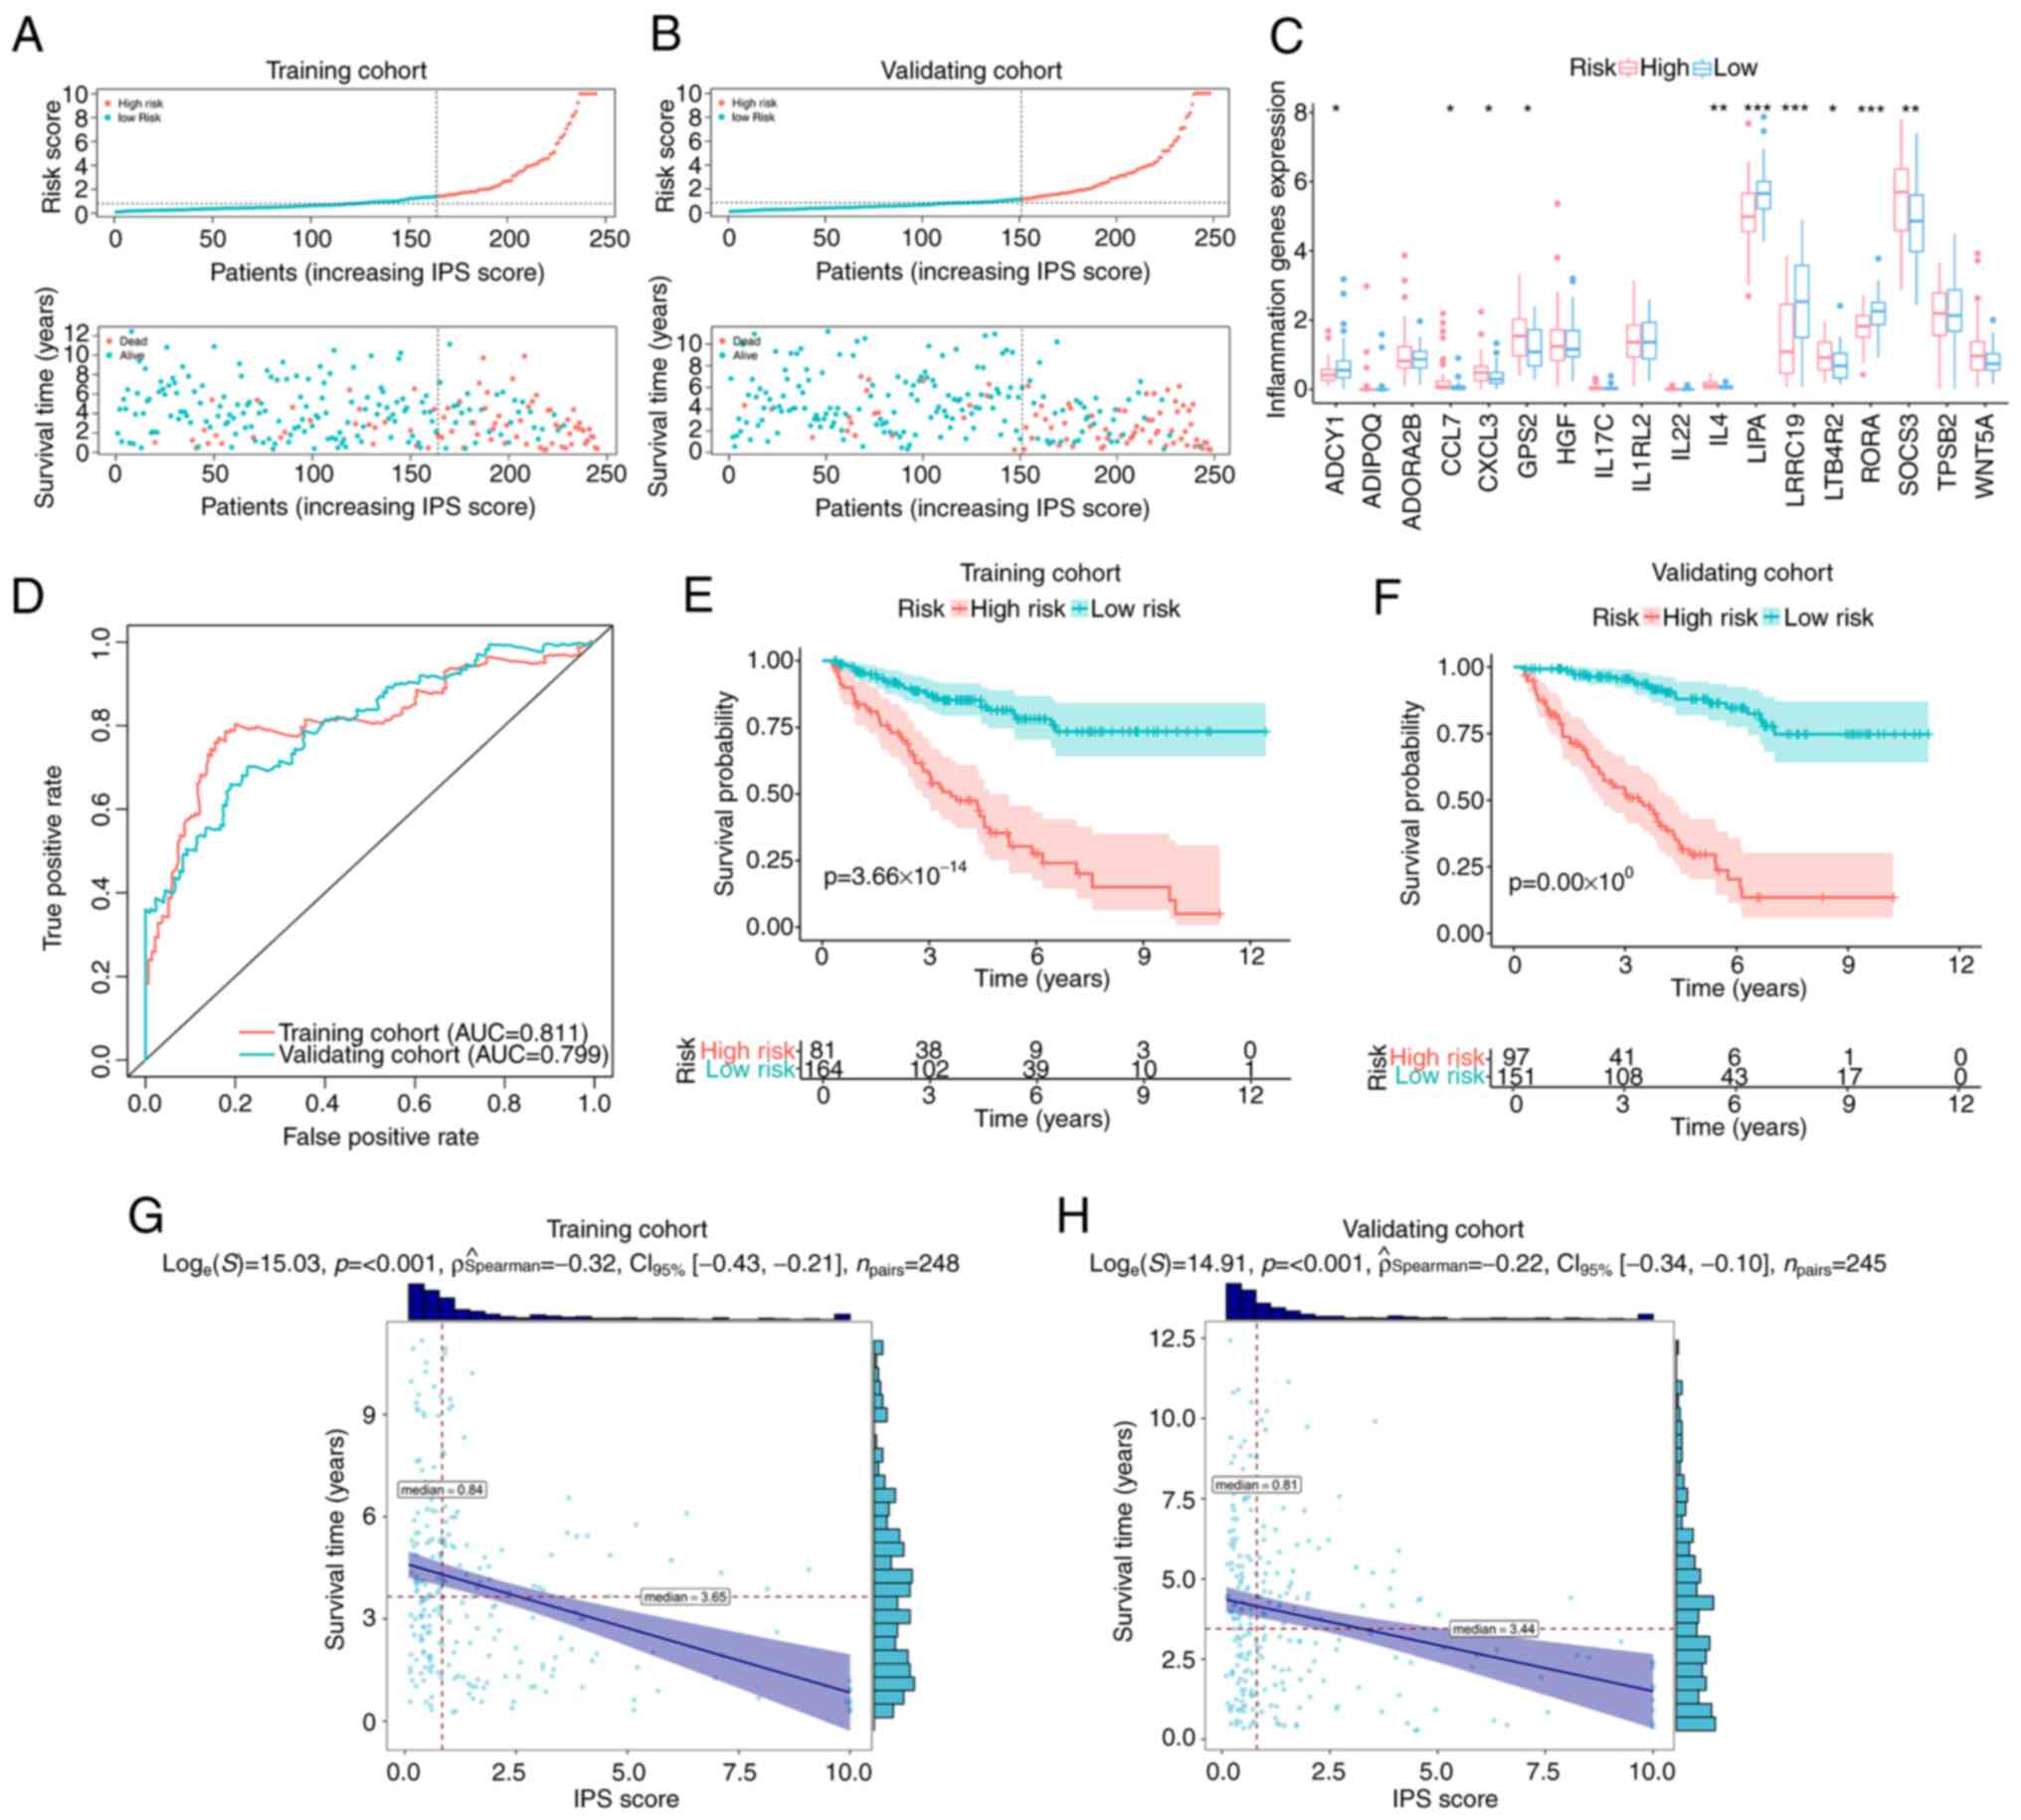 | Figure 2.Validation of IPS. Distribution plots
for the IPS score, overall survival time and survival status of
each patient with clear cell renal cell carcinoma in the (A)
training cohort and (B) validation cohort. (C) Differential
expression profiles of inflammation-associated genes constituting
the IPS between IPS-identified high- and low-risk groups, with dots
above indicating outliers. Box plots show the five-number summary
of a set of data, including the minimum score, first (lower)
quartile, median, third (upper) quartile and maximum score. (D) ROC
curves of IPS in the training and validation cohort. Kaplan-Meier
curves indicating the difference in survival probability between
the IPS-identified high-risk and low-risk groups in (E) the
training cohort and (F) validating cohort. Correlation analyses
attested the association between the IPS score and survival time in
(G) the training cohort and (H) validation cohort. IPS,
inflammatory prognostic signature; AUC, area under the ROC curve;
ROC, receiver operating characteristic. *P<0.05, **P<0.01 and
***P<0.001. |
To assess if this IPS score can serve as an
independent prognostic factor, univariate and multivariate Cox
regression analyses were performed on the training cohort and
validation cohort, respectively. As indicated by the results
presented in Table III, the
P-values of the IPS scores were <0.001 according to both
univariate and multivariate Cox regression in the training and
validation cohort. This suggest that the IPS score can be used as
an independent prognostic factor for patients with ccRCC. In
particular, univariate Cox regression revealed that the risk of
unfavorable prognosis (shorter overall survival time or death) in
the high-risk group was enhanced by 1,073% in the training cohort
[hazard ratio (HR)=11.73; 95% CI, 5.10-26.98; P<0.001].
Additionally, this association remained stable even after other
covariates were included (Table
III). Similar trends were observed in the validation cohort,
where all HRs of the IPS scores were higher compared with those of
the clinical characteristics in the corresponding analyses
(Table III). These results
suggest that the IPS score has high predictive power for the risk
of poor outcomes and that it associates more closely with prognosis
compared with other common clinical characteristics.
| Table III.Independent analyses using univariate
and multivariate Cox regression. |
Table III.
Independent analyses using univariate
and multivariate Cox regression.
| A, Training
cohort |
|---|
|
|---|
|
| Univariate | Multivariate |
|---|
|
|
|
|
|---|
| Variable | HR (95% CI) | P-value | HR (95% CI) | P-value |
|---|
| IPS (cut-off
1.14) | 11.735
(5.104-26.981) |
6.72×10⁻⁹ | 11.690
(4.588-29.788) |
2.57×10⁻⁷ |
| Age, years (cut-off
61) | 1.020
(0.993-1.048) | 0.147098 | 1.035
(0.994-1.077) | 0.095488 |
| Sex | 0.728
(0.386-1.374) | 0.327579 | 1.685
(0.771-3.68) | 0.190771 |
| Neoplasm
histological grade | 2.192
(1.408-3.414) | 0.000514 | 2.006
(1.141-3.529) | 0.015643 |
| Pathologic
T-stage | 6.934
(3.645-13.191) |
3.60×10⁻⁹ | 7.939
(1.653-38.137) | 0.009668 |
| Pathologic
N-stage | 2.249
(0.795-6.363) | 0.126733 | 2.089
(0.564-7.743) | 0.270389 |
| Pathologic
M-stage | 1.962
(1.333-2.887) | 0.000634 | 0.855
(0.317-2.303) | 0.756184 |
| Stage | 2.169
(1.565-3.006) |
3.29×10−06 | 0.931
(0.331-2.621) | 0.892045 |
|
| B, Validation
cohort |
|
|
|
Univariate |
Multivariate |
|
|
|
|
|
Variable | HR (95%
CI) | P-value | HR (95%
CI) | P-value |
|
| IPS (cut-off
1.14) | 4.499
(2.440-8.295) |
1.45×10⁻⁶ | 4.211
(2.131-8.320) |
3.50×10⁻⁵ |
| Age, years (cut-off
61) | 1.017
(0.992-1.043) | 0.186949 | 1.031
(1.003-1.059) | 0.027546 |
| Sex | 1.582
(0.860-2.911) | 0.139997 | 1.555
(0.801-3.018) | 0.191663 |
| Neoplasm histologic
grade | 1.910
(1.295-2.818) | 0.001094 | 0.986
(0.593-1.637) | 0.955512 |
| Pathologic
T-stage | 2.569
(1.328-4.971) | 0.005066 | 1.38
(0.428-4.452) | 0.590357 |
| Pathologic
N-stage | 3.768
(1.476-9.617) | 0.005531 | 0.964
(0.31-3.000) | 0.949146 |
| Pathologic
M-Stage | 1.699
(1.248-2.315) | 0.000769 | 1.045
(0.543-2.013) | 0.894424 |
| Stage | 1.602
(1.246-2.060) | 0.000238 | 1.415
(0.714-2.805) | 0.320424 |
Mechanisms of unfavorable prognosis of
high-risk patients with ccRCC
To uncover the roles of these IGPs in the
development of ccRCC, GO annotation and KEGG enrichment analysis
were performed to elucidate the associated dysregulated biological
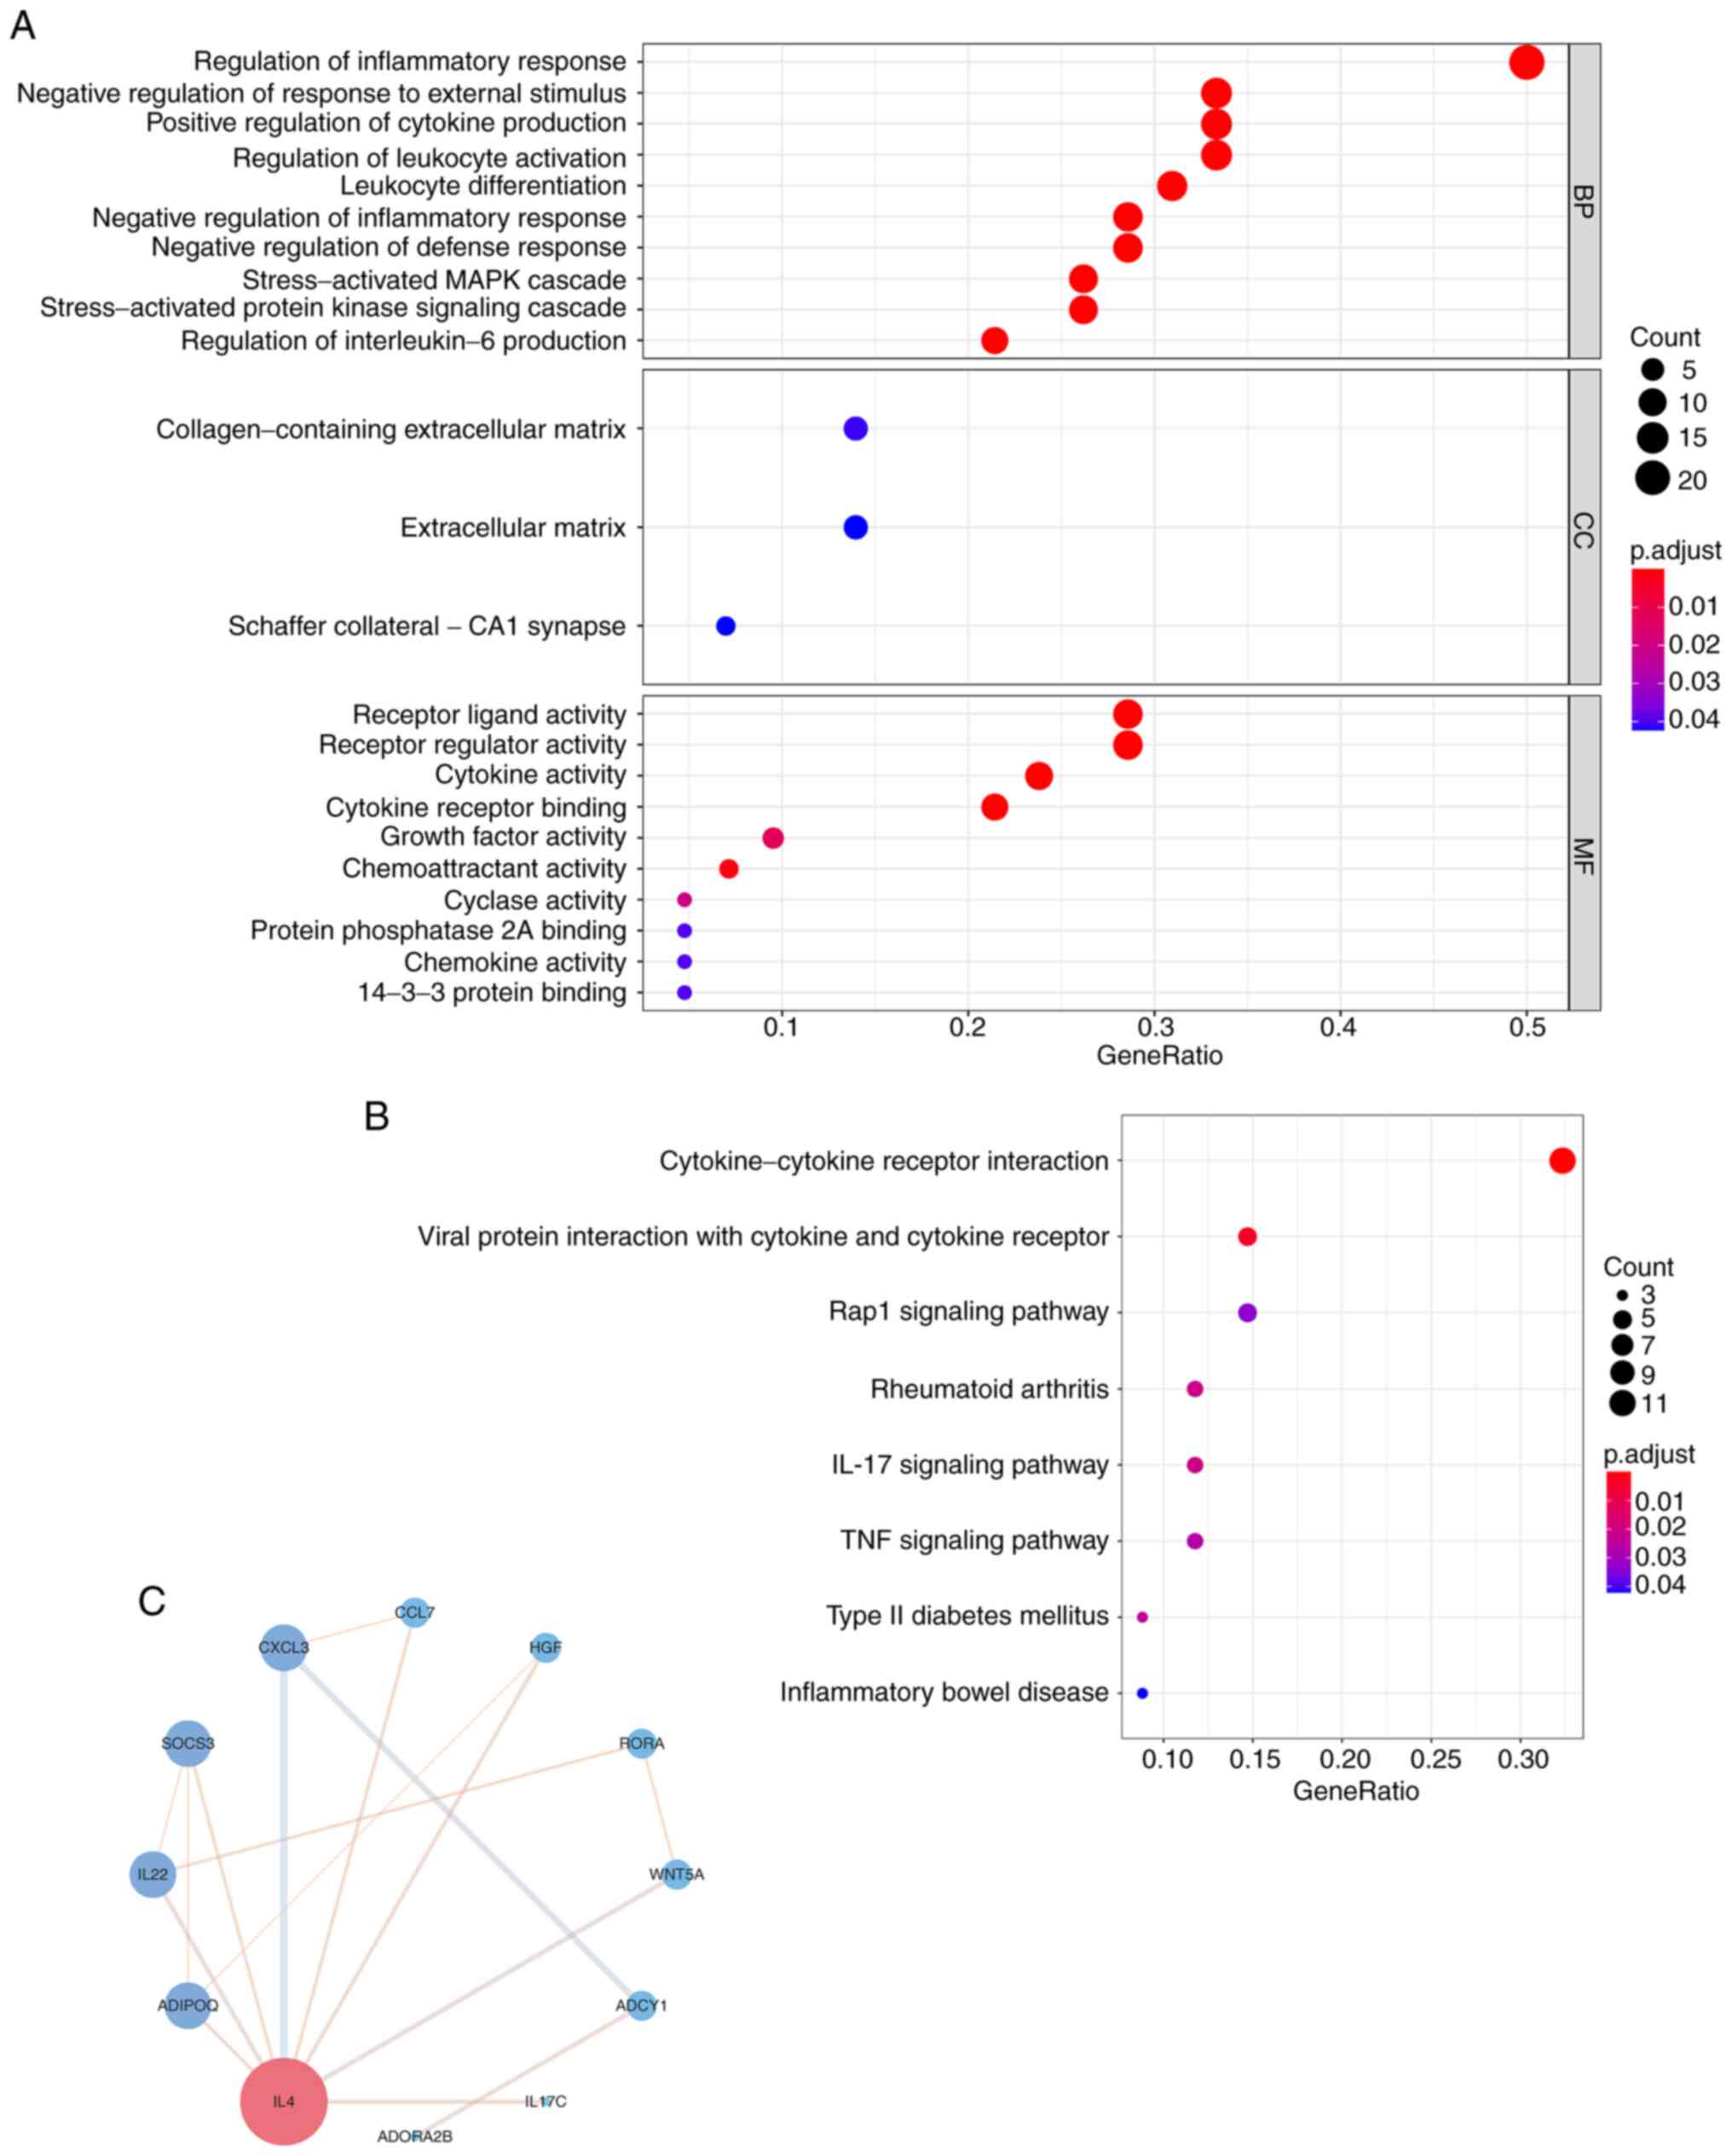
functions and pathways. KEGG enrichment revealed the dysregulated
pathways of IGPs that can promote ccRCC progression (Fig. 3A). the majority of the
significantly dysregulated pathways were involved in the
inflammatory response or inflammation-immune interaction, including
‘cytokine-cytokine receptor interaction’, ‘IL-17 signaling pathway’
and the ‘TNF signaling pathway’ (Fig.
3B). To further elucidate the biological functions of these
IGPs in the progression of ccRCC, GO annotation was performed. The
results of the GO annotation provided a molecular regulatory
network from three aspects (Fig.
3A). For instance, in the GO category ‘biological process’, the
IGPs participated in the ‘Regulation of inflammatory response’,
‘Negative regulation of response to external stimulus’ and
‘Positive regulation of cytokine production’. In the GO category
‘Cellular component’, the IGPs participated in pathways relating to
‘The collagen-containing extracellular matrix’, the ‘Extracellular
matrix’ and the ‘Schaffer collateral-CA1 synapse’. Furthermore, in
the GO category ‘Molecular function’, the IGPs participated in
‘Receptor ligand activity’, ‘Receptor regulator activity’ and
‘Cytokine activity’. To further detect the interactive network of
IGPs constructing IPS, PPI analysis was performed. As presented in
Fig. 3C, an interactive network
was generated and analyzed, where IL4 was confirmed as the molecule
with the most interactions with other IGPs among other IGPs.
Difference in the immune
microenvironment between the risk groups
Since the immune microenvironment and
inflammation-immunity interactions serve important roles in the
development of ccRCC (44,45), differences in the immune
microenvironment between the two risk groups were next
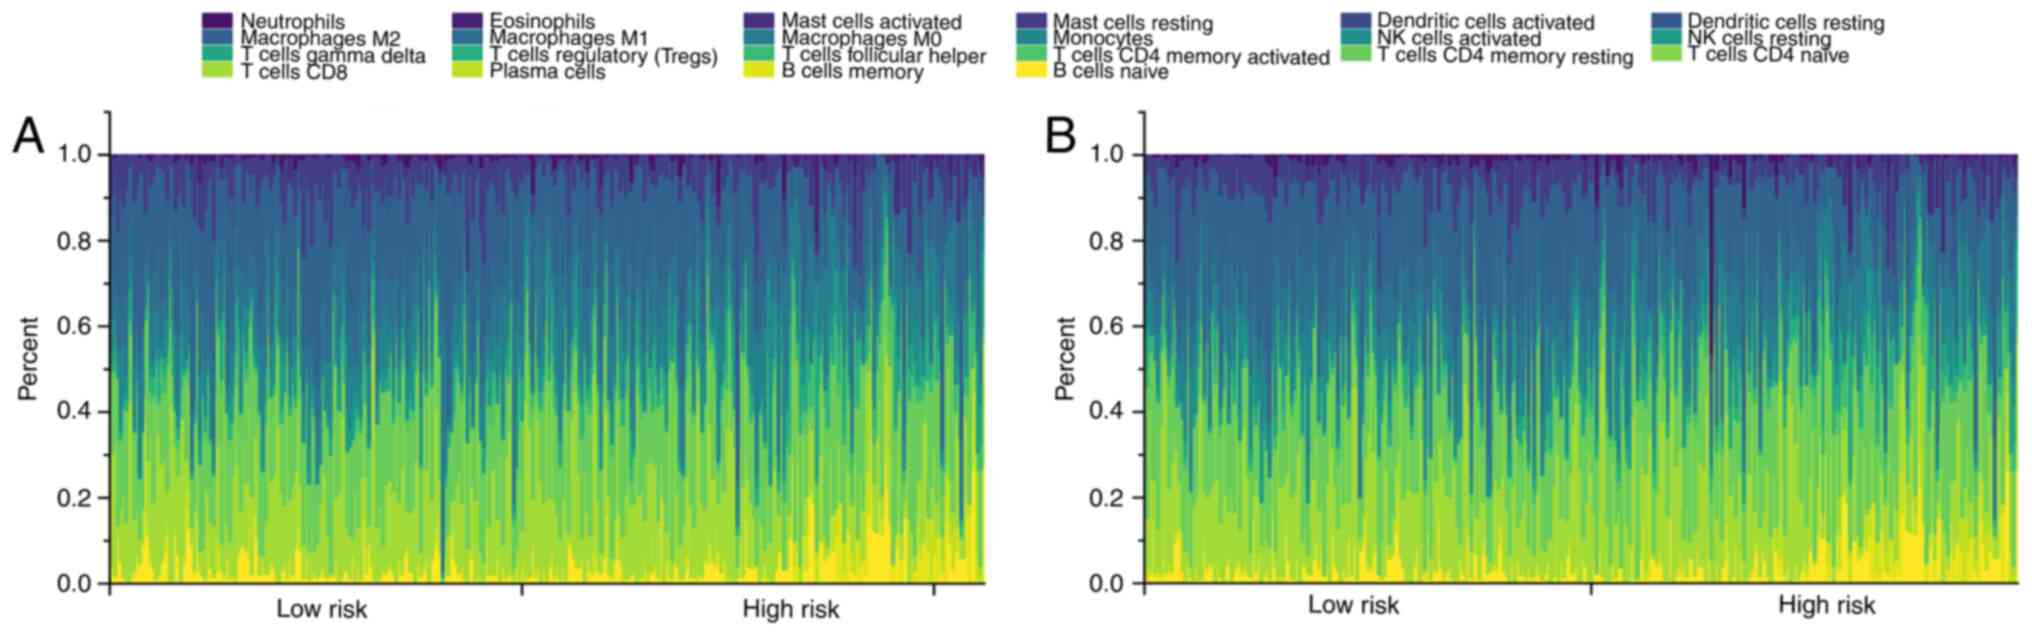
investigated. CIBERSORT algorithm revealed the immune cell
infiltration profiles of each ccRCC clinical sample in the training
(Fig. 4A) and validation cohort
(Fig. 4B). A total of six immune
cell types exhibited significant differences in their infiltration
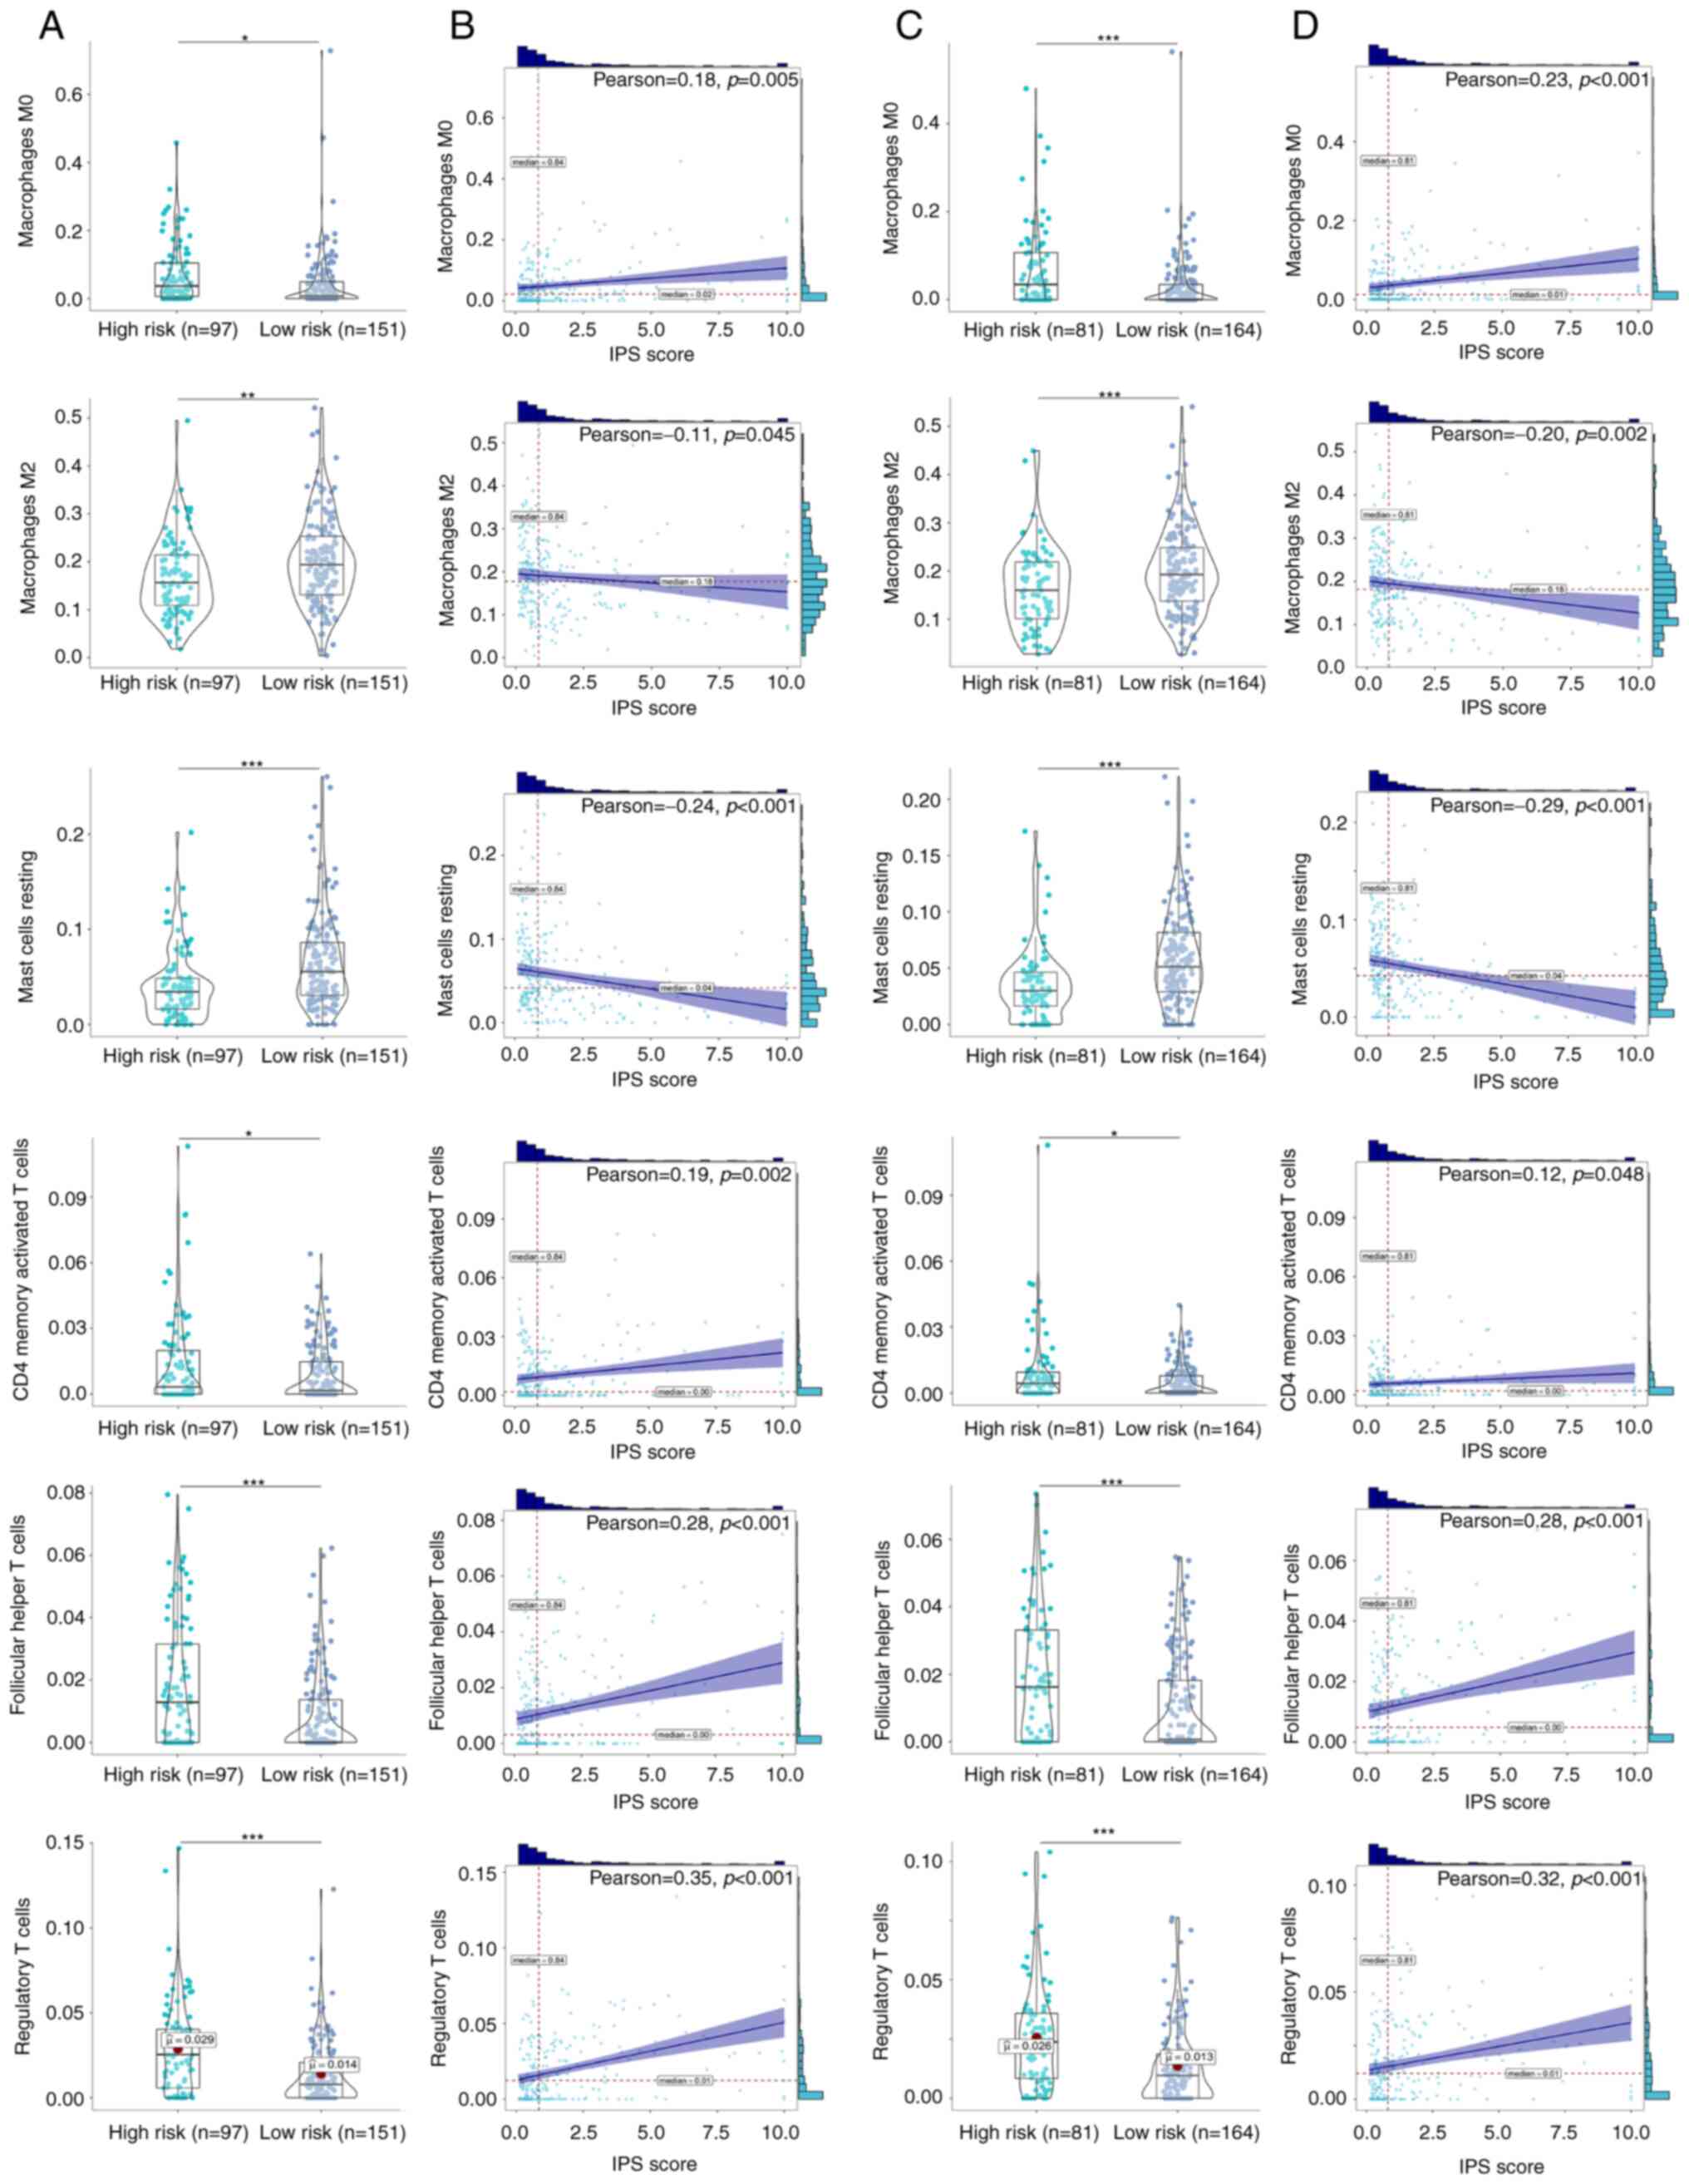
profiles between the low- and high-risk groups. Infiltration by
M0 macrophages, CD4 memory-activated T cells, follicular
helper T cells and T regulatory cells (Tregs) were significantly
increased in the high-risk ccRCC groups in both the training
(Fig. 5A and B) and validation
cohorts (Fig. 5C and D). By
contrast, infiltration by M2 macrophages and resting
mast cells were significantly decreased in the high-risk ccRCC
group in both the training and validation cohorts. Further
correlation analysis found significant positive correlations
between the IPS score and the degree of infiltration by
M0 macrophages [ρ=0.18 (training cohort); ρ=0.23
(validation cohort)], CD4 memory-activated T cells [ρ=0.19
(training cohort); ρ=0.12 (validation cohort)], follicular T helper
cells [ρ=0.28 (training cohort); ρ=0.28 (validation cohort)] and
Tregs [ρ=0.35 (training cohort); ρ=0.32 (validation cohort)]. By
contrast, negative correlations were found between the IPS score
and the extent of infiltration by M2 macrophages
[ρ=−0.11 (training cohort); ρ=−0.20 (validation cohort)] and mast
cells [ρ=0.24 (training cohort); ρ=−0.29 (validation cohort)].
These identified immune cells were therefore suggested to be
important parameters on the prognosis of patients with ccRCC.
Integrated prognostic index (IPI)
after combining the IPS with clinicopathological factors
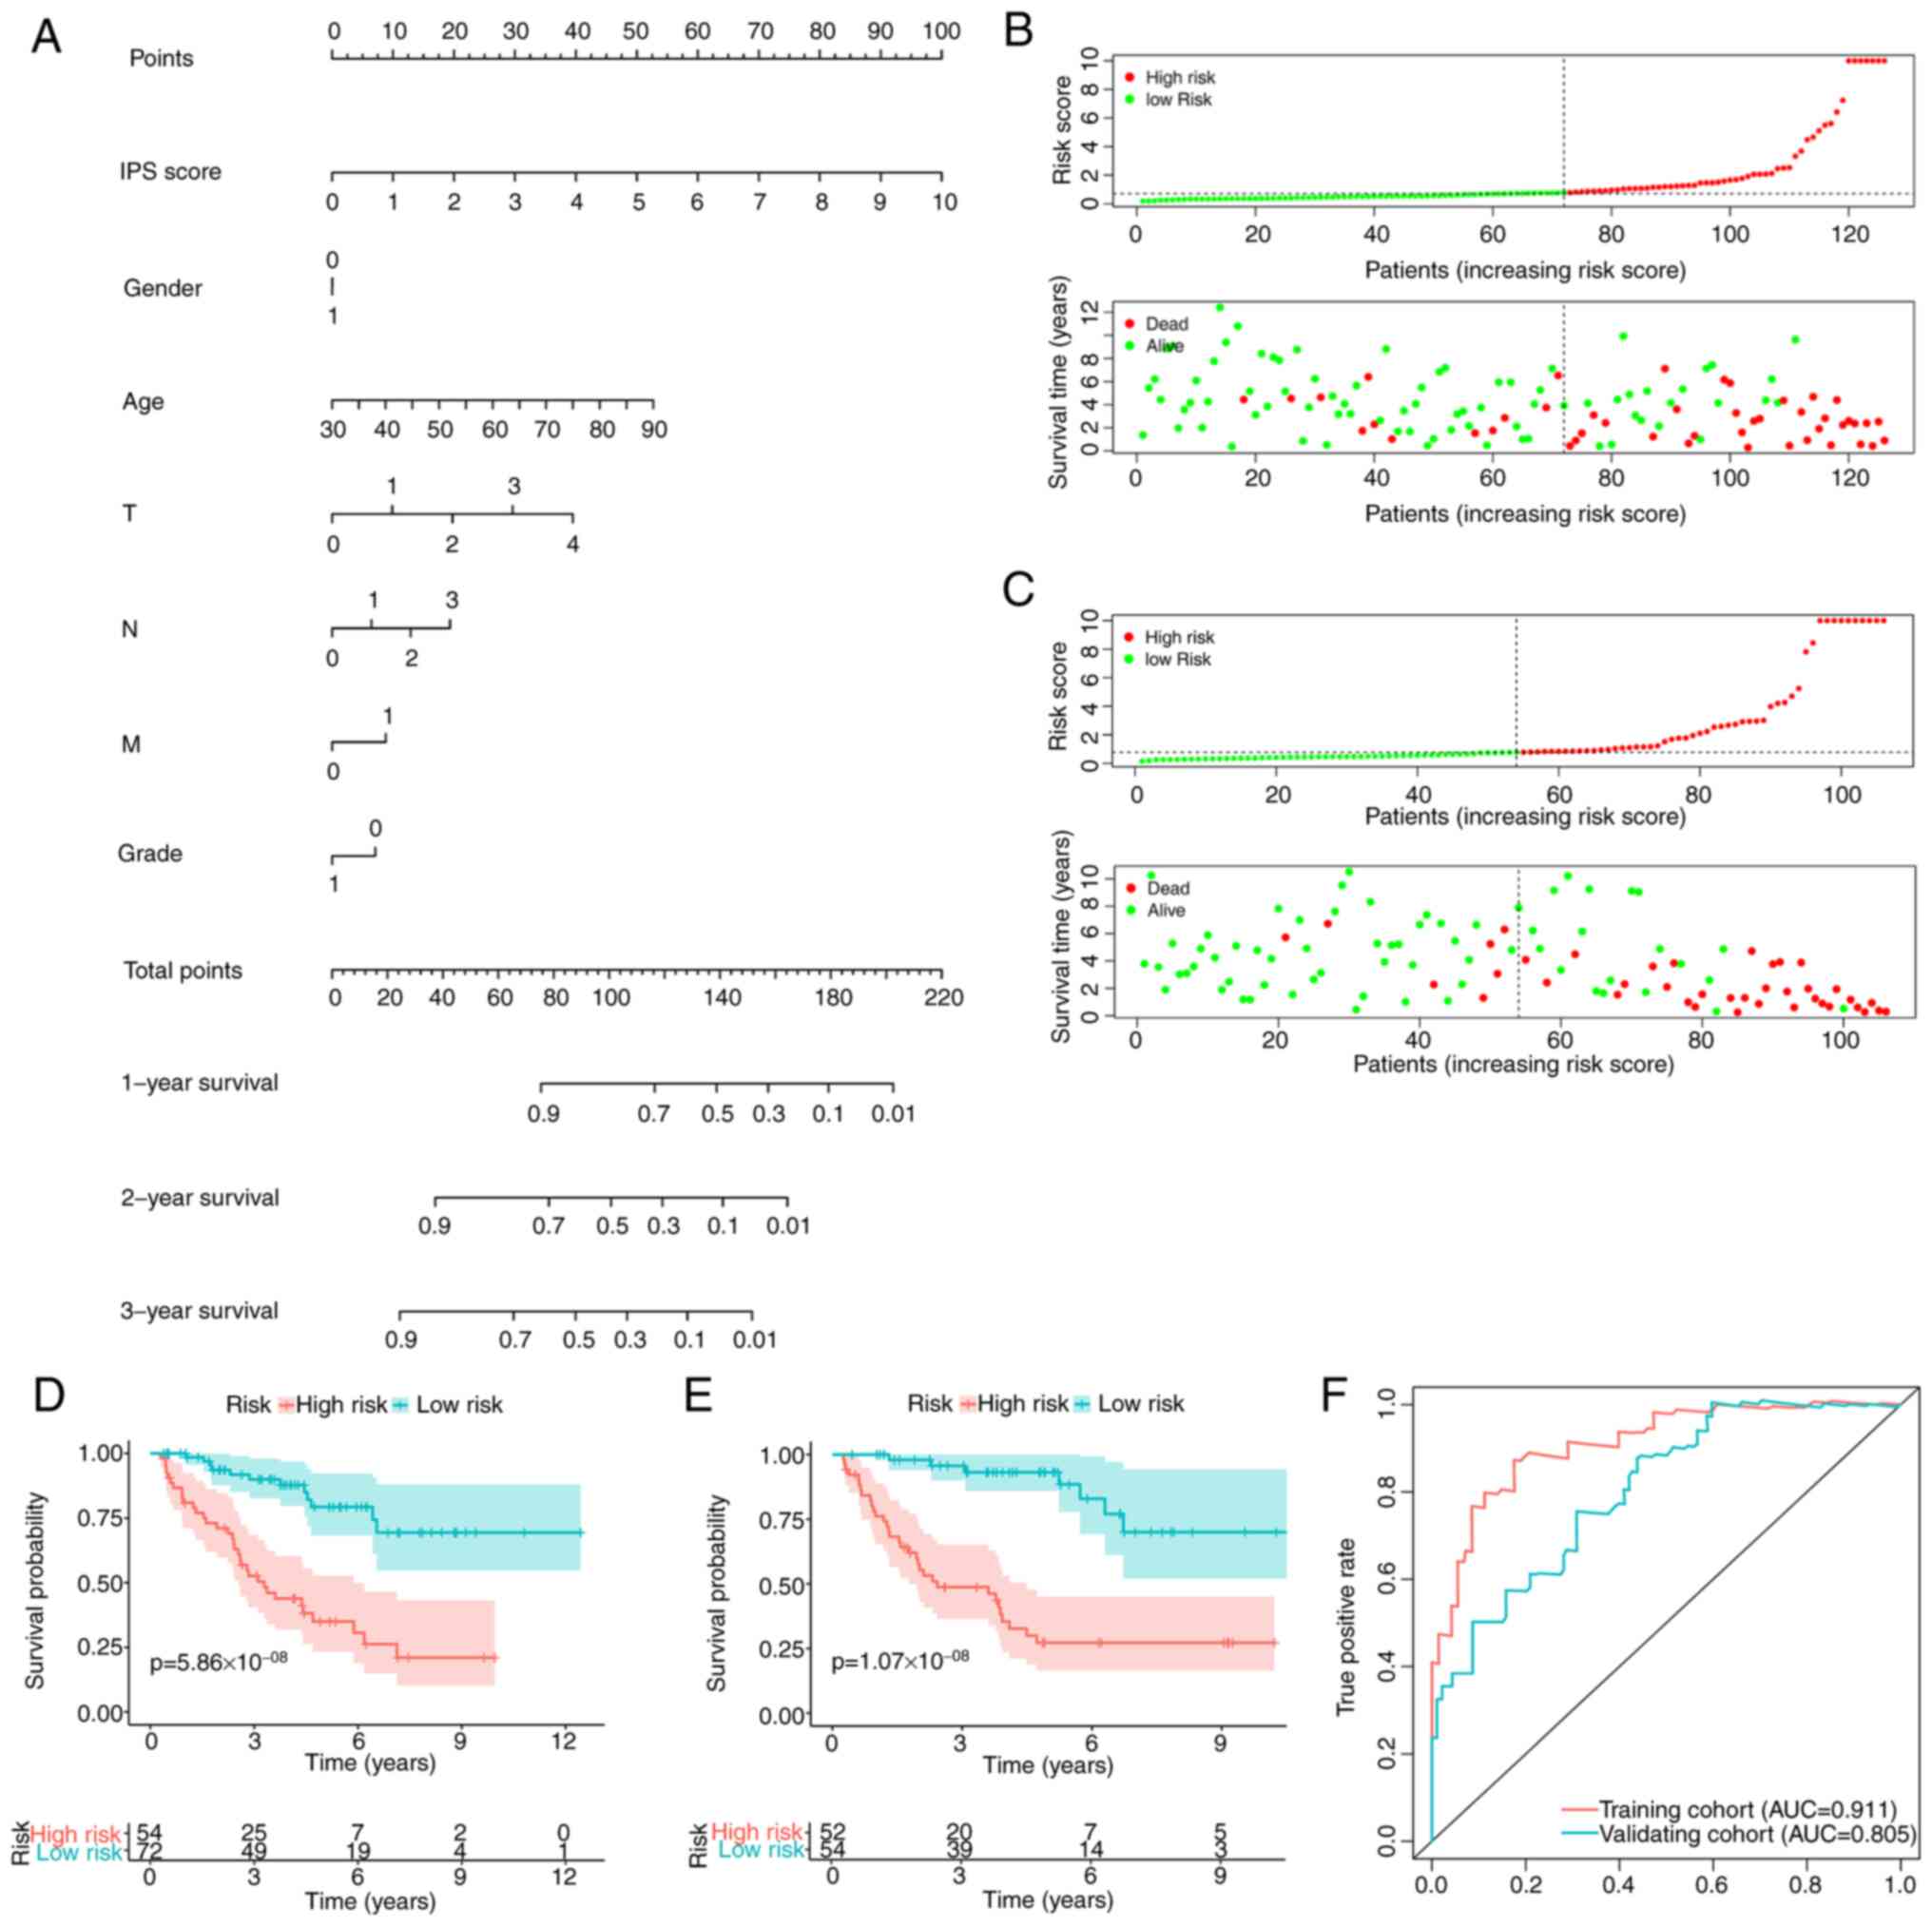
To improve the prediction accuracy of the IPS and to
facilitate clinical application, the IPI was constructed using
multivariate Cox regression by combining the IPS with the
clinicopathological characteristics, namely age, sex and TNM stage.
Following feature selection using a stepwise method, the IPI was
developed and plotted as a nomogram to calculate the survival
probability of individual patients with ccRCC (Fig. 6A). IPI distribution and
risk-stratification profiles of the training and validation cohorts
are provided in Fig. 6B and C,
respectively. Kaplan-Meier curve analysis also revealed that the
IPI was able to accurately stratify patients with ccRCC into either
low- or high-risk groups, with significantly different survival
probabilities (Fig. 6D and E). As
expected, the IPI's predictive accuracy in estimating the survival
of patients with ccRCC was higher compared with that of the IPS
(Fig. 6F), which was observed in
both the training [AUC: 0.911 (IPI) vs. 0.811 (IPS)] and validation
cohorts [AUC: 0.805 (IPI) vs. 0.799 (IPS)].
Validation in the clinical ccRCC
samples
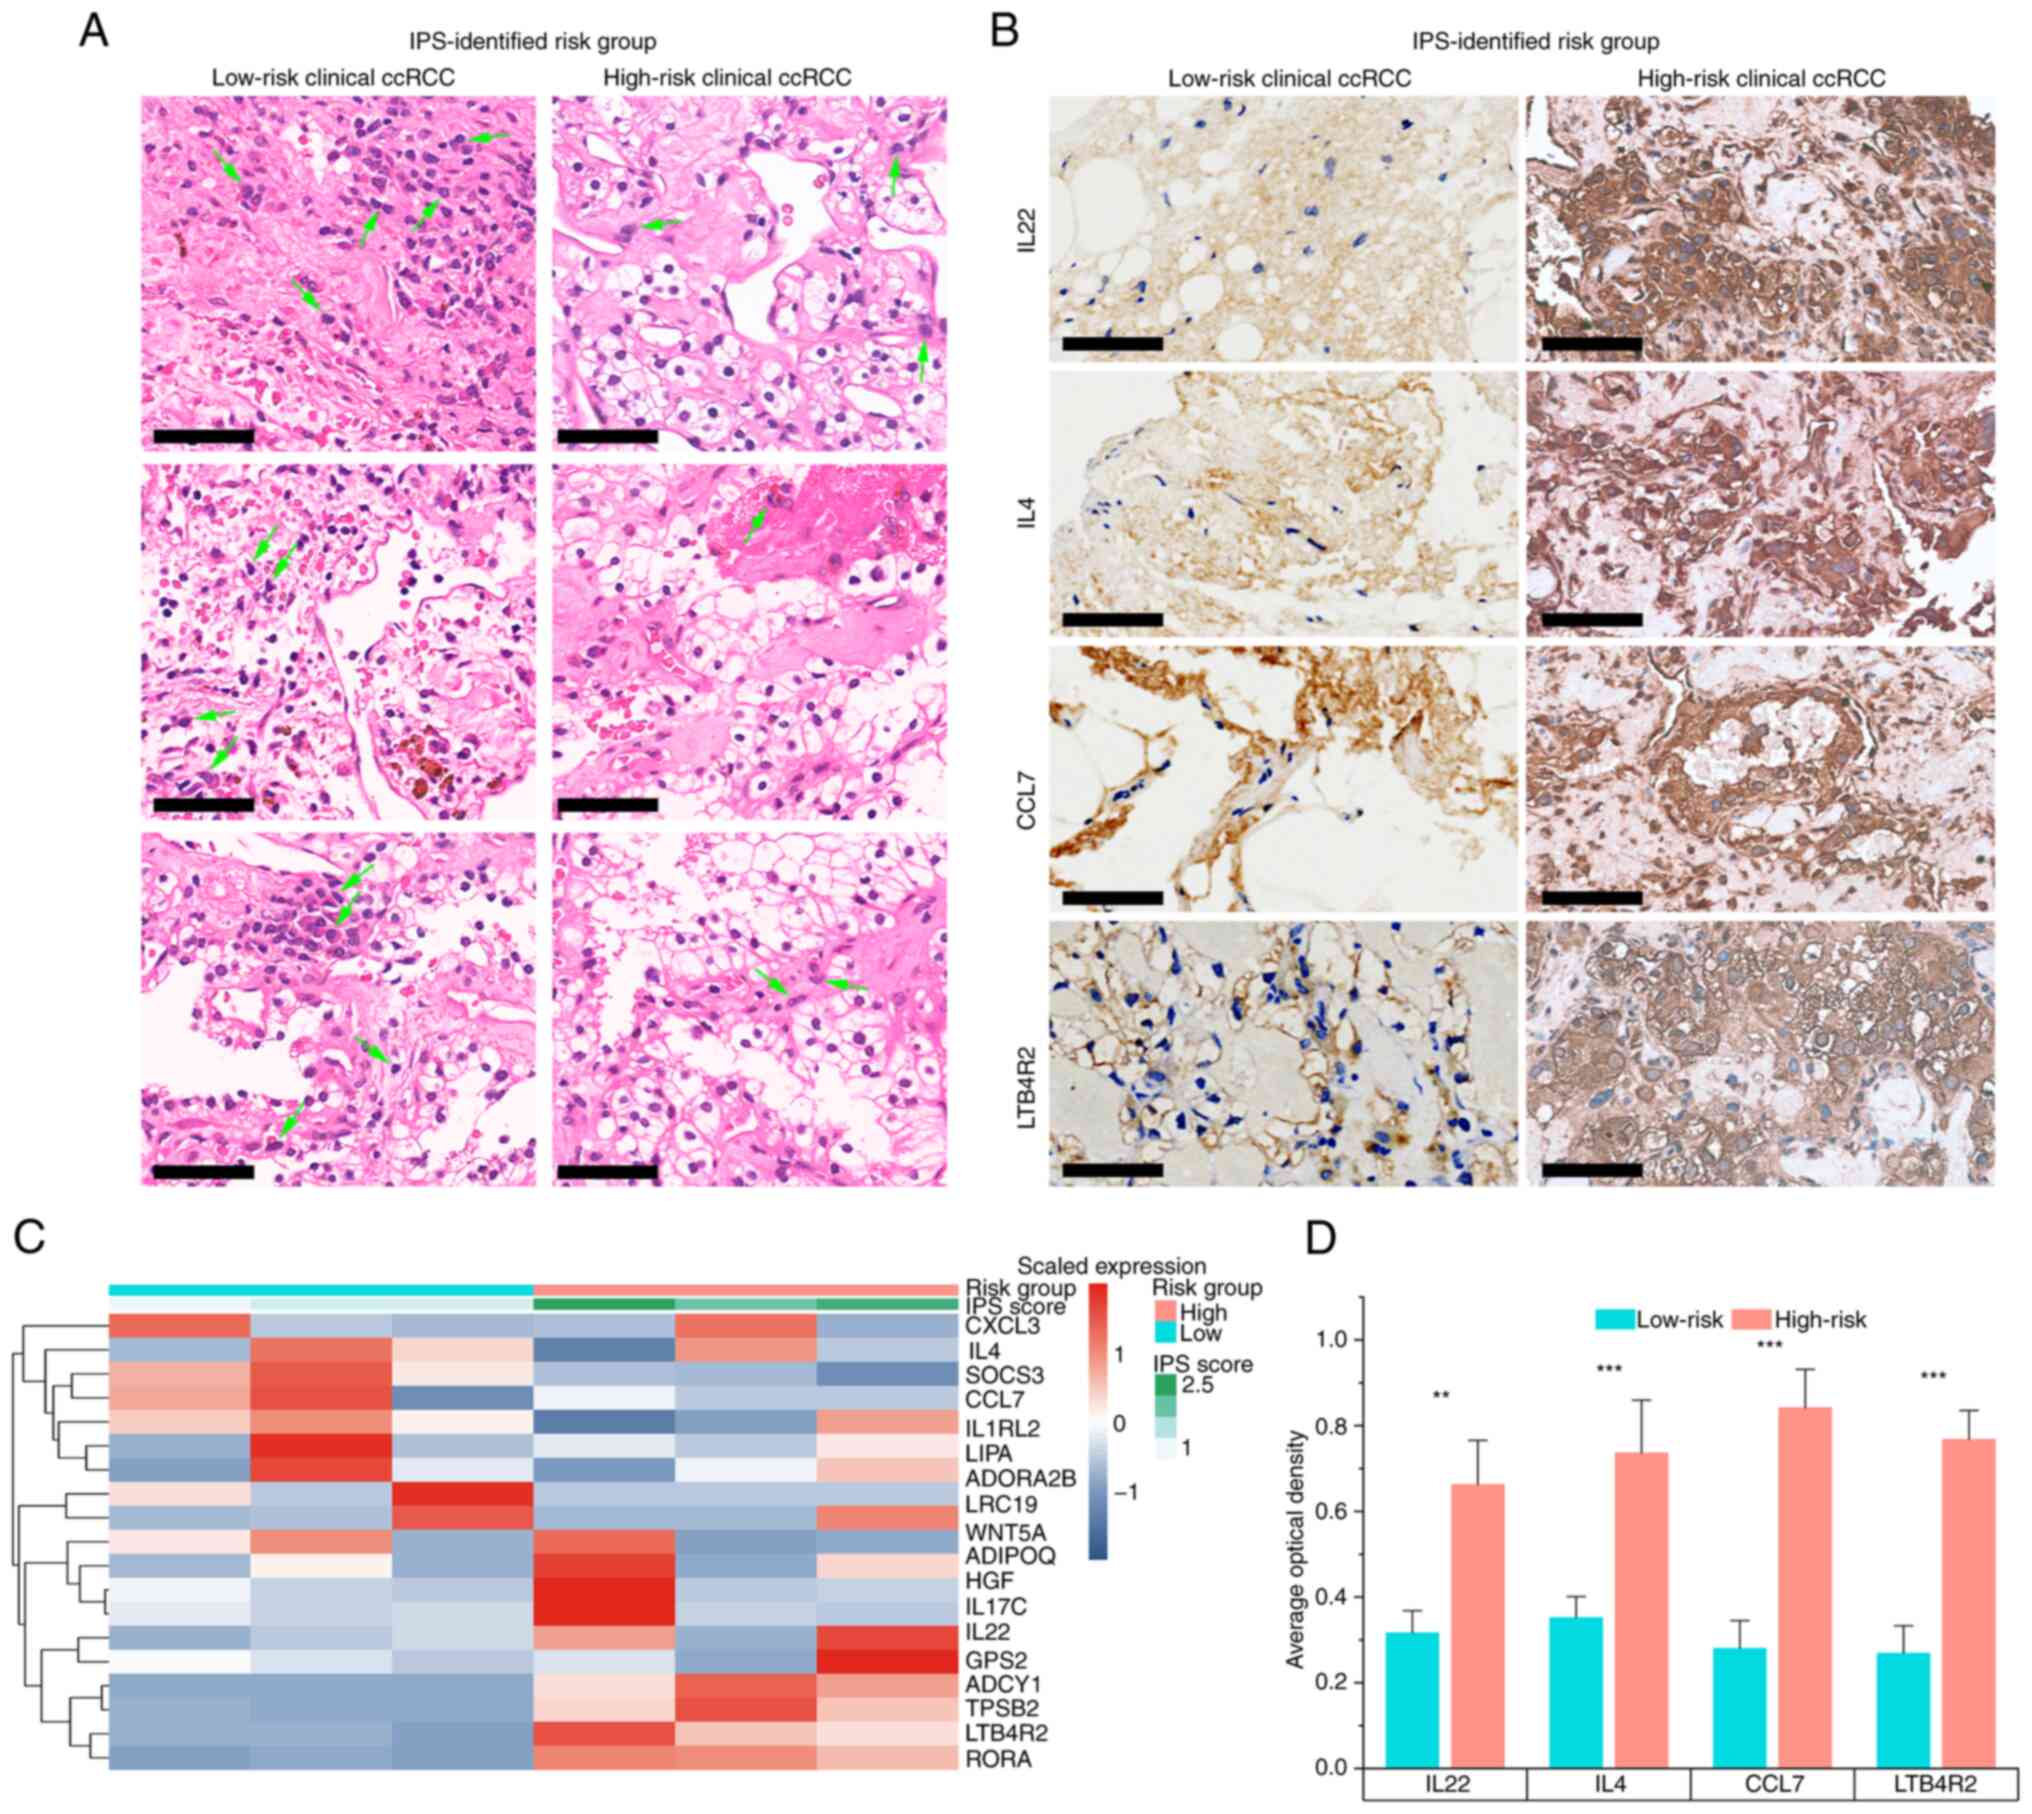
To further validate the IPS developed in the present
study, six patients with ccRCC were recruited and their IGP
expression was quantified to assign an IPS score using pre-trained
IPS model to each subject (Fig.
7). A total of three patients were identified as high-risk
whereas the others were low-risk, as determined from the heatmap
generated from the qPCR data (Fig.
7C). H&E staining was performed to compare the cell
morphology and structure of samples from high-risk and low-risk
patients with ccRCC (Fig. 7A).
Histologically, samples from high-risk patients with ccRCC
identified based on their IPS exhibited more typical malignant
findings compared with those of the low-risk cases. In high-risk
ccRCC samples, cells had a voluminous, clear and eosinophilic
cytoplasm, where their growth patterns were tubular, acinar and
lamellar (Fig. 7A). Furthermore,
high-risk ccRCC samples also had a papillary or alveolar nested
architecture with an abundant vascular network. The tumor cell
nuclei exhibited varying degrees of atypia, with features such as
prominent nucleoli and spindle-shaped cells. These data suggest
that the normal renal tubular epithelium and renal parenchyma were
severely damaged in the high-risk ccRCC cells, as compared to their
low-risk counterparts, which presented with a moderately damaged
renal microstructure. The IHC results further demonstrated that in
the high-risk group, the top four risk-associated IGPs were
expressed at significantly higher levels compared with those in the
low-risk group (Fig. 7B and D),
which supported the clinical applicability of the IPS developed in
the present study.
Discussion
To the best of our knowledge, the present study was
the first to elucidate the prognostic potential of
inflammation-associated molecules and develop an IPS for the
survival estimation and risk-stratification of patients with ccRCC.
The underlying mechanism of the unfavorable prognosis of high-risk
patients with ccRCC were identified using the IPS in the present
study, where a dysregulated immune microenvironment, signaling
pathways and biological functions were revealed. Subsequently, the
enhanced prognostic tool IPI combined this IPS with
clinicopathological factors, which exhibited greater accuracy for
prognosis prediction. With the present study's findings,
particularly the IPS and IPI, oncologists may be able pre-stratify
patients with ccRCC for optimizing clinical management protocols
whilst also improving their understanding into the nature of ccRCC
progression in terms of inflammatory responses.
The novelty of the present study lies in the
construction of IPS and IPI. Inspired by the key impact of the
inflammatory response on the progression of ccRCC (46–48),
the prognostic potential of inflammation-associated molecules was
systematically elucidated, following which the IPS was developed
and validated. This IPS was confirmed to be a viable and robust
biomarker for prognostic estimation and risk-stratification in both
the training (AUC=0.811) and validation cohorts (AUC=0.799). In
addition, IPS was found to be an independent prognostic factor of
ccRCC outcomes (P<0.001). The predictive ability of this IPS was
higher compared with that of the other reported biomarkers
(immune-related risk signature with AUC of 0.753) (24,49),
suggesting that inflammation-associated molecules are of high
prognostic value for ccRCC. This IPS was also discovered to be a
high-risk factor for poorer outcomes compared with other clinical
characteristics [HR=11.73; 95% CI, 26.98-5.10; P<0.001],
yielding the largest HR in the present study. Subsequently, the IPI
was developed by combining the IPS with clinicopathological factors
to enhance clinical accuracy. In the nomogram of the IPI, the score
for each feature was calculated to obtain the total score, before a
vertical line is drawn on the total score scale to enable
clinicians to estimate the expected survival probability of an
individual patient with ccRCC. IPI displayed higher accuracy
compared with IPS for prognostic estimation in both the training
[AUC: 0.911 (IPI) vs. 0.811 (IPS)] and validation cohorts [AUC:
0.805 (IPI) vs. 0.799 (IPS)]. Using this proposed tool, in-clinic
risk-stratification of ccRCC could be improved in terms of both
accuracy and convenience. In addition, as tumorigenesis and
development of solid carcinomas in humans are facilitated by a
strong proinflammatory environment (50–52),
it is hypothesized that the IPS score, which was constructed using
IGs, can perform well when applied for the prognosis estimation of
other tumor types, such as neuroblastoma or osteosarcoma.
The immune microenvironment serves a significant
role in tumor development (17),
particularly in ccRCC (53–55).
Numerous studies have previously revealed that the interaction
between inflammation and immune cells can potentially fuel the
malignant development of ccRCC (44,45).
In particular, inflammatory signaling pathways [e.g., von
Hippel-Lindau tumor suppressor (VHL), hypoxia, TNF-α, STAT and
TGF-β] and inflammatory molecules (e.g., pVHL, TGFβ, IL6 and
selected chemokines/chemokine receptors) can promote the tumor
evasion of immune cells (44). As
a type of inflammatory cell death, pyroptosis may also recast a
suitable immune microenvironment to promote ccRCC growth (45). However, only a small number of
studies have systematically investigated the association between an
RNA expression-based inflammatory signature and the immune
microenvironment in the development of ccRCC (56). In the present study, high-risk
ccRCCs were classified based on the IPS, which exhibited
dysregulated profiles of immune cell infiltration compared with
those of low-risk ccRCCs. Infiltration by M0
macrophages, CD4 memory activated T cells, follicular helper T
cells and Tregs were all found to be significantly increased in
high-risk ccRCC. These tumor-infiltrating immune cells present at
high levels are proposed to sculpt a highly immunosuppressive
microenvironment to potentially promote the development of tumors,
particularly ccRCC (49,57). In a previous study, M0
macrophages were found to facilitate the progression of ccRCC,
where they were present at high levels in high-risk patients with
ccRCC (49). Tregs normally
prevent hyperactive immune responses and autoimmunity (58). They have been reported to
accumulate aberrantly in tumors, where they suppress antitumor
immunity and support the establishment of an immunosuppressive
microenvironment (58). All these
aforementioned results strongly indicate that the dysregulation of
immune cells or the immune microenvironment can fuel the
progression of high-risk ccRCC, which was identified by the IPS in
the present study.
There are certain limitations to the present study.
Although analysis was performed using a large sample size, the
retrospective nature is a limitation. Therefore, these findings,
including IPS and IPI, require further validation in clinical
trials. Furthermore, the IPS and associated immune mechanisms
require further validation using clinical data from multiple
centers. It was also not possible to analyze disease-free survival
due to the high abundance of censored data. Experimental in
vitro and in vivo data are expected to strengthen the
clinical feasibility of the IPS, which will be pursued further as
planned for future studies.
In conclusion, data in the present study suggest
that the constructed IPS and IPI are a highly effective and robust
tools for the clinical pre-stratification of patients with ccRCC
for the precise designation of intervention strategies to enhance
survival probability. Subsequently, it was found that inflammatory
responses and the dysregulation of the immune microenvironment,
including higher infiltration of immunosuppressive cells, can fuel
the progression of ccRCC. It is hoped that these findings can
facilitate the biological understanding into the roles of immunity
and inflammation in ccRCC development.
Supplementary Material
Supporting Data
Supporting Data
Supporting Data
Acknowledgements
Not applicable.
Funding
The present study was supported by a grant for the Hainan
Provincial Natural Science Foundation of China (grant no. 820RC769
and grant no.822RC839) and Hainan Provincial Graduate Innovation
research project (grant no. Qhyb2021-57).
Availability of data and materials
The datasets used and/or analyzed during the current
study are available from the corresponding author on reasonable
request.
Authors' contributions
GL was responsible for conceptualization and
visualization. GL and DX helped with the methodology, data curation
and writing (original draft preparation). GL, DX and ZC performed
the formal analysis. WJ, ZC and HC were involved in writing
(reviewing and editing for important intellectual content), and
helped with the analysis. WJ and ZC controlled project
administration. HC was responsible for funding acquisition. ZC and
HC confirm the authenticity of all the raw data. All authors read
and approved the final manuscript.
Ethics approval and consent to
participate
Full informed consent in written form was given by
the subjects and the study was approved by the Ethics Committee of
Renmin Hospital of Wuhan University (Wuhan, China; approval no.
2017K-C015).
Patient consent for publication
Not applicable.
Competing interests
The authors declare that they have no competing
interests.
Glossary
Abbreviations
Abbreviations:
|
ccRCC
|
clear cell renal cell carcinoma
|
|
IPS
|
inflammation-associated prognostic
signature
|
|
FPKM
|
fragments per kilobase of exon model
per million mapped fragments
|
|
IGs
|
inflammation-associated genes
|
|
LASSO
|
least absolute shrinkage and selection
operator
|
|
AIC
|
Akaike information criterion
|
|
ROC
|
receiver operating characteristic
|
|
AUC
|
area under ROC curve
|
|
KEGG
|
Kyoto Encyclopedia of Genes and
Genomes
|
|
PPI
|
protein-protein interaction
|
|
CIBERSORT
|
cell type identification through the
estimation of relative subsets of RNA transcripts
|
|
IGPs
|
IGs that impact the prognosis of
patients with ccRCC
|
|
Tregs
|
T regulatory cells
|
|
IPI
|
integrated prognostic index
|
References
|
1
|
Che Z, Fan J, Zhou Z, Li Q, Ma Z, Hu Z, Wu
Y, Jin Y, Su Y, Liang P and Li H: Activation-induced cytidine
deaminase expression facilitates the malignant phenotype and
epithelial-to-mesenchymal transition in clear cell renal cell
carcinoma. DNA Cell Biol. 39:1299–1312. 2020. View Article : Google Scholar
|
|
2
|
Zhang F, Ma X, Li H, Zhang Y, Li X, Chen
L, Guo G, Gao Y, Gu L, Xie Y, et al: FOXK2 suppresses the malignant
phenotype and induces apoptosis through inhibition of EGFR in
clear-cell renal cell carcinoma. Int J Cancer. 142:2543–2557. 2018.
View Article : Google Scholar : PubMed/NCBI
|
|
3
|
Wang Y, Cong R, Liu S, Zhu B, Wang X and
Xing Q: Decreased expression of METTL14 predicts poor prognosis and
construction of a prognostic signature for clear cell renal cell
carcinoma. Cancer Cell Int. 21:462021. View Article : Google Scholar
|
|
4
|
Tacconi EM, Tuthill M and Protheroe A:
Review of adjuvant therapies in renal cell carcinoma: Evidence to
date. Onco Targets Ther. 13:12301–12316. 2020. View Article : Google Scholar : PubMed/NCBI
|
|
5
|
Su Y, Lu J, Chen X, Liang C, Luo P, Qin C
and Zhang J: Long non-coding RNA HOTTIP affects renal cell
carcinoma progression by regulating autophagy via the
PI3K/Akt/Atg13 signaling pathway. J Cancer Res Clin Oncol.
145:573–588. 2019. View Article : Google Scholar
|
|
6
|
Xu F, Guan Y, Xue L, Huang S, Gao K, Yang
Z and Chong T: The effect of a novel glycolysis-related gene
signature on progression, prognosis and immune microenvironment of
renal cell carcinoma. BMC Cancer. 20:12072020. View Article : Google Scholar : PubMed/NCBI
|
|
7
|
Czarnecka AM, Kukwa W, Kornakiewicz A,
Lian F and Szczylik C: Clinical and molecular prognostic and
predictive biomarkers in clear cell renal cell cancer. Future
Oncol. 10:2493–2508. 2014. View Article : Google Scholar
|
|
8
|
Wang ZH, Zhang YZ, Wang YS and Ma XX:
Identification of novel cell glycolysis related gene signature
predicting survival in patients with endometrial cancer. Cancer
Cell Int. 19:2962019. View Article : Google Scholar
|
|
9
|
Gray RE and Harris GT: Renal cell
carcinoma: Diagnosis and management. Am Fam Physician. 99:179–184.
2019.PubMed/NCBI
|
|
10
|
Shi J, Wang K, Xiong Z, Yuan C, Wang C,
Cao Q, Yu H, Meng X, Xie K, Cheng Z, et al: Impact of inflammation
and immunotherapy in renal cell carcinoma. Oncol Lett. 20:2722020.
View Article : Google Scholar
|
|
11
|
Zhao E, Li L, Zhang W, Wang W, Chan Y, You
B and Li X: Comprehensive characterization of immune- and
inflammation-associated biomarkers based on multi-omics integration
in kidney renal clear cell carcinoma. J Transl Med. 17:1772019.
View Article : Google Scholar : PubMed/NCBI
|
|
12
|
Chen Q, Wang J, Zhang Q, Zhang J, Lou Y,
Yang J, Chen Y, Wei T, Zhang J, Fu Q, et al: Tumour cell-derived
debris and IgG synergistically promote metastasis of pancreatic
cancer by inducing inflammation via tumour-associated macrophages.
Br J Cancer. 121:786–795. 2019. View Article : Google Scholar : PubMed/NCBI
|
|
13
|
Balkwill F and Mantovani A: Inflammation
and cancer: Back to Virchow? Lancet. 357:539–545. 2001. View Article : Google Scholar
|
|
14
|
Liubomirski Y, Lerrer S, Meshel T,
Rubinstein-Achiasaf L, Morein D, Wiemann S, Körner C and Ben-Baruch
A: Tumor-stroma-inflammation networks promote pro-metastatic
chemokines and aggressiveness characteristics in triple-negative
breast cancer. Front Immunol. 10:7572019. View Article : Google Scholar
|
|
15
|
Ngabire D and Kim GD: Autophagy and
inflammatory response in the tumor microenvironment. Int J Mol Sci.
18:20162017. View Article : Google Scholar
|
|
16
|
Carraway RE and Cochrane DE: Enhanced
vascular permeability is hypothesized to promote
inflammation-induced carcinogenesis and tumor development via
extravasation of large molecular proteins into the tissue. Med
Hypotheses. 78:738–743. 2012. View Article : Google Scholar : PubMed/NCBI
|
|
17
|
Mantovani A, Bussolino F and Dejana E:
Cytokine regulation of endothelial cell function. FASEB J.
6:2591–2599. 1992. View Article : Google Scholar : PubMed/NCBI
|
|
18
|
Dominguez C, David JM and Palena C:
Epithelial-mesenchymal transition and inflammation at the site of
the primary tumor. Semin Cancer Biol. 47:177–184. 2017. View Article : Google Scholar
|
|
19
|
Koong AC, Denko NC, Hudson KM, Schindler
C, Swiersz L, Koch C, Evans S, Ibrahim H, Le QT, Terris DJ and
Giaccia AJ: Candidate genes for the hypoxic tumor phenotype. Cancer
Res. 60:883–887. 2000.PubMed/NCBI
|
|
20
|
Taher MY, Davies DM and Maher J: The role
of the interleukin (IL)-6/IL-6 receptor axis in cancer. Biochem Soc
Trans. 46:1449–1462. 2018. View Article : Google Scholar : PubMed/NCBI
|
|
21
|
Kaminska K, Czarnecka AM, Escudier B, Lian
F and Szczylik C: Interleukin-6 as an emerging regulator of renal
cell cancer. Urol Oncol. 33:476–485. 2015. View Article : Google Scholar
|
|
22
|
DiGiacomo JW and Gilkes DM: Tumor hypoxia
as an enhancer of inflammation-mediated metastasis: Emerging
therapeutic strategies. Target Oncol. 13:157–173. 2018. View Article : Google Scholar
|
|
23
|
Simon N, Friedman J, Hastie T and
Tibshirani R: Regularization paths for Cox's proportional hazards
model via coordinate descent. J Stat Softw. 39:1–13. 2011.
View Article : Google Scholar : PubMed/NCBI
|
|
24
|
Jin W, Zhang Y, Liu Z, Che Z, Gao M and
Peng H: Exploration of the molecular characteristics of the
tumor-immune interaction and the development of an individualized
immune prognostic signature for neuroblastoma. J Cell Physiol.
236:294–308. 2021. View Article : Google Scholar
|
|
25
|
Therneau TM and Grambsch PM: Modeling
survival data: Extending the Cox model. Springer; New York, NY: pp.
39–77. 2000
|
|
26
|
Li B, Cui Y, Diehn M and Li R: Development
and validation of an individualized immune prognostic signature in
early-stage nonsquamous non-small cell lung cancer. JAMA Oncol.
3:1529–1537. 2017. View Article : Google Scholar
|
|
27
|
Newman AM, Liu CL, Green MR, Gentles AJ,
Feng W, Xu Y, Hoang CD, Diehn M and Alizadeh AA: Robust enumeration
of cell subsets from tissue expression profiles. Nat Methods.
12:453–457. 2015. View Article : Google Scholar : PubMed/NCBI
|
|
28
|
Liu L, Huang L, Chen W, Zhang G, Li Y, Wu
Y, Xiong J and Jie Z: Comprehensive analysis of necroptosis-related
long noncoding RNA immune infiltration and prediction of prognosis
in patients with colon cancer. Front Mol Biosci. 9:8112692022.
View Article : Google Scholar
|
|
29
|
Livak KJ and Schmittgen TD: Analysis of
relative gene expression data using real-time quantitative PCR and
the 2(−Delta Delta C(T)) method. Methods. 25:402–408. 2001.
View Article : Google Scholar : PubMed/NCBI
|
|
30
|
Xiao Z, He L, Takemoto M, Jalanko H, Chan
GC, Storm DR, Betsholtz C, Tryggvason K and Patrakka J: Glomerular
podocytes express type 1 adenylate cyclase: Inactivation results in
susceptibility to proteinuria. Nephron Exp Nephrol. 118:e39–e48.
2011. View Article : Google Scholar
|
|
31
|
Saleh AA, Tayel SI, Shalaby AG and El
Naidany SS: Role of adiponectin gene and receptor polymorphisms and
their mRNA levels with serum adiponectin level in myocardial
infarction. Appl Clin Genet. 13:241–252. 2020. View Article : Google Scholar
|
|
32
|
Mertens TC, Hanmandlu A, Tu L, Phan C,
Collum SD, Chen NY, Weng T, Davies J, Liu C, Eltzschig HK, et al:
Switching-Off Adora2b in vascular smooth muscle cells halts the
development of pulmonary hypertension. Front Physiol. 9:5552018.
View Article : Google Scholar
|
|
33
|
Feuser K, Thon KP, Bischoff SC and Lorentz
A: Human intestinal mast cells are a potent source of multiple
chemokines. Cytokine. 58:178–185. 2012. View Article : Google Scholar : PubMed/NCBI
|
|
34
|
Berglöf E, Andre R, Renshaw BR, Allan SM,
Lawrence CB, Rothwell NJ and Pinteaux E: IL-1Rrp2 expression and
IL-1F9 (IL-1H1) actions in brain cells. J Neuroimmunol. 139:36–43.
2003. View Article : Google Scholar
|
|
35
|
Chai L, Dai L, Che Y, Xu J, Liu G, Zhang Z
and Yang R: LRRC19, a novel member of the leucine-rich repeat
protein family, activates NF-kappaB and induces expression of
proinflammatory cytokines. Biochem Biophys Res Commun. 388:543–548.
2009. View Article : Google Scholar : PubMed/NCBI
|
|
36
|
Venerito M, Helmke C, Jechorek D, Wex T,
Rosania R, Antweiler K, Weigt J and Malfertheiner P: Leukotriene
receptor expression in esophageal squamous cell cancer and
non-transformed esophageal epithelium: A matched case control
study. BMC Gastroenterol. 16:852016. View Article : Google Scholar
|
|
37
|
Liu B, Xie Y, Mei X, Sun Y, Shi W and Wu
Z: Reciprocal regulation of interleukin-17A and interleukin-22
secretion through aryl hydrocarbon receptor activation in CD4(+) T
cells of patients with vitiligo. Exp Ther Med. 21:1582021.
View Article : Google Scholar : PubMed/NCBI
|
|
38
|
Cai X, Zhang P, Wang S, Hong L, Yu S, Li
B, Zeng H, Yang X and Shao L: lncRNA FGD5 antisense RNA 1
upregulates RORA to suppress hypoxic injury of human cardiomyocyte
cells by inhibiting oxidative stress and apoptosis via miR195. Mol
Med Rep. 22:4579–4588. 2020. View Article : Google Scholar : PubMed/NCBI
|
|
39
|
Flores-Mendoza LK, Estrada-Jimenez T,
Sedeno-Monge V, Moreno M, Manjarrez MD, González-Ochoa G,
Millán-Pérez Peña L and Reyes-Leyva J: IL-10 and socs3 are
predictive biomarkers of dengue hemorrhagic fever. Mediators
Inflamm. 2017:51975922017. View Article : Google Scholar : PubMed/NCBI
|
|
40
|
Liang Y, Qiao L, Peng X, Cui Z, Yin Y,
Liao H, Jiang M and Li L: The chemokine receptor CCR1 is identified
in mast cell-derived exosomes. Am J Transl Res. 10:352–367.
2018.PubMed/NCBI
|
|
41
|
Wu J, Lv Y, Li Y, Jiang Y, Wang L, Zhang
X, Sun M, Zou Y, Xu J and Zhang L: MCM3AP-AS1/miR-876-5p/WNT5A axis
regulates the proliferation of prostate cancer cells. Cancer Cell
Int. 20:3072020. View Article : Google Scholar
|
|
42
|
Patil I: Visualizations with statistical
details: The'ggstatsplot' approach. J Open Source Softw.
6:31672021. View Article : Google Scholar
|
|
43
|
Alba AC, Agoritsas T, Walsh M, Hanna S,
Iorio A, Devereaux PJ, McGinn T and Guyatt G: Discrimination and
calibration of clinical prediction models: Users' guides to the
medical literature. JAMA. 318:1377–1384. 2017. View Article : Google Scholar : PubMed/NCBI
|
|
44
|
de Vivar Chevez AR, Finke J and Bukowski
R: The role of inflammation in kidney cancer. Adv Exp Med Biol.
816:197–234. 2014. View Article : Google Scholar
|
|
45
|
Zhang X, Wei X, Wang Y, Wang S, Ji C, Yao
L and Song N: Pyroptosis regulators and tumor microenvironment
infiltration characterization in clear cell renal cell carcinoma.
Front Oncol. 11:7742792021. View Article : Google Scholar
|
|
46
|
Nishida J, Momoi Y, Miyakuni K, Tamura Y,
Takahashi K, Koinuma D, Miyazono K and Ehata S: Epigenetic
remodelling shapes inflammatory renal cancer and
neutrophil-dependent metastasis. Nat Cell Biol. 22:465–475. 2020.
View Article : Google Scholar
|
|
47
|
Gorka J, Marona P, Kwapisz O, Rys J, Jura
J and Miekus K: The anti-inflammatory protein MCPIP1 inhibits the
development of ccRCC by maintaining high levels of tumour
suppressors. Eur J Pharmacol. 888:1735912020. View Article : Google Scholar
|
|
48
|
Roumenina LT, Daugan MV, Noé R, Petitprez
F, Vano YA, Sanchez-Salas R, Becht E, Meilleroux J, Clec'h BL,
Giraldo NA, et al: Tumor cells hijack macrophage-produced
complement C1q to promote tumor growth. Cancer Immunol Res.
7:1091–1105. 2019. View Article : Google Scholar : PubMed/NCBI
|
|
49
|
Hua X, Chen J, Su Y and Liang C:
Identification of an immune-related risk signature for predicting
prognosis in clear cell renal cell carcinoma. Aging (Albany NY).
12:2302–2332. 2020. View Article : Google Scholar : PubMed/NCBI
|
|
50
|
Vezzani B, Carinci M, Previati M,
Giacovazzi S, Della Sala M, Gafà R, Lanza G, Wieckowski MR, Pinton
P and Giorgi C: Epigenetic regulation: A link between inflammation
and carcinogenesis. Cancers (Basel). 14:12212022. View Article : Google Scholar : PubMed/NCBI
|
|
51
|
Özdemir BH: Tumor microenvironment:
Necroptosis switches the subtype of liver cancer while necrosis
promotes tumor recurrence and progression. Exp Clin Transplant. Mar
15–2022.(Epub ahead of print). View Article : Google Scholar
|
|
52
|
Jha NK, Arfin S, Jha SK, Kar R, Dey A,
Gundamaraju R, Ashraf GM, Gupta PK, Dhanasekaran S, Abomughaid MM,
et al: Re-establishing the comprehension of phytomedicine and
nanomedicine in inflammation-mediated cancer signaling. Semin
Cancer Biol. Feb 23–2022.(Epub ahead of print). View Article : Google Scholar
|
|
53
|
Şenbabaoğlu Y, Gejman RS, Winer AG, Liu M,
Van Allen EM, de Velasco G, Miao D, Ostrovnaya I, Drill E, Luna A,
et al: Tumor immune microenvironment characterization in clear cell
renal cell carcinoma identifies prognostic and
immunotherapeutically relevant messenger RNA signatures. Genome
Biol. 17:2312016. View Article : Google Scholar
|
|
54
|
Chevrier S, Levine JH, Zanotelli VR,
Silina K, Schulz D, Bacac M, Ries CH, Ailles L, Jewett MA, Moch H,
et al: An immune atlas of clear cell renal cell carcinoma. Cell.
169:736–749.e718. 2017. View Article : Google Scholar
|
|
55
|
Xiao GF, Yan X, Chen Z, Zhang RJ, Liu TZ
and Hu WL: Identification of a novel immune-related prognostic
biomarker and small-molecule drugs in clear cell renal cell
carcinoma (ccRCC) by a merged microarray-acquired dataset and TCGA
database. Front Genet. 11:8102020. View Article : Google Scholar
|
|
56
|
Tang X, Zhang A, Feng Y, Su Y, Wang X,
Jiang F and Ma J: A novel pyroptosis-related lncRNAs signature for
predicting the prognosis of kidney renal clear cell carcinoma and
its associations with immunity. J Oncol. 2021:99971852021.
View Article : Google Scholar
|
|
57
|
Dunn GP, Bruce AT, Ikeda H, Old LJ and
Schreiber RD: Cancer immunoediting: From immunosurveillance to
tumor escape. Nat Immunol. 3:991–998. 2002. View Article : Google Scholar
|
|
58
|
Wang H, Franco F and Ho PC: Metabolic
regulation of tregs in cancer: Opportunities for immunotherapy.
Trends Cancer. 3:583–592. 2017. View Article : Google Scholar : PubMed/NCBI
|