Introduction
Ovarian neoplasm accounts for 6.6% of all female
neoplasms (1) and has emerged as
one of the most prevalent types of gynecological cancer in Western
nations and is also an emerging type of cancer in Asia (2). Ovarian neoplasm survival in
Indonesians is poor (3), with its
mortality rate surpassing that of cervical and endometrial cancer
(4). Ovarian neoplasm is the third
most common cancer in women in Indonesia, with incidence rates of
10 per 100,000 individuals, 14,896 new cases in 2020, and a
mortality rate of 4.1% (5).
According to a recent study, 80% of all ovarian neoplasms are
benign (6). Others are malignant,
with epithelial ovarian carcinoma (EOC) accounting for 90% of
ovarian cancers (7).
The effects of the Western lifestyle have been
linked to chronic high blood glucose, obesity, and insulin
resistance (IR), all of which are included in metabolic syndrome
(MetS) (8). Through insulin-like
growth factor (IGF) signaling, IR induces hyperinsulinemia and has
a mitogenic and anti-apoptotic effect (9,10).
These contribute to the development of multisite cancer (11), especially in individuals who
consume more food with a higher glycemic index (12). Hyperinsulinemia has been linked to
an increased risk of ovarian cancer in women after menopause
(13), and thus it would be
another obstacle that would significantly influence cancer
outcomes. Several investigations have studied the link between IR
and cancer in general (14) and
cancer in women, namely cancer of the breast (15–21),
endometrium (16,22) and cervix (16). However, despite obesity being a
well-known risk factor for ovarian cancer (23), limited evidence supports the role
of IR in ovarian neoplasm (16,24,25),
and controversies arise regarding whether IR prevalence is
different between benign and malignant neoplasms (24–26).
In a previous study of non-diabetic post-menopausal
Chinese women with ovarian neoplasms, researchers discovered that
the prevalence of ovarian neoplasms was twice as high in the
insulin-resistant group as it was in the insulin-sensitive group
(16). However, no prior research
in Indonesia has studied the difference in IR prevalence between
benign and malignant ovarian neoplasms, and no current research has
studied surrogate indicators of IR in these two types of ovarian
neoplasms. The present study aimed to examine the
clinicopathological characteristics, metabolic indicators, and
prevalence of benign and malignant ovarian neoplasms in Indonesian
women. Fasting insulin level (FIL), homeostatic model assessment of
IR (HOMA-IR), homeostasis model assessment of β-cell dysfunction
(HOMA-β), fasting IR index (FIRI), and quantitative insulin
sensitivity check index (QUICKI) were some of the novels, robust
surrogate markers the present study attempted to evaluate in
correlation with IR status. The present study also intended to
investigate the correlations between the markers and the
relationships between the markers and clinical characteristics.
Based on IR status and body mass index, it sought to establish a
connection between clinicopathological and metabolic variables and
ovarian neoplasm grouping by IR status and body mass index
(BMI).
Materials and methods
Research design, study population, and
inclusion and exclusion criteria
The present study was an analytical cross-sectional
study investigating surrogate markers of IR in benign and malignant
ovarian neoplasms patients in Dr. Cipto Mangunkusumo Hospital, a
referral hospital for cancer in Indonesia, between October 2019 and
2020. The minimum required sample was calculated using a
statistical formula for a comparative test of numerical data of two
unpaired groups that were carried out in one measurement (27,28)
as stated below:
In this formula, ‘n1 and n2’
denoted the number of subjects in each group (benign and
malignant). ‘Zα’ was the standard value of α obtained
from the z-curve, with a value of 1.96, and ‘Zβ’ is the standard
value of type two error (β=0.8), with a value of 0.84. The notation
of ‘π’ is the sum of two standard deviations (SDs) of HOMA-IR, as a
common marker of IR, in the malignant group (SD=0.5) and benign
group (SD=0.6) of ovarian neoplasm and thus π value was 1.1
(24). The mean score difference
of the HOMA-IR deemed significant between the two groups was
indicated by ‘X1-X2’, with 2.8 being the
value judged by the researchers to be significantly different (a
prior study determined it as 0.5, but the result was not
statistically significant) (24).
Following calculation, the present study obtained a
minimum number of subjects per group of 18.97 (~19). However, it
adopted a consecutive nonrandom sampling method and enlisted 80
subjects with ovarian cysts suspected as neoplasms who were
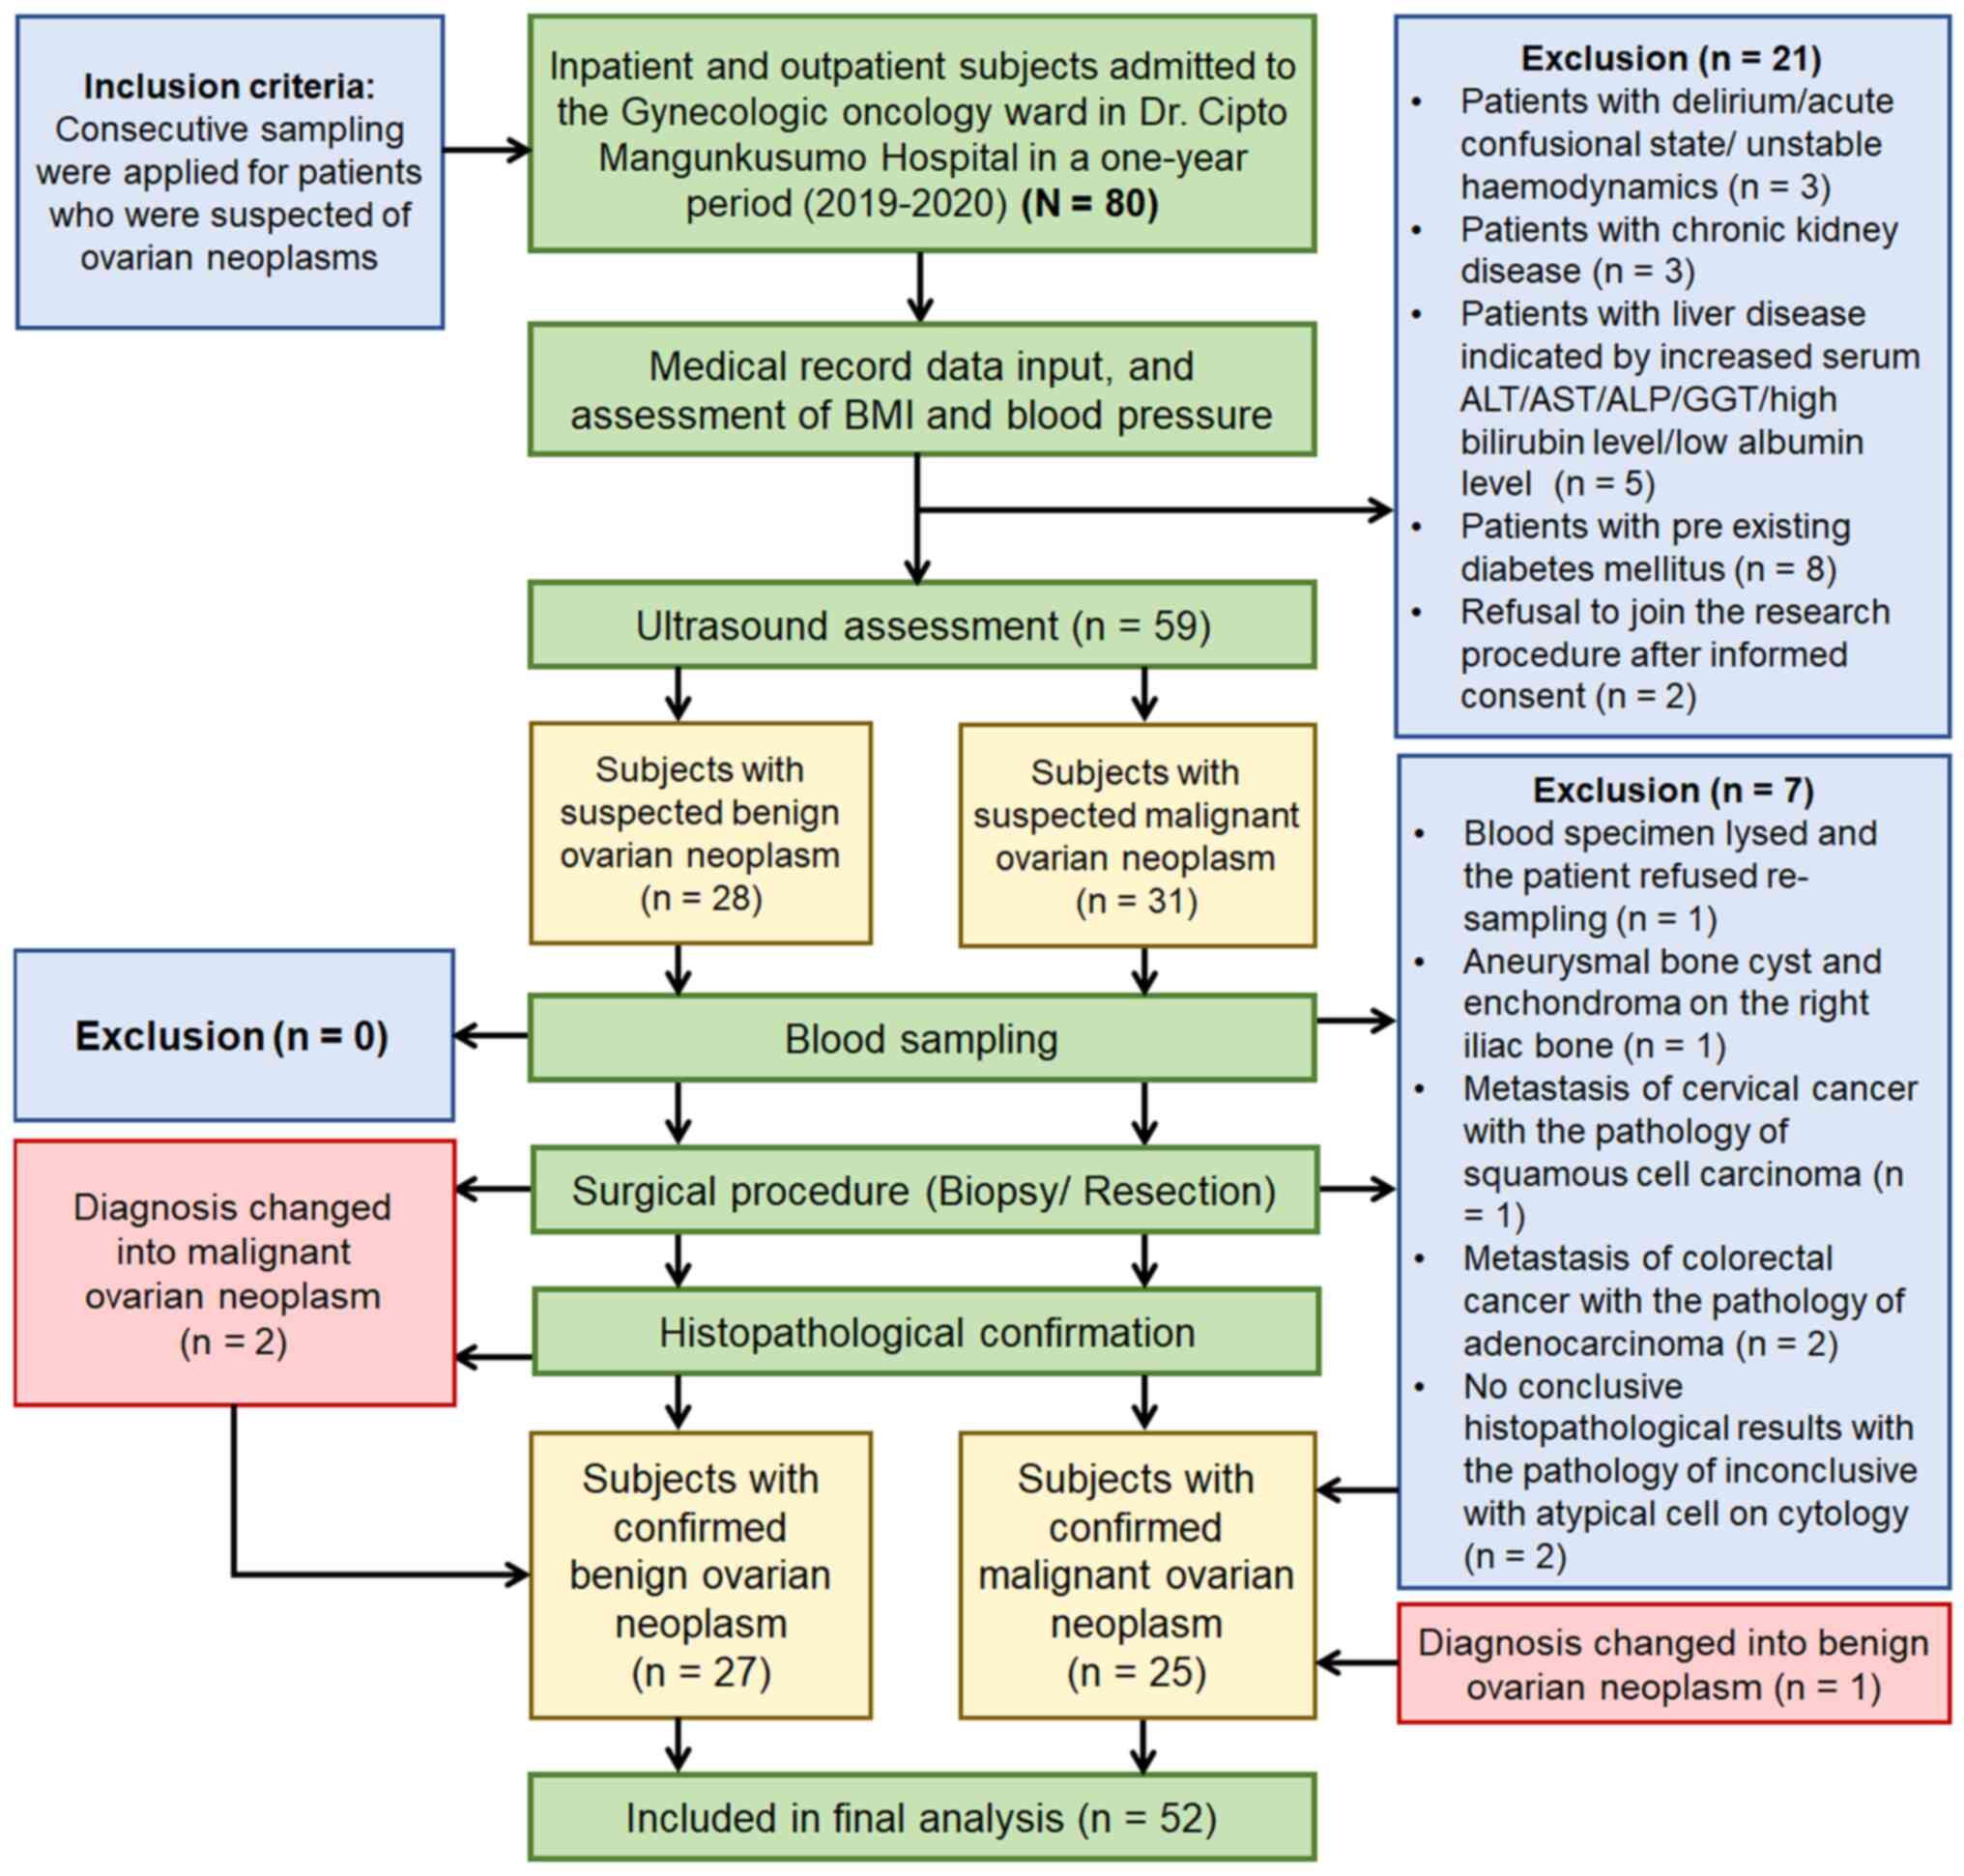
admitted to inpatient or outpatient services in the ward. Fig. 1 describes the selection of subjects
based on inclusion and exclusion criteria. After all eligible
patients had given informed consent, transvaginal, transabdominal,
or transrectal ultrasound (US) was performed by an experienced
examiner to initially classify the neoplasms as benign or malignant
while waiting for histopathological confirmation. The initial
grouping followed the assessment of different neoplasias in the
adnexa risk model developed by the International Ovarian Tumor
Analysis (IOTA) (29,30). Clinical characteristics and blood
sampling were obtained preoperatively, and histopathological
examination results confirmed the final grouping after the surgical
procedure (resection or biopsy).
Data extraction, measurement of
parameters, and definition of variables
Data were extracted from the identity cards of
patients, history, and medical records. Sociodemographic variables
included the hometown, age, education, and occupation of patients.
The province where the patient resided within the last year was
recorded based on the identity card and domicile letter (31). The rurality variable was created by
categorizing the patients' domicile into rural, suburban, and urban
areas based on the Indonesian Statistics Agency data (32–34).
The age was classified into ranges per decade and categorized into
young (≤40 years) and old age (>40 years) based on productivity
and reproductive age (35,36) and relevant studies (37,38).
Formal education was categorized based on their level of
educational status to be low level [primary and junior high school
(JHS)] or high-level education [senior high school (SHS) and
bachelor's degree)] (39).
Employment status was categorized as employed or unemployed
(39).
The present study analyzed parity status,
contraception use, menopausal status and age, specimen type,
affected ovarium site (left/right), cancer stage, and
histopathological examination results through medical records,
surgical reports, and pathological reports. A prior study
classified parity status into nulliparous, primiparous, and
multiparous (3). Contraception
status was classified by different methods of contraception that
the subjects had ever used, such as hormonal or non-hormonal
contraception, pill or non-pill, and injection or non-injection
(3). Menopausal status was defined
as a cessation of the menstrual cycle for 12 months and was
classified based on a prior study (3). Specimen types were divided into
biopsy or resection specimens. The history of cancer pointed to the
presence of any malignancies in the close/nuclear family. The
affected side of the ovary included the left, right, or bilateral
ovary depending on the location of the neoplasm found at diagnosis.
The cancer stage was grouped as early (I–II) and advanced stage
(III–IV) cancer, as classified by The International Federation of
Gynecology and Obstetrics (40).
Experienced gynecological-oncologist consultants performed the
determination of the cancer stage. Histopathological examination
results were obtained from post-surgical samples and confirmed
benign or malignant pathological diagnoses and other concurrent
pathological findings based on World Health Organization (WHO)
criteria (41). The malignant
neoplasms can histologically be classified as an epithelial, germ
cell, sex cord-stromal, other specific non-epithelial, and
non-specific histological types (42).
The present study measured blood pressure (BP) and
documented prior hypertension history, BMI, fasting plasma glucose
(FPG), and FIL in metabolic parameters. The systolic and diastolic
blood pressure (SBP and DBP) were doubly measured using a
clinically validated digital sphygmomanometer (Omron HEM-7120;
OMRON Healthcare Asia) with a standard protocol of measurement of
BP (43). The results of SBP and
DBP were classified based on the 2020 Global Hypertension Practice
Guidelines (43). BMI was computed
using height and weight data from calibrated hospital scales
following adult anthropometrics standard procedures (44). The Asia Pacific standard's specific
threshold was applied to classify BMI (45), which was then divided into two
groups (normal + underweight and overweight + obese).
All blood sampling and recording of clinical data
were performed before surgery. A venous blood sample was taken to
measure FPG and FIL in the morning after overnight fasting.
Following universal standard precautions, 6 ml of peripheral venous
blood was collected from the antecubital vein by venipuncture into
red and grey sterile Vacutainer tubes from participants who had
fasted overnight (8–12 h) (46).
Blood in the grey tube was used for FPG analysis using a hexokinase
enzymatic reference method (47).
Meanwhile, blood in the red tube was chilled immediately and
allowed to clot within 30–45 min. Then, the clotted blood was
centrifuged at 1,300-2,000 × g for 15 min at 4°C. After obtaining
the serum (supernatant), it and the aliquot were put into two
sample cups, each with a volume of 0.5 ml. The remaining aliquots
were stored at −80°C until assayed. The procedures used in this
investigation were based on a previous study (48).
Insulin was quantified using the chemiluminescence
technique with a standardized ADVIA Centaur ReadyPack assay (Bayer
AG). The ADVIA insulin examination is a two-site sandwich
immunoassay using direct chemiluminescence technology, employing
two antibody types. The first antibody, in Lite Reagent, is a
labeled mouse insulin monoclonal antibody conjugated to acridinium
ester. The second antibody, a solid-phase mouse insulin monoclonal
antibody, was attached to a paramagnetic particle. These two
antibodies react with the insulin in the sample and produce a
luminescent emission captured by the photomultiplier and translated
into a Relative Light Unit (RLU). This RLU value is proportional to
the insulin concentration in the sample. This process was referred
to in a study by Gupta et al (49).
The present study employed three FPG criteria as
given in the guidelines by the American Diabetes Association in
2022 (50). Criteria for high FIL
were defined from receiver operating characteristic (ROC) curve
analyses in a previous study with a cut-off of <7 µIU/ml to
exclude IR (51). The present
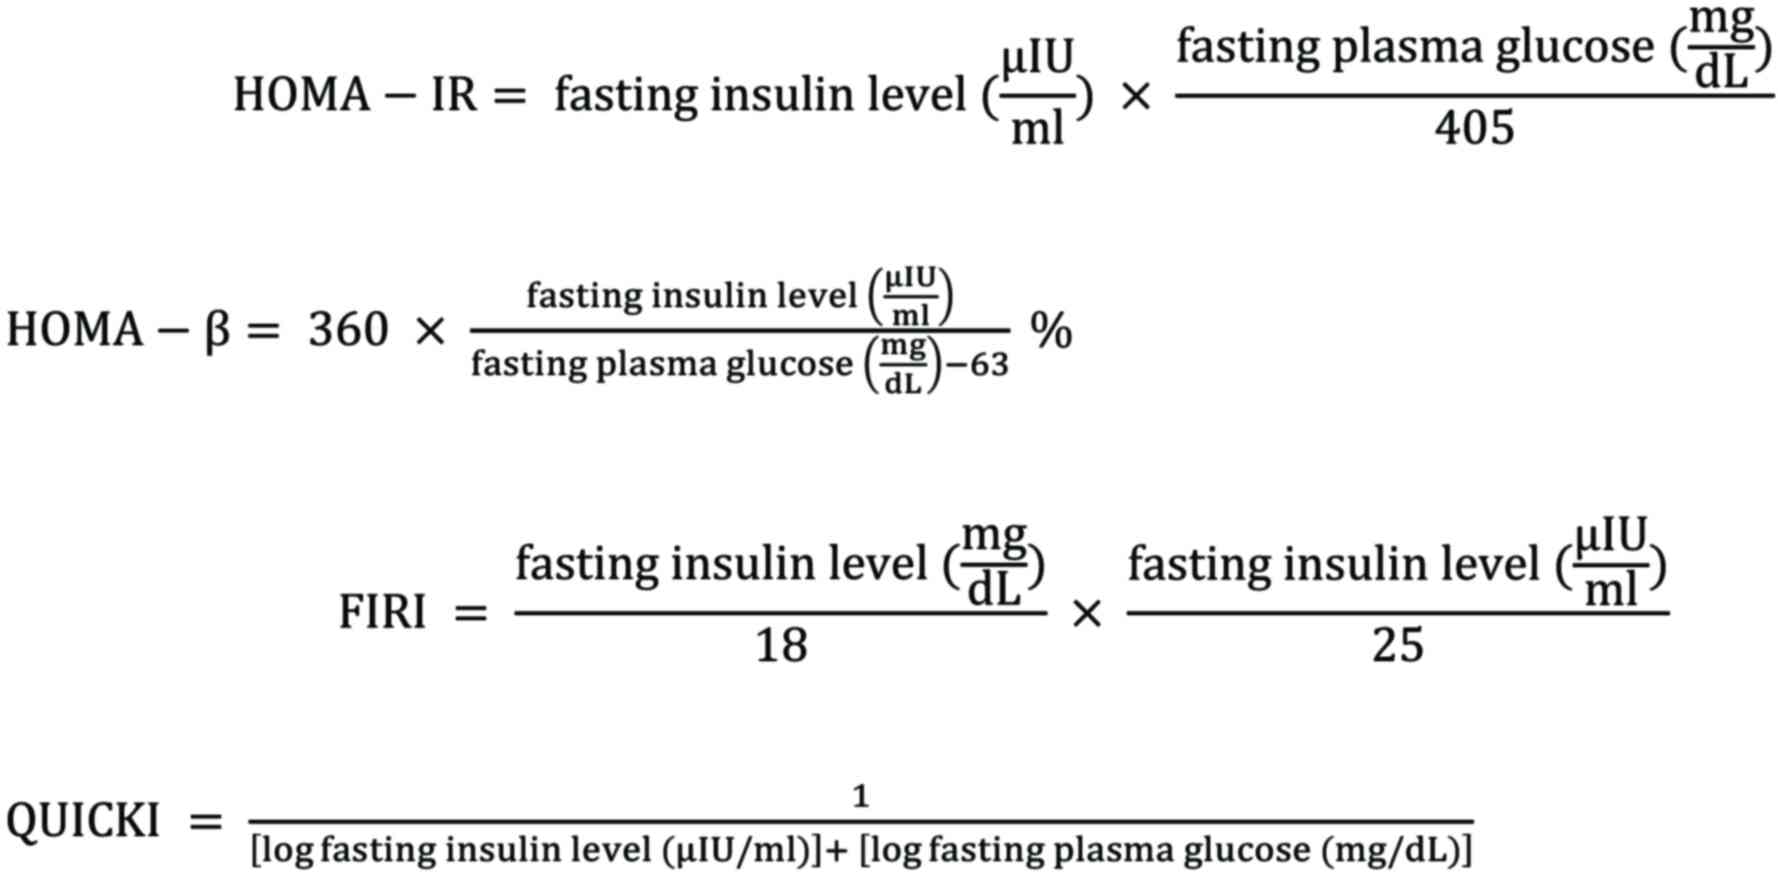
study employed several surrogate markers [i.e., HOMA-IR (52,53),
HOMA-β (52–55), FIRI (56–58),
and QUICKI (59–62)] with the following equations to
quantify IR prevalence:
HOMA-IR was used to evaluate IR and calculated with
a HOMA calculator released in MDCalc (mdcalc.com/homa-ir-homeostatic-model-assessment-insulin-resistance).
The present study used a cut-off of HOMA-IR specific for Indonesian
women with IR and MetS with a value of ≥1.208 noted as IR and
‘normal’ if the result is <1.208 (63).
HOMA-β classification depicts the function of the
pancreatic β-cells (64). The
classification used for the HOMA-β tests was determined by an Asian
study from Japan using a cut-off point by tertile: ≤76.25 (low
value; suggesting β-cell dysfunction); 76.25-122.13 (medium value;
indicating normal β-cell function); and ≥122.13 (high; suggesting
the excessive function of insulin secretion in β-cells, commonly
found in central obesity) (53).
Duncan et al (57) formulated FIRI derived from FIL and
FPG, which has been validated as an empirical IR index against the
hyperinsulinaemic-euglycaemic clamp (HEC) (65). The original formula for FIRI in a
previous study used FPG in mmol/l (66), hence the present study modified it
to be adjusted in mg/dl by dividing the FPG by 18 [FPG (mmol/l)=FPG
(mg/dl)/18] (67). A lower result
of FIRI reflected a normal-level value, and the cut-off >0.77
denoted IR based on the AUC value in a prior study (68).
The QUICKI is the inverse of the HOMA-IR and
assesses insulin sensitivity instead of IR (69) and a value <0.339 indicated IR
(59–62).
Ethical clearance
An Institutional Ethical Reviewer Board from the
Faculty of Medicine Universitas Indonesia authorized this research,
with the ethical clearance number
KET-1091/UN2.F1/ETIK/PPM.00.02/2019. The eligible subjects gave
full written consent to this research regarding the present study's
purpose and procedure. This study followed the Strengthening the
reporting of observational studies in epidemiology checklist
guidelines for cross-sectional studies (70).
Statistical analysis
All collected data were analyzed using the
Statistical Package for the Social Sciences software (v24; IBM
Corp.) and visualized using Microsoft Excel for Microsoft 365 MSO
(v2205; 32-bit edition; Microsoft Corporation). After completing a
Levene's test for homogeneity of variances following the normality
test using the Kolmogorov-Smirnov or Shapiro-Wilk tests, normally
distributed continuous data were expressed as a mean score and
standard error or as median score [interquartile ranges (IQR)] if
they were skewed in distribution. Employing an independent
Student's t-test or its alternate statistical test (the
Mann-Whitney U test), numerical data of clinical and metabolic
parameters were compared between cases of benign and malignant
neoplasms, whereas for categorical data, χ2 or Fisher
exact tests were used.
P<0.05 indicated a statistically significant
difference with a 95% confidence interval (CI). Pearson's
correlation analysis or Spearman's rank test was used depending on
data variance. Their correlation value (r) or rho degree (ρ) was
interpreted according to the standard: 0, no correlation; 0.01-0.2,
very weak correlation; 0.2-0.4, weak correlation; 0.4-0.6, moderate
correlation; 0.6-0.8, strong correlation; 0.8-1, very strong
correlation; and 1, monotonic correlation (71).
Results
Sociodemographic, clinicopathological
and metabolic profiles
In the present study, 52 subjects were selected,
consisting of 27 (51.92%) with benign neoplasm and 25 (48.08%) with
malignant neoplasm. The majority of the patients came from urban
areas (67.3%), then suburban areas (19.2%), and then rural areas
(13.5%). Five different provinces were identified, with residents
of Jakarta representing the majority of participants (53.9%),
followed by those from West Java (26.9%), Banten (15.4%), Bangka
Belitung (1.9%), and Yogyakarta (1.9%). Unemployed subjects made up
61.5% of the population. More than 60% of women had a high level of
formal education, including a bachelor's degree (19.2%) and SHS
(42.3%). Meanwhile, almost 40% of women possessed a low level of
formal education comprised of primary school (21.2%) and JHS
(17.3%). Subjects had a mean age of 42.9±11.0 (range 17–65 years).
As shown in Table I, the
proportion between young and old patients was comparable (55.8% vs.
44.2%), corresponding with the significantly different mean score
between patients with benign and malignant neoplasms (38.63±11.43
vs. 47.40±8.63, P=0.003) in Table
II. The majority of the participants were married, had multiple
children, were not menopausal, did not use contraception, had no
family history of cancer, had both ovaries affected by tumors, had
normal levels of SBP and DBP, did not previously have hypertension,
and were within the normal weight range according to BMI.
 | Table I.Comparison of patient's
sociodemographic and clinical characteristics between the two
ovarian neoplasm classifications. |
Table I.
Comparison of patient's
sociodemographic and clinical characteristics between the two
ovarian neoplasm classifications.
|
| Ovarian
neoplasms |
|
|
|
|---|
|
|
|
|
|
|
|---|
|
| Benign | Malignant | Total |
|
|---|
|
|
|
|
|
|
|---|
|
Characteristics | n | % | n | % | n | % | P-value |
|---|
| Age (years) |
|
|
|
|
|
| 0.123a |
|
11–20 | 1 | 3.7 | 0 | 0 | 1 | 1.9 |
|
|
21–30 | 8 | 29.7 | 1 | 4.0 | 9 | 17.3 |
|
|
31–40 | 7 | 25.9 | 6 | 24.0 | 13 | 25.0 |
|
|
41–50 | 6 | 22.2 | 8 | 32.0 | 14 | 26.9 |
|
|
51–60 | 4 | 14.8 | 9 | 36.0 | 13 | 25.0 |
|
|
61–70 | 1 | 3.7 | 1 | 4.0 | 2 | 3.9 |
|
| Age category
(years) |
|
|
|
|
|
| 0.023a |
| Young
(≤40) | 16 | 59.3 | 7 | 28.0 | 23 | 44.2 |
|
| Old
(>40) | 11 | 40.7 | 18 | 72.0 | 29 | 55.8 |
|
| Marital status |
|
|
|
|
|
|
>0.999b |
|
Married | 23 | 85.2 | 22 | 88.0 | 45 | 86.5 |
|
|
Unmarried | 4 | 14.8 | 3 | 12.0 | 7 | 13.5 |
|
| Parity status |
|
|
|
|
|
| 0.449a |
|
Nulliparous | 9 | 33.3 | 8 | 32.0 | 17 | 32.7 |
|
|
Primiparous | 3 | 11.1 | 6 | 24.0 | 9 | 17.3 |
|
|
Multiparous | 15 | 55.6 | 11 | 44.0 | 26 | 50.0 |
|
| Menopausal
status |
|
|
|
|
|
| 0.026a |
|
Yes | 6 | 22.2 | 13 | 52.0 | 19 | 36.5 |
|
| No | 21 | 77.8 | 12 | 48.0 | 33 | 63.5 |
|
| Fertility drug
use |
|
|
|
|
|
|
>0.999b |
|
Yes | 1 | 3.7 | 1 | 4.0 | 2 | 3.8 |
|
| No | 26 | 96.3 | 24 | 96.0 | 50 | 96.2 |
|
| Malignancy history
in the family |
|
|
|
|
|
|
>0.999b |
|
Yes | 1 | 3.7 | 1 | 4.0 | 2 | 3.8 |
|
| No | 26 | 96.3 | 24 | 96.0 | 50 | 96.2 |
|
| Contraception
use |
|
|
|
|
|
| 0.242a |
| No | 21 | 77.8 | 16 | 64.0 | 37 | 71.2 |
|
|
Pill | 2 | 7.4 | 1 | 4.0 | 3 | 5.8 |
|
|
DMPA | 0 | 0 | 4 | 16.0 | 4 | 7.7 |
|
| DMPA,
pill | 3 | 11.1 | 1 | 4.0 | 4 | 7.7 |
|
| DMPA,
IUD | 0 | 0.0 | 1 | 4.0 | 1 | 1.9 |
|
|
IUD | 1 | 3.7 | 1 | 4.0 | 2 | 3.8 |
|
| IUD,
pill | 0 | 0 | 1 | 4.0 | 1 | 1.9 |
|
| Contraception
type |
|
|
|
|
|
| 0.262a |
| None +
non-hormonal | 22 | 81.5 | 17 | 68.0 | 39 | 75.0 |
|
|
Hormonal | 5 | 18.5 | 8 | 32.0 | 13 | 25.0 |
|
| Oral contraception
use |
|
|
|
|
|
| 0.705b |
| No | 22 | 81.5 | 22 | 88.0 | 44 | 84.6 |
|
|
Yes | 5 | 18.5 | 3 | 12.0 | 8 | 15.4 |
|
| Injection
contraception use |
|
|
|
|
|
| 0.284b |
| No | 24 | 88.9 | 19 | 76.0 | 43 | 82.7 |
|
|
Yes | 3 | 11.1 | 6 | 24.0 | 9 | 17.3 |
|
| Specimens from
diagnostic procedures |
|
|
|
|
|
| 0.002a |
|
Biopsy | 9 | 33.3 | 0 | 0 | 9 | 17.3 |
|
|
Resection | 18 | 66.7 | 25 | 100.0 | 43 | 82.7 |
|
| Ovarium side
affected |
|
|
|
|
|
| 0.036b |
|
Left | 5 | 18.5 | 8 | 32.0 | 13 | 25.0 |
|
|
Right | 6 | 22.2 | 11 | 44.0 | 17 | 32.7 |
|
|
Bilateral | 16 | 59.3 | 6 | 24.0 | 22 | 42.3 |
|
| SBP (mmHg) |
|
|
|
|
|
| 0.043a |
| Normal
(<130) | 17 | 63.0 | 11 | 44.0 | 28 | 53.8 |
|
|
High-normal (130–139) | 8 | 29.6 | 4 | 16.0 | 12 | 23.1 |
|
| Grade I
(140–159) | 2 | 7.4 | 8 | 32.0 | 10 | 19.2 |
|
| Grade
II (≥160) | 0 | 0 | 2 | 8.0 | 2 | 3.9 |
|
| DBP (mmHg) |
|
|
|
|
|
| 0.377a |
| Normal
(<85) | 18 | 66.7 | 13 | 52.0 | 31 | 59.6 |
|
|
High-normal (85–89) | 7 | 25.9 | 6 | 24.0 | 13 | 25.0 |
|
| Grade I
(90–99) | 2 | 7.4 | 5 | 20.0 | 7 | 13.5 |
|
| Grade
II (≥100) | 0 | 0 | 1 | 4.0 | 1 | 1.9 |
|
| Prior hypertension
history |
|
|
|
|
|
| 0.053a |
| No | 20 | 74.1 | 12 | 48.0 | 32 | 61.5 |
|
|
Yes | 7 | 25.9 | 13 | 52.0 | 20 | 38.5 |
|
| BMI Asia-Pacific
classification (kg/m2) |
|
|
|
|
|
| 0.061a |
|
Underweight (<18.5) | 4 | 14.9 | 11 | 44.0 | 15 | 28.9 |
|
| Normal
(18.5–22.9) | 10 | 37.0 | 9 | 36.0 | 19 | 36.5 |
|
|
Overweight (23–24.9) | 8 | 29.6 | 2 | 8.0 | 10 | 19.2 |
|
| Obese
(≥25) | 5 | 18.5 | 3 | 12.0 | 8 | 15.4 |
|
| BMI class |
|
|
|
|
|
| 0.033a |
|
Lower-class BMI (normal +
underweight) | 14 | 51.9 | 20 | 80.0 | 34 | 65.4 |
|
|
Higher-class BMI (overweight +
obese) | 13 | 48.1 | 5 | 20.0 | 18 | 34.6 |
|
| Table II.Differences in mean or median values
of clinical characteristics of patients and metabolic parameters
between the two ovarian neoplasm classifications. |
Table II.
Differences in mean or median values
of clinical characteristics of patients and metabolic parameters
between the two ovarian neoplasm classifications.
|
| Mean ± SD or median
(IQR) |
|
|---|
|
|
|
|
|---|
| Variables | Benign ovarian
neoplasms | Malignant ovarian
neoplasms | All cases |
P-valuea |
|---|
| Age (years) | 38.63±11.43 | 47.40±8.63 | 42.85±11.01 | 0.003b |
| Menopausal age
(years) | 48.50±4.37 | 48.08±4.37 | 48.21±4.25 | 0.847b |
| SBP (mmHg) | 121.70±13.14 | 129.40±17.88 | 125.40±15.92 | 0.081b |
| DBP (mmHg) | 80.00
(78.00-85.00) | 84.00
(79.00-89.50) | 82.00
(78.00-87.75) | 0.078c |
| BMI
(kg/m2) | 22.98
(20.08-24.44) | 18.61
(17.97-21.32) | 20.39
(18.36-24.19) | 0.014c |
| FPG (mg/dl) | 82.00
(79.00-96.00) | 94.00
(78.00-100) | 84.00
(79.25-96.00) | 0.241c |
| FIL (µIU/ml) | 3.20
(4.20-7.70) | 3.60
(2.75-5.15) | 4.00
(2.95-5.87) | 0.105c |
| HOMA-IR | 0.82
(0.57-1.73) | 0.79
(0.54-1.29) | 0.82
(0.58-1.50) | 0.318c |
| HOMA-β (%) | 75.79
(59.29-102.86) | 49.33
(28.06-84.44) | 65.14
(42.91-99.07) | 0.011c |
| FIRI | 0.81
(0.54-1.56) | 0.74
(0.54-1.16) | 0.76
(0.54-1.35) | 0.327c |
| QUICKI | 0.39
(0.35-0.42) | 0.40
(0.37-0.42) | 0.39
(0.36-0.42) | 0.307c |
The differences in sociodemographic and clinical
characteristics between benign and malignant ovarian neoplasms
cases were found in the variable of age category (P=0.023),
menopausal status (P=0.026), specimen taking (P=0.002), affected
side of ovary (P=0.036), SBP (P=0.043), and BMI class (P=0.033).
Table II shows that the patients
with malignant neoplasms had a lower mean score of BMI than those
with benign tumors [18.61 (IQR: 17.97-21.32) vs. 22.98
(20.08-24.44), P=0.014]. It also demonstrates that malignant cases
had a lower median HOMA-β score than their counterparts [49.33
(IQR: 28.06–84.44) vs. 75.79 (IQR: 59.29–102.86), P=0.011].
As illustrated in Table III, the most frequent diagnosis
in cases of benign neoplasms was an endometrial cyst (59.3%),
followed by mucinous cystadenoma (25.9%) and mature teratoma
(18.5%). Mucinous carcinoma (40% of all malignant neoplasm cases),
clear cell carcinoma (24%), and adenocarcinoma (16%) were the three
most prevalent malignant neoplasm types. Among the malignant cases,
5 patients (20%) had stages I–II, and 20 patients (80%) had stages
II–IV of the disease.
| Table III.Description of histopathological
diagnosis in the benign and malignant ovarian neoplasm cases. |
Table III.
Description of histopathological
diagnosis in the benign and malignant ovarian neoplasm cases.
|
| Total |
|---|
|
|
|
|---|
| Histopathological
diagnosis | n | % |
|---|
| Primary ovarian
neoplasm diagnosis |
|
|
| Benign
pathology | 27 | 51.9 |
|
Malignant pathology | 25 | 48.1 |
| Presented benign
histopathological diagnosisa |
|
|
|
Endometrial cyst | 16 | 59.3 |
|
Mucinous cystadenoma | 7 | 25.9 |
| Mature
teratoma | 5 | 18.5 |
| Dermoid
cyst | 3 | 11.1 |
| Ovarian
abscess | 3 | 11.1 |
| Chronic
xanthogranuloma oophoritis | 2 | 7.4 |
| Brenner
tumor | 1 | 3.7 |
|
Seromucinous cystadenoma | 1 | 3.7 |
|
Cellular fibroma | 1 | 3.7 |
| Presented malignant
histopathological diagnosis |
|
|
|
Mucinous carcinoma | 10 | 40.0 |
| Clear
cell carcinoma | 6 | 24.0 |
|
Adenocarcinoma | 4 | 16.0 |
|
Endometrioid carcinoma | 2 | 8.0 |
| Serous
carcinoma | 2 | 8.0 |
| Mixed
type (mucinous carcinoma and clear cell carcinoma) | 1 | 4.0 |
Prevalence of IR in ovarian
neoplasms
The prevalence estimation of IR among Indonesian
patients with ovarian neoplasms ranged from 19.2% using FIL to
86.5% using QUICKI, depending on the selected surrogate marker
(Table IV). According to these
results, β-cell dysfunction affected 61.5% of patients
concurrently. For any application of the markers, there was no
statistically significant difference in the prevalence of IR and
β-cell dysfunction between benign and malignant cases. However,
subjects with benign neoplasms tended to have IR more commonly
(FIRI, 51.9% vs. 48%; HOMA-IR, 37% vs. 28%; and FIL, 25.9% vs.
12%). On the other hand, malignant neoplasms tended to have more
significant β-cell dysfunction according to HOMA-β (72% vs. 51.9%)
and more frequent IR according to QUICKI (92% vs. 81.5%). All cases
with high FPG ≥126 mg/dl (n=2) also belonged to malignant neoplasms
cases.
| Table IV.Comparison of metabolic parameters
related to the prevalence of insulin resistance between the two
ovarian neoplasm classifications. |
Table IV.
Comparison of metabolic parameters
related to the prevalence of insulin resistance between the two
ovarian neoplasm classifications.
|
| Ovarian
neoplasms |
|
|
|
|---|
|
|
|
|
|
|
|---|
|
| Benign | Malignant | Total |
|
|---|
|
|
|
|
|
|
|---|
| Parameters | n= | % | n= | % | n= | % | P-value |
|---|
| FPG (mg/dl) |
|
|
|
|
|
| 0.193a |
| Normal
(<100) | 24 | 88.9 | 18 | 72.0 | 42 | 80.8 |
|
|
Moderate (100–125) | 3 | 11.1 | 5 | 20.0 | 8 | 15.4 |
|
| High
(≥126) | 0 | 0 | 2 | 8.0 | 2 | 3.8 |
|
| FIL (µIU/ml) |
|
|
|
|
|
| 0.296b |
| Normal
(<7) | 20 | 74.1 | 22 | 88.0 | 42 | 80.8 |
|
| IR
(≥7) | 7 | 25.9 | 3 | 12.0 | 10 | 19.2 |
|
| HOMA-IR |
|
|
|
|
|
| 0.488a |
| Normal
(<1.208) | 17 | 63.0 | 18 | 72.0 | 35 | 67.3 |
|
| IR
(≥1.208) | 10 | 37.0 | 7 | 28.0 | 17 | 32.7 |
|
| HOMA-β (%) |
|
|
|
|
|
| 0.300a |
| Normal
β-cell function (76.25-122.13) | 8 | 29.6 | 5 | 20.0 | 13 | 25.0 |
|
| Beta
cell dysfunction (≤76.25) | 14 | 51.9 | 18 | 72.0 | 32 | 61.5 |
|
| Beta
cell excessive function (≥122.13) | 5 | 18.5 | 2 | 8.0 | 7 | 13.5 |
|
| FIRI |
|
|
|
|
|
| 0.781a |
| Normal
(≤0.77) | 13 | 48.1 | 13 | 52.0 | 26 | 50.0 |
|
| IR
(>0.77) | 14 | 51.9 | 12 | 48.0 | 26 | 50.0 |
|
| QUICKI |
|
|
|
|
|
| 0.352b |
| Normal
(>0.339) | 5 | 18.5 | 2 | 8.0 | 7 | 13.5 |
|
| IR
(≤0.339) | 22 | 81.5 | 23 | 92.0 | 45 | 86.5 |
|
Correlation between clinical features
and surrogate markers
Three different correlation analyses were performed
among markers, and between markers and clinical features, done in
the overall subject pool, and the benign and malignant ovarian
neoplasm groups, respectively. As shown in Fig. 2A, there was a strong positive
correlation between FIL and FIRI, HOMA-IR and FIRI, age and
menopausal age, and FIL and HOMA-IR among all ovarian neoplasm
cases. There was also a strong negative correlation between QUICKI
and FIRI, QUICKI and FIL, and QUICKI and HOMA-IR. Fig. 2B shows that among the ‘benign
group,’ there was a strong positive correlation between FIL and
FIRI, HOMA-IR and FIRI, and FIL and HOMA-IR. A strong negative
correlation was also discovered between QUICKI and FIRI, QUICKI and
FIL, and QUICKI and HOMA-IR. Fig.
2C expresses a significant positive correlation among the
malignant group between FIRI and FIL and between FIRI and HOMA-IR;
meanwhile, a strong negative correlation was identified between
QUICKI and FIRI, QUICKI and FIL, and QUICKI and HOMA-IR.
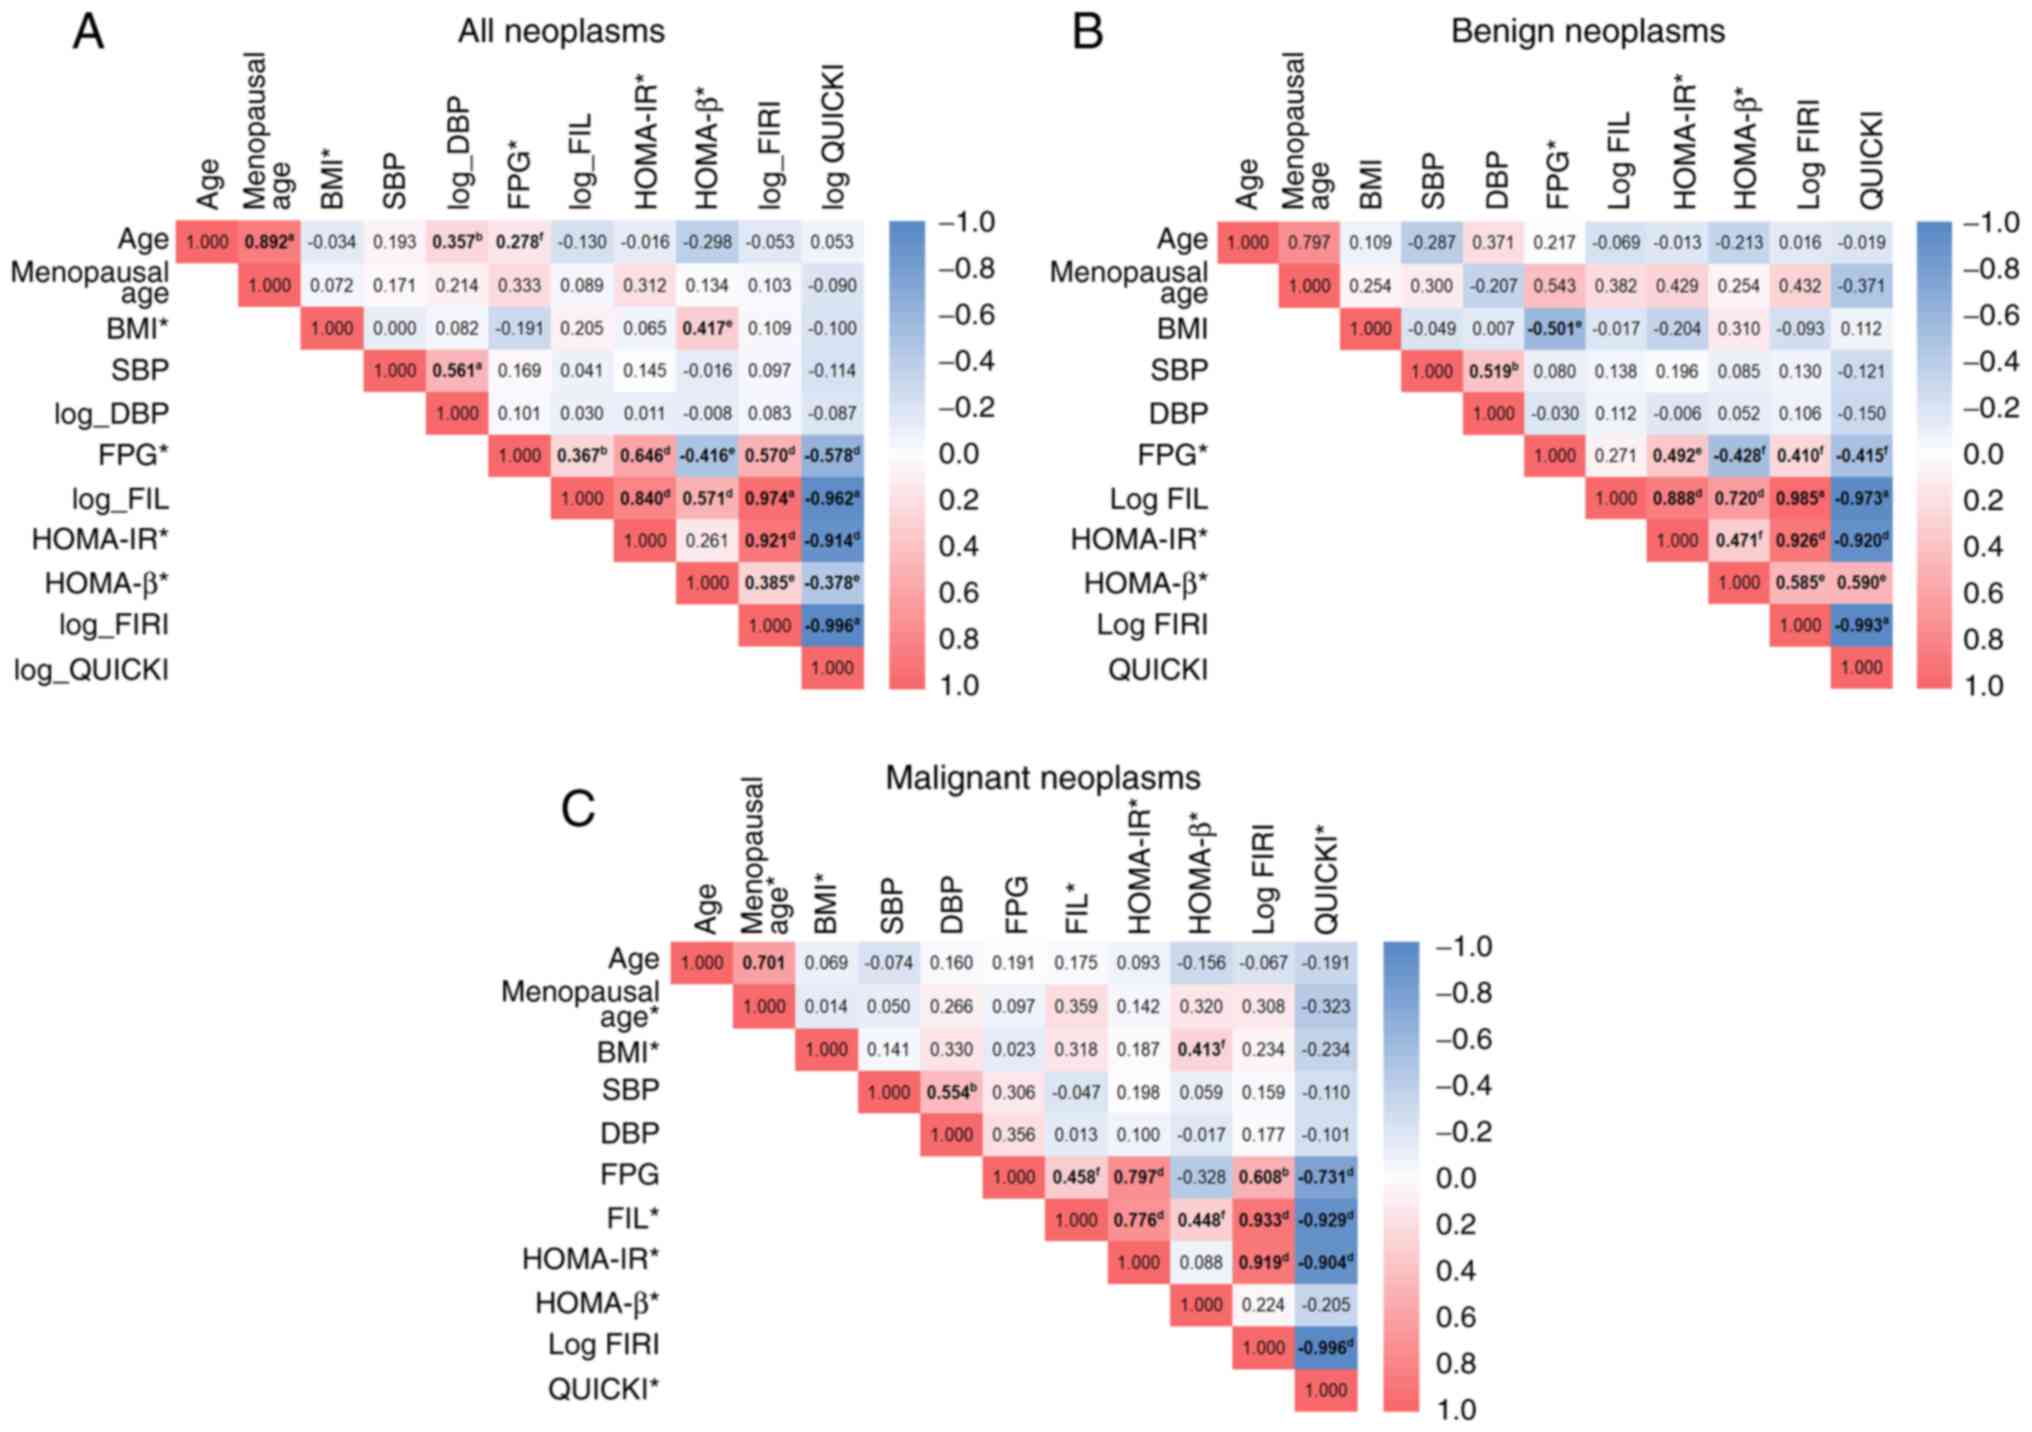 | Figure 2.Correlation plot between clinical
features and surrogate markers of insulin resistance among the
entire, benign, and malignant case groups. (A) Among all ovarian
neoplasm cases, the highest positive correlation was revealed
between FIL and FIRI (r=0.974), and the strongest negative
correlation was found between FIRI and QUICKI (ρ=−0.996). (B)
Considering benign cases, FIL possesses the most potent positive
correlation with FIRI (r=0.985), and FIRI was most negatively
correlated with QUICKI (r=−0.993). (C) In the sub-analysis for
malignant cases, FIL and FIRI had the most robust positive
correlation (ρ=0.933); meanwhile, FIRI and QUICKI possessed the
firmest correlation value with ρ=−0.996. aP<0.001
from Pearson's correlation test; bP<0.01 from
Pearson's correlation test; cP<0.05 from Pearson's
correlation test; dP<0.001 from Spearman's rank
correlation test; eP<0.01 from Spearman's rank
correlation test; fP<0.05 from Spearman's rank
correlation test. *Skewed data distribution in the normality test
using the Kolmogorov-Smirnov test for overall patients and the
Shapiro-Wilk test for respectively the benign and malignant case
groups, although adjustments for normalization have been made.
Thus, the usual correlation test was Spearman's statistical test;
other variables without asterisks were tested using the Pearson
correlation test. Logarithmic variables resulted from transformed
variables to allow them to be normalized in distribution. BMI, body
mass index; SBP, systolic blood pressure; DBP, diastolic blood
pressure; FPG, fasting plasma glucose; FIL, fasting insulin level;
HOMA-IR, homeostatic model assessment of insulin resistance;
HOMA-β, homeostasis model assessment of β-cell dysfunction; FIRI,
fasting insulin resistance index; QUICKI, quantitative insulin
sensitivity check index. |
Association between patients'
characteristics and ovarian neoplasms according to IR and BMI
Table V shows that
the difference between the two groups of IR status (non-IR vs. IR)
was observed among the benign neoplasm group in the median score of
FIL (P<0.001) and HOMA-β (P=0.031), as well as in the mean
scores of FPG (P=0.004), FIRI (P<0.001), and QUICKI
(P<0.001). Meanwhile, among the malignant neoplasms group, the
mean score of FPG (P=0.002) and the median score of FIL (P=0.001),
FIRI (P<0.001), and QUICKI (P<0.001) were significantly
different between the IR and non-IR groups. More detailed analysis
in Table SI (in categorical data)
revealed that among benign neoplasms cases, parity status
(P=0.039), FPG (P=0.041), FIL (P<0.001), FIRI (P<0.001), and
QUICKI (P=0.012) differed between the two groups of IR status.
Meanwhile, the parameters of FPG (P=0.036), FIL (P=0.015), and FIRI
(P=0.002) were shown to differ between the non-IR and IR groups
among malignant neoplasm cases.
| Table V.Differences in mean or median values
of clinical characteristics of patients and metabolic parameters
between non-insulin-resistant and insulin-resistant groups among
benign and malignant ovarian neoplasms. |
Table V.
Differences in mean or median values
of clinical characteristics of patients and metabolic parameters
between non-insulin-resistant and insulin-resistant groups among
benign and malignant ovarian neoplasms.
|
| Mean ± SD or median
(IQR) |
|---|
|
|
|
|---|
|
| Benign
neoplasms |
| Malignant
neoplasms |
|
|---|
|
|
|
|
|
|
|---|
| Variables | Non-IR (HOMA-IR
<1.208) | IR (HOMA-IR
≥1.208) | P-value | Non-IR (HOMA-IR
<1.208) | IR (HOMA-IR
≥1.208) | P-value |
|---|
| Age (years) | 39.18±10.64 | 37.70±13.22 | 0.753a | 46.11±7.88 | 50.71±10.19 | 0.239a |
| Menopausal age
(years) | 46.50
(43.00-50.75) | 52.00
(50.00-52.00) | 0.165b | 48.00±1.85 | 48.20±7.15 | 0.940a |
| SBP (mmHg) | 121.18±12.32 | 122.60±15.07 | 0.792a | 130.50±16.96 | 126.57±21.23 | 0.632a |
| DBP (mmHg) | 81.06±5.85 | 80.50±6.75 | 0.227a | 83.83±6.51 | 86.14±7.99 | 0.462a |
| BMI
(kg/m2) | 23.13±3.11 | 21.14±3.61 | 0.145a | 18.66
(17.89-20.88) | 18.61
(18.36-24.97) | 0.671b |
| FPG (mg/dl) | 82.06±6.05 | 92.00±10.59 | 0.004a | 85.50±15.55 | 109.71±15.77 | 0.002a |
| FIL (µIU/ml) | 3.60
(2.80-4.10) | 7.95
(6.87-13.30) |
<0.001b | 3.15
(2.45-3.87) | 5.60
(4.90-7.90) | 0.001b |
| HOMA-β (%) | 65.25
(49.20-101.83) | 86.72
(64.84-249.04) | 0.031b | 47.53
(28.02-81.48) | 65.03
(28.00-91.74) | 0.672b |
| FIRI | 0.66±0.19 | 1.91±0.57 |
<0.001a | 0.62
(0.43-0.82) | 1.37
(1.17-1.65) |
<0.001b |
| QUICKI | 0.41±0.20 | 0.34±0.14 |
<0.001a | 0.41
(0.39-0.44) | 0.36
(0.35-0.37) |
<0.001b |
The difference between ‘higher-class’ and
‘lower-class’ BMI status among benign and malignant patients was
examined in Table VI. Among
patients with benign neoplasms, it was discovered that the median
score of FPG (P=0.017) and HOMA-β (P=0.023) was significantly
different between the two groups of BMI status (overweight + obese
vs. normal + underweight). Meanwhile, among patients with malignant
diagnoses, there was no significant variation in mean/median score
parameters between the two groups of BMI status. Further
categorical data analysis, as the details attached in Table SII, revealed a significant
difference in DBP (P=0.009), hypertension status (P=0.039), and
HOMA-β (P=0.041) variables between the two BMI statuses within the
malignant neoplasms group.
| Table VI.Differences in mean or median values
of patient's clinical characteristics and metabolic parameters
between the two classes of body mass index among benign and
malignant ovarian neoplasms. |
Table VI.
Differences in mean or median values
of patient's clinical characteristics and metabolic parameters
between the two classes of body mass index among benign and
malignant ovarian neoplasms.
|
| Mean ± SD or median
(IQR) |
|---|
|
|
|
|---|
|
| Benign ovarian
neoplasms |
| Malignant ovarian
neoplasms |
|
|---|
|
|
|
|
|
|
|---|
| Variables | Normal +
underweight | Obese +
overweight | P-value | Normal +
underweight | Obese +
overweight | P-value |
|---|
| Age (years) | 39.29±12.60 | 37.92±10.50 | 0.764a | 47.25±8.58 | 48.00±9.82 | 0.866a |
| Menopausal age
(years) | 49.00
(43.00-53.50) | 48.50
(47.00-48.50) |
>0.999b | 49.00
(46.00-50.00) | 49.50
(49.00-49.50) | 0.611b |
| SBP (mmHg) | 123.00±14.02 | 120.31±12.53 | 0.604a | 126.45±16.52 | 141.20±20.12 | 0.100a |
| DBP (mmHg) | 80.50±7.23 | 81.23±4.80 | 0.762a | 83.30±6.97 | 89.20±4.15 | 0.085a |
| FPG (mg/dl) | 86.50
(81.75-96.25) | 80.00
(76.50-83.50) | 0.017b | 91.65±20.24 | 94.80±13.53 | 0.746a |
| FIL (µIU/ml) | 4.80
(2.76-7.12) | 4.00
(3.45-8.45) | 0.560b | 3.65±1.68 | 7.40±5.29 | 0.190c |
| HOMA-β (%) | 62.23
(49.80-85.91) | 102.86
(70.52-161.84) | 0.023b | 43.16
(27.77-73.44) | 77.14
(57.40-110.45) | 0.067b |
| FIRI | 0.96
(0.51-1.58) | 0.74
(0.61-1.77) | 0.865b | 0.69
(0.46-1.13) | 0.98
(0.79-2.87) | 0.089b |
| QUICKI | 0.39±0.04 | 0.38±0.04 | 0.895a | 0.40
(0.37-0.43) | 0.38
(0.33-0.39) | 0.097b |
Association between characteristics of
patients and histopathological types of ovarian cancer
There was no significant variation in patient
characteristics regarding clinical, metabolic, and IR indicators
among histopathological types of malignant ovarian neoplasm, as
shown in Table VII and Table SIII. However, patients with serous
carcinoma seemed to have the oldest age, the oldest age at which
menopause occurs, the greatest BMI score, the highest FIL, the
highest HOMA-IR, and the greatest FIRI. Meanwhile, the mixed
histopathological type group had the highest SBP, DBP, and FPG
levels and the lowest BMI and HOMA-β score. These two subtypes also
shared the lowest QUICKI results.
| Table VII.Differences in mean or median values
of patient's clinical characteristics and metabolic parameters
among the different histopathological types of malignant ovarian
neoplasm. |
Table VII.
Differences in mean or median values
of patient's clinical characteristics and metabolic parameters
among the different histopathological types of malignant ovarian
neoplasm.
|
| Median (IQR) |
|
|---|
|
|
|
|
|---|
| Variables | Mucinous
carcinoma | Clear cell
carcinoma | Adenocarcinoma | Endometrioid
carcinomab | Serous
carcinomab | Mixed
typeb |
P-valuec |
|---|
| Age (years) | 45.50
(40.00-53.25) | 46.00
(40.25-50.50) | 38.00
(31.50-52.00) | 52.50 | 62.00 | 56.00 | 0.085 |
| Menopausal age
(years) | 48.50
(45.75-49.75) | 46.50a | 43.00a | 49.50 | 52.50 | 50.00 | 0.300 |
| SBP (mmHg) | 138.00
(116.75-152.75) | 121.00
(106.00-140.25) | 116.50
(115.00-130.75) | 130.00 | 130.00 | 140.00 | 0.553 |
| DBP (mmHg) | 82.50
(77.25-90.75) | 85.50
(80.00-90.50) | 80.50
(77.00-87.00) | 85.00 | 85.50 | 90.00 | 0.680 |
| BMI
(kg/m2) | 20.04
(17.89-24.84) | 18.66
(17.98-25.44) | 18.49
(17.24-18.93) | 19.84 | 21.66 | 18.36 | 0.904 |
| FPG (mg/dl) | 87.50
(80.50-102.50) | 87.50
(70.25-115.25) | 83.50
(72.25-98.50) | 92.50 | 96.00 | 126.00 | 0.651 |
| FIL (µIU/ml) | 3.50
(2.85-4.55) | 3.00
(1.83-6.82) | 5.30
(3.20-7.40) | 3.10 | 6.55 | 4.90 | 0.245 |
| HOMA-IR | 0.73
(0.58-1.14) | 0.73
(0.26-1.79) | 0.82
(0.15-1.66) | 0.70 | 1.56 | 1.52 | 0.433 |
| HOMA-β (%) | 49.30
(36.53-78.92) | 26.13
(−20.15-87.48) | 94.47
(57.23-201.30) | 38.73 | 71.08 | 28.00 | 0.260 |
| FIRI | 0.66
(0.52-1.02) | 0.66
(0.23-1.61) | 0.99
(0.56-1.50) | 0.63 | 1.40 | 1.37 | 0.293 |
| QUICKI | 0.40
(0.38-0.42) | 0.40
(0.37-0.52) | 0.37
(0.35-0.42) | 0.41 | 0.36 | 0.36 | 0.308 |
Discussion
Limited evidence is available on the association of
IR with ovarian neoplasm (16,24,49),
particularly among Southeast Asians. Thus the present study
investigated whether there is a difference in IR between benign and
malignant ovarian neoplasm since IR plays a vital role in FIL
homeostasis related to cancer.
Characteristics of patients with
benign and malignant ovarian neoplasms
Not surprisingly, due to the massive urbanization
and adoption of a sedentary lifestyle associated with Western
society in Indonesia, the patients in the present study
predominantly came from urban areas with high education levels.
This lifestyle may lead to a rising incidence of obesity-related
comorbidities, including ovarian neoplasms, as observed in urban
areas of China compared with rural areas (2,72,73).
Nevertheless, living in an urban area with a high education does
not guarantee that patients will be diagnosed early since cases in
the present study were predominantly in advanced-stage diseases
(80%). Indeed, ~75% of cases of ovarian cancer are diagnosed at a
late stage due to the non-specific nature of symptoms and the
absence of practical screening tests (49).
The present study revealed that most of the patients
were old (>40 years), similar to a study conducted in India
(49), with young women mostly
having benign ovarian neoplasm (Table
I). Meanwhile, older women were more commonly involved in
malignant cases. Different ages were also found to exhibit
different histological subtypes; serous subtypes were more common
in older patients and adenocarcinoma in younger patients.
Generally, a younger age pattern was found among all histological
subtypes compared with a study by Otokozawa et al (25). The present study found no
significant difference in other clinical risk factors of ovarian
cancer, such as menopausal status, parity, and contraceptive use,
between malignant and benign neoplasm patients, similar to a prior
study in India (49).
There were no differences in the
clinicopathological characteristics of patients with ovarian
neoplasm according to IR status, BMI status, cancer stage, and
histological subtypes among the benign and malignant case groups.
However, the present study found a higher proportion of patients
with high SBP (grade I and II) in malignant compared with benign
neoplasms (40% vs. 7.4%; P<0.05). Hypertension is an age-related
disease, and those with malignant ovarian neoplasm are more
commonly elderly. Hypertension may occur in these patients due to
psychological states or pain, involving a maladaptive nociceptive
system (74). IR, which is
associated with activation of the renin-angiotensin-aldosterone
system and sympathetic nervous system activities, could also
contribute to the patients' high blood pressure in this study
(75).
The most intriguing finding of the present study
was that those with benign ovarian neoplasms were more likely to be
overweight or obese compared with those with malignant neoplasms.
In this study, the predominance of patients with a lower BMI status
in malignant neoplasms was probably related to protein-energy
wasting caused by chronic leptin dysregulation due to persistent
systemic inflammation (76). This
process leads to reduced appetite and intake, weight loss,
malnutrition, and possibly cachexia (77). The results were comparable to a
study in South Korea that found that underweight and normal BMI
prevalence in advanced-stage ovarian cancer was 44% (vs. 3.3%) and
36% (vs. 45%), respectively (78).
Wright et al (79) also
confirmed that women having ‘normal’ BMI categories (35.2%) are
more likely to suffer malignant ovarian neoplasm compared with
overweight (23.9%) or obese (25.8%) women. Nevertheless, according
to a study in the US, BMI demonstrated a poor positive association
with ovarian cancer (OR 1.14, 95% CI: 0.86-1.51) (80).
Measuring IR in benign and malignant
ovarian neoplasms
In Indonesia, there is no established investigation
on surrogate markers for IR in ovarian neoplasms, and there is no
universally accepted definition of IR based on these various
markers. The present study enrolled non-diabetic women with benign
and malignant neoplasms to measure their IR status using numerous
surrogate markers proposed in the literature (56). Accordingly, the prevalence of IR in
the Indonesian patients in the present study ranged from 19.2-86.5%
in overall cases depending on different markers used, 25.9-81.5% in
the benign case group, and 12–92% in the malignant case group,
varying based on the diagnostic markers and selected cut-offs used.
These numbers were comparable with the prevalence of IR in benign
cases (28.7%) and malignant cases of breast neoplasm (64.0%) in
Turkey (15), as well as the
prevalence of IR in endometrial carcinoma (80%) in China (22). IR prevalence is attributed to
different populations, inclusion criteria, markers, and cut-offs to
define IR. In the investigation of IR, the result revealed no
difference in prevalence statistically between benign and malignant
ovarian neoplasms. This was in agreement with Serin et al
(24), who reported that the IR
index by HOMA is not a valid indicator for ovarian malignancy. A
study by Lukanova et al (26) also reported no significant
association of IR-related circulating blood marker [i.e., insulin
growth factors binding proteins-3 (IGFBP-3)] with ovarian cancer
risk. Hernandez et al (81)
also reported no differences in IR markers, including FIL, in women
with breast cancer (BC), while Kundaktepe et al (82) showed no differences in FPG and
HOMA-IR between BC cases and healthy controls.
In contrast with the findings of the present study,
Sun et al (16) found that
the prevalence of post-menopausal malignant neoplasm of the ovary
was higher in patients with IR (0.17 vs. 0.09%; P<0.05) with OR
of 2.17 (95% CI: 1.22-3.89; P<0.05) than those who were insulin
sensitive (16). Research in India
discovered that a high level of FIL in ovarian neoplasm is
associated with a greater risk for cancer development with an OR of
2.7 (95% CI: 1.00-6.67; P<0.05) (49). Otokozawa et al (25) also documented an increased risk of
malignant ovarian neoplasm in the high tertile of FIL compared with
the low tertile (P trend <0.001).
The lack of significance between the benign and
malignant groups in the present study's findings may be due to the
different proportions of subject BMIs, with higher rates of obese
and overweight patients in the benign group. Meanwhile, the
malignant group's BMI was more typically normal or underweight.
Variations in study characteristics might be another cause for
these discrepancies. Several factors influence serum IGF-I
concentrations in individuals with IR, including age, nutritional
intake, and underlying disease severity (83). A study discovered a tangible link
between circulating IGF-I levels and the risk of getting ovarian
cancer before age 55 (26);
meanwhile, most of our patients had a younger age with a mean age
of 42.9 years. The most recent studies studied IR and ovarian
neoplasm in individuals who were primarily menopausal (16,24,49),
which was not the case in the present study. Menopause, which
involves hormonal changes, might affect IR by contributing to
increased visceral adiposity, which is linked to IR in
post-menopausal women (17). This
hypothesis might answer why the present study could not get
significant differences between the benign and malignant case
groups, mainly because of the generally younger age of patients
involved in this study and fewer patients in our study group having
menopausal status. Additionally, the prevalence of IR is also
closely related to obesity (84);
by contrast, the present study had fewer obese and overweight
participants, and in malignant cases, the subjects mainly had lower
BMI; thus, the IR difference will also probably be statistically
insignificant between the two groups.
Recent research into ovarian cancer has revealed
that different histopathological types may have different risk
factors, unique carcinogenesis, and distinct developmental pathways
(85,86). Accordingly, the present study
conducted a comparative histopathological analysis of malignant
ovarian neoplasms related to clinical, metabolic, and IR
indicators. The results, however, revealed no significant variation
for these comparisons. Nonetheless, based on FIL, HOMA-IR, and FIRI
markers, it was discovered that IR tended to be more prevalent in
serous carcinoma groups. There has been a limited exploration into
the various histopathological types of ovarian cancer and IR. The
present study, however, corroborated previous findings in a
case-control study, which reported that the proportion of MetS is
more prominent in the serous carcinoma group compared with the
other histopathological groups (69.44% vs. 30.56%, P=0.411)
(87). The highest median BMI
score in the ovarian cancer patients in the present study was also
found in the serous carcinoma group. This result supported evidence
from a previous Mendelian randomization study, which indicated that
genetically predicted increasing BMI (per 5 kg/m2) was
linked with an increased risk of low-grade serous ovarian cancers
(87). Notably, a higher
triacylglycerol level is associated with a greater risk of serous
ovarian cancers (88). However,
the sample size of each histopathological type of ovarian cancer in
this provided data was small, making it challenging to draw
convincing conclusions concerning these qualities. More research,
therefore, is demanded to validate these findings.
Study on surrogate markers of IR
between benign and malignant ovarian neoplasms
The measurement of IR should be seen as heralding
the possibility of future changes in the understanding of ovarian
neoplasm development. The HEC is a standard and direct approach for
estimating IR currently. However, because of the time and cost
needed (89), its application in
clinical practice is restricted. As a result, there is a need for
accessible and approachable tests to evaluate insulin
sensitivity/resistance (56).
Several studies have focused on more practical ways of assessing IR
using calculated markers (52,61,90).
As the main component of IR markers, FPG is crucial
in determining the probability of reactive glucose and type 2
diabetes mellitus (T2DM) development. In the current investigation,
the variations in IR markers and FPG parameters between the benign
and malignant case groups were not statistically significant.
However, there was a tendency for a slightly greater proportion of
women with de novo high FPG in malignant cases rather than
in benign cases. This insignificant difference might be related to
the lower BMI status and metabolic parameters of the patients in
the present study compared with those in other studies. Chronic
hyperglycemia in patients with cancer may develop due to IR, which
reduces glucose uptake in the muscle tissue and glucose storage in
the liver, leading to elevated blood glucose levels (15).
Measuring the FIL and FPG is the most convenient
and accurate method for determining IR in the normoglycemic
population (91,92). The concentration of FIL was
strongly correlated with the estimated insulin action (r=0.61;
P<0.001) (93). However, it did
not address the inappropriately low insulin secretion in the face
of hyperglycemia, as found in diabetic or glucose-intolerant
patients (56). Although a study
with a cut-off of ≥7 µIU/ml indicated that the sensitivity of FIL
was reasonably high (92.19%) with poor specificity (59.04%) for
excluding IR (51), the present
study discovered that FIL with the same cut-off could not
distinguish the IR status difference in our case groups.
The HOMA model has proved to be a robust clinical
and epidemiological tool for assessing IR (HOMA-IR) and β-cell
function (HOMA-β). HOMA-IR correlates well with the HEC tests
(94), with a sensitivity of 86%,
specificity of 100%, and accuracy of 88% (66). No difference was found between
benign and malignant cases using the Indonesian cut-off (63). HOMA-β is another computed variable
demonstrating basal insulin secretion of pancreatic β-cells
(95), indicating either normal,
reduced, or excessive function. Insulin levels depend on the
pancreatic β-cell effect on glucose concentrations. Thus, the
diminished response of β-cell to secrete insulin with glucose
stimulation will echo the impaired function of the β-cells of the
subjects (62,96,97).
Similarly, IR is reflected in the diminished
suppressive effect of insulin on hepatic glucose production
(56). The present study found a
statistically significant lower median score of HOMA-β in the
malignant neoplasm group compared with the benign neoplasm group
(49.33 vs. 75.79; P=0.011), and both of their median scores were
classified as β-cell dysfunction (Table II). In the early phases of IR
development, pancreatic β-cells release excessive insulin,
resulting in hyperinsulinemia. Blood glucose levels will rise as
β-cells become exhausted, depleted, and dysfunctional, eventually
developing T2DM (98). This
research has therapeutic implications, indicating that combining
anti-tumor and anti-hyperglycemic medications may result in better
tumor reduction outcomes (99).
The present study observed the different mean scores of HOMA-β
between the IR and non-IR groups and between two classes of BMI
classes among benign neoplasm cases; meanwhile, there was no
statistical difference among malignant cases. It was probably due
to the lower prevalence of obese and overweight participants in the
malignant group, thus making the marker measurement results less
reliable (64).
Another derived IR marker is FIRI, with a
sensitivity of 86%, specificity of 100%, and accuracy of 88%
(66). Among all patients with
ovarian neoplasms, the present study revealed that the median score
of FIRI was 0.76 (IQR: 0.54-1.35) and was not significantly
different between the benign and malignant groups. FIRI is the most
robust positively correlated parameter with FIL in the overall
subjects, benign, and malignant case groups. It can indicate a
cluster of pathologies, including hypercholesterolemia, T2DM,
hypertension, and cardiovascular disease, indicating that they
share a common etiology in IR (100). FIRI and HOMA reflect hepatic
insulin sensitivity (90).
The last marker, QUICKI, has been found to have
greater accuracy, stronger correlation (r=0.78), and improved
positive predictive power to HEC compared with HOMA-IR (r=0.6)
(56,61,101) in estimating insulin sensitivity
(61,102). This marker has a sensitivity of
84%, specificity of 100%, and accuracy of 86% (66). The present study identified 86.5%
of IR cases using this marker, similar to a prior study with a
percentage of 84.4% (66). The
median score of QUICKI in the present study was 0.39 (IQR:
0.36-0.42), with no significant difference between the two case
groups, presumably because this index is lower in non-diabetic
subjects than in patients with MetS, T2DM, and obesity (56). QUICKI is simply the logarithm of
HOMA-IR, which explains the near-perfect correlation with HOMA, as
seen in Fig. 2. Given the
similarities between QUICKI and HOMA, these two approaches compare
well (56) and have a strong
correlation with FIL (P<0.01) (103). Nevertheless, according to the
literature, HOMA-IR and QUICKI are limited due to their inability
to provide information on the activity of insulin receptors in
assessing IR (104).
Correlation between clinical features
and surrogate markers
The correlation between markers and between markers
and clinical variables related to insulin sensitivity (i.e.,
QUICKI) and IR (FIL, HOMA-IR, HOMA-β, FIRI) as reported by prior
studies (66,104) are presented in Fig. 2. The strongest positive
correlations were observed between FIL and FIRI among all neoplasm
cases (r=0.974), benign (r=0.985) and malignant cases (ρ=0.933).
FIL was correlated with HOMA-IR and HOMA-β in all three groups at
decreasing strengths, respectively. Another study also found a
positive correlation between FIL and HOMA-IR (r=0.93) and between
FIL and FIRI (r=0.93) (66).
Rutter et al (105) also
report a correlation between FIL and HOMA-IR. Focusing on their
link with clinical data, the present study found that HOMA-β was
moderately correlated with BMI in the overall case group
(ρ=0.417).
Similarly, the strongest significant inversely
correlations were found between QUICKI and FIRI among the overall
(r=−0.996), benign (r=−0.993), and malignant (ρ=−0.996) case
groups. At a lesser strength, QUICKI was inversely correlated with
FIL, HOMA-IR, FPG, and HOMA-β among the overall case group, with
FIL, HOMA-IR, HOMA-β, and FPG among the benign group and with FIL,
HOMA-IR, and FPG among the malignant group. A similar result
between QUICKI and FIL (r=−0.92) was also found in a previous study
(66). Evaluating their
correlation with clinical data, the current investigation
discovered an inverse correlation between HOMA-β and FPG among
overall cases and the benign case group, as well as between QUICKI
and FPG in all three groups. These results were not entirely
different from findings in a study on melanoma, which highlights
the importance of HOMA-IR and QUICKI, which correlate between each
marker and clinical data (104).
Similarly, Conwell et al (106) reported that HOMA-IR, QUICKI, and
FIL strongly correlate with IR. Overall, these findings confirm the
reliability of the surrogate marker tests to determine IR status
and their correlation with essential clinical data, as well as
their interchangeability in assessing IR.
Compared to QUICKI and HOMA measurements, the FIL
test exhibited excellent levels of sensitivity and specificity
(107). In a previous study,
Gates et al (100)
discovered that FIRI substantially correlated with MetS-related
characteristics. Meanwhile, Rudvik and Månsson (108) propose HOMA-IR, QUICKI, and FIRI
as the best approach for estimating IR in clinical practice,
attributed to their high correlation with HEC.
The mechanism between IR and malignant ovarian
neoplasm is explained by the stimulation of IGF-1, a peptide
hormone generated by excessive insulin. Anti-apoptotic and
mitogenic properties of IGF-1 will promote tumor formation in
ovarian epithelial cells (26,77,109). Karasik et al (110) confirm that IGF-1 concentrations
are higher in cystic fluid from malignant ovarian neoplasms than in
cystic fluid from benign ovarian neoplasms. IGF-1 is also released
by hepatocytes and adipocytes, which explains why this peptide is
linked to obesity (111,112). High insulin levels can promote
peripheral estrogen transformation by affecting the expression of
adipose tissue aromatase P450c17 in the ovarian glands (22,113). Together with insulin, estrogen
will trigger the proliferation of the stroma, granulose cells, and
theca cells (114,115).
Ovarian cancer is metabolically active and boosts
its capacity to uptake larger volumes of glucose by upregulating
the expression of glucose transporters (116–118). Chronic hyperglycemia creates DNA
damage, cellular dysfunction, and damage to the ovarian epithelium
by exposure to produced oxidative stress (i.e., reactive oxygen
species) and the effects of glycation (119,120). In hyperglycemic environments, the
interaction of advanced glycation end products and their receptors
has been demonstrated to enhance tumor cell proliferation or
invasiveness (121) by promoting
systemic inflammation. High concentrations of cytokines (IL-1,
TNF-α, IL-6, IL-8, and TGF-β) and prostaglandin, which promote
mutagenesis and impede cellular recognition and destruction of
tumors, are hypothesized to be connected with cancer development
mechanistically (8,122). Higher glucose levels also
contribute to increased angiogenesis in tumors by upregulating the
expression of pro-angiogenic factors (e.g., VEGF) (123).
The critical finding of this study was that by
applying multiple simple and specific cut-off surrogate markers, we
could identify IR in more than two-thirds of this Indonesian case
group with ovarian neoplasms. Considering the role of insulin in
ovarian carcinogenesis, the results suggested that individuals with
benign ovarian neoplasms and a higher BMI status, particularly
those with metabolic comorbidities, should be cautiously
investigated for IR. A greater BMI should be a concern since it may
alter circulating hormone levels and growth factors, leading to
enhanced carcinogenesis and the possibility of malignant
transformation (124).
Strengths and limitations
The present study was the first in Indonesia, to
the best of the authors' knowledge, to report clinicopathological
factors associated with IR in newly diagnosed Asian patients with
ovarian neoplasm. It will be helpful for further scientific
development and policy-makers due to a paucity of evidence in this
area. Patients with T2DM and chronic inflammatory illnesses were
also excluded from the study to avoid bias and false-positive high
insulin levels.
However, although the outcomes of the present study
are clinically worthwhile, several drawbacks might arise. First,
this research was performed in a single center. Second, this
cross-sectional study also does not prove causality; thus, it is
challenging from a healthy population standpoint to infer if the
diseases begin from IR to ovarian neoplasm or vice versa (8). The third limitation is that the
sample size was relatively small; thus, type II errors may have
occurred in the study. Nevertheless, earlier research on this issue
also used a small sample size with similar settings (24,25,49,59)
and the sample size of the present study was more extensive than
those. Fourth, the present study did not recruit a healthy control
group, making it impossible to assess and compare the development
of the neoplasm case group to a normal state. The present study
also did not use the standard technique to confirm IR (i.e., HEC)
for this study (125); however,
WHO has suggested surrogate markers to be diagnostic tools for IR
in epidemiological research (126). Sixth, the cut-offs adopted in
this study were not entirely based on the Indonesian women
population with ovarian neoplasm because no initial investigation
had established those cut-offs for Indonesians. Finally, the
pre-menopausal and post-menopausal groups for each case group
(benign and malignant) were not studied because their proportions
were unequal.
In conclusion, there was no significant difference
in IR between benign and malignant ovarian neoplasms among
Indonesian non-diabetic women, as measured by numerous surrogate
markers of IR. However, benign ovarian neoplasms tended to have a
slightly higher proportion of IR. A tendency for a slightly higher
proportion of IR was also found in advanced-stage cancer and serous
carcinoma. QUICKI is likely superior in showing the highest
prevalence of IR among the three groups. The present study also
discovered considerable β-cell dysfunction in both case groups,
with a more severe occurrence in malignant neoplasms, indicating
early MetS and possible correlations to IR. Since insulin affects
multiple pathways signaling cancer development, monitoring FIL,
FPG, and other IR surrogates might be practical and integrative
approaches to therapeutic cancer targets. To better understand the
effect of IR on ovarian carcinogenesis and progression, a
multicenter and population-based study with long-term follow-up on
women with ovarian neoplasms should be conducted. It is also
necessary to adjust BMI, age, menopausal status, comorbidities, and
histopathological diagnosis to precisely stratify susceptibility to
IR. Future research should measure other IR surrogate markers,
including the glucose/insulin ratio, insulinogenic index, Matsuda
index, Gutt index, Stumvoll index, Avignon index, oral glucose
insulin sensitivity index, sex hormones, leptin and other
inflammatory markers (56).
Investigations should also focus on more specific markers like
IGF-I and IGFBP-3, which might be more accurate in distinguishing
between benign and malignant ovarian neoplasms.
Supplementary Material
Supporting Data
Acknowledgements
Not applicable.
Funding
Funding: No funding was received.
Availability of data and materials
The datasets used and/or analyzed during the
current study are available from the corresponding author on
reasonable request.
Authors' contributions
HW was the principal investigator of this study,
acquired funding, and controlled the decision to publish. HW, MH
and ISF confirm the authenticity of all the raw data and accepted
full responsibility for the overall content of the work. HW, MH,
and ISF conceptualized the study, performed the investigation,
designed the methodology, and provided the resources. HW and MH
contributed to the analysis and drafted the manuscript. MH and ISF
collected the data and performed the project administration. MH was
entirely responsible for software utilization, data cleaning, and
visualization of research findings. HW, FK, KHN, TDA, TWU and ADP
performed the cancer staging, supervised the study and validated
all data analyses. All authors critically revised the manuscript
for important intellectual content. All authors have read and
approved the final manuscript.
Ethics approval and consent to
participate
The study was conducted according to the guidelines
of the Declaration of Helsinki and approved by the Institutional
Review Board of the Faculty of Medicine, Universitas Indonesia,
with the ethical clearance number
KET-1091/UN2.F1/ETIK/PPM.00.02/2019 and protocol number 19-07-0831.
Written informed consent has been obtained from all patients
involved in the study.
Patient consent for publication
Not applicable.
Competing interests
The authors declare that they have no competing
interests.
Glossary
Abbreviations
Abbreviations:
|
BC
|
breast cancer
|
|
BMI
|
body mass index
|
|
BP
|
blood pressure
|
|
DBP
|
diastolic blood pressure
|
|
FIL
|
fasting insulin level
|
|
FIRI
|
fasting insulin resistance index
|
|
FPG
|
fasting plasma glucose
|
|
HEC
|
hyperinsulinaemic-euglycaemic
clamp
|
|
HOMA-IR
|
homeostatic model assessment of
insulin resistance
|
|
HOMA-β
|
homeostasis model assessment of
β-cell dysfunction
|
|
IGF
|
insulin-like growth factor
|
|
IGFBP
|
insulin growth factors binding
proteins
|
|
IOTA
|
International Ovarian Tumor
Analysis
|
|
IR
|
insulin resistance
|
|
QUICKI
|
quantitative insulin sensitivity
check index
|
|
RLU
|
relative light unit
|
|
SBP
|
systolic blood pressure
|
|
SBP
|
systolic blood pressure
|
|
SD
|
standard deviation
|
|
SHS
|
senior high school
|
|
T2DM
|
type 2 diabetes mellitus
|
|
US
|
ultrasound
|
|
WHO
|
World Health Organization
|
References
|
1
|
Sung H, Ferlay J, Siegel RL, Laversanne M,
Soerjomataram I, Jemal A and Bray F: Global Cancer Statistics 2020:
GLOBOCAN Estimates of Incidence and Mortality Worldwide for 36
Cancers in 185 Countries. CA Cancer J Clin. 71:209–249. 2021.
View Article : Google Scholar : PubMed/NCBI
|
|
2
|
Teng Z, Han R, Huang X, Zhou J, Yang J,
Luo P and Wu M: Increase of incidence and mortality of ovarian
cancer during 2003–2012 in Jiangsu Province, China. Front Public
Health. 4:1462016. View Article : Google Scholar : PubMed/NCBI
|
|
3
|
Winarto H, Welladatika A, Habiburrahman M,
Purwoto G, Kusuma F, Utami TW, Putra AD, Anggraeni T and Nuryanto
KH: Overall survival and related factors of advanced-stage
epithelial ovarian cancer patients underwent debulking surgery in
Jakarta, Indonesia: A single-center experience. Open Access Maced J
Med Sci. 10:265–280. 2022. View Article : Google Scholar
|
|
4
|
Torre LA, Trabert B, DeSantis CE, Miller
KD, Samimi G, Runowicz CD, Gaudet MM, Jemal A and Siegel RL:
Ovarian cancer statistics, 2018. CA Cancer J Clin. 68:284–296.
2018. View Article : Google Scholar : PubMed/NCBI
|
|
5
|
Aziz MF: Gynecological cancer in
Indonesia. J Gynecol Oncol. 20:8–10. 2009. View Article : Google Scholar
|
|
6
|
Devouassoux-Shisheboran M and Genestie C:
Pathobiology of ovarian carcinomas. Chin J Cancer. 34:50–55. 2015.
View Article : Google Scholar : PubMed/NCBI
|
|
7
|
Beauchamp MC, Yasmeen A, Knafo A and
Gotlieb WH: Targeting insulin and insulin-like growth factor
pathways in epithelial ovarian cancer. J Oncol. 2010:2570582010.
View Article : Google Scholar
|
|
8
|
Kellenberger LD, Bruin JE, Greenaway J,
Campbell NE, Moorehead RA, Holloway AC and Petrik J: The role of
dysregulated glucose metabolism in epithelial ovarian cancer. J
Oncol. 2010:5143102010. View Article : Google Scholar
|
|
9
|
Uzunlulu M, Telci Caklili O and Oguz A:
Association between metabolic syndrome and cancer. Ann Nutr Metab.
68:173–179. 2016. View Article : Google Scholar : PubMed/NCBI
|
|
10
|
Tseng YH, Ueki K, Kriauciunas KM and Kahn
CR: Differential roles of insulin receptor substrates in the
anti-apoptotic function of insulin-like growth factor-1 and
insulin. J Biol Chem. 277:31601–31611. 2002. View Article : Google Scholar : PubMed/NCBI
|
|
11
|
Djiogue S, Nwabo Kamdje AH, Vecchio L,
Kipanyula MJ, Farahna M, Aldebasi Y and Seke Etet PF: Insulin
resistance and cancer: The role of insulin and IGFs. Endocr Relat
Cancer. 20:R1–R17. 2013. View Article : Google Scholar : PubMed/NCBI
|
|
12
|
Atsumi T: Diabetes and risk of cancer.
Diabetol Int. 6:190–192. 2015. View Article : Google Scholar
|
|
13
|
Joung KH, Jeong JW and Ku BJ: The
association between type 2 diabetes mellitus and women cancer: The
epidemiological evidences and putative mechanisms. Biomed Res Int.
2015:9206182015. View Article : Google Scholar
|
|
14
|
Igwe EO, Azman A, Nordin A and Mohtarrudin
N: Association between HOMA-IR and Cancer in a Medical Centre in
Selangor, Malaysia. IJPHCS. 2:21–34. 2015.
|
|
15
|
Ekinci O, Eren T, Kurtoglu Yakici M,
Gapbarov A, Aydemir MA, Saglam ZA and Alimoglu O: Relationship
Between Metabolic Syndrome and Postmenopausal Breast Cancer. Cir
Esp (Engl Ed). 98:540–546. 2020.(In English, Spanish). View Article : Google Scholar : PubMed/NCBI
|
|
16
|
Sun W, Lu J, Wu S, Bi Y, Mu Y, Zhao J, Liu
C, Chen L, Shi L, Li Q, et al: Association of insulin resistance
with breast, ovarian, endometrial and cervical cancers in
non-diabetic women. Am J Cancer Res. 6:2334–2344. 2016.PubMed/NCBI
|
|
17
|
Nam S, Park S, Park HS, Kim S, Kim JY and
Kim SI: Association between insulin resistance and luminal B
subtype breast cancer in postmenopausal women. Medicine
(Baltimore). 95:e28252016. View Article : Google Scholar : PubMed/NCBI
|
|
18
|
Gennari A, Puntoni M, Nanni O, De Censi A,
Bruzzi P, Paleari L, Freschi A, Amaducci L, Bologna A, Gianni L and
Amadori D: Impact of insulin resistance (IR) on the prognosis of
metastatic breast cancer (MBC) patients treated with first-line
chemotherapy (CT). J Clin Oncol. 32 (Suppl 15):S5142014. View Article : Google Scholar
|
|
19
|
Doğan İ, Ürün Y and Onur H: Effects of
Adjuvant Chemotherapy on Insulin Resistance in Patients with Early
Breast Cancer. Cam and Sakura Med J. 2:8–13. 2022. View Article : Google Scholar
|
|
20
|
Alan O, Akin Telli T, Aktas B, Koca S,
Ökten IN, Hasanov R, Basoglu T, Arikan R, Demircan NC, Ercelep O,
et al: Is insulin resistance a predictor for complete response in
breast cancer patients who underwent neoadjuvant treatment? World J
Surg Oncol. 18:2422020. View Article : Google Scholar
|
|
21
|
Martín-Manzo MV, Lara C, Vargas-de-Leon C,
Carrero J, Queipo G, Fonseca-Sanchez M, Mejia-Dominguez NR,
Kershenobich D, Mummidi S, Zentella-Dehesa A and Hernandez J:
Interaction of Breast Cancer and Insulin Resistance on PD1 and TIM3
Expression in Peripheral Blood CD8 T Cells. Pathol Oncol Res.
25:1233–1243. 2019. View Article : Google Scholar
|
|
22
|
Lai Y and Sun C: Association of abnormal
glucose metabolism and insulin resistance in patients with atypical
and typical endometrial cancer. Oncol Lett. 15:2173–2178. 2018.
|
|
23
|
Momenimovahed Z, Tiznobaik A, Taheri S and
Salehiniya H: Ovarian cancer in the world: Epidemiology and risk
factors. Int J Womens Health. 11:287–299. 2019. View Article : Google Scholar : PubMed/NCBI
|
|
24
|
Serin IS, Tanriverdi F, Yilmaz MO, Ozcelik
B and Unluhizarci K: Serum insulin-like growth factor (IGF)-I, IGF
binding protein (IGFBP)-3, leptin concentrations and insulin
resistance in benign and malignant epithelial ovarian tumors in
postmenopausal women. Gynecol Endocrinol. 24:117–121. 2008.
View Article : Google Scholar
|
|
25
|
Otokozawa S, Tanaka R, Akasaka H, Ito E,
Asakura S, Ohnishi H, Saito S, Miura T, Saito T and Mori M:
Associations of serum isoflavone, adiponectin and insulin levels
with risk for epithelial ovarian cancer: Results of a case-control
study. Asian Pac J Cancer Prev. 16:4987–4991. 2015. View Article : Google Scholar : PubMed/NCBI
|
|
26
|
Lukanova A, Lundin E, Toniolo P, Micheli
A, Akhmedkhanov A, Rinaldi S, Muti P, Lenner P, Biessy C, Krogh V,
et al: Circulating levels of insulin-like growth factor-I and risk
of ovarian cancer. Int J Cancer. 101:549–554. 2002. View Article : Google Scholar : PubMed/NCBI
|
|
27
|
Dahlan MS: Sample Size in Medical and
Health Research. 5th edition. Epidemiologi Indonesia; Jakarta:
2019, (In Indonesian).
|
|
28
|
Sharma SK, Mudgal SK, Thakur K and Gaur R:
How to calculate sample size for observational and experiential
nursing research studies? Natl J Physiol Pharm Pharmacol. 10:1–8.
2020. View Article : Google Scholar
|
|
29
|
Timmerman D, Ameye L, Fischerova D,
Epstein E, Melis GB, Guerriero S, Van Holsbeke C, Savelli L,
Fruscio R, Lissoni AA, et al: Simple ultrasound rules to
distinguish between benign and malignant adnexal masses before
surgery: Prospective validation by IOTA group. BMJ. 341:c68392010.
View Article : Google Scholar : PubMed/NCBI
|
|
30
|
Abramowicz JS and Timmerman D: Ovarian
mass-differentiating benign from malignant: The value of the
International Ovarian Tumor Analysis ultrasound rules. Am J Obstet
Gynecol. 217:652–660. 2017. View Article : Google Scholar
|
|
31
|
Badan Pusat Statistik/BPS-Statistics
Indonesia, . Concept of Population, Age, Marital Status, Children
Ever Born, Children Still Alive, and Place of Birth in Indonesia.
Concept. 2021.https://www.bps.go.id/subject/12/kependudukan.htmlDecember
10–2021
|
|
32
|
Mulyana W: Rural-urban linkages: Indonesia
case study. Working Group: Development with Territorial Cohesion.
Territorial Cohesion for Development Program Rimisp. 1–36.
2014.
|
|
33
|
Badan Pusat Statistik/BPS-Statistics
Indonesia, . Regulation of the Head of the Central Statistics
Agency Number 120 of 2020: Classification of Urban and Rural Areas
in Java, Indonesia [In Indonesian]. Book Chapter Java. 2nd ed. BPS;
Jakarta: pp. 1–692. 2010
|
|
34
|
Badan Pusat Statistik/BPS-Statistics
Indonesia, . Regulation of the Head of the Central Statistics
Agency Number 120 of 2020: Classification of Urban and Rural Areas
in Sumatra, Indonesia [In Indonesian]. Book Chapter Sumatera. 2nd
ed. BPS; Jakarta: pp. 1–681. 2010
|
|
35
|
Klar M, Hasenburg A, Hasanov M, Hilpert F,
Meier W, Pfisterer J, Pujade-Lauraine E, Herrstedt J, Reuss A and
du Bois A: Prognostic factors in young ovarian cancer patients: An
analysis of four prospective phase III intergroup trials of the AGO
Study Group, GINECO and NSGO. Eur J Cancer. 66:114–124. 2016.
View Article : Google Scholar : PubMed/NCBI
|
|
36
|
Lalrinpuii E, Bhageerathy PS, Sebastian A,
Jeyaseelan L, Vinotha Thomas, Thomas A, Chandy R and Peedicayil A:
Ovarian Cancer in Young Women. Indian J Surg Oncol. 8:540–547.
2017. View Article : Google Scholar
|
|
37
|
Encinas G, Maistro S, Pasini FS, Katayama
ML, Brentani MM, Bock GH and Folgueira MA: Somatic mutations in
breast and serous ovarian cancer young patients: A systematic
review and meta-analysis. Rev Assoc Med Bras (1992). 61:474–483.
2015. View Article : Google Scholar : PubMed/NCBI
|
|
38
|
Bozas G, Dimopoulos MA, Kastritis E,
Efstathiou E, Koutsoukou V, Rodolakis A, Vlahos G, Voulgaris Z,
Papageorgiou T, Gika D, et al: Young age is associated with
favorable characteristics but is not an independent prognostic
factor in patients with epithelial ovarian cancer: A single
institution experience. Oncology. 70:265–272. 2006. View Article : Google Scholar : PubMed/NCBI
|
|
39
|
Winarto H, Habiburrahman M, Dorothea M,
Wijaya A, Nuryanto KH, Kusuma F, Utami TW and Anggraeni TD:
Knowledge, attitudes, and practices among Indonesian urban
communities regarding HPV infection, cervical cancer, and HPV
vaccination. PLoS One. 17:e02661392022. View Article : Google Scholar : PubMed/NCBI
|
|
40
|
4Berek JS, Renz M, Kehoe S, Kumar L and
Friedlander M: FIGO Cancer Report 2021: Cancer of the ovary,
fallopian tube, and peritoneum: 2021 update. Int J Gynaecol Obstet.
155:61–85. 2021. View Article : Google Scholar
|
|
41
|
World Health Organization and
International Agency for Research on Cancer, . World Health
Organization: WHO Classification of Tumours: Female Genital
Tumours. 5th edition. WHO; Geneva, Switzerland: pp. 31–163.
2021
|
|
42
|
Matz M, Coleman MP, Sant M, Chirlaque MD,
Visser O, Gore M and Allemani C; & the CONCORD Working Group, :
The histology of ovarian cancer: Worldwide distribution and
implications for international survival comparisons (CONCORD-2).
Gynecol Oncol. 144:405–413. 2017. View Article : Google Scholar
|
|
43
|
Unger T, Borghi C, Charchar F, Khan NA,
Poulter NR, Prabhakaran D, Ramirez A, Schlaich M, Stergiou GS,
Tomaszewski M, et al: 2020 International Society of Hypertension
Global Hypertension Practice Guidelines. Hypertension.
75:1334–1357. 2020. View Article : Google Scholar : PubMed/NCBI
|
|
44
|
National Health and Nutrition Examination
Survey and Center of Disease Control and Prevention, .
Anthropometry Procedures Manual CDC2. 1–65. 2007.
|
|
45
|
Lim JU, Lee JH, Kim JS, Hwang YI, Kim TH,
Lim SY, Yoo KH, Jung KS, Kim YK and Rhee CK: Comparison of World
Health Organization and Asia-Pacific body mass index
classifications in COPD patients. Int J Chron Obstruct Pulmon Dis.
12:2465–2475. 2017. View Article : Google Scholar : PubMed/NCBI
|
|
46
|
Cleveland Clinic, . Fasting Blood Sugar
Test. Diagnostics & Testing; 2021, https://my.clevelandclinic.org/health/diagnostics/21952-fasting-blood-sugarDecember
10–2021
|
|
47
|
Gayoso-Diz P, Otero-González A,
Rodriguez-Alvarez MX, Gude F, García F, De Francisco A and Quintela
AG: Insulin resistance (HOMA-IR) cut-off values and the metabolic
syndrome in a general adult population: Effect of gender and age:
EPIRCE cross-sectional study. BMC Endocr Disord. 13:472013.
View Article : Google Scholar : PubMed/NCBI
|
|
48
|
Farahani H, Mahmoudi T, Asadi A, Nobakht
H, Dabiri R and Hamta A: Insulin Resistance and Colorectal Cancer
Risk: The Role of Elevated Plasma Resistin Levels. J Gastrointest
Cancer. 51:478–483. 2020. View Article : Google Scholar : PubMed/NCBI
|
|
49
|
Gupta RK, Dholariya SJ, Kaushik S, Gupta
SK, Tripathi R and Jain SL: Hyperinsulinemia and
Hypoadiponectinemia are Associated with increased risk for
occurrence of ovarian cancer in non-diabetic women of North Indian
Population. Indian J Clin Biochem. 36:221–227. 2021. View Article : Google Scholar : PubMed/NCBI
|
|
50
|
American Diabetes Association (ADA), .
Diagnosis of Diabetes Mellitus. ADA; Arlington, VA: 2022
|
|
51
|
Lunger F, Wildt L and Seeber B: Accurate
screening for insulin resistance in PCOS women using fasting
insulin concentrations. Gynecol Endocrinol. 29:541–544. 2013.
View Article : Google Scholar
|
|
52
|
Matthews DR, Hosker JP, Rudenski AS,
Naylor BA, Treacher DF and Turner RC: Homeostasis model assessment:
Insulin resistance and beta-cell function from fasting plasma
glucose and insulin concentrations in man. Diabetologia.
28:412–419. 1985. View Article : Google Scholar
|
|
53
|
Onishi Y, Hayashi T, Sato KK, Ogihara T,
Kuzuya N, Anai M, Tsukuda K, Boyko EJ, Fujimoto WY and Kikuchi M:
Fasting tests of insulin secretion and sensitivity predict future
prediabetes in Japanese with normal glucose tolerance. J Diabetes
Investig. 1:191–195. 2010. View Article : Google Scholar : PubMed/NCBI
|
|
54
|
Yamauchi K, Sato Y, Nakasone Y and Aizawa
T: Comparison of HOMA-IR, HOMA-β% and disposition index between US
white men and Japanese men in Japan in the ERA JUMP study: Was the
calculation of disposition index legitimate? Diabetologia.
58:1679–1680. 2015. View Article : Google Scholar
|
|
55
|
Imano H, Kitamura A, Yamagishi K, Kiyama
M, Ohira T, Cui R, Umesawa M, Okada T and Iso H; CIRCS
Investigators, : Abstract P455: Insulin Resistance, Secretion and
Risk of Incident Coronary Heart Disease in Non-diabetic Japanese
Population: The Circulatory Risk in Communities Study. Circulation.
129:AP4552014. View Article : Google Scholar
|
|
56
|
Singh B and Saxena A: Surrogate markers of
insulin resistance: A review. World J Diabetes. 1:36–47. 2010.
View Article : Google Scholar : PubMed/NCBI
|
|
57
|
Duncan MH, Singh BM, Wise PH, Carter G and
Alaghband-Zadeh J: A simple measure of insulin resistance. Lancet.
346:120–121. 1995. View Article : Google Scholar
|
|
58
|
Tsarouhas K, Tsitsimpikou C, Haliassos A,
Georgoulias P, Koutsioras I, Kouretas D, Kogias J, Liosis I,
Rentoukas E and Kyriakides Z: Study of insulin resistance, TNF-α,
total antioxidant capacity and lipid profile in patients with
chronic heart failure under exercise. In Vivo. 25:1031–1037.
2011.PubMed/NCBI
|
|
59
|
Farkas GJ, Gordon PS, Trewick N, Gorgey
AS, Dolbow DR, Tiozzo E, Berg AS and Gater DR Jr: Comparison of
various indices in identifying insulin resistance and diabetes in
chronic spinal cord injury. J Clin Med. 10:55912021. View Article : Google Scholar : PubMed/NCBI
|
|
60
|
Gordon PS, Farkas GJ and Gater DR Jr:
Neurogenic Obesity-Induced Insulin Resistance and Type 2 Diabetes
Mellitus in Chronic Spinal Cord Injury. Top Spinal Cord Inj
Rehabil. 27:36–56. 2021. View Article : Google Scholar
|
|
61
|
Katz A, Nambi SS, Mather K, Baron AD,
Follmann DA, Sullivan G and Quon MJ: Quantitative insulin
sensitivity check index: A simple, accurate method for assessing
insulin sensitivity in humans. J Clin Endocrinol Metab.
85:2402–2410. 2000. View Article : Google Scholar : PubMed/NCBI
|
|
62
|
Matsuda M and DeFronzo RA: Insulin
sensitivity indices obtained from oral glucose tolerance testing:
Comparison with the euglycemic insulin clamp. Diabetes Care.
22:1462–1470. 1999. View Article : Google Scholar : PubMed/NCBI
|
|
63
|
Pratisthita Livy B, Purnamasari D, Rizka
A, Soewondo P, Yunir E and Tahapary DL: The Cut-off Values of
Homeostasis Model Assessment of Insulin Resistance (HOMA-IR) in
Indonesian Rural Population. Lancet Preprint. 6:7–20. 2020.
|
|
64
|
Rahman MN, Sukmawati IR, Puspitasari IM
and Fattah M: Serum free zinc as a predictor for excessive function
of pancreatic beta-cells in central-obese men. Indones Biomed J.
11:262–266. 2019. View Article : Google Scholar
|
|
65
|
AlZadjali MA, Godfrey V, Khan F, Choy A,
Doney AS, Wong AK, Petrie JR, Struthers AD and Lang CC: Insulin
resistance is highly prevalent and is associated with reduced
exercise tolerance in nondiabetic patients with heart failure. J Am
Coll Cardiol. 53:747–753. 2009. View Article : Google Scholar
|
|
66
|
Kaur N, Gitanjali, Garg R, Tapasvi C,
Chawla S and Kaur N: Correlation of Surrogate Markers of Insulin
Resistance with Fasting Insulin in Type 2 Diabetes Mellitus
Patients: A Study of Malwa Population in Punjab, India. J Lab
Physicians. 13:238–244. 2021. View Article : Google Scholar : PubMed/NCBI
|
|
67
|
Diebetes.co.uk, . Blood Sugar Converter.
Calculators and Tools. 2022.https://www.diabetes.co.uk/blood-sugar-converter.htmlApril
12–2022
|
|
68
|
Katalin C: Surrogate Measures of Insulin
Resistance in Middle-aged Non-diabetic Subjects. Acta Med
Marisiensis. 59:279–284. 2014. View Article : Google Scholar
|
|
69
|
Burzawa JK, Schmeler KM, Soliman PT, Meyer
LA, Bevers MW, Pustilnik TL, Anderson ML, Ramondetta LM,
Tortolero-Luna G, Urbauer DL, et al: Prospective evaluation of
insulin resistance among endometrial cancer patients. Am J Obstet
Gynecol. 204:355.e1–7. 2011. View Article : Google Scholar
|
|
70
|
von Elm E, Altman DG, Egger M, Pocock SJ,
Gøtzsche PC and Vandenbroucke JP: Strengthening the reporting of
observational studies in epidemiology (STROBE) statement:
guidelines for reporting observational studies. BMJ. 335:806
LP–808. 2007. View Article : Google Scholar
|
|
71
|
Statistic Tutor: Spearman's correlation,
2021. http://www.statstutor.ac.uk/resources/uploaded/spearmans.pdfDecember
10–2021
|
|
72
|
Beavis AL, Smith AJ and Fader AN:
Lifestyle changes and the risk of developing endometrial and
ovarian cancers: Opportunities for prevention and management. Int J
Womens Health. 8:151–167. 2016.PubMed/NCBI
|
|
73
|
Szpurek D, Moszynski R, Szubert S and
Sajdak S: Urban and rural differences in characteristics of ovarian
cancer patients. Ann Agric Environ Med. 20:390–394. 2013.PubMed/NCBI
|
|
74
|
Saccò M, Meschi M, Regolisti G, Detrenis
S, Bianchi L, Bertorelli M, Pioli S, Magnano A, Spagnoli F, Giuri
PG, et al: The relationship between blood pressure and pain. J Clin
Hypertens (Greenwich). 15:600–605. 2013. View Article : Google Scholar
|
|
75
|
El-Atat FA, Stas SN, McFarlane SI and
Sowers JR: The relationship between hyperinsulinemia, hypertension
and progressive renal disease. J Am Soc Nephrol. 15:2816–2827.
2004. View Article : Google Scholar
|
|
76
|
Pérez-Pérez A, Sánchez-Jiménez F,
Vilariño-García T and Sánchez-Margalet V: Role of Leptin in
Inflammation and Vice Versa. Int J Mol Sci. 21:2020. View Article : Google Scholar
|
|
77
|
Orgel E and Mittelman SD: The links
between insulin resistance, diabetes, and cancer. Curr Diab Rep.
13:213–222. 2013. View Article : Google Scholar : PubMed/NCBI
|
|
78
|
Kim SI, Kim HS, Kim TH, Suh DH, Kin K, No
JH, Chung HH, Kim YB and Song YS: Impact of underweight after
treatment on prognosis of advanced-stage ovarian cancer. J Immunol
Res. 2014.1–8. 2014. View Article : Google Scholar
|
|
79
|
Wright JD, Powell MA, Mutch DG, Rader JS,
Gibb RK, Gao F and Herzog TJ: Relationship of ovarian neoplasms and
body mass index. J Reprod Med. 50:595–602. 2005.PubMed/NCBI
|
|
80
|
Leitzmann MF, Koebnick C, Danforth KN, et
al: Body mass index and risk of ovarian cancer. Cancer.
115:812–822. 2009. View Article : Google Scholar : PubMed/NCBI
|
|
81
|
Hernandez AV, Guarnizo M, Miranda Y,
Pasupuleti V, Deshpande A, Paico S, Lenti H, Ganoza S, Montalvo L,
Thota P and Lazaro H: Association between insulin resistance and
breast carcinoma: A systematic review and meta-analysis. PLoS One.
9:e993172014. View Article : Google Scholar : PubMed/NCBI
|
|
82
|
Kundaktepe BP, Durmus S, Cengiz M,
Kundaktepe FO, Sozer V, Papila C, Gelisgen R and Uzun H: The
significance of insulin resistance in nondiabetic breast cancer
patients. J Endocrinol Metab. 11:42–48. 2021. View Article : Google Scholar
|
|
83
|
Gómez JM, Maravall FJ, Gómez N, Navarro
MA, Casamitjana R and Soler J: Interactions between serum leptin,
the insulin-like growth factor-I system, and sex, age,
anthropometric and body composition variables in a healthy
population randomly selected. Clin Endocrinol (Oxf). 58:213–219.
2003. View Article : Google Scholar
|
|
84
|
Bjørge T, Lukanova A, Tretli S, Manjer J,
Ulmer H, Stocks T, Selmer R, Nagel G, Almquist M, Concin H, et al:
Metabolic risk factors and ovarian cancer in the Metabolic Syndrome
and Cancer project. Int J Epidemiol. 40:1667–1677. 2011. View Article : Google Scholar
|
|
85
|
Craig ER, Londoño AI, Norian LA and Arend
RC: Metabolic risk factors and mechanisms of disease in epithelial
ovarian cancer: A review. Gynecol Oncol. 143:674–683. 2016.
View Article : Google Scholar
|
|
86
|
Khanlarkhani N, Azizi E, Amidi F,
Khodarahmian M, Salehi E, Pazhohan A, Farhood B, Mortezae K,
Goradel NH and Nashtaei MS: Metabolic risk factors of ovarian
cancer: A review. JBRA Assist Reprod. 26:335–347. 2022.PubMed/NCBI
|
|
87
|
Dixon SC, Nagle CM, Thrift AP, Pharoah PD,
Pearce CL, Zheng W, Painter JN; AOCS Group & Australian Cancer
Study (Ovarian Cancer), ; Chenevix-Trench G, Fasching PA, et al:
Adult body mass index and risk of ovarian cancer by subtype: A
Mendelian randomization study. Int J Epidemiol. 45:884–895. 2016.
View Article : Google Scholar
|
|
88
|
Zeleznik OA, Eliassen AH, Kraft P, Poole
EM, Rosner BA, Jeanfavre S, Deik AA, Bullock K, Hitchcock DS,
Avila-Pacheco J, et al: A prospective analysis of circulating
plasma metabolites Associated with ovarian cancer risk. Cancer Res.
80:1357–1367. 2020. View Article : Google Scholar : PubMed/NCBI
|
|
89
|
Lee S, Choi S, Kim HJ, Chung YS, Lee KW,
Lee HC, Huh KB and Kim DJ: Cutoff values of surrogate measures of
insulin resistance for metabolic syndrome in Korean non-diabetic
adults. J Korean Med Sci. 21:695–700. 2006. View Article : Google Scholar
|
|
90
|
Bonora E, Targher G, Alberiche M,
Bonadonna RC, Saggiani F, Zenere MB, Monauni T and Muggeo M:
Homeostasis model assessment closely mirrors the glucose clamp
technique in the assessment of insulin sensitivity: Studies in
subjects with various degrees of glucose tolerance and insulin
sensitivity. Diabetes Care. 23:57–63. 2000. View Article : Google Scholar : PubMed/NCBI
|
|
91
|
Robbins DC, Andersen L, Bowsher R, Chance
R, Dinesen B, Frank B, Gingerich R, Goldstein D, Widemeyer HM,
Haffner S, et al: Report of the American Diabetes Association's
Task Force on standardization of the insulin assay. Diabetes.
45:242–256. 1996. View Article : Google Scholar : PubMed/NCBI
|
|
92
|
Mack R, Skurnick B, Sterling-Jean Y,
Pedra-Nobre M and Bigg D: Fasting insulin levels as a measure of
insulin resistance in American blacks. J Med. 34:31–38.
2003.PubMed/NCBI
|
|
93
|
Yeni-Komshian H, Carantoni M, Abbasi F and
Reaven GM: Relationship between several surrogate estimates of
insulin resistance and quantification of insulin-mediated glucose
disposal in 490 healthy nondiabetic volunteers. Diabetes Care.
23:171–175. 2000. View Article : Google Scholar : PubMed/NCBI
|
|
94
|
Buchanan TA, Watanabe RM and Xiang AH:
Limitations in surrogate measures of insulin resistance. J Clin
Endocrinol Metab. 95:4874–4876. 2010. View Article : Google Scholar : PubMed/NCBI
|
|
95
|
Haffner SM, Miettinen H and Stern MP: The
homeostasis model in the San Antonio Heart Study. Diabetes Care.
20:1087–1092. 1997. View Article : Google Scholar : PubMed/NCBI
|
|
96
|
Legro RS, Finegood D and Dunaif A: A
fasting glucose to insulin ratio is a useful measure of insulin
sensitivity in women with polycystic ovary syndrome. J Clin
Endocrinol Metab. 83:2694–2698. 1998. View Article : Google Scholar : PubMed/NCBI
|
|
97
|
Jørgensen SW, Hjort L, Gillberg L,
Justesen L, Madsbad S, Brøns C and Vaag AA: Impact of prolonged
fasting on insulin secretion, insulin action, and hepatic versus
whole body insulin secretion disposition indices in healthy young
males. Am J Physiol Endocrinol Metab. 320:E281–E290. 2021.
View Article : Google Scholar
|
|
98
|
Habib SS, Eshki A, AlTassan B, Fatani D,
Helmi H and AlSaif S: Relationship of serum novel adipokine
chemerin levels with body composition, insulin resistance,
dyslipidemia and diabesity in Saudi women. Eur Rev Med Pharmacol
Sci. 21:1296–1302. 2017.
|
|
99
|
Pavelić K, Slijepcević M, Pavelić J, Ivić
J, Audy-Jurković S, Pavelić ZP and Boranić M: Growth and treatment
of Ehrlich tumor in mice with alloxan-induced diabetes. Cancer Res.
39:1807–1813. 1979.
|
|
100
|
Gates JR, Parpia B, Campbell TC and Chen
J: Evaluation of the FIRI (Fasting Insulin Resistance Index) and
selected plasma parameters associated with insulin resistance as
predictors of cardiovascular mortality in rural Chinese women. Asia
Pac J Clin Nutr. 6:200–202. 1997.PubMed/NCBI
|
|
101
|
Mather KJ, Hunt AE, Steinberg HO, Paradisi
G, Hook G, Katz A, Quon MJ and Baron AD: Repeatability
characteristics of simple indices of insulin resistance:
Implications for research applications. J Clin Endocrinol Metab.
86:5457–5464. 2001. View Article : Google Scholar : PubMed/NCBI
|
|
102
|
Chen H, Sullivan G, Yue LQ, Katz A and
Quon MJ: QUICKI is a useful index of insulin sensitivity in
subjects with hypertension. Am J Physiol Endocrinol Metab.
284:E804–E812. 2003. View Article : Google Scholar : PubMed/NCBI
|
|
103
|
Hettihewa LM, Palangasinghe S, Jayasinghe
SS, Gunasekara SW and Weerarathna TP: Comparison of insulin
resistance by indirect methods-HOMA, QUICKI and McAuley-With
fasting insulin in patients with type 2 diabetes in Galle, Sri
Lanka: A pilot study. Online J Health Allied Sci. 5:1–8. 2006.
|
|
104
|
Scoppola A, Strigari L, Barnabei A,
Petasecca P, De Galitiis F, Fulgenzi CAM, Roselli M, De Lorenzo A,
Di Renzo L, Marchetti P and Torino F: Insulin resistance as a risk
factor for cutaneous melanoma. A case control study and
risk-assessment nomograms. Front Endocrinol (Lausanne). 10:7572019.
View Article : Google Scholar : PubMed/NCBI
|
|
105
|
Rutter MK, Wilson PWF, Sullivan LM, Fox
CS, D'Agostino RB Sr and Meigs JB: Use of alternative thresholds
defining insulin resistance to predict incident type 2 diabetes
mellitus and cardiovascular disease. Circulation. 117:1003–1009.
2008. View Article : Google Scholar : PubMed/NCBI
|
|
106
|
Conwell LS, Trost SG, Brown WJ and Batch
JA: Indexes of insulin resistance and secretion in obese children
and adolescents: A validation study. Diabetes Care. 27:314–319.
2004. View Article : Google Scholar : PubMed/NCBI
|
|
107
|
Garg MK, Tandon N, Marwaha RK and Singh Y:
Evaluation of surrogate markers for insulin resistance for defining
metabolic syndrome in urban Indian adolescents. Indian Pediatr.
51:279–284. 2014. View Article : Google Scholar : PubMed/NCBI
|
|
108
|
Rudvik A and Månsson M: Evaluation of
surrogate measures of insulin sensitivity-correlation with gold
standard is not enough. BMC Med Res Methodol. 18:642018. View Article : Google Scholar
|
|
109
|
Coppola D, Saunders B, Fu L, Mao W and
Nicosia SV: The insulin-like growth factor 1 receptor induces
transformation and tumorigenicity of ovarian mesothelial cells and
down-regulates their Fas-receptor expression. Cancer Res.
59:3264–3270. 1999.PubMed/NCBI
|
|
110
|
Karasik A, Menczer J, Pariente C and
Kanety H: Insulin-like growth factor-I (IGF-I) and IGF-binding
protein-2 are increased in cyst fluids of epithelial ovarian
cancer. J Clin Endocrinol Metab. 78:271–276. 1994. View Article : Google Scholar : PubMed/NCBI
|
|
111
|
Holly J: Insulin-like growth factor-1 and
risk of breast cancer. Lancet. 352:13881998. View Article : Google Scholar
|
|
112
|
D'Esposito V, Passaretti F, Hammarstedt A,
Liguoro D, Terracciano D, Molea G, Canta L, Miele C, Smith U,
Beguinot F and Formisano P: Adipocyte-released insulin-like growth
factor-1 is regulated by glucose and fatty acids and controls
breast cancer cell growth in vitro. Diabetologia. 55:2811–2822.
2012. View Article : Google Scholar
|
|
113
|
Sanchez-Garrido MA and Tena-Sempere M:
Metabolic dysfunction in polycystic ovary syndrome: Pathogenic role
of androgen excess and potential therapeutic strategies. Mol Metab.
35:2020. View Article : Google Scholar
|
|
114
|
Takemura Y, Ouchi N, Shibata R, Aprahamian
T, Kirber MT, Summer RS, Kihara S and Walsh K: Adiponectin
modulates inflammatory reactions via calreticulin
receptor-dependent clearance of early apoptotic bodies. J Clin
Invest. 117:375–386. 2007. View Article : Google Scholar
|
|
115
|
Kalli KR, Falowo OI, Bale LK, Zschunke MA,
Roche PC and Conover CA: Functional insulin receptors on human
epithelial ovarian carcinoma cells: Implications for IGF-II
mitogenic signaling. Endocrinology. 143:3259–3267. 2002. View Article : Google Scholar : PubMed/NCBI
|
|
116
|
Lutz AM, Ray P, Willmann JK, Drescher C
and Gambhir SS: 2-Deoxy-2-[F-18]fluoro-D-glucose accumulation in
ovarian carcinoma cell lines. Mol Imaging Biol. 9:260–266. 2007.
View Article : Google Scholar
|
|
117
|
Shibata K, Kajiyama H, Mizokami Y, Ino K,
Nomura S, Mizutani S, Terauchi M and Kikkawa F: Placental leucine
aminopeptidase (P-LAP) and glucose transporter 4 (GLUT4) expression
in benign, borderline, and malignant ovarian epithelia. Gynecol
Oncol. 98:11–18. 2005. View Article : Google Scholar
|
|
118
|
Tsukioka M, Matsumoto Y, Noriyuki M,
Yoshida C, Nobeyama H, Yoshida H, Yasui T, Sumi T, Honda K and
Ishiko O: Expression of glucose transporters in epithelial ovarian
carcinoma: Correlation with clinical characteristics and tumor
angiogenesis. Oncol Rep. 18:361–367. 2007.PubMed/NCBI
|
|
119
|
Sheetz MJ and King GL: Molecular
understanding of hyperglycemia's adverse effects for diabetic
complications. JAMA. 288:2579–2588. 2002. View Article : Google Scholar : PubMed/NCBI
|
|
120
|
Yamagishi S, Nakamura K, Inoue H, Kikuchi
S and Takeuchi M: Possible participation of advanced glycation end
products in the pathogenesis of colorectal cancer in diabetic
patients. Med Hypotheses. 64:1208–1210. 2005. View Article : Google Scholar : PubMed/NCBI
|
|
121
|
Taguchi A, Blood DC, del Toro G, Canet A,
Lee DC, Qu W, Tanji N, Lu Y, Lalla E, Fu C, et al: Blockade of
RAGE-amphoterin signalling suppresses tumour growth and metastases.
Nature. 405:354–360. 2000. View Article : Google Scholar : PubMed/NCBI
|
|
122
|
Ness RB, Grisso JA, Cottreau C, Klapper J,
Vergona R, Wheeler JE, Morgan M and Schlesselman JJ: Factors
related to inflammation of the ovarian epithelium and risk of
ovarian cancer. Epidemiology. 11:111–117. 2000. View Article : Google Scholar : PubMed/NCBI
|
|
123
|
Benjamin LE: Glucose, VEGF-A, and diabetic
complications. Am J Pathol. 158:1181–1184. 2001. View Article : Google Scholar
|
|
124
|
Wang M, Cheng N, Zheng S, Wang D, Hu X,
Ren X, Pei H, Ma H, Mu H and Bai Y: Metabolic syndrome and the risk
of breast cancer among postmenopausal women in North-West China.
Climacteric. 18:852–858. 2015. View Article : Google Scholar
|
|
125
|
DeFronzo RA, Tobin JD and Andres R:
Glucose clamp technique: A method for quantifying insulin secretion
and resistance. Am J Physiol. 237:E214–E223. 1979.
|
|
126
|
Alberti KG and Zimmet PZ: Definition,
diagnosis and classification of diabetes mellitus and its
complications. Part 1: Diagnosis and classification of diabetes
mellitus provisional report of a WHO consultation. Diabet Med.
15:539–553. 1998. View Article : Google Scholar : PubMed/NCBI
|