Introduction
Breast cancer is the most common malignancy in women
worldwide and despite advances in research and therapy, it remains
a highly lethal malignant disease that constitutes a heavy burden
to public health in >154 countries, with an ~600,000 per year
(1,2). In Chile, it has been the leading
cause of cancer-associated death since 2009 with 11.8% of deaths
from cancer in women per year and a high level of mortality in
elder patients. The average number of patients diagnosed with this
pathology has improved considerably in recent years; several
symptoms are prevalent, especially in the population with
inadequate access to national health systems (3,4). The
recommended treatment according to the molecular subtypes agreed
upon in the St. Gallen consensus has shown favorable effects on
patient survival (5,6). According to the St. Gallen protocol,
the histopathological aspects of the mammary tumor are defined in a
standardized manner, and recommendations for adjuvant therapies are
decided based on observation of tumor biopsies under the microscope
(5). In this context, the
diagnosis of tumors using a minimal panel of molecular techniques,
where immunodetection of hormonal receptors [estrogen receptor (ER)
and progesterone receptor (PR)], Ki67 antigen, and epidermal growth
factor receptor 2 (HER2), is central to pathological analyses due
to their fundamental role in appropriately establishing the
therapeutic strategy and prognosis for each patient, and for
ultimately reducing breast cancer-associated deaths (5,7,8).
Specifically, HER2 protein is overexpressed in
10–25% of invasive breast cancer cases (2,7).
Detection of HER2 in tumor cells through histological analysis is
an important measure of prognostic and predictive outcomes in
invasive tumors (2,9,10).
The detection of HER2 by microscopy is more challenging than for
the other antigens due to the complex pattern of HER2 expression
within cells, which often requires the use of complementary
techniques such as fluorescent in situ hybridization (FISH)
to detect the gene encoding ERBB2 (8,11,12).
The American Society for Clinical Oncology (ASCO) has proposed a
specific qualitative algorithm for HER2 using immunohistochemistry
(IHC), based on the intensity of the signal, the completeness of
the pattern of expression in the cell membrane, and the approximate
minimum percentage of expression (8). Following this approach, invasive
tumor samples can be categorized as HER2 0, 1+, 2+, or 3+, where
the last category corresponds to upregulated expression protein and
represents cases that should be treated with anti-HER2 therapy
(12,13). Being able to adequately
differentiate the HER2-IHC 2+ category (equivocal) from a false
positive, or 3+, by traditional microscopy is crucial from several
points of view, including appropriate referral to the oncology
service and subsequent suitable adjuvant treatment with trastuzumab
in this pathology and in gastric cancer (14–16).
However, due to the analytical complexity of this biomarker, the
HER2 category represents an important obstacle when it comes to
determining the histopathological diagnosis under the St. Gallen
protocol, with unfavorable consequences on the diagnostic
procedure, treatment strategy, and public health (17).
Analyzing the intensity and distribution of the IHC
signal in situ provides important information for the
diagnosis and prognosis of cancer. Visual scoring of markers is
currently employed, using light microscopy with medium
magnification capacity (×20 or ×40 objective lenses) (15,18).
The tumor can be scored as 0/1+ (negative), 2+ (equivocal), or 3+
(positive) according to official guidelines such as those proposed
by ASCO (8,12); however, the microscopic observation
of the IHC performed by the pathologist is highly time-consuming
and suffers from high inter- and intra-observer variability, with
the results being conditioned by subjective factors (19,20).
In contrast, analysis performed by computational tools shortens the
time required and decreases inter-operator variation in the
evaluation of staining levels (20,21).
Used for the first time for immunostaining in 1980, computerized
image analysis has since been applied in several studies, in
combination with innovations in laboratory techniques for protein
and gene detection; some examples include AQUA Technology (22), HERmark (23), Mammaprint (24), Oncotype Dx (25), and PAM50 Breast Cancer Intrinsic
Classifier (26). Unfortunately,
most assays that provide quantitative data work with reference
centers and laboratories that do not fit the needs and capabilities
of public health systems in Latin America (27). This strengthens the importance of
developing low-cost technologies for high-precision analysis and
generating digital references of existing material. In addition to
this problem, the existing computerized analysis techniques of
immunohistochemical signals only integrate 1–2 image parameters to
qualify the diagnosis through defined thresholds based on controls
(15,21,23).
Due to these limitations, innovative techniques are needed to
integrate a large number of quantitative parameters to build a
mathematical classification model that could be optimized by data
training itself (28,29).
Machine learning (ML) and observation with
computational tools have been used in a wide variety of clinical
tasks ranging from the segmentation of medical images to
generation, classification, and clinical prediction (30–33).
Different research centers and biotechnology corporations have been
exploring the use of artificial intelligence (AI) and ML in key
clinical areas (30,34–36).
Specifically, ML classified as Supervised Learning allows for the
resolution of classification problems where the machine must learn
to be able to predict discrete values. This means that the machine
can predict the most likely category, class, or label for new
examples, or solve regression problems to predict the value of a
continuous variable (28,37). In certain problems, the response
variable is not normally distributed, for example, a coin toss can
only have two outcomes: Positive or negative. In these cases, the
use of logistic regression as a classification model is relatively
popular and has been used regularly in both industry and medicine
(38). The performance of this
response is shaped thanks to a mathematical optimization procedure;
the use of the cost function in conjunction with the downward
gradient that derives from the maximum likelihood makes it possible
to find weight coefficients for each input parameter that maximize
the performance of the classifier (39).
Despite the promising properties described for the
ML classification, the constant increase in the complexity of
learning algorithms has led to the frequent appearance of ‘black
box’ models, where the interpretation of their internal functioning
is very difficult with traditional analytical methods (40). These models are increasingly used
in decision-making in important contexts, such as in clinical
development, implying that the demand for transparency is essential
when decisions based on AI are unjustifiable in real life (41,42).
In this context, the concept of explainability makes it possible to
detect and correct the training bias, provides robustness by
detecting disturbances in the prediction, and establishes arguments
that allow us to understand changes in the performance of the
classification tasks. Different systems that are coupled to ML
models allow opening the black box, such as decision trees,
visualization of inputs and outputs through graphs, and Shapley
Additive exPlanation (SHAP) values, where the latter stands out
primarily for being applicable to any classification model, with
easily understandable graphic interpretation and allowance of both
explanation and advice (41,43).
The primary question of this study is whether it is
possible to obtain a classification as good as pathologists' using
ML and photomicrographs features. Additionally, we attempt to
understand how the classifier is modified when including
information provided by FISH.
Material and methods
Type of study
The present study was a retrospective diagnostic
assessment performed to analyze images of anonymized microscopic
slides of paraffin-embedded tissues with a histological diagnosis
of breast cancer.
Collection of images
Histological slides of IHC-stained breast cancer
tissues from 2019 were randomly collected for the lab technician
team of Carlos Van Buren Hospital Pathology Service (Valparaíso,
Chile) with prior authorization from the Chief pathologist. Only
those classed as HER2-positive and a corresponding pathologist's
diagnosis reported by IHC and IHC + FISH were included. Data from
141 samples were tabulated from the local database, and anonymized
using the internal code of each sample together with its IHC-HER2
diagnosis as 0, 1, 2, or 3 and its FISH diagnosis as 0 or 1. These
two classifications were considered for the ML classification to be
compared. The histological slides were imaged using a Leica
microscope (DM750) with a CCD ICC50-W digital camera integrated
into the Las EZ software (Leica Microsystems). Three images were
obtained at an ×400 magnification with 3 different areas imaged for
each tumor sample, with staining in at least 10% of the tumor area.
We used automatic parameters for light exposure, hue, saturation,
and γ, calibrated by the factory with in vitro diagnostics
standard (https://www.leica-microsystems.com/products/light-microscopes/p/leica-dm2000/).
The pathologist provided coded and tabulated data in a
password-protected file. The use of digital image samples and
anonymized data was approved by the Carlos van Buren Hospital
directive (Valparaiso, Chile) and by the V Region, Valparaíso-San
Antonio, Scientific Ethics Committee SSVSA (approval no.:
1765-07.10.2021).
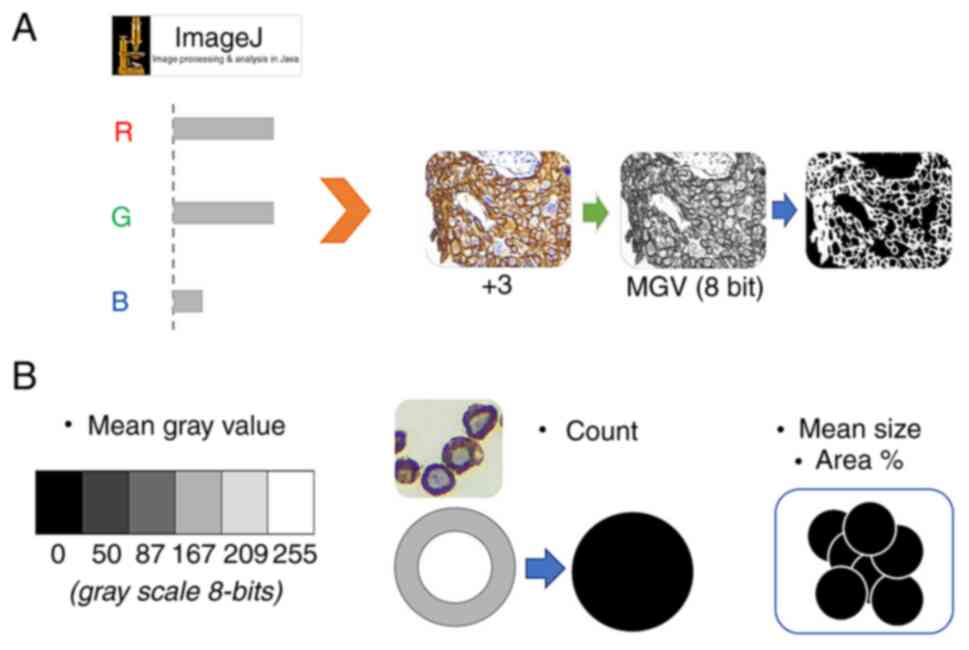
Automated image quantification
Using ImageJ 1.53 (National Institutes of Health),
automatic batch analysis was performed to extract four features per
image, and these were used to differentiate the expression levels
of HER2 according to the ASCO algorithm with the following protocol
(Fig. 1): i) Resize images to
1,000×750 pixels with bilinear interpolation; ii) separate colors
based on an 8-bit channel red/green/blue (RGB) color set; iii)
determine the region of interest associated with cell membranes,
based on a pixel-by-pixel analysis of RGB information: The retained
pixels are denoted as ‘signal’; iv) Obtain the average intensity
value of the total signal (feature 1: 8 bit mean gray value, named
as MGV); v) convert the 8-bit signal into binary; vi) invert the
binary code to transform the fully enclosed empty spaces delimited
by the surrounding signal into black particles of a similar size to
cells; vii) determine the individual particles meeting two
criteria: Area ranging from 250-2,500 pixles2 with a
circularity between 0.3–1.0 (feature 2: Circ count, or cells that
meet the criterion of fully stained membrane, named as COUNT),
quantification of the total percentage area (feature 3: % Area
circ, named as %AREA) and average area of the previous counts
(feature 4: Mean size, named as M.SIZE). The data (4 features)
obtained from 423 photographs (131 patient samples and 10 controls)
were tabulated in Excel 365 (Microsoft Corporation). The data
corresponding to the patient cohort was subsequently imported into
the classifier's input data. The controls (30 samples) corresponded
to reference cases (both healthy and non-healthy) and were used to
illustrate controlled cases.
Training and testing of logistic
regression classifiers
ANACONDA open-source toolkit (https://www.anaconda.com) was used to train,
implement, and test a logistic amplified (+3) vs. non-amplified (0,
+1, or +2) signal classifier, and the Spyder 4 IDE (https://www.spyder-ide.org/) to program the
instruction set in Python 3.7, using Scikit-learn packages for
machine learning (https://scikit-learn.org/stable/index.html). The
previously stored data was first divided into: i) Set of input
data, corresponding to the 4 features in each image, to represent
the variables of the X axis of the 4-dimensional distribution; ii)
output data set 1 (first Y variable), corresponding to the IHC
diagnoses of each image, where the scores were grouped according to
whether it is an amplified signal or not, such that 0, 1+, and 2+
were merged into a unique output 0 (HER2 normal expression) and 3+
corresponded to output 1 (HER2 overexpression); and iii) output
data set 2 (second Y variable), corresponding to the IHC diagnoses
corrected by FISH. This converted all the IHC diagnoses that had
negative FISH (0) to 0 if they were declared as 1 and vice
versa.
Subsequently, the previous data sets were divided
into training_set and test_set with a ratio of 0.65:0.35
respectively using the Scikit tool ‘train_test_split’. Next, we
implemented a logistic regression model with the default parameters
and the model coefficients were automatically adjusted to the
training_set. Finally, we used the adjusted model to predict the
diagnoses in the test_set and compared them with the original
diagnoses to obtain the prediction probabilities and build a
confusion matrix, calculate the efficiency parameters of the model,
and perform receiver operating characteristic (ROC) curve analysis
between the IHC diagnoses and IHC + FISH corrected data.
The whole procedure was tested 20 times to obtain
the best performance model.
Model performance explainability using
SHapley Additive exPlanations (SHAP) values analysis
To obtain an overview of the most important features
for the model output, and how their analytic priority order
affected the HER2 diagnostic performance, we plotted the SHAP
values of each feature for every sample and mean absolute SHAP
values for all features, using SHAP libraries for python
(https://shap.readthedocs.io/en/latest/index.html)
coupled with the classifier code. SHAP values can further show
positive and negative relationships of the predictor, and by
plotting all dots in the training data with a blue-to-red color
gradient, the following information can be obtained: i) Single
value impact: The horizontal location shows whether the effect of
that value is associated with higher or lower predictive
performance; ii) original value: Color shows whether that variable
is high (in red) or low (in blue) for that observation; iii)
Mean feature importance: Using mean absolute values, data can be
summarized in a simplified bar plot to show the overall impact of
each feature on model output. Variables were ranked in descending
order.
Classifier performance evaluation
To assess the performance of the model, a confusion
matrix was constructed with the ML-predicted diagnoses vs. the
actual diagnoses to define true positives and negatives (TP/TN) and
false positives and negatives (FP/FN). With this, matrix,
precision, recall, specificity, accuracy, and FPR were calculated
to perform ROC analysis to determine, using the area under the
curve (AUC), the set of diagnoses that allowed building a better
predictor (44). ROC analysis was
performed using binary prediction probabilities of positive class
over test_dataset to calculate false rates (FPR) and true positive
rates (TPR) with Sklearn metrics libraries. Next, the FPR and TPR
were plotted to calculate the AUC score, and the 95% confidence
intervals were determined by bootstrapped scores
(n_bootstraps=1,000, random state=42).
Statistical analysis
Bar graph results are presented as the mean ±
standard deviation from at least three independent evaluations for
each experimental condition. Data were analyzed with Origin Pro 9.0
(OriginLab Corporation Northampton). Differences between multiple
groups were compared using a Fisher's least significant difference
test and ANOVA followed by a Bonferroni posthoc test in
Statgraphics Plus version 5.0 (GraphPad Software, Inc.). P<0.05
was considered to indicate a statistically significant
difference.
Results
Automated image analysis
The first approach was to test if the distribution
values of the four features, MGV, COUNT, %AREA and M.SIZE, were
statically different between the control samples, as references in
the laboratory.
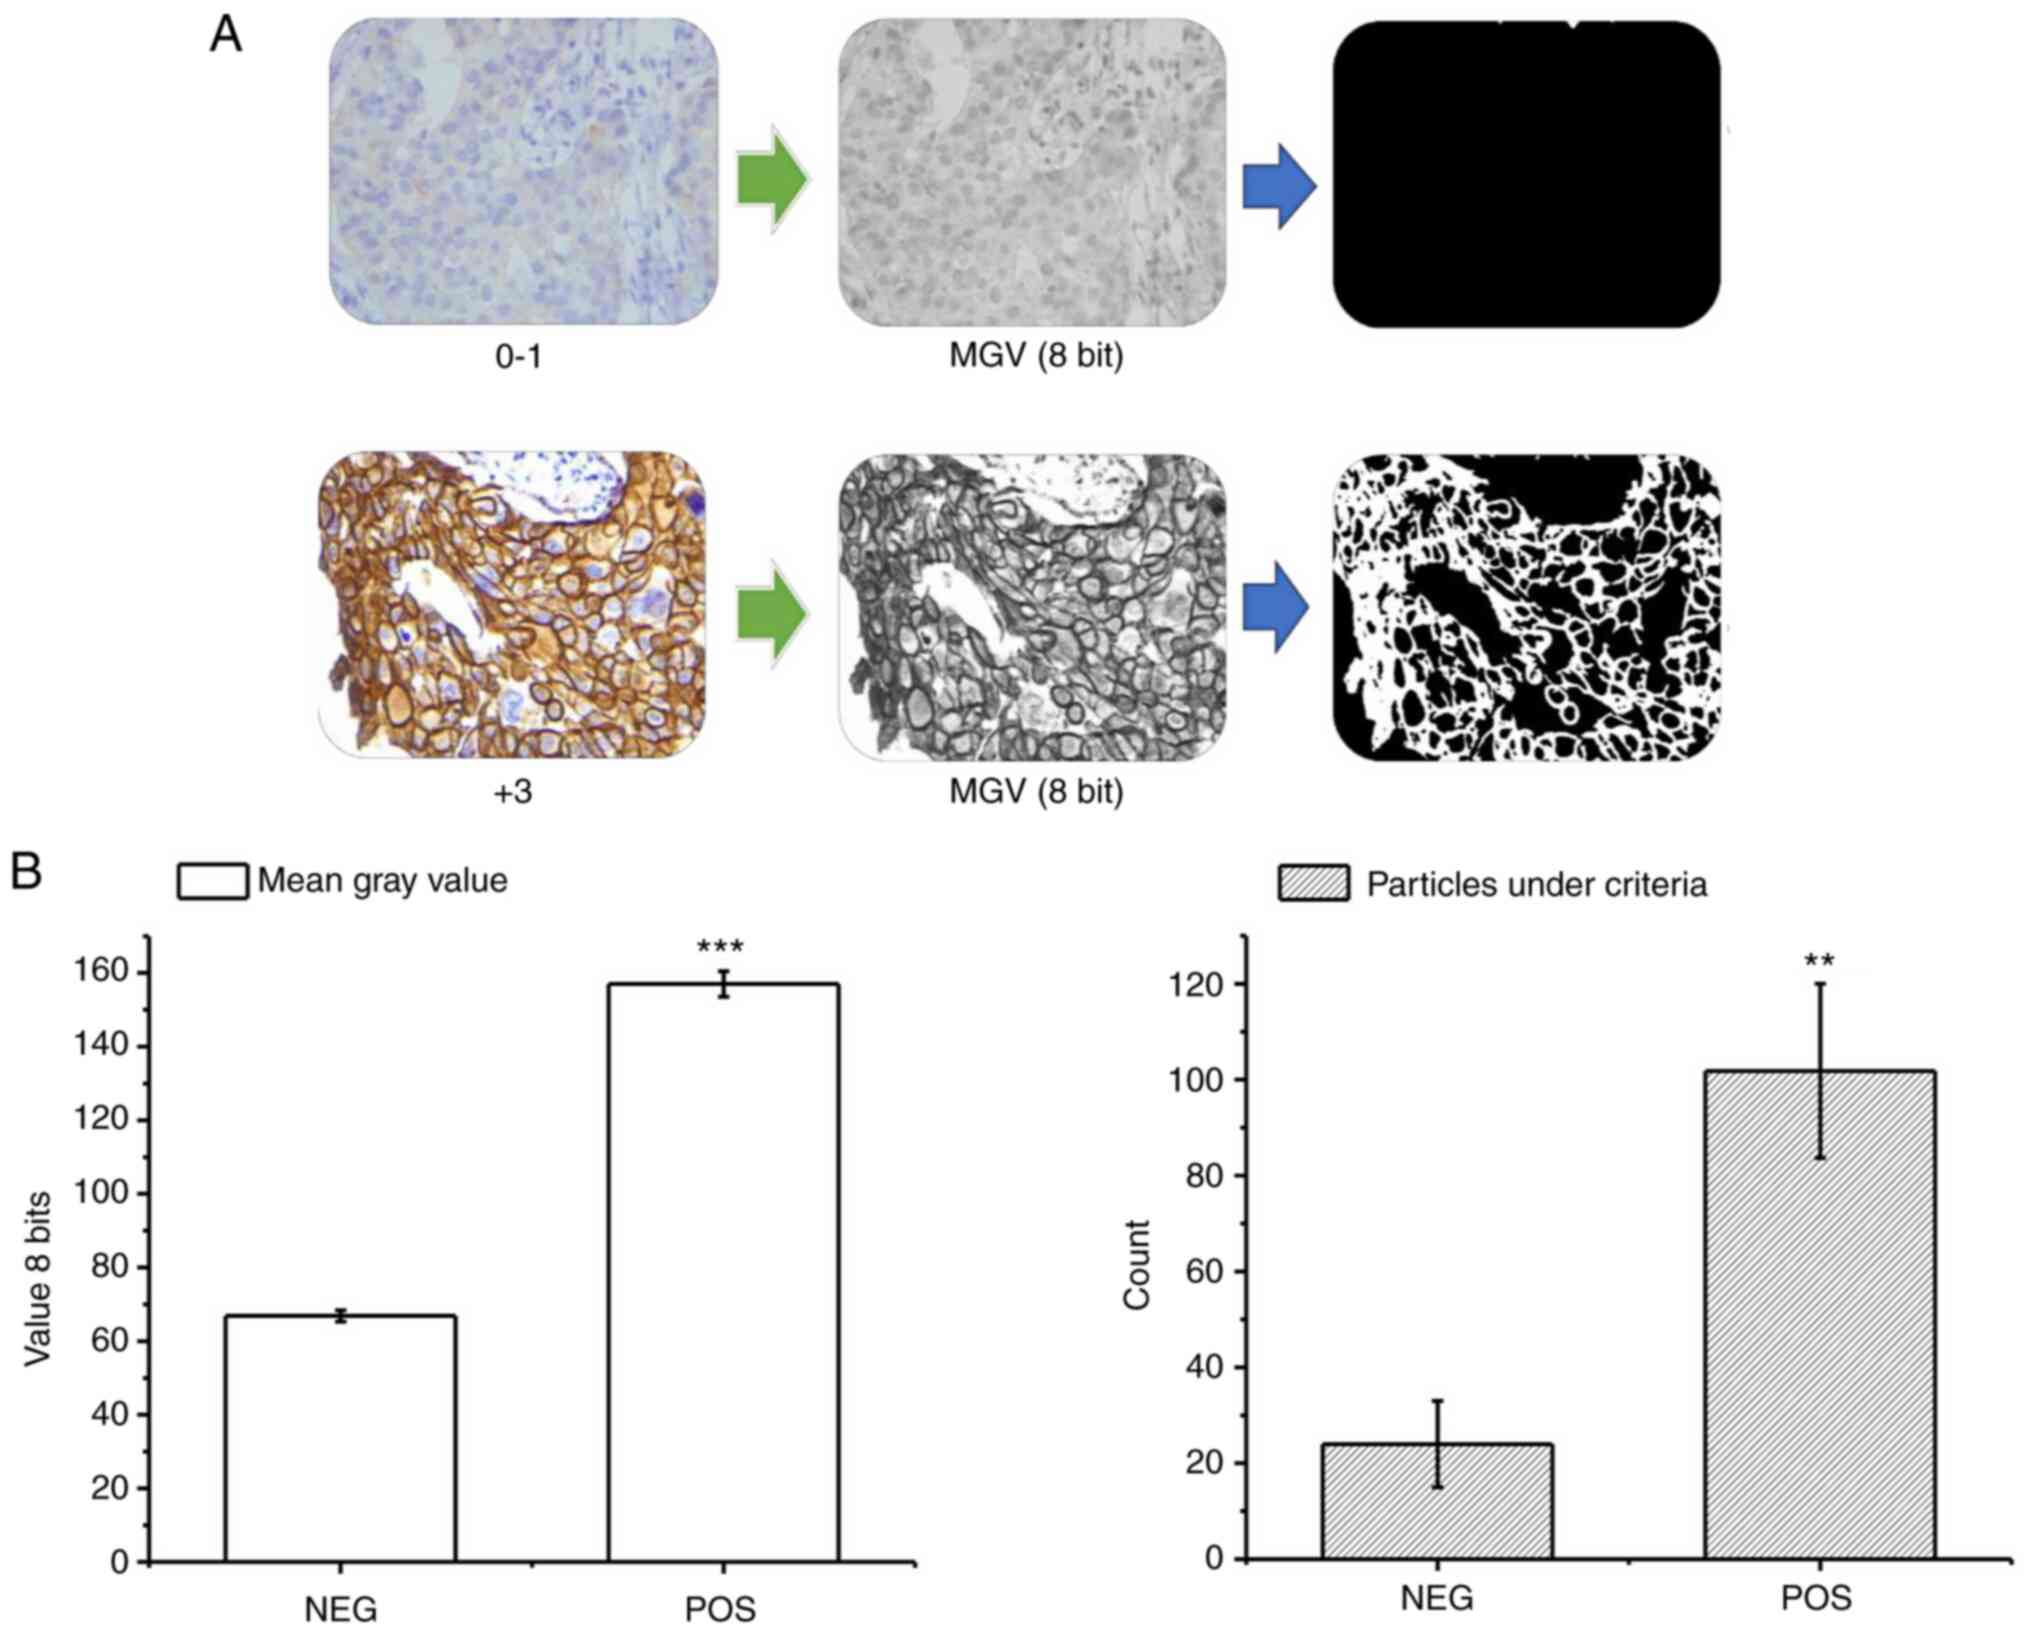
Through the previously described procedure, it was
possible to differentiate the samples according to their
immunohistochemical expression levels through the average intensity
of the signal and the parameters derived from the particle count in
the binary results. The negative control samples (corresponding to
known diagnoses 0/1+) presented a low overall signal intensity with
an average of 65 (±2) 8 bit-grayscale, and a particle count under
the positivity criterion of 21 (±9) by visual field (Fig. 2A). Conversely, in the positive
control samples (corresponding to known diagnoses 3+) the global
intensity and the particle count under the criterion were
significantly higher (Fig. 2A),
with values of 155 (±3) and 101 (±20), respectively (Fig. 2B). With this procedure, the MGV,
COUNT, %AREA determined by this count, and the M.SIZE were obtained
for the cohort samples, resulting in a data matrix for the training
with dimensions: (3,934).
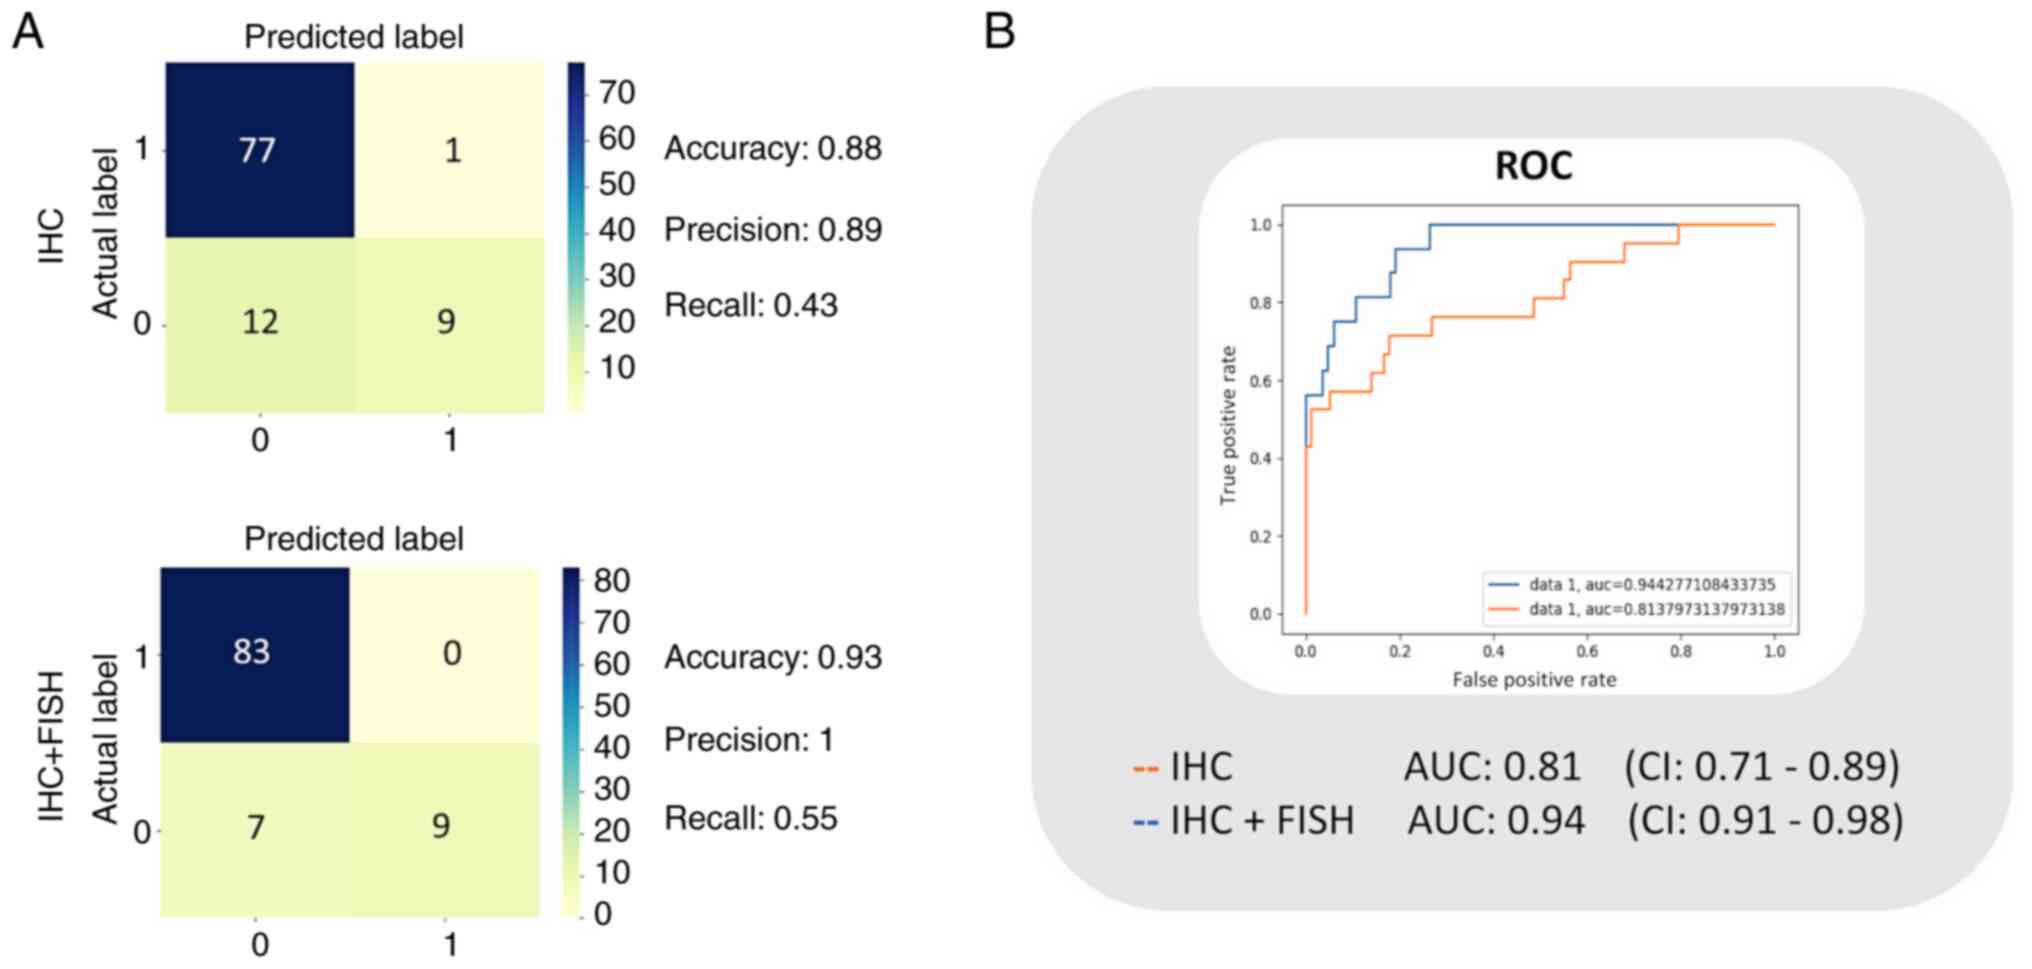
Classifier performance evaluation
The logistic model was trained with the training
data set, and the classifier performance was evaluated with the
data intended for testing (n=99). In this manner, a confusion
matrix for training based on the diagnoses reported with HER2 IHC,
and another matrix for the trained classifier based on confirmed
diagnoses after FISH (IHC + FISH) were obtained to calculate the
performance indicators. The best accuracy, precision, and recall
calculated for the IHC model were 0.88, 0.89, and 0.43
respectively, while for the IHC + FISH classifier they were 0.93,
1.00, and 0.55, respectively (Fig.
3A). Subsequently, to illustrate the sensitivity vs.
specificity using the compared ROC curves, we calculated the TPR
and FPR. The resulting AUC value for the IHC classifier was 0.81
(0.71–0.89), and for the IHC + FISH model, it was 0.94 (0.92–0.98).
Confidence intervals are based on 20 samples (Fig. 3B).
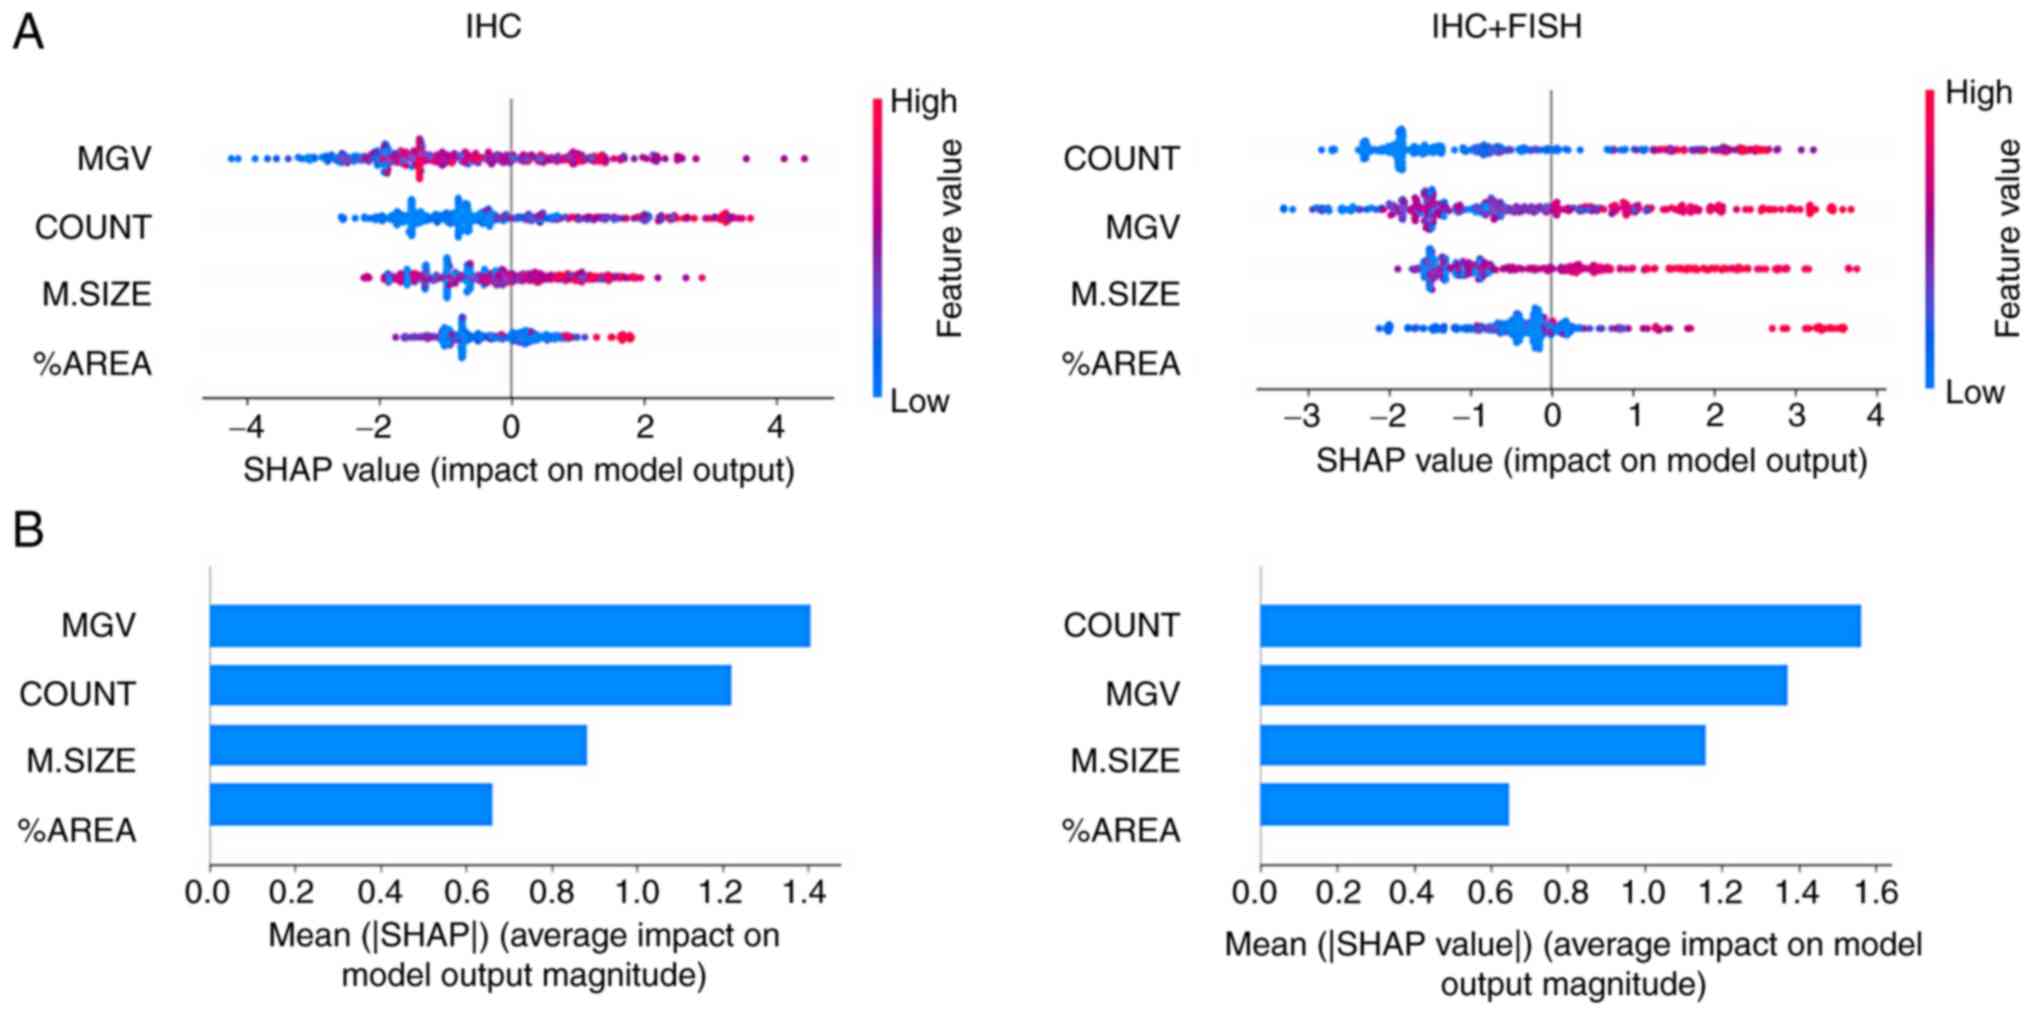
Model explanation by SHAP values
Differences in classifier performance trained based
on the IHC diagnosis provided by the pathologist vs. the training
based on IHC + FISH can be explained primarily by changes in the
order of the analytical priority of the features. As the graphs in
Fig. 4A show, the MGV primarily
influenced the negative output of the logistic classifier
(appearance of 0), while in the case of the COUNT value, at higher
values the impact was positive (appearance of 1) and vice
versa. Meanwhile, M.SIZE and %AREA values showed a more diffuse
impact pattern on the binary output; however, it was possible to
observe how the distribution of the points became more evident
towards the binary output with IHC + FISH training. The summary of
this effect is shown in Fig. 4B,
where it can be seen that MGV and COUNT had a greater absolute
average impact than the other two variables; however, the first
parameter loses priority below the count of cells that meet the
membrane completeness criteria when the training is based on IHC +
FISH.
Discussion
The complex expression pattern of HER2 within cells
presents a challenge for pathologists and the high inter-observer
variability highlights the necessity of tools that allow for
improved predictive results to better tailor treatment strategies.
Deep learning automatic-assisted diagnosis is the most suitable and
potentially accurate solution. Automatic quantification of images
allows for the factorization of two key points highlighted in the
HER2 classification algorithm recommended by ASCO. First, the
visual field signal intensity in the low, medium, and high
categories, a continuous variable of 256 dimensions (8-bit depth),
is internationally used in other immune detection techniques in
brightfield and fluorescence formats (45,46).
The second parameter corresponds to the completeness of the
staining around the cell membrane, whose quantitative estimation
still represents a significant challenge for the pathologist. In
the present study, the signal was transformed into an inverted
binary, where the surrounding blanks by the nuclear signal were
converted into particles with a size ranging between 250 and 2,500
pixels2 and medium circularity when working with images with a
standardized resolution of 1,000 pixels in width (47). This strategy allows for the
generation of statistically significant differences when comparing
amplified vs. normal HER2 expression samples (set of positive vs.
negative controls), based on a reduced analytical complexity in
comparison with current analytical methods of membrane signals from
other research groups that use a skeletonization technique or cell
segmentation through the specialized filters (48,49).
Moreover, our automated process also used a low complexity method
to extract the IHC signal by decomposing the colors into RGB data
matrices pixel by pixel, where the combinatorial intensity in red,
green, and blue allowed the pixels to be separated. A promising
approach to refine the signal could be to use the technique
proposed by Fu et al (18),
with a filter detection complex for brown color generated by the
DAB chromogen typically used in immunohistochemistry.
With the parameters obtained, it was possible to
train a logistic regression ML model for classification and
explainability, and we were able to show significant changes in the
classification performance when the training was performed based on
the diagnosis supplemented with FISH results: When evaluating the
basic performance parameters, the classifier showed high precision
and accuracy in the two trained models (IHC: 0.84 and 0.72 vs. IHC
+ FISH: 0.97 and 0.89, respectively), highlighting that both values
increased when the FISH criterion was added. This obtained data
increases the performance and seems to be primarily explained by
reducing the output impact of the parameter associated with the
global intensity of IHC MGV and increasing the weight of the
subcellular location of the protein, in this case towards the
plasma membrane through the positive cells, the criterion of
completeness (COUNT). In this regard, although IHC takes advantage
of the high affinity of the antigen-antibody reaction that allows
identifying the expression of biomarkers or proteins, its results,
known as immunoexpression, immunostaining, and/or chromogenic
signal intensity, are influenced by multiple factors from the
pre-analytical to the post-analytical phase, and depending on the
performance of these stages, several results can be obtained even
using the same antibody, affecting clinical interpretation
(50,51). If each stage of the preanalytical
phase of histopathology is analyzed in detail, the first step of
taking a sample for biopsy and fixing the tissue in formaldehyde
solution is one of the most important steps, as the result of the
IHC is highly dependent on the time required to fix a sample after
extraction: The cold ischemic time must be as low as possible,
since a prolonged cold ischemic time leads to tissue acidosis,
enzymatic degradation, and altered immunoreactivity, resulting in
artifactual lower antigenic expression (50,51).
Conversely, over-fixing may occur if fixing times exceed 72 h in
small samples such as core breast biopsies. This increases
variability and can generate false negatives/positives at the time
of interpretation when qualitatively assessing the staining
intensity (50). Finally, another
preanalytical factor is the histological paraffin section
technique. In IHC, the optimal section thickness is 3 µm, when
these sections are thicker (>5 µm), they can generate an
overgrowth of the staining intensity during the IHC-reveal stage,
due to overlapping of the cell layers, which saturates the reaction
and may produce an more intense signal, inappropriately augmenting
intensity instead of the completeness of the cell membrane, which
can generate a false diagnosis of +3 HER2, translating into a
completely different treatment and prognosis (52–54).
Based on the performance improvements obtained by
including the FISH results as an extra dimension in the reference
diagnosis, it is hypothesized that the addition of more features to
the ML algorithm training, that include the construction of a
training supervision matrix based on unsupervised learning will
improve predictive ability. This complementary information may
include the basic histological subtype of the tumor, the expression
pattern in lymph node metastases, the response to treatment, and
patient survival, to better study the predictive variables of each
tumor (2,55–57).
With this increase in the dimension of the known output variables,
the performance of the test may potentially improve, specifically
in the recall values, which were low in this study (IHC: 0.43 and
IHC + FISH: 0.55), this may assist in determining the proportion of
actual positives that were correctly identified (58). Low false positive detection is very
attractive in practice regarding the implications of a diagnosis of
breast cancer and referring the patient to the oncology service,
with tremendous burden in terms of complexity of health services,
costs, and impact to the patient in vain (2,59).
In addition, the general performance of the test through the ROC
analysis, showed that this HER2 classifier had AUC values of 0.81
and 0.94 for training with the IHC and IHC + FISH sets
respectively, a very positive scenario since values between 0.8–0.9
are considered very good for complex and high-throughput detection,
such as in blood biochemical profiling (60,61).
Finally, the classification model presented here can
potentially be trained with a larger number of samples to generate
a robust digital pathological reference, through a free access
interoperability platform for public health services, just as
pathology laboratories do in developed countries, applying data
management systems currently available on the market, but at a high
cost (62–64). Furthermore, the methods and
technology proposed here have been developed motivated by previous
research in this field, to test the performance of different
classification algorithms for breast cancer, through the unitary
evaluation of multiple molecular markers in existing protocols such
as Ki67, ER, and PR (6,65,66),
or in proposals under development for molecular classification
including new markers such as PDL1, Claudin, MCL-1, and TRPV1
(67–70). The ability of ML classifiers to
decrease the inter-observer variability improves the accuracy of
breast cancer diagnoses, which may have important implications
since treatment is based on the subtype of tumor diagnosed
(5,54,71).
This approach has the potential to reduce breast cancer mortality
with a significant impact on health systems and affected
populations. Our approach however has some limitations. The model
presented here is only limited to diagnosis and does not provide
analytical evidence to improve tumor prognosis, as it does not
integrate other relevant immunohistochemical biomarkers such as
Ki67, or hormone receptors to subclassify the tumor according to
the risk and the treatment corresponding to the standard categories
(6). Additionally, the model
requires an image preprocessing phase, which increases the level of
complexity and time required for analysis. Therefore, the
implementation of deep learning models based on convolutional
neural networks that allow working directly with the images and
integrating other biomarkers in a 4-dimensional hyperimage
(32,35), could be explored in the future to
propose an easy-to-use procedure to be assessed in clinical
trials.
In conclusion, our current findings suggest that ML
classifiers may be an important contribution to pathology services
and pathologists as, despite their limitations, they can assist in
obtaining a more accurate diagnosis of HER2 immunohistochemical
expression as a tool to predict future potential patient
outcomes.
Acknowledgements
Not applicable.
Funding
This study was funded by Regular FONDECYT, Chile (grant no.
1201311), a national doctoral scholarship from the “Agencia
Nacional de Investigación y Desarrollo ANID”, Chile (grant no.
21220332), a PhD Program in Health Sciences and Engineering,
Universidad de Valparaíso, Chile, and Andrés Bello National
University (Viña del Mar, Chile), Los Andes University (Santiago,
Chile) and the Carlos Van Buren Hospital (Valparaiso, Chile) basic
operational funds.
Availability of data and materials
The datasets used and/or analyzed during the present
study are available from the corresponding author on reasonable
request.
Authors' contributions
CC, PO, and JGM conceived and designed the study.
CL, PG and IM collected, prepared, and anonymized the histological
samples. CC and JGM designed and executed the automated image
analysis. CC, RO, and RM implemented and tested the explainable
machine learning model. CC, WGA and PO analyzed the data and
performed the statistical tests. CC, WGA, PO, PG, and IM wrote the
manuscript. CC, JGM, CL, IM and PO confirm the authenticity of all
the raw data. All authors have read and approved the final
manuscript.
Ethics approval and consent to
participate
The use of digital image samples and anonymized data
was approved by the Carlos van Buren Hospital directive and by the
V Region, Valparaíso-San Antonio, Scientific Ethics Committee SSVSA
(approval no.: 1765-07.10.2021).
Patient consent for publication
The need for informed consent was waived with
authorization from V Region, Valparaíso-San Antonio, Scientific
Ethics Committee SSVSA (approval no.: 1765-07.10.2021).
Competing interests
The authors declare that they have no competing
interests.
Glossary
Abbreviations
Abbreviations:
|
IHC
|
immunohistochemistry
|
|
ML
|
machine learning
|
|
AI
|
artificial intelligence
|
|
HER2
|
human epidermal growth factor 2
|
|
FISH
|
fluorescence in situ
hybridization
|
|
SHAP
|
Shapley Additive exPlanations
|
References
|
1
|
Bray F, Ferlay J, Soerjomataram I, Siegel
RL, Torre LA and Jemal A: Global cancer statistics 2018: GLOBOCAN
estimates of incidence and mortality worldwide for 36 cancers in
185 countries. CA Cancer J Clin. 68:394–424. 2018. View Article : Google Scholar : PubMed/NCBI
|
|
2
|
Waks AG and Winer EP: Breast cancer
treatment: A review. JAMA. 321:288–300. 2019. View Article : Google Scholar : PubMed/NCBI
|
|
3
|
Banegas MP, Püschel K, Martínez-Gutiérrez
J, Anderson JC and Thompson B: Perceived and objective breast
cancer risk assessment in Chilean women living in an underserved
area. Cancer Epidemiol Biomarkers Prev. 21:1716–1721. 2012.
View Article : Google Scholar : PubMed/NCBI
|
|
4
|
Icaza G, Núñez L and Bugueño H:
Epidemiological analysis of breast cancer mortality in women in
Chile. Rev Med Chil. 145:106–114. 2017.(in Spanish). View Article : Google Scholar : PubMed/NCBI
|
|
5
|
Thomssen C, Balic M, Harbeck N and Gnant
M: St. Gallen/Vienna 2021: A brief summary of the consensus
discussion on customizing therapies for women with early breast
cancer. Breast Care (Basel). 16:135–143. 2021. View Article : Google Scholar : PubMed/NCBI
|
|
6
|
Balic M, Thomssen C, Würstlein R, Gnant M
and Harbeck N: St. Gallen/Vienna 2019: A brief summary of the
consensus discussion on the optimal primary breast cancer
treatment. Breast Care (Basel). 14:103–110. 2019. View Article : Google Scholar : PubMed/NCBI
|
|
7
|
Li C, Bian X, Liu Z, Wang X, Song X, Zhao
W, Liu Y and Yu Z: Effectiveness and safety of pyrotinib-based
therapy in patients with HER2-positive metastatic breast cancer: A
real-world retrospective study. Cancer Med. 10:8352–8364. 2021.
View Article : Google Scholar : PubMed/NCBI
|
|
8
|
Wang B, Ding W, Sun K, Wang X, Xu L and
Teng X: Impact of the 2018 ASCO/CAP guidelines on HER2 fluorescence
in situ hybridization interpretation in invasive breast cancers
with immunohistochemically equivocal results. Sci Rep. 9:167262019.
View Article : Google Scholar : PubMed/NCBI
|
|
9
|
Masuda N, Lee SJ, Ohtani S, Im YH, Lee ES,
Yokota I, Kuroi K, Im SA, Park BW, Kim SB, et al: Adjuvant
capecitabine for breast cancer after preoperative chemotherapy. N
Engl J Med. 376:2147–2159. 2017. View Article : Google Scholar : PubMed/NCBI
|
|
10
|
Slomski A: Adjuvant therapy for
HER2-positive breast cancer. JAMA. 322:11342019. View Article : Google Scholar
|
|
11
|
Gown AM: Current issues in ER and HER2
testing by IHC in breast cancer. Mod Pathol. 21 (Suppl 2):S8–S15.
2008. View Article : Google Scholar : PubMed/NCBI
|
|
12
|
Press MF, Seoane JA, Curtis C, Quinaux E,
Guzman R, Sauter G, Eiermann W, Mackey JR, Robert N, Pienkowski T,
et al: Assessment of ERBB2/HER2 status in HER2-equivocal breast
cancers by FISH and 2013/2014 ASCO-CAP guidelines. JAMA Oncol.
5:366–375. 2019. View Article : Google Scholar : PubMed/NCBI
|
|
13
|
Gupta S, Neumeister V, McGuire J, Song YS,
Acs B, Ho K, Weidler J, Wong W, Rhees B, Bates M, et al:
Quantitative assessments and clinical outcomes in HER2 equivocal
2018 ASCO/CAP ISH group 4 breast cancer. NPJ Breast Cancer.
5:282019. View Article : Google Scholar : PubMed/NCBI
|
|
14
|
Díaz-Serrano A, Angulo B, Dominguez C,
Pazo-Cid R, Salud A, Jiménez-Fonseca P, Leon A, Galan MC, Alsina M,
Rivera F, et al: Genomic profiling of HER2-positive gastric cancer:
PI3K/Akt/mTOR pathway as predictor of outcomes in HER2-positive
advanced gastric cancer treated with trastuzumab. Oncologist.
23:1092–1102. 2018. View Article : Google Scholar : PubMed/NCBI
|
|
15
|
Jensen K, Krusenstjerna-Hafstrøm R, Lohse
J, Petersen KH and Derand H: A novel quantitative
immunohistochemistry method for precise protein measurements
directly in formalin-fixed, paraffin-embedded specimens: Analytical
performance measuring HER2. Mod Pathol. 30:180–193. 2017.
View Article : Google Scholar : PubMed/NCBI
|
|
16
|
Goddard KAB, Weinmann S, Richert-Boe K,
Chen C, Bulkley J and Wax C: HER2 evaluation and its impact on
breast cancer treatment decisions. Public Health Genomics. 15:1–10.
2011. View Article : Google Scholar : PubMed/NCBI
|
|
17
|
Wolff AC, Hammond MEH, Hicks DG, Dowsett
M, McShane LM, Allison KH, Allred DC, Bartlett JM, Bilous M,
Fitzgibbons P, et al: Recommendations for human epidermal growth
factor receptor 2 testing in breast cancer: American society of
clinical oncology/college of American pathologists clinical
practice guideline update. Arch Pathol Lab Med. 138:241–256. 2014.
View Article : Google Scholar : PubMed/NCBI
|
|
18
|
Fu R, Ma X, Bian Z and Ma J: Digital
separation of diaminobenzidine-stained tissues via an automatic
color-filtering for immunohistochemical quantification. Biomed Opt
Express. 6:544–558. 2015. View Article : Google Scholar : PubMed/NCBI
|
|
19
|
Morelli P, Porazzi E, Ruspini M and Banfi
G: Analysis of errors in histology by root cause analysis: A pilot
study. J Prev Med Hyg. 54:90–96. 2013.PubMed/NCBI
|
|
20
|
Qaiser T, Mukherjee A, Reddy Pb C,
Munugoti SD, Tallam V, Pitkäaho T, Lehtimäki T, Naughton T, Berseth
M, Pedraza A, et al: HER2 challenge contest: A detailed assessment
of automated HER2 scoring algorithms in whole slide images of
breast cancer tissues. Histopathology. 72:227–238. 2018. View Article : Google Scholar : PubMed/NCBI
|
|
21
|
Varghese F, Bukhari AB, Malhotra R and De
A: IHC profiler: An open source plugin for the quantitative
evaluation and automated scoring of immunohistochemistry images of
human tissue samples. PLoS One. 9:e968012014. View Article : Google Scholar : PubMed/NCBI
|
|
22
|
McCabe A, Dolled-Filhart M, Camp RL and
Rimm DL: Automated quantitative analysis (AQUA) of in situ protein
expression, antibody concentration, and prognosis. J Natl Cancer
Inst. 97:1808–1815. 2005. View Article : Google Scholar : PubMed/NCBI
|
|
23
|
Larson JS, Goodman LJ, Tan Y, Defazio-Eli
L, Paquet AC, Cook JW, Rivera A, Frankson K, Bose J, Chen L, et al:
Analytical validation of a highly quantitative, sensitive,
accurate, and reproducible assay (HERmark) for the measurement of
HER2 total protein and HER2 homodimers in FFPE breast cancer tumor
specimens. Patholog Res Int. 2010:8141762010.PubMed/NCBI
|
|
24
|
Zanconati F, Cusumano P, Tinterri C, Di
Napoli A, Lutke Holzik MF, Poulet B, Dekker L and Sapino A: P205
The 70-gene expression profile, Mammaprint, for breast cancer
patients in mainly European hospitals. Breast. 20:S452011.
View Article : Google Scholar
|
|
25
|
Cronin M, Sangli C, Liu ML, Pho M, Dutta
D, Nguyen A, Jeong J, Wu J, Langone KC and Watson D: Analytical
validation of the Oncotype DX genomic diagnostic test for
recurrence prognosis and therapeutic response prediction in
node-negative, estrogen receptor-positive breast cancer. Clin Chem.
53:1084–1091. 2007. View Article : Google Scholar : PubMed/NCBI
|
|
26
|
Nielsen TO, Parker JS, Leung S, Voduc D,
Ebbert M, Vickery T, Davies SR, Snider J, Stijleman IJ, Reed J, et
al: A comparison of PAM50 intrinsic subtyping with
immunohistochemistry and clinical prognostic factors in
tamoxifen-treated estrogen receptor-positive breast cancer. Clin
Cancer Res. 16:5222–5232. 2010. View Article : Google Scholar : PubMed/NCBI
|
|
27
|
Economic Comission for Latin America and
the Caribbean, . Plan for self-sufficiency in health matters in
Latin America and the Caribbean: Lines of action and proposals
(LC/TS.2021/115). United Nations Publication; 2021, [cited 2022 Jun
7]. Available from:. https://repositorio.cepal.org/bitstream/handle/11362/47253/1/S2100556_en.pdf
|
|
28
|
Hey T, Butler K, Jackson S and
Thiyagalingam J: Machine learning and big scientific data. Philos
Trans A Math Phys Eng Sci. 378:201900542020.PubMed/NCBI
|
|
29
|
Larmuseau M, Sluydts M, Theuwissen K,
Duprezd L, Dhaenec T and Cottenier S: Race against the machine: Can
deep learning recognize microstructures as well as the trained
human eye? Scr Mater. 193:33–37. 2021. View Article : Google Scholar
|
|
30
|
Shah P, Kendall F, Khozin S, Goosen R, Hu
J, Laramie J, Ringel M and Schork N: Artificial intelligence and
machine learning in clinical development: A translational
perspective. NPJ Digit Med. 2:692019. View Article : Google Scholar : PubMed/NCBI
|
|
31
|
Dong J and Dong J: A 19-miRNA support
vector machine classifier and a 6-miRNA risk score system designed
for ovarian cancer patients. Oncol Rep. 41:3233–3243.
2019.PubMed/NCBI
|
|
32
|
Esteva A, Kuprel B, Novoa RA, Ko J,
Swetter SM, Blau HM and Thrun S: Dermatologist-level classification
of skin cancer with deep neural networks. Nature. 542:115–118.
2017. View Article : Google Scholar : PubMed/NCBI
|
|
33
|
Elsharawy KA, Gerds TA, Rakha EA and
Dalton LW: Artificial intelligence grading of breast cancer: A
promising method to refine prognostic classification for management
precision. Histopathology. 79:187–199. 2021. View Article : Google Scholar : PubMed/NCBI
|
|
34
|
Trivizakis E, Ioannidis GS, Melissianos
VD, Papadakis GZ, Tsatsakis A, Spandidos DA and Marias K: A novel
deep learning architecture outperforming ‘off-the-shelf’ transfer
learning and feature-based methods in the automated assessment of
mammographic breast density. Oncol Rep. 42:2009–2015.
2019.PubMed/NCBI
|
|
35
|
Rajkomar A, Oren E, Chen K, Dai AM, Hajaj
N, Hardt M, Liu PJ, Liu X, Marcus J, Sun M, et al: Scalable and
accurate deep learning with electronic health records. NPJ Digit
Med. 1:182018. View Article : Google Scholar : PubMed/NCBI
|
|
36
|
Wilbur DC, Smith ML, Cornell LD,
Andryushkin A and Pettus JR: Automated identification of glomeruli
and synchronised review of special stains in renal biopsies by
machine learning and slide registration: A cross-institutional
study. Histopathology. 79:499–508. 2021. View Article : Google Scholar : PubMed/NCBI
|
|
37
|
Burrell J: How the machine ‘thinks’:
Understanding opacity in machine learning algorithms. Big Data Soc.
3:1–12. 2016. View Article : Google Scholar
|
|
38
|
Rashidi HH, Tran NK, Betts EV, Howell LP
and Green R: Artificial intelligence and machine learning in
pathology: The present landscape of supervised methods. Acad
Pathol. 6:23742895198730882019. View Article : Google Scholar : PubMed/NCBI
|
|
39
|
Ahmad A and Quegan S: Analysis of maximum
likelihood classification on multispectral data. Appl Math Sci.
6:6425–6436. 2012.
|
|
40
|
Adadi A and Berrada M: Peeking inside the
black-box: A survey on explainable artificial intelligence (XAI).
IEEE Access. 6:52138–52160. 2018. View Article : Google Scholar
|
|
41
|
Arrieta AB, Díaz-Rodríguez N, Del Ser J,
Bennetot A, Tabik S, Barbado A, Garciag S, Gil-Lopez S, Molina D,
Benjamins R, et al: Explainable artificial intelligence (XAI):
Concepts, taxonomies, opportunities and challenges toward
responsible AI. Inf Fusion. 58:82–115. 2020. View Article : Google Scholar
|
|
42
|
Tosun AB, Pullara F, Becich MJ, Taylor DL,
Fine JL and Chennubhotla SC: Explainable AI (xAI) for anatomic
pathology. Adv Anat Pathol. 27:241–250. 2020. View Article : Google Scholar : PubMed/NCBI
|
|
43
|
Goodman B and Flaxman S: European union
regulations on algorithmic decision-making and a ‘right to
explanation’. AI Mag. 38:50–57. 2017.
|
|
44
|
Huang G, Huang GB, Song S and You K:
Trends in extreme learning machines: A review. Neural Netw.
61:32–48. 2015. View Article : Google Scholar : PubMed/NCBI
|
|
45
|
Zinchuk V and Zinchuk O: Quantitative
colocalization analysis of confocal fluorescence microscopy images.
Curr Protoc Cell Biol. Chapter 4: Unit 4.19. 2008. View Article : Google Scholar : PubMed/NCBI
|
|
46
|
Fereidouni F, Bader AN and Gerritsen HC:
Spectral phasor analysis allows rapid and reliable unmixing of
fluorescence microscopy spectral images. Opt Express.
20:12729–12741. 2012. View Article : Google Scholar : PubMed/NCBI
|
|
47
|
Alberts B, Johnson A, Lewis J, Raff M,
Roberts K and Walter P: Looking at the structure of cells in the
microscope. molecular Biology of the cell. 4th edition. New York:
Garland Science; 2002
|
|
48
|
Moulisová V, Jiřík M, Schindler C,
Červenková L, Pálek R, Rosendorf J, Arlt J, Bolek L, Šůsová S,
Nietzsche S, et al: Novel morphological multi-scale evaluation
system for quality assessment of decellularized liver scaffolds. J
Tissue Eng. 11:20417314209211212020. View Article : Google Scholar : PubMed/NCBI
|
|
49
|
Aguilera A, Pezoa R and Rodríguez-Delherbe
A: A novel ensemble feature selection method for pixel-level
segmentation of HER2 overexpression. Complex Intell Syst.
8:5489–5510. 2022. View Article : Google Scholar
|
|
50
|
Taylor CR and Rudbeck L:
Immunohistochemical staining methods. Sixth Edition. Agilent
Technologies; Santa Clara, CA: pp. 22–76. 2021
|
|
51
|
Dabbs DJ: Diagnostic immunohistochemistry:
Theranostic and genomic applications. Sixth Edition. Elsevier;
Amsterdam: pp. 15–54. 2021, PubMed/NCBI
|
|
52
|
Lin F and Prichard J: Handbook of
Practical Immunohistochemistry. Second Edition. Springer; New York,
NY: pp. 220–224. 2015
|
|
53
|
Untch M, Harbeck N, Huober J, von
Minckwitz G, Gerber B, Kreipe HH, Liedtke C, Marschner N, Möbus V,
Scheithauer H, et al: Primary therapy of patients with early breast
cancer: Evidence, controversies, consensus. Geburtshilfe
Frauenheilkd. 75:556–565. 2015. View Article : Google Scholar : PubMed/NCBI
|
|
54
|
Harbeck N, Penault-Llorca F, Cortes J,
Gnant M, Houssami N, Poortmans P, Ruddy K, Tsang J and Cardoso F:
Breast cancer. Nat Rev Dis Primers. 5:662019. View Article : Google Scholar : PubMed/NCBI
|
|
55
|
Koboldt DC, Fulton RS, McLellan MD,
Schmidt H, Kalicki-Veizer J, McMichael JF, Fulton LL, Dooling DJ,
Ding L, Mardis ER, et al: Comprehensive molecular portraits of
human breast tumours. Nature. 490:61–70. 2012. View Article : Google Scholar : PubMed/NCBI
|
|
56
|
Hariri N, Roma AA, Hasteh F, Walavalkar V
and Fadare O: Phenotypic alterations in breast cancer associated
with neoadjuvant chemotherapy: A comparison with baseline rates of
change. Ann Diagn Pathol. 31:14–19. 2017. View Article : Google Scholar : PubMed/NCBI
|
|
57
|
Brasó-Maristany F, Griguolo G, Pascual T,
Paré L, Nuciforo P, Llombart-Cussac A, Bermejo B, Oliveira M,
Morales S, Martínez N, et al: Phenotypic changes of HER2-positive
breast cancer during and after dual HER2 blockade. Nat Commun.
11:3852020. View Article : Google Scholar : PubMed/NCBI
|
|
58
|
Powers DMW: Evaluation: From precision,
recall and F-measure to ROC, informedness, markedness and
correlation. arXiv:. 2010:160612020.
|
|
59
|
Sharma D, Kumar S and Narasimhan B:
Estrogen alpha receptor antagonists for the treatment of breast
cancer: A review. Chem Cent J. 12:1072018. View Article : Google Scholar : PubMed/NCBI
|
|
60
|
Favretto D, Cosmi E, Ragazzi E, Visentin
S, Tucci M, Fais P, Cecchetto G, Zanardo V, Viel G and Ferrara SD:
Cord blood metabolomic profiling in intrauterine growth
restriction. Anal Bioanal Chem. 402:1109–1121. 2012. View Article : Google Scholar : PubMed/NCBI
|
|
61
|
Lokhov PG, Dashtiev MI, Moshkovskii SA and
Archakov AI: Metabolite profiling of blood plasma of patients with
prostate cancer. Metabolomics. 6:156–163. 2010. View Article : Google Scholar
|
|
62
|
Ellin J, Haskvitz A, Premraj P, Shields K,
Smith M, Stratman C and Wrenn M: Interoperability between anatomic
pathology laboratory information systems and digital pathology
systems. Madison: Digital Pathology Association; pp. 1–10. 2011
|
|
63
|
Pathology and Tissue Imaging | MetaSystems
[Internet]. [cited 2020 Aug 10]. Available from. https://metasystems-international.com/us/applications/patho/
|
|
64
|
Patología digital, . Leica Biosystems
[Internet]. [cited 2020 Aug 10]. Available from:. https://www.leicabiosystems.com/es/patologia-digital/
|
|
65
|
Dunbier AK, Anderson H, Ghazoui Z, Salter
J, Parker JS, Perou CM, Smith IE and Dowsett M: Association between
breast cancer subtypes and response to neoadjuvant anastrozole.
Steroids. 76:736–740. 2011. View Article : Google Scholar : PubMed/NCBI
|
|
66
|
Becker S: A historic and scientific review
of breast cancer: The next global healthcare challenge. Int J
Gynecol Obstet. 131 (Suppl 1):S36–S39. 2015. View Article : Google Scholar : PubMed/NCBI
|
|
67
|
Planes-Laine G, Rochigneux P, Bertucci F,
Chrétien AS, Viens P, Sabatier R and Gonçalves A: PD-1/PD-l1
targeting in breast cancer: The first clinical evidences are
emerging. A literature review. Cancers (Basel). 11:10332019.
View Article : Google Scholar : PubMed/NCBI
|
|
68
|
Lozano C, Córdova C, Marchant I, Zúñiga R,
Ochova P, Ramírez-Barrantes R, González-Arriagada WA, Rodriguez B
and Olivero P: Intracellular aggregated TRPV1 is associated with
lower survival in breast cancer patients. Breast Cancer (Dove Med
Press). 10:161–168. 2018.PubMed/NCBI
|
|
69
|
Campbell KJ, Dhayade S, Ferrari N, Sims
AH, Johnson E, Mason SM, Dickson A, Ryan KM, Kalna G, Edwards J, et
al: MCL-1 is a prognostic indicator and drug target in breast
cancer. Cell Death Dis. 9:192018. View Article : Google Scholar : PubMed/NCBI
|
|
70
|
Zhang Y, Zheng A, Lu H, Jin Z, Peng Z and
Jin F: The expression and prognostic significance of claudin-8 and
androgen receptor in breast cancer. Onco Targets Ther.
13:3437–3448. 2020. View Article : Google Scholar : PubMed/NCBI
|
|
71
|
Nanda R, Liu MC, Yau C, Shatsky R, Pusztai
L, Wallace A, Chien AJ, Forero-Torres A, Ellis E, Han H, et al:
Effect of pembrolizumab plus neoadjuvant chemotherapy on pathologic
complete response in women with early-stage breast cancer: An
analysis of the ongoing phase 2 adaptively randomized I-SPY2 trial.
JAMA Oncol. 6:676–684. 2020. View Article : Google Scholar : PubMed/NCBI
|