Introduction
Esophageal cancer ranks sixth in cancer deaths, with
an estimated 572,000 new cases and 509,000 deaths yearly worldwide
(1). Several studies have shown
that preoperative chemotherapy with cisplatin and 5-fluorouracil
(CF) followed by surgical resection improves survival from
esophageal squamous cell carcinoma (ESCC) (2–4) and
that combination chemotherapy comprising docetaxel, cisplatin, and
5-fluorouracil (DCF) or Adriamycin, cisplatin, and 5-fluorouracil
(ACF) provides better outcomes compared to CF (5–8).
Current evidence has revealed that inflammation is a
critical component of tumor progression (9). Failure in controlling the immune
system could therefore promote tumor progression. Tumor cells and
its surrounding microenvironment promote a systemic inflammatory
response that alter circulating neutrophil and lymphocyte counts.
Accordingly, recent studies have revealed the
neutrophil-to-lymphocyte ratio (NLR), one of the easily calculated
marker of systemic inflammation (10), can be a potential prognostic
biomarker in various solid tumors (11–15),
with most studies agreeing with the correlation between an increase
in the NLR and worse prognosis.
The triplet regimens, ACF and DCF, have shown
promise for ESCC, exhibiting higher response rates but more
frequent severe hematological toxicities compared to conventional
CF, with DCF and ACF achieving histopathological tumor response
rates of 42 and 18%, respectively (5). Furthermore, Grade 3/4 leukopenia and
neutropenia were observed in 72.5 and 90% of patients receiving
DCF, respectively (16). Although
these findings suggest that the tumor and its surrounding
microenvironment change dramatically during chemotherapy (17), it remains unclear whether NLR
changes before and after chemotherapy. Recently, Hoshino et
al reported NLR change, which was calculated NLR after NAC/NLR
before NAC, was identified as a significant prognosis predictor
(18). In this previous study, 209
patients who underwent NAC followed by thoracic esophagectomy for
esophageal cancer were enrolled, DCF was performed 35 (16.7%)
patients. The patients with NLR change below 0.55 had a
significantly better Overall survival (OS) and recurrence-free
survival (RFS) than those with NLR change above 0.55. However, no
consensus has been reached regarding which NLR value (i.e., before
or after chemotherapy) could better predict prognosis.
Up to our knowledge, the present study firstly aimed
to analyze changes in NLR during triplet chemotherapy and surgical
intervention in 338 consecutive ESCC patients and to determine
whether the NLR upon starting neoadjuvant chemotherapy (NAC)
(pre-NLR) or that upon subsequent esophagectomy (post-NLR) would be
a better prognostic factor.
Materials and methods
Patients
This retrospective analysis included data from 441
consecutive patients who were histologically diagnosed with primary
thoracic ESCC and underwent esophagectomy at Osaka University
Hospital between 2010 and 2016. The present report analyzed 338
patients retrospectively after excluding patients who satisfied the
following criteria: i) Had previous or other concomitant cancers,
ii) did not receive NAC, ii) received neoadjuvant radiotherapy, iv)
received noncurative resection, and v) incomplete or inexhaustive
follow-up data. All clinicopathological data were retrieved from
medical records at Osaka University Hospital. The clinicopathologic
findings were classified according to the UICC-TNM Classification,
seventh edition (19).
Calculation of pre- and post-NLR
NLR was calculated as the ratio of the number of
neutrophils to the number of lymphocytes collected in a blood test.
Each patient underwent NLR counting twice (i.e., before and after
NAC). Pre- and post-NLR were calculated in 1–7 days before starting
NAC and subsequently after esophagectomy, respectively.
Outcomes
OS and RFS were evaluated. OS was calculated from
the date of surgery until an event or last known date of follow-up,
whereas RFS was calculated from the date of surgery until a
recurrence event, death, or last known date of follow-up, whichever
occurred first. Moreover, clinical and histopathological responses
were assessed. Clinical response was evaluated through computed
tomography (CT) and esophagoscopy based on the criteria of Japan
Esophageal Society (19). Briefly,
complete response (CR) was defined as the complete disappearance of
all evidence of the tumor, including negative biopsy results;
partial response (PR) was defined as a ≥50% decrease; sTable
disease was defined as a <50% reduction and <25% increase;
and progressive disease was defined as a ≥25% increase. Responses
were determined after NAC. Histopathological tumor response was
evaluated according to the histological criteria of the Japanese
Esophageal Society (20) and was
classified into five categories according to the proportion of
tumor degeneration and necrosis: Grade 3 (markedly effective; no
viable cancer cells); grade 2 (moderately effective; viable cancer
cells accounting for less than 1/3 of tumor tissue, while other
cancer cells showed severe degeneration or necrosis); grade 1
(slightly effective; apparently viable cancer cells accounting for
1/3 or more of tumor tissue, but some evidence of degenerating
cancer tissue or cells was present), and grade 0 (ineffective;
denoting no discernible therapeutic effect on cancer tissue or
cells). Grade 1 lesions can also be subclassified into grade 1a
(viable cancer cells accounting for 2/3 or more of tumor tissue)
and grade 1b (viable cancer cells accounting for 1/3 or more, but
less than 2/3, of tumor tissue). Furthermore, hematological
toxicities occurring after triplet chemotherapy were determined
according to the Common Terminology Criteria for Adverse Events
(CTCAE) (21).
Treatment
All patients included in the present study were
treated with two or three cycles of NAC, ACF, or DCF. ACF
chemotherapy consisted of Adriamycin 35 mg/m2 and
cisplatin 70 mg/m2 on day 1 and 5-FU 700
mg/m2/day on days 1–7 every 4 weeks (22). DCF chemotherapy consisted of
docetaxel 70 mg/m2 and cisplatin 70 mg/m2 on
day 1 and 5-FU 700 mg/m2/day on days 1–5 every 3 weeks
(5–8). Our standard procedure was subtotal
esophagectomy performed via a right thoracotomy or video-assisted
thoracoscopic surgery with two- or three-field lymphadenectomy
(23,24).
Patient follow-up
Patients who undergo esophagectomy at our
institution were followed up through tumor markers and CT scan
every 3 months during the first 2 years and every 4–6 months for
the next 3 years, and annually after 5 years (23,25).
Upper gastrointestinal endoscopy was also performed once a year,
with PET-CT being performed as necessary. The last follow-up was in
December 2019, which included verification of the clinical
records.
Statistical analysis
Categorical and continuous data were compared using
the χ2 test and the Mann-Whitney U test, respectively.
Cutoff values were determined using the receiver operating
characteristic (ROC) curve. A matched pairs t-test was used to
determine significant differences between pre- and post-NLR. The
Kaplan-Meier method was used to estimate OS and RFS after surgery,
while the generalized Wilcoxon test was used to compare the groups
and assess prognostic values. Multivariate analyses using Cox
regression modeling and logistic regression with variables having
P-values less than 0.1 were performed. The statistical significance
of each model was set at P<0.05. All statistical analyses were
performed using JMP Pro ver 14.0.0.
Results
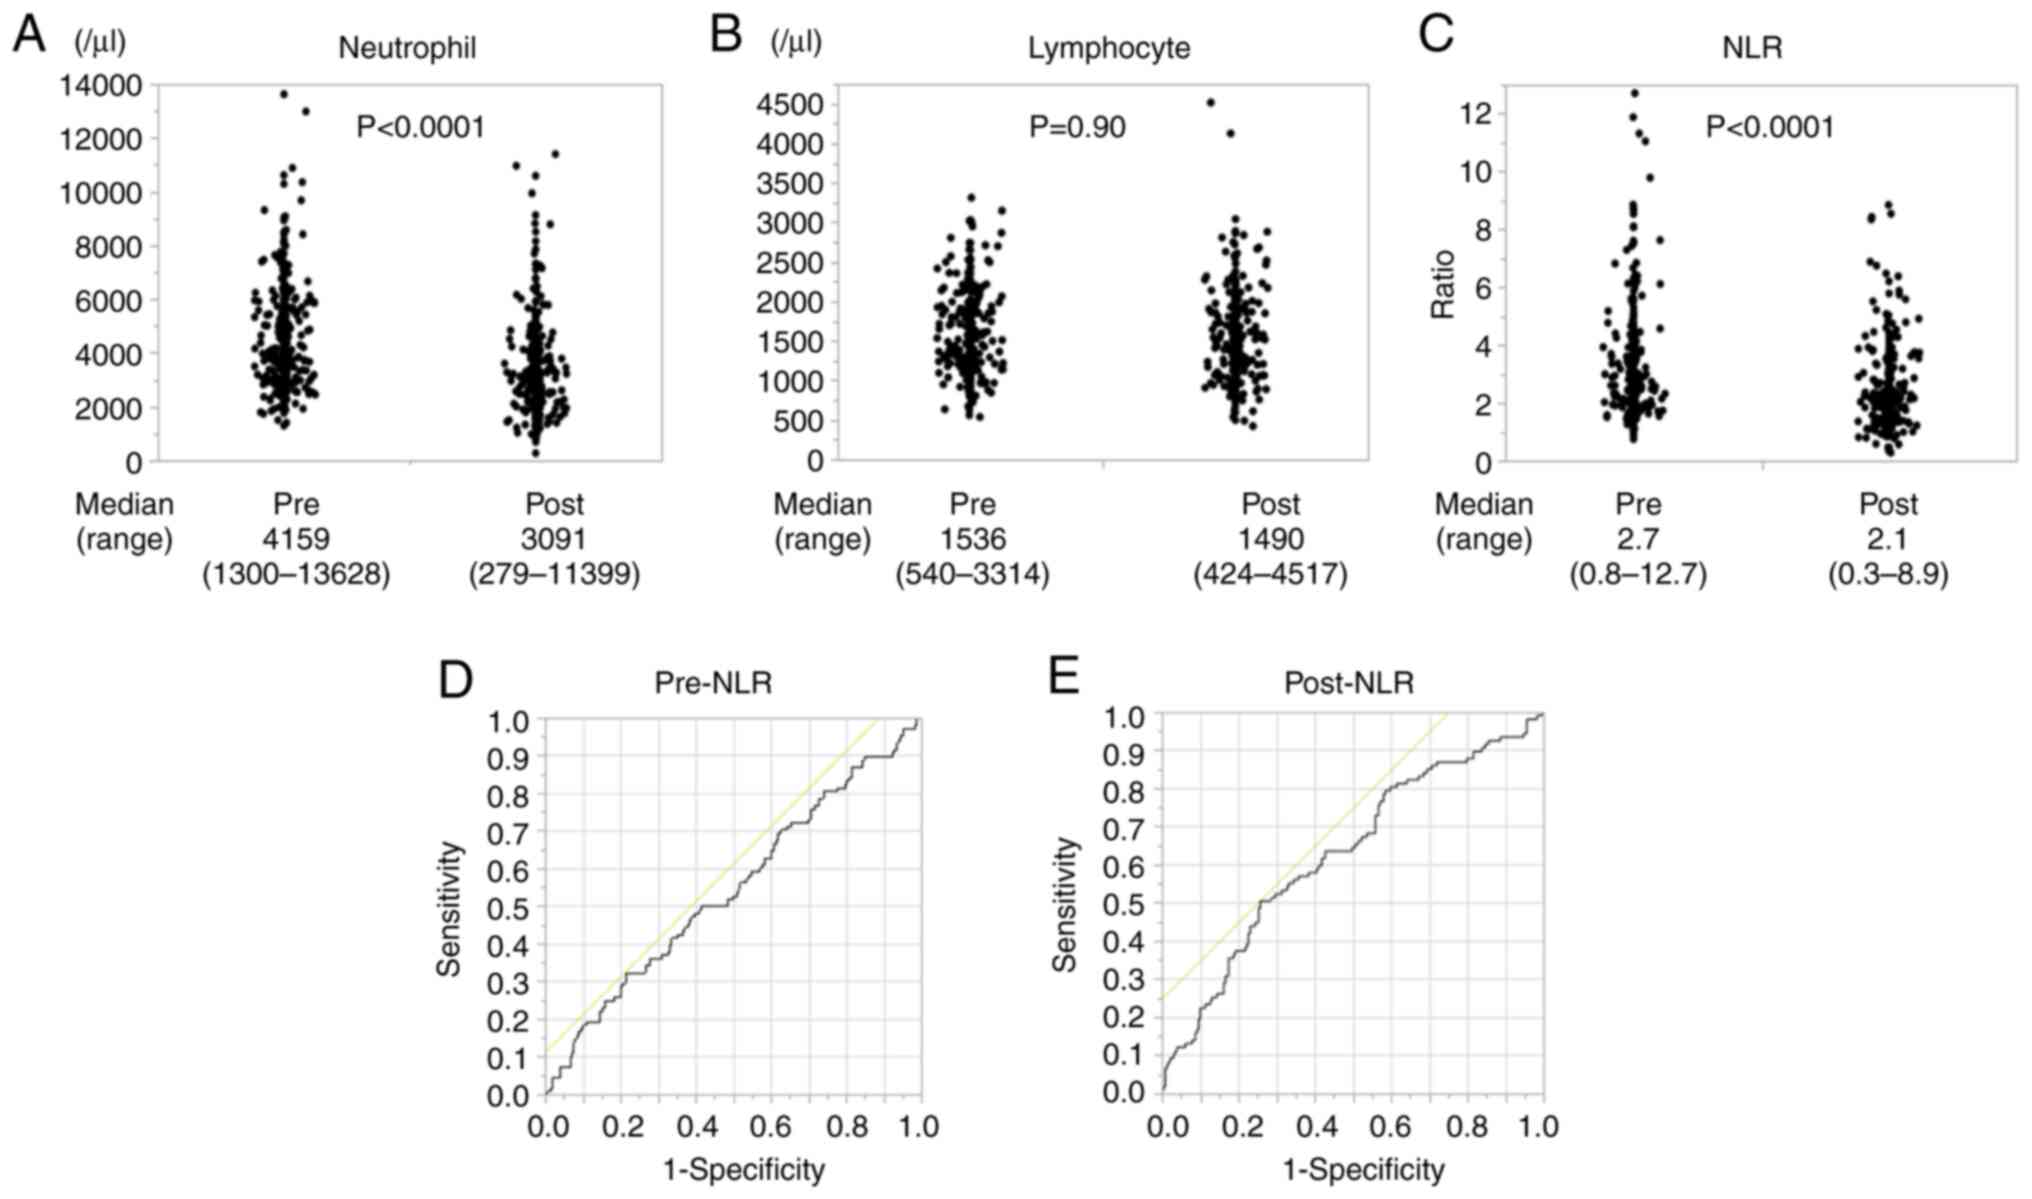
Numerical data for pre- and
post-NLR
While neutrophil count significantly decreased after
NAC (Fig. 1A), no change in
lymphocyte count was noted (Fig.
1B). Post-NLR was significantly lower than pre-NLR 2.1
(0.3-19.2) vs. 2.7 (0.8-12.7); P<0.0001; Fig. 1C). A comparison of matched pairs of
pre- and post-NLR also showed that NLR decreased significantly
after chemotherapy (P<0.0001).
Optimal cutoff values for pre- and
post-NLR
To evaluate which NLR was a better biomarker, cutoff
values for pre- and post-NLR were set based on the ROC.
Accordingly, pre-NLR had a cutoff value of 3.7, which discriminated
between survival and death 3 years after operation, with an area
under the curve of 0.54662 and a sensitivity and specificity of
78.7 and 32.4%, respectively (Fig.
1D). Post-NLR had a cutoff value of 2.5, with an area under the
curve of 0.63255 and a sensitivity and specificity of 51.0 and
74.3%, respectively (Fig. 1E). We
also analyzed the ROC which discriminated between clinical response
PR-CR and PD-SD. Accordingly, pre-NLR had a cutoff value of 5.5
with an area under the curve of 0.48864 and a sensitivity and
specificity of 94.1 and 12.5%, respectively. Post-NLR had a cutoff
value of 2.5, with an area under the curve of 0.56634 and a
sensitivity and specificity of 47.1 and 70.4%, respectively
(Fig. S1A and B). Considering
these separate analyses, we set the optimal cut off value at 3.7
for pre-NLR and 2.5 for post-NLR which were determined by the ROC
curve of survival and death 3 years after operation for two
reasons. Firstly, the ROC curve of survival and death 3 years after
operation had better sensitivity and specificity than that of
clinical response PR-CR and PD-SD. Secondly, the NLR cutoff values
generally ranged from 2 to 5 (26).
Characteristics of patients
A total of 338 patients were included in this study.
Based on the cutoff value, 87 (26%) and 251 patients (74%) were
assigned to low and high pre-NLR group, while 111 (33%) and 227
(67%) were assigned to low and high post-NLR group, respectively.
Table I compares the clinical
characteristics between both pre- and post-NLR groups. Accordingly,
the high groups had lower BMI, higher neutrophil count, and lower
lymphocyte count compared to the low groups. Both pre- and post-NLR
were not significantly correlated with age, gender, cStage and
American Society of Anesthesiologists physical status. Among the
338 patients, 259 (77%) received DCF, while 79 (23%) received ACF
as NAC, with almost the same rates observed in pre- and
post-NLR.
 | Table I.Patient and tumor characteristics,
based on pre- and post-NLR. |
Table I.
Patient and tumor characteristics,
based on pre- and post-NLR.
|
| Pre-NLR | Post-NLR |
|---|
|
|
|
|
|---|
| Characteristic | High (n=87) | Low (n=251) | P-value | High (n=111) | Low (n=227) | P-value |
|---|
| Age, years |
|
| 0.18 |
|
| 0.07 |
| Median
(range) | 69 (35–82) | 67 (38–83) |
| 67 (35–83) | 69 (38–82) |
|
| Sex |
|
| 0.06 |
|
| 0.10 |
|
Male | 82 | 217 |
| 103 | 195 |
|
|
Female | 5 | 34 |
|
8 | 31 |
|
| Ethnicity |
|
|
|
|
|
|
|
Asian | 87 | 251 |
| 111 | 227 |
|
|
Others | 0 |
0 |
|
0 |
0 |
|
| BMI,
kg/m2 |
|
| 0.04 |
|
| 0.04 |
| Median
(range) | 20.0
(15.0-28.8) | 21.3
(14.8-29.7) |
| 20.5
(14.9-29.7) | 21.3
(14.8-28.7) |
|
| Location |
|
| 0.38 |
|
| 0.77 |
| Ut | 13 | 49 |
| 18 | 44 |
|
| Mt | 46 | 112 |
| 53 | 105 |
|
| Lt | 28 | 90 |
| 40 | 78 |
|
| Histology |
|
| 0.86 |
|
| 0.91 |
|
Poor | 6 | 16 |
| 7 | 15 |
|
|
Well/moderate | 81 | 235 |
| 104 | 212 |
|
| cT a |
|
| 0.31 |
|
| 0.78 |
| 1 | 1 | 18 |
| 6 | 13 |
|
| 2 | 10 | 57 |
| 15 | 52 |
|
| 3 | 56 | 147 |
| 75 | 128 |
|
| 4 | 20 | 29 |
| 15 | 34 |
|
| cN a |
|
| 0.18 |
|
| 0.79 |
| 0 | 24 | 60 |
| 23 | 61 |
|
| 1 | 42 | 140 |
| 65 | 117 |
|
| 2 | 21 | 45 |
| 21 | 45 |
|
| 3 | 0 |
6 |
| 2 |
4 |
|
| cM a |
|
| 0.76 |
|
| 0.75 |
| 0 | 11 | 35 |
| 95 | 197 |
|
| 1 | 76 | 216 |
| 16 | 30 |
|
| cStage
a |
|
| 0.10 |
|
| 0.53 |
| I | 4 | 34 |
| 9 | 29 |
|
| II | 18 | 52 |
| 21 | 49 |
|
|
III | 54 | 129 |
| 65 | 118 |
|
| IV | 11 | 36 |
| 16 | 31 |
|
| WBCs, µl |
|
| <0.0001 |
|
| <0.0001 |
| Median
(range) | 8,130 | 5,930 |
| 6,130 | 4,880 |
|
|
| (4,210–16,840) | (2,590–13,810) |
| (2,720–13,750) | (1,140–10,800) |
|
| Neutrophils,
µl |
|
| <0.0001 |
|
| <0.0001 |
| Median
(range) | 6,132 | 3,704 |
| 4,141 | 2,631 |
|
|
| (3,198–13,628) | (1,300–9,087) |
| (1,778–11,399) | (279–6,405) |
|
| Lymphocytes,
µl |
|
| <0.0001 |
|
| <0.0001 |
| Median
(range) | 1,169 | 1,698 |
| 1,212 | 1,601 |
|
|
| (540–2,360) | (729–3,314) |
| (424–2,142) | (670–4,517) |
|
| ASA PS |
|
| 0.37 |
|
| 0.25 |
| 1 | 11 | 40 |
| 18 | 33 |
|
| 2 | 69 | 200 |
| 84 | 185 |
|
| 3 | 7 | 11 |
| 9 |
9 |
|
| Preoperative
chemotherapy |
|
| 0.77 |
|
| 0.78 |
|
DCF | 68 | 191 |
| 84 | 175 |
|
|
ACF | 19 | 60 |
| 27 | 52 |
|
Hematological toxicities
To determine how chemotherapy directly influenced
change in peripheral leukocyte count and evaluate its correlation
with NLR, hematological toxicities were compared between low and
high pre- and post-NLR groups (Table
II). Interestingly, the high group had a significantly higher
incidence of grade 3/4 lymphopenia than the low group in both
pre-NLR (44% vs. 27%; P=0.0073) and post-NLR (49% vs. 23%;
P<0.0001), whereas no difference in the incidence of neutropenia
was noted (pre-NLR: 91% vs. 92%; P=0.65 and post-NLR: 91% vs. 92%;
P=1.0). Furthermore, the high pre-NLR group had a significantly
higher incidence of anemia than the low group (16% vs. 8%; P=0.04).
Aa similar tendency, albeit not significant, was observed in the
post-NLR group (14% vs. 8%; P=0.08). No differences in frequencies
of other hematological toxicities, such as leukopenia (pre-NLR: 86%
vs. 82%; P=0.41, post-NLR: 87% vs. 81%; P=0.17), febrile
neutropenia (pre-NLR: 47% vs. 48%; P=0.12, post-NLR: 50% vs. 47%;
P=0.73), and thrombocytopenia (pre-NLR: 2% vs. 7%; P=0.90,
post-NLR: 9% vs. 4%; P=0.14) were observed.
| Table II.Hematological toxicities NCI-CTC
grade 3/4. |
Table II.
Hematological toxicities NCI-CTC
grade 3/4.
|
| Pre-NLR | Post-NLR |
|---|
|
|
|
|
|---|
| Parameter | High (n=87), n
(%) | Low (n=251), n
(%) | P-value | High (n=111), n
(%) | Low (n=227), n
(%) | P-value |
|---|
| Leukopenia | 75 (86) | 206 (82) | 0.41 | 97 (87) | 184 (81) | 0.17 |
| Neutropenia | 79 (91) | 232 (92) | 0.65 | 102 (92) | 209 (92) | 1.0 |
| Lymphopenia | 38 (44) | 69 (27) | 0.0073 | 54 (49) | 53 (23) | <.0001 |
| Anemia | 14 (16) | 20 (8) | 0.04 | 16 (14) | 18 (8) | 0.08 |
|
Thrombocytopenia | 2 (2) | 18 (7) | 0.12 | 10 (9) | 10 (4) | 0.14 |
| Febrile
neutropenia | 41 (47) | 121 (48) | 0.90 | 55 (50) | 107 (47) | 0.73 |
Clinical and histopathological
response
With regard to clinical response to NAC, 67 (77%)
and 203 (81%) achieved PR or CR in the high and low pre-NLR group,
respectively (Table III). No
significant relationship was observed between clinical response and
pre-NLR (P=0.44). On the other hand, 190 (83%) and 80 (72%)
patients showed PR or CR in the low and high post-NLR,
respectively. Patients with high post-NLR had significantly worse
clinical response (P=0.01). Similarly, no significant relationship
was observed between histopathological response rate and pre- or
post-NLR.
| Table III.Clinical response and
histopathological response rate. |
Table III.
Clinical response and
histopathological response rate.
|
| Pre-NLR | Post-NLR |
|---|
|
|
|
|
|---|
| Parameter | High (n=87) | Low (n=251) | P-value | High (n=111) | Low (n=227) | P-value |
|---|
| Clinical
response |
|
| 0.44 |
|
| 0.01 |
|
PD/SD | 20 | 48 |
| 31 | 37 |
|
|
PR/CR | 67 | 203 |
| 80 | 190 |
|
| Pathological
response |
|
| 0.31 |
|
| 0.15 |
| Grade
0/1b | 58 | 151 |
| 75 | 134 |
|
| Grade
2 | 29 | 100 |
| 36 | 93 |
|
| pTa |
|
| 0.38 |
|
| 0.28 |
| 0 | 7 | 31 |
| 10 | 28 |
|
| 1 | 16 | 70 |
| 22 | 64 |
|
| 2 | 18 | 47 |
| 20 | 45 |
|
| 3 | 45 | 102 |
| 58 | 89 |
|
| 4 | 1 | 1 |
| 1 | 1 |
|
| pNa |
|
| 0.91 |
|
| 0.31 |
| 0 | 32 | 103 |
| 41 | 94 |
|
| 1 | 28 | 77 |
| 42 | 63 |
|
| 2 | 18 | 46 |
| 18 | 46 |
|
| 3 | 9 | 25 |
| 10 | 24 |
|
| pM a |
|
| 0.12 |
|
| 0.22 |
| 0 | 82 | 222 |
| 103 | 201 |
|
| 1 | 5 | 29 |
| 8 | 26 |
|
| pStagea |
|
| 0.11 |
|
| 0.40 |
| 0 | 5 | 27 |
| 9 | 23 |
|
| I | 16 | 55 |
| 20 | 51 |
|
| II | 20 | 54 |
| 26 | 48 |
|
|
III | 41 | 86 |
| 48 | 79 |
|
| IV | 5 | 29 |
| 8 | 26 |
|
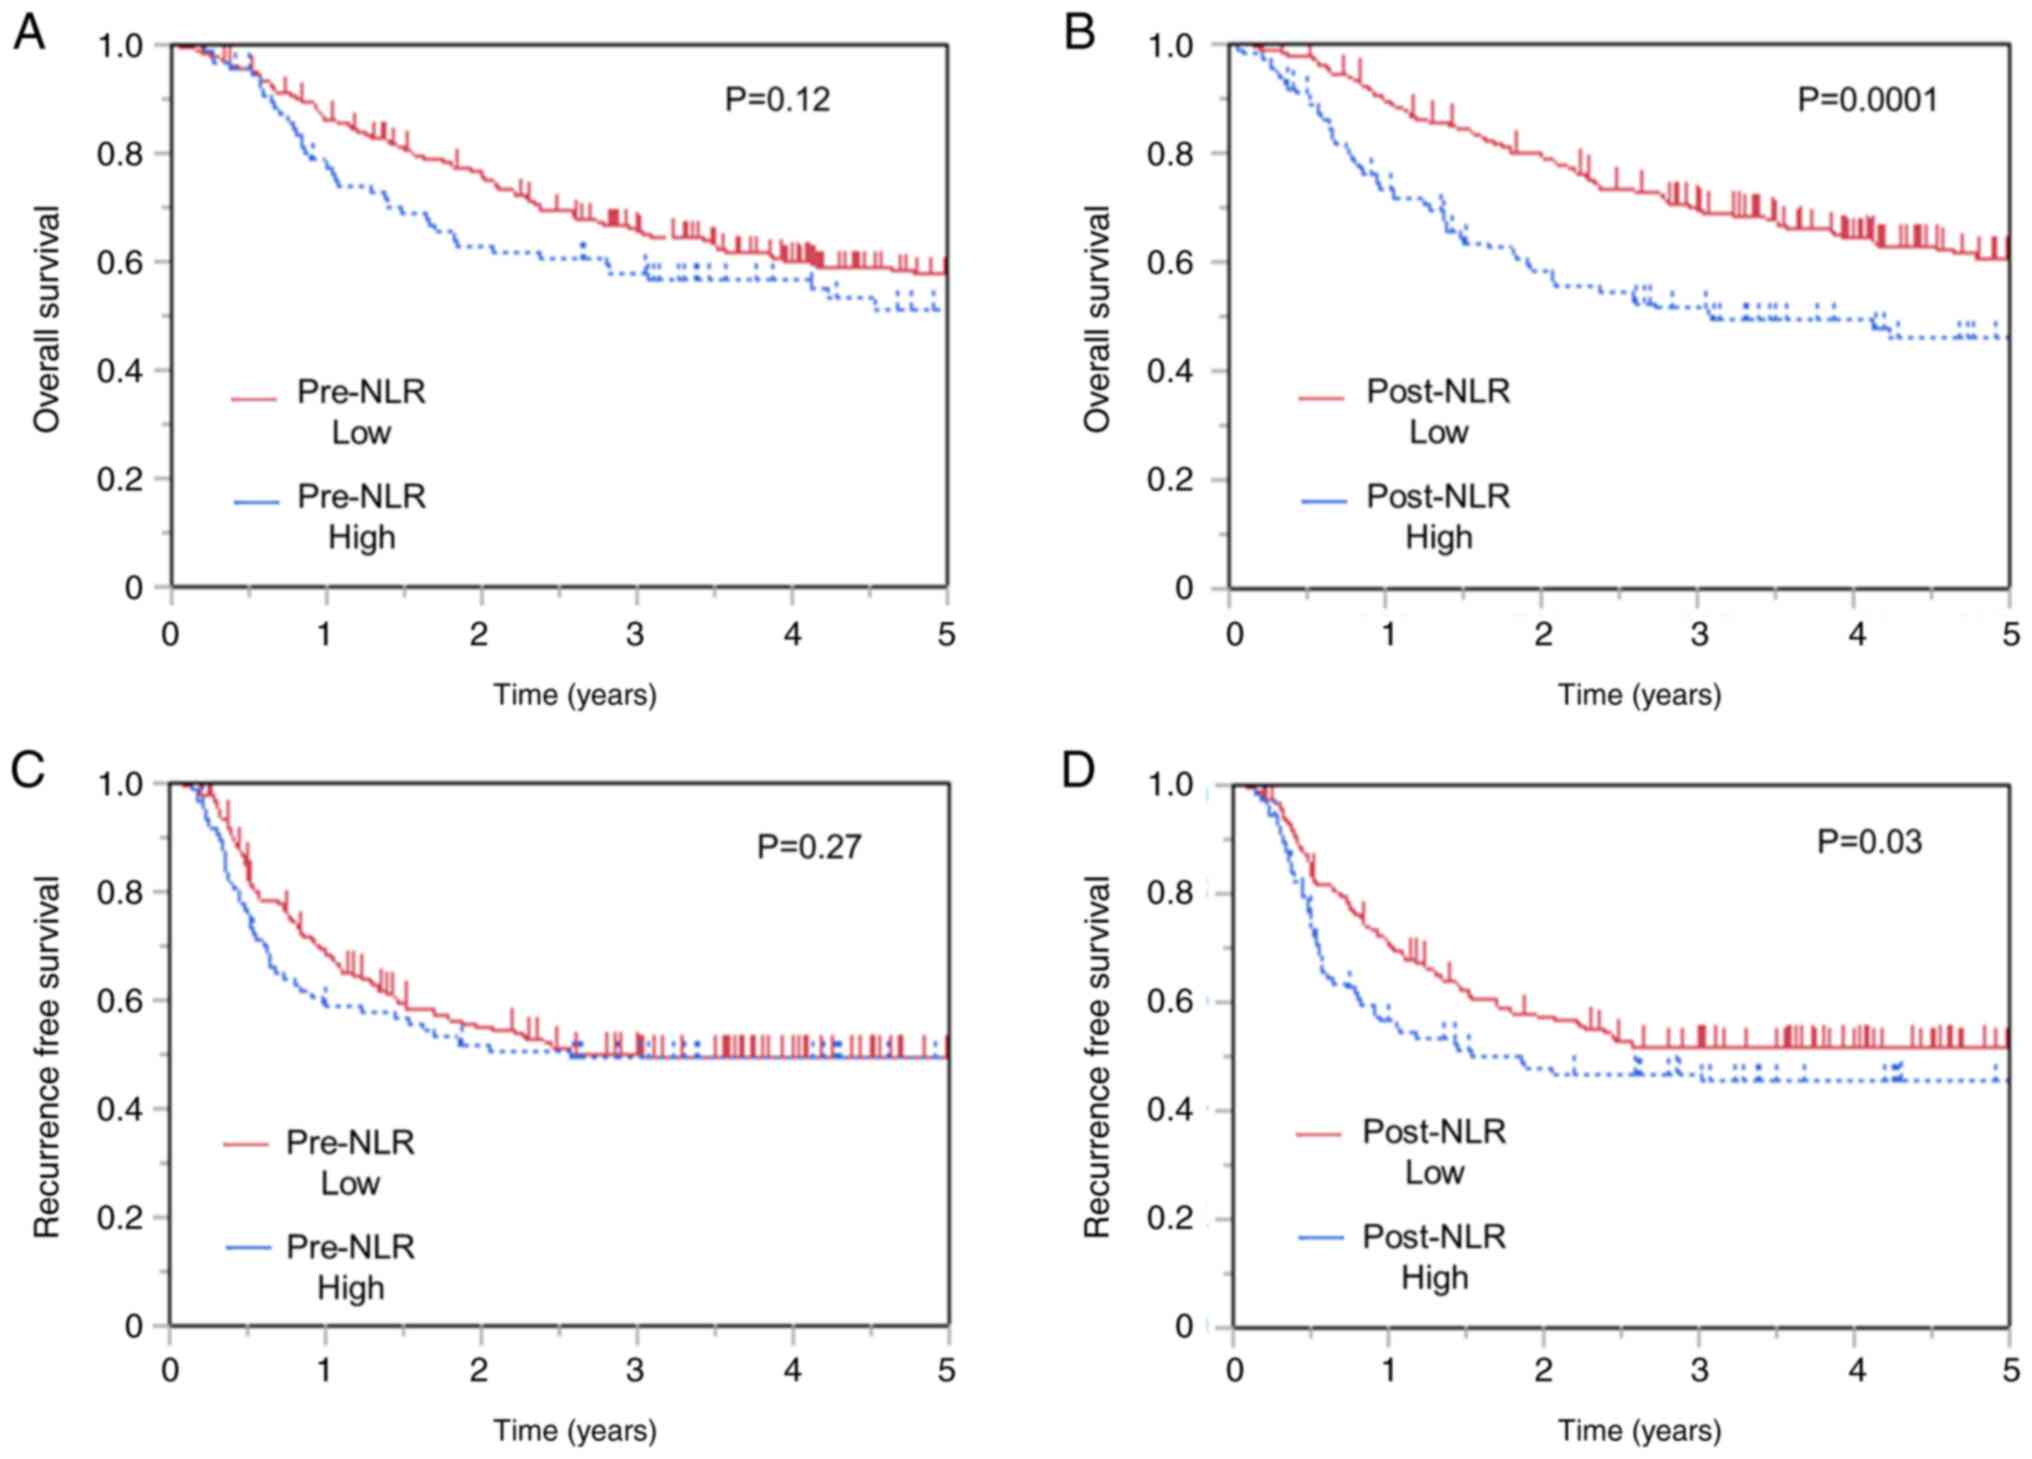
Overall and recurrence-free
survival
The 3-year OS rates were 58.0 and 66.1% in patients
with high and low pre-NLR, respectively. No difference in OS was
observed between patients with low and high pre-NLR (P=0.12;
Fig. 2A). On the other hand,
patients with high post-NLR showed worse OS (Fig. 2B) than those with low post-NLR
(P=0.0001), with the 3-year OS of 51.4 and 70.1% in patients with
high and low post-NLR patients, respectively. Moreover, no
difference in RFS was observed between patients with low and high
pre-NLR (P=0.27) (Fig. 2C),
whereas those with high post-NLR showed worse RFS than those with
low post-NLR (Fig. 2D). The 3-year
RFS rates were 46.9 and 51.4% in patients with high and low
post-NLR, respectively (P=0.03). Similarly, no difference in RFS
was observed between patients with low and high pre-NLR
(P=0.27).
Univariate analysis identified pT (3-4/0-2,
P<0.0001), pN (1–3/0, P<0.0001), pM stage (1/0, P=0.02),
clinical response (PD-SD/PR-CR, P<0.0001), pathological response
(Grade 0-Ib/II, P<0.0001), and post-NLR (≥2.5/<2.5, P=0.0007)
as significant factors for OS (Table
IV). To determine independent prognostic factors for OS, a
multivariate Cox proportional hazards model was performed with
variables having P-values of less than 0.1 during univariate
analysis. Accordingly, multivariate analysis identified high
post-NLR (HR 1.62, 95% CI 1.14-2.28; P=0.008) as independent
prognostic factor, along with advanced pN stage (HR 2.34, 95% CI
1.53-3.65; P<0.0001) and worse clinical response (HR 1.70, 95%
CI 1.12-2.51; P=0.01).
| Table IV.Univariate and multivariate analysis
of overall survival. |
Table IV.
Univariate and multivariate analysis
of overall survival.
|
| Univariate
analysis | Multivariate
analysis |
|---|
|
|
|
|
|---|
| Variable | HR (95% CI) | P-value | HR (95% CI) | P-value |
|---|
| Sex,
male/female | 1.02
(0.62-1.83) | 0.92 |
|
|
| Age,
≥75/<75 | 1.26
(0.81-1.88) | 0.29 |
|
|
| BMI,
<18.5/≥18.5 | 1.58
(0.99-2.42) | 0.06 | 1.03
(0.63-1.62) | 0.90 |
| Location,
Ut/Mt-Lt | 1.16
(0.75-1.73) | 0.50 |
|
|
| Histology,
poor/well or moderate | 1.00
(0.49-1.81) | 1.00 |
|
|
| Preoperative
chemotherapy, DCF/ACF | 0.77
(0.54-1.12) | 0.17 | 0.89
(0.61-1.32) | 0.56 |
| pT,
3-4/0-2a | 2.47
(1.78-3.47) | <0.0001 | 1.29
(0.84-1.98) | 0.25 |
| pN,
1-3/0a | 3.17
(2.17-4.76) | <0.0001 | 2.34
(1.53-3.65) | <.0001 |
| pM,
1/0a | 1.68
(1.08-2.53) | 0.02 | 1.49
(0.88-2.40) | 0.13 |
| Pre-NLR,
≥3.7/<3.7 | 1.25
(0.86-1.78) | 0.23 |
|
|
| Post-NLR,
≥2.5/<2.5 | 1.81
(1.29-2.52) | 0.0007 | 1.62
(1.14-2.28) | 0.008 |
| Clinical response,
PD-SD/PR-CR | 2.32
(1.61-3.27) | <0.0001 | 1.70
(1.12-2.51) | 0.01 |
| Pathological
response, Grade 0-1b/2 | 2.71
(1.85-4.08) | <0.0001 | 1.36
(0.83-2.24) | 0.22 |
Independent factors for high
post-NLR
Univariate analysis identified age (≥75/<75,
P=0.0015), BMI (<18.5/≥18.5, P=0.0006), pre-neutrocyte counts
(≥6,000/µl/<6,000/µl, P=0.0011), pre-lymphocyte counts
(≥1,500/µl/<1,500/µl), P<0.0001), and clinical response
(PD-SD/PR-CR, P=0.014) as significant factors for higher post-NLR
(Table V). Multivariate logistic
regression was then performed using variables having P-values than
0.1 during univariate analysis. Interestingly, higher age (OR 2.36,
95% CI 1.22-4.55; P=0.01), lower BMI (OR 2.51, 95% CI 1.23-5.11;
P=0.01), higher pre-neutrocyte counts (OR 3.57, 95% CI 1.87-6.84;
P=0.0001), lower pre-lymphocyte counts (OR 0.38, 95% CI 0.22-0.66;
P=0.0006), and lymphopenia (OR 2.90, 95% CI 1.64-5.10; P=0.0002)
were identified as independent factors for high post-NLR.
| Table V.Univariate and multivariate analysis
of post-NLR. |
Table V.
Univariate and multivariate analysis
of post-NLR.
|
| Univariate
analysis | Multivariate
analysis |
|---|
|
|
|
|
|---|
| Variable | HR (95% CI) | P-value | HR (95% CI) | P-value |
|---|
| Sex,
male/female | 2.0
(0.90-4.59) | 0.10 |
|
|
| Age,
≥75/<75 | 2.54
(1.45-4.48) | 0.0015 | 2.36
(1.22-4.55) | 0.01 |
| BMI,
<18.5/≥18.5 | 3.16
(1.68-5.98) | 0.0006 | 2.51
(1.23-5.11) | 0.01 |
| Preoperative
chemotherapy, DCF/ACF | 0.92
(0.54-1.57) | 0.79 | 0.81
(0.43-1.53) | 0.51 |
| pT,
3-4/0-2a | 1.73
(1.09-2.73) | 0.02 | 1.25
(0.68-2.32) | 0.28 |
| pN,
1-3/0a | 1.2
(0.76-1.93) | 0.48 | 1.05
(0.59-1.89) | 0.71 |
| pM,
1/0a | 0.60
(0.26-1.37) | 0.25 |
|
|
| Pre-neutrocyte,
≥6,000/µl/<6,000/µl | 2.58
(1.48-4.48) | 0.0011 | 3.57
(1.87-6.84) | 0.0001 |
| Pre-lymphocytes,
≥1,500/µl/<1,500/µl | 0.30
(0.19-0.49) | <0.0001 | 0.38
(0.22-0.66) | 0.0006 |
| Neutropenia, Grade
3-4/1-2 | 0.98
(0.42-2.25) | 1.0 |
|
|
| Lymphopenia, Grade
3-4/1-2 | 3.10
(1.92-5.04) | <0.0001 | 2.90
(1.64-5.10) | 0.0002 |
| Anemia,
Grade3-4/1-2 | 1.96
(0.96-4.00) | 0.07 | 0.90
(0.38-2.16) | 0.82 |
| Clinical response,
PD-SD/PR-CR | 0.50
(0.29-0.87) | 0.014 | 0.55
(0.27-1.07) | 0.07 |
| Pathological
response, Grade 0-1b/2 | 0.69
(0.43-1.11) | 0.15 |
|
|
Discussion
Up to our knowledge, this has been the first study
to compare the prognostic utility of pre- and post-chemotherapy NLR
values in 338 consecutive patients receiving triplet neoadjuvant
regimens. Accordingly, the present study showed that high post-NLR
but not pre-NLR was an independent prognostic factor for OS among
those receiving triplet chemotherapy followed by surgical
resection. Moreover, high post-NLR was significantly correlated
with poor clinical response to NAC.
A meta-analysis including a total of 20 studies
consisting of 6457 patients showed a significant association
between higher NLR and worse survival in esophageal cancer,
subsequently considering NLR as an independent predictive marker
(27). However, majority of these
previous reports have focused on patients who underwent surgery
alone, with only a handful having investigated variations in NLR
following NAC. Among such studies, Miyazaki et al identified
high NLR before surgery as a significant risk factor for poor
prognosis in patients who did or did not undergo NAC for esophageal
cancer (28). Despite the
availability of similar reports (29–31),
it remains unclear whether NAC influences NLR given that the
aforementioned studies analyzed patients who both did and did not
receive chemotherapy with no unified timing of NLR measurements.
Lee et al reported that post-treatment NLR but not
pre-treatment NLR was a significant prognostic factor following
chemotherapy including gefinitib, gemcitabine, and cisplatin for
advanced or metastatic lung adenocarcinoma and that high
post-treatment NLR was associated with worse tumor response, higher
risk of progression, and greater risk of death (32). The aforementioned results
corroborate the findings presented herein, which showed that
post-NLR was a potential prognostic marker. The present report
suggests that NLR may predict prognosis more precisely by
considering the timing of measurements. Interestingly, Hoshino
et al focused on NLR change itself, which was calculated NLR
after NAC/NLR before NAC (18).
NLR change identified as a significant prognosis predictor, the
patients with NLR change below 0.55 had a significantly better OS
and RFS than those with NLR change above 0.55. Notably, these
tendencies increased in patients who underwent DCF in comparison
with those who underwent CF. However, their study included a small
number of cases, 35 patients who underwent DCF with esophageal
cancer. The present report has been the first to directly reveal
the impact chemotherapy may have on NLR in more than 300 patients
who underwent triplet chemotherapy for ESCC.
The mechanisms by which NLR influences survival in
esophageal cancer remains unclear. Tumors consist of not only
neoplastic cells but also a microenvironment. Infiltrating
leukocytes and stromal cells make up the microenvironment wherein
they engage in continuous interactions with both tumor cells and
each other (33). Increasing
studies have found that neutrophils have the ability to synthesize
a series of cytokines with multifaceted effects, including tumor
promotion, angiogenesis, and progression (34,35).
One example is APRIL, a neutrophil-derived cytokine involved in
tumor progression reported to be broadly expressed in normal
tissue, tumor cells, and peripheral blood (36). Lymphocytes in the peripheral blood
are currently thought to cause synergistic cytotoxicity and exert
tumor suppressor properties (37).
The NLR, a useful biomarker that can be calculated quite easily
from routine blood cell tests, may reflect the balance between the
complex systemic inflammation.
Both pre- and post-NLR were not significantly
associated with frequency of leukopenia and neutropenia during
chemotherapy. On the other hand, the high groups of both pre- and
post-NLR had significantly more incidences of lymphopenia compared
to the low groups. Although no change in lymphocyte count had
apparently been observed before and after chemotherapy, a
dramatical change in lymphocyte count had in fact occurred during
chemotherapy, which may have strongly influenced the NLR.
Additionally, the high pre-NLR group had significantly more
incidences of anemia than the low pre-NLR group. The high pre-NLR
had significantly more patients with locally advanced tumor (cT3 or
T4) (76 out of 87, 87%) than low pre-NLR (176 out of 251, 70%)
(P=0.002). The chronic inflammation or bleeding caused by the
advanced tumor may consequently cause frequent anemia in patients
with high pre-NLR.
The present study observed differences in the NLR
and neutrophil counts before and after NAC. Furthermore, the NLR
after NAC had been determined to be a better prognostic factor than
that before NAC. Our multivariate analysis for post-NLR identified
lymphopenia, as well as higher neutrocyte counts and lower
lymphocyte counts, as an independent factor for high post-NLR.
Patients who exhibit sensitivity to ACF or DCF have dramatically
reduced tumor volumes (16). The
present study showed that patients with high post-NLR had
significantly worse clinical responses than those with low
post-NLR. Chemo-resistant patients with a high post-NLR still have
numerous tumor cells remaining after chemotherapy. The tumor cells
and surrounding microenvironment promote a systemic inflammatory
response (9), which can be
reflected in circulating neutrophil and lymphocyte counts. This
suggests that a higher NLR after NAC may imply resistance to
treatment, which can correlate with prognosis.
Interestingly, multivariate analysis identified
lower BMI as an independent factor for high post-NLR, indicating a
possible association between NLR and nutritional status. A few
patients with esophageal cancer present with malnutrition upon
initial diagnosis. Hagi et al reported that 92 out of 434
patients with esophageal cancer were able to swallow only liquids
or had complete dysphagia (38).
Patients suffering from dysphagia require intensive support mainly
via enteral nutrition during chemotherapy, which may consequently
suppress systemic inflammation. Improvement in a patients'
nutritional status during NAC may help correct the NLR,
consequently making NLR after NAC a more accurate prognostic factor
than that before NAC. Conversely, the nutritional intervention
itself during chemotherapy might suppress the cascade of immune
response, which contributes to better prognosis.
Some limitations of the current study are worth
noting. The present study carried a retrospective design and was
conducted at a single institution. Furthermore, nutritional
parameters had not been assessed herein. This is significant given
Baker's report suggesting that elevated NLR was associated with
greater weight loss and cachexia in patients with advanced colon,
lung, or prostate cancer (39).
Considering that 21% of patients with esophageal cancer suffer from
dysphagia (38), future studies
should evaluate the association between nutrition and
inflammation.
In conclusion, the current study showed that NLR
after NAC was a better prognostic factor than that before NAC for
patients receiving triplet chemotherapy followed by surgical
resection.
Supplementary Material
Supporting Data
Acknowledgements
The authors acknowledge Dr S. Komukai (Division of
Biomedical Statistics, Department of Integrated Medicine, Graduate
School of Medicine, Osaka University) for his advice.
Funding
Funding: No funding was received.
Availability of data and materials
The datasets used and/or analyzed during the present
study are available from the corresponding author on reasonable
request.
Authors' contributions
MoY and KT conceived and designed the present study.
MoY, KT, MaY, KY, TM, TS, TT, YKu, MM, YKi, KN, HE and YD
contributed to data acquisition and analysis. MoY and KT were major
contributors in writing the manuscript and confirmed the
authenticity of all the raw data. All authors provided supervision
of the manuscript, and read and approved the final manuscript.
Ethics approval and consent to
participate
The current study was approved by the Human Ethics
Review Committee of the Osaka University School of Medicine
(approval no. 16305-4) and written informed consent was obtained
from all patients.
Patient consent for publication
Not applicable.
Competing interests
The authors declare that they have no competing
interests.
References
|
1
|
Bray F, Ferlay J, Soerjomataram I, Siegel
RL, Torre LA and Jemal A: Global cancer statistics 2018: GLOBOCAN
estimates of incidence and mortality worldwide for 36 cancers in
185 countries. CA Cancer J Clin. 68:394–424. 2018. View Article : Google Scholar : PubMed/NCBI
|
|
2
|
Medical Research Council Oesophageal
Cancer Working Group, : Surgical resection with or without
preoperative chemotherapy in oesophageal cancer: A randomised
controlled trial. Lancet. 359:1727–1733. 2002. View Article : Google Scholar : PubMed/NCBI
|
|
3
|
Allum WH, Stenning SP, Bancewicz J, Clark
PI and Langley RE: Long-term results of a randomized trial of
surgery with or without preoperative chemotherapy in esophageal
cancer. J Clin Oncol. 27:5062–5067. 2009. View Article : Google Scholar : PubMed/NCBI
|
|
4
|
Ando N, Kato H, Igaki H, Shinoda M, Ozawa
S, Shimizu H, Nakamura T, Yabusaki H, Aoyama N, Kurita A, et al: A
randomized trial comparing postoperative adjuvant chemotherapy with
cisplatin and 5-fluorouracil versus preoperative chemotherapy for
localized advanced squamous cell carcinoma of the thoracic
esophagus (JCOG9907). Ann Surg Oncol. 19:68–74. 2012. View Article : Google Scholar : PubMed/NCBI
|
|
5
|
Yamasaki M, Yasuda T, Yano M, Hirao M,
Kobayashi K, Fujitani K, Tamura S, Kimura Y, Miyata H, Motoori M,
et al: Multicenter randomized phase II study of cisplatin and
fluorouracil plus docetaxel (DCF) compared with cisplatin and
fluorouracil plus adriamycin (ACF) as preoperative chemotherapy for
resectable esophageal squamous cell carcinoma (OGSG1003). Ann
Oncol. 28:116–120. 2017. View Article : Google Scholar : PubMed/NCBI
|
|
6
|
Shiraishi O, Yamasaki M, Makino T, Motoori
M, Miyata H, Shinkai M, Kimura Y, Hirao M, Fujitani K, Tamura S, et
al: Feasibility of preoperative chemotherapy with docetaxel,
cisplatin, and 5-fluorouracil versus adriamycin, cisplatin, and
5-fluorouracil for resectable advanced esophageal cancer. Oncology.
92:101–108. 2017. View Article : Google Scholar : PubMed/NCBI
|
|
7
|
Shimakawa T, Naritaka Y, Asaka S, Isohata
N, Murayama M, Konno S, Yoshimatsu K, Shiozawa S, Katsube T and
Ogawa K: Neoadjuvant chemotherapy (FAP) for advanced esophageal
cancer. Anticancer Res. 28:2321–2326. 2008.PubMed/NCBI
|
|
8
|
Motoori M, Yano M, Yasuda T, Miyata H,
Peng YF, Yamasaki M, Shiraishi O, Masuzawa Y, Tanaka K, Ishikawa O,
et al: Chemotherapy-induced toxicities and treatment efficacy in
advanced esophageal cancer treated with neoadjuvant chemotherapy
followed by surgery. Esophagus. 8:81–87. 2011. View Article : Google Scholar
|
|
9
|
Coussens LM and Werb Z: Inflammation and
cancer. Nature. 420:860–867. 2002. View Article : Google Scholar : PubMed/NCBI
|
|
10
|
McMillan DC: Systemic inflammation,
nutritional status and survival in patients with cancer. Curr Opin
Clin Nutr Metab Care. 12:223–226. 2009. View Article : Google Scholar : PubMed/NCBI
|
|
11
|
Huang W, Wang S, Zhang H, Zhang B and Wang
C: Prognostic significance of combined fibrinogen concentration and
neutrophil-to-lymphocyte ratio in patients with resectable
non-small cell lung cancer. Cancer Biol Med. 15:88–96. 2018.
View Article : Google Scholar : PubMed/NCBI
|
|
12
|
Zhang Y, Jiang C, Li J, Sun J and Qu X:
Prognostic significance of preoperative neutrophil/lymphocyte ratio
and platelet/lymphocyte ratio in Patients with gallbladder
carcinoma. Clin Transl Oncol. 17:810–818. 2015. View Article : Google Scholar : PubMed/NCBI
|
|
13
|
Huszno J and Kolosza Z: Prognostic value
of the neutrophil-lymphocyte, platelet-lymphocyte and
monocyte-lymphocyte ratio in breast cancer patients. Oncol Lett.
18:6275–6283. 2019.PubMed/NCBI
|
|
14
|
Sharaiha RZ, Halazun KJ, Mirza F, Port JL,
Lee PC, Neugut AI, Altorki NK and Abrams JA: Elevated preoperative
neutrophil: Lymphocyte ratio as a predictor of postoperative
disease recurrence in esophageal cancer. Ann Surg Oncol.
18:3362–3369. 2011. View Article : Google Scholar : PubMed/NCBI
|
|
15
|
Chen L, Zeng H, Yang J, Lu Y, Zhang D,
Wang J, Kuang C, Zhu S, Wang M and Ma X: Survival and prognostic
analysis of preoperative inflammatory markers in patients
undergoing surgical resection for laryngeal squamous cell
carcinoma. BMC Cancer. 18:8162018. View Article : Google Scholar : PubMed/NCBI
|
|
16
|
Yamasaki M, Miyata H, Tanaka K, Shiraishi
O, Motoori M, Peng YF, Yasuda T, Yano M, Shiozaki H, Mori M and
Doki Y: Multicenter phase I/II study of docetaxel, cisplatin and
fluorouracil combination chemotherapy in patients with advanced or
recurrent squamous cell carcinoma of the esophagus. Oncology.
80:307–313. 2011. View Article : Google Scholar : PubMed/NCBI
|
|
17
|
Wu T and Dai Y: Tumor microenvironment and
therapeutic response. Cancer Lett. 387:61–68. 2017. View Article : Google Scholar : PubMed/NCBI
|
|
18
|
Hoshino S, Takeuchi M, Kawakubo H,
Kobayashi R, Matsuda S, Irino T, Fukuda K, Nakamura R and Kitagawa
Y: Neutrophil-to-lymphocyte ratio change predicts histological
response to and oncological outcome of neoadjuvant chemotherapy for
esophageal squamous cell carcinoma. Esophagus. 19:426–435. 2022.
View Article : Google Scholar : PubMed/NCBI
|
|
19
|
Sobin LH, Gospodarowicz MK and Wittekind
C: UICC International Union Against Cancer. TNM classification of
malignant tumors. 7th edition. New York: Wiley-Blackwell; 2009
|
|
20
|
Japan Esophageal Society: Japanese
classification of esophageal cancer, 11th edition: Part II and III.
Esophagus. 14:37–65. 2017. View Article : Google Scholar : PubMed/NCBI
|
|
21
|
National Cancer Institute, . Common
terminology criteria for adverse events (CTCAE). http://ctep.cancer.gov/protocolDevelopment/electronic_applications/ctc.htm#ctc_40
|
|
22
|
Yano M, Takachi K, Doki Y, Miyashiro I,
Kishi K, Noura S, Eguchi H, Yamada T, Ohue M, Ohigashi H, et al:
Preoperative chemotherapy for clinically node-positive patients
with squamous cell carcinoma of the esophagus. Dis Esophagus.
19:158–163. 2006. View Article : Google Scholar : PubMed/NCBI
|
|
23
|
Kitagawa Y, Uno T, Oyama T, Kato K, Kato
H, Kawakubo H, Kawamura O, Kusano M, Kuwano H, Takeuchi H, et al:
Esophageal cancer practice guidelines 2017 edited by the Japan
esophageal society: Part 2. Esophagus. 16:25–43. 2019. View Article : Google Scholar : PubMed/NCBI
|
|
24
|
Yamashita K, Makino T, Yamasaki M, Tanaka
K, Hara T, Miyazaki Y, Takahashi T, Kurokawa Y, Nakajima K,
Takiguchi S, et al: Comparison of short-term outcomes between 2-
and 3-field lymph node dissection for esophageal cancer. Dis
Esophagus. 30:1–8. 2017. View Article : Google Scholar
|
|
25
|
Toh Y, Kitagawa Y, Kuwano H, Kusano M,
Oyama T, Muto M, Kato H, Takeuchi H, Doki Y, Naomoto Y, et al: A
nation-wide survey of follow-up strategies for esophageal cancer
patients after a curative esophagectomy or a complete Response by
definitive chemoradiotherapy in Japan. Esophagus. 13:173–181. 2016.
View Article : Google Scholar : PubMed/NCBI
|
|
26
|
Yodying H, Matsuda A, Miyashita M,
Matsumoto S, Sakurazawa N, Yamada M and Uchida E: Prognostic
significance of neutrophil-to-lymphocyte ratio and
platelet-to-lymphocyte ratio in oncologic outcomes of esophageal
cancer: A systematic review and meta-analysis. Ann Surg Oncol.
23:646–654. 2016. View Article : Google Scholar : PubMed/NCBI
|
|
27
|
Pirozzolo G, Gisbertz SS, Castoro C, van
Berge Henegouwen MI and Scarpa M: Neutrophil-to-lymphocyte ratio as
prognostic marker in esophageal cancer: A systematic review and
meta-analysis. J Thorac Dis. 11:3136–3145. 2019. View Article : Google Scholar : PubMed/NCBI
|
|
28
|
Miyazaki T, Sakai M, Sohda M, Tanaka N,
Yokobori T, Motegi Y, Nakajima M, Fukuchi M, Kato H and Kuwano H:
Prognostic significance of inflammatory and nutritional parameters
in patients with esophageal cancer. Anticancer Res. 36:6557–6562.
2016. View Article : Google Scholar : PubMed/NCBI
|
|
29
|
Wang L, Wang C, Wang J, Huang X and Cheng
Y: A novel systemic immune-inflammation index predicts survival and
quality of life of patients after curative resection for esophageal
squamous cell carcinoma. J Cancer Res Clin Oncol. 143:2077–2086.
2017. View Article : Google Scholar : PubMed/NCBI
|
|
30
|
Ishibashi Y, Tsujimoto H, Hiraki S, Kumano
I, Yaguchi Y, Horiguchi H, Nomura S, Ito N, Shinto E, Aosasa S, et
al: Prognostic value of preoperative systemic immunoinflammatory
measures in patients with esophageal cancer. Ann Surg Oncol.
25:3288–3299. 2018. View Article : Google Scholar : PubMed/NCBI
|
|
31
|
Xu XL, Yu HQ, Hu W, Song Q and Mao WM: A
novel inflammation-based prognostic score, the C-reactive
protein/albumin ratio predicts the prognosis of patients with
operable esophageal squamous cell carcinoma. PLoS One.
10:e01386572015. View Article : Google Scholar : PubMed/NCBI
|
|
32
|
Lee Y, Kim SH, Han JY, Kim HT, Yun T and
Lee JS: Early neutrophil-to-lymphocyte ratio reduction as a
surrogate marker of prognosis in never smokers with advanced lung
adenocarcinoma receiving gefitinib or standard chemotherapy as
first-line therapy. J Cancer Res Clin Oncol. 138:2009–2016. 2012.
View Article : Google Scholar : PubMed/NCBI
|
|
33
|
Coussens LM and Werb Z: Inflammatory cells
and cancer: Think different! J Exp Med. 193:F23–F26. 2001.
View Article : Google Scholar : PubMed/NCBI
|
|
34
|
Cassatella MA: Neutrophil-derived
proteins: Selling cytokines by the pound. Adv Immunol. 73:369–509.
1999. View Article : Google Scholar : PubMed/NCBI
|
|
35
|
Scapini P, Bazzoni F and Cassatella MA:
Regulation of B-cell-activating factor (BAFF)/B lymphocyte
stimulator (BLyS) expression in human neutrophils. Immunol Lett.
116:1–6. 2008. View Article : Google Scholar : PubMed/NCBI
|
|
36
|
Jabłońska E, Wawrusiewicz-Kurylonek N,
Garley M, Ratajczak-Wrona W, Antonowicz B, Dziemiańczyk-Pakieła D,
Jabłoński J, Krętowski A and Grabowska SZ: A proliferation-inducing
ligand (APRIL) in neutrophils of patients with oral cavity squamous
cell carcinoma. Eur Cytokine Netw. 23:93–100. 2012. View Article : Google Scholar : PubMed/NCBI
|
|
37
|
Ogiya R, Niikura N, Kumaki N, Bianchini G,
Kitano S, Iwamoto T, Hayashi N, Yokoyama K, Oshitanai R, Terao M,
et al: Comparison of tumor-infiltrating lymphocytes between primary
and metastatic tumors in breast cancer patients. Cancer Sci.
107:1730–1735. 2016. View Article : Google Scholar : PubMed/NCBI
|
|
38
|
Hagi T, Makino T, Yamasaki M, Tanaka K,
Nishida N, Sakai D, Motoori M, Kimura Y, Satoh T, Mori M and Doki
Y: Dysphagia score as a predictor of adverse events due to triplet
chemotherapy and oncological outcomes in 434 consecutive patients
with esophageal cancer. Ann Surg Oncol. 26:4754–4764. 2019.
View Article : Google Scholar : PubMed/NCBI
|
|
39
|
Barker T, Fulde G, Moulton B, Nadauld LD
and Rhodes T: An elevated neutrophil-to-lymphocyte ratio associates
with weight loss and cachexia in cancer. Sci Rep. 10:75352020.
View Article : Google Scholar : PubMed/NCBI
|