Introduction
Renal cell carcinoma (RCC) is the most common type
of malignant tumor of the kidney with incidence and mortality rates
of 2–3 and 1–2% (according to the National Cancer Registration
Annual Report 2015–2019 in China) (1), respectively. The specific cause of
RCC is still unknown. In general, smoking, drinking and other
living habits, taking hormone drugs and basic diseases are the main
factors leading to the onset of renal cell carcinoma (2). The most common RCC subtypes are clear
cell (cc) and non-ccRCC. Surgery is ccRCC and non-ccRCC typically
treated. Due to higher malignancy in non-ccRCC, surgical treatment
and clinical prognosis are also different; the malignant degree of
non-ccRCC is higher than that of ccRCC, cc-RCC only remove the
tumor and retain the normal part of the kidney. non-ccRCC must
expand the scope of surgery, or even remove the entire the diseased
kidney. The prognosis of CC-RCC is better than that of non-ccRCC
(2,3). Accurate identification of RCC
subtypes before surgery is important to determine appropriate
surgical methods and clinical prognosis. Currently, imaging
differentiation of ccRCC and non-ccRCC is primarily based on
dynamic enhancement scans of magnetic resonance imaging (MRI)
(4,5). Different image characteristics are
also shown on MRI-enhanced examination due to the different
hemodynamic performances of different subtypes of RCC (1,6–8).
ccRCC is a tumor with multiple blood supply on MRI
contrast-enhanced, while non-ccRCC is a tumor with less blood
supply but, enhanced examination may cause allergic reaction to
contrast agent. MRI-DWI sequence is a fast excitation signal in
magnetic field, which can detect the movement of water molecules.
ADC is the apparent dispersion coefficient. Certain types of
malignant tumors have dense growth cells, less free water, limited
diffusion in malignant tumors, MRI-DWI is high signal whereas ADC
is low signal, which can be used to diagnose tumors. The objective
of the present study was to investigate the differential diagnostic
value of MRI-DWI and ADC in ccRCC and non-ccRCC.
Patients and methods
Patient information
Imaging data from 100 patients with RCC confirmed by
pathology Affiliated Hospital of Gansu University of Chinese
Medicine, (Lanzhou, China) from March 2018 to March 2021 were
retrospectively analyzed. The inclusion criteria were patients with
pathologically proven RCC. The exclusion criteria: All patients
with renal cancer diagnosed and treated by drugs or surgery. The
patients were assigned to two groups according to RCC subtype
(ccRCC and non-ccRCC). The ccRCC group consisted of 68 cases (42
males and 26 females) with a tumor size range of 0.6–5.4 cm, median
tumor size of 3.4 cm, and the following tumor stages: Grade 1 in 15
cases, grade 2 in 32 cases, grade 3 in 11 cases and grade 4 in 10
cases. staging and typing criteria: the pathological staging of
renal cell carcinoma shall refer to the American Joint Cancer
Commission The TNM staging system and pathological classification
of renal cell carcinoma refer to the classification standard
formulated by the World Health Organization (9,10).
The age of the patients in the ccRCC group was 35–59 years with a
median age of 52 years. The course of the disease ranged from 6
months to 2.5 years, with a median of 1.7 years. There were 32
cases in the non-ccRCC group (21 cases of chromophobe and 11 cases
of papillary cell carcinoma), with a tumor size range of 2.4–6.5
cm, median tumor size of 4.4 cm and the following tumor stages:
Grade 1 in 9 cases, grade 2 in 14 cases, grade 3 in 5 cases and
grade 4 in 4 cases. Patients in the non-ccRCC group included 20
males and 12 females, aged 34–60 years, with a median age of 58
years. The course of the disease ranged from 5 months to 2 years,
with a median of 1.5 years. Patient characteristics and tumor
staging information are listed in Tables I and II, respectively. The study was approved
[approval no. (2018)25] by the Affiliated Hospital of Gansu
University of Chinese Medicine Ethics Committee. Written consent
was obtained from all patients to participate.
 | Table I.Patient characteristics. |
Table I.
Patient characteristics.
| Disease subtype | Male, n | Female, n | years Age range, | Median age,
years | Median disease
course, years |
|---|
| ccRCC | 42 | 26 | 35-59 | 52 | 1.7 |
| Non-ccRCC | 20 | 12 | 34-60 | 58 | 1.5 |
| Table II.Tumor stagea and size. |
Table II.
Tumor stagea and size.
| Disease subtype | 1 | 2 | 3 | 4 | Tumor size range,
cm | Median tumor size,
cm |
|---|
| ccRCC | 15 | 32 | 11 | 10 | 0.6–5.4 | 3.4 |
| Non-ccRCC | 9 | 14 | 5 | 4 | 2.4–6.5 | 4.4 |
MRI examination
All patients underwent routine MRI examinations,
including high and low B-value DWI and ADC determination. The 1.5 T
superconducting MRI instrument provided by Shanghai United Imaging
Healthcare Co., Ltd. was used. The scanning parameters were as
follows: Coronal T2W1, echo time (TE) 93 ms, repetition time (TR)
700 ms. DWI was imaged using echo planar imaging-DWI with the
following parameters: TR/TE, 3200/94 ms; slice thickness, 6 mm;
field of view, 350×350 mm; B-value, 50 or 800 s/mm2. The
ADC of the solid part of the tumor was also measured using the
Function software (version no: V4.2; Beijing Si Chuang Guan Yu
Technology Development Co., Ltd.) that came with the device. The
intensity of DWI and ADC signals were observed and interpreted by
two experienced associate physicians (LX and XY) in the MRI room
for blind diagnostic reading. In the event of disagreement, a final
decision was made by mutual consultation.
Observation indicators and
standards
According to the study by Erbay et al
(3), DWI signal was defined
relative to renal parenchyma as follows: low, obviously low, equal,
high, slightly high, significantly high signal. The ADC signal was
judged by the same criteria. In addition, if the ADC signal of the
lesion was significantly lower than the renal parenchyma, it was
judged as a significantly low signal.
Statistical analysis
SPSS 20.0 (IBM Corp.) was used to analyze the study
data. χ2 test (using mean ± SD) represented the measured
data. P<0.05 was considered to indicate a statistically
significant difference. ADC threshold was determined by the
receiver operating characteristic (ROC) curve.
Results
Patient information
There were no significant differences in general
characteristics between the two groups (Table I). There was no significant
association between tumor size and identification using MRI-DWI and
ADC (Table II).
DWI and ADC assessment
There were significant differences in DWI and ADC
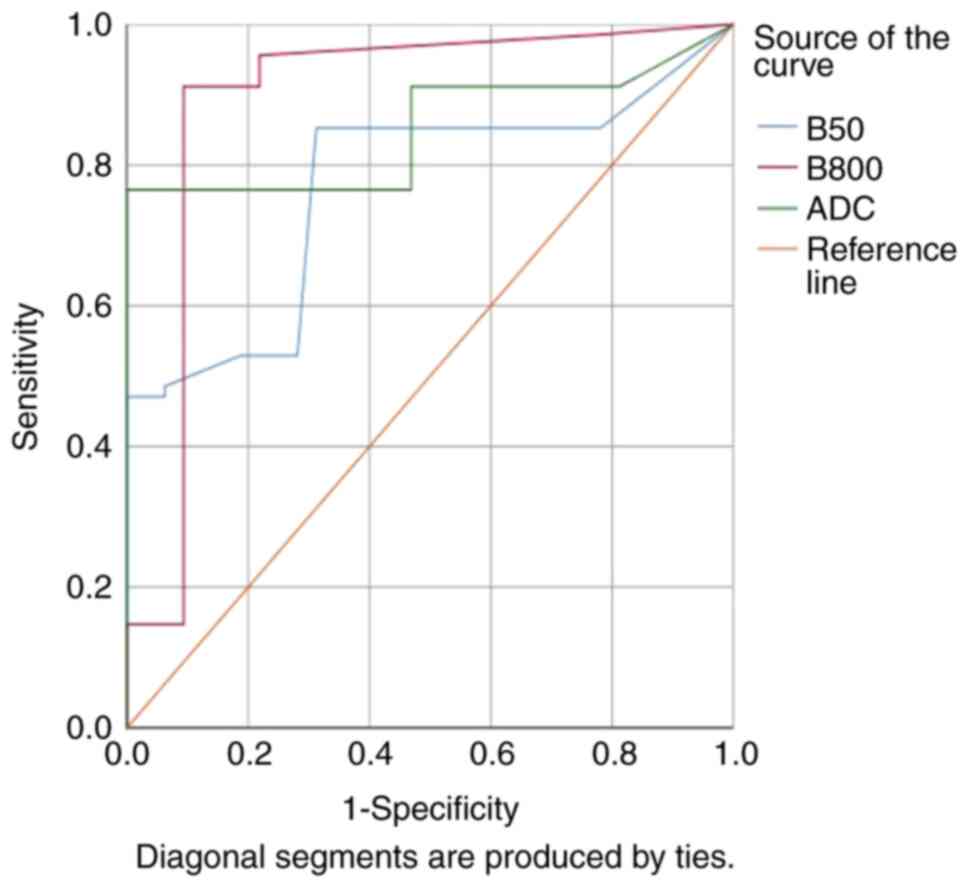
signal between the ccRCC and non-ccRCC groups (Table III). For B-800, the sensitivity
and specificity of predicting ccRCC with MRI-DWI was 0.912 and
0.437, respectively. The sensitivity and specificity of predicting
non-ccRCC with MRI-DWI was 0.954 and 0.426, respectively. The area
under the red ROC curve was 0.873 (Fig. 1).
| Table III.Comparison of DWI and ADC assessment
between the ccRCC (n=68) and non-ccRCC (n=32) groups. |
Table III.
Comparison of DWI and ADC assessment
between the ccRCC (n=68) and non-ccRCC (n=32) groups.
| Assessment
method | DWI (B=50) | DWI (B=800) | ADC |
|---|
|
|
|
|
|---|
| Disease subtype | ccRCC | Non-ccRCC | ccRCC | Non-ccRCC | ccRCC | Non-ccRCC |
|---|
| Signal |
|
|
|
|
|
|
| Low,
n | 0 | 0 | 33 | 0 | 14 | 7 |
| Obviously
low, n | 0 | 0 | 0 | 0 | 0 | 25 |
| Equal,
n | 0 | 0 | 16 | 0 | 23 | 0 |
| Slightly
high, n | 52 | 25 | 19 | 0 | 31 | 0 |
| High,
n | 16 | 7 | 0 | 7 | 0 | 0 |
|
Significantly high, n | 0 | 0 | 0 | 25 | 0 | 0 |
| P-value | <0.001 | <0.001 | <0.001 |
| Sensitivity | 0.941 | 0.923 | 0.912 | 0.954 | 0.912 | 0.928 |
| Specificity | 0.344 | 0.328 | 0.437 | 0.426 | 0.531 | 0.536 |
The median average ADC value of ccRCC was
2.84±1.35×10⁻³ mm2/s, meanwhile, non-ccRCC
papillary cell carcinoma was 1.42±0.78×10⁻³
mm2/s and chromophobe cell carcinoma was
1.34±0.52×10⁻³ mm2/s. The median average ADC
value of ccRCC was significantly higher than that of non-ccRCC.
Imaging characteristics of DWI and ADC
in the diagnosis of non-ccRCC
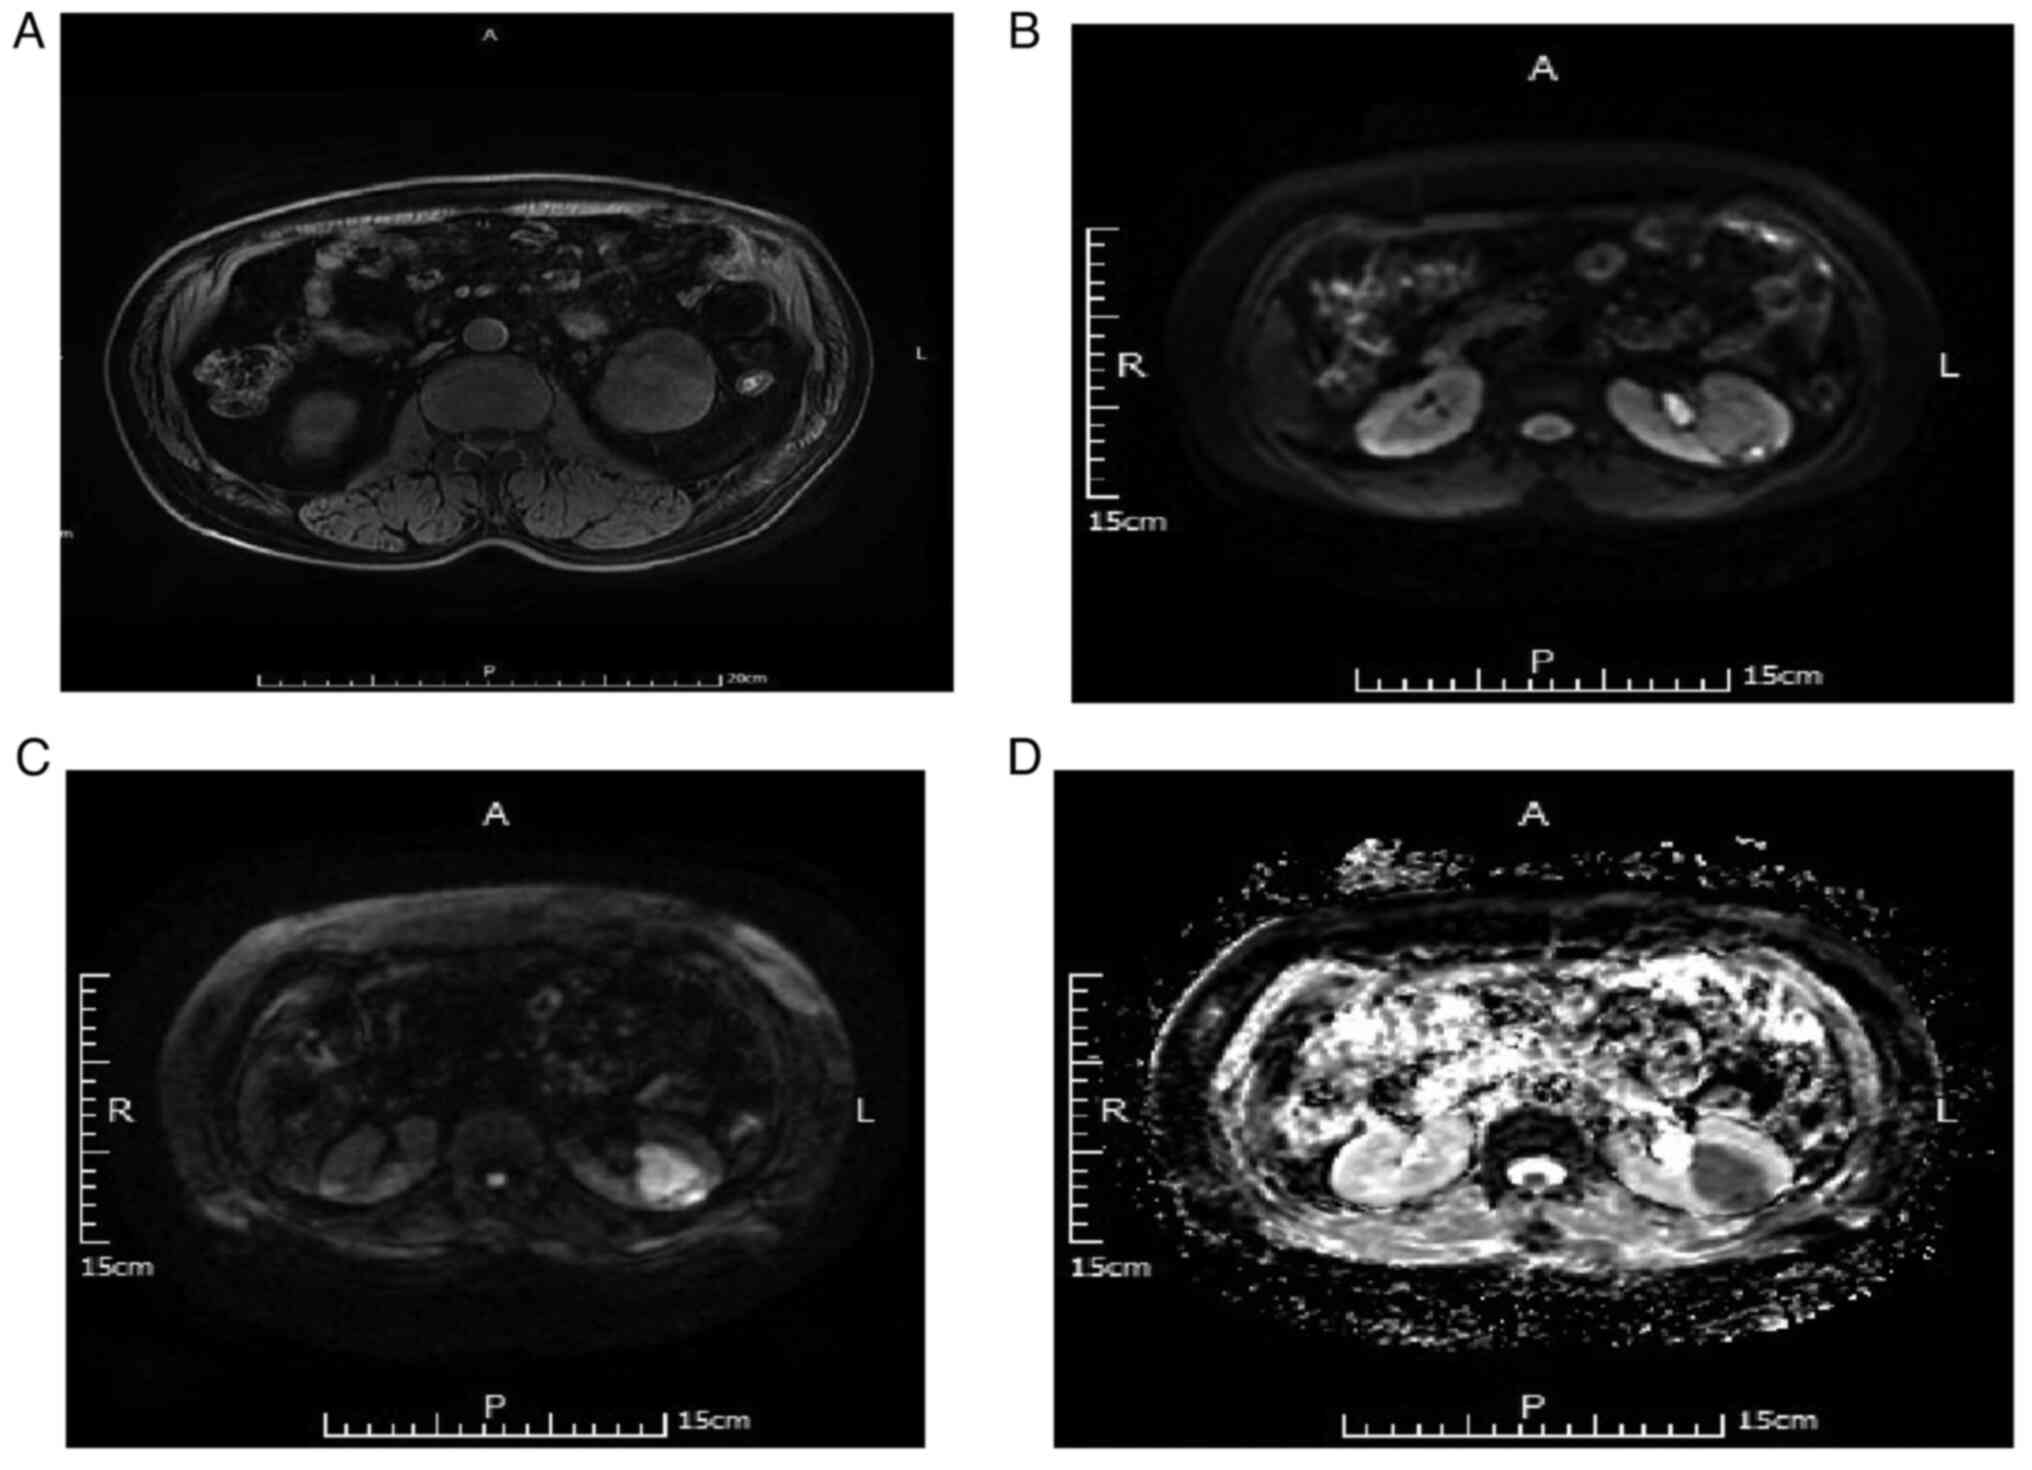
Of the 32 non-ccRCC cases, there were 21 cases of
chromophobe cell carcinoma. For DWI B-value=50 s/mm2, 17
of the 21 cases (80.95%) were judged as a slightly high and four
cases (19.05%) as high signal. For DWI B-value=800
s/mm2, five of the 21 cases (23.81%) were judged as high
and 16 cases (76.19%) as significantly high signal. Additionally,
for ADC, 4 cases (19.05%) were judged as low and 17 cases (80.95%)
as significantly low signal. Representative MRI scans are depicted
in Fig. 2.
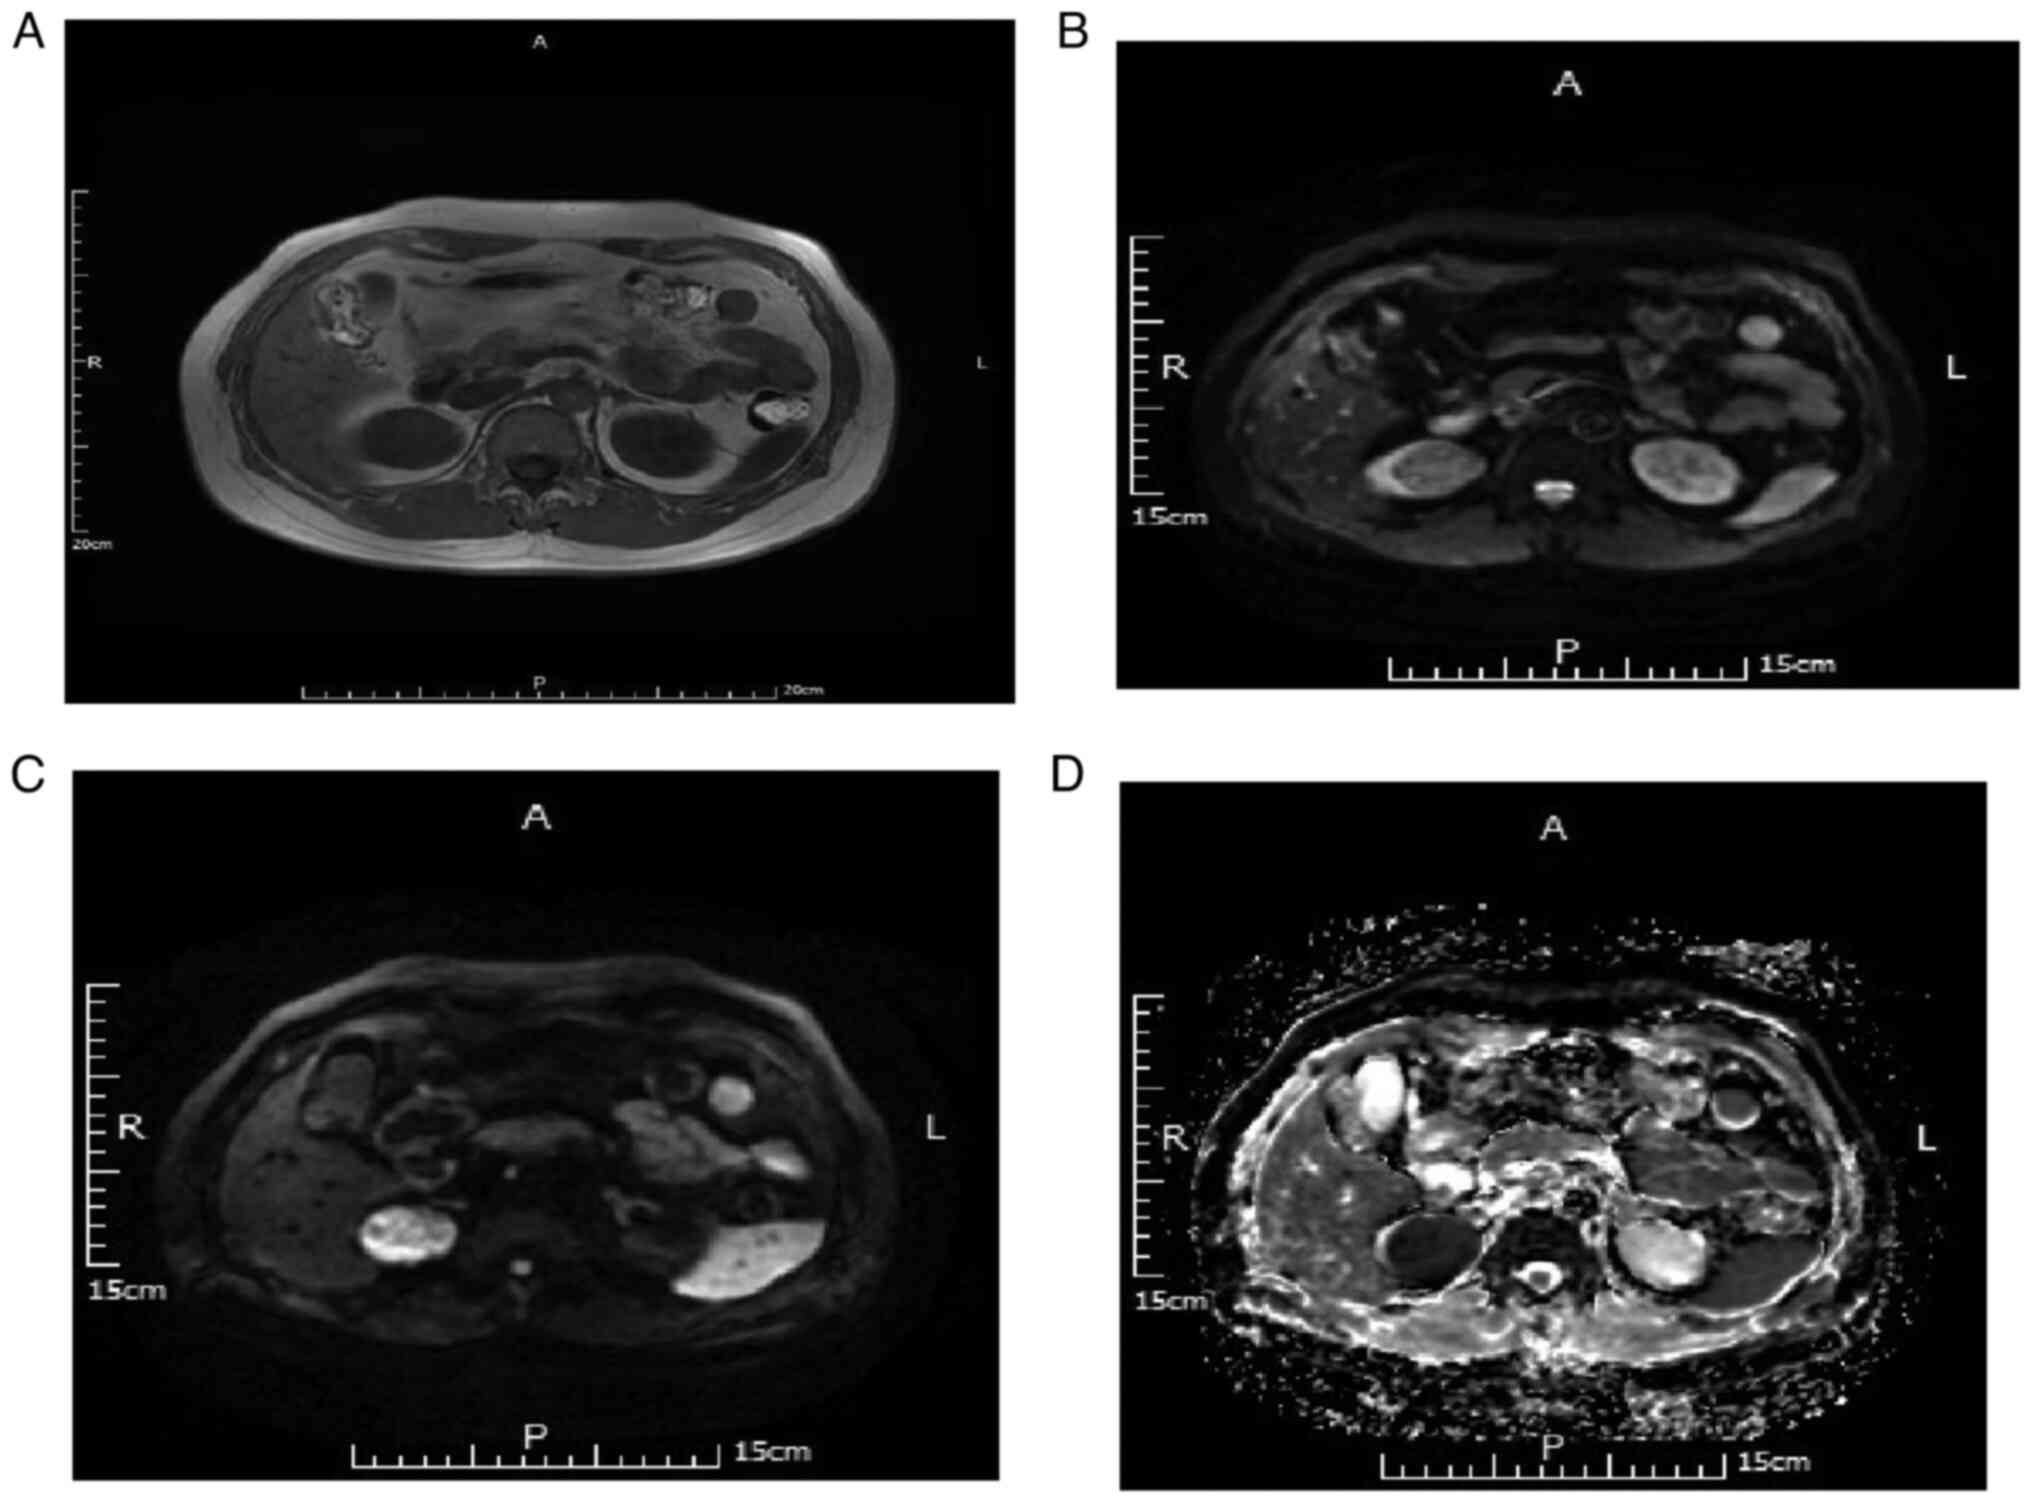
In 11 cases of papillary cell carcinoma, for DWI
B-value=50 s/mm2, eight cases (72.73%) were judged as
slightly high and three cases (27.28%) as high signal. For DWI
B-value=800 s/mm2, two cases (18.18%) were judged as
high signal and nine cases (81.82%) as significantly high signal.
Additionally, for ADC, three cases (27.27%) were judged as low
signal and eight cases (72.73%) as significantly low signal.
Representative MRI scans are depicted in Fig. 3.
Imaging characteristics of DWI and ADC
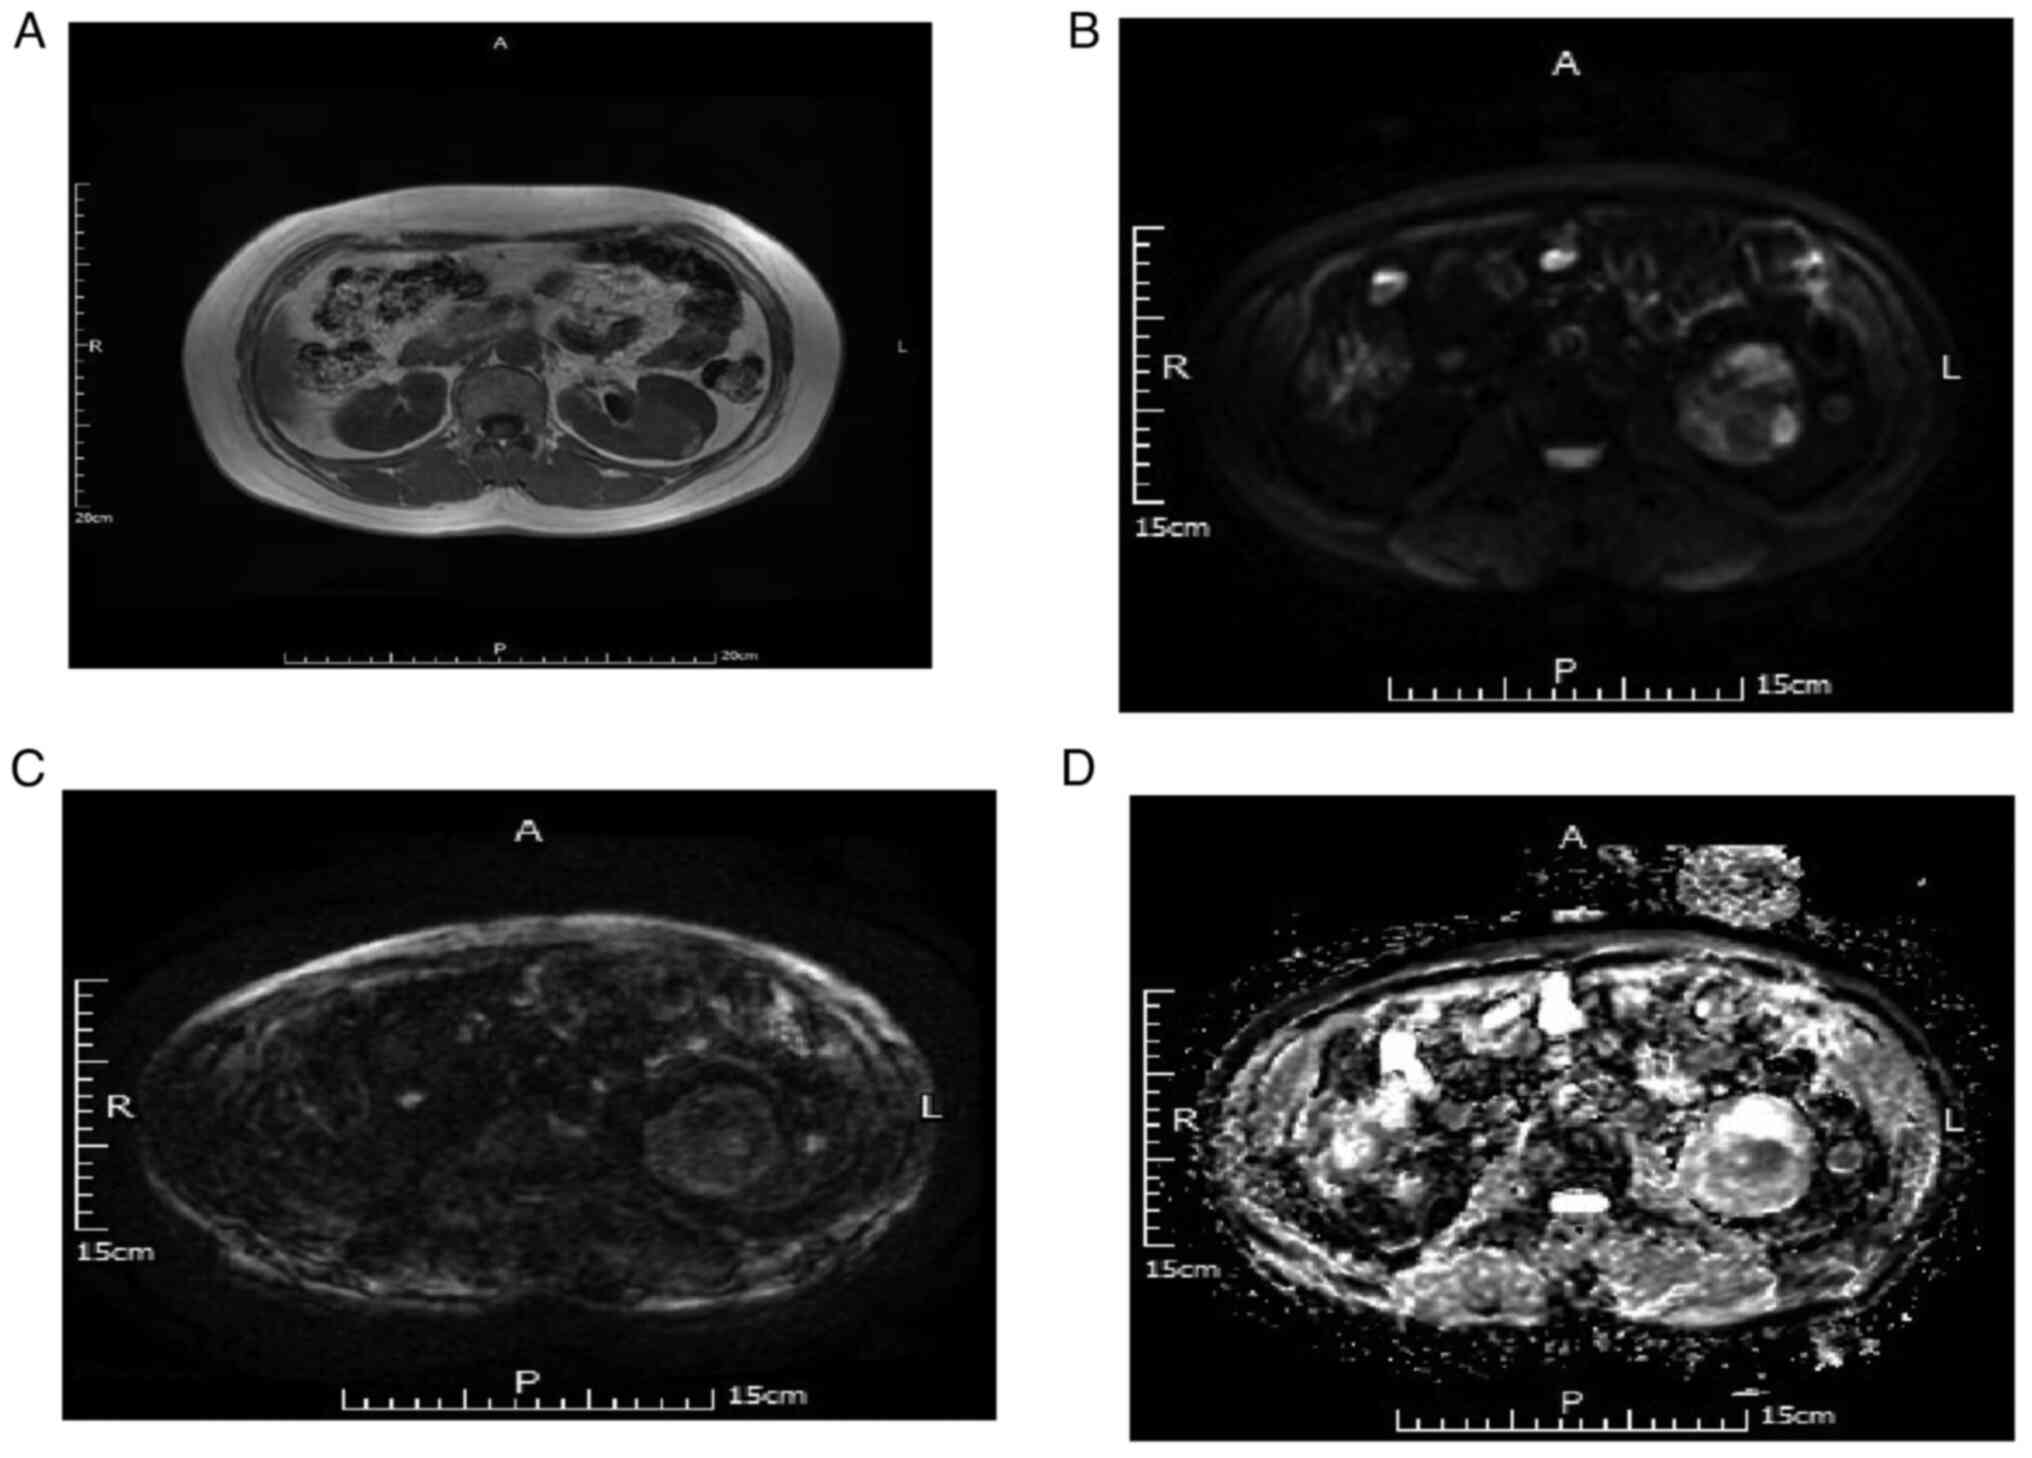
in the diagnosis of ccRCC
There were 68 cases of ccRCC. For DWI B-value=50
s/mm2, 52 of 68 cases (76.47%) were judged as slightly
high and 16 cases (23.53%) as high signal. For DWI B-value=800
s/mm2, 19 cases (27.94%) were judged as slightly high,
16 cases (23.53%) as equal and 33 cases (48.53%) as low signal.
Meanwhile, for ADC, 14 cases were judged as low signal (20.59%), 23
(33.82%) as equisignal and 31 cases (45.59%) as slightly high
signal. Representative MRI scans are depicted in Fig. 4.
Discussion
RCC accounts for 85–90% of renal tumors (9). Papillary cell carcinoma and ccRCC are
the two most common of the five subtypes of RCC, accounting for
10–15 and 70–80%, respectively. According to a previous study, the
5-year survival rate of chromophobe and papillary cell carcinoma is
87–100% (10), while the 5-year
survival rate of ccRCC is ~69% (11). Therefore, preoperative MRI
examination to determine the subtype of RCC is key to formulate a
reasonable surgical approach and accurately evaluate the
prognosis.
At present, in differentiating ccRCC and non-ccRCC,
the commonly used method for dynamic enhanced MRI (12), the CT plain scan, has no obvious
value in the diagnosis of cc carcinoma and non-cc carcinoma
(13). Triphasic dynamic-enhanced
MRI in renal tissue involves cortical, parenchyma phase and delayed
phase. The tumor in cortical phase is significantly enhanced, and
the tumor in cortical phase is not enhanced, and the tumor in the
delayed phase is enhanced (14,15).
In the present study, only MRI plain scan, DWI and ADC
distinguished ccRCC from non-ccRCC. The ADC value of ccRCC was
lower than that of non-ccRCC, and DWI signal intensity of ccRCC was
higher than that of non-ccRCC. DWI and ADC therefore distinguished
between ccRCC and non-ccRCC. Compared with traditional MRI, there
is no marked difference in the image identification of ccRCC and
non-ccRCC on T1 and T2. Compared with traditional MRI T1 and T2,
the signal strength of DWI and the quantitative analysis of ADC
have good discriminating value in image identification of ccRCC and
non-ccRCC (13).
In the present study, of non-cc chromophobe cell
carcinoma cases, 80.95% analyzed using DWI B-value=50
s/mm2 were judged as slightly high signal, 76.19% using
DWI B-value=800 s/mm2 were significantly high signal and
80.95% using ADC were significantly low signal. The results of the
present study therefore showed that the DWI signal of chromophobe
cell carcinoma with using high B-value was higher than that with
the low B-value, while ADC with an obvious, uniform low signal was
observed in most cases, which may be associated with less cystic
degeneration and necrosis in non-cc carcinoma.
For papillary cell carcinoma, 72.73% of cases
analyzed using DWI B-value=50 s/mm2 were slightly high
signal, 81.82% using DWI B-value=800 s/mm2 were
significantly high signal and 72.73% using ADC were obviously low
signal. Therefore, the high B-value signal of papillary cell
carcinoma DWI was higher than that of the low B-value signal and
most ADCs measured were significantly low signal. In the present
study, it was difficult to distinguish chromophobe from papillary
cell carcinoma.
For ccRCC, 76.47% of cases analyzed using DWI
B-value=50 s/mm2 were judged as slightly higher signal,
48.53% using DWI B-value=800 s/mm2, were low signal and
79.41% using ADC were equal or slightly high signal. Therefore, the
high B-value signal in DWI of ccRCC was lower than that of the low
B-value signal, while the majority of ADC signal was equal or
slightly high signal; this is the opposite to results for non-ccRCC
and may be because ccRCC is prone to sac necrosis, sac necrosis can
lead to DWI signal decreased and ADC signal increased (10). In the present study, only one case
with small kidney cancer of the tumor diameter <1 cm did not
have cystic degeneration. Therefore cystic degeneration is a
characteristic of ccRCC, which is similar to the results reported
in the existing literature (14).
T2WI signals of ccRCC are mostly mixed and the DWI and ADC signals
of individual cases are higher due to the T2 penetration effect
(8).
In the present study, the median average ADC value
of ccRCC was 2.84±1.35×10⁻³ mm2/s, of
non-ccRCC papillary cell carcinoma was 1.42±0.78×10⁻³
mm2/s and that of chromophobe cell carcinoma was
1.34±0.52×10⁻³ mm2/s. The median average ADC
value of ccRCC was significantly higher than that of non-ccRCC. By
contrast, Chen et al (16)
reported that the median average ADC value of ccRCC was
1.67×10⁻³ mm2/s and that of non-ccRCC was
3.67×10⁻³ mm2/s. According to a previous
study, signals with ccRCC on T2WI are mostly mixed signals and ADC
signals are mostly slightly low signals (16,17),
which is inconsistent with the present study. The selected cases in
this study had a long the course of illness and large tumor growth,
large tumors are prone to cystic change, which leads to signal
reduction). However, other studies have reported that ccRCC is
prone to cystic degeneration, necrosis and hemorrhage, which is
consistent with the results in the present study (16,17).
In conclusion, in the present study, DWI and ADC
measurements were different between ccRCC and non-ccRCC groups. DWI
of ccRCC was mostly low, equal or slightly high signal and ADC was
mostly equal or slightly high signal. In addition, high B-value DWI
signal was lower than low B-value DWI. DWI of non-ccRCC was mostly
obvious high signal and ADC was mostly uniform, obviously low
signal. In addition, high B-value DWI signal was significantly
higher than low B-value DWI. Therefore, DWI and ADC had notable
differential diagnostic value for ccRCC and non-ccRCC.
Acknowledgements
Not applicable.
Funding
The present study was supported by the Health Industry Plan
Project of Gansu Province (grant no. GSWSKY2020-09) and the Science
and Technology Project of Chengguan District, Lanzhou (grant no.
2020SHFZ0007).
Availability of data and materials
The datasets used and/or analyzed during the current
study are available from the corresponding author on reasonable
request.
Authors' contributions
XL designed the study and collected patient data. XL
and HL confirm the authenticity of all the raw data. XX and HL
performed the statistical data analysis. All authors have read and
approved the final manuscript.
Ethics approval and consent to
participate
All participants provided written informed consent.
The methods of the study met the criteria of the Declaration of
Helsinki for human rights and the study was approved by the
Affiliated Hospital of Gansu University of Chinese Medicine Ethics
Committee [Lanzhou, China; approval no. (2018)25].
Patient consent for publication
Not applicable.
Competing interests
The authors declare that they have no competing
interests.
References
|
1
|
Wang H, Cheng L, Zhang X, Wang D, Guo A,
Gao Y and Ye H: Renal cell carcinoma: Diffusion-weighted MR imaging
for subtype differentiation at 3.0 T. Radiology. 257:135–143. 2010.
View Article : Google Scholar : PubMed/NCBI
|
|
2
|
Chowdhury S and Choueiri TK: Recent
advances in the systemic treatment of metastatic papillary renal
cancer. Expert Rev Anticancer Ther. 9:373–379. 2019. View Article : Google Scholar : PubMed/NCBI
|
|
3
|
Erbay G, Koc Z, Karadeli E, Kuzgunbay B,
Goren MR and Bal N: Evaluation of malignant and benign renal
lesions using diffusion-weighted MRI with multiple b values. Acta
Radiol. 3:359–365. 2012. View Article : Google Scholar : PubMed/NCBI
|
|
4
|
Dale BM, Braithwaite AC, Boll DT and
Merkle EM: Field strength and diffusion encoding technique affect
the apparent diffusion coefficient measurements in
diffusion-weighted imaging of the abdomen. Invest Radiol.
45:104–108. 2010. View Article : Google Scholar : PubMed/NCBI
|
|
5
|
Srinivasan A, Dvorak R, Perni K, Rohrer S
and Mukherji SK: Differentiation of benign and malignant pathology
in the head and neck using 3T apparent diffusion coefficient
values: Early experience. AJNR Am J Neuroradiol. 29:40–44. 2008.
View Article : Google Scholar : PubMed/NCBI
|
|
6
|
Manenti G, Di Roma M, Mancino S,
Bartolucci DA, Palmieri G, Mastrangeli R, Miano R, Squillaci E and
Simonetti G: Malignant renal neoplasms: Correlation between ADC
values and cellularity in diffusion weighted magnetic resonance
imaging at 3 T. Radiol Med. 113:199–213. 2008.(In English,
Italian). View Article : Google Scholar : PubMed/NCBI
|
|
7
|
Chen J, Sun J, Xing W, Ding J, Chen T, Dai
Y, Sun J and Hu J: Prediction of nuclear grade of clear cell renal
cell carcinoma with MRI: Intratumoral susceptibility signal
intensity versus necrosis. Acta Radiol. 55:378–384. 2014.
View Article : Google Scholar : PubMed/NCBI
|
|
8
|
Hartman DS, Davis CJ Jr, Johns T and
Goldman SM: Cystic renal cell carcinoma. Urology. 28:145–153. 1986.
View Article : Google Scholar : PubMed/NCBI
|
|
9
|
Parienty RA, Pradel J and Parienty I:
Cystic renal cancers: CT characteristics. Radiology. 157:741–744.
1985. View Article : Google Scholar : PubMed/NCBI
|
|
10
|
Özgök Y, Ateş M, Hoşcan MB, İstanbulluoğlu
O, Başal Ş and Zor M: Renal cell carcinoma dwelling upon a renal
cyst wall and laparoscopic management. Urol J. 10:1165–1167.
2014.PubMed/NCBI
|
|
11
|
Bielsa O, Lloreta J and Gelabert-Mas A:
Cystic renal cell carcinoma: Pathological features, survival and
implications for treatment. Br J Urol. 82:16–20. 1998. View Article : Google Scholar : PubMed/NCBI
|
|
12
|
Huan L: Comparison of CT and MRI in the
diagnosis of renal cell carcinoma of different pathological
subtypes. Contemp Med. 19:139–140. 2021.
|
|
13
|
Robbin ML, Lockhart ME and Barr RG: Renal
imaging with ultrasound contrast: Current status. Radiol Clin North
Am. 41:963–978. 2003. View Article : Google Scholar : PubMed/NCBI
|
|
14
|
Israel GM, Hindman N and Bosniak MA:
Evaluation of cystic renal masses: Comparison of CT and MR imaging
by using the Bosniak classification system. Radiology. 231:365–371.
2004. View Article : Google Scholar : PubMed/NCBI
|
|
15
|
Park BK, Kim B, Kim SH, Ko K, Lee HM and
Choi HY: Assessment of cystic renal masses based on Bosniak
classification: Comparison of CT and contrast-enhanced US. Eur J
Radiol. 61:310–314. 2007. View Article : Google Scholar : PubMed/NCBI
|
|
16
|
Chen Y, Wu N, Xue T, Hao Y and Dai J:
Comparison of contrast-enhanced sonography with MRI in the
diagnosis of complex cystic renal masses. J Clin Ultrasound.
43:203–209. 2015. View Article : Google Scholar : PubMed/NCBI
|
|
17
|
Mühlfeld AS, Lange C, Kroll G, Floege J,
Krombach GA, Kuhl C, Eitner F and Schrading S: Pilot study of
non-contrast-enhanced MRI vs ultrasound in renal transplant
recipients with acquired cystic kidney disease: A prospective
intra-individual comparison. Clin Transplant. 27:694–701. 2013.
View Article : Google Scholar : PubMed/NCBI
|