Introduction
Globally, the morbidity of colorectal cancer (CRC)
ranks third (10.0%) among all cancers, whereas the mortality rate
ranks second (9.4%) (1). Over the
past decade, both the incidence and death rates of CRC have
increased (2). Through decades of
progress in the understanding of CRC pathophysiology, multiple
treatments have been developed, including endoscopic and surgical
local excision, downstaging preoperative radiotherapy,
chemotherapy, biologics and immunotherapy. These treatments in
conjunction with several new drugs have led to certain improvements
in the survival of patients with CRC; however, these changes remain
insufficient in the face of an increasingly severe situation
(3). There is a continued need to
identify more effective and reliable biomarkers, as well as models
to further improve individualized therapy.
Oncosis is a type of programmed death referring to
the cellular response to injury that occurs prior to cell death
(4). Oncosis is accompanied by
cellular and organelle swelling, as well as increased cell membrane
permeability. The mechanism of oncosis is based on the incapacity
of certain plasma membrane ion pumps, such as sodium-potassium pump
and calcium channel (5,6). Certain cell surface receptors (e.g.,
PORIMIN) are able to trigger oncosis when activated, which may be
caused by substances that interfere with ATP production or that
increase plasma membrane permeability (7,8).
Several previous studies have suggested that oncosis may represent
a vital link in tumorigenesis and tumor progression. For instance,
one study has demonstrated that aspirin is able to significantly
induce the oncosis of HeLa cells through reduction of the level of
the antiapoptotic protein, Bcl-xl, and may therefore significantly
inhibit tumor growth (9). When
exposed to sanguinarine, multiple cancer cells experience oncosis
(e.g., breast and prostate cancer cells) (4). Inducing the programmed death of
drug-resistant cancer cells represents an important research
direction for the treatment of tumors. In a previous study, a
series of synthesized Ir(III) complexes induced oncosis in A549R
cells, a type of drug-resistant cancer cell line (10). Long noncoding RNAs (lncRNAs) are
defined as transcripts with a length >200 nucleotides that
cannot be translated into protein (11). Previous studies on lncRNA have
indicated that the dysregulation of lncRNA expression is common in
cancer and most abnormal lncRNAs are specific to a particular type
of cancer (12–14). In addition, the level of lncRNA
expression is a specific biomarker for several types of cancer
(15). Increasing evidence
suggests that immunity is related to oncosis in cancer (16–18).
Furthermore, interleukin-33 production by cells may enhance
programmed oncosis in low-metastatic cells in hypoxic regions in
lung cancer (19). LncRNA has an
important role in events (e.g., CD4+ T-cell
differentiation and T-cell activation) (20) that are essential for immune
regulation (21). The prognosis of
patients further differs based on differential gene mutations
(22).
In cancer diagnostic models, the combination of two
biomarkers is more accurate than an individual biomarker (23). Thus, in the present study, a
pairing oncosis-related lncRNA (orlncRNA) algorithm was
constructed. By obtaining information on the expression of orlncRNA
pairs, the corresponding results, including patient prognosis,
immune-cell infiltration and drug sensitivity was able to be
determined while avoiding common algorithm problems (e.g., data
correction in the application process of the model). The presented
algorithm provides a novel method by which the clinical outcomes of
CRC may be predicted, potentially providing a method of selecting
appropriate immunotherapy and chemotherapy treatments.
Materials and methods
Data acquisition
First, the transcriptome data of patients with CRC
were downloaded from The Cancer Genome Atlas database (TCGA;
http://portal.gdc.cancer.gov/) (24) in November 2021. The transcriptome
data were reported as fragments per kilobase per million mapped
reads. Next, gene transfer format (GTF) files were applied to
distinguish between lncRNA and mRNA. Subsequently, the
corresponding clinical data were downloaded and repeated invalid
clinical information was deleted. In addition, a list of
oncosis-related genes (orgenes) was obtained by searching for
‘oncosis cancer’ on PubMed (https://pubmed.ncbi.nlm.nih.gov/) (25).
Recognition of differentially
expressed orlncRNAs (DEorlncRNAs)
OrlncRNAs were screened out by a co-expression
analysis and the expression correlation was explored between
orgenes and lncRNAs, and the screening criteria for orlncRNAs were
established, for which the immune gene correlation coefficient
value was >0.4 and the P-value was <0.001. The differential
expression of orlncRNAs between cancerous and normal samples was
also assessed, all using limma, an R package (version 3.50.0) was
used (26). To improve the
accuracy, a log fold-change >2 and false discovery rate (FDR)
<0.05 was set as the threshold.
Construction of DEorlncRNA pairs
The aforementioned DEorlncRNAs were copied into two
empty files, labelled as A and B, and every DEorlncRNAs in file A
were cyclically singly paired with all DEorlncRNAs in file B. A 0–1
matrix could be constructed using the following logic: Assume that
A represents a pair of DEorlncRNAs, for instance, representing
lncRNAB paired with lncRNAC. If the level of lncRNAB expression is
higher than that of lncRNAC, A is equal to 1; otherwise, A is equal
to 0. If the expression of DEorlncRNA pairs was calculated as
either 0 or 1 among a majority (>80%) of all samples, those
lncRNA pairs were not adopted in the following prognostic analysis,
since there is no certain degree of difference in lncRNA pairs,
which means that an accurate prediction of patient survival is
impossible. Only the DEorlncRNA pairs with an expression of 0 or 1
in 20–80% of all samples were considered valid.
Construction of the risk assessment
model
Univariate Cox analysis was first performed on
DEorlncRNA pairs, after which a Lasso regression with 10-fold cross
validation was performed with a threshold P-value of 0.05. A total
of 1,000 cycles were performed in the Lasso regression to minimize
the cross-validation error in obtaining the DEorlncRNA pairs. The
pairs were subsequently used in the Cox proportional hazards
regression analysis and the model analysis was then carried out.
The akaike information criterion (AIC; AIC=−2log L + 2V, where L is
the maximum likelihood of a fit model and V is the number of free
parameters) was calculated for each model (27) and was applied in the following
steps. The AIC of each model was calculated, which was then aborted
once the AIC value reached the minimum point, and that model was
recognized as the optimal candidate model. Next, the receiver
operating characteristic (ROC) curves for 1, 3 and 5 year survival
were plotted. The following formula was used to calculate the risk
score for all samples:
Coef (Table I)
represents the coefficient from the multivariate Cox regression
analysis of each DEorlncRNA pair and E represents the expression
value of the DEorlncRNA pairs, which was obtained during the
aforementioned recognition of DEorlncRNAs. Each point on the ROC
curve was evaluated to obtain the sum of sensitivity and
specificity. The high- or low-risk scores were divided by the
cut-off value, which was equal to the risk score obtained from the
maximum point of the curve. The survival (version 3.2-13),
survminer (version 0.4.9), survivalROC (version 1.0.3) and glmnet
(version 4.1-3) R packages were used in the above steps.
 | Table I.Regression coefficients of DEorlnRNAs
included in the Lasso regression analysis. |
Table I.
Regression coefficients of DEorlnRNAs
included in the Lasso regression analysis.
| DEorlncRNA | Coefficient |
|---|
|
SCAT2|AC112496.1 | 0.79067414 |
|
ARHGEF38-IT1|AL136115.2 | −0.62254692 |
|
AC026356.1|AC026368.1 | 0.56929575 |
|
AC016831.4|AC104695.4 | −0.90749403 |
|
AC092338.1|AC087222.1 | 0.67053059 |
|
LINC01811|MIR181A2HG | −0.36402154 |
Verification of the constructed model
using all 548 cases from TCGA
The cut-off point used was first verified.
Kaplan-Meier analysis was used to indicate the survival differences
between groups with different risk grades through the log-rank test
and the curve was plotted for visualization. The R tool was used to
visualize the specific risk score of each sample in the model.
To explore the clinical value of the model, a
χ2 test was performed to analyze the relationship
between the model and different clinical traits (e.g., patient age,
sex and American Joint Committee on Cancer tumor stage) (28). The results of the analyses were
displayed in a band diagram that was subsequently plotted. A
Wilcoxon signed-rank test was applied to calculate the difference
in the risk scores among groups with different clinicopathological
features (e.g., patient age, sex and tumor stage). The results of
the analyses were presented as a box-plot. Cox regression analysis,
including single and multivariate variables, was applied to
evaluate the association between the risk score and the
aforementioned clinicopathological features. Thus, whether the risk
model may be an independent prognostic indicator of CRC was
verified. The results were displayed in a forest map. The R
packages survival, surviviner, survivalROC, limma, ggpubr, pheatmap
and complex Heatmap were used for the aforementioned analyses.
Gene association analysis based on
risk score
To explore the differences in gene expression
between the high and low-risk groups, the level of target gene
expression and patients' risk score values were first extracted and
then combined. Next, the data were compared between the two groups.
The mean values used for testing were compared and the results of
the analysis were presented in a violin diagram. The limma and
ggpubr R packages were used for this analysis. Gene expression
status was verified through using the immunohistochemical staining
database (accession no. CAB013272, CAB013272, CAB000003, CAB004022,
CAB011671, CAB025583 and HPA003590; http://www.proteinatlas.org/).
Correlation analysis with
tumor-infiltrating immune cells
Since the lncRNAs recognized by the co-expression
analysis were initially associated with orgenes (and therefore may
also be linked to immunity), the correlation of the model related
to immune cell infiltration in the tumor microenvironment was
investigated. To investigate the potential connection between the
risk score and tumor-infiltrating immune cells, a method that
combined currently acknowledged methods of evaluating the immune
cell infiltration status among CRC samples was applied, which
included XCELL, TIMER, QUANTISEQ, MCPCOUNTER, EPIC, CIBERSORT-ABS
and CIBERSORT. To improve the accuracy of the correlation analysis,
the content of infiltrating immune cells was compared between the
aforementioned high- and low-risk groups with a Mann-Whitney
U-test. Spearman's correlation analysis was used to analyze the
correlation between risk score and immune cell infiltration. The
cut-off value was set as P<0.05 and these results were presented
in a lollipop diagram. The R packages limma, scales, ggplot2 and
ggtext were applied as in the aforementioned analyses.
Functional assessment of the model in
clinical therapy
To assess the application value of the model in
clinical therapy for CRC, the IC50 values of several
common immunotherapy and chemotherapy drugs in the TCGA dataset
were evaluated. Antitumor medication used in this assessment
included cisplatin, camptothecin, doxorubicin, dasatinib, bleomycin
and docetaxel. The Mann-Whitney U-test was applied to compare the
IC50 of the drugs between the high- and low-risk groups.
Box plots were used to visualize the results. The R packages limma,
ggpubr, pRRophetic and ggplot2 were used to complete the
aforementioned tests.
Sampling of tumor tissues
A tissue sample with pathological stage T2N0Mx was
collected from a male patient with colorectal cancer (aged 55
years) in January 2022 at Sir Run Run Shaw Hospital (Hangzhou,
China). The tumor tissue was placed in Tissue RNA protection
solution RNAsafer Stabilizer Reagent (cat. no. R1100; Applygen
Technologies, Inc.) and stored at −80°C. Prior to sampling, the
surface of the tumor was thoroughly cleaned with PBS to remove any
impurities from the surface of the tumor. The tumor was then cut
open and ~100 mg of the brittle part of the center of the tumor was
taken as the experimental sample.
Verification by reverse
transcription-quantitative PCR (RT-qPCR)
TRIzol™ (Invitrogen; Thermo Fisher Scientific, Inc.)
was used to extract total RNA from the CRC tissues as per the
manufacturer's instructions. A NanoDrop™ 2000 Spectrophotometer
(Thermo Fisher Scientific, Inc.) was used for RNA quantification,
with the A260/280 ratio indicating RNA purity. RT was performed
using the PrimeScript RT Reagent Kit according to the
manufacturer's protocol (Takara Biotechnology Co., Inc.). Then cDNA
amplification was performed on a C1000 Touch Thermal Cycler
Detection System (Bio-Rad Laboratories, Inc.) in triplicate. The
reaction mixture (total volume, 50 µl) was comprised of 1 ng cDNA,
125 nM forward and reverse primers and 25 µl 2X SYBR®
Premix Ex Taq™ (Takara Biotechnology Co., Inc.). The thermocycling
conditions were as follows: Initial denaturation at 95°C for 1 min,
followed by 42 cycles of 95°C for 15 sec, 56°C for 25 sec and 72°C
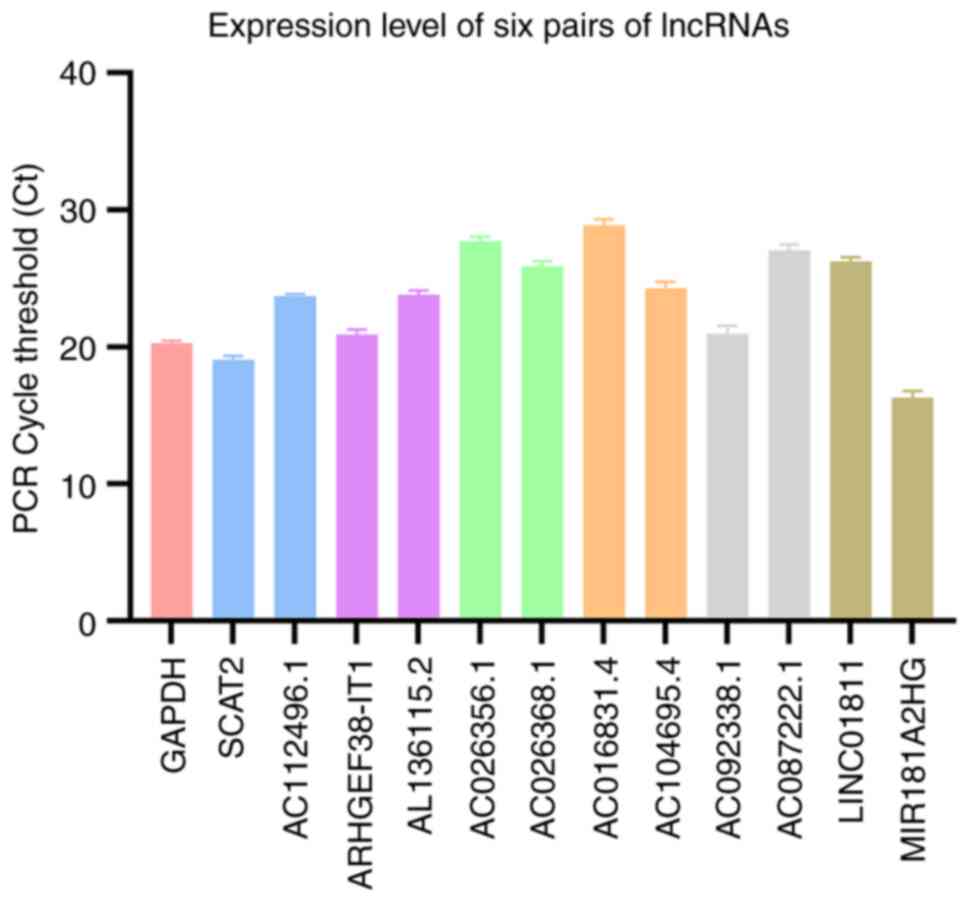
for 30 sec. The primers used are listed in Table SI. lncRNA expression levels were
assessed using the cycle threshold method according to the
according to previously reported methods (29). The lncRNA expression levels were
analyzed using an unpaired Student's t-test. Expression levels were
compared according to the cycle threshold values of each selected
DEorlncRNA, which were then verified for each sample according to
the aforementioned risk score formula.
Verification of the biological impact
of the orlncRNAs
LoVo CRC cell lines were purchased from the American
Type Culture Collection. LoVo cells were maintained in 1640
(HyClone; Cytiva) with 10% FBS (Gibco; Thermo Fisher Scientific,
Inc.) and 100 U/ml penicillin. LoVo cells were seeded into a 6-well
plate and cultured at 37°C and 5% CO2. Their growth was
closely monitored until they reached 80% confluence, and they were
then transfected with siRNA (siRNA Transfection Reagent; cat. no.
sc-29528; Santa Cruz Biotechnology, Inc.) using Lipofectamine 2000
(Invitrogen; Thermo Fisher Scientific, Inc.). Briefly,
Lipofectamine 2000™ was diluted to 5 µl/well and siRNA were diluted
to a final concentration of 100 nM. The solutions were incubated
separately for 5 min and mixed for 15 min, both at 25C. The mixture
was then added to the cells in the 6-well plate and incubated at
37C. After 8 h, the growth medium was changed to fresh media and
the cells were further incubated at 37°C for 24 h under 5%
CO2. The cells were immediately collected for further
analysis.
Oncosis was induced in LoVo cells with or without
lncRNA knockdown (30) [using
small interfering RNA-MIR181A2 host gene (si-MIR181A2HG) or
si-negative control (si-NC); Table
SII] with 0.01% Triton X-100 (Sigma-Aldrich; Merck KGaA)
(31) for 10 min at 37°C and
repeated 3 times. After induction, the cells were centrifuged at
300 × g for 5 min at 25°C the supernatant was discarded and the
cells were collected. The cells were gently resuspended in PBS and
counted using a Countess II fluorescence microscope (Thermo Fisher
Scientific, Inc.). A total of 2×10⁵ suspended cells were
centrifuged at 300 × g for 5 min and the supernatant was discarded.
The cells were washed once more with PBS and the supernatant was
discarded after centrifugation. To resuspend the cells, 500 µl
DilC1(5) dyeing solution (CAS no. 36536-22-8; Enzo Life Sciences,
Inc.) was added to the cell pellet. The cells were then incubated
in a 5% CO2 incubator at 37°C for 15–20 min. After this
incubation, the cells were centrifuged at 300 × g for 5 min, the
supernatant was discarded and 500 µl pre-cooled (4°C) 1X PBS was
added to the cells. This cell washing was repeated twice. Finally,
500 µl of the aforementioned precooled buffer was used to resuspend
the cells. The samples were stored on ice and detected by flow
cytometry within 30 min.
The cell suspensions were analyzed by flow cytometry
(BD FACSCalibur; BD Biosciences) and the fluorescence channels
corresponding to the dyes were selected for data analysis [DilC1(5)
was detected in the 660/20 nm channel on HeNe trigon]. The data
were analyzed and processed using FlowJo (version 10.8.1, FlowJo
LLC).
For the fluorescence microscope observation, the
cells (a total of 2×10⁵) were seeded in a confocal dish
for different treatments as 6 groups in the aforementioned flow
cytometry section. A total of 200 µl of the DilC1(5) dyeing
solution (CAS no. 36536-22-8; Enzo Life Sciences, Inc.) was then
added and the cells were incubated at 37°C with 5% CO2
for 15–20 min. After incubation, 1X PBS was used to wash the cells
1–2 times. Finally, the coverslip was placed upside down on the
slide and the slide was observed under a fluorescence
microscope.
Statistical analysis
The R package limma was applied to recognize
DEorlncRNAs, and log fold-change >2 and FDR <0.05 was set as
the threshold. Univariate Cox analysis, Lasso regression, Cox
proportional hazards regression analysis, multivariate Cox
regression analysis and R packages (survival, surviviner, survival
ROC and glmnet) were used to construct the risk assessment model.
The χ2 test, Wilcoxon signed-rank test, uni- and
multivariate Cox regression analyses and R packages (survival,
survminer, survival ROC, limma, ggpubr, pheatmap and complex
Heatmap) were used to verify the model. The R packages (limma and
ggpubr) were used in gene correlation analysis. Mann-Whitney
U-test, Spearman's correlation analysis, Wilcoxon signed-rank test
and R packages (limma, scales, ggplot2 and ggtext) were used to
analyze the association between risk score and immune cell
infiltration, and the cut-off value was set as P<0.05. The
Mann-Whitney U-test and R packages (limma, ggpubr, pRRophetic and
ggplot2) were used to complete the assessment of the model in
clinical therapy. Experimental data analysis was performed using
GraphPad Prism 9.00. P<0.05 was considered to indicate
statistical significance. All of the individual statistical
analyses are elaborated on in the corresponding methods
sections.
Results
Recognition of DEorlncRNAs
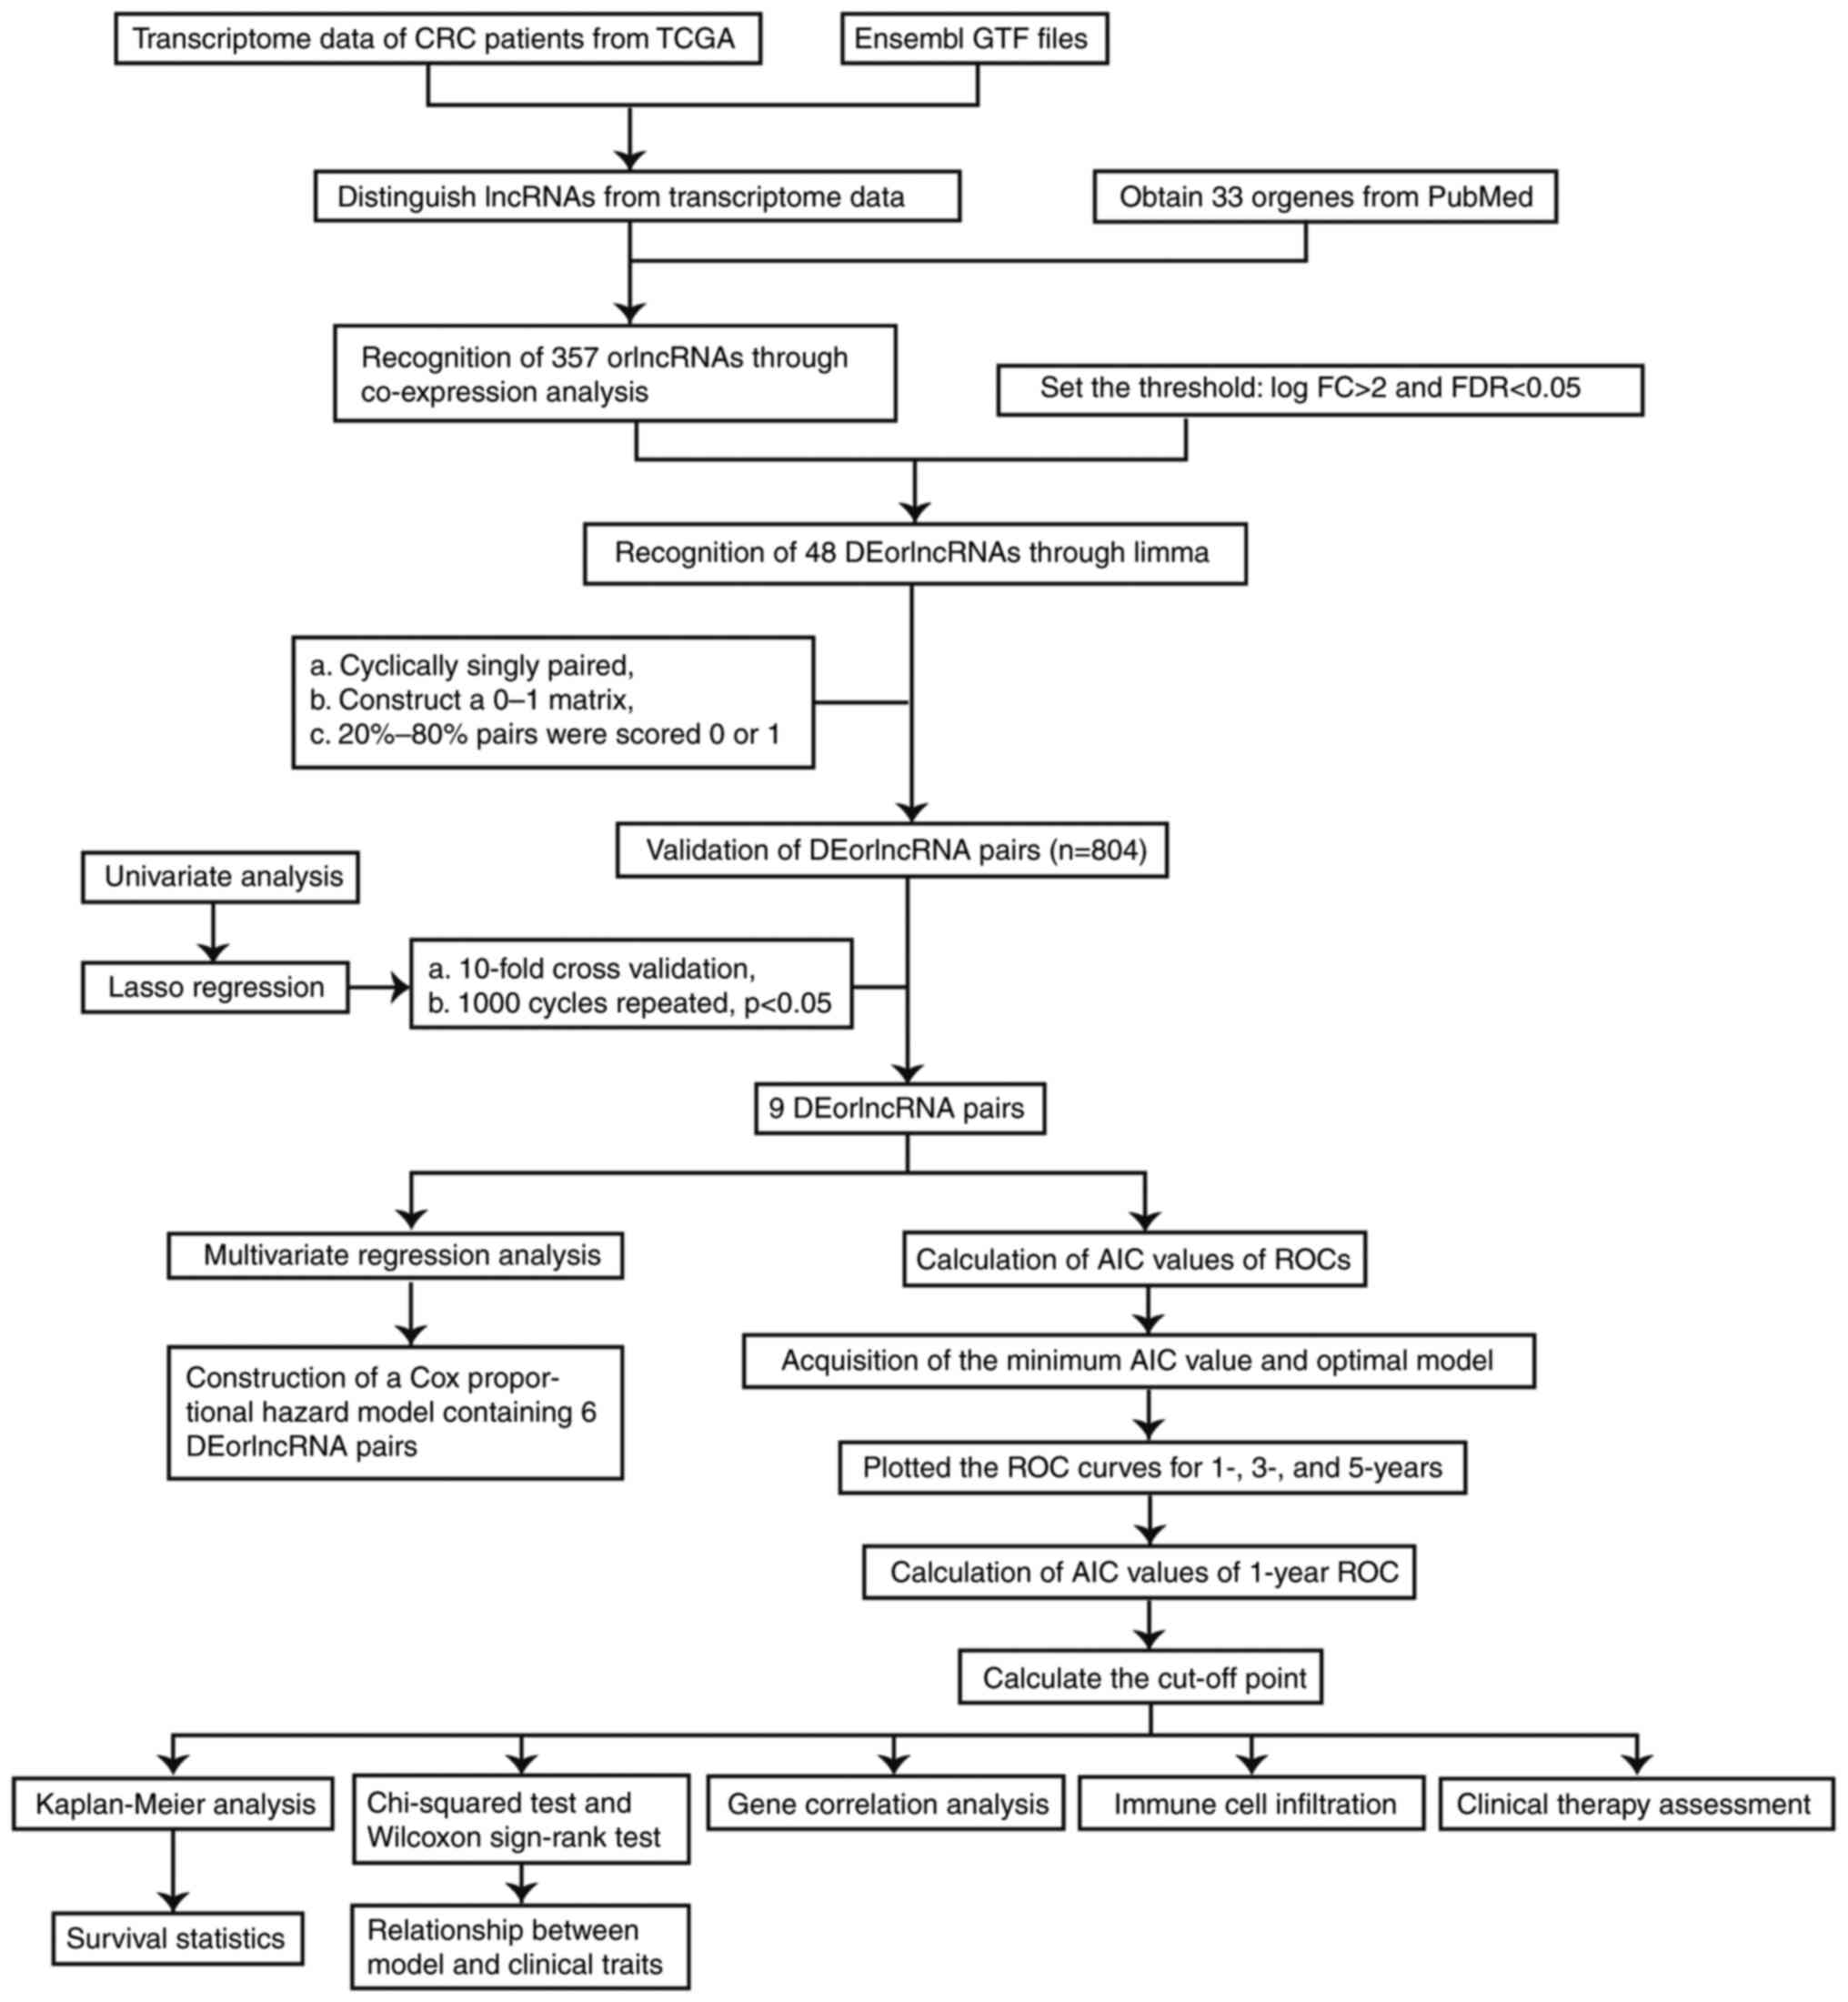
The process flow of the present study is presented
in Fig. 1. First, 44 normal and
568 CRC samples were acquired from the TCGA projects (projects
screened for, colon adenocarcinoma and rectum adenocarcinoma). The
CRC transcriptome data were also obtained from the TCGA database.
Subsequently, a total of 33 oncosis-related genes were collected by
screening on PubMed. Next, Ensembl GTF files were used to annotate
the data and a co-expression analysis was performed between the
orgenes and lncRNA. As many as 357 orlncRNAs were recognized by
using R-x64-4.1.2 language. Of these, 48 were recognized as
DEorlncRNAs through a differential expression analysis. The heat
map in Fig. 2A presents all of the
recognized DEorlncRNAs and their expression status. All of these
DEorlncRNAs were highly expressed (Fig. 2B).
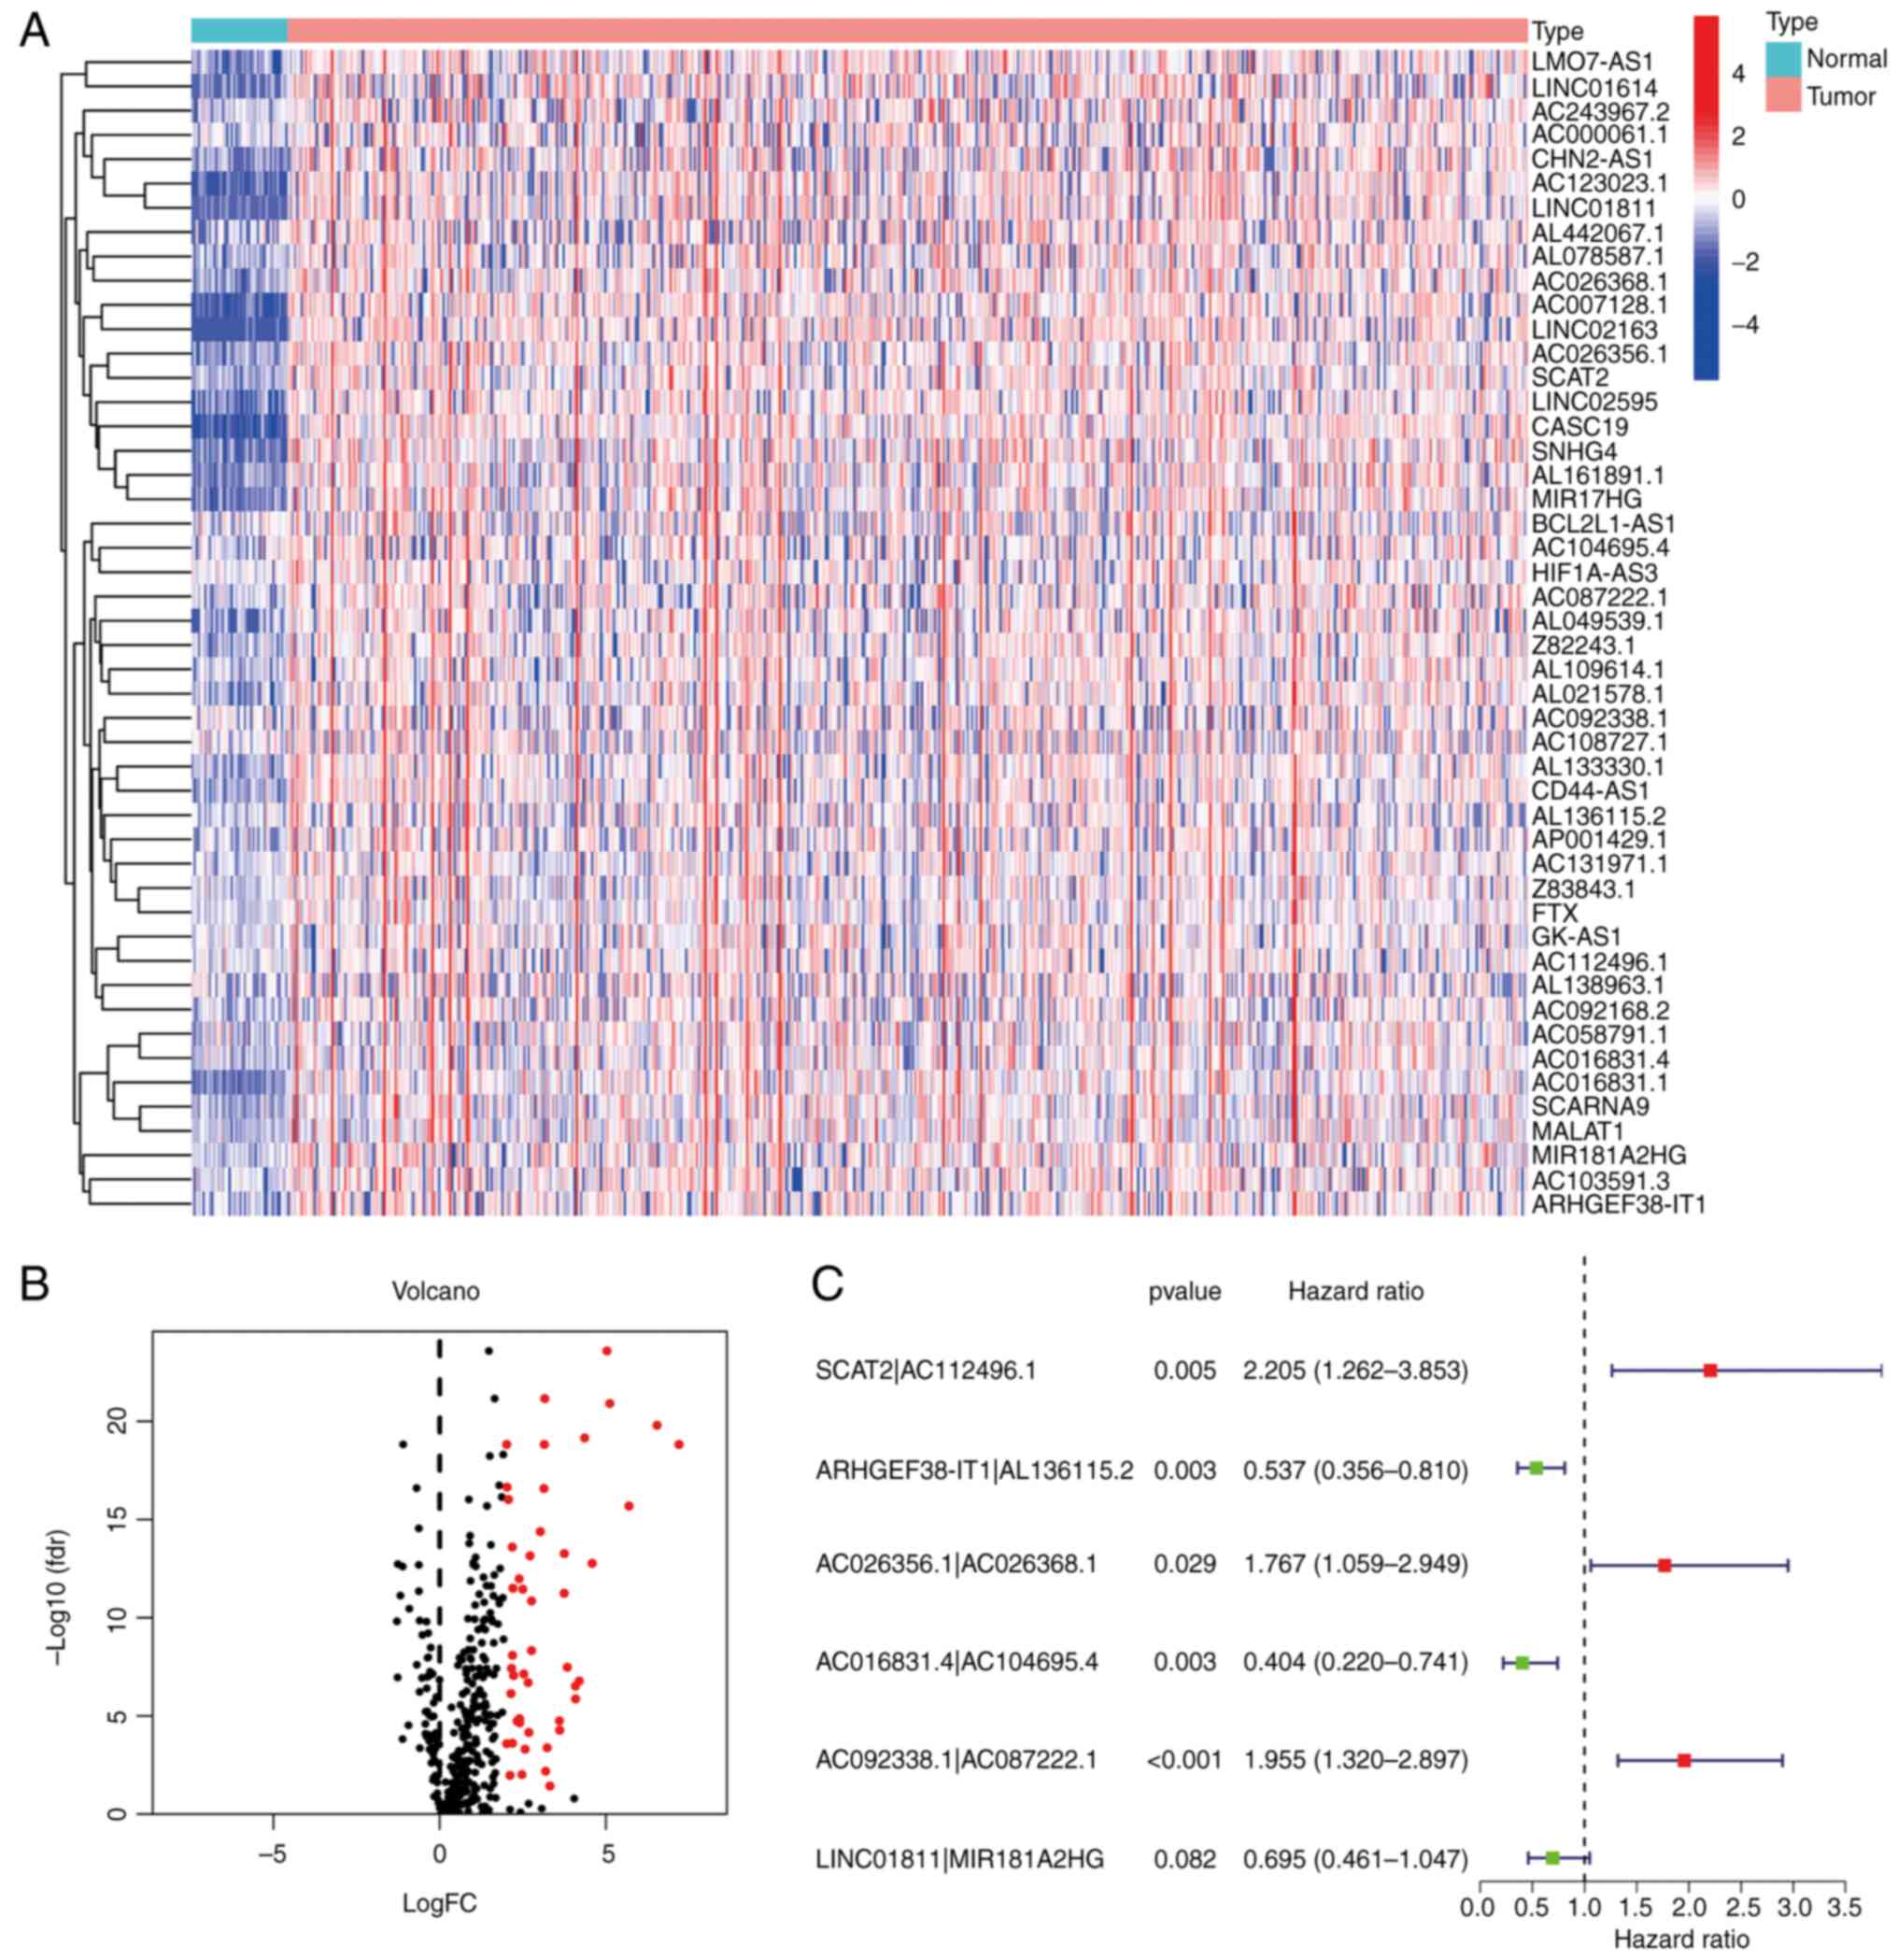 | Figure 2.Recognition of DEorlncRNAs. (A)
Heatmap and (B) volcano plot displaying the expression of 48
DEorlncRNAs in colorectal cancer and normal samples. The columnar
bands from 4 to −4 in figure A represented lncRNA expression levels
as calculated using the pheatmap R package. Red points represent
highly expressed DEorlncRNAs, and black points represent normally
expressed DEorlncRNAs (C) Forest map of the six DEorlncRNA pairs
included in the model (AC112496.1, AL136115.2, AC026356.1,
AC026368.1, AC016831.4, AC104695.4, AC092338.1 and AC087222.1 are
sequence accession numbers). FC, fold change; fdr, false discovery
rate; DEorlncRNA, differentially expressed oncosis-related long
noncoding RNA. |
Construction of the DEorlncRNA pairs
and the risk model
By using iterative loop pairing and 0-or-1 matrix
screening, 804 valid DEorlncRNA pairs were acquired from 48
DEorlncRNAs. A total of 13 DEorlncRNA pairs associated with
prognosis were extracted using univariate analysis. A Lasso
regression analysis was applied to prevent over-fitting and nine
DEorlncRNA pairs were screened out. Finally, six DEorlncRNA pairs
were absorbed into a Cox proportional hazard model by a stepwise
method (Fig. 2C). Thus, the risk
score for all samples was calculated using the risk score formula
and the coefficients (Table I)
obtained from the aforementioned process.
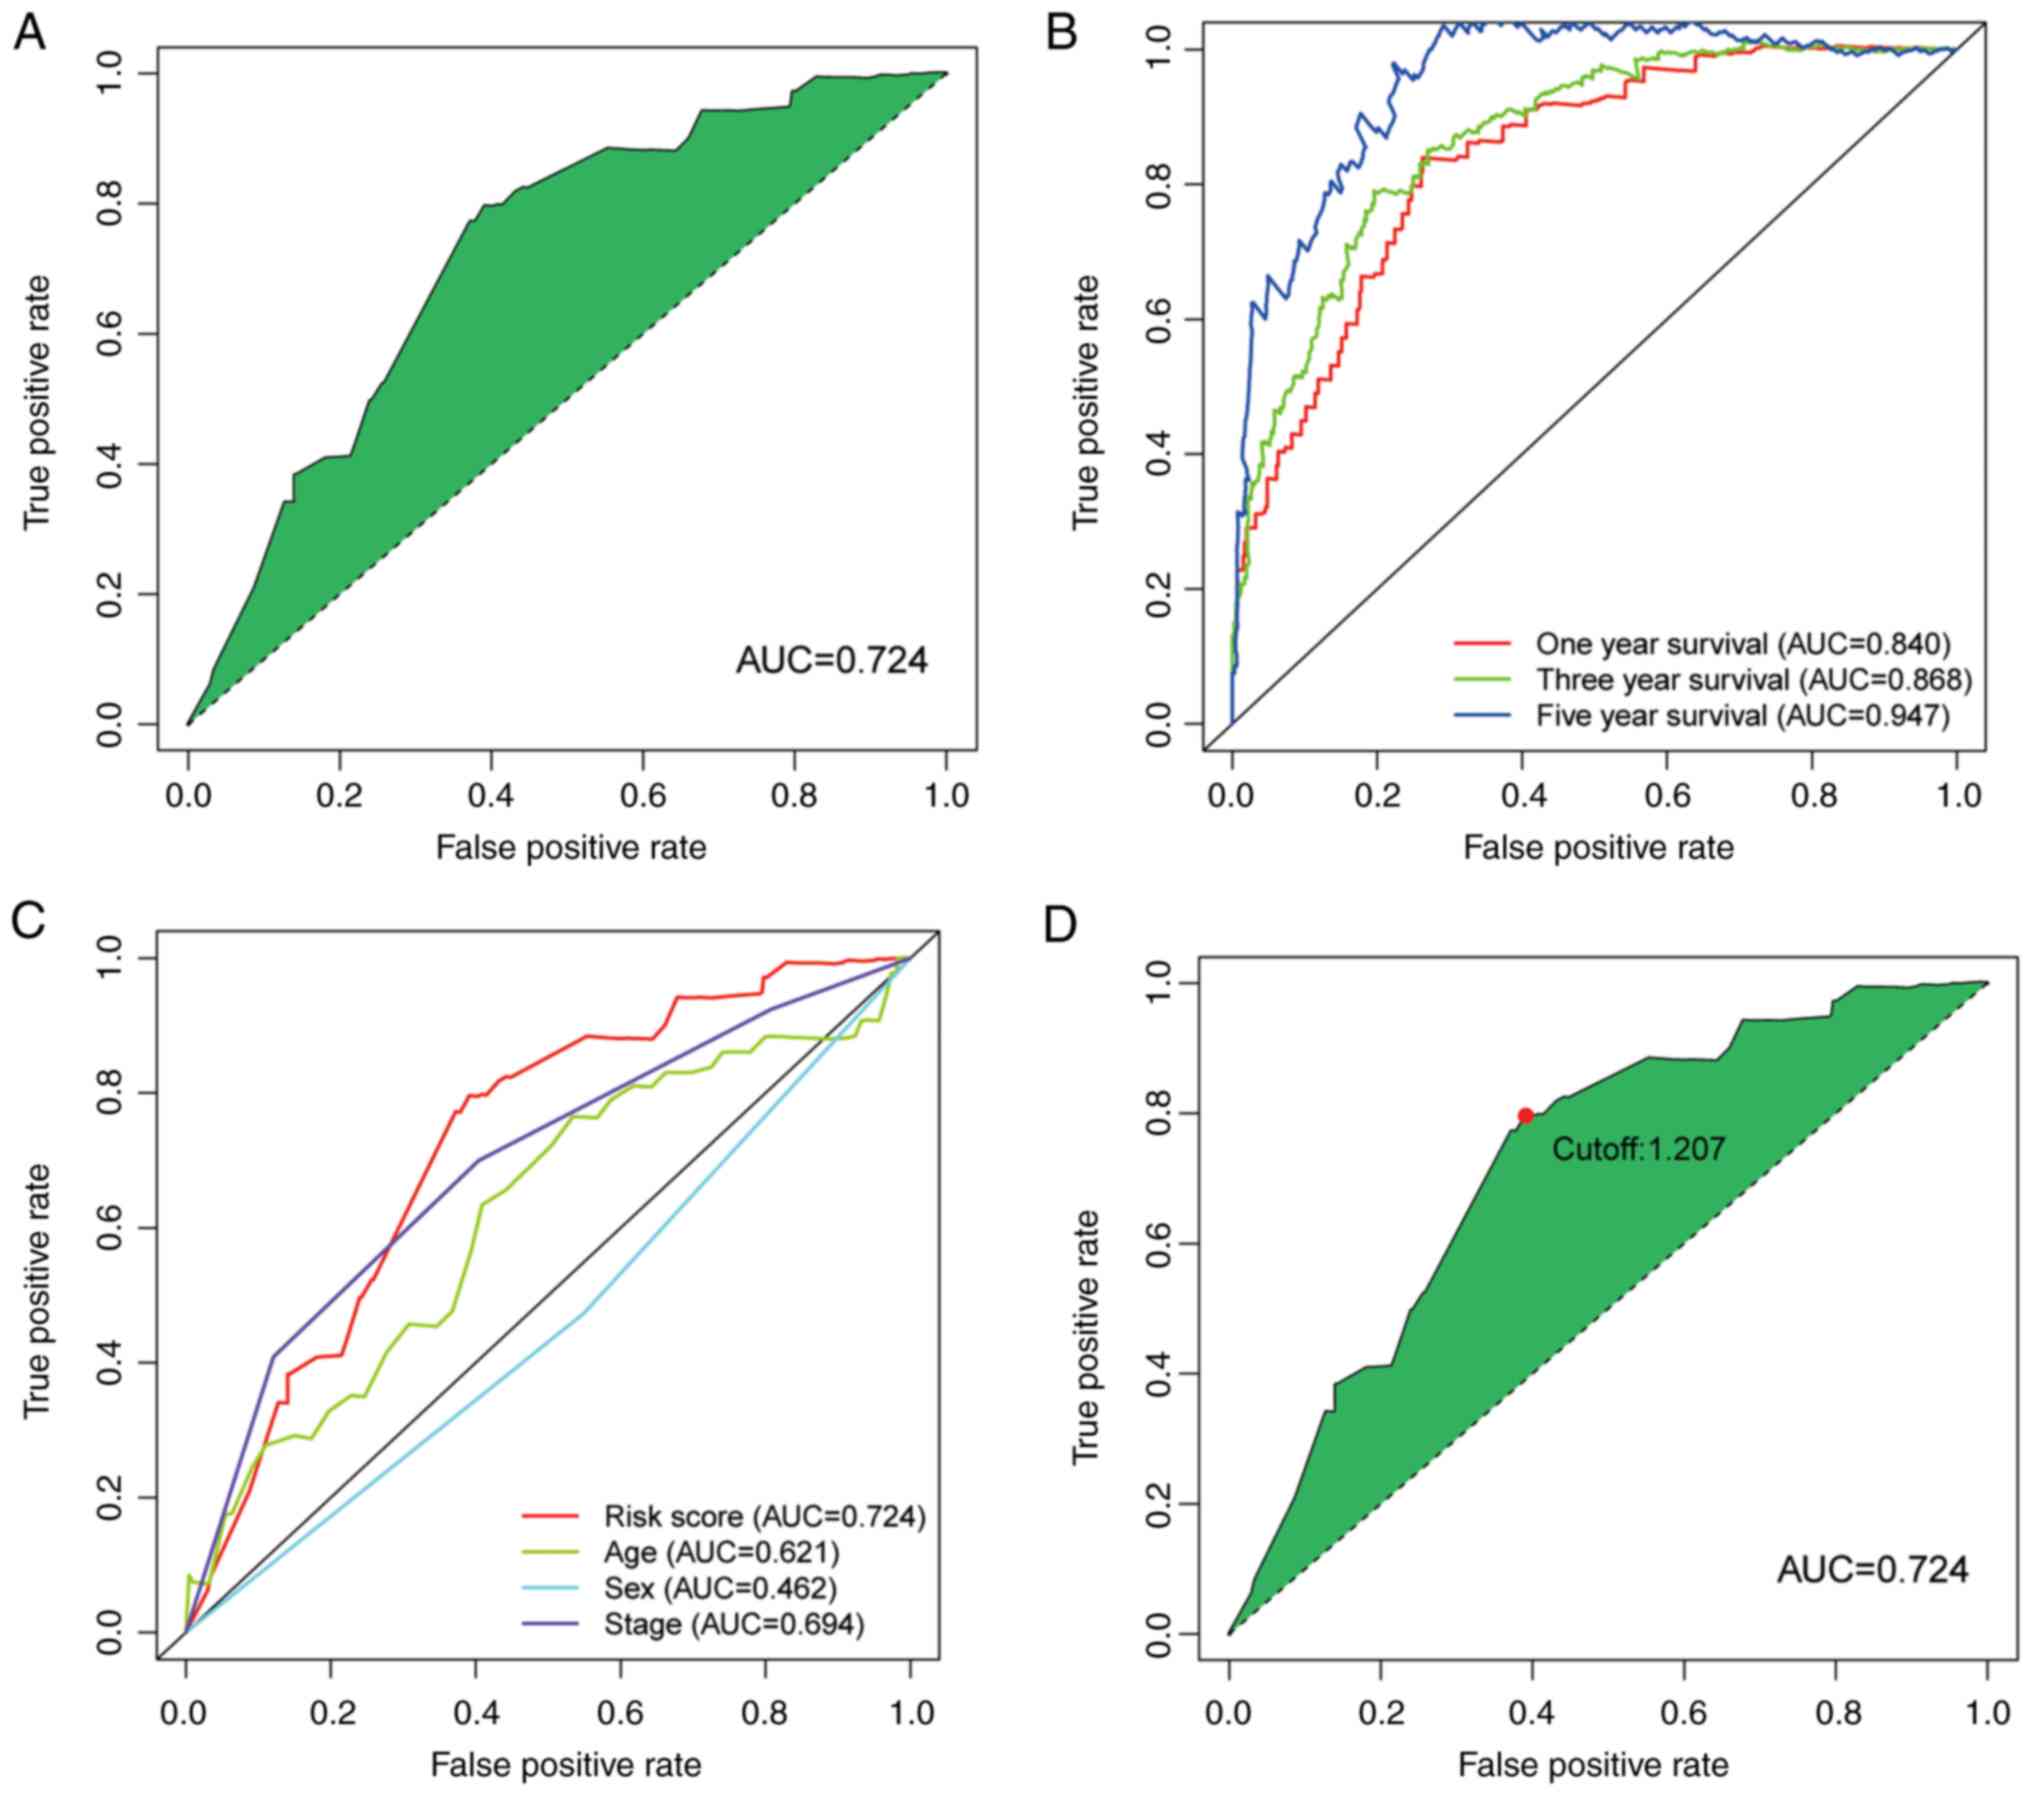
Next, the ROC curve of the model was plotted. The
area under curve (AUC) of the model was 0.724, which was >0.7
(Fig. 3A). This finding suggests
that this model exhibited a fair predictive capability. To confirm
the superiority of the model, the 1, 3, and 5-year ROC curves were
plotted. The AUC value of every curve shown in the results was
>0.7 (Fig. 3B). In addition,
the 1-year ROC curve analysis with other clinical features (e.g.,
age, sex and stage) were also performed and the results indicated
that the risk score had a greater AUC value compared with the other
indicators (Fig. 3C). The maximum
inflection point was recognized by calculating and comparing each
point of the ROC curve. A value of 1.207 was recognized as the
cut-off value (Fig. 3D). This
value was used to separate the samples into different risk groups.
A total of 548 CRC samples were obtained from TCGA database, and 33
cases were excluded due to including incomplete data. Then the risk
score of these rest cases was calculated. Subsequently, for further
verification, the samples were re-distinguished and divided into
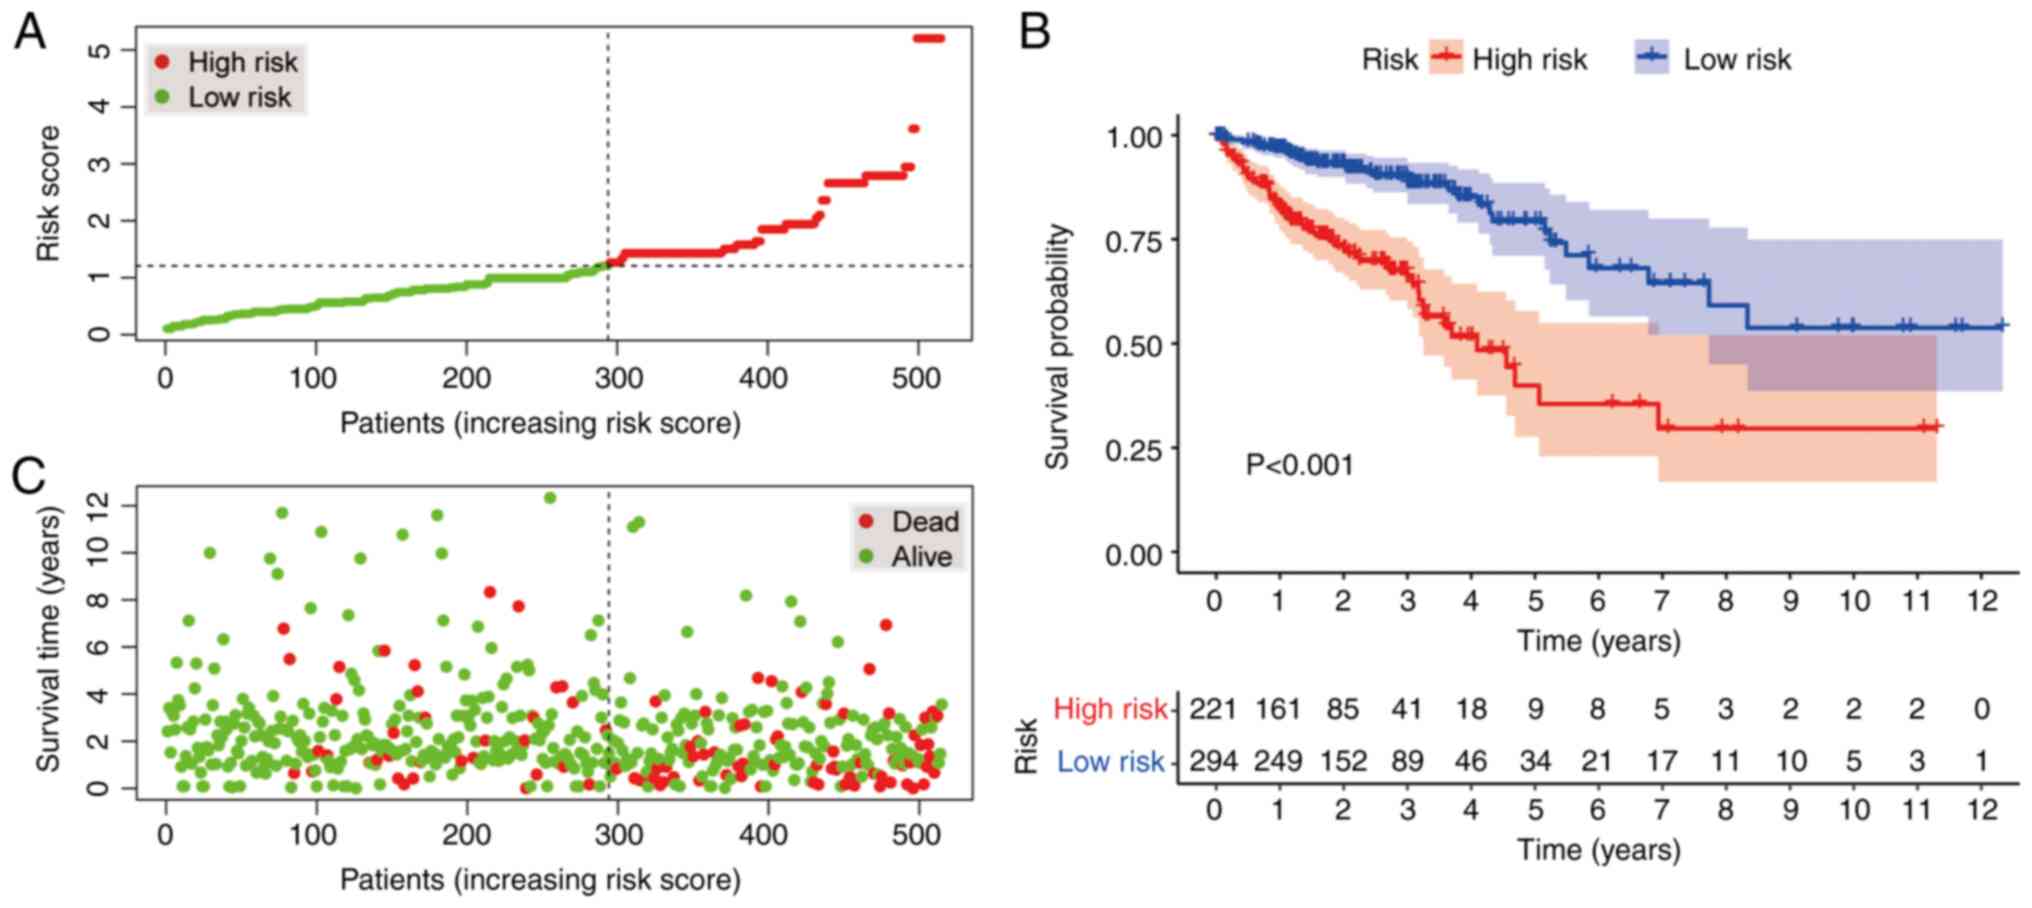
high- and low-risk groups by the cut-off value.
Verification of the constructed model
and its application in clinical evaluation
According to the cut-off value, 221 cases were
classified into the high-risk group, whereas 294 cases were
categorized into the low-risk group. The plots in Fig. 4A and B display the risk scores and
survival status of these cases, respectively. These results
indicated that the patients' survival rate and survival time were
negatively associated with the risk score. As indicated by the
Kaplan-Meier survival analysis, the survival time of the patients
in the high-risk group was shorter than that of the low-risk group
(Fig. 4C).
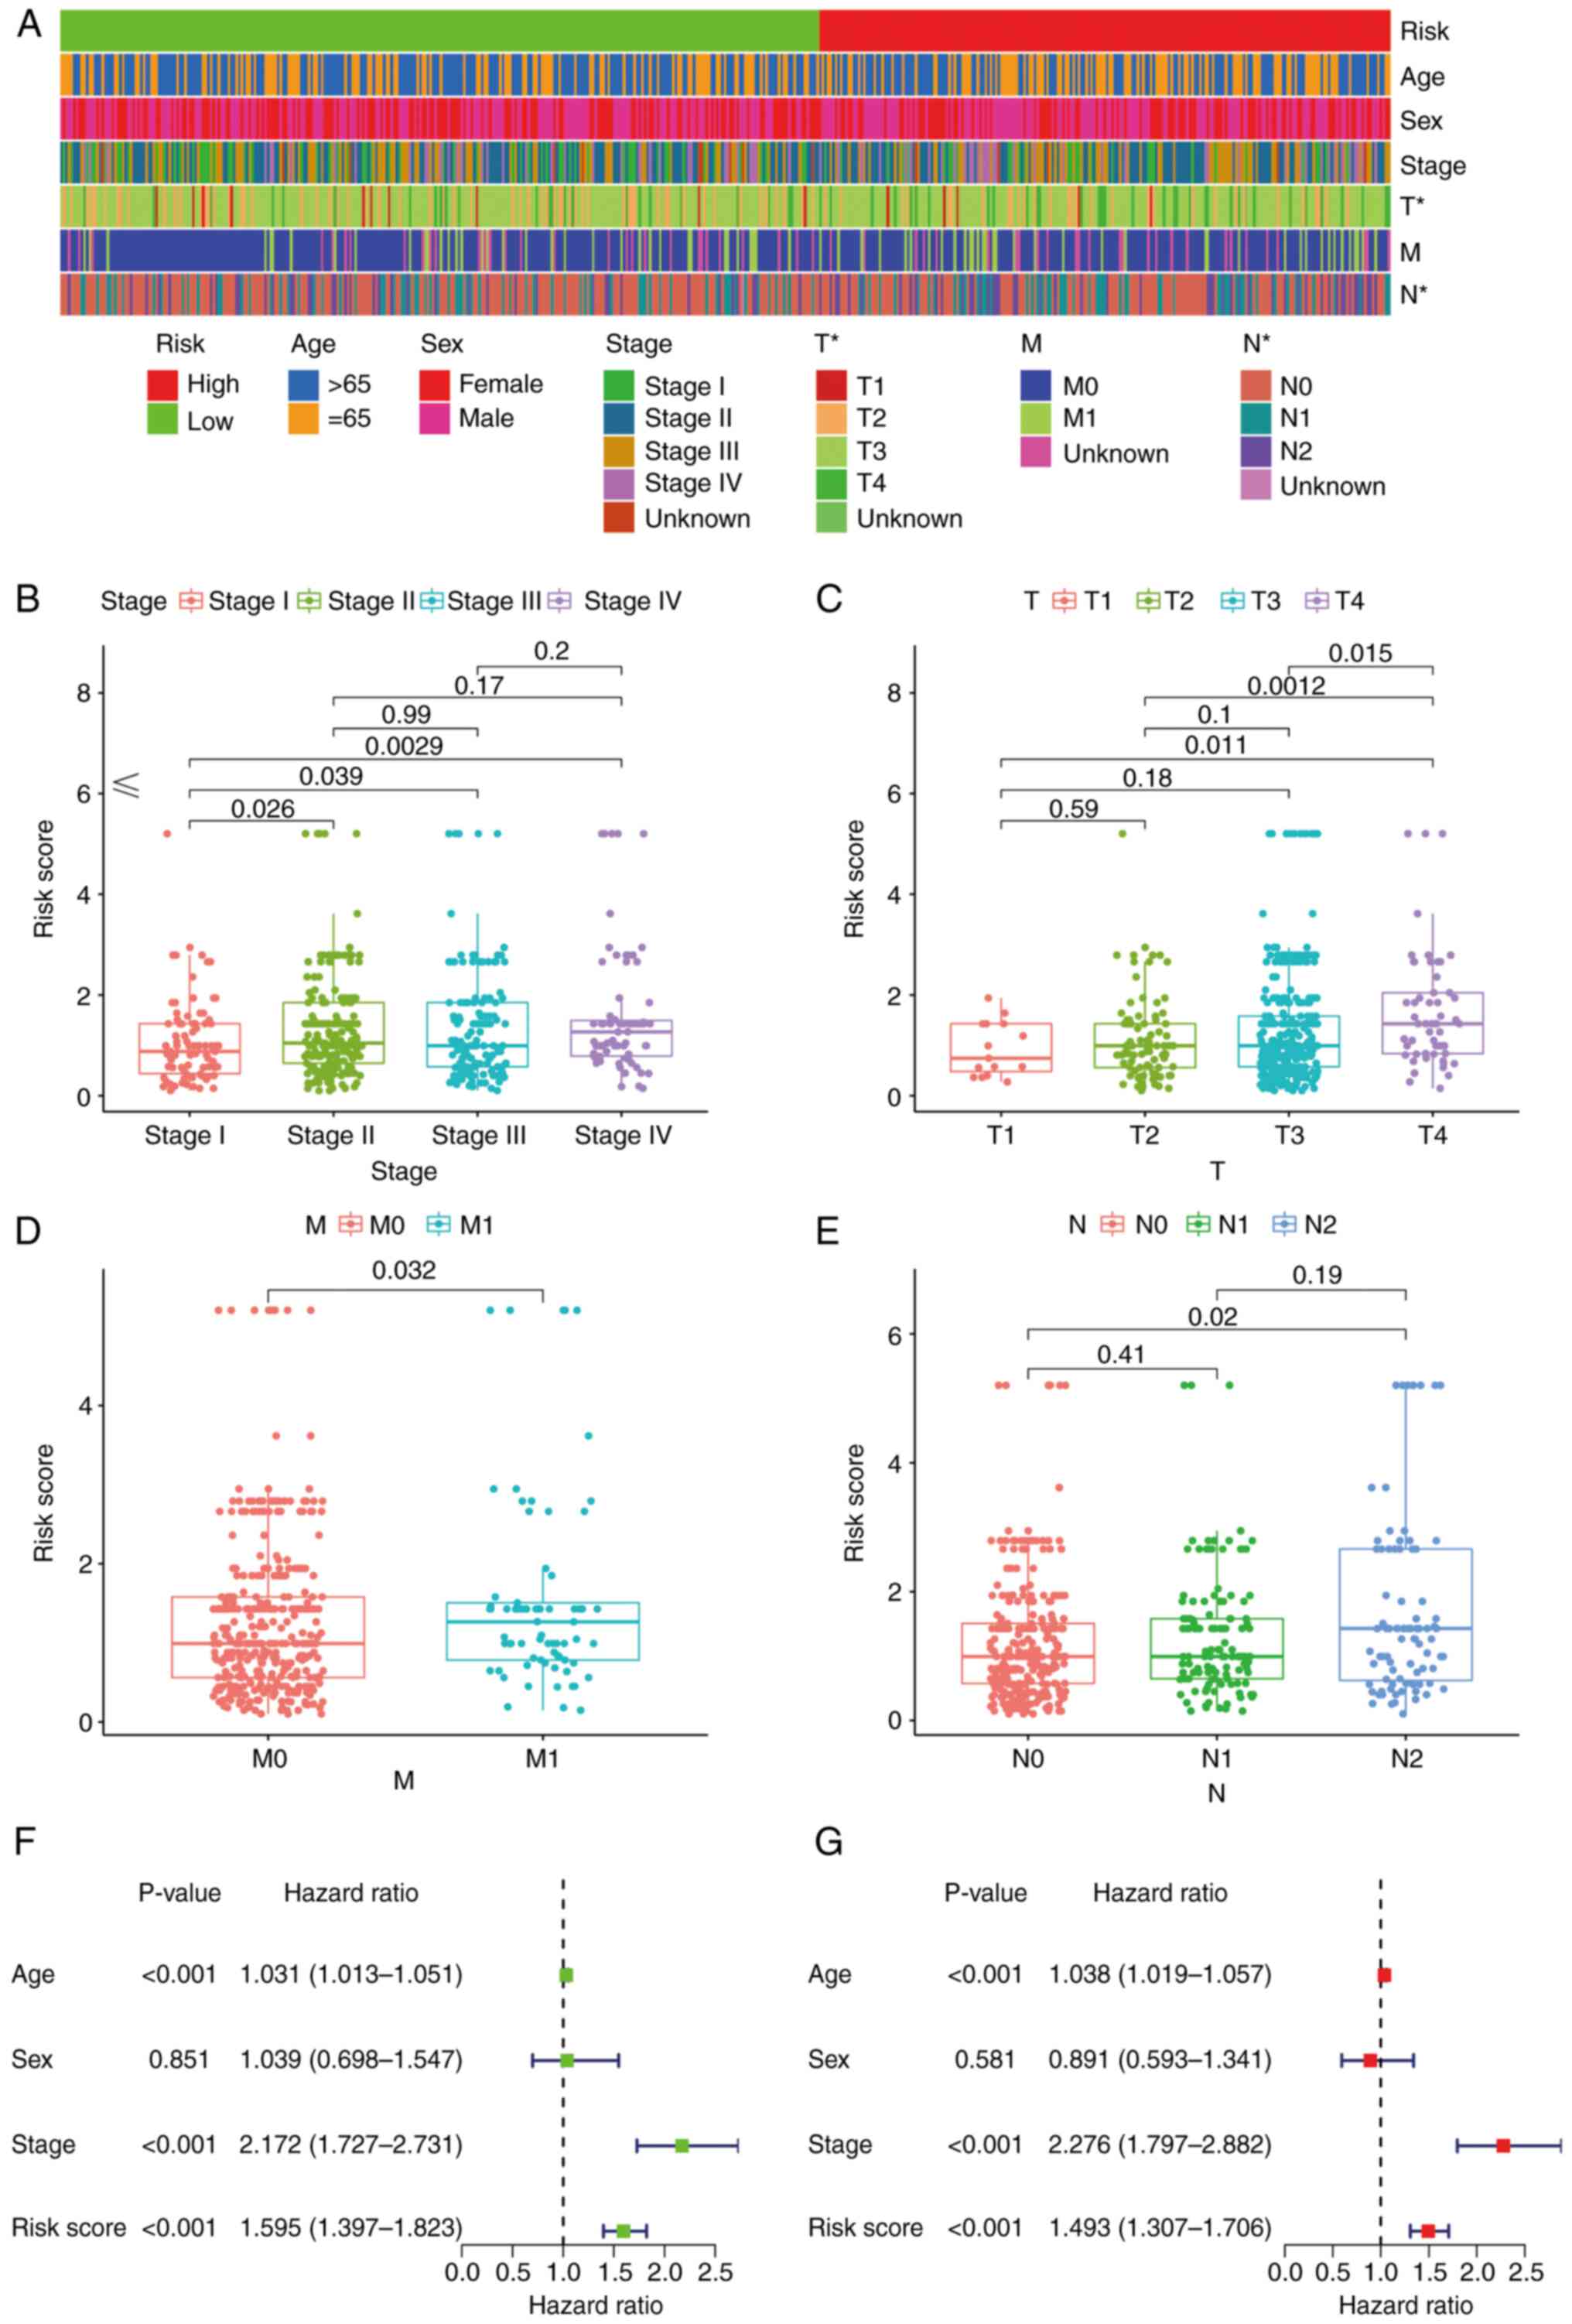
Subsequently, a strip chart and scatter diagrams
indicated that there was a significant association between the risk
score and clinical, tumor, metastasis and node stages according to
the results of a Wilcoxon signed-rank test (Fig. 5A-E). Groups displaying an advanced
stage were associated with a higher risk score. Univariate Cox
regression analysis indicated that age [hazard ratio (HR), 1.031;
95% confidence interval (CI), 1.013–1.051], clinical stage (HR,
2.172; 95% CI, 1.727–2.731) and risk score (HR, 1.595; 95% CI,
1.397–1.823) were statistically significant between the low- and
high-risk groups (Fig. 5F). The
multivariate Cox regression analysis indicated that age (HR, 1.038;
95% CI, 1.019–1.057), clinical stage (HR, 2.276; 95% CI,
1.797–2.882) and risk score (HR, 1.493; 95% CI, 1.307–1.706) may
serve as independent prognostic predictors (Fig. 5G). The P-values for the
aforementioned data were all >0.001.
Gene association analysis based on the
risk score
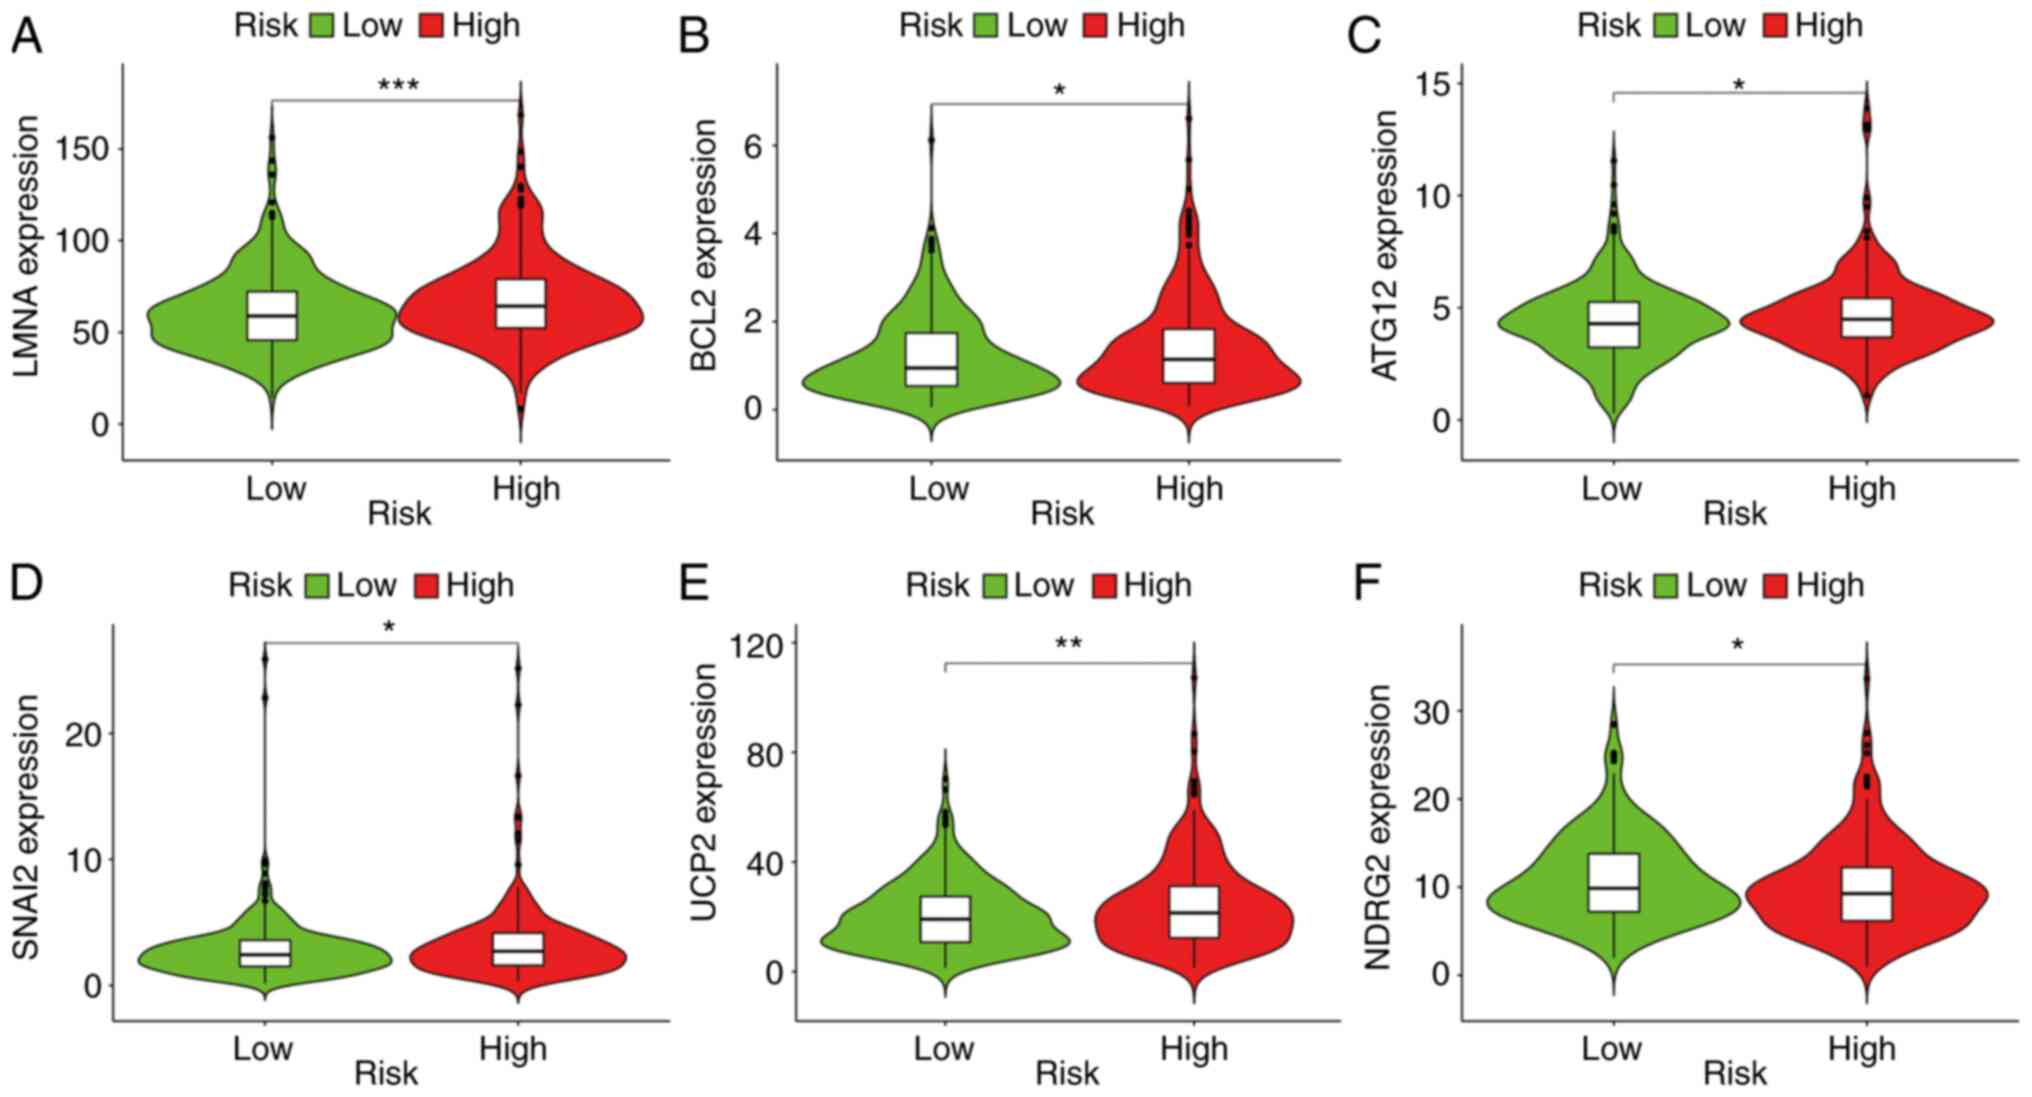
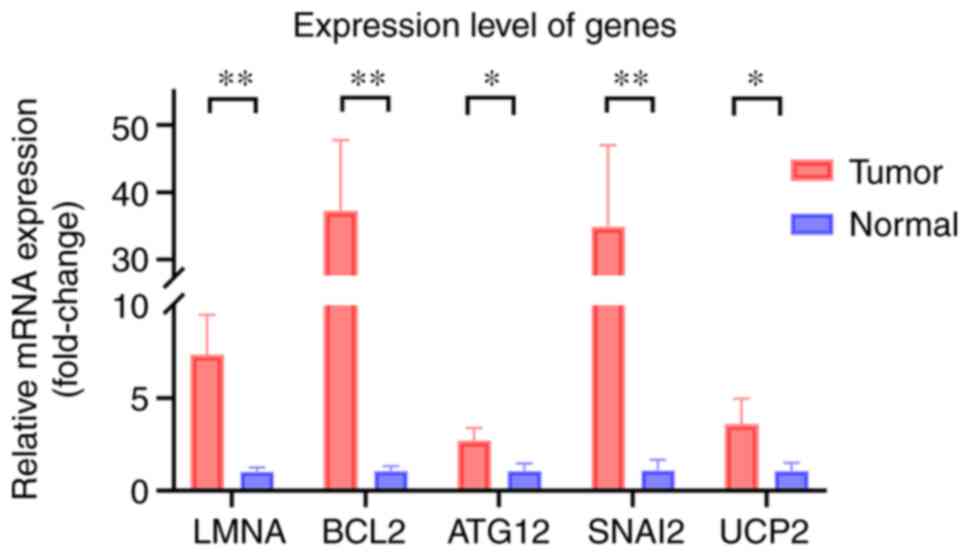
The results indicated that a high-risk score was
positively associated with genes such as ATG12 (P<0.05), BCL2
(P<0.05), LMNA (P<0.001), SNAI2 (P<0.05) and UCP2
(P<0.01) (Fig. 6A-E), whereas
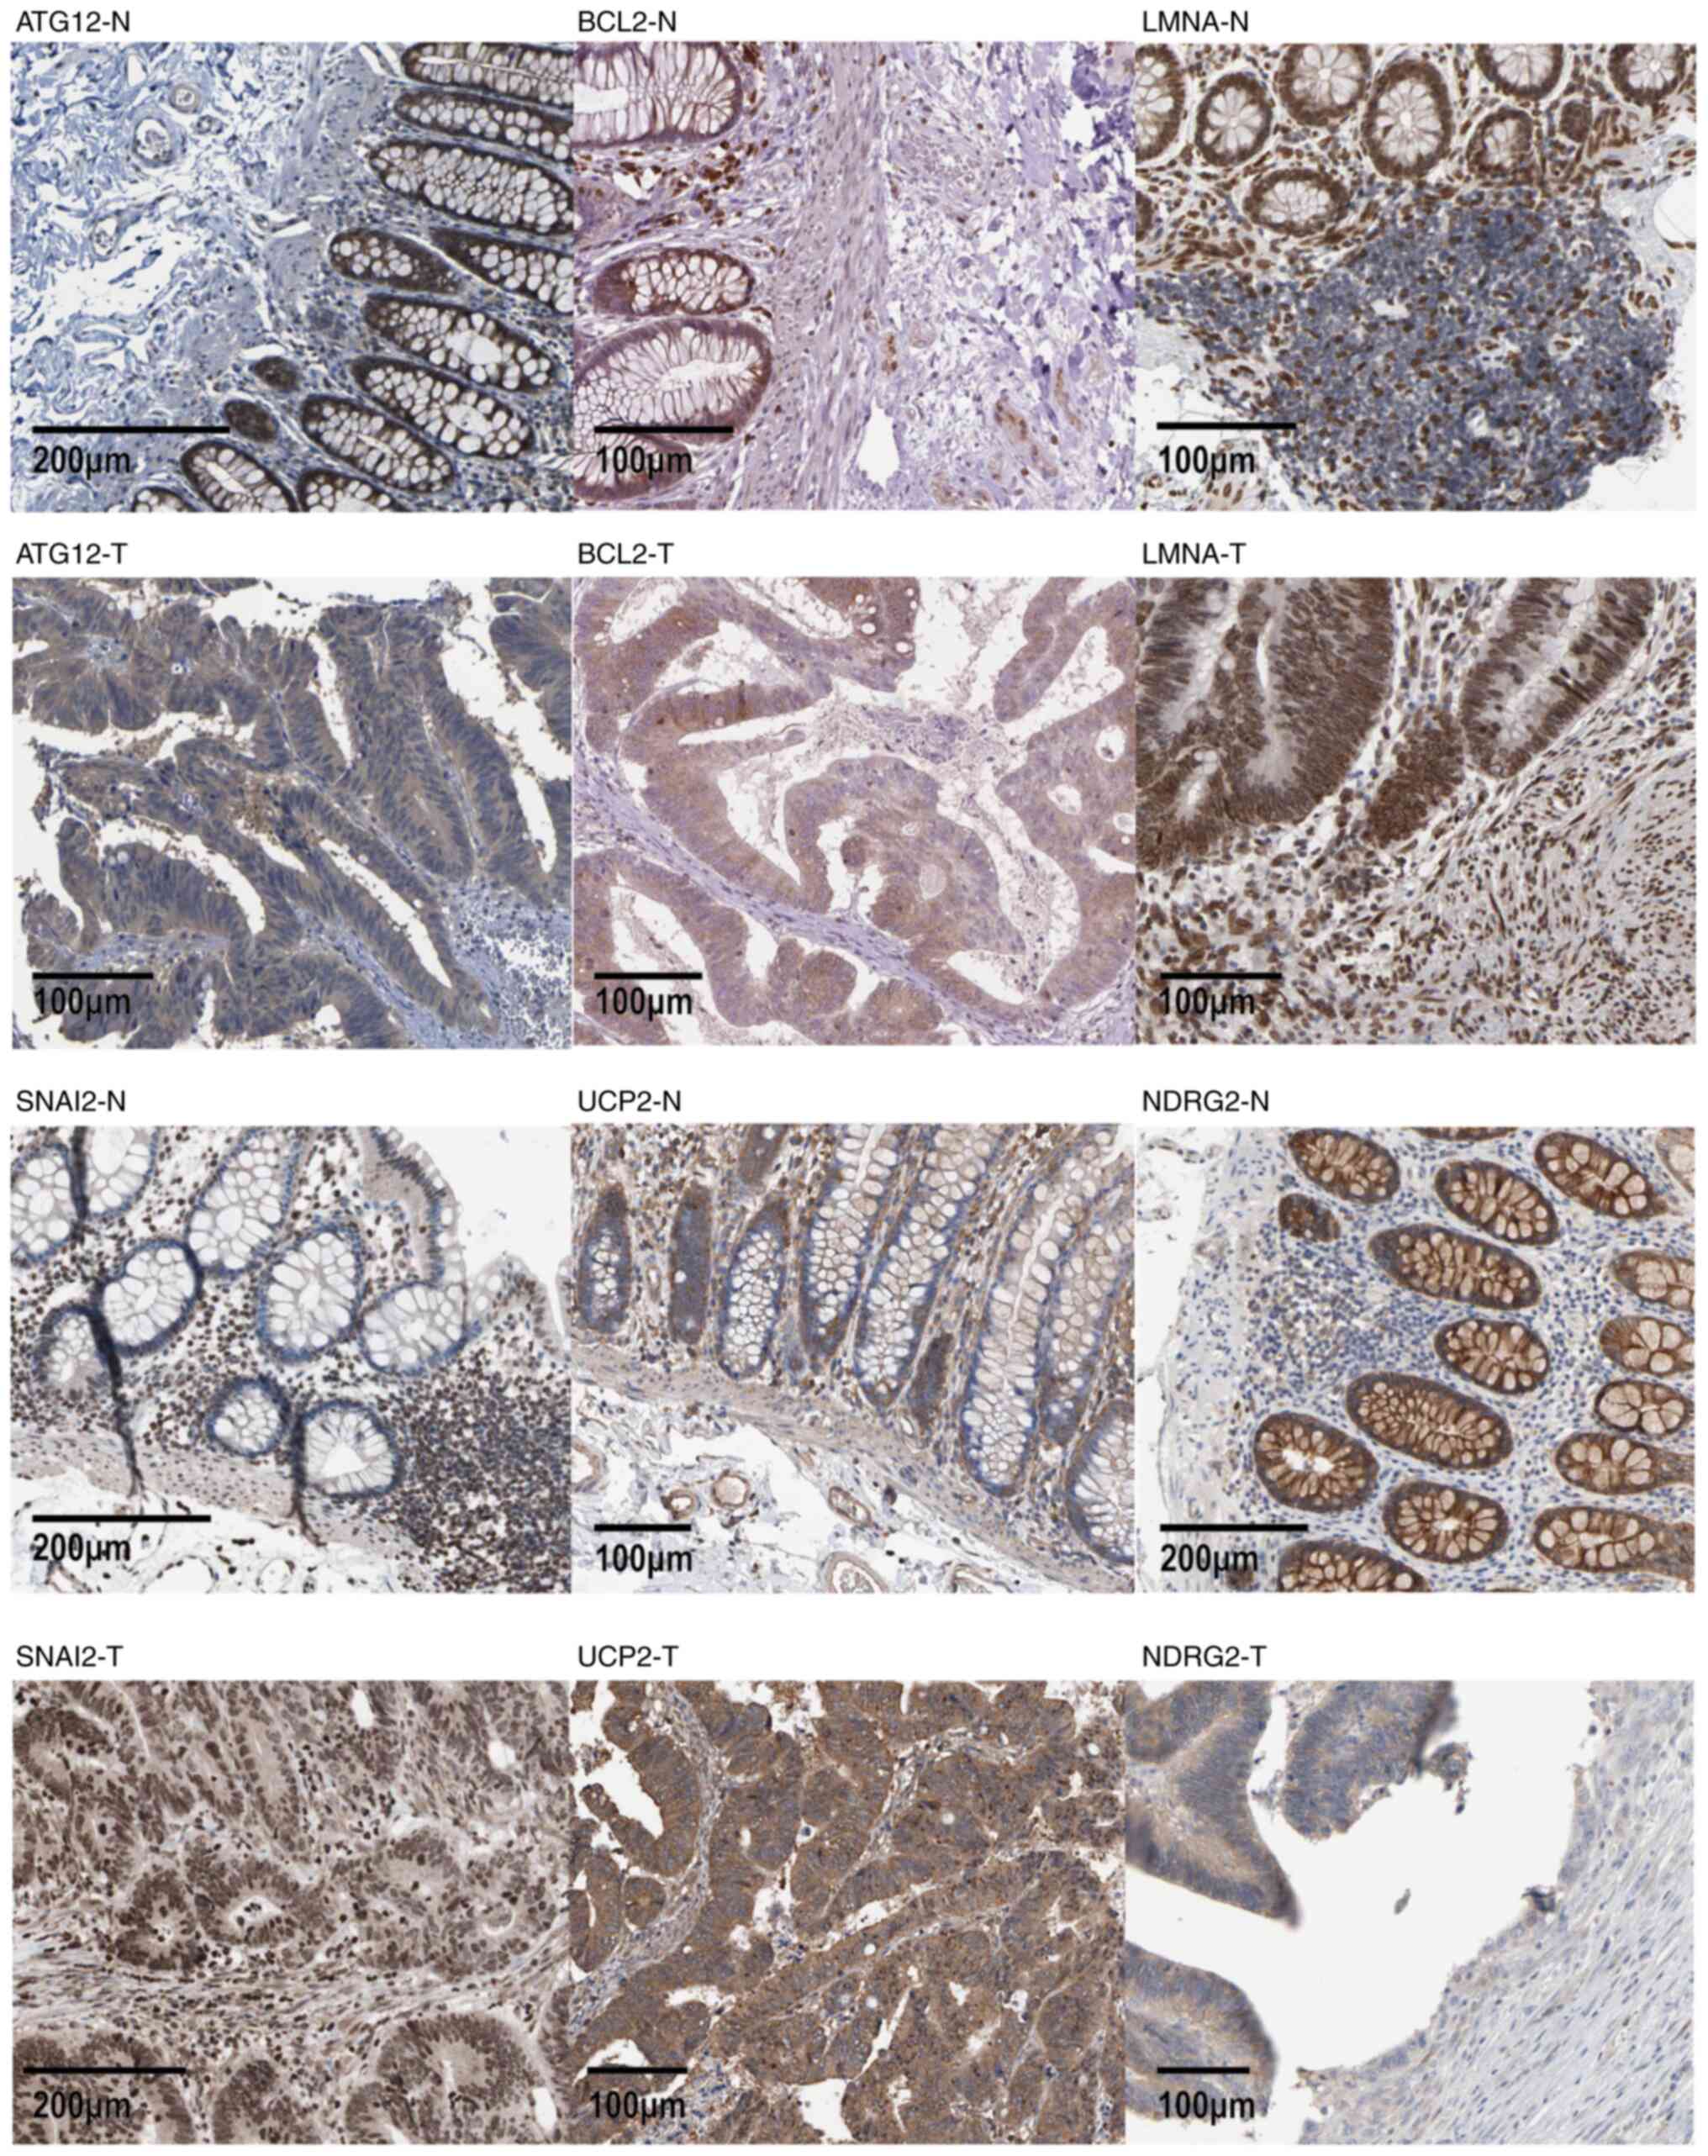
risk was negatively associated with NDRG2 (P<0.05) (Fig. 6F). Immunohistochemical staining
images also indicated that the expression levels of ATG12, BCL2,
LMNA, SNAI2 and UCP2 were higher in cancer tissue compared with
those in normal tissue (Fig.
7).
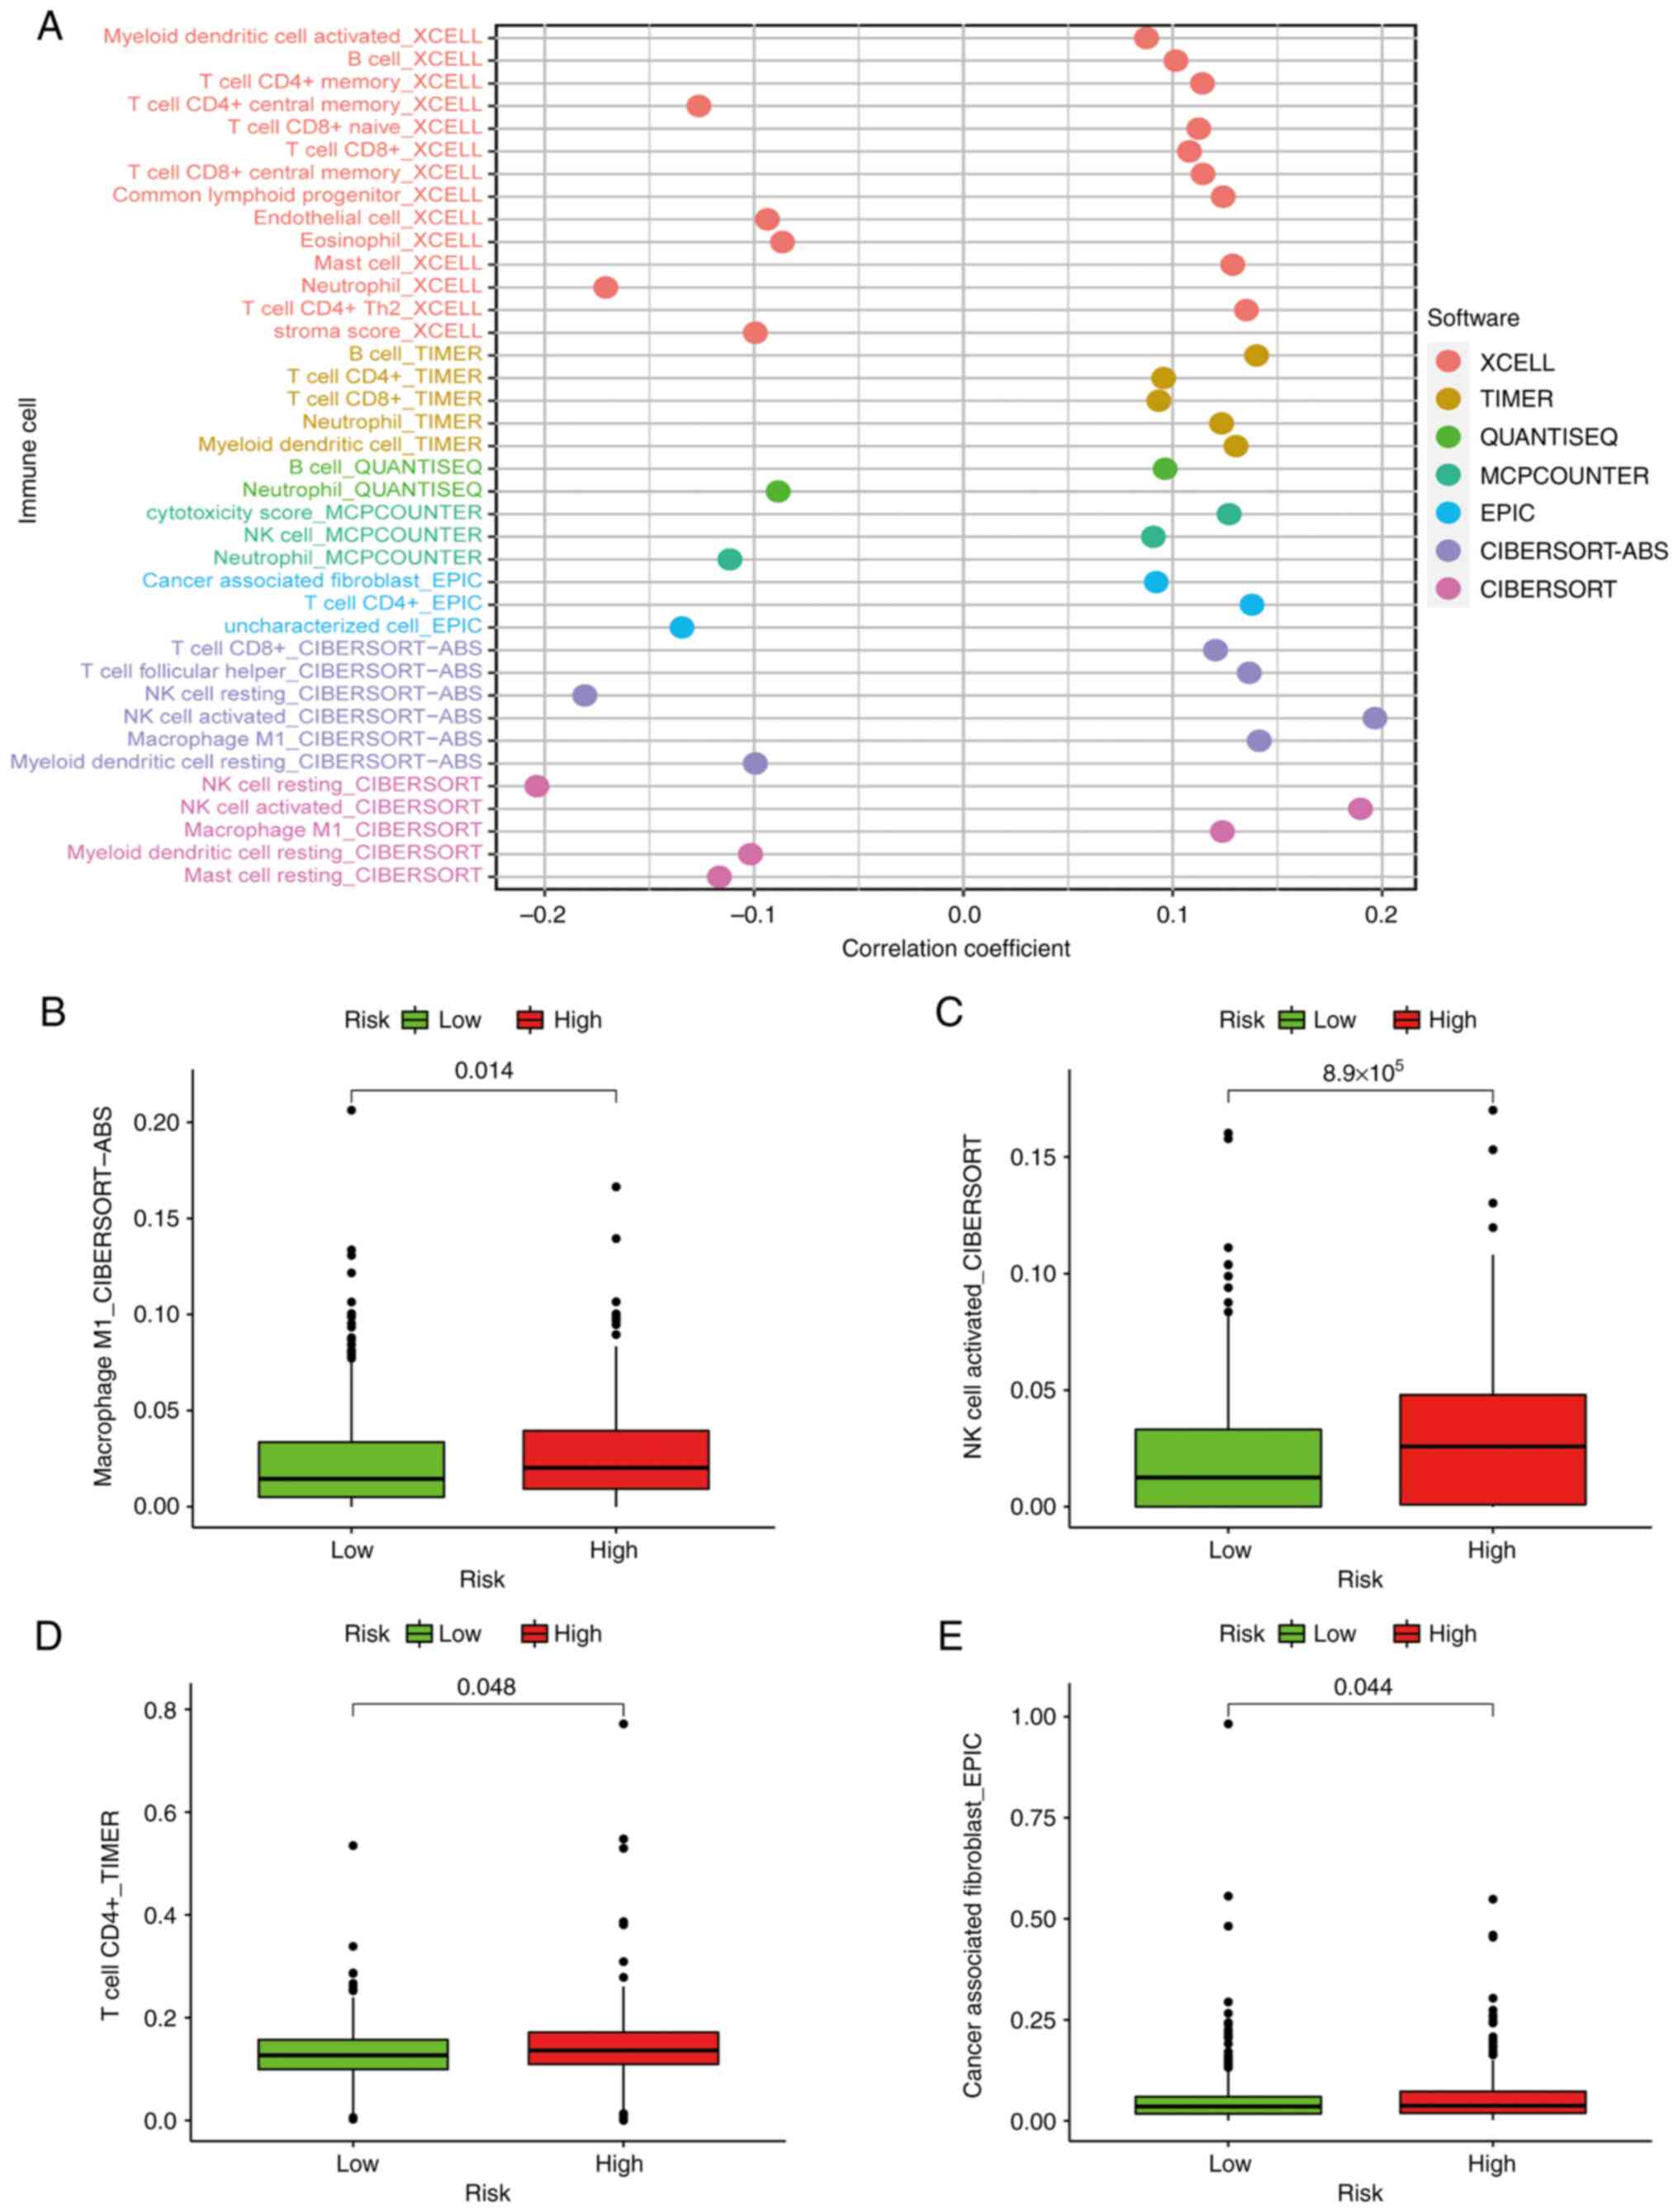
Analysis of immune cell
infiltration
Patients in the high-risk group exhibited a positive
association with immune cells, including cancer-associated
fibroblasts, macrophages, CD4+ T cells and natural
killer (NK) cells (Fig. 8B-E).
Using Spearman's correlation analysis, the relationship between
risk score and immune-infiltrating cells in multiple databases was
displayed in a lollipop chart (Fig.
8A) and the specific values are listed in Table II.
| Table II.Results of the correlation between
tumor-infiltrating immune cells and risk score. |
Table II.
Results of the correlation between
tumor-infiltrating immune cells and risk score.
| Symbol | Spearman
correlation coefficient | P-value |
|---|
| B cell_TIMER | 0.140020872 | 0.001444718 |
| T cell
CD4+_TIMER | 0.095646701 | 0.029986209 |
| T cell
CD8+_TIMER | 0.093339716 | 0.034201057 |
|
Neutrophil_TIMER | 0.123325136 | 0.005069284 |
| Myeloid dendritic
cell_TIMER | 0.130194203 | 0.003076337 |
| NK cell
resting_CIBERSORT | −0.20379316 |
3.12×10⁻⁶ |
| NK cell
activated_CIBERSORT | 0.189706121 |
1.46×10⁻⁵ |
| Macrophage
M1_CIBERSORT | 0.123725861 | 0.004926897 |
| Myeloid dendritic
cell resting_CIBERSORT | −0.101734416 | 0.020937744 |
| Mast cell
resting_CIBERSORT | −0.116602694 | 0.008079078 |
| T cell
CD8+_CIBERSORT-ABS | 0.120419134 | 0.006217829 |
| T cell follicular
helper_CIBERSORT-ABS | 0.136542775 | 0.001898442 |
| NK cell
resting_CIBERSORT-ABS | −0.180865302 |
3.65×10⁻⁵ |
| NK cell
activated_CIBERSORT-ABS | 0.196574724 |
6.99×10⁻⁶ |
| Macrophage
M1_CIBERSORT-ABS | 0.141280063 | 0.001306712 |
| Myeloid dendritic
cell resting_CIBERSORT-ABS | −0.099423856 | 0.024045776 |
| B
cell_QUANTISEQ | 0.096337307 | 0.028814455 |
|
Neutrophil_QUANTISEQ | −0.088510252 | 0.044677492 |
| cytotoxicity
score_MCPCOUNTER | 0.126957411 | 0.003904117 |
| NK
cell_MCPCOUNTER | 0.090727199 | 0.039573709 |
|
Neutrophil_MCPCOUNTER | −0.111578196 | 0.011280863 |
| Myeloid dendritic
cell activated_XCELL | 0.087432741 | 0.047351518 |
| B cell_XCELL | 0.101477075 | 0.021265689 |
| T cell CD4+
memory_XCELL | 0.114174225 | 0.009508347 |
| T cell CD4+ central
memory_XCELL | −0.126344576 | 0.004081879 |
| T cell CD8+
naive_XCELL | 0.112402483 | 0.010688716 |
| T cell
CD8+_XCELL | 0.1079606 | 0.014236864 |
| T cell CD8+ central
memory_XCELL | 0.114425918 | 0.009350425 |
| Common lymphoid
progenitor_XCELL | 0.124081452 | 0.004803578 |
| Endothelial
cell_XCELL | −0.09362572 | 0.033652529 |
|
Eosinophil_XCELL | −0.086455384 | 0.049891825 |
| Mast
cell_XCELL | 0.128617222 | 0.003457318 |
|
Neutrophil_XCELL | −0.17086684 |
9.74×10⁻⁵ |
| T cell CD4+
Th2_XCELL | 0.135172714 | 0.00211051 |
| stroma
score_XCELL | −0.099411962 | 0.024062755 |
| Cancer associated
fibroblast_EPIC | 0.092110535 | 0.036646054 |
| T cell
CD4+_EPIC | 0.137868277 | 0.00171202 |
Model functional assessment for
clinical therapy
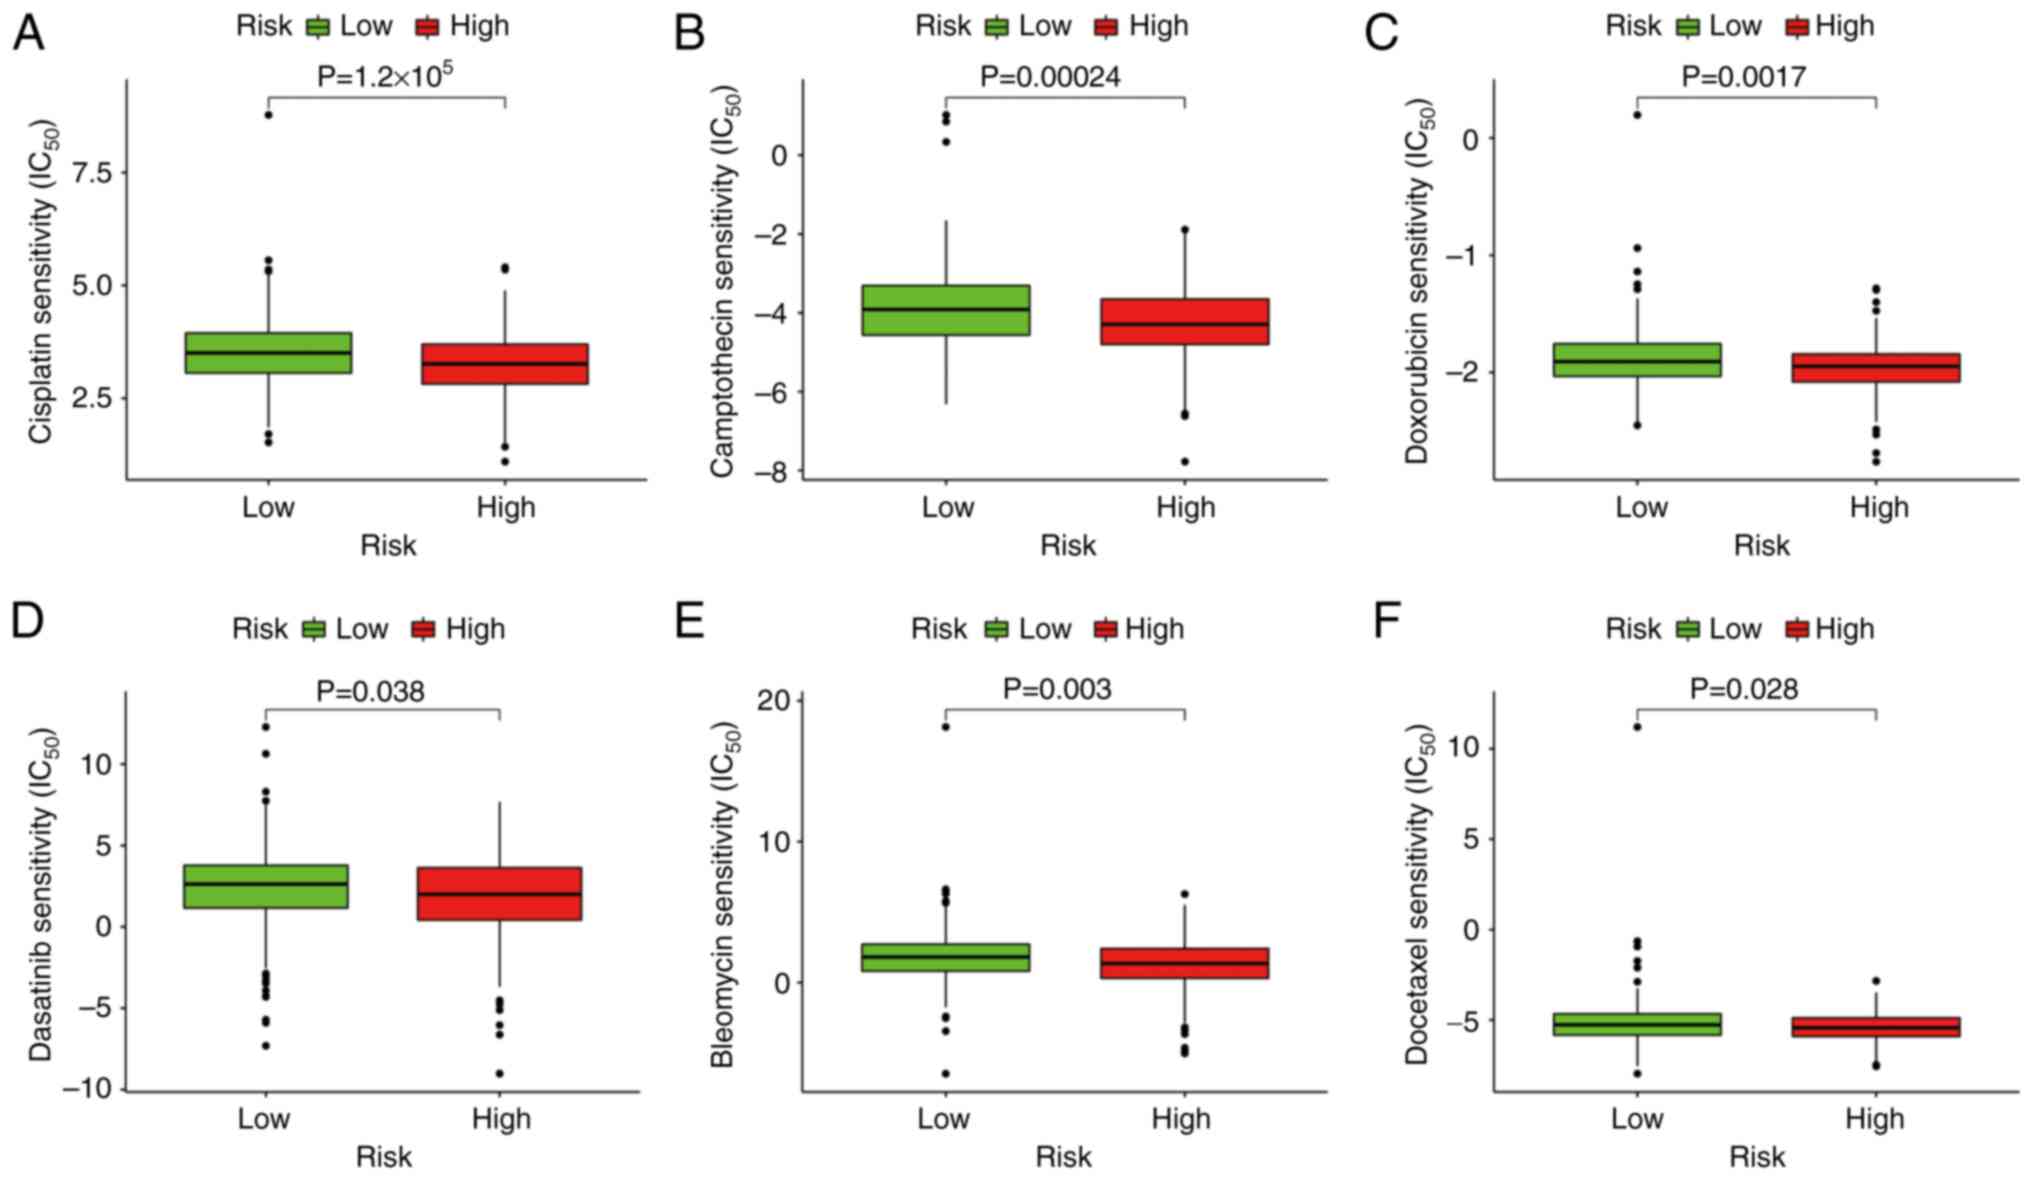
The results indicated that a high-risk score was
related to a lower IC50 for certain therapeutic
medicines, including bleomycin (P=0.003), camptothecin (P=0.00024),
dasatinib (P=0.038), docetaxel (P=0.028), doxorubicin (P=0.0017)
and cisplatin (P=1.2×10⁻⁵) (Fig. 9). This finding suggests that the
model has the potential to assist with predicting drug
sensitivity.
RT-qPCR
The expression levels of six lncRNA pairs in the
patient tumor tissue are presented in Fig. 10. The risk value calculated
according to the formula is 0.839, indicating this patient belongs
to the low-risk group. The expression level of ATG12, BCL2, LMNA,
SNAI2 and UCP2 in CRC tissue and normal tissue is presented in
Fig. 11, which indicates that the
expression of these genes was higher in the tumor tissue than in
normal tissue.
Verification of the biological impact
of MIR181A2HG
Through the use of flow cytometry and DilC1(5), it
was observed that after oncosis induced by Triton X, the
mitochondrial membrane potential of the three groups whose
treatment included Triton X decreased (Fig. 12A). The decrease in mitochondrial
membrane potential in the MIR181A2HG expression knockdown group was
more significant than that in the negative control group. Through
the use of fluorescence confocal microscopy, it was seen that
DilC1(5) fluorescence decreased in the Triton X-induced groups and
DilC1(5) fluorescence decreased more markedly after knockdown of
MIR181A2HG expression. Morphologically, compared with the control
group, the cells in the Triton treatment group increased in volume
and demonstrated swelling. After MIR181A2HG expression was knocked
down, the cell oncosis was more apparent, the intracellular
structure and membrane appeared blistered, and membrane integrity
was damaged (Fig. 12B).
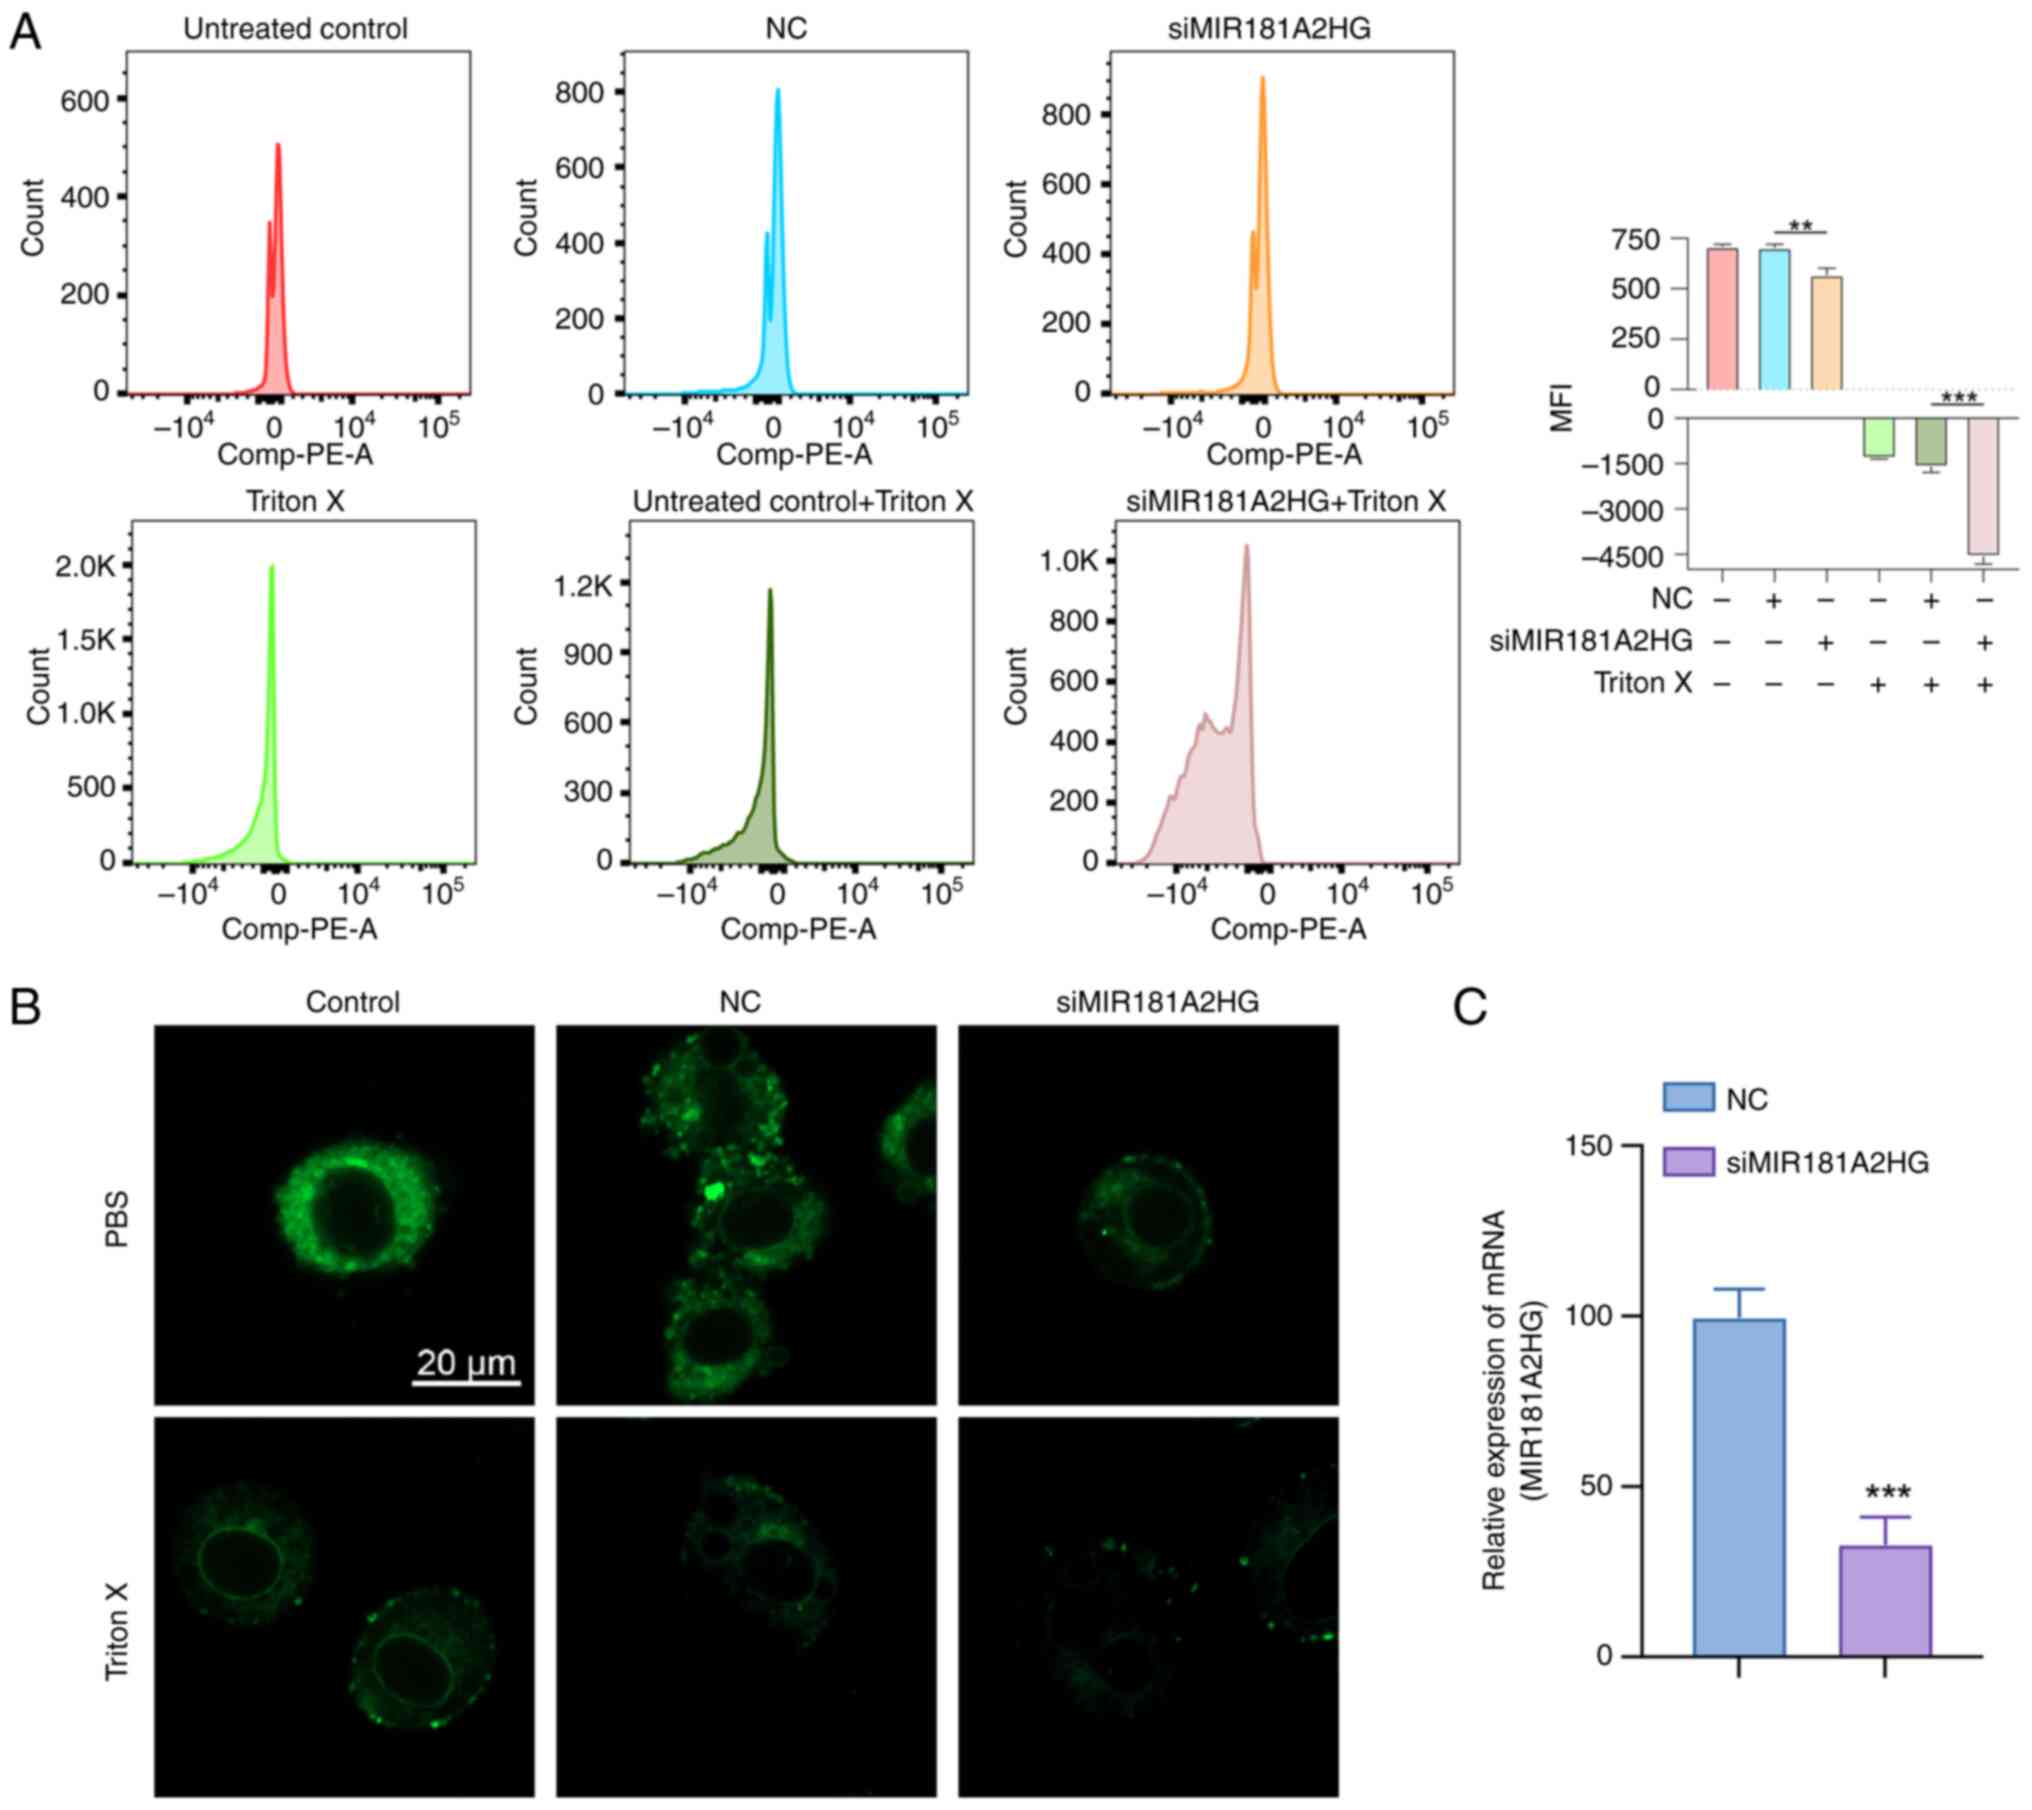 | Figure 12.Biological impact of the MIR181A2HG.
(A) Data detected using flow tcytometry and DilC1(5). As shown in
the figure, The histogram groups are (a) untreated control, (b) NC,
(c) siMIR181A2HG, (d) Triton X only control, (e)Triton X-NC, (f)
Triton X-siMIR181A2HG, from left to right. (B) Fluorescence
confocal microscopy of LoVo cells labeled with DilC1(5) (scale bar,
20 µm). (C) siRNA transfection efficiency was verified. **P<0.01
and ***P<0.001. MFI (mean fluorescence intensity); NC, negative
control (cells transfected with si-NC); si, small interfering RNA;
miR, microRNA. |
Discussion
Oncosis is a fundamental modality of cell death that
may lead to oncotic necrosis and was first discovered in models of
ischemic injury (8). Oncosis has
an important role in the transition between apoptosis, autophagy
and necrosis (32). The
relationship between oncosis and tumors has been widely studied.
For instance, overexpression of ion channels may induce breast
cancer cells to undergo oncosis to promote cell death (6). It has also been found that gastric
cancer cell death may be induced by QC4 via oncosis (33). LncRNA also has important
implications in numerous aspects of cancer, including
proliferation, survival, migration and genomic stability (34). The construction of prognostic
markers for predicting the overall survival (including survival
rate and time) of patients with cancer using lncRNA has become an
area of increased research (35,36).
The survival outcome, immunotherapy effect and drug sensitivity of
patients with cancer may be determined by detecting the expression
status of several lncRNAs, such as AC016027.1, AC099850.3 and
ELFN1.AS1, which may provide clinical diagnosis and treatment
options (35,37,38).
Certain studies have focused on the construction of autophagy,
immune and other coding genes, as well as non-coding RNA models to
predict the prognosis of CRC (35,39).
However, to the best of our knowledge, there are no studies to date
that have established an orlncRNA model to evaluate CRC-related
traits. The present study built on previous research that has been
using a reasonable scheme composed of paired DEorlncRNAs (40), effectively reducing the complex
data batch correction and achieving a more accurate risk assessment
and CRC prognosis prediction while reducing the data required for
this.
In the present study, all orgenes were collected by
first searching the oncosis-related literature, followed by
obtaining the original transcriptome CRC data from the TCGA
database. The Wilcoxon signed-rank test and other testing methods
were used for analyzing co-expression and differential expression
to recognize DEorlncRNAs. The contributing DEorlncRNA pairs were
verified by circular pairing and a 0-or-1 matrix. The DEorlncRNA
pairs included in the model were determined through a series of
analyses, including Lasso and Cox regression analyses. The AIC
value was determined to recognize the optimal model and the sum of
sensitivity and specificity of each point on the 1-, 3- and 5-year
ROC curves were calculated to find the optimal risk score cut-off.
The model was validated using case data and further evaluated in
terms of survival time, clinicopathological progression, related
gene expression, infiltration of immune cells into the tumor and
sensitivity to chemotherapy. Based on the model, it was observed
that the prognosis of patients in the high-risk group significantly
differed from that of the low-risk group and the survival outcome
of patients in the high-risk group was significantly worse than
that in the low-risk group. The risk score of patients was related
to tumor-node-metastasis (TNM) and clinical stage, with a higher
risk score associated with a higher TNM and clinical stage. Certain
genes exhibited a higher level of expression in the high-risk group
than in the low-risk group (e.g., ATG12, BCL2, LMNA, UCP2 and
SNAI2), whereas the opposite was observed for the NDRG2 gene. Such
gene expression status changes may provide supporting evidence for
cancer prognosis. ATG12 deficiency leads to depletion of
intracellular levels of L-glutamine, which is associated with a
lower tolerance to hypoxia and an improved cancer prognosis
(41). Furthermore, ATG12
silencing in CRC may weaken cell viability, induce cell apoptosis,
inhibit autophagy and enhance the radiosensitivity of CRC cells.
BCL2, a known antiapoptotic protein, may inhibit apoptosis by
reducing the level of activated caspase (42). Inhibition of BCL2 may therefore
promote apoptosis of CRC cells (43). Metastatic tumors of the prostate
are highly aggressive, have a slow proliferation rate and exhibit
elevated SNAI2 expression (44).
Certain studies have found that increased SNAI2 expression was
associated with CRC cell invasion (45,46).
The NTRK1-LMNA axis may be associated with extensive phenotypic
changes in neuroblastoma cells and NTRK1-induced reprogramming
(47). LMNA is also expressed in
colon stem cells and, statistically, the prognosis of patients with
an LMNA-positive tumor is significantly worse than that of patients
with an LMNA-negative tumor (48).
In addition, UCP2 has been indicated to have different roles
according to cell type and the regulation of its expression is
correlated with the progression and treatment of cancer cells
(49). UCP2 has a key role in the
mitochondrial apoptosis pathway and inhibition of UCP2 promotes
apoptosis in CRC cells. Furthermore, in murine intestinal cancer
models and samples from patients with CRC, higher levels of UCP2
protein were observed than in non-tumor counterparts (50,51).
Functioning as either a tumor suppressor gene or stress response
gene, NDRG2 has been associated with antimetastasis and
antiproliferation responses in tumors and the level of NDRG2
expression is related to tumor prognosis (52). Since oncosis is related to the
immune response (53,54), a number of methods were used in the
present study to comprehensively evaluate infiltrating immune cells
in CRC. According to the analysis, cancer-associated fibroblasts,
NK cells, CD4+ T cells and macrophage content were
higher in the high-risk group in the present model. A previous
study has indicated that the metastatic potential of ovarian cancer
cells may be increased by pro-inflammatory M1 macrophages through
activation of the NF-κB signaling pathway (55). According to the risk model in the
present study, the drug sensitivity results indicated that patients
in the high-risk group treated with bleomycin, camptothecin,
tipifarnib, dasatinib, docetaxel, doxorubicin or cisplatin tended
to have a higher tumor mutation burden (TMB).
In the six DeorlncRNA pairs included in the Lasso
regression analysis, at least three of the orlncRNAs described
below were demonstrated to be associated with cancer progression.
LncRNA MIR181A2HG inhibits the proliferation, migration and
capillary-like structures of vascular endothelial cells through
dysregulation of the miRNAs/AKT2 axis (56). Another study demonstrated that
MIR181A2HG is a prognostic predictor of bladder cancer survival
time and is an immune checkpoint inhibitor (57). The MIR181A2HG gene is also
overexpressed in the thyroid and there is a connection between
MIR181A2HG and the prognosis of thyroid cancer (58,59).
In addition, LncRNA AC104695.4 as a component of the prediction
model, is positively correlated with TGFβ1 expression in triple
negative breast cancer tissue (60). LncRNA ARHGEF38-IT1 was
significantly associated with the survival time, clinical features,
immune cells in the tumor microenvironment, TMB and cancer-related
pathways of stomach adenocarcinoma (61). In the present study, an early-stage
CRC tissue sample was selected and the expression of six pairs of
lncRNA were verified by RT-qPCR. The results indicated that the
sample was in the low-risk group and consistent with clinical
diagnosis. To further improve the credibility of the algorithm, a
lncRNA was randomly selected and the biological process in oncosis
was verified. Flow cytometry and fluorescence confocal microscopy
results indicated that knockdown of MIR181A2HG expression promoted
the oncosis of LoVo cells, which indicated MIR181A2HG was
associated with oncosis. All the aforementioned studies verified
the validation of the algorithm. The remaining DEorlncRNAs were
reported in the present study for the first time and require
further exploration and research.
In the present study, a novel algorithm based on
oncosis was established to explore the clinical implications of
risk assessment models. The algorithm indicated that DEorLncRNAs
may be identified and associated vital pairs may be constructed.
The AUC values of the 1-, 3- and 5-year ROC curves of the model
were all >0.7, exhibiting a fair predictive performance. There
have been multiple studies on the establishment of lncRNA-related
prediction models for CRC and each algorithm have their own
advantages, such as using simple predictors, and disadvantages,
such as insufficient clinical and molecular biological validation
(62,63). In the present study, orlncRNAs were
applied for the construction of the CRC prediction model for the
first time and differential orlncRNAs were identified to form
DEorlncRNA pairs. The study models used by others frequently
require the batch correction of clinical data. Thus, since the
present model uses DEorlncRNA pairs, only the expression levels of
the lncRNA pairs require to be compared, thereby avoiding the need
for data correction. Therefore, there is a substantially lower
threshold for the clinical application of this model and errors
related to differences in the detection of marker expression are
largely avoided.
There are certain limitations to the present study.
First, since the data were obtained from open public databases, the
sample size may be relatively small and there may be certain bias
in the analyzed profile. Furthermore, the data in the TCGA database
were used to internally verify the constructed risk assessment
model, but it should also be externally verified. In addition, the
correlation between the model and immune cell features requires to
be verified by clinical data and other experiments. Finally, the
new algorithm ultimately serves clinical treatment and in future
clinical work, our clinical case validation of this model is
insufficient since only one sample was verified by PCR and there is
a requirement to collect additional samples to verify the
predictive ability of this algorithm for the clinical treatment of
patients with CRC.
In summary, the present study successfully
established a new algorithm consisting of paired orlncRNAs in CRC
and the algorithm was verified to a certain extent. Only the
expression levels of six lncRNA pairs needed to be detected and
compared to divide CRC patients into high- and low-risk groups and
to predict their survival outcomes, related tumor immune cell
infiltration and sensitivity to drug treatment. The model may
provide individualized management and treatment for patients with
CRC.
Supplementary Material
Supporting Data
Acknowledgements
Not applicable.
Funding
This study was supported by the National Natural Science
Foundation of China (grant no. 82002982).
Availability of data and materials
The datasets used and/or analyzed during the current
study are available from the corresponding authors on reasonable
request.
Authors' contributions
ZS and WC conceptualized the study. HX and XS
performed the experiments and acquired the data. HX, XS and EC were
involved in data analysis, writing and preparation of the original
draft. EC was involved in the writing, reviewing and editing of the
manuscript. All authors read and approved the final version of the
manuscript. ZS, WC, HX, EC and XS confirm the authenticity of all
the raw data.
Ethics approval and consent to
participate
All patients and healthy donors signed the written
informed consent form. All experiments involving patient tissue
were approved by the Medical Ethics Committee of Sir Run Run Shaw
Hospital affiliated to Zhejiang University School of Medicine
(Hangzhou, China; approval no. 20211108-31) and were conducted
according to the Ethical Review Measures for Biomedical Research
involving People (2016) of the National Health Commission. The
tissue experiments involving human participants complied with the
Declaration of Helsinki.
Patient consent for publication
Not applicable.
Competing interests
The authors declare that they have no competing
interests.
References
|
1
|
Sung H, Ferlay J, Siegel RL, Laversanne M,
Soerjomataram I, Jemal A and Bray F: Global cancer statistics 2020:
GLOBOCAN estimates of incidence and mortality worldwide for 36
cancers in 185 countries. CA Cancer J Clin. 71:209–249. 2021.
View Article : Google Scholar : PubMed/NCBI
|
|
2
|
Bray F, Ferlay J, Soerjomataram I, Siegel
RL, Torre LA and Jemal A: Global cancer statistics 2018: GLOBOCAN
estimates of incidence and mortality worldwide for 36 cancers in
185 countries. CA Cancer J Clin. 68:394–424. 2018. View Article : Google Scholar : PubMed/NCBI
|
|
3
|
Dekker E, Tanis P, Vleugels J, Kasi P and
Wallace M: Colorectal cancer. Lancet. 394:1467–1480. 2019.
View Article : Google Scholar : PubMed/NCBI
|
|
4
|
Weerasinghe P and Buja LM: Oncosis: An
important non-apoptotic mode of cell death. Exp Mol Pathol.
93:302–308. 2012. View Article : Google Scholar : PubMed/NCBI
|
|
5
|
Trump BF and Berezesky IK:
Calcium-mediated cell injury and cell death. FASEB J. 9:219–228.
1995. View Article : Google Scholar : PubMed/NCBI
|
|
6
|
Peters AA, Jamaludin SYN, Yapa KTDS,
Chalmers S, Wiegmans AP, Lim HF, Milevskiy MJG, Azimi I, Davis FM,
Northwood KS, et al: Oncosis and apoptosis induction by activation
of an overexpressed ion channel in breast cancer cells. Oncogene.
36:6490–6500. 2017. View Article : Google Scholar : PubMed/NCBI
|
|
7
|
Mills EM, Xu D, Fergusson MM, Combs CA, Xu
Y and Finkel T: Regulation of cellular oncosis by uncoupling
protein 2. J Biol Chem. 277:27385–27392. 2002. View Article : Google Scholar : PubMed/NCBI
|
|
8
|
Majno G and Joris I: Apoptosis, oncosis,
and necrosis. An overview of cell death. Am J Pathol. 146:3–15.
1995.PubMed/NCBI
|
|
9
|
Wang L, Mai Z, Zhao M, Wang B, Yu S, Wang
X and Chen T: Aspirin induces oncosis in tumor cells. Apoptosis.
24:758–772. 2019. View Article : Google Scholar : PubMed/NCBI
|
|
10
|
Guan R, Chen Y, Zeng L, Rees TW, Jin C,
Huang J, Chen ZS, Ji L and Chao H: Oncosis-inducing cyclometalated
iridium(iii) complexes. Chem Sci. 9:5183–5190. 2018. View Article : Google Scholar : PubMed/NCBI
|
|
11
|
Derrien T, Johnson R, Bussotti G, Tanzer
A, Djebali S, Tilgner H, Guernec G, Martin D, Merkel A, Knowles DG,
et al: The GENCODE v7 catalog of human long noncoding RNAs:
Analysis of their gene structure, evolution, and expression. Genome
Res. 22:1775–1789. 2012. View Article : Google Scholar : PubMed/NCBI
|
|
12
|
Okugawa Y, Toiyama Y, Hur K, Toden S,
Saigusa S, Tanaka K, Inoue Y, Mohri Y, Kusunoki M, Boland CR and
Goel A: Metastasis-associated long non-coding RNA drives gastric
cancer development and promotes peritoneal metastasis.
Carcinogenesis. 35:2731–2739. 2014. View Article : Google Scholar : PubMed/NCBI
|
|
13
|
Schmitt AM and Chang HY: Gene regulation:
Long RNAs wire up cancer growth. Nature. 500:536–537. 2013.
View Article : Google Scholar : PubMed/NCBI
|
|
14
|
Schmidt LH, Spieker T, Koschmieder S,
Schäffers S, Humberg J, Jungen D, Bulk E, Hascher A, Wittmer D,
Marra A, et al: The long noncoding MALAT-1 RNA indicates a poor
prognosis in non-small cell lung cancer and induces migration and
tumor growth. J Thorac Oncol. 6:1984–1992. 2011. View Article : Google Scholar : PubMed/NCBI
|
|
15
|
Yan X, Hu Z, Feng Y, Hu X, Yuan J, Zhao
SD, Zhang Y, Yang L, Shan W, He Q, et al: Comprehensive genomic
characterization of long non-coding RNAs across human cancers.
Cancer Cell. 28:529–540. 2015. View Article : Google Scholar : PubMed/NCBI
|
|
16
|
Matsumura H, Shimizu Y, Ohsawa Y, Kawahara
A, Uchiyama Y and Nagata S: Necrotic death pathway in Fas receptor
signaling. J Cell Biol. 151:1247–1256. 2000. View Article : Google Scholar : PubMed/NCBI
|
|
17
|
Holler N, Zaru R, Micheau O, Thome M,
Attinger A, Valitutti S, Bodmer JL, Schneider P, Seed B and Tschopp
J: Fas triggers an alternative, caspase-8-independent cell death
pathway using the kinase RIP as effector molecule. Nat Immunol.
1:489–495. 2000. View
Article : Google Scholar : PubMed/NCBI
|
|
18
|
Tanabe K, Nakanishi H, Maeda H, Nishioku
T, Hashimoto K, Liou SY, Akamine A and Yamamoto K: A predominant
apoptotic death pathway of neuronal PC12 cells induced by activated
microglia is displaced by a non-apoptotic death pathway following
blockage of caspase-3-dependent cascade. J Biol Chem.
274:15725–15731. 1999. View Article : Google Scholar : PubMed/NCBI
|
|
19
|
Akimoto M, Hayashi JI, Nakae S, Saito H
and Takenaga K: Interleukin-33 enhances programmed oncosis of
ST2L-positive low-metastatic cells in the tumour microenvironment
of lung cancer. Cell Death Dis. 7:e20572016. View Article : Google Scholar : PubMed/NCBI
|
|
20
|
Chen YG, Satpathy AT and Chang HY: Gene
regulation in the immune system by long noncoding RNAs. Nat
Immunol. 18:962–972. 2017. View Article : Google Scholar : PubMed/NCBI
|
|
21
|
Li Y, Jiang T, Zhou W, Li J, Li X, Wang Q,
Jin X, Yin J, Chen L, Zhang Y, et al: Pan-cancer characterization
of immune-related lncRNAs identifies potential oncogenic
biomarkers. Nat Commun. 11:10002020. View Article : Google Scholar : PubMed/NCBI
|
|
22
|
Fang T, Liang T, Wang Y, Wu H, Liu S, Xie
L, Zhang Z, Liang J, Yao C, Tan Y and Wang C: An early-onset
advanced rectal cancer patient with increased KRAS gene copy number
showed A primary resistance to cetuximab in combination with
chemotherapy: A case report. Front Oncol. 11:7555782021. View Article : Google Scholar : PubMed/NCBI
|
|
23
|
Lv Y, Lin SY, Hu FF, Ye Z, Zhang Q, Wang Y
and Guo AY: Landscape of cancer diagnostic biomarkers from
specifically expressed genes. Brief Bioinform. 21:2175–2184. 2020.
View Article : Google Scholar : PubMed/NCBI
|
|
24
|
Tomczak K, Czerwinska P and Wiznerowicz M:
The cancer genome atlas (TCGA): An immeasurable source of
knowledge. Contemp Oncol (Pozn). 19:A68–A77. 2015.PubMed/NCBI
|
|
25
|
Fiorini N, Lipman DJ and Lu Z: Towards
PubMed 2.0. Elife. 6:e288012017. View Article : Google Scholar : PubMed/NCBI
|
|
26
|
Ritchie ME, Phipson B, Wu D, Hu Y, Law CW,
Shi W and Smyth GK: limma powers differential expression analyses
for RNA-sequencing and microarray studies. Nucleic Acids Res.
43:e472015. View Article : Google Scholar : PubMed/NCBI
|
|
27
|
Akaike H: A new look at the statistical
model identification. IEEE Trans Automat Contr AC. 19:716–723.
1974. View Article : Google Scholar
|
|
28
|
Amin MB, Greene FL, Edge SB, Compton CC,
Gershenwald JE, Brookland RK, Meyer L, Gress DM, Byrd DR and
Winchester DP: The eighth edition AJCC cancer staging manual:
Continuing to build a bridge from a population-based to a more
‘personalized’ approach to cancer staging. CA Cancer J Clin.
67:93–99. 2017. View Article : Google Scholar : PubMed/NCBI
|
|
29
|
Strutner J, Ramchandar N, Dubey S, Gamboa
M, Vanderpool MK, Mueller T, Wang W, Cannavino C, Tovar Padua L,
Malicki D and Pong A: Comparison of RT-PCR cycle threshold values
from respiratory specimens in symptomatic and asymptomatic children
with SARS-CoV-2 infection. Clin Infect Dis: ciab403. 2021.(Epub
ahead of print). View Article : Google Scholar
|
|
30
|
Chen Y, Lu B, Yang Q, Fearns C, Yates JR
III and Lee JD: Combined integrin phosphoproteomic analyses and
small interfering RNA-based functional screening identify key
regulators for cancer cell adhesion and migration. Cancer Res.
69:3713–3720. 2009. View Article : Google Scholar : PubMed/NCBI
|
|
31
|
Warnes G and Martins S: Real-time flow
cytometry for the kinetic analysis of oncosis. Cytometry A.
79:181–191. 2011. View Article : Google Scholar : PubMed/NCBI
|
|
32
|
D'Arcy MS: Cell death: A review of the
major forms of apoptosis, necrosis and autophagy. Cell Biol Int.
43:582–592. 2019. View Article : Google Scholar : PubMed/NCBI
|
|
33
|
Luo D, Ni Q, Ji A, Gu W, Wu J and Jiang C:
Dehydroabietic acid derivative QC4 induces gastric cancer cell
death via oncosis and apoptosis. Biomed Res Int. 2016:25810612016.
View Article : Google Scholar : PubMed/NCBI
|
|
34
|
Huarte M: The emerging role of lncRNAs in
cancer. Nat Med. 21:1253–1261. 2015. View Article : Google Scholar : PubMed/NCBI
|
|
35
|
Zhang W, Fang D, Li S, Bao X, Jiang L and
Sun X: Construction and validation of a novel ferroptosis-related
lncRNA signature to predict prognosis in colorectal cancer
patients. Front Genet. 12:7093292021. View Article : Google Scholar : PubMed/NCBI
|
|
36
|
Yu J, Mao W, Xu B and Chen M: Construction
and validation of an autophagy-related long noncoding RNA signature
for prognosis prediction in kidney renal clear cell carcinoma
patients. Cancer Med. 10:2359–2369. 2021. View Article : Google Scholar : PubMed/NCBI
|
|
37
|
Ghafouri-Fard S and Taheri M: Long
non-coding RNA signature in gastric cancer. Exp Mol Pathol.
113:1043652020. View Article : Google Scholar : PubMed/NCBI
|
|
38
|
Liu S, Cao Q, An G, Yan B and Lei L:
Identification of the 3-lncRNA signature as a prognostic biomarker
for colorectal cancer. Int J Mol Sci. 21:93592020. View Article : Google Scholar : PubMed/NCBI
|
|
39
|
Wei J, Ge X, Tang Y, Qian Y, Lu W, Jiang
K, Fang Y, Hwang M, Fu D, Xiao Q and Ding K: An autophagy-related
long noncoding RNA signature contributes to poor prognosis in
colorectal cancer. J Oncol. 2020:47289472020. View Article : Google Scholar : PubMed/NCBI
|
|
40
|
Tang R, Wu Z, Rong Z, Xu J, Wang W, Zhang
B, Yu X and Shi S: Ferroptosis-related lncRNA pairs to predict the
clinical outcome and molecular characteristics of pancreatic ductal
adenocarcinoma. Brief Bioinform. 23:bbab3882022. View Article : Google Scholar : PubMed/NCBI
|
|
41
|
Keulers TG, Koch A, van Gisbergen MW,
Barbeau LMO, Zonneveld MI, de Jong MC, Savelkouls KGM, Wanders RG,
Bussink J, Melotte V and Rouschop KMA: ATG12 deficiency results in
intracellular glutamine depletion, abrogation of tumor hypoxia and
a favorable prognosis in cancer. Autophagy. 18:1898–1914. 2022.
View Article : Google Scholar : PubMed/NCBI
|
|
42
|
Llambi F, Wang YM, Victor B, Yang M,
Schneider DM, Gingras S, Parsons MJ, Zheng JH, Brown SA, Pelletier
S, et al: BOK is a non-canonical BCL-2 family effector of apoptosis
regulated by ER-associated degradation. Cell. 165:421–433. 2016.
View Article : Google Scholar : PubMed/NCBI
|
|
43
|
Dai W, Mu L, Cui Y, Li Y, Chen P, Xie H
and Wang X: Long non-coding RNA CASC2 enhances berberine-induced
cytotoxicity in colorectal cancer cells by silencing BCL2. Mol Med
Rep. 20:995–1006. 2019.PubMed/NCBI
|
|
44
|
Mazzu YZ, Liao Y, Nandakumar S, Sjöström
M, Jehane LE, Ghale R, Govindarajan B, Gerke TA, Lee GM, Luo JH, et
al: Dynamic expression of SNAI2 in prostate cancer predicts tumor
progression and drug sensitivity. Mol Oncol. 16:2451–2469. 2022.
View Article : Google Scholar : PubMed/NCBI
|
|
45
|
Findlay VJ, Wang C, Nogueira LM, Hurst K,
Quirk D, Ethier SP, Staveley O'Carroll KF, Watson DK and Camp ER:
SNAI2 modulates colorectal cancer 5-fluorouracil sensitivity
through miR145 repression. Mol Cancer Ther. 13:2713–2726. 2014.
View Article : Google Scholar : PubMed/NCBI
|
|
46
|
Du F, Li X, Feng W, Qiao C, Chen J, Jiang
M, Qiu Z, Qian M, Tian D, Nie Y, et al: SOX13 promotes colorectal
cancer metastasis by transactivating SNAI2 and c-MET. Oncogene.
39:3522–3540. 2020. View Article : Google Scholar : PubMed/NCBI
|
|
47
|
Funke L, Bracht T, Oeck S, Schork K,
Stepath M, Dreesmann S, Eisenacher M, Sitek B and Schramm A:
NTRK1/TrkA signaling in neuroblastoma cells induces nuclear
reorganization and intra-nuclear aggregation of lamin A/C. Cancers
(Basel). 13:52932021. View Article : Google Scholar : PubMed/NCBI
|
|
48
|
Willis ND, Cox TR, Rahman-Casañs SF, Smits
K, Przyborski SA, van den Brandt P, van Engeland M, Weijenberg M,
Wilson RG, de Bruïne A and Hutchison CJ: Lamin A/C is a risk
biomarker in colorectal cancer. PLoS One. 3:e29882008. View Article : Google Scholar : PubMed/NCBI
|
|
49
|
Kim DY, Cheong HT, Ra CS, Kimura K and
Jung BD: Effect of 5-azacytidine (5-aza) on UCP2 expression in
human liver and colon cancer cells. Int J Med Sci. 18:2176–2186.
2021. View Article : Google Scholar : PubMed/NCBI
|
|
50
|
Aguilar E, Esteves P, Sancerni T, Lenoir
V, Aparicio T, Bouillaud F, Dentin R, Prip-Buus C, Ricquier D,
Pecqueur C, et al: UCP2 deficiency increases colon tumorigenesis by
promoting lipid synthesis and depleting NADPH for antioxidant
defenses. Cell Rep. 28:2306–2316.e5. 2019. View Article : Google Scholar : PubMed/NCBI
|
|
51
|
Qiao C, Wei L, Dai Q, Zhou Y, Yin Q, Li Z,
Xiao Y, Guo Q and Lu N: UCP2-related mitochondrial pathway
participates in oroxylin A-induced apoptosis in human colon cancer
cells. J Cell Physiol. 230:1054–1063. 2015. View Article : Google Scholar : PubMed/NCBI
|
|
52
|
Kim G, Lim S and Kim KD: N-myc
downstream-regulated gene 2 (NDRG2) function as a positive
regulator of apoptosis: A new insight into NDRG2 as a tumor
suppressor. Cells. 10:26492021. View Article : Google Scholar : PubMed/NCBI
|
|
53
|
Moreno E and Barquero-Calvo E: The role of
neutrophils in brucellosis. Microbiol Mol Biol Rev. 84:e00048–20.
2020. View Article : Google Scholar : PubMed/NCBI
|
|
54
|
Davidson WF, Haudenschild C, Kwon J and
Williams MS: T cell receptor ligation triggers novel nonapoptotic
cell death pathways that are Fas-independent or Fas-dependent. J
Immunol. 169:6218–6230. 2002. View Article : Google Scholar : PubMed/NCBI
|
|
55
|
Cho U, Kim B, Kim S, Han Y and Song YS:
Pro-inflammatory M1 macrophage enhances metastatic potential of
ovarian cancer cells through NF-κB activation. Mol Carcinog.
57:235–242. 2018. View Article : Google Scholar : PubMed/NCBI
|
|
56
|
Wang S, Zheng B, Zhao H, Li Y, Zhang X and
Wen J: Downregulation of lncRNA MIR181A2HG by high glucose impairs
vascular endothelial cell proliferation and migration through the
dysregulation of the miRNAs/AKT2 axis. Int J Mol Med. 47:352021.
View Article : Google Scholar : PubMed/NCBI
|
|
57
|
Wu Y, Zhang L, He S, Guan B, He A, Yang K,
Gong Y, Li X and Zhou L: Identification of immune-related LncRNA
for predicting prognosis and immunotherapeutic response in bladder
cancer. Aging (Albany NY). 12:23306–23325. 2020.PubMed/NCBI
|
|
58
|
Yang F, Zhang J, Li B, Zhao Z, Liu Y, Zhao
Z, Jing S and Wang G: Identification of potential lncRNAs and
miRNAs as diagnostic biomarkers for papillary thyroid carcinoma
based on machine learning. Int J Endocrinol. 2021:39844632021.
View Article : Google Scholar : PubMed/NCBI
|
|
59
|
Xu Y, Chen J, Yang Z and Xu L:
Identification of RNA expression profiles in thyroid cancer to
construct a competing endogenous RNA (ceRNA) network of mRNAs, long
noncoding RNAs (lncRNAs), and microRNAs (miRNAs). Med Sci Monit.
25:1140–1154. 2019. View Article : Google Scholar : PubMed/NCBI
|
|
60
|
Vishnubalaji R and Alajez NM: Epigenetic
regulation of triple negative breast cancer (TNBC) by TGF-β
signaling. Sci Rep. 11:154102021. View Article : Google Scholar : PubMed/NCBI
|
|
61
|
Ye Z, Zheng M, Zeng Y, Wei S, Wang Y, Lin
Z, Shu C, Xie Y, Zheng Q and Chen L: Bioinformatics analysis
reveals an association between cancer cell stemness, gene
mutations, and the immune microenvironment in stomach
adenocarcinoma. Front Genet. 11:5954772020. View Article : Google Scholar : PubMed/NCBI
|
|
62
|
Liu Z, Liu L, Weng S, Guo C, Dang Q, Xu H,
Wang L, Lu T, Zhang Y, Sun Z and Han X: Machine learning-based
integration develops an immune-derived lncRNA signature for
improving outcomes in colorectal cancer. Nat Commun. 13:8162022.
View Article : Google Scholar : PubMed/NCBI
|
|
63
|
Song W, Ren J, Yuan W, Xiang R, Ge Y and
Fu T: N6-methyladenosine-related lncRNA signature predicts the
overall survival of colorectal cancer patients. Genes (Basel).
12:13752021. View Article : Google Scholar : PubMed/NCBI
|