Introduction
Endometrial cancer (EC) is one of the three most
common malignant tumors of the female reproductive system, and its
incidence has been increasing globally, as described by Global
Disease Burden (GDB) statistics. GDB statistics have also reported
that the death rate and disability-adjusted life years have been
decreasing over the past 30 years due to EC (1).
There is a close association between myometrial
invasion (MI) in advanced EC and a poor prognosis (2). Yet the mechanisms involved in
malignant tumor invasion and metastasis are still unclear. The
understanding of EC biology has progressed thanks to continuous
breakthroughs in diagnosis and in treatment technologies; however,
a number of aspects of treatment are still controversial, such as
the use of surgery and fertility-sparing treatment.
Nomograms are graphic calculation tools that
visualize and individualize prediction in different situations, and
they have been used for several types of cancer, including
endometrial stromal sarcoma and metastatic tumors (3,4). A
number of established nomograms are available to screen lymph node
metastasis (LNM), recurrence, overall survival and cancer-specific
survival rates in patients with EC (5,6). Yet,
to the best of our knowledge, risk prediction nomograms that
correctly estimate MI are limited, and the most commonly used and
validated nomogram is based on magnetic resonance imaging (MRI)
(7).
Metabolic syndrome (MetS) represents a cluster of
cardiovascular risk factors, including elevated blood pressure,
obesity, high circulating triglyceride (TG), dysglycemia and low
circulating high-density lipoprotein cholesterol (HDL-C). One study
indicated that EC is a form of cancer that has associations with
metabolic diseases, and that EC incidence increases with metabolic
disease prevalence (8).
Metabolic parameters can be obtained in
cost-effective and non-invasive ways. Metabolic Risk Score (MRS)
has recently been developed and is considered a good index to
provide information on a patient's metabolic status. MRS is based
on a set of markers, including pulse pressure (PP), body mass index
(BMI), fasting blood glucose (FBG), TG and HDL-C. The better
predictive value of MRS in comparison with the model based on
traditional clinicopathological characteristics has been confirmed
in a variety of tumors, such as esophageal cancer (9). MI is currently investigated and
nomograms constructed based on radiological features collected with
MRI (7), but the exact relationship
between the MRS and MI in patients with EC has not yet been
reported.
In the present study, univariate and multivariate
analyses were conducted in order to reveal the risk factors for MI.
A nomogram that integrates clinicopathological characteristics and
MRS was subsequently developed. Internal validation was then
performed based on a cohort of patients using receiver operating
characteristic (ROC) and calibration curves. The aim of this study
was to develop a nomogram that is useful in clinical practice to
predict MI in patients with EC based on clinicopathological
parameters. This would allow clinicians to screen out high-risk
groups and develop appropriate treatment plans.
Materials and methods
Patients and variables selection
Data was retrospectively collected from female
patients diagnosed with EC between January 2006 and December 2020
at the Department of Gynecology in Nanjing First Hospital. Patients
whose pathology was confirmed as EC by histology were eligible for
inclusion. The exclusion criteria were as follows: i) Combination
with other malignant tumors; ii) absence of medical records; iii) a
history of any preoperative therapy; and iv) patients <18 years
old. After application of the strict inclusion and exclusion
criteria, a total of 1,076 cases were included for further
analysis. A total of 549 patients who were diagnosed with EC and
underwent staging surgery were included in the final study
following application of inclusion and exclusion criteria. The
patients were randomly divided into a training cohort (n=366) and a
validation cohort (n=183), with a 2:1 ratio. The clinical and
pathological information of these patients were collected
preoperatively, including age, BMI, systolic blood pressure (SBP),
diastolic blood pressure (DBP), PP, serum fasting blood glucose
(FBG), cholesterol, TG and HDL-C levels, diabetes mellitus (DM),
hypertension (HP) and menopause status, histological type, tumor
grade, and presence of MI and LNM. The study cohort was examined
prior to surgery with MRI to determine the presence of LNM. MI
<50% or MI ≥50% was defined by the depth of MI according to
their pathological characteristics, which were extracted from the
pathology report. MetS was diagnosed according to diagnostic
criteria proposed by the Chinese Diabetes Society in 2004 (10), and PP was calculated as the
difference between SBP and DBP. As these factors of metabolic
origin tend to occur together, MRS was hence generated based on
baseline BMI, PP, FBG, TG and HDL-C values. In the present study,
the rationales of a ‘points’ system and the validity of shrinkage
method (11) were employed to
generate MRS when all five metabolism-related factors were analyzed
in quintiles. The detailed process is illustrated in Table SI.
Development and validation of the
nomogram
Univariate and multivariate logistic regression
analyses were used to identify independent risk factors predictive
for MI. Significant factors identified in multivariate logistic
regression were then included in the development of the nomogram.
The performance of the nomogram was assessed in both the training
and the validation group. The ROC curves of the nomogram were
calculated. ROC curves reflect the accuracy and specificity of a
model by calculating the area under the curve (AUC). The larger the
AUC, the higher the accuracy and specificity of the model. A
calibration plot was generated to visualize the association between
prediction model and actual outcomes. Decision Curve Analysis (DCA)
was performed to measure the clinical utility of the nomogram. A
net benefit (NB) analytic measure puts benefits and drawbacks on
the same scale, with the vertical axis representing the NB and the
horizontal axis representing the probability threshold. The model
with the highest NB at a particular threshold probability has a
higher clinical value and is more beneficial in clinical practice.
The performance of the MRS and other conventional clinical
characteristics associated with MI in patients with EC was
evaluated using univariate and multivariable logistic regression
analyses. Next, an MI-associated nomogram with independent risk
factors was performed with the ‘rms’ and ‘Hmisc’ R packages. The
ROC, NB and DCA curve of the prediction model were then analyzed by
Empower-Stats software (X&Y Solutions, Inc.) in both
cohorts.
Statistical analysis
Categorical variables are expressed as n (%) and
continuous variables are expressed as the mean ± standard
deviation. The χ2 or Fisher's exact tests were applied
for categorical variables. Student's t-test was applied for
continuous variables. Univariable and multivariate logistic
analyses were used to evaluate the associations between the risk of
MI and clinicopathological parameters in patients with EC.
Statistical analyses were conducted using SPSS version 26.0
software (IBM Corp.), the statistical software package R
(http://www.R-project.org; The R
Foundation) and Empower-Stats. The ‘Random Number Generators’
function of SPSS software was used to randomly group the patients.
Unless otherwise indicated, all tests were two-sided and P<0.05
was considered to indicate a statistically significant
difference.
Results
Characteristics of patients
As shown in Table I,
a total of 549 patients were included in the study. Among these,
366 were enrolled in the training cohort, and 183 in the validation
cohort. The mean ages of the patients within the training and
validation sets were 55.96±9.76 and 55.81±9.12 years (age range,
20–75 years). The MRS was 2.64±4.40 and 2.54±4.14 in the training
and validation sets, respectively. In the training set, MI ≥50%
accounted for 22.13% of the group, while in the validation set, the
proportion was 25.68%. DM (23.33% in the training cohort and 25.14%
in the validation cohort) and HP [136 patients (37.16%) in the
training cohort and 72 patients (39.34%) in the validation cohort]
were included in the study. Endometrioid endometrial carcinoma
(EEA) histological type was present in 89.07% of patients for both
groups, with other types including serous carcinoma and a mixed
type, among others. Most patients (92.08 and 90.71% for the
training and validation sets, respectively) were negative for LNM.
In terms of tumor grade, in the training group 125 (34.15%)
patients had a low tumor grade (G3), 156 (42.62%) patients had a
moderate tumor grade (G2) and 85 (23.22%) patients had a high tumor
grade (G1). The values were close for both groups. There were no
significant differences between the two cohorts for any
clinicopathological feature (P<0.05).
 | Table I.Basic characteristics of study
participants (n=549) in the training and validation groups. |
Table I.
Basic characteristics of study
participants (n=549) in the training and validation groups.
| Characteristic | Training | Validation | P-value |
|---|
| Patients, n | 366 | 183 |
|
| Age, years | 55.96±9.76 | 55.81±9.12 | 0.929 |
| BMI,
kg/m2 | 26.18±4.41 | 26.30±4.71 | 0.743 |
| SBP, mmHg | 125.88±14.30 | 128.64±16.99 | 0.138 |
| DBP, mmHg | 78.08±8.51 | 79.99±9.88 | 0.049 |
| PP, mmHg | 47.80±12.54 | 48.66±12.39 | 0.370 |
| FBG, mmol/l | 6.03±1.69 | 5.89±1.53 | 0.287 |
| TG, mmol/l | 1.63±1.09 | 1.56±0.81 | 0.734 |
| HDL-C, mmol/l | 1.21±0.30 | 1.23±0.41 | 0.675 |
| CA125, U/ml | 61.90±277.16 | 110.04±500.84 | 0.341 |
| MRS | 2.64±4.40 | 2.54±4.14 | 0.669 |
| MI, n (%) |
|
| 0.353 |
|
<50% | 285 (77.87) | 136 (74.32) |
|
| ≥50% | 81 (22.13) | 47 (25.68) |
|
| Menopausal status, n
(%) |
|
| 0.850 |
| Pre- | 131 (35.79) | 64 (34.97) |
|
|
Post- | 235 (64.21) | 119 (65.03) |
|
| DM, n (%) |
|
| 0.620 |
| No | 281 (76.78) | 137 (74.86) |
|
| Yes | 85 (23.22) | 46 (25.14) |
|
| HP, n (%) |
|
| 0.619 |
| No | 230 (62.84) | 111 (60.66) |
|
| Yes | 136 (37.16) | 72 (39.34) |
|
| Histological type, n
(%) |
|
| 1.000 |
| EEA | 326 (89.07) | 163 (89.07) |
|
|
Others | 40 (10.93) | 20 (10.93) |
|
| LNM, n (%) |
|
| 0.586 |
|
Negative | 337 (92.08) | 166 (90.71) |
|
|
Positive | 29 (7.92%) | 17 (9.29) |
|
| Grade, n (%) |
|
| 0.431 |
| G1 | 125 (34.15) | 69 (37.70) |
|
| G2 | 156 (42.62) | 80 (43.72) |
|
| G3 | 85 (23.22) | 34 (18.58) |
|
Univariate and multivariate analyses
for MI
The univariate analysis considered age, BMI, SBP,
DBP, PP, FBG, TG, HDL-C, cancer antigen 125, MRS, menopause status,
DM, HP, histological type, LNM and tumor grade as potential risk
factors for MI. Both the training and the validation cohorts
indicated that MRS (training set: OR, 1.06; 95% CI, 1.01-1.11;
P=0.023; validation set: OR, 1.08; 95% CI, 1.02-1.14; P=0.013),
histological type (training set: OR, 1.98; 95% CI, 1.11-3.53;
P=0.023; validation set: OR, 2.16; 95% CI, 1.07-4.36; P=0.032), LNM
(training set: OR, 3.15; 95% CI, 1.61-6.15; P<0.001; validation
set: OR, 4.72; 95% CI, 1.99-11.17; P<0.001), and tumor grade
(training set: Grade 2; OR, 1.71; 95% CI, 1.23-2.39; P=0.002; grade
3; OR, 2.10; 95% CI, 1.53-2.88; P<0.001; validation set: grade
2; OR, 1.64; 95% CI, 1.24-2.18; P<0.001; grade 3, OR, 2.07; 95%
CI, 1.39-3.07; P<0.001) were risk factors for MI. Detailed
information is listed in Table II.
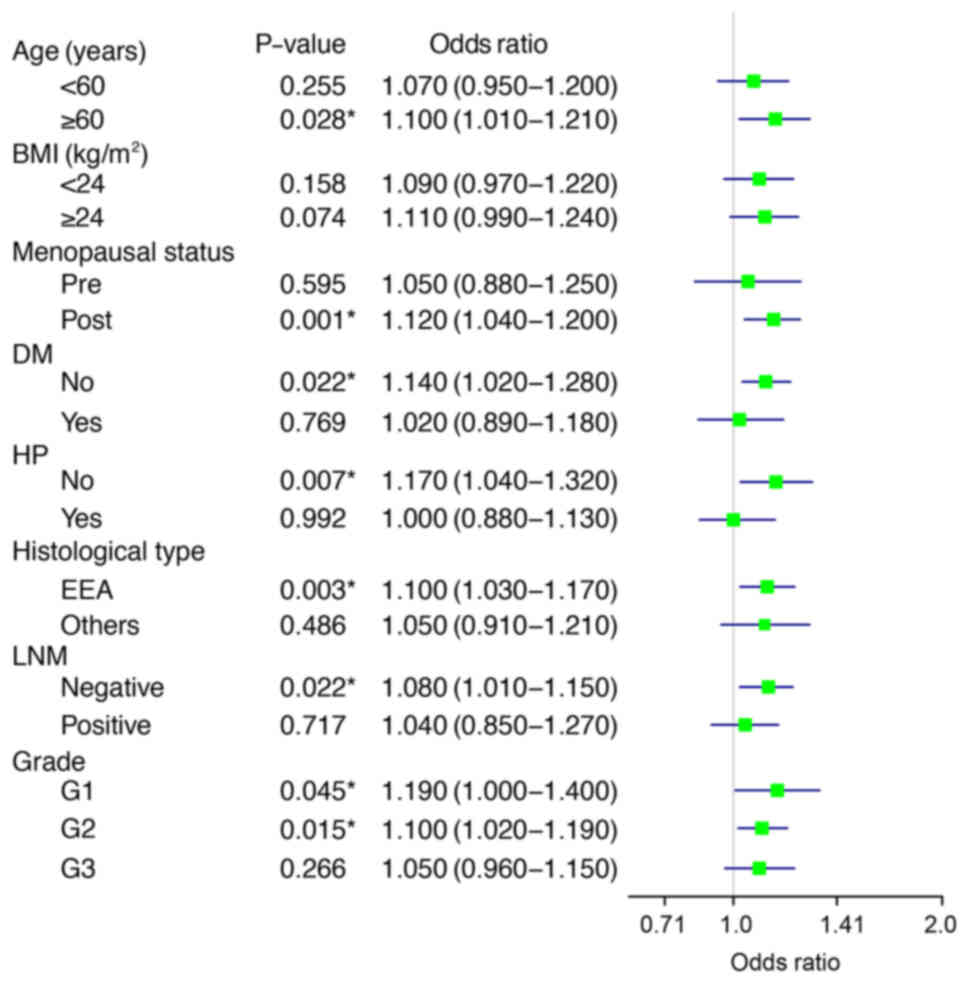
Next, stratified analyses were conducted to reveal whether the
influence of MRS on MI was stable in different clinicopathological
features. Fig. 1 shows that the
effect was more obvious in patients ≥60 years, with postmenopausal
status, with no DM or HP, with an EEA histology, no LNM, and tumor
grade 1 and 2. It can be concluded that MRS is closely related with
MI, and that it can increase the risk of MI in patients with
EC.
| Table II.Univariate analysis for myometrial
invasion in patients with endometrial cancer. |
Table II.
Univariate analysis for myometrial
invasion in patients with endometrial cancer.
|
| Training set | Validation set |
|---|
|
|
|
|
|---|
|
| Univariate
analysis | Multivariate
analysis | Univariate
analysis | Multivariate
analysis |
|---|
|
|
|
|
|
|
|---|
| Parameter | OR (95% CI) | P-value | OR (95% CI) | P-value | OR (95% CI) | P-value | OR (95% CI) | P-value |
|---|
| Age, years | 1.06
(1.03–1.08) | <0.001 | 1.02
(0.98–1.05) | 0.253 | 1.05
(1.02–1.09) | 0.039 | 1.11
(0.98–1.05) | 0.396 |
| BMI,
kg/m2 | 0.99
(0.94–1.04) | 0.691 |
|
| 0.95
(0.88–1.02) | 0.159 |
|
|
| SBP, mmHg | 1.02
(1.00–1.03) | 0.055 |
|
| 1.01
(0.99–1.02) | 0.490 |
|
|
| DBP, mmHg | 0.99
(0.97–1.02) | 0.446 |
|
| 0.99
(0.96–1.02) | 0.689 |
|
|
| PP, mmHg | 1.02
(1.01–1.04) | 0.006 |
|
| 1.02
(0.99–1.04) | 0.180 |
|
|
| FBG, mmol/l | 1.13
(1.00–1.28) | 0.056 |
|
| 1.13
(0.95–1.34) | 0.165 |
|
|
| TG, mmol/l | 0.88
(0.67–1.14) | 0.316 |
|
| 0.80
(0.53–1.20) | 0.275 |
|
|
| HDL-C, mmol/l | 0.64
(0.29–1.39) | 0.258 |
|
| 0.57
(0.23–1.41) | 0.225 |
|
|
| CA125, U/ml | 1.00
(1.00–1.00) | 0.357 |
|
| 1.00
(1.00–1.00) | 0.087 |
|
|
| MRS | 1.10
(1.04–1.16) | 0.014 | 1.06
(1.01–1.11) | 0.023 | 1.09
(1.01–1.18) | 0.004 | 1.08
(1.02–1.14) | 0.013 |
| Menopausal
status |
|
|
|
|
|
|
|
|
|
Pre- | 1.00 |
| 1.00 |
| 1.00 |
| 1.00 |
|
|
Post- | 2.29
(1.36–3.85) | 0.019 | 1.32
(0.71–2.47) | 0.381 | 2.64
(1.27–5.49) | 0.001 | 1.41
(0.65–3.09) | 0.384 |
| DM |
|
|
|
|
|
|
|
|
| No | 1.00 |
|
|
| 1.00 |
|
|
|
|
Yes | 0.93
(0.54–1.59) | 0.789 |
|
| 1.22
(0.61–2.45) | 0.569 |
|
|
| HP |
|
|
|
|
|
|
|
|
| No | 1.00 |
|
|
| 1.00 |
|
|
|
|
Yes | 1.42
(0.91–2.22) | 0.127 |
|
| 1.17
(0.62–2.19) | 0.630 |
|
|
| Histological
type |
|
|
|
|
|
|
|
|
|
EEA | 1.00 |
| 1.00 |
| 1.00 |
| 1.00 |
|
|
Others | 2.33
(1.19–4.56) | 0.014 | 1.98
(1.11–3.53) | 0.023 | 2.59
(1.03–6.55) | 0.044 | 2.16
(1.07–4.36) | 0.032 |
| LNM |
|
|
|
|
|
|
|
|
|
Negative | 1.00 |
| 1.00 |
| 1.00 |
| 1.00 |
|
|
Positive | 5.53
(2.78–11.03) | <0.001 | 3.15
(1.61–6.15) | <0.001 | 2.85
(1.11–7.30) | 0.029 | 4.72
(1.99–11.17) | <0.001 |
| Tumor grade |
|
|
|
|
|
|
|
|
| G1 | 1.00 |
| 1.00 |
| 1.00 |
| 1.00 |
|
| G2 | 3.70
(1.99–6.90) | <0.001 | 1.71
(1.23–2.39) | 0.002 | 2.85
(1.25–6.51) | 0.013 | 1.64
(1.24–2.18) | <0.001 |
| G3 | 5.04
(2.56–9.91) | <0.001 | 2.10
(1.53–2.88) | <0.001 | 6.76
(2.65–17.25) | <0.001 | 2.07
(1.39–3.07) | <0.001 |
Development and validation of
nomogram
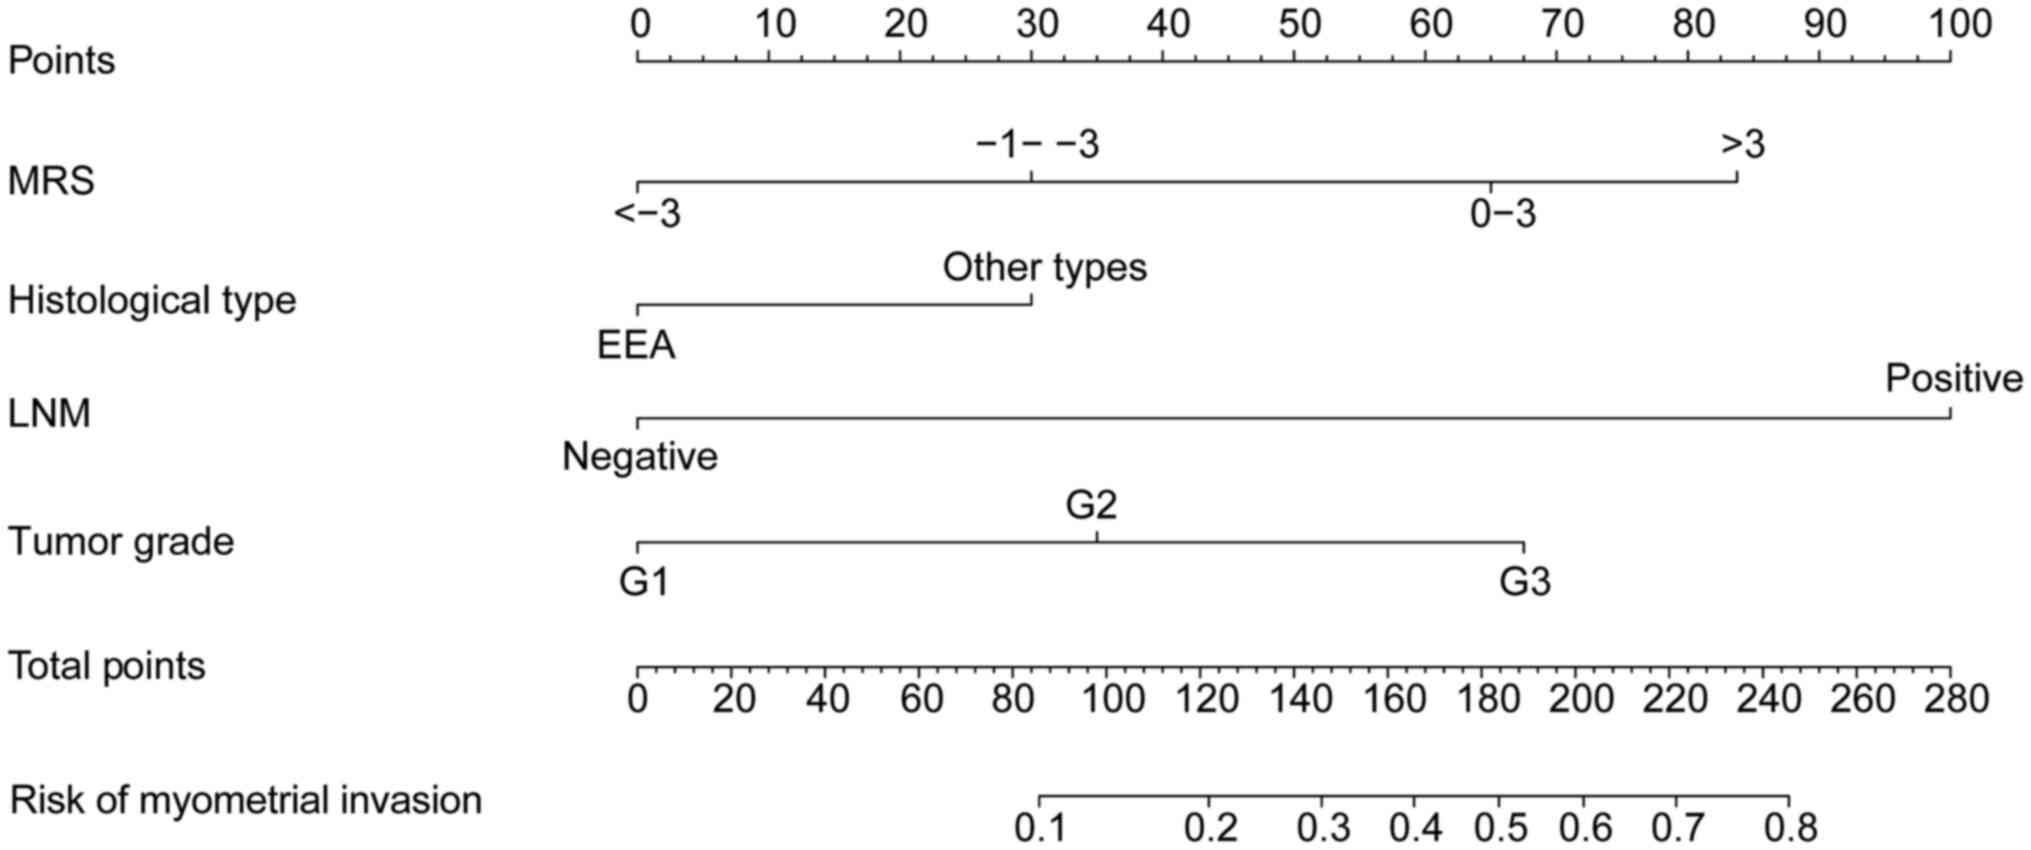
Based on the risk factors identified in the
univariate and multivariate regression analyses, a nomogram was
designed to predict MI in patients with EC (Fig. 2). From the nomogram, it was observed
that LNM has the greatest influence on MI, followed by MRS and
other risk factors. The highest total score was 280 points, and the
accumulated score for each variable state represents the
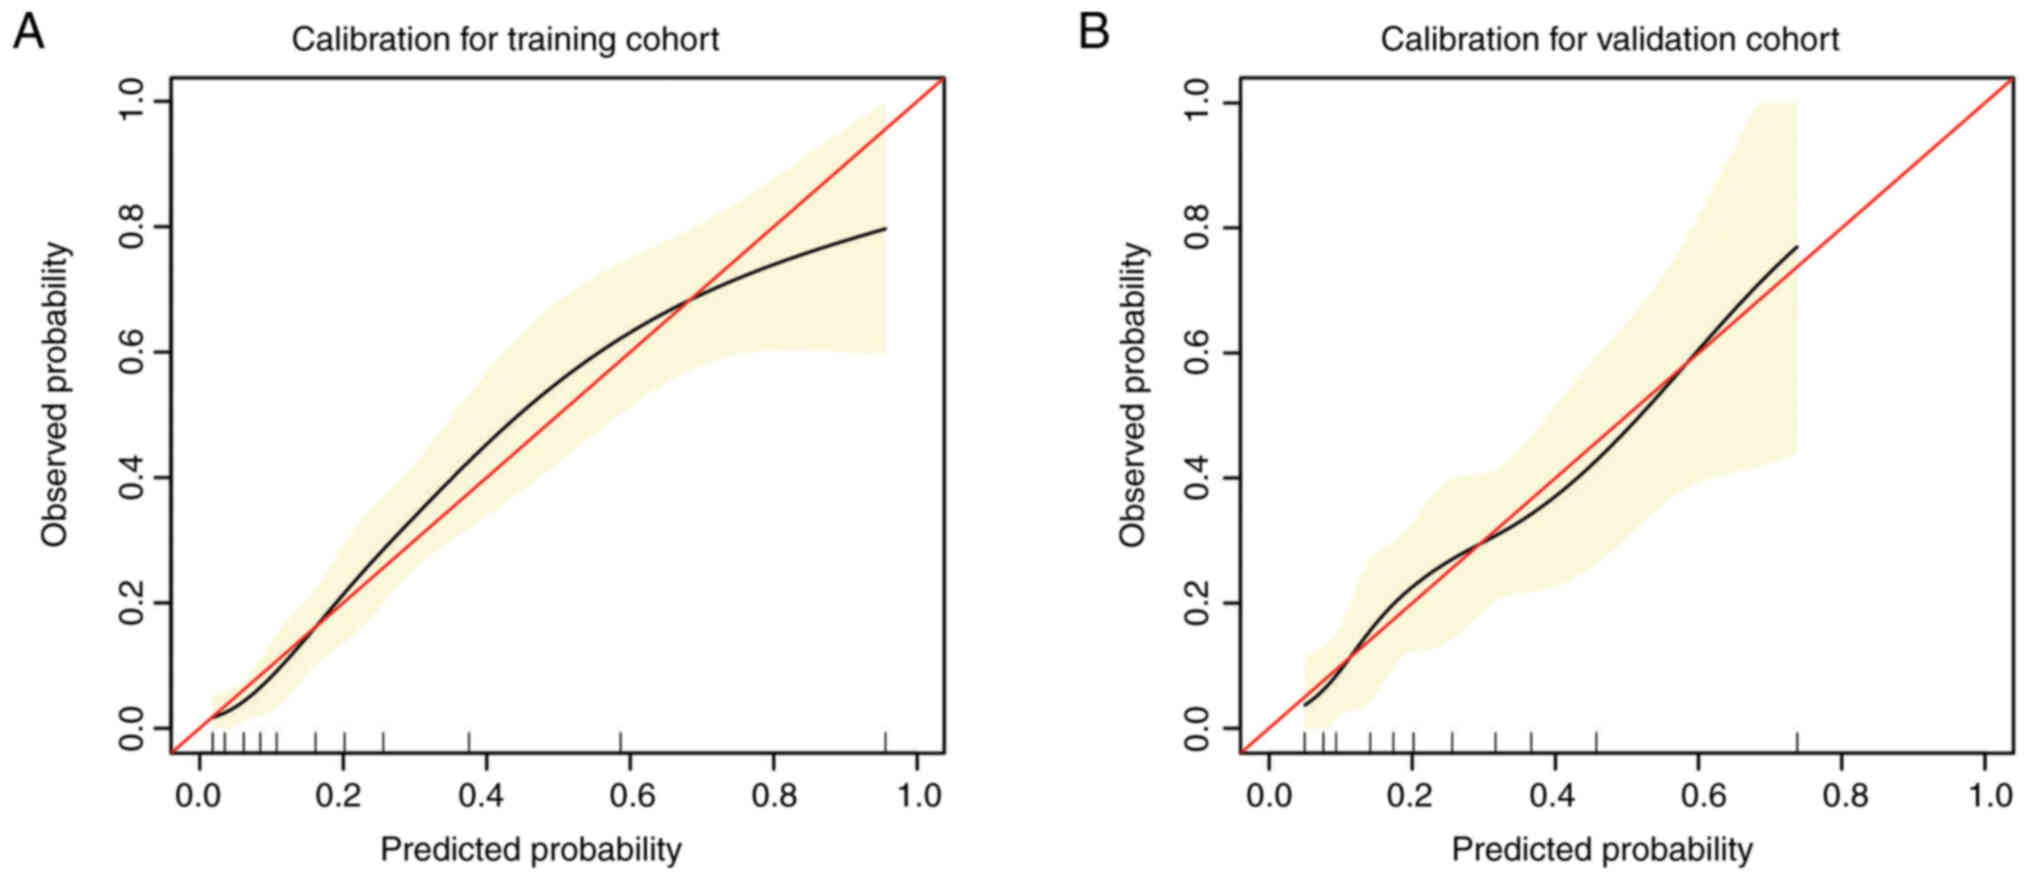
probability of MI. Discrimination and calibration analyses were
applied to assess the performance of the final model. The results
revealed that the nomogram was well calibrated for predicting MI
both in the training cohort and in the validation cohort (Fig. 3A and B).
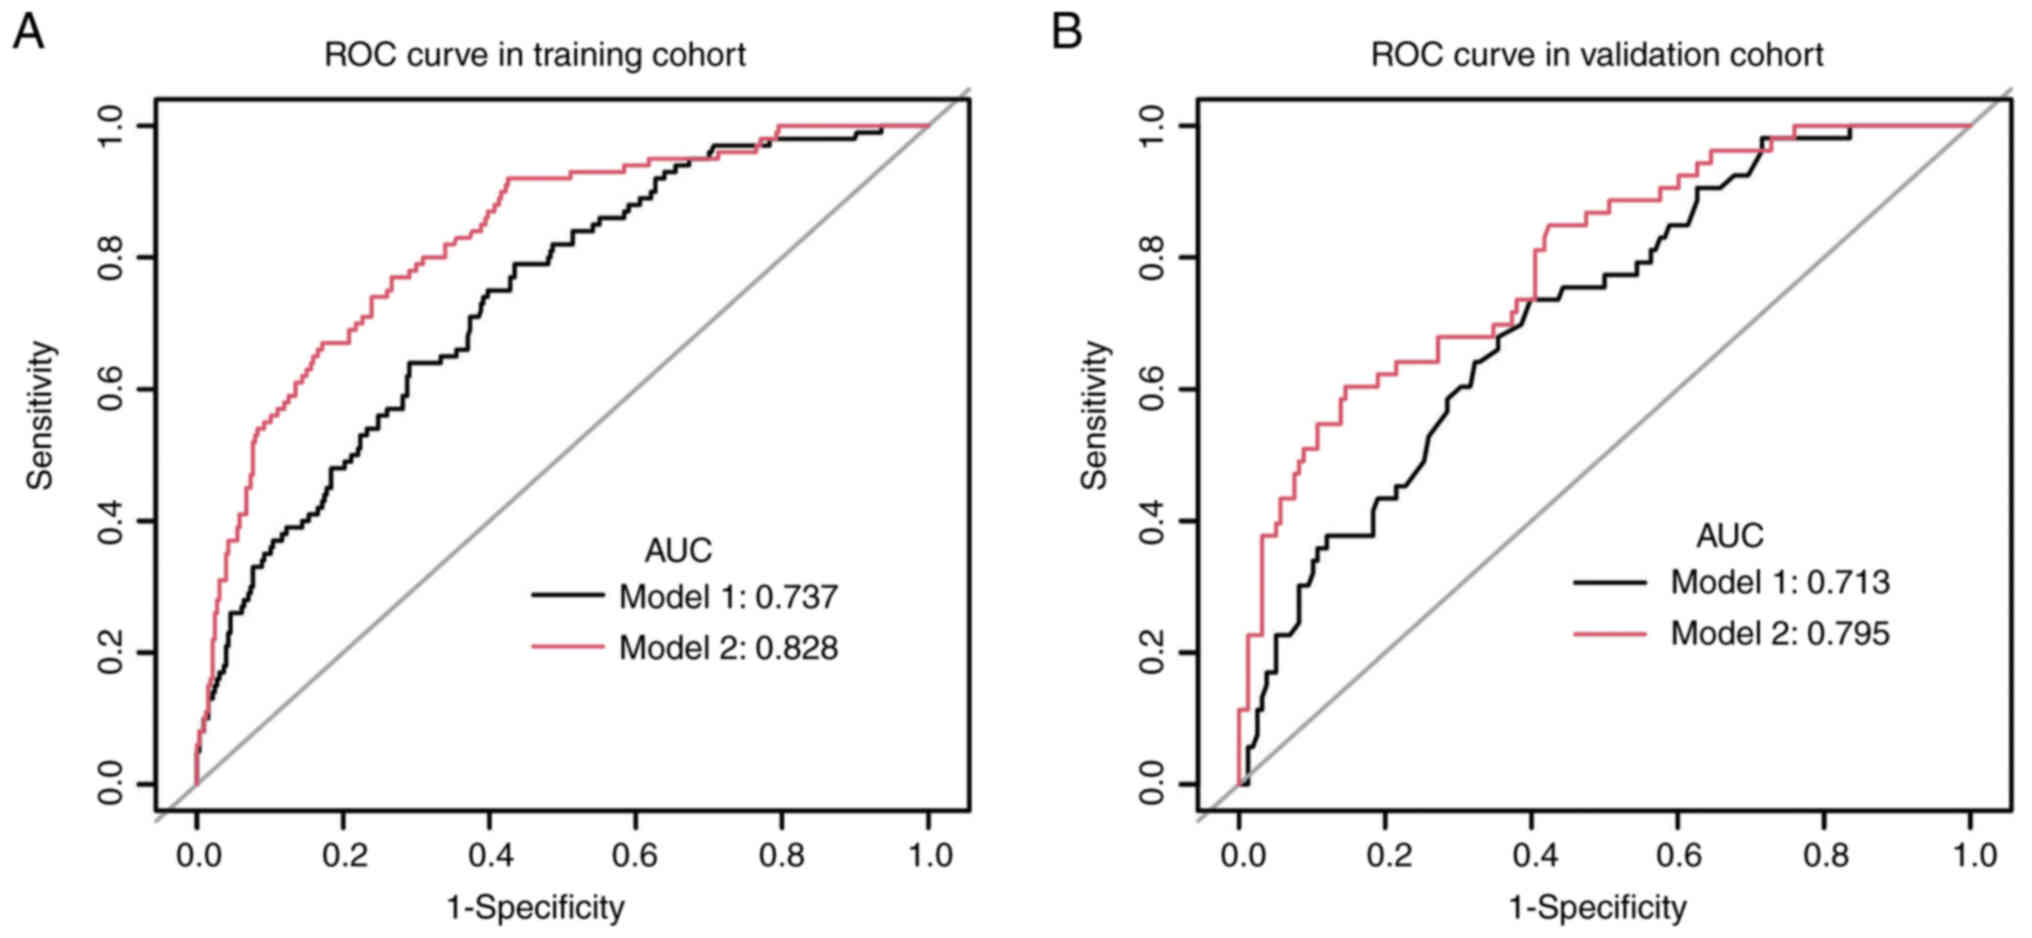
To further investigate the value of MRS in the
prediction of MI for patients with EC, two models were created.
Model 1 included the clinical variables of histological type, LNM
and tumor grade. Model 2 included the variables of model 1 and MRS.
The nomogram had an AUC value of 0.828 for model 2 in the training
group, compared with 0.737 for model 1 (P<0.05; Fig. 4A). In the validation group, the AUC
value was 0.795 for model 2 and 0.713 for model 1 (P<0.05;
Fig. 4B). The accuracy of the
nomogram was also validated in the total cohort, and the results
indicated that the AUC value was 0.806 for model 2 and 0.757 for
the model 1 (P<0.05; Fig. S1A).
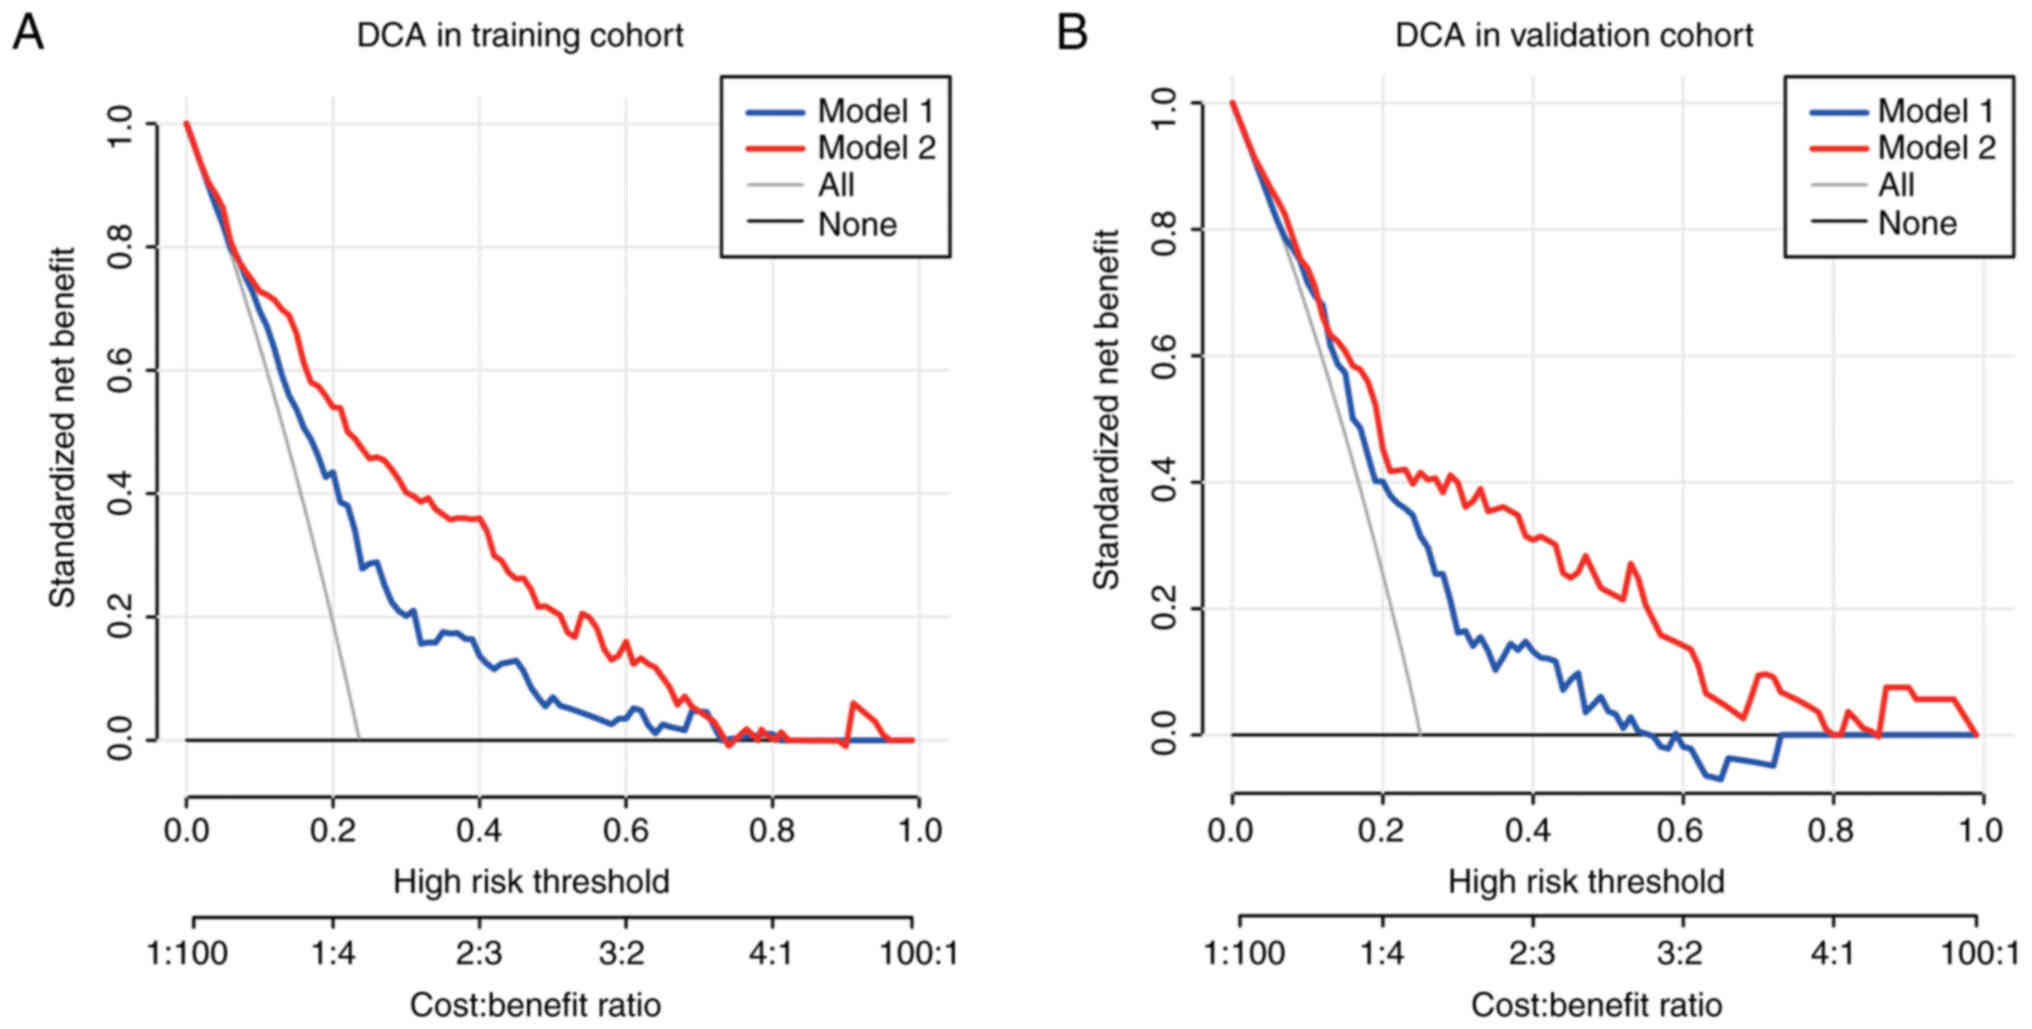
To further evaluate the clinical benefit of MRS performance in the
nomogram, DCA was conducted, which showed the benefits achieved
with the application of the nomogram. The NB in patients with EC is
significantly reduced when MRS is removed from the model, in both
of the sets (Fig. 5A and B). The NB
in model 2 also achieved a higher value than that in model 1 in the
whole cohort (Fig. S1B).
Discussion
EC is a frequently occurring gynecological
malignancy with a high OS rate, especially when diagnosed at an
early stage. The efforts of researchers focus on the accurate
prediction of EC clinicopathological features and subsequent
personalized treatment. MI is a well-known predictor of OS and
recurrence-free survival in EC, and is essential in making the
decision of which adjuvant therapy to apply (12). A previous found that metabolic
disorders are closely associated with tumor stage, grade,
lymph-vascular space invasion (LVSI) and LNM of EC, therefore
representing an independent risk factor of EEC (13). Previous studies analyzed stage I and
II cases without adnexal pathological factors, and found that
patients with type I EC without depth of MI ≥1/2 had a significant
risk of ovarian metastasis and LNM (14,15).
However, the association between metabolic abnormalities and MI is
not clear. The present study investigated preoperative risk factors
of MI and found four features, namely MRS, histological type, LNM
and tumor grade, that were independent risk factors for MI in EC. A
nomogram was then constructed and validated by combining MRS
features and clinical information to assess the depth of MI in
patients with EC. Further ROC analysis showed that the predictive
value of model 2 for MI was significantly higher than that of model
1, indicating that the addition of MRS significantly improved the
predictive accuracy of MI. The calibration plot showed consistency
between the training and validation sets. DCA showed that the
application of the combined nomogram including MRS could provide
more benefits than the clinicopathological model alone. MRS is also
a commonly used indicator and easy to obtain.
The highlight of the present study is the inclusion
of the MRS in the predictive model of MI. One study reported direct
associations between MetS and EC risk (10). Women with metabolic disorders,
including obesity and diabetes, have an increased risk of
developing EC. A case-control study from the European Prospective
Investigation into Cancer and Nutrition, which analyzed 284 women
with EC, found that women with MetS had a relative risk of 2.12
times that of the general population. The same study noticed a
positive trend in risk with the increasing number of MetSs. A
different study conducted on 135,110 postmenopausal women in the UK
identified three independent predictors of EC risk: BMI, body fat
percentage and fat mass (16).
However, metabolic indicators have so far been neglected in the
prediction of EC metastasis. A retrospective study on 506 EC cases
revealed that the patients with MetS had a higher positive rate of
LNM, LVSI and deep-MI proportion, suggesting that patients with EC
and MetS have higher tumor aggressiveness (10). In the present findings, MRS,
histological type, LNM and tumor grade were independent factors,
and these factors were used to build the model. To the best of our
knowledge, there only a few predictive models have been constructed
to evaluate MI before surgery, and they are mostly based on MRI
radiomics (7,17). The aforementioned studies used
parameters such as axial T1-weighted images (T1WIs), T2WIs and
diffusion weighted imaging to sketch region of interest, and
further least absolute shrinkage and selection operator regression
was conducted to narrow the range. The AUC of the clinical
parameters, radiomics signature and nomogram in evaluating DMI were
0.744, 0.869 and 0.883, respectively. The predictive accuracy was
also very high for the present model in predicting MI, with an AUC
value of 0.828 for model 2 in the training group. However, DCA was
conducted to further verify the accuracy of the predictive model.
While clinical imaging indicators can improve the diagnosis of deep
MI in patients with early stage EC, imaging examinations are
subjective and depend on the technology used and the skill of the
clinician. The previous literature has reported several
risk-scoring models for the prediction of MI in patients with EC.
One of the key indicators associated with MI is estrogen-related
receptor γ (ERRγ) (18). ERRγ
overexpression occurs in EC and may be involved in the regulation
of glucose metabolism and the promotion of MI in EC. Furthermore,
the AUC for ERRγ was reported as 0.834, indicating the good
diagnostic performance ERRγ for differentiating between healthy
individuals and patients with EC, and that ERRγ may represent a
promising non-invasive biomarker for the disease. In the present
study, MRS was normally distributed in the patients with EC. MRS
was found to be a significant indicator of MI, implying that
metabolic mechanisms may be involved in EC invasion. The different
components of the score system were not investigated. Another study
suggested that HDL-C may be a valuable marker of EC, but there is
no direct evidence that it is associated with metastasis (19).
Although the results of the present study indicated
that MRS has a significant association with MI, stratified analysis
showed that more clear effects were found in certain patients, such
as older patients (≥60 years), patients with a higher BMI (≥24
kg/m2), patients in postmenopausal status, and those
without DM or HP. It has been reported that MetSs have a
significant influence in specific groups, such as in patients with
postoperative complications, or in those with early-stage or
low-grade tumors, which is consistent with what was observed in the
present study (20–22). Since a good proportion of young
patients with EC would like to preserve fertility and, to the best
of our knowledge, there have been no such models or studies related
to this, we may explore this in the future. The depth of MI is an
important indication for fertility preservation treatment in EC,
and a future study could explore the relationship between MRS score
and MI in patients with EC who wish to preserve fertility. MRS can
be added to the predictive model of MI to improve its accuracy.
The present study had a number of limitations.
Firstly, all data was derived from a single-center; therefore,
further external validation of the nomogram is needed. Secondly,
the retrospective nature of this study may lead to potential bias.
Finally, although the number of enrolled cases is relatively large,
a larger sample size and a randomized control trial are recommended
for future studies. Using the nomogram built in the present study,
it is possible to adopt more conservative treatment, avoiding
extended surgery, which would improve the quality of life of the
patients, while high-risk patients can be screened to undertake
more aggressive measures.
In conclusion, the present study investigated the
effect of MRS in patients with EC and its correlation with MI. With
the use of stratified analysis, specific subgroups of patients in
which MRS has a stronger influence on MI were found. MRS can
significantly improve the accuracy of predicting MI in patients
with EC. A nomogram integrating clinical factors and MRS was built
that can predict MI in patients with EC. The effectiveness and NB
of the model was determined. Given the high incidence of MetSs in
EC, monitoring metabolic abnormalities may enable clinicians to
identify individuals at high risk at an early stage and provide
guidance for a healthy lifestyle.
Supplementary Material
Supporting Data
Supporting Data
Acknowledgements
Not applicable.
Funding
Funding: No funding was received.
Availability of data and materials
The datasets used and/or analyzed during the current
study are available from the corresponding author on reasonable
request.
Authors' contributions
YQ conceived and designed the experiments, and
contributed reagents/materials/analysis tools. LD made
contributions to the methodology and statistical analysis, and
provided supervision. QZ performed the data collection and analyzed
the data. YQ and LD confirm the authenticity of all the raw data.
YQ and LD contributed to the writing of the manuscript. All authors
read and approved the final manuscript.
Ethics approval and consent to
participate
The present study was approved by the Institutional
Review Board for Clinical Trials of Nanjing First Hospital
(approval number, KY20210604-05). The protocol is described on the
hospital website, and subjects were provided the opportunity to
opt-out; therefore, no additional consent was required from the
patients.
Patient consent for publication
Not applicable.
Competing interests
The authors declare that they have no competing
interests.
References
|
1
|
Zhang S, Gong TT, Liu FH, Jiang YT, Sun H,
Ma XX, Zhao YH and Wu QJ: Global, regional, and national burden of
endometrial cancer, 1990–2017: Results from the global burden of
disease study, 2017. Front Oncol. 9:14402019. View Article : Google Scholar : PubMed/NCBI
|
|
2
|
Morice P, Leary A, Creutzberg C,
Abu-Rustum N and Darai E: Endometrial cancer. Lancet.
387:1094–1108. 2016. View Article : Google Scholar : PubMed/NCBI
|
|
3
|
Yang XG, Feng JT, Wang F, He X, Zhang H,
Yang L, Zhang HR and Hu YC: Development and validation of a
prognostic nomogram for the overall survival of patients living
with spinal metastases. J Neurooncol. 145:167–176. 2019. View Article : Google Scholar : PubMed/NCBI
|
|
4
|
Wu J, Zhang H, Li L, Hu M, Chen L, Xu B
and Song Q: A nomogram for predicting overall survival in patients
with low-grade endometrial stromal sarcoma: A population-based
analysis. Cancer Commun (Lond). 40:301–312. 2020. View Article : Google Scholar : PubMed/NCBI
|
|
5
|
Dong Y, Cheng Y, Tian W, Zhang H, Wang Z,
Li X, Shan B, Ren Y, Wei L, Wang H and Wang J: An Externally
validated nomogram for predicting lymph node metastasis of presumed
Stage I and II endometrial cancer. Front Oncol. 9:12182019.
View Article : Google Scholar : PubMed/NCBI
|
|
6
|
Li X, Cheng Y, Dong Y, Zhou J, Wang Z, Li
X and Wang J: Development and validation of predictive model for
lymph node metastasis in endometrial cancer: A SEER analysis. Ann
Transl Med. 9:5382021. View Article : Google Scholar : PubMed/NCBI
|
|
7
|
Wang Y, Bi Q, Deng Y, Yang Z, Song Y, Wu Y
and Wu K: Development and validation of an MRI-based radiomics
nomogram for assessing deep myometrial invasion in early stage
endometrial adenocarcinoma. Acad Radiol. Jun 28–2022.doi:
10.1016/j.acra.2022.05.017 (Epub ahead of print). View Article : Google Scholar
|
|
8
|
Esposito K, Chiodini P, Colao A, Lenzi A
and Giugliano D: Metabolic syndrome and risk of cancer: A
systematic review and meta-analysis. Diabetes Care. 35:2402–2411.
2012. View Article : Google Scholar : PubMed/NCBI
|
|
9
|
Sha H, Hu D, Wu S, Peng F, Xu G, Fan G,
Lin X, Chen G, Liang B, Chen Y, et al: Baseline metabolic risk
score and postsurgical esophageal cancer-specific mortality: The
fujian prospective investigation of cancer (FIESTA) study. J
Cancer. 9:1173–1181. 2018. View Article : Google Scholar : PubMed/NCBI
|
|
10
|
Yang X, Li X, Dong Y, Fan Y, Cheng Y, Zhai
L, Zhang S, Zhou J and Wang J: Effects of metabolic syndrome and
its components on the prognosis of endometrial cancer. Front
Endocrinol (Lausanne). 12:7807692021. View Article : Google Scholar : PubMed/NCBI
|
|
11
|
Tibshirani R: The lasso method for
variable selection in the Cox model. Stat Med. 16:385–395. 1997.
View Article : Google Scholar : PubMed/NCBI
|
|
12
|
Ruz-Caracuel I, Ramon-Patino JL,
Lopez-Janeiro A, Yebenes L, Berjon A, Hernandez A, Gallego A,
Heredia-Soto V, Mendiola M, Redondo A, et al: Myoinvasive pattern
as a prognostic marker in Low-grade, early-stage endometrioid
endometrial carcinoma. Cancers (Basel). 11:18452019. View Article : Google Scholar : PubMed/NCBI
|
|
13
|
Shou H, Yan K, Song J, Zhao L, Zhang Y and
Ni J: Metabolic syndrome affects the long-term survival of patients
with non-endometrioid carcinoma of the uterine corpus. Int J
Gynaecol Obstet. 148:96–101. 2020. View Article : Google Scholar : PubMed/NCBI
|
|
14
|
Matoba Y, Yamagami W, Chiyoda T, Kobayashi
Y, Tominaga E, Banno K and Aoki D: Characteristics and
clinicopathological features of patients with ovarian metastasis of
endometrial cancer: A retrospective study. J Obstet Gynaecol.
42:2456–2462. 2022. View Article : Google Scholar : PubMed/NCBI
|
|
15
|
Maire M, Bourdon A, Soubeyran I, Lucchesi
C, Guyon F, Babin G, Floquet A, Petit A, Baud J, Velasco V, et al:
Biomarkers associated with lymph nodal metastasis in endometrioid
endometrial carcinoma. Cancers (Basel). 14:21882022. View Article : Google Scholar : PubMed/NCBI
|
|
16
|
Omiyale W, Allen NE and Sweetland S: Body
size, body composition and endometrial cancer risk among
postmenopausal women in UK Biobank. Int J Cancer. 147:2405–2415.
2020. View Article : Google Scholar : PubMed/NCBI
|
|
17
|
Zhao M, Wen F, Shi J, Song J, Zhao J, Song
Q, Lai Q, Luo Y, Yu T, Jiang X, et al: MRI-based radiomics nomogram
for the preoperative prediction of deep myometrial invasion of FIGO
stage I endometrial carcinoma. Med Phys. 49:6505–6516. 2022.
View Article : Google Scholar : PubMed/NCBI
|
|
18
|
Tong Y, Huang M, Chen L, Lei H, Lin H, Mao
X and Sun P: ERRgamma, a novel biomarker, associates with
pathoglycemia of endometrial cancer to predict myometrial invasion.
J Oncol. 2022:52833882022. View Article : Google Scholar : PubMed/NCBI
|
|
19
|
Luo YZ, Yang Z, Qiu YL, Li XH, Qin LQ, Su
QS and Mo WN: Pretreatment triglycerides-to-high density
lipoprotein cholesterol ratio in postmenopausal women with
endometrial cancer. Kaohsiung J Med Sci. 35:303–309. 2019.
View Article : Google Scholar : PubMed/NCBI
|
|
20
|
Borden LE, Locklear TM, Grider DJ, Osborne
JL, Saks EJ, Valea FA and Iglesias DA: Endometrial Cancer
Characteristics and Risk of Recurrence. Am J Clin Pathol.
157:90–97. 2022. View Article : Google Scholar : PubMed/NCBI
|
|
21
|
Bacalbasa N, Diaconu C, Iliescu L, Savu C,
Savu C, Balalau C, Dimitriu M, Filipescu A, Bratu OG, Neacsu A, et
al: The Influence of the metabolic syndrome on early postoperative
outcomes of patients with advanced-stage endometrial cancer. In
Vivo. 34:2913–2917. 2020. View Article : Google Scholar : PubMed/NCBI
|
|
22
|
Andrade Fernandes JP, da Camara AO,
Frajacomo FT, Chaves CBP, Fernandes Pereira A and Chaves GV:
Metabolic profile of patients with endometrial adenocarcinoma and
association with tumor grade. Int J Gynecol Cancer. 32:626–632.
2022. View Article : Google Scholar : PubMed/NCBI
|