Introduction
Bile duct cancer is a high-grade epithelial tumor
that arises from the bile duct epithelium. This highly malignant
tumor trait is caused due to difficulty in early diagnosis, the
anatomical complication of radical resection and the insufficient
efficacy of anticancer therapy. The 5-year survival rate for
inoperable patients was ≤5% (1),
and the overall 5-year survival rates of patients who undergo
surgery are 20–30% after curative resection (2). The first choice for biliary tract
cancer is surgical resection because its localization leads to
better prognoses. Preoperative diagnosis, such as local extension
and distant metastasis, is vital to decide cancer resection.
Recently, the preoperative use of 18F-fluorodeoxyglucose
positron emission tomography (FDG-PET) has been reported to be
effective in detecting lymph node metastasis and unexpected distant
metastasis on gallbladder carcinoma and biliary carcinoma with the
advancement of diagnostic imaging (3–7).
Additionally, various reports have demonstrated an association
between the max value of standardized uptake value (SUVmax) and
overall survival (OS) or disease-free survival (DFS) in the
gallbladder and biliary tract cancers (7–12).
However, only a few reports examine SUVmax values and
histopathological characteristics. Paudyal et al (13) reported a correlation between F18-FDG
and glucose uptake level by cholangiocarcinoma using
immunohistochemistry in bile duct cancer. However, the
investigation of the relationship between clinicopathological tumor
grade and SUVmax value has not been fully clarified. Therefore,
this study aimed to investigate the correlation between SUVmax and
prognosis and recurrence in extrahepatic cholangiocarcinoma and
analyze the correlation between SUVmax and tumor grade using
immunostaining of proliferative capacity and glucose uptake of
cancer cells.
Materials and methods
Patients and study design
This single-center retrospective study was approved
by the Medical Ethics Committee of Hirosaki University Graduate
School of Medicine. Of the 331 patients who underwent surgery for
hilar and distal cholangiocarcinoma from January 2008 to May 2018,
86 patients who met the criteria were included in the control
group. We excluded patients with poorly controlled diabetes,
patients with an inability to reduce obstructive jaundice who
underwent semi-emergent surgery, and patients from whom informed
consent for FDG-PET/CT examination could not be obtained.
Furthermore, to eliminate the influence of inter-institutional
errors in the SUVmax values, we excluded patients who had been
examined preoperatively at other hospitals and did not undergo
FDG-PET/CT at our hospital. Patients with liver metastasis, lung
metastasis, bone metastasis, peritoneal dissemination, distant
lymph node metastasis (para-aortic lymph node, extra-abdominal
lymph node), or those who were inoperable because of their poor
general condition were considered unsuitable for surgery and were
treated with chemotherapy. The efficacy of preoperative
chemotherapy in biliary tract cancer has not been established
(14). Therefore, we did not
administrate preoperative chemotherapy at our institution. All
other patients considered to be operable (n=331) underwent surgery
without preoperative chemotherapy.
Of these 86 patients, 58 were males and 28 were
females, with a median age of 71 years. The locations of carcinoma
were hilar (29 cases) and distal (57 cases) anatomically. Curative
resection and lymph node dissection were performed depending on the
primary tumor location, wherein pancreaticoduodenectomy or
pylorus-preserving pancreaticoduodenectomy was performed in 56
cases, combined hepatectomy with bile duct resection in 26 cases
and bile duct resection in 4 cases. After surgery, CT scans were
performed every 3–6 months to identify any local recurrence or
distant metastasis. Serum CA19-9, serum SPan-1, and serum DUPAN-2
levels were also periodically evaluated as tumor markers to aid in
the diagnosis of recurrence. The definition of recurrence was
confirmation of local or distant metastatic lesions on CT by a
radiologist, accompanied by an increase of tumor markers. In
particular, the following findings were used as criteria for local
recurrence: i) soft tissue shadow with a tendency to enlarge near
the resected primary tumor, ii) soft tissue shadow with deformation
of the portal vein, hepatic artery, or hilar bile duct near the
resected primary tumor, iii) FDG accumulation on FDG/PET-CT, and
iv) soft tissue shadow that can be differentiated from an
inflammatory mass.
Tegafur, gimeracil, and oteracil (S-1) at 80
mg/m2 on days 1–14 every 3 weeks for 1 year were
administered in 52 cases for adjuvant chemotherapy. Gemcitabine
plus cisplatin to gemcitabine was administered in one patient and
gemcitabine to cisplatin in another patient. Survival data were
obtained from hospital medical charts. The median observation
period was 31 months.
Data were retrospectively collected from an
electronic medical records system and included the following:
Information on clinical and demographic characteristics,
pathological characteristics and stages, postoperative recurrence
duration, and overall survival. All study procedures involving
participants were performed following the ethical standards of the
institutional and national research committees and the 1964
Helsinki Declaration and its later amendments or comparable ethical
standards. None of the patients applied for withdrawal of
consent.
Pathological analysis
All surgical specimens were fixed with 10% formalin
at 25°C for 48–72 h. In the pancreatoduodenectomy cases, the common
bile ducts were sliced at right angles. The enlarged right and left
lobectomy cases were resected at intervals of 5–7 mm intervals on a
plane perpendicular to the long axis on the craniocaudal side. The
extrahepatic bile duct resection cases were sliced in a plane
perpendicular to the extrahepatic bile duct. Thinly sliced sections
(4 µm) were stained with H&E (Hematoxylin 20 min and eosin 3
min at room temperature, usually 25°C) for the histopathological
examination. Clinicopathological findings, such as depth of tumor
invasion, histological type, lymph node metastasis, lymphatic
invasion, venous invasion, and stage, were reviewed according to
the 8th edition of the Tumor-Node-Metastasis classification of the
Union For International Cancer Control (15).
Immunohistochemical staining
Deparaffinized sections were immunohistochemically
examined using the standard avidin-biotin-peroxidase complex method
with an automated immunostainer (Benchmark XT; Ventana Medical
System). In brief, deparaffinized slides were treated with Tris
(pH: 7.8) at 95°C for 44 min. The slides were treated with 5%
non-fat dry milk at 37°C for 15 min for blocking endogenous
peroxides and protein. The slides were incubated with primary
antibodies for 60 min at room temperature. The antibodies used were
as follows: glucose transporter 1 (Glut1; rabbit polyclonal, Abcam,
Catalog No: ab15309, dilution 1:200), hypoxia-inducible factor 1α
(HIF-1α; Clone: H1α67, mouse monoclonal, MILLIPORE, Catalog No:
MAB5382, dilution 1:500), and Ki-67 (Clone: MIB-1, mouse
monoclonal, Dako, Catalog No: M7240, dilution 1:100). The Glut1 is
a transmembrane protein and is associated with glucose transport
inside and outside the cell. The HIF-1α is a typical
hypoxia-related marker. The Ki-67 is a marker that determines the
growth fraction of a given cell population.
Immunohistochemistry evaluation
Immunohistochemical staining specimens for Glut1,
HIF-1α, and Ki-67 were evaluated by two experienced pathologists
(TY and KH) without patient or clinical outcome information. The
intensity of staining and the percentage of stained tumor cells
were calculated for Glut1 and HIF-1α staining for all specimens.
Additionally, the number of tumor cells with positive nuclei was
calculated for Ki-67 staining. Specifically, the staining intensity
of cells is classified into scores of 0 (negative), 1 (weak), 2
(intermediate), and 3 (strong) in the Glut1 and HIF-1α staining
evaluation regarding the H score (range 0–300), and the percentage
of stained tumor cells is shown in the total tumor cells (0–100%).
The H score was then calculated by multiplying the staining
intensity of tumor cells (0–3) by the distribution percentage of
positive cells (0–100%). The Ki-67 ratio was calculated by counting
the number of positive tumor cells per 1000 tumor cells in a tumor
hot spot.
FDG-PET/CT and image analysis
All patients fasted for at least 4 h and water
intake was encouraged to prepare them for FDG-PET/CT. F-18 FDG (FDG
scan injectable, 185 MBq on the assay data; Nihon Medi-Physics),
which was delivered via intravenous injection ~60 min before the
initiation of scanning. Patients were advised to drink a sufficient
amount of water and remain calm during the 60-min uptake period.
Data in 7–8 bed positions with an acquisition time of 2.5-3.0 min
per bed position were acquired using a FDG-PET/CT system (Discovery
ST Elite 16; GE Healthcare). The CT was performed first (30–80 mA,
120 kV, 3.75-3.27 mm slice thickness). The CT data were used for
FDG-PET data attenuation correction as well as co-registration with
the attenuation-corrected FDG-PET images. The PET data of the same
body regions were immediately acquired following CT imaging. The
FDG-PET, CT, and fused FDG-PET/CT images were available for review
and were displayed in the axial, coronal, and sagittal planes on a
viewer system (Discovery ST Elite 16; GE Healthcare). According to
the previous study, SUVmax (g/ml) was evaluated in all
histopathologically proven lesions (10). The SUVmax, which was defined as the
highest SUV in the pixel with the maximal SUV within the region of
interest, was measured and recorded for the focal areas of uptake.
The SUVmax values were standardized for the injected dose and the
patient's weight.
Statistical analysis
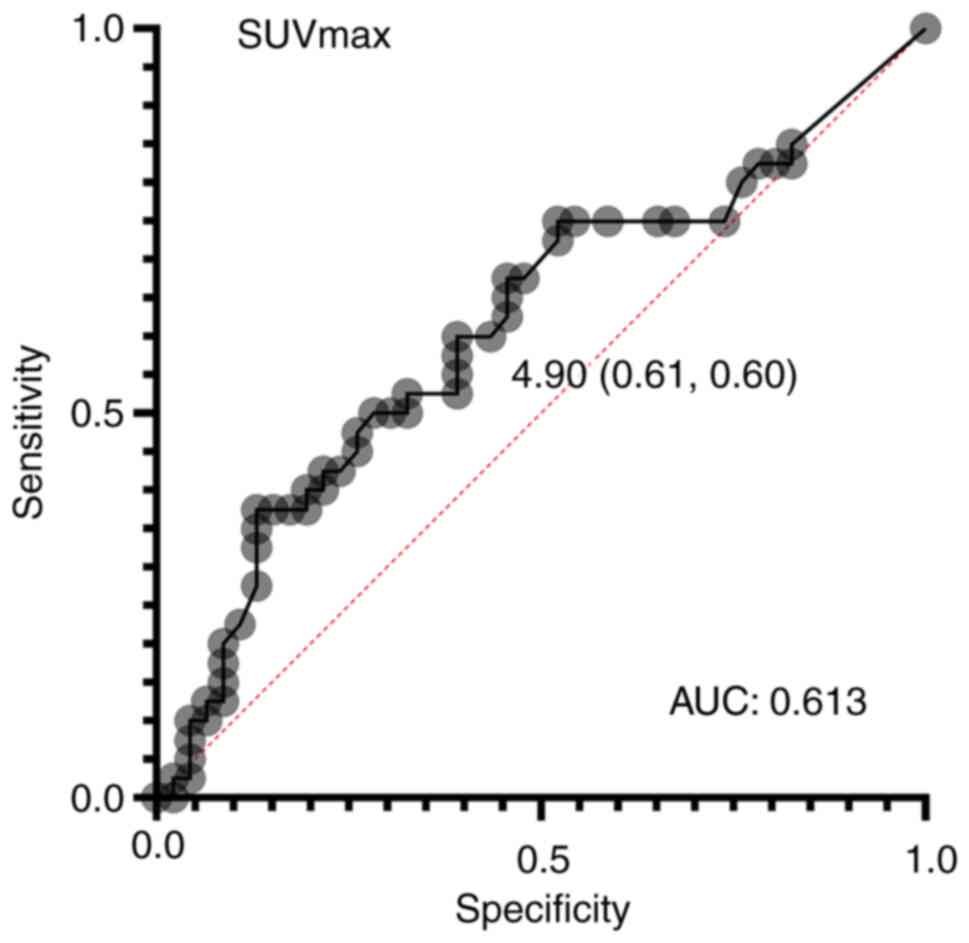
We used receiver operating characteristic (ROC)
curves with postoperative recurrence as the categorical variable to
calculate the cutoff value of the SUVmax. The
Kaplan-Meier method was used for OS and the DFS analysis was used
to estimate the event rates and the log-rank test for survival
comparisons between patient groups. Univariate analysis was
performed for prognostic factors using a log-rank test. Significant
factors in univariate analysis were included in multivariate
analysis using a Cox proportional hazards model. And Cox
proportional analysis was used for multivariate analysis. The
χ2 and Fisher exact (categories with expected values
<5) probability tests were used to examine the relationship
between SUVmax and clinicopathological features, such as sex, age,
location, macroscopic type, histology, lymphatic invasion, vessel
invasion, perineural invasion, tumor status (T), node status (N),
stage, portal vein invasion, resection margin status, preoperative
biliary drainage and preoperative serum hemoglobin A1 (HbA1c).
Continuous variables between two groups [SUVmax <4.9 (SUV-low)
group and SUVmax ≥4.9 (SUV-high) group] were compared using the
Mann-Whitney U test to examine the Glut1, HIF-1α and Ki-67
expressions. The association between the SUVmax and Glut1, HIF-1α
and Ki-67 expressions was evaluated using Spearman's rank
correlation test. The P-values of <0.05 was considered
significant, and statistical analysis was performed using GraphPad
Prism software version 9.0.
Results
Clinicopathological factors and
SUVmax
From the ROC curve, the optimal cutoff value for
SUVmax to predict recurrence was calculated to be 4.9
(area under the curve: 0.613) (Fig.
1). The median value was divided into groups of 44 cases with
SUV-low and 42 cases with SUV-high. The comparison of each group
with clinicopathological factors (sex, age, localization,
macroscopic type, histology, lymphatic invasion, vessel invasion,
perineural invasion, T status, N status, stage, portal vein
invasion, resection status, preoperative biliary drainage,
preoperative serum HbA1c, and cholangitis) showed no significant
differences in any of the factors (Table I).
 | Table I.Association between the SUV and
clinicopathological factors. |
Table I.
Association between the SUV and
clinicopathological factors.
| Characteristics | SUVmax <4.9, n
(n=44) | SUVmax ≥4.9, n
(n=42) | P-value |
|---|
| Sex |
|
|
|
| Male | 31 | 27 | 0.65 |
|
Female | 13 | 15 |
|
| Age, years |
|
|
|
| ≤70 | 17 | 21 | 0.40 |
|
>70 | 27 | 21 |
|
| Localisation |
|
|
|
|
Hilar | 14 | 15 | 0.88 |
|
Distal | 30 | 27 |
|
| Macroscopic type |
|
|
|
|
Nodular/papillary | 21 | 18 | 0.09 |
| Flat | 23 | 24 |
|
| Histology |
|
|
|
|
Papillary/well | 19 | 20 | 0.84 |
|
Moderately/poorly/others | 25 | 22 |
|
| Lymphatic
invasion |
|
|
|
|
Absent | 22 | 17 | 0.50 |
|
Present | 22 | 25 |
|
| Vessel invasion |
|
|
|
|
Absent | 24 | 21 | 0.84 |
|
Present | 20 | 21 |
|
| Perineural
invasion |
|
|
|
|
Absent | 15 | 14 | >0.99 |
|
Present | 29 | 28 |
|
| pT status |
|
|
|
|
T1/T2 | 32 | 29 | 0.89 |
|
T3/T4 | 12 | 13 |
|
| pN status |
|
|
|
| N0 | 32 | 22 | 0.08 |
|
N1/N2 | 12 | 20 |
|
| pStage |
|
|
|
|
I/II | 34 | 31 | 0.90 |
|
III/IV | 10 | 11 |
|
| Portal vein
invasion |
|
|
|
|
Non-invasion | 42 | 39 | 0.96 |
|
Invasion | 2 | 3 |
|
| Resection
margin |
|
|
|
|
Negative | 42 | 37 | 0.39 |
|
Positive | 2 | 5 |
|
| Preoperative
biliary drainage |
|
|
|
|
Yes | 29 | 33 | 0.29 |
| No | 15 | 9 |
|
| Preoperative
serum |
|
|
|
| HbA1c, % |
|
|
|
|
≤6.4 | 34 | 37 | 0.30 |
|
>6.4 | 10 | 5 |
|
| Cholangitis |
|
|
|
|
Absent | 40 | 35 | 0.35 |
|
Present | 4 | 7 |
|
Pathological factors and SUVmax
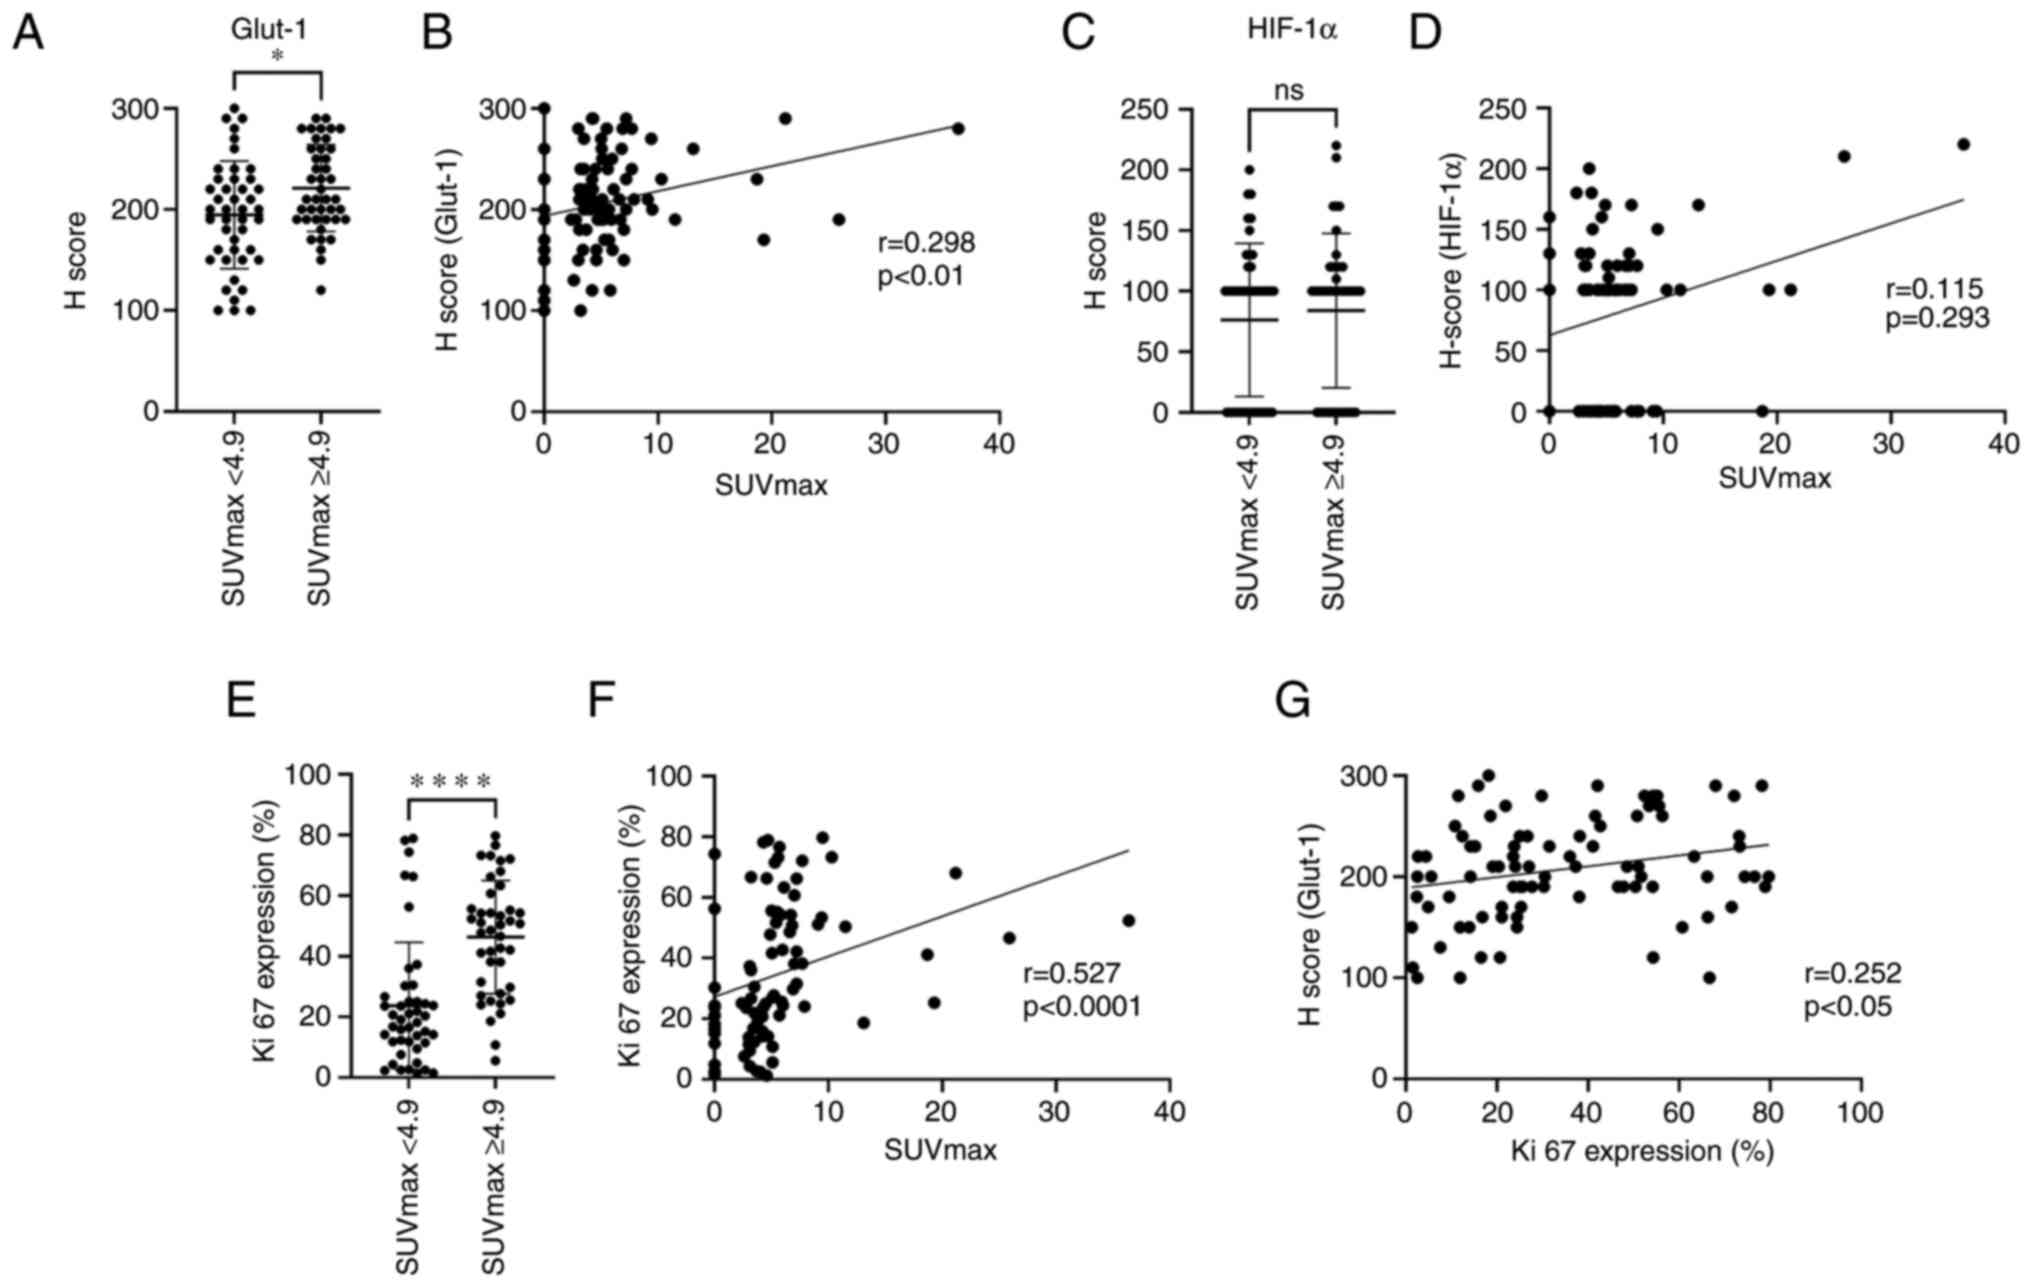
The staining properties of Glut1 and HIF-1α in tumor
cells between the SUV-low and SUV-high groups were compared using
the H score, respectively. The Glut1 expression was higher in the
SUV-high group than in the SUV-low group (P<0.05), and SUVmax
and Glut1 (H score) showed a significant correlation (r=0.298,
P<0.01). No correlation was obtained between the SUV-low and
SUV-high groups for HIF-1α (H score). Additionally, no predominant
correlation was found between the SUVmax and the HIF-1α (H score).
The Ki-67 expression showed a significant difference between the
SUV-low and SUV-high groups (P<0.0001). Similarly, a significant
correlation was found between the SUVmax and the Ki-67 expression
(r=0.527, P<0.0001). The comparison between Ki-67 expression and
Glut1 (H scores) showed a significant correlation (r=0.252,
P<0.05; Figs. 2 and 3).
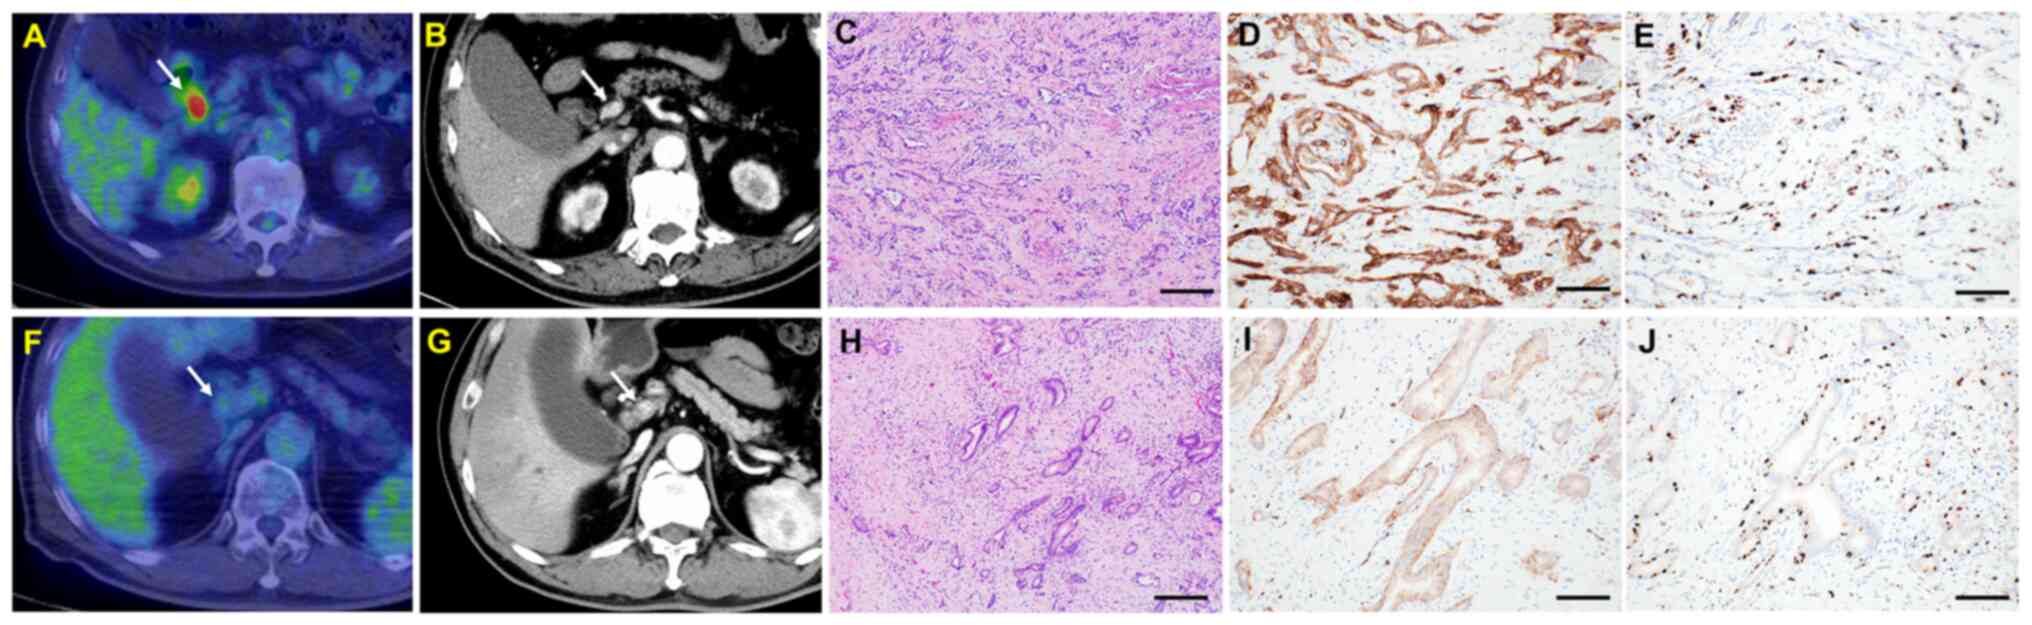 | Figure 2.Representative bile duct cancer cases
in the (A-E) SUV-high (≥4.9) and (F-J) SUV-low (<4.9) groups.
(A) FDG/PET-CT image of distal cholangiocarcinoma (SUVmax <4.9).
High absorption of SUVmax (13.1) was observed in the distal bile
duct. (B) Contrast-enhanced CT image. Arrows indicate the bile duct
cancer lesion. The distal bile duct exhibited wall thickening with
increased contrast density. (C) H&E image. Moderate to poorly
differentiated tumor cells were proliferating (Scale bar, 200 µm).
(D) Glut1 immunohistochemistry. Strong expression of Glut1 of tumor
cells (score 3) was observed (Scale bar, 100 µm). (E) Ki-67
immunohistochemistry. The Ki-67 expression rate was 40% (Scale bar,
100 µm). (F) PET-CT image of distal cholangiocarcinoma (SUVmax
<4.9). In this tumor lesion, the SUVmax was low (2.8). (G)
Contrast-enhanced CT image. Arrows indicate the bile duct cancer
lesion. (H) H&E image. Well-to-moderately differentiated tumor
cells were proliferating (Scale bar, 200 µm). (I) Glut-1
immunohistochemistry. Weak expression of Glut1 of tumor cells
(score 1) is shown (Scale bar, 100 µm). (J) Ki-67 image. The Ki-67
expression rate was 10% (Scale bar, 100 µm). Glut1, glucose
transporter 1; PET-CT, positron emission tomography-computed
tomography; SUV, standardized uptake value; SUVmax, maximum
standardized uptake value. |
Clinicopathological features and OS
and DFS
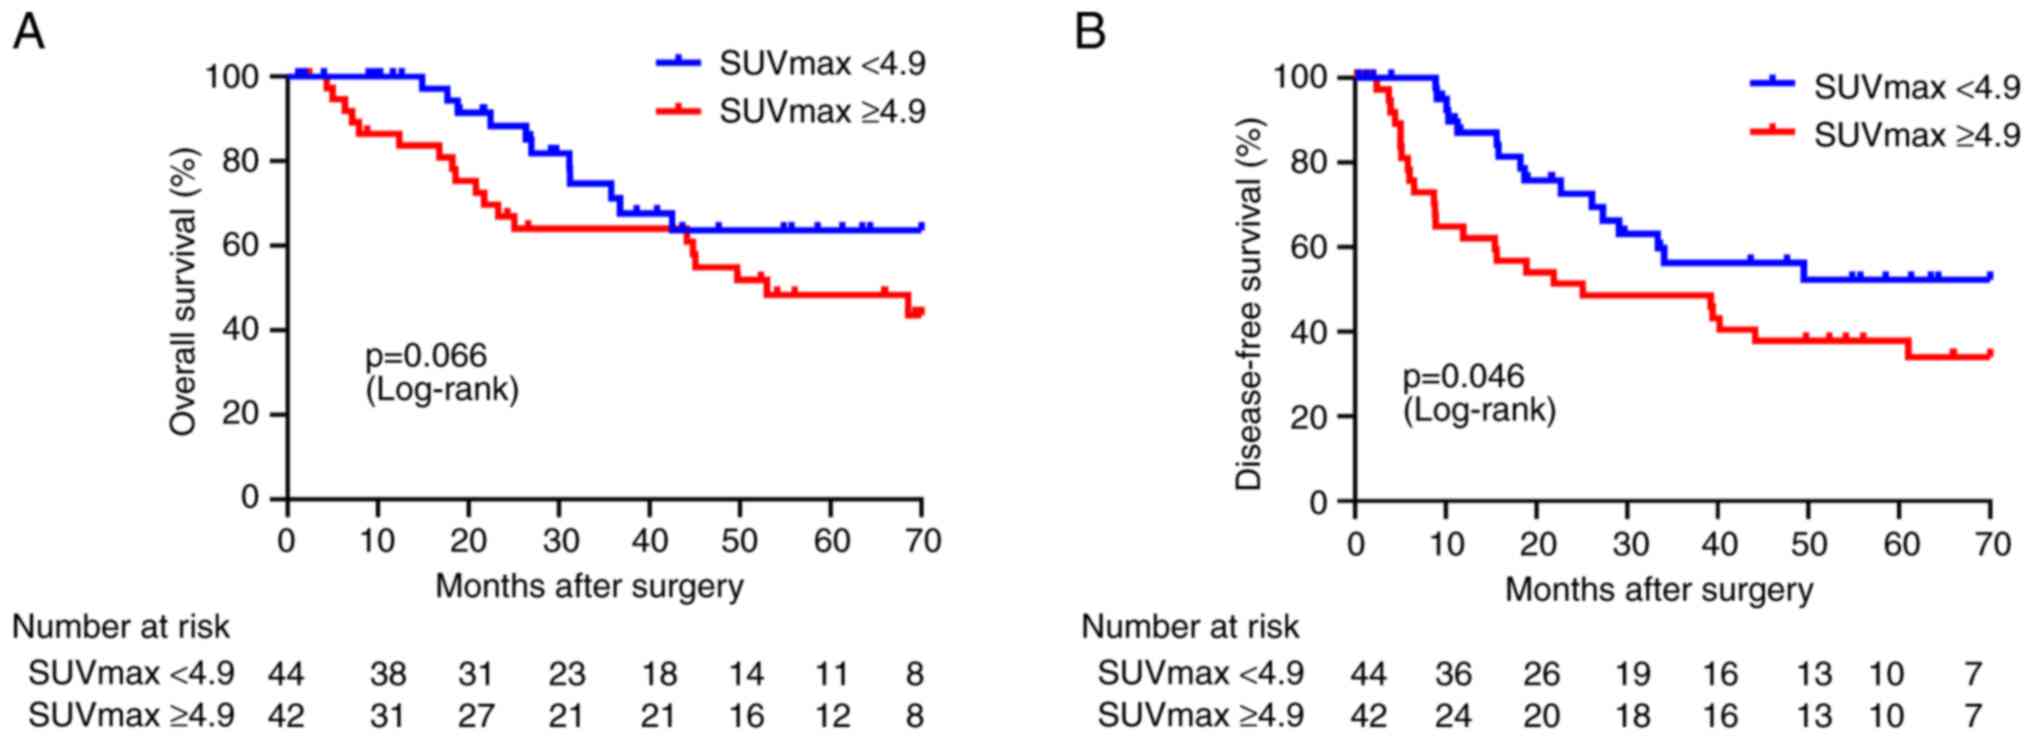
The Kaplan-Meier curves of OS and DFS for patients
(SUV-low and SUV-high) are shown in Fig. 4. No significant difference was found
between the SUVmax and OS, but the risk of recurrence was
significantly higher in the SUVmax (≥4.9) group for DFS. The DFS
data were analyzed for a total of 86 patients (SUV-low in 44 cases,
SUV-high in 42 cases), and the results were summarized in Table II. Univariate analysis for DFS
revealed tumor location (P=0.013), N status (P<0.001) stage
(P<0.01), and SUVmax (P=0.046) and multiple analysis revealed
tumor location (P=0.028) and N status (P<0.01) as
clinicopathological factors. In multivariate analysis, the SUVmax
was not an independent recurrence factor.
| Table II.Univariate and multivariate analyses
of the DFS. |
Table II.
Univariate and multivariate analyses
of the DFS.
|
|
| Univariate
analysis | Multivariate
analysis |
|---|
|
|
|
|
|
|---|
|
Characteristics | No. | Median DFS,
months | P-value | Hazard ratio (95%
CI) | P-value |
|---|
| Age, years |
|
|
|
|
|
|
≤70 | 38 | 39.2 | 0.84 |
|
|
|
>70 | 48 | 40.2 |
|
|
|
| Localisation |
|
|
|
|
|
|
Hilar | 29 | 18.9 | 0.01 | 2.27
(1.09-4.71) | 0.03 |
|
Distal | 57 | N/A |
|
|
|
| Macroscopic
type |
|
|
|
|
|
|
Nodular/papillary | 49 | 33.4 | 0.09 |
|
|
|
Flat | 37 | N/A |
|
|
|
| Histology |
|
|
|
|
|
|
Papillary/well | 39 | N/A | 0.21 |
|
|
|
Moderately/poorly/others | 47 | 34.1 |
|
|
|
| Lymphatic
invasion |
|
|
|
|
|
|
Absent | 39 | N/A | 0.09 |
|
|
|
Present | 47 | 34.1 |
|
|
|
| Vessel
invasion |
|
|
|
|
|
|
Absent | 45 | 49.5 | 0.14 |
|
|
|
Present | 41 | 27.3 |
|
|
|
| Perineural
invasion |
|
|
|
|
|
|
Absent | 29 | N/A | 0.08 |
|
|
|
Present | 57 | 29.1 |
|
|
|
| pT status |
|
|
|
|
|
|
T1/T2 | 61 | 39.4 | 0.58 |
|
|
|
T3/T4 | 25 | 40.2 |
|
|
|
| pN status |
|
|
|
|
|
| N0 | 54 | N/A | <0.001 | 3.21
(1.36-7.60) | <0.01 |
|
N1/N2 | 32 | 18.2 |
|
|
|
| pStage |
|
|
|
|
|
|
I/II | 65 | N/A | <0.01 | 0.79
(0.29-2.14) | 0.65 |
|
III/IV | 21 | 18.2 |
|
|
|
| Portal vein
invasion |
|
|
|
|
|
| Non
invasion | 81 | 39.4 | 0.22 |
|
|
|
Invasion | 5 | N/A |
|
|
|
| Resection
margin |
|
|
|
|
|
|
Negative | 79 | 40.2 | 0.36 |
|
|
|
Positive | 7 | 18.9 |
|
|
|
| Adjuvant
chemotherapy |
|
|
|
|
|
| No | 34 | 33.4 | 0.62 |
|
|
|
Yes | 52 | 44.1 |
|
|
|
| SUVmax |
|
|
|
|
|
|
<4.9 | 44 | N/A | <0.05 | 1.77
(0.93-3.35) | 0.08 |
|
≥4.9 | 42 | 25.1 |
|
|
|
Cases of recurrence and
characteristics of recurrence location
In the SUV-high and -low groups, there were 24 and
16 recurrence cases, respectively. The 24 SUV-high group recurrence
cases included 11 (45.8%) local and 13 (54.2%) distant recurrence
cases, whereas the 16 SUV-low group included 9 (56.3%) local and 7
(43.7%) distant recurrence cases, and there was no significant
difference in recurrence between the SUV-high and -low groups
(Table III).
| Table III.Cases of recurrence and
characteristics of recurrence locations. |
Table III.
Cases of recurrence and
characteristics of recurrence locations.
|
|
| Recurrence
site |
|---|
|
|
|
|
|---|
| SUVmax | Cases | Local, n (%) | Distant, n (%) |
|---|
| ≥4.9 | 24 | 11 (45.8) | 13 (54.2) |
| <4.9 | 16 | 9 (56.3) | 7 (43.7) |
Pathological characteristics of
recurrence and non-recurrence cases in the SUVmax low and SUVmax
high groups
The comparison of the clinicopathological factors
(localization, histology, lymphatic invasion, vessel invasion,
perineural invasion, T status, N status, stage, portal vein
invasion, and resection status) between the recurrence and
non-recurrence subgroups in the SUVmax low and
SUVmax high groups showed no significant differences in
any of the factors (Tables SI and
SII).
Discussion
Our study results revealed two points. First, the
SUV-high group had a higher postoperative recurrence rate than the
SUV-low group. Second, the SUV-high group showed higher Glut1 and
Ki-67expression rates. Furthermore, increased SUVmax, Glut1, and
Ki-67 expression rates were positively correlated, and the Ki-67
expression rate was positively correlated with Glut1 expression.
The relationship between SUVmax and prognosis and recurrence
prediction of cholangiocarcinoma was previously clarified using
FDG-PET/CT. The prognosis and recurrence rate was reported to
worsen in the SUV-high group (8,9). Our
study found no significant difference in prognosis but a
significantly higher recurrence rate in the SUV-high group. The
results may differ because the previous reports include surgically
unresectable cases (8), gallbladder
cancer, and intrahepatic cholangiocarcinoma, which are different
from our study in terms of the target cases (9). Furthermore, the median SUVmax of
cholangiocarcinoma is reported to vary depending on the primary
tumor, wherein intrahepatic cholangiocarcinoma has the highest
SUVmax, followed by gallbladder carcinoma and extrahepatic
cholangiocarcinoma (3). Our study
only focused on patients with resected extrahepatic
cholangiocarcinoma. Hence, the results may have differed due to
control case differences. Therefore, our study, which focused on
surgically resected extrahepatic cholangiocarcinoma cases, was
judged useful in extracting a high recurrence group.
Furthermore, the SUV-high group correlated with the
histological malignancy of the tumor using immunostaining in
resection specimens. First, tumor cells in the SUV-high group
predominantly expressed high Glut1 levels. The FDG, which is used
in FDG-PET/CT, is taken up into cells through glucose transporters
(16). Previous studies have
revealed that increased Glut1expression in cholangiocarcinoma
correlates with decreased tumor differentiation, increased
lymphatic invasion, and increased perineural invasion and is a poor
prognostic factor, which indicates a correlation between Glut1
expression and cholangiocarcinoma malignancy (17,18).
Paudyal et al (13) studied
FDG uptake and Glut1 expression in cholangiocarcinoma, reported a
positive correlation between FDG uptake and Glut expression, and
noted that increased FDG uptake correlated with decreased tumor
differentiation. Our study found no significant difference between
the SUVmax and tumor differentiation; however, Ki-67 expression,
which is a marker of cell proliferative potential, was evaluated as
tumor malignancy and was significantly increased in the SUV-high
group. Particularly, the results are similar to previous reports in
correlation with tumor grade. Cancer cells require more glucose
than normal cells, and high-grade tumor cells with high
proliferative potential have a rapid cell cycle and increased cell
proliferation. This study points to the possibility of assessing
the trend of cell proliferation by evaluating the SUVmax values.
Then, we examined the hypoxia marker HIF-1α and revealed no
correlation between FDG uptake and HIF-1α in cancer cells. The
HIF-1α is a transcription factor that is expressed under hypoxic
conditions and is not degraded and stabilized when cells are
exposed to hypoxia, resulting in rapid HIF-1α accumulation. Thus,
HIF-1α has been reported to induce various growth factor
transcription, such as vascular endothelial growth factor and Glut1
(19–21). Particularly, a positive correlation
was assumed between increased expression of SUVmax and Glut1 and
HIF-1α, but the study results revealed no significant effects. The
relationship between HIF-1α and FDG-PET/CT parameters is
controversial. Kaymak et al (22) revealed no significant association
between HIF-1α and SUVmax in colorectal carcinoma probably because
of the heterogeneity of the oxygen situation within the tumor. The
tumor invasion area is assumed to be more hypoxic than the bile
duct surface. The HIF-1α expression evaluation throughout cancer
may have been affected, which is an issue for future study.
This study had two limitations. First, this study
was retrospectively performed not as a randomized controlled study
and included a relatively small number of patients who underwent
FDG-PET/CT. Furthermore, only patients who had undergone FDG-PET/CT
at our hospital were included in the study, but the criteria for
inclusion at our hospital were not clear. Additionally, hilar and
distal cholangiocarcinoma were analyzed together. However, the
hilar and distal cholangiocarcinoma have different tumor
characteristics, which possibly affected the OS. Therefore,
preoperative testing, including FDG-PET/CT, is currently being
performed at our hospital for patients with cholangiocarcinoma, and
we plan to accumulate and analyze more cases in the future. Second,
we only focused on cancer cells and performed immunostaining
evaluation for cancer malignancy. However, cancer malignancy
involves cancer cells and the cancer microenvironment, including
the stroma and immune cells. Therefore, a future comprehensive
study that includes the cancer microenvironment is expected.
In conclusion, preoperative measurement of SUVmax by
FDG/PET-CT is useful in predicting recurrence as well as cancer
malignancy.
Supplementary Material
Supporting Data
Acknowledgements
Not applicable.
Funding
Funding: No funding was received.
Availability of data and materials
The datasets used and/or analyzed during the current
study are available from the corresponding author on reasonable
request.
Authors' contributions
TYa, TYo, HS, SM, SG and NK designed the
experiments. TYa and TYo performed the experiments. TYa, TYo, KI,
HK and KH performed the data analysis. TYa and TYo wrote the main
manuscript text, and prepared the figures. HS evaluated the
radiological images. TYo, SG and HK contributed to histological
evaluation. SM, KI and KH provided clinical information including
adjuvant chemotherapy information. KI, HK and KH critically revised
the manuscript. TYo and HK confirm the authenticity of all the raw
data. All authors agree to be accountable for all aspects of the
research in ensuring that the accuracy or integrity of any part of
the work is appropriately investigated and resolved. All authors
read and approved the final manuscript.
Ethics approval and consent to
participate
The research protocol was approved by the ethics
committee of Hirosaki University (2022–038; Hirosaki, Japan). All
study procedures involving human participants were performed
following the ethical standards of the institutional and/or
national research committee and in accordance with the 1964
Helsinki Declaration and its later amendments or comparable ethical
standards. All patients provided written informed consent to
participate.
Patient consent for publication
Not applicable.
Competing interests
The authors declare that they have no competing
interests.
Glossary
Abbreviations
Abbreviations:
|
FDG-PET
|
18F-fluorodeoxyglucose positron
emission tomography
|
|
Glut1
|
glucose transporter 1
|
|
SUV
|
standardized uptake value
|
|
HIF-1α
|
hypoxia-inducible factor 1α
|
|
CT
|
computed tomography
|
|
OS
|
overall survival
|
|
DFS
|
disease-free survival
|
References
|
1
|
Nathan H, Pawlik TM, Wolfgang CL, Choti
MA, Cameron JL and Schulick RD: Trends in survival after surgery
for cholangiocarcinoma: A 30-year population-based SEER database
analysis. J Gastrointest Surg. 11:1488–1497. 2007. View Article : Google Scholar : PubMed/NCBI
|
|
2
|
WHO classification of tumours editorial
board. Digestive system tumours, . WHO Classification of Tumours.
1. 5th edition. International Agency for Research on Cancer; Lyon:
2019
|
|
3
|
Lee SW, Kim HJ, Park JH, Park DI, Cho YK,
Sohn CI, Jeon WK and Kim BI: Clinical usefulness of
18F-FDG PET-CT for patients with gallbladder cancer and
cholangiocarcinoma. J Gastroenterol. 45:560–466. 2010. View Article : Google Scholar : PubMed/NCBI
|
|
4
|
Lee Y, Yoo IR, Boo SH, Kim H, Park HL and
Hyun OJ: The role of F-18 FDG PET/CT in intrahepatic
cholangiocarcinoma. Nucl Med Mol Imaging. 51:69–78. 2017.
View Article : Google Scholar : PubMed/NCBI
|
|
5
|
Anderson CD, Rice MH, Pinson CW, Chapman
WC, Chari RS and Delbeke D: Fluorodeoxyglucose PET imaging in the
evaluation of gallbladder carcinoma and cholangiocarcinoma. J
Gastrointest Surg. 8:90–97. 2004. View Article : Google Scholar : PubMed/NCBI
|
|
6
|
Ruys AT, Bennink RJ, van Westreenen HL,
Engelbrecht MR, Busch OR, Gouma DJ and van Gulik TM: FDG-positron
emission tomography/computed tomography and standardized uptake
value in the primary diagnosis and staging of hilar
cholangiocarcinoma. HPB (Oxford). 13:256–262. 2011. View Article : Google Scholar : PubMed/NCBI
|
|
7
|
Kitamura K, Hatano E, Higashi T, Seo S,
Nakamoto Y, Narita M, Taura K, Yasuchika K, Nitta T, Yamanaka K, et
al: Prognostic value of (18)F-fluorodeoxyglucose positron emission
tomography in patients with extrahepatic bile duct cancer. J
Hepatobiliary Pancreat Sci. 18:39–46. 2011. View Article : Google Scholar : PubMed/NCBI
|
|
8
|
Ma KW, Cheung TT, She WH, Chok KSH, Chan
ACY, Dai WC, Chiu WH and Lo CM: Diagnostic and prognostic role of
18-FDG PET/CT in the management of resectable biliary tract cancer.
World J Surg. 42:823–834. 2018. View Article : Google Scholar : PubMed/NCBI
|
|
9
|
Cho KM, Oh DY, Kim TY, Lee KH, Han SW, Im
SA, Kim TY and Bang YJ: Metabolic characteristics of advanced
biliary tract cancer using 18F-fluorodeoxyglucose
positron emission tomography and their clinical implications.
Oncologist. 20:926–933. 2015. View Article : Google Scholar : PubMed/NCBI
|
|
10
|
Furukawa H, Ikuma H, Asakura K and Uesaka
K: Prognostic importance of standardized uptake value on F-18
fluorodeoxyglucose-positron emission tomography in biliary tract
carcinoma. J Surg Oncol. 100:494–499. 2009. View Article : Google Scholar : PubMed/NCBI
|
|
11
|
Lee JY, Kim HJ, Yim SH, Shin DS, Yu JH, Ju
DY, Park JH, Park DI, Cho YK, Sohn CI, et al: Primary tumor maximum
standardized uptake value measured on
18F-fluorodeoxyglucose positron emission
tomography-computed tomography is a prognostic value for survival
in bile duct and gallbladder cancer. Korean J Gastroenterol.
62:227–233. 2013. View Article : Google Scholar : PubMed/NCBI
|
|
12
|
Park MS and Lee SM: Preoperative
18F-FDG PET-CT maximum standardized uptake value
predicts recurrence of biliary tract cancer. Anticancer Res.
34:2551–2554. 2014.PubMed/NCBI
|
|
13
|
Paudyal B, Oriuchi N, Paudyal P, Higuchi
T, Nakajima T and Endo K: Expression of glucose transporters and
hexokinase II in cholangiocellular carcinoma compared using
[18F]-2-fluro-2-deoxy-D-glucose positron emission tomography.
Cancer Sci. 99:260–266. 2008. View Article : Google Scholar : PubMed/NCBI
|
|
14
|
Glazer ES, Liu P, Abdalla EK, Vauthey JN
and Curley SA: Neither neoadjuvant nor adjuvant therapy increases
survival after biliary tract cancer resection with wide negative
margins. J Gastrointest Surg. 16:1666–1671. 2012. View Article : Google Scholar : PubMed/NCBI
|
|
15
|
Brierley JD, Gospodarowicz MK and
Wittekind C: TNM Classification of Malignant Tumors. 8th edition.
Wiley-Liss; New York, NY: 2017
|
|
16
|
Gallagher BM, Fowler JS, Gutterson NI,
MacGregor RR, Wan CN and Wolf AP: Metabolic trapping as a principle
of oradiopharmaceutical design: Some factors resposible for the
biodistribution of [18F] 2-deoxy-2-fluoro-D-glucose. J Nucl Med.
19:1154–1161. 1978.PubMed/NCBI
|
|
17
|
Ikeno Y, Seo S, Iwaisako K, Yoh T,
Nakamoto Y, Fuji H, Taura K, Okajima H, Kaido T, Sakaguchi S and
Uemoto S: Preoperative metabolic tumor volume of intrahepatic
cholangiocarcinoma measured by 18F-FDG-PET is associated
with the KRAS mutation status and prognosis. J Transl Med.
16:952018. View Article : Google Scholar : PubMed/NCBI
|
|
18
|
Kubo Y, Aishima S, Tanaka Y, Shindo K,
Mizuuchi Y, Abe K, Shirabe K, Maehara Y, Honda H and Oda Y:
Different expression of glucose transporters in the progression of
intrahepatic cholangiocarcinoma. Hum Pathol. 45:1610–1617. 2014.
View Article : Google Scholar : PubMed/NCBI
|
|
19
|
Semenza GL: Regulation of physiological
responses to continuous and intermittent hypoxia by
hypoxia-inducible factor 1. Exp Physiol. 91:803–806. 2006.
View Article : Google Scholar : PubMed/NCBI
|
|
20
|
Semenza GL: Regulation of tissue perfusion
in mammals by hypoxia-inducible factor 1. Exp Physiol. 92:988–991.
2007. View Article : Google Scholar : PubMed/NCBI
|
|
21
|
Ikeda E: Cellular response to tissue
hypoxia and its involvement in disease progression. Pathol Int.
55:603–610. 2005. View Article : Google Scholar : PubMed/NCBI
|
|
22
|
Kaymak ZA, Karahan N, Erdoğan M, Erdemoğlu
E, Zihni İ and Şengül SS: Correlation of 18F-FDG/PET
SUVmax, SUVmean, MTV, and TLG with HIF-1α in
patients with colorectal cancer. Mol Imaging Radionucl Ther.
30:93–100. 2021. View Article : Google Scholar : PubMed/NCBI
|