Introduction
Oral leukoplakia (OL) is a common oral mucosal
disease characterized by white plaques or patches (1). As reported by the World Health
Organization (WHO), OL is a manifestation of precancerous lesions;
in other words, leukoplakia is likely to progress into cancer
(2). According to the statistics
reported in previous studies, the cancerous rate of leukoplakia is
3–5% (3). Oral squamous cell
carcinoma (OSCC) is a frequently diagnosed head and neck cancer,
accounting for >90% of oral and maxillofacial cancer cases
(4). OSCC demonstrates a high
incidence, strong invasiveness and a poor prognosis (5). Currently, the treatment of OSCC is
mainly performed using surgical resection, supplemented by
radiotherapy and chemotherapy (6).
Therefore, it is important to prevent, treat and predict the
prognosis of OSCC at the early stage and more studies have focused
on the early prognosis of OSCC.
Previous studies have reported that biomarkers, such
as keratin 8 whose high levels independently predict a poor
prognosis for patients with lung adenocarcinoma, serve critical
roles in the prognosis of numerous cancer types, (7). The autophagy-related gene,
P4HB, has been reported as a novel prognostic biomarker for
renal clear cell carcinoma (8).
Rivera et al (9) reported
that radiotherapy was normally used in OSCC treatment but that it
was mostly applied without stratification by molecular diagnostics,
and that it was urgent to provide clinically useful biomarkers for
oral cancer. Biomarkers are expected to become the key to OSCC
prognosis prediction in the future (10) and could also be used to guide the
selection of appropriate treatment options. Notably, 35% of Asian
patients with oral cancer present with H-ras mutations and
patients who have the habit of chewing tobacco exhibit a
significantly higher frequency of H-ras mutations (11). As reported by Sathyan et al
(12), H-ras mutation
reduced the expression of cyclin D1 and cyclin-dependent kinase 4,
and upregulated that of RB transcriptional corepressor 1 and
cyclin-dependent kinase inhibitor 2A, which might be used as
favorable prognostic criterion. Moreover, the upregulation of human
telomerase reverse transcriptase (hTRT) protein is an early event
in oral cancer (13). Quantitative
detection of hTRT expression in the cytoplasm and nucleus is
of use in the assessment of the progression, recurrence and
prognosis of OSCC (14). Patients
with oral cancer with high expression of epidermal growth factor
receptor (EGFR) are often more sensitive to gene therapy;
therefore, antibodies targeting EGFR may be an effective
tool to treat OSCC and precancerous lesions (15). Moreover, patients with higher
expression of tumor protein P53 (TP53) and lower expression
of Ki-67 are more likely to develop disease relapse after
initial treatment (16). Therefore,
these patients should be given more active combination therapy.
Currently, gene detection for OSCC is limited due to
its low sensitivity. Consequently, the combined detection of
multiple tumor markers is required to evaluate and predict tumor
prognosis. The present study performed transcriptome analysis in
different stages from OL to OSCC. Based on the protein-protein
interaction (PPI) network constructed, the top 10 hub
differentially expressed genes (DEGs) were screened and evaluated
using reverse transcription-quantitative PCR (RT-qPCR).
Materials and methods
Data sources
The GSE85195 dataset (17) was downloaded from the NCBI Gene
Expression Omnibus (GEO) database (https://www.ncbi.nlm.nih.gov/). The dataset included
15 OL, 24 early (stage 1–2) OSCC and 10 late (stage 3–4) OSCC
samples; these samples were later divided into OL, early and late
groups, respectively. The dataset was generated using the
Agilent-014850 Whole Human Genome Microarray 4×44K G4112F platform
(Agilent Technologies, Inc.).
Screening of DEGs between two
groups
Samples from the three groups were compared in
pairs. DEGs between two groups were screened using the R (version,
3.4.1) limma package (http://bioconductor.org/packages/release/bioc/html/limma.html)
(version, 3.32.5) (18) for
Bioconductor using thresholds of false discovery rate (FDR)<0.05
and log2 fold-change (FC)>1. The R (version, 3.4.1)
pheatmap package (version, 1.0.8) (https://cran.rproject.org/web/packages/pheatmap/index.html)
was used to generate two-way hierarchical clustering of the
screened DEGs (19). The DEG sets
among the three groups were then compared (early OSCC vs. OL, late
OSCC vs. OL and late OSCC vs. early OSCC) and the overlapping DEG
set was selected and retained as the object set for subsequent
experiments.
Short Time-series Expression Miner
(STEM) and enrichment analysis
DEGs that demonstrated similar expression patterns
during the OL-early-late OSCC development process were clustered
using STEM (version, 1.3.11; http://www.cs.cmu.edu/~jernst/stem/), using a
similarity threshold of 0.8 and a significance threshold of
FDR<0.05 (20). The Database for
Annotation, Visualization and Integrated Discovery (DAVID) online
analysis tool (version, 6.8; http://david.ncifcrf.gov/) was used to perform Gene
Ontology (GO; http://geneontology.org/) functional annotation and
Kyoto Encyclopedia of Genes and Genomes (KEGG; http://www.kegg.jp/) pathway enrichment analysis on
the DEGs in each cluster (21).
Based on the GO and KEGG results, the Fisher's exact test of
hypergeometric distribution was used to calculate the significance
level of each function and pathway. The significance level was set
at P<0.05.
Construction of the PPI network and
analysis of topological structure
The Search Tool for the Retrieval of Interacting
Genes/Proteins (STRING; version: 10.0; http://string-db.org/) database was used to evaluate
the interaction relationships between DEGs in the clusters, and an
interaction network of these proteins was then constructed
(22). Cytoscape (version, 3.6.1;
http://www.cytoscape.org/) was used for
the visual display of the network. The DAVID 6.8 online analysis
tool (http://david.abcc.ncifcrf.gov/)
(23) was used for GO biological
process and KEGG pathway enrichment analyses of hub genes in the
network using the P<0.05 threshold.
The majority of biological networks obeyed the
properties of scale-free networks; typically, nodes with the most
connections in the network were identified as the hub nodes
(24). The topological structure of
the constructed interaction network was analyzed and the four
important network topological parameters [degree, betweenness
centrality (BC), closeness centrality (CC) and path length] were
calculated. The degree distribution represented the probability
distribution function P(k) of the degree of a node. The BC
algorithm reflected the degree of the pivotal position of a node in
the topological structure of the interaction network. The BC values
of hub nodes were calculated as follows:
CB(v)=∑t≠v≠u∈V
(σst(v)/σst). Where σst was the
number of the shortest paths from s to t and σst(v) was
the number of nodes (v) in the shortest path from s to t. The BC
value was 0–1 and a value closer to 1 indicated a higher degree for
the central hub. The CC algorithm assessed the connection between
hub nodes and other nodes in the interactive network topology. The
CC value of significantly related genes was calculated as follows:
CC=1/(∑t∈V/tdG(v,t), where V represented the
node set, t represented a node in the node set and
dG(v,t) indicated the sum of the path distances from
node t to the rest nodes. The CC value ranged from 0 to 1 and a
value closer to 1 indicated stronger node centrality. Furthermore,
the average path length described the degree of separation between
nodes in the network.
Patient samples
Between June 2019 and January 2020, patients with OL
and OSCC were enrolled from the Department of Stomatology in The
First Affiliated Hospital of Zhengzhou University (Zhengzhou,
China). All the enrolled samples were graded according to the WHO
standards (25), with pathological
diagnosis by two pathologists. There were 35 normal oral mucosal
samples (including those from 21 males and 14 females), 41 OL
samples (including those from 23 males and 18 females) and 37 OSCC
samples (including those from 22 males and 15 females; 13 early
OSCC and 24 late OSCC). The collected tissue samples were
immediately frozen in liquid nitrogen for subsequent total RNA
extraction. Differences in the age, sex ratio and underlying
diseases of patients among the three groups were not statistically
significant. All patients had not received radiotherapy,
chemotherapy or other intervention before biopsy and they provided
written informed consent for use of their tissues in this study.
The study protocol was approved by the Ethics Committee of The
First Affiliated Hospital of Zhengzhou University (approval number:
2018KJ06).
RT-qPCR for DEG verification in
clinical samples
The mRNA sequence of hub genes was searched using
Genebank (https://www.ncbi.nlm.nih.gov/genbank/), and RT-PCR
primers were designed using Primer 5 software (https://www.bioprocessonline.com/doc/primer-premier-5-design-program-0001).
Primer sequences (Table I) were
synthesized by Sangon Bioengineering (Shangahi) Co., Ltd. The
aforementioned patient tissue samples were weighed and total RNA
was extracted from 100 mg by RNA extraction kit (cat. no. 9767)
according to the manufacturer's protocol (Takara Bio, Inc.).
Afterwards, complementary DNA was synthesized from the extracted
RNA using a RevertAid RT Reverse Transcription kit (Thermo Fisher
Scientific, Inc.) according to the manufacturer's instructions and
used as the template for qPCR amplification on the Rotor Gene 3000
(GE Healthcare). For qPCR, SYBR Premix Ex Taq II (cat. no. RR420A;
Takara Bio, Inc.) was used. The PCR conditions were as follows:
95°C for 30 sec, followed by 40 cycles of 95°C for 5 sec and 60°C
for 45 sec. β-actin was used as the internal reference. The
expression levels of DEGs were calculated using the
2−ΔΔCq method (26) and
compared with that of β-actin.
 | Table I.Sequences of primers used for reverse
transcription-quantitative PCR. |
Table I.
Sequences of primers used for reverse
transcription-quantitative PCR.
| Gene | Sequence
(5′-3′) |
|---|
| FN1 | F:
CCAGCAGAGGCATAAGGT |
|
| R:
GTAGGGGTCAAAGCACGA |
| APP | F:
GATTCCCTACCGCTGCTT |
|
| R:
CACTGCATGTCTCTTTGGC |
| STAT1 | F:
TGCTCCCTCTCTGGAATG |
|
| R:
CTCCTTGCTGATGAAGCC |
| SDC4 | F:
GAAGGGGATGGTGGGAT |
|
| R:
CAGGAACAGGGCAAGAGA |
| COL2A1 | F:
TCCCACCCTCTCACAGTTC |
|
| R:
TGCCCAGTTCAGGTCTCTT |
| COL10A1 | F:
GGATCAGGCTTCAGGGAGTG |
|
| R:
GGCCATTTGACTCGGCATTG |
| COL4A6 | F:
GGATTGCCAGCATTATCAGGT |
|
| R:
GTCTCAAATTCTGGACTAGGTGG |
| β-actin | F:
CAAAGACCTGTACGCCAACAC |
|
| R:
CATACTCCTGCTTGCTGATCC |
Statistical analysis
SPSS software (version 16.0; SPSS, Inc.) was used
for the statistical analysis. One-way ANOVA followed by Tukey's
post hoc test was used to compare multiple groups. A difference of
P<0.05 was considered to indicate a statistically significant
difference. The receiver operating characteristic (ROC) curve was
plotted to assess the prognostic value of hub genes and the area
under the curve (AUC), specificity and sensitivity were
calculated.
Results
Data preprocessing and DEG
screening
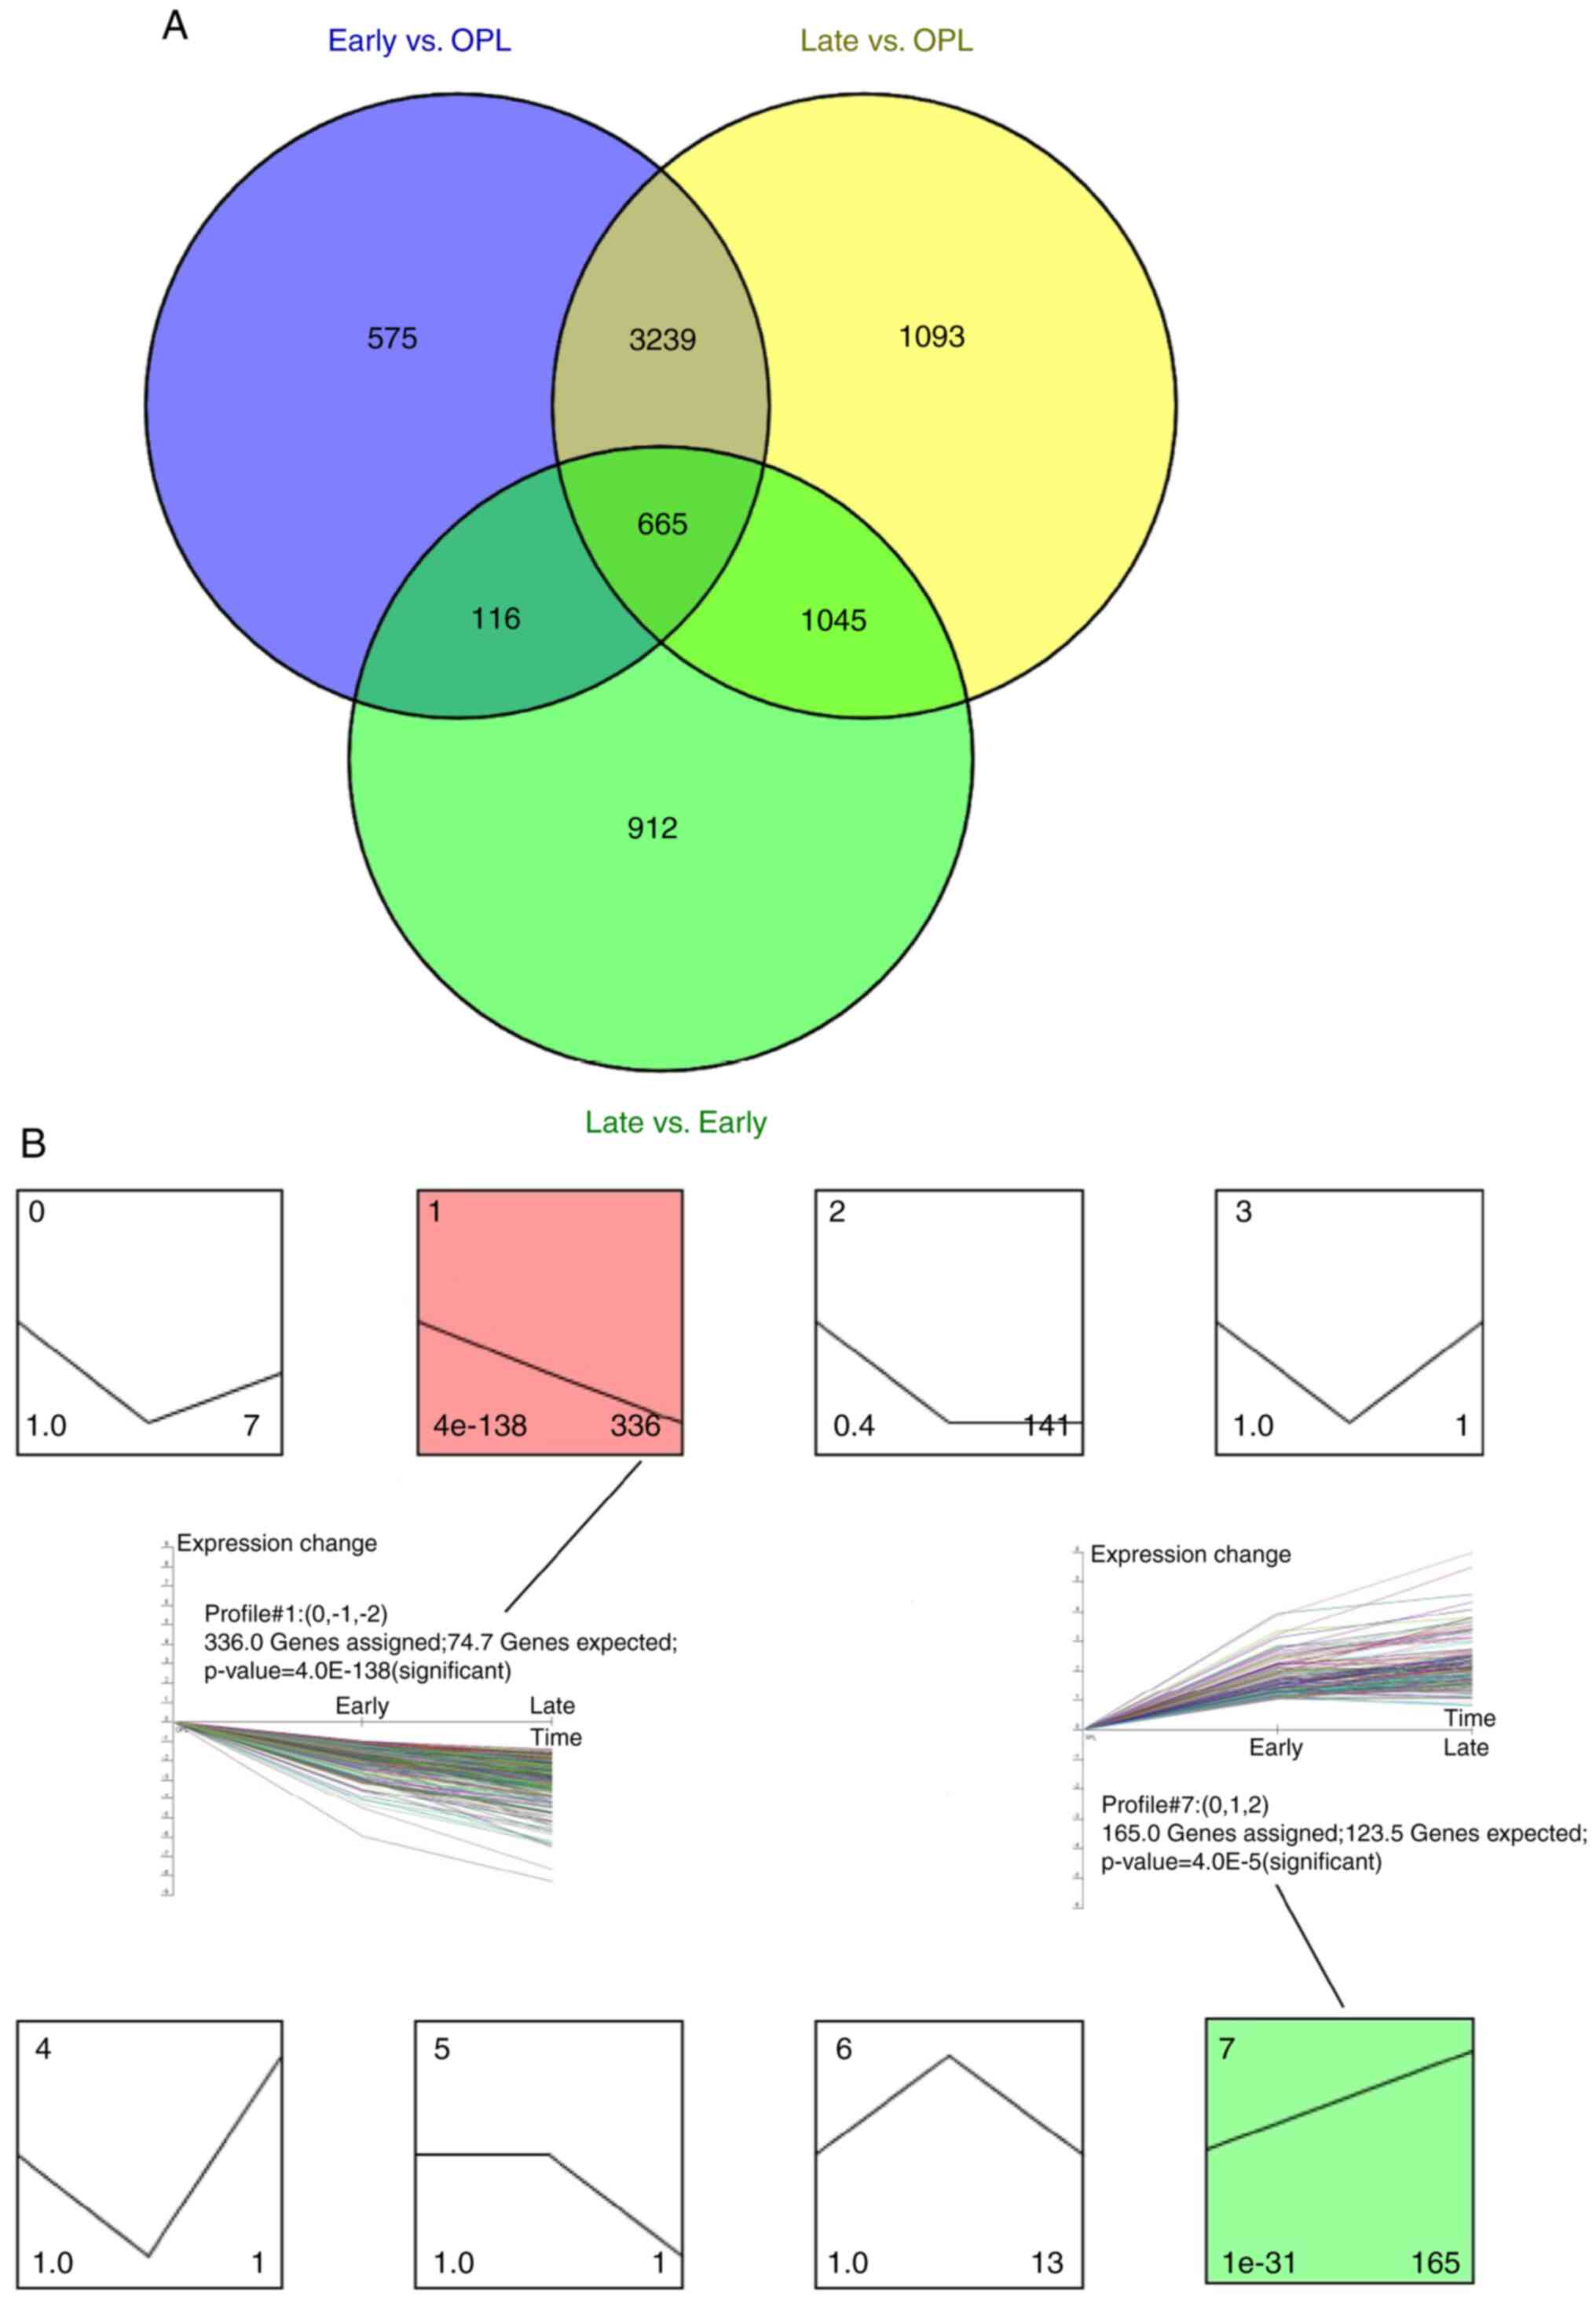
The GSE85195 dataset contained 15 OL samples, 24
early OSCC samples and 10 late OSCC samples. Samples at the three
stages were compared in pairs and 4,595, 6,042 and 2,738 DEGs were
detected in early OSCC vs. OL, late OSCC vs. OL and late OSCC vs.
early OSCC groups, respectively. Samples were clustered based on
the expression levels of the identified DEGs. A total of 665
overlapping genes were identified after comparing the screened DEGs
(Fig. 1A). Trend clustering was
performed on the 665 overlapping DEGs using STEM software. These
results demonstrated two significant clusters (cluster 1 and
cluster 7; Fig. 1B). Cluster 1
included 336 DEGs with a decreasing expression trend, whereas
cluster 7 included 165 DEGs with an increasing expression
trend.
Functional annotation and KEGG pathway
enrichment analysis
Genes interact with each other to serve numerous
roles and participate in different signaling pathways and
functions. Consequently, it is critical to investigate related
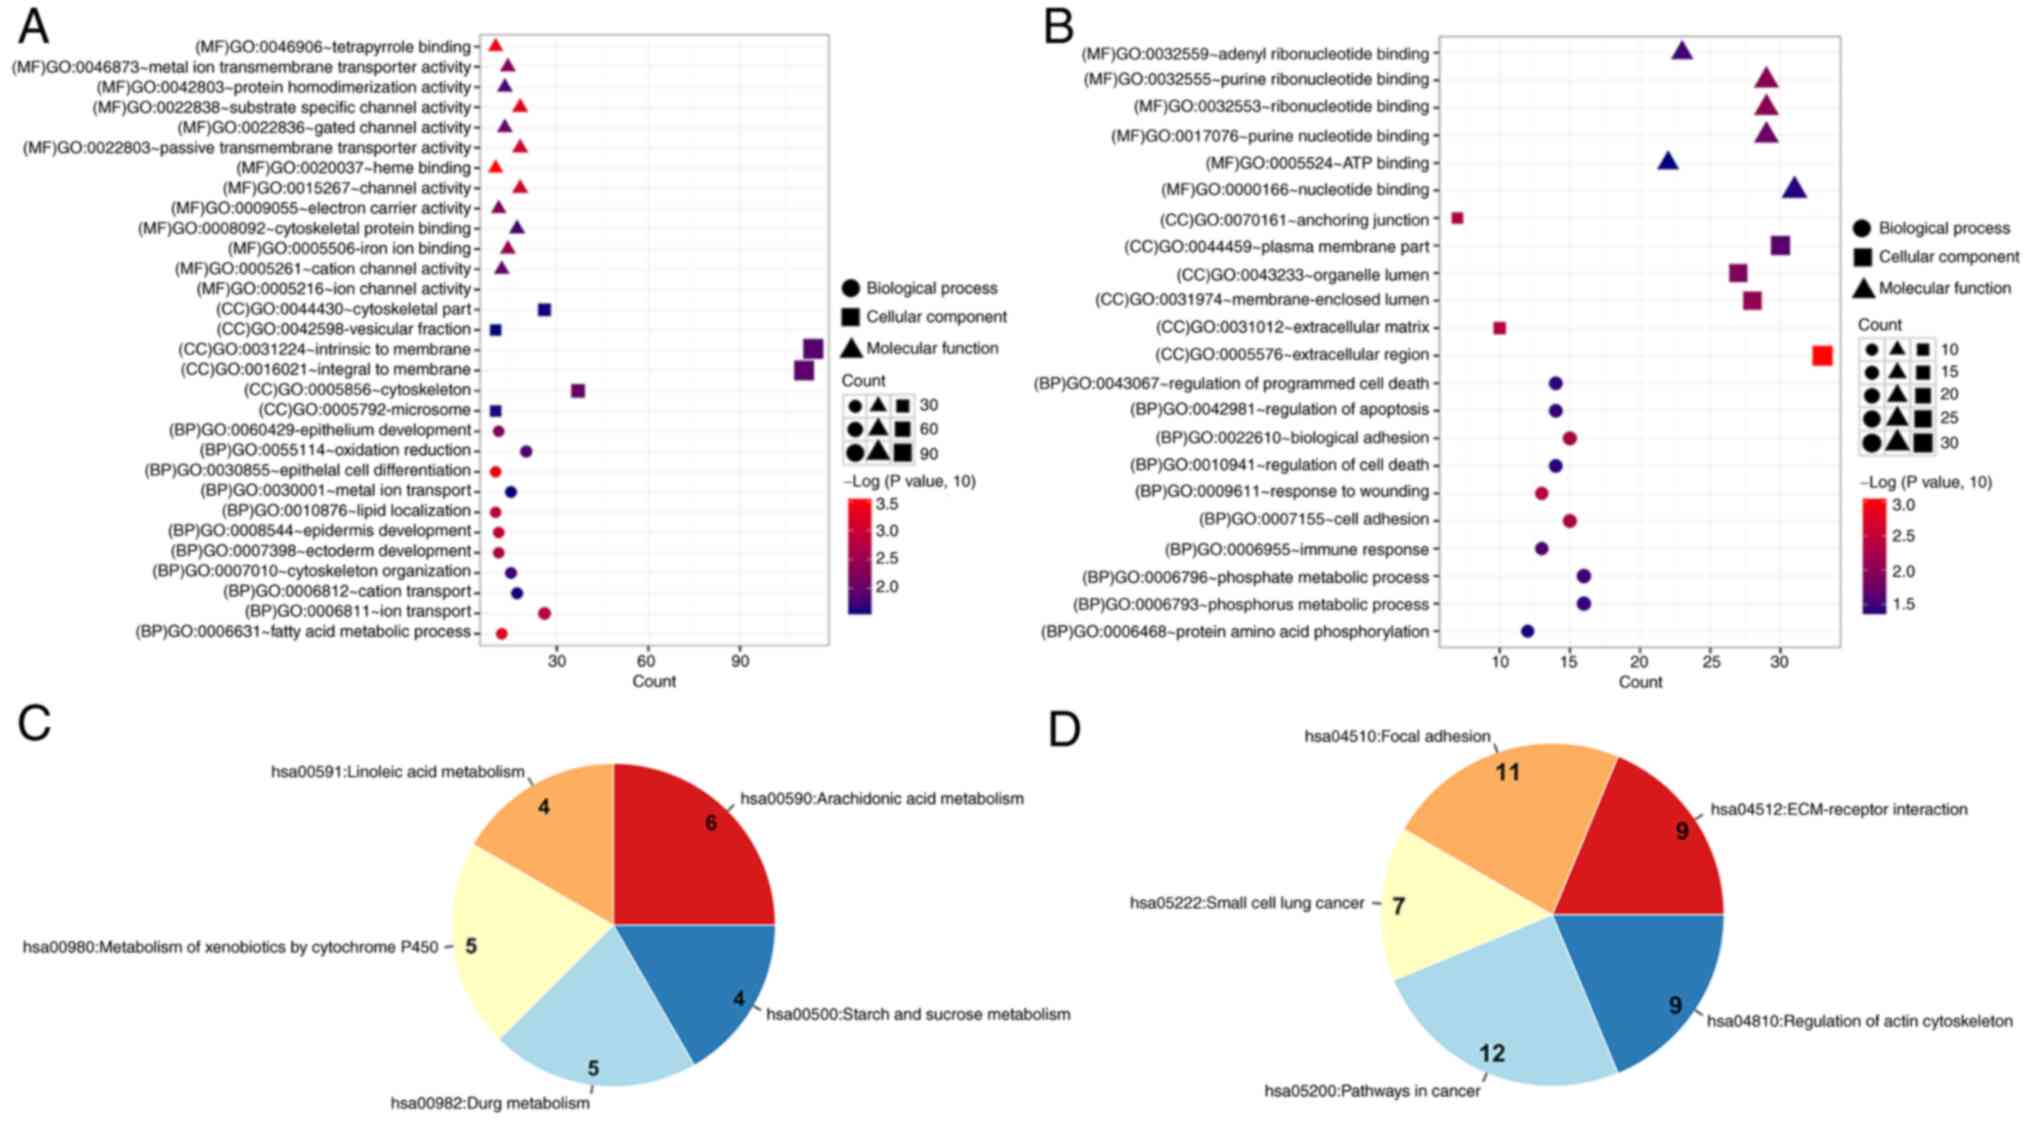
functions and pathways. Using the DAVID tools, GO function
annotation and KEGG pathway enrichment analyses of DEGs in clusters
1 and 7 were performed. DEGs in cluster 1 were mainly enriched in
30 GO functions and 5 pathways, including ‘epithelial cell
differentiation’ (n=10; P=5.07×10⁻⁴), ‘fatty acid
metabolic process’ (n=12; P=6.01×10⁻⁴), ‘epidermis
development’ (n=11; P=0.001), ‘arachidonic acid metabolism’ (n=6;
P=0.00017) and ‘linoleic acid metabolism’ (n=4; P=0.0093) (Fig. 2A and C). However, DEGs in cluster 7
were mainly enriched in 22 GO functions and 5 pathways, including
‘phosphorus metabolic process’ (n=16; P=0.036), ‘phosphate
metabolic process’ (n=16; P=0.036), ‘cell adhesion’ (n=15;
P=0.005), ‘pathways in cancer’ (n=12; P=0.0015) and ‘focal
adhesion’ (n=11; P=1.15×10⁻⁴) (Fig. 2B and D).
PPI network construction and
topological structural analysis
The roles of genes are intricate, with a number
working together through interaction. The influence of different
genes is different and the number of genes involved in a given
process may also be different. Through the PPI network, genes with
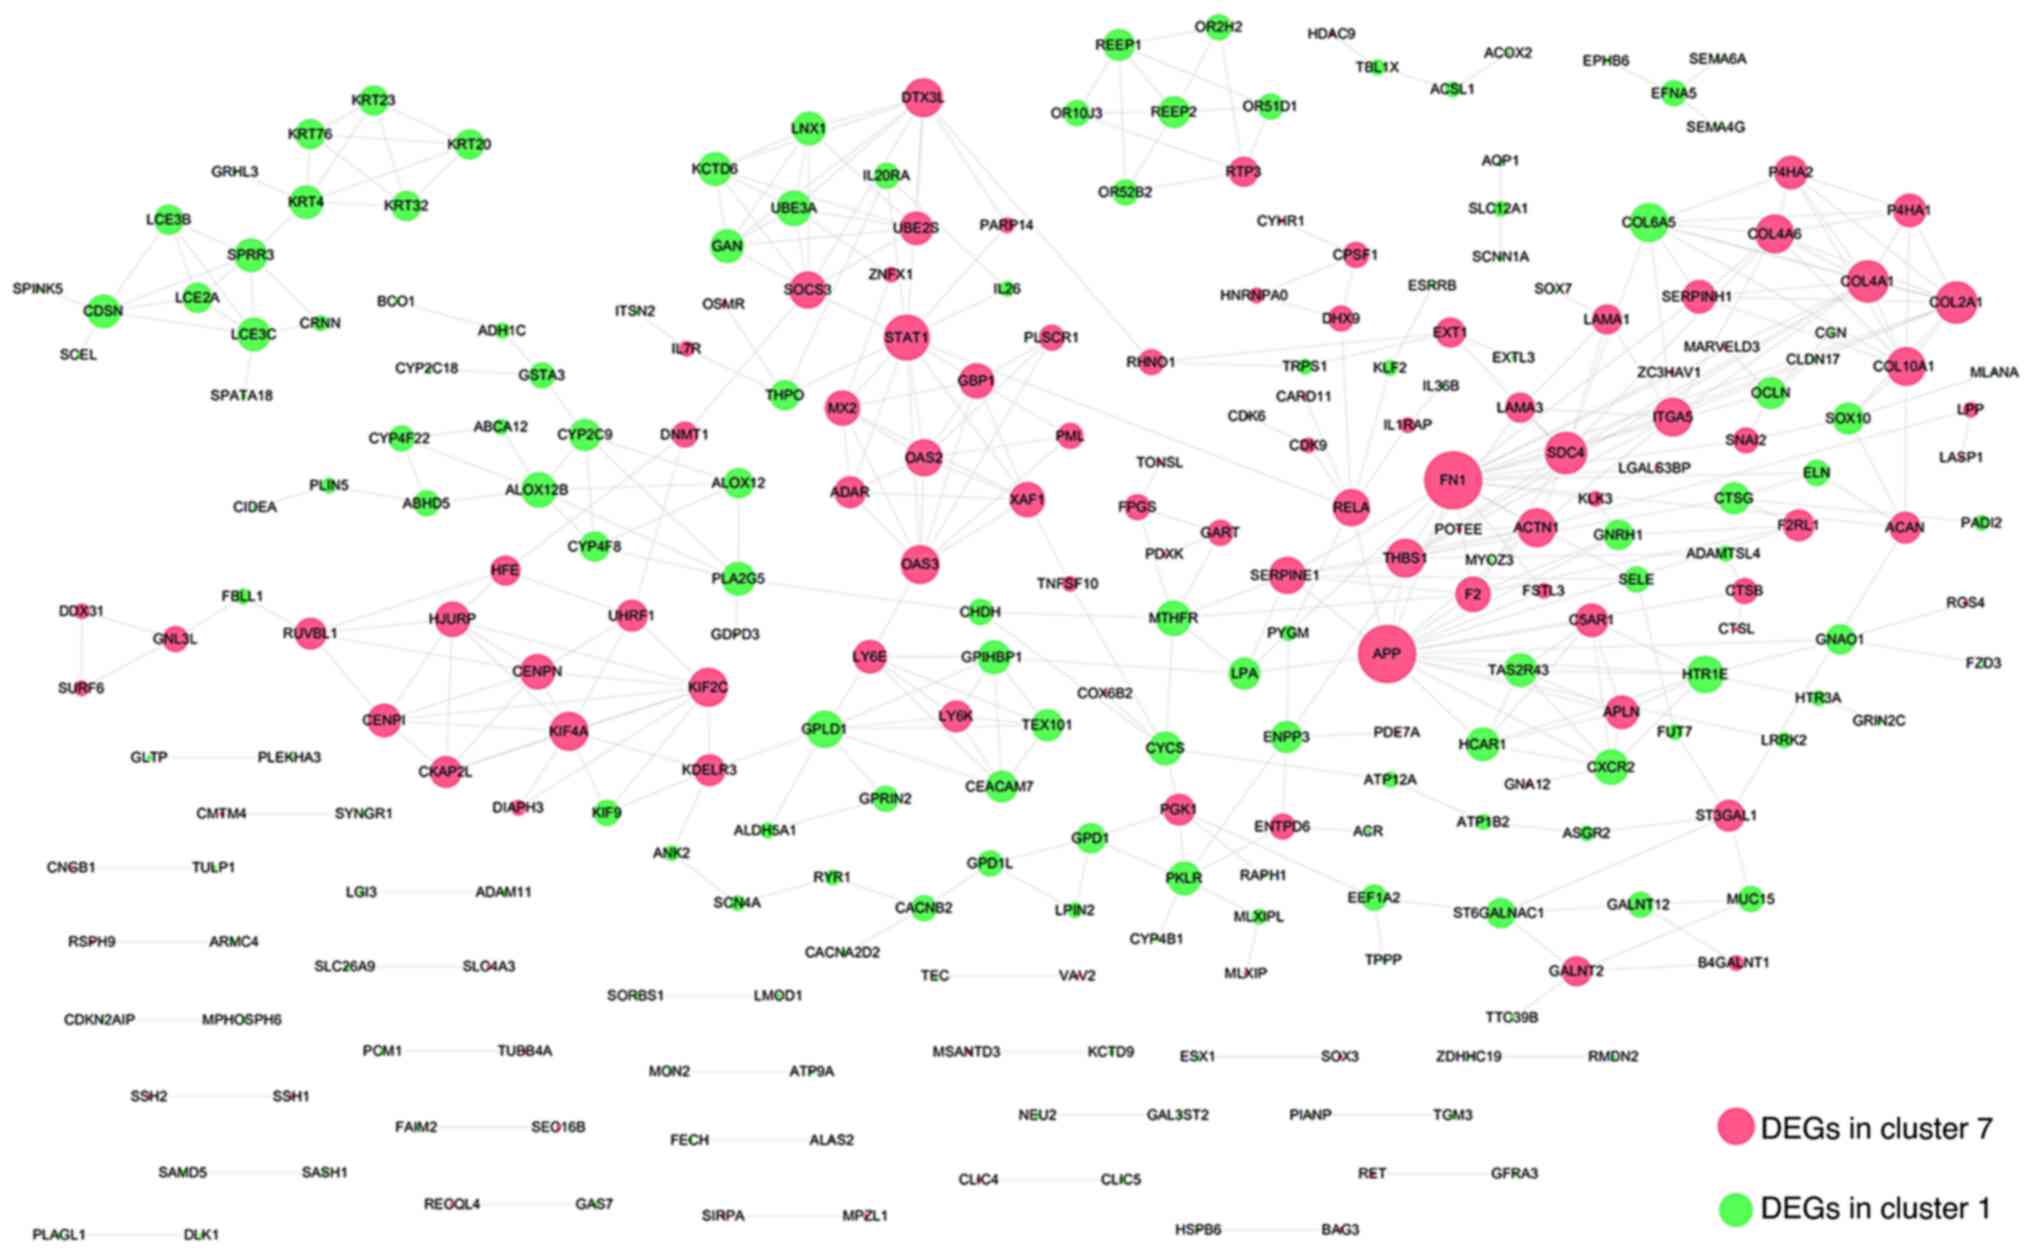
the highest degree of interaction were screened out. The
interaction relationships between DEGs in cluster 1 and cluster 7
were searched against the STRING database, using a threshold of an
interaction score >0.6, and a total of 440 interaction pairs
were identified. All the relationships in the constructed
interaction network (Fig. 3) are
presented in Table SI. GO
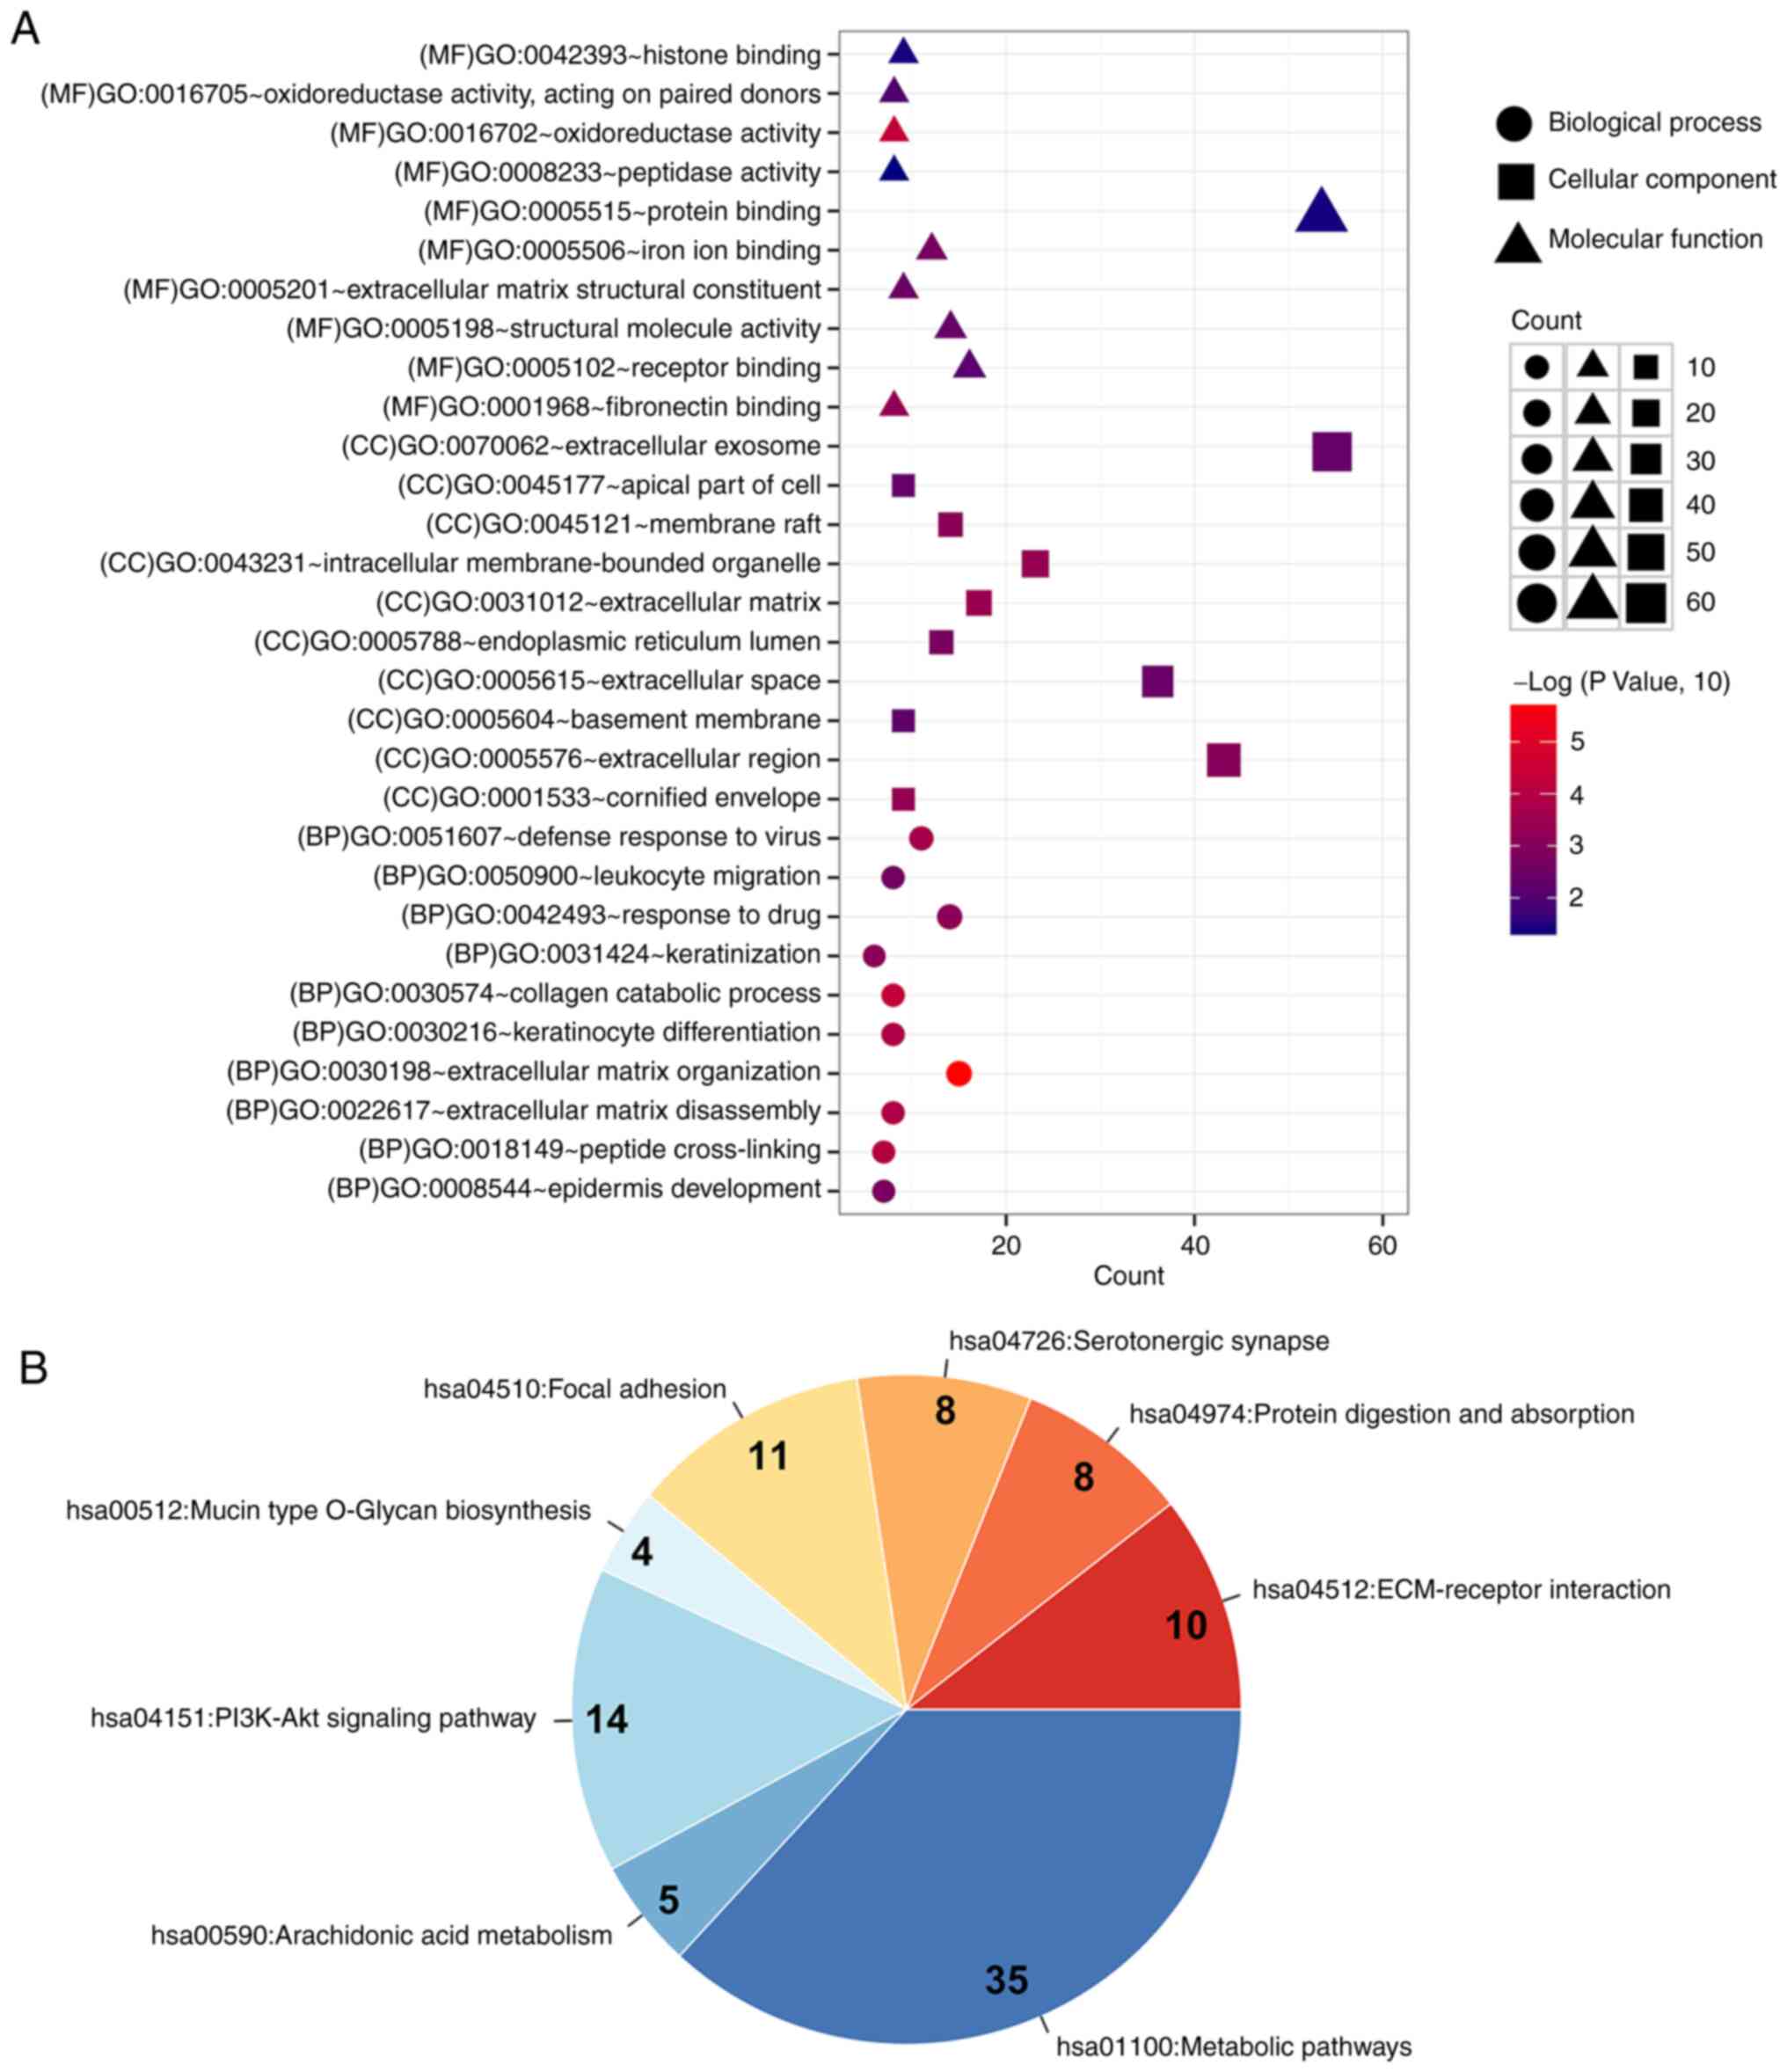
functional annotation and KEGG pathway enrichment analyses using
the DAVID database were performed on the genes in the network
(Fig. 4A and B). These genes were
mainly enriched into 49 functions and 8 pathways, including
‘extracellular matrix organization’ (n=15; P=1.75×10⁻⁶),
‘collagen catabolic process’ (n=8; P=4.97×10⁻⁵),
‘peptide cross-linking’ (n=7; P=1.03×10⁻⁴),
‘ECM-receptor interaction’ (n=10; P=8.12×10⁻⁵) and
‘protein digestion and absorption’ (n=8; P=0.0087). The four
critical topological structural parameters of the interaction
network (degree, BC, CC and path length) were calculated to screen
hub genes with higher degrees in network connection. The average
shortest path length, BC, CC, clusters and degrees of DEGs in
cluster 1 and cluster 7 are presented in Table SII. Hub genes with higher degrees
were selected and the top 10 hub nodes were selected according to
the degree (Table II). The top
seven hub nodes included FN1 (degree, 20), amyloid β
precursor protein (APP; degree, 20), STAT1 (degree,
13), syndecan 4 (SDC4; degree, 11), COL4A1 (degree,
11), COL2A1 (degree, 11) and COL6A5 (degree, 9). The
FDRs of these genes among three groups were calculated (Table III).
| Table II.Topology parameter information for
the top 10 nodes. |
Table II.
Topology parameter information for
the top 10 nodes.
| Gene | Average shortest
path length | Betweenness
centrality | Closeness
centrality | Cluster | Degree |
|---|
| FN1 | 3.74863388 | 0.23032173 | 0.26676385 | 7 | 20 |
| APP | 3.61748634 | 0.32970711 | 0.27643505 | 7 | 20 |
| STAT1 | 4.09289617 | 0.23343102 | 0.24432577 | 7 | 13 |
| SDC4 | 4.1147541 | 0.08022745 | 0.24302789 | 7 | 11 |
| COL4A1 | 4.49180328 | 0.01521287 | 0.22262774 | 7 | 11 |
| COL2A1 | 4.50273224 | 0.01956135 | 0.22208738 | 7 | 11 |
| COL6A5 | 4.96174863 | 0.00248319 | 0.20154185 | 1 | 9 |
| THBS1 | 4.01639344 | 0.02817062 | 0.24897959 | 7 | 9 |
| COL10A1 | 5.26775956 | 0.00445108 | 0.18983402 | 7 | 9 |
| COL4A6 | 4.96174863 | 0.00248319 | 0.20154185 | 7 | 9 |
| Table III.FDRs of the top seven hub genes among
the 3 groups. |
Table III.
FDRs of the top seven hub genes among
the 3 groups.
|
| FDRs |
|---|
|
|
|
|---|
| Gene | Early OSCC vs.
OL | Late OSCC vs.
OL | Late OSCC vs. early
OSCC |
|---|
| FN1 | 0.0112 | 0.000116 | 0.017 |
| APP | 0.000386 | 0.000155 | 0.0413 |
| STAT1 | 0.00000348 | 0.00000234 | 0.0239 |
| SDC4 | 0.00000000226 | 0.0000204 | 0.0111 |
| COL2A1 | 0.0017 | 0.00000568 | 0.0104 |
| COL10A1 | 0.00329 | 0.0000145 | 0.0329 |
| COL4A6 | 0.00247 | 0.000208 | 0.0481 |
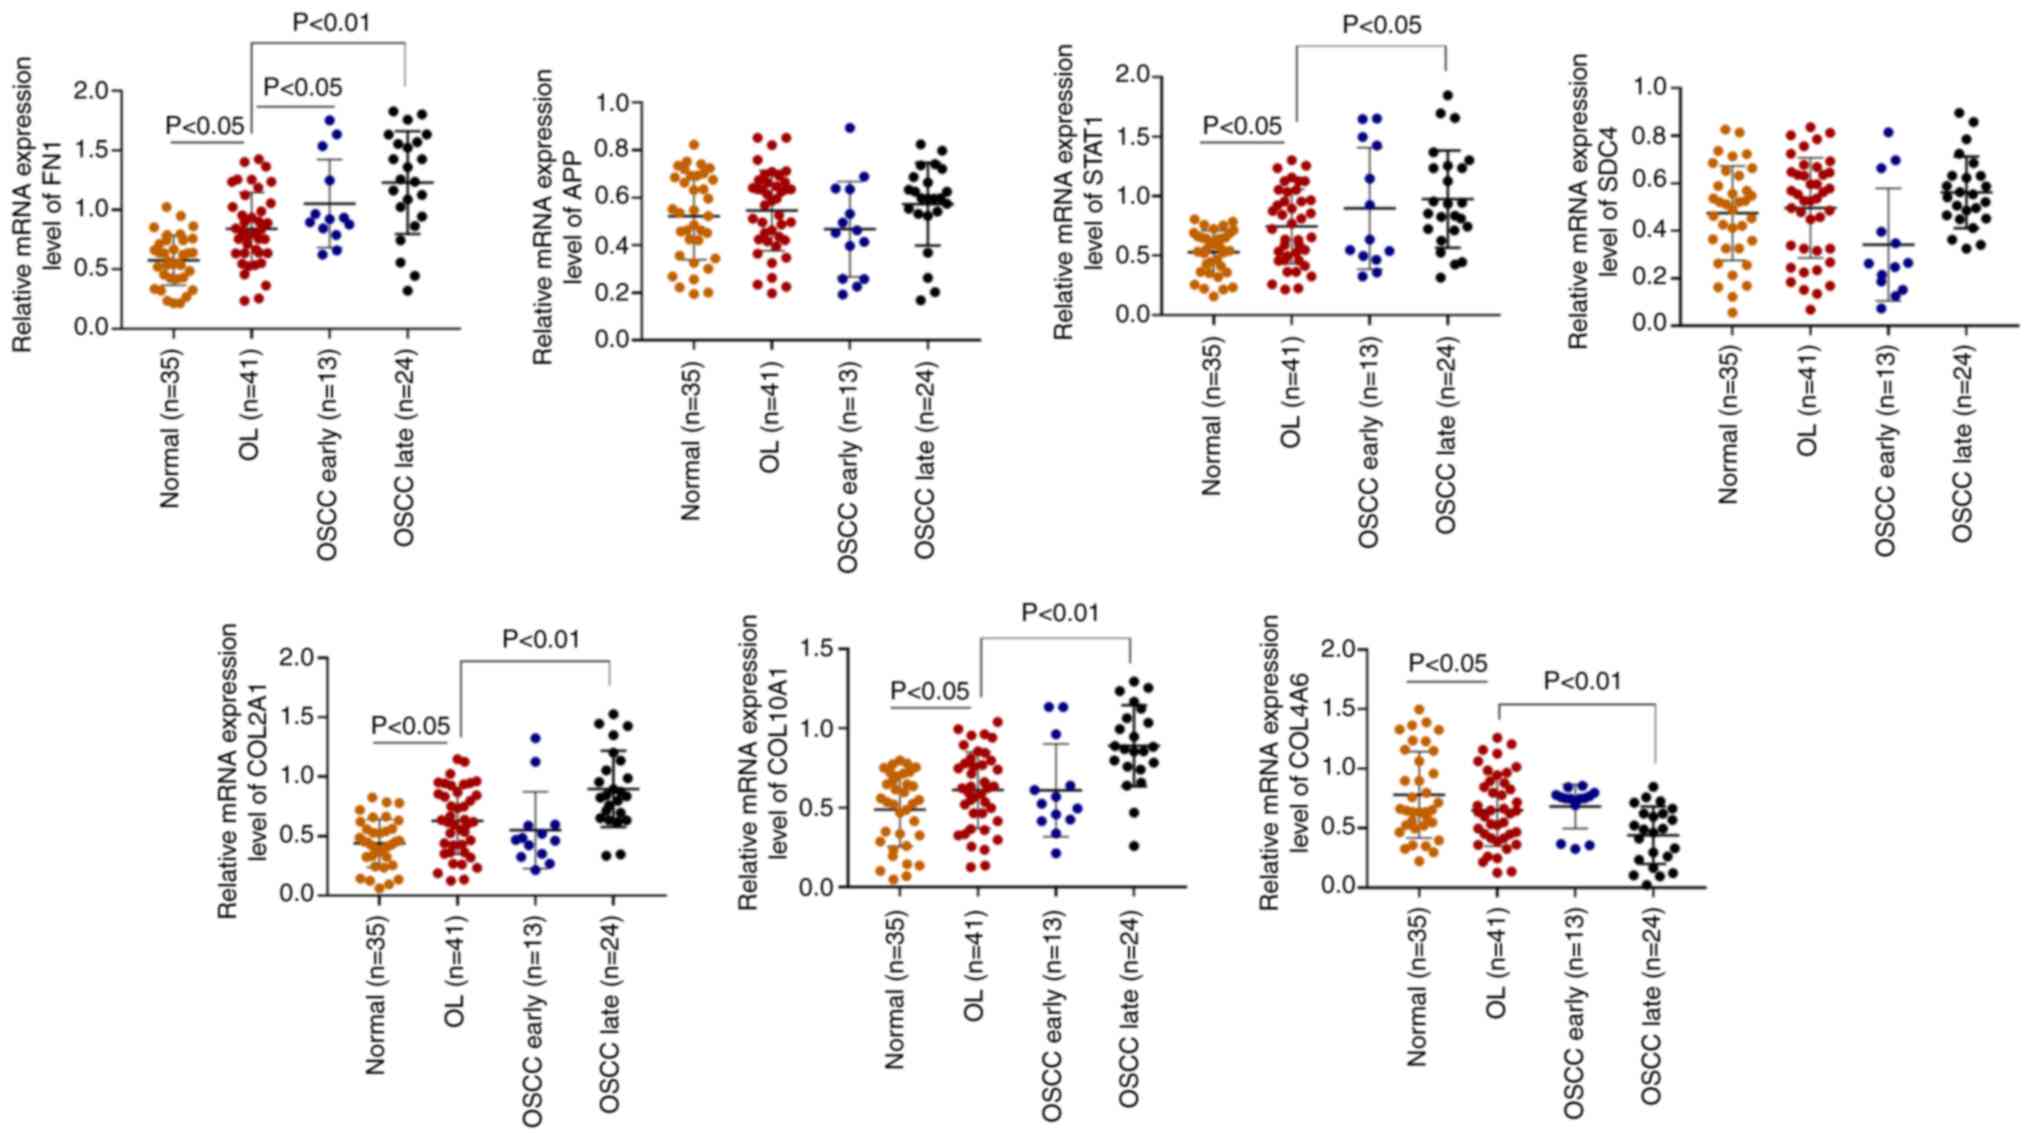
Assessment of the top seven hub genes
in clinical samples
Bioinformatic analysis indicated the important genes
through algorithms based on the GSE85195 dataset. The identified
hub genes were assessed clinically. The mRNA expression levels, in
the clinical samples, of the top seven hub genes were assessed
using RT-qPCR. FN1, STAT1, COL2A1 and COL10A1
demonstrated a significant increase in their mRNA expression levels
in the late OSCC group compared with the OL group (Fig. 5). However, COL4A6 mRNA
expression levels exhibited a significant decrease in the late OSCC
group compared with the OL group. There was no significant
difference in the mRNA expression levels of APP or
SDC4. Both APP and SDC4 belonged to cluster 7,
which had demonstrated an increasing trend on bioinformatic
analysis. There were still differences between the results obtained
using bioinformatic analysis and the actual expression in patient
tissues. Therefore, FN1, STAT1, COL2A1, COL10A1 and
COL4A6 might serve as potential biomarkers for predicting
the progression from OL to OSCC. ROC analysis was used to assess
the prognostic value of these hub genes. FN1 (OL AUC=0.7604;
OSCC AUC=0.8977), STAT1 (OL AUC=0.6950; OSCC AUC=0.7541),
COL2A1 (OL AUC=0.6944; OSCC AUC=0.7803), COL10A1 (OL
AUC=0.6338; OSCC AUC=0.7718) and COL4A6 (OL AUC=0.5916; OSCC
AUC=0.6668) were the candidate independent prognostic factors for
OL and OSCC (Fig. 6A and B). Based
on the AUC, FN1 appeared to be the better prognostic
factor.
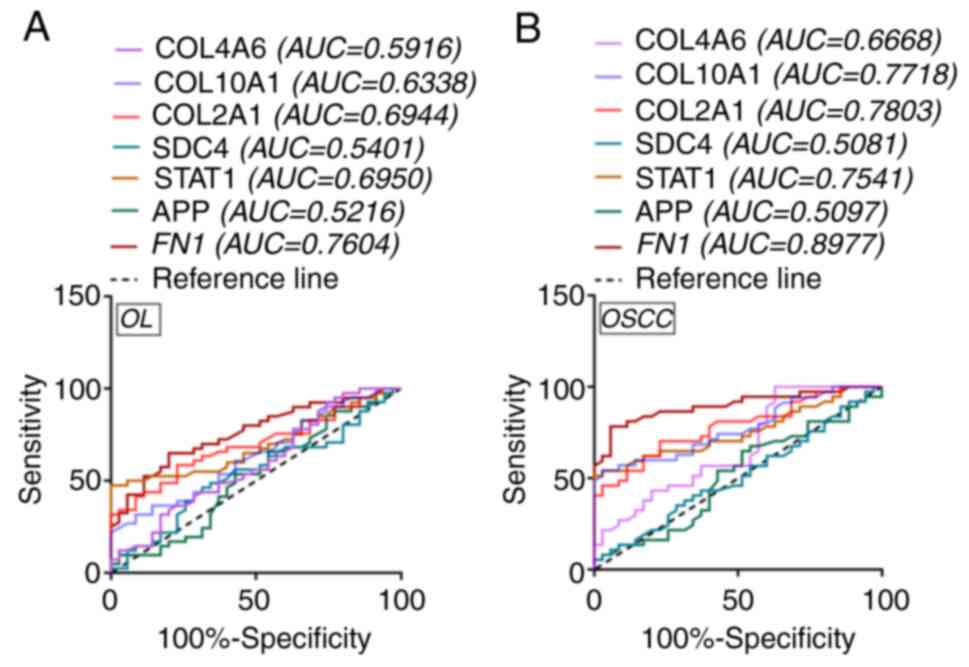 | Figure 6.ROC curve analyses for hub genes.
Analysis of ROC curve for hub genes in (A) OL and (B) OSCC patient
samples. ROC, receiver operating characteristic; AUC, area under
the curve; OL, oral leukoplakia; OSCC, oral squamous cell
carcinoma; FN1, fibronectin 1; STAT1, signal
transducer and activator of transcription 1; COL2A1,
collagen type II α1 chain; COL10A1, collagen type X α1
chain; COL4A6, collagen type IV α6 chain; SDC4, syndecan 4;
APP, amyloid β precursor protein. |
Discussion
OL is a well-characterized oral mucosal precancerous
lesion (27). The abnormal genetic
changes in OL have been reported to lay the biological basis for
the development of oral cancer (28). In the present study, DEGs in
different developmental stages were screened to assess their
ability to predict OSCC. These DEGs were enriched in numerous
different signaling pathways and functions. Using the PPI network,
genes with the highest degree of interaction were screened.
FN1 was identified as the hub node with the
highest degree in the present study. FN1 is a high-molecular weight
glycoprotein, which is widely distributed in blood, body fluids and
numerous tissues (29). FN1
possesses a variety of biological activities and is extensively
involved in numerous cell processes, such as cell migration,
adhesion, proliferation, hemostasis and tissue repair (30). In a previous study, the inhibition
of FN1 expression was suggested as a promising treatment
strategy for OSCC (31).
Furthermore, FN1 has been reported as a biomarker for OSCC,
with sensitivity and specificity of 80 and 84%, respectively
(32). Moreover, Suresh et
al (33) performed
high-throughput analysis of oral tongue cancer and reported
FN1 as a molecular biomarker for drug resistance.
Importantly, FN1 expression is markedly different between
patients with early and late OSCC (34). In the present study, FN1 was
indicated to have participated in extracellular matrix (ECM)
organization and ECM-receptor interaction during tissue
reconstruction. The ECM is key to triggering cell migration and
fixation (35), and ECM components
facilitate the attachment, proliferation and cytoskeletal
organization of human oral epithelial cells (36). Therefore, it can be hypothesized
that FN1 was involved in the carcinogenesis of OL by
participating in the ECM function and pathways.
STAT1 belongs to the STAT protein family. In
response to cytokines and growth factors, the STAT members are
phosphorylated by receptor-related kinases to form homodimers or
heterodimers (37). This protein
can be activated by a variety of ligands, such as interferon-α,
interferon-γ, epidermal growth factor, PDGF and IL6
(38). A previous study reported
that STAT1 expression was positively associated with the
occurrence of oral precancerous lesions (39). Furthermore, the activation of
STAT1 has been reported to predict the risk of OSCC and is
also associated with lymph node status (40). STAT1/ATF4/S1OOP is a critical
signaling pathway associated with the development of oral cancer
(41), and the results of the
present study were consistent with this. In the present study,
STAT1 expression increased from OL to OSCC status and it was
also indicated to participate in drug response, the type I
interferon signaling pathway. Previous studies reported that type I
interferon induced the expression of MDA-5, which improved
the immune response of oral disease (42). Furthermore, the type I interferon
signaling pathway is an important process linked with the defense
mechanism against oral viral infections (43). Based on the aforementioned evidence,
it was hypothesized that STAT1 not only served a critical
role in the carcinogenesis of OL, but also participated in drug
response and immune defense.
COL2A1, COL10A1 and COL4A6 all belong
to the collagen family. Collagen fibers are the most important ECM
component in the oral mucosa and are an important component of the
cancer interstitium (44). Any
changes in their morphological distribution or quantity may be
related to OSCC invasion (45). In
2016, Li et al (46)
reported the use of microarray data analysis to screen oral tongue
SCC (OTSCC)-related biomarkers and reported that numerous collagen
proteins were differentially expressed in OTSCC samples. Notably,
COL2A1, COL10A1 and COL4A6 were enriched in ECM
organization, collagen catabolic process, proteinaceous ECM and the
PI3K-Akt signaling pathway in the present study. The PI3K-Akt
signaling pathway is widely involved in oral diseases such as
periapical pulp disease, periodontal disease and oral tumors
(47). This pathway has also been
reported to demonstrate oncogenic properties and is related to the
proliferation and migration of OSCC cells (48). Combing these previous studies and
the results of the present study suggested that COL2A1,
COL10A1 and COL4A6 may serve as prognostic biomarkers
for OSCC.
Genes in the PPI network in the present study were
enriched in 49 functions and 8 pathways, such as ‘extracellular
matrix organization’, ‘collagen catabolic process’, ‘peptide
cross-linking’, ‘ECM-receptor interaction’ and ‘protein digestion
and absorption’. These functions and pathways are critical in the
carcinogenesis of OL. Previous studies have reported certain
theoretical foundations for these pathways. Sutinen et al
(49) reported the expression of
MMP-1 and MMP-2, and their inhibitors TIMP-1,
TIMP-2 and TIMP-3, in dysplastic epithelium and squamous
cell carcinoma, and demonstrated that the expression of MMP
and TIMP increased significantly from leukoplakia to cancer.
Katayama et al (50) applied
immunohistochemistry to detect the expression of MMPs and
TIMPs in 53 early oral cancer biopsy specimens and reported
that the high expression of TIMP-2 was an independent factor
for the poor prognosis of early OSCC. Furthermore, Arora et
al (51) assessed the
expression of type IV collagen in OL and reported that the
inhibition of collagen decomposition delayed OL deterioration and
tumor spread. The aforementioned evidence suggested that these
functions and pathways have specific roles in the progression from
OL to OSCC.
Certain limitations should be noted in the present
study. Firstly, the present study conducted the preliminary
verification of the identified DEGs, but the underlying mechanisms
of these DEGs were not verified in vitro and the detailed
molecular mechanisms were not evaluated. For an in vitro
study, cell functional experiments, including analysis of the
effect of FN1, STAT1, COL2A1, COL10A1 and COL4A6 on
cell proliferation, apoptosis, migration and invasion, as well as
elucidation of the underlying molecular mechanism, should be
performed. For an in vivo study, animal models of oral
leukoplakia and oral squamous cell carcinoma should be constructed
to evaluate the effect of FN1, STAT1, COL2A1, COL10A1 and
COL4A6 on tumor growth and regulation mechanisms. Secondly,
due to the limitations of the online dataset, the expression levels
were not compared with those in normal samples. Thirdly, due to the
small sample size and short time period of clinical sample
collection, clinical samples from patients who developed OSCC from
OL were not involved in this study and the expression changes of
DEGs during the progression from OL to OSCC were not assessed.
Therefore, the DEGs among a greater number of healthy individuals
and patients with OL and OSCC should be evaluated. Moreover, the
protein levels of these mRNAs in the same samples should be
assessed to evaluate the physiological relevance in further
studies.
In conclusion, FN1, STAT1, COL2A1, COL10A1
and COL4A6 were identified as potential biomarkers for the
carcinogenesis of OL, which may provide a theoretical basis for the
clinical assessment of the prognosis of OSCC. More studies are
required to evaluate the underlying molecular mechanism of these
genes and related pathways.
Supplementary Material
Supporting Data
Acknowledgements
Not applicable.
Funding
The present study was supported by the Youth Fund of The First
Affiliated Hospital of Zhengzhou University (grant no.
2018YJ156).
Availability of data and materials
The GSE85195 dataset (https://ftp.ncbi.nlm.nih.gov/geo/series/GSE85nnn/GSE85195/matrix/)
was downloaded from the NCBI Gene Expression Omnibus (GEO) database
(https://www.ncbi.nlm.nih.gov/). The
datasets used and/or analyzed during the current study are
available from the corresponding author on reasonable request.
Authors' contributions
LHY and BG were responsible for study design and
data collection. BG, JNW and JLW contributed to data analysis. LHY
and JLW were responsible for clinical data recording and data
analysis. LHY, JNW and JLW wrote the manuscript and confirm the
authenticity of all the raw data. All authors read and approved the
final manuscript.
Ethics approval and consent to
participate
The project protocol was approved by the Ethics
Committee of The First Affiliated Hospital of Zhengzhou University
(approval number: 2018KJ06) and performed in accordance with the
Guidelines of The First Affiliated Hospital of Zhengzhou University
(Zhengzhou, China). Patients provided written, informed
consent.
Patient consent for publication
Not applicable.
Competing interests
The authors declare that they have no competing
interests.
References
|
1
|
Madke B, Chougule BD, Kar S and Khopkar U:
Appearances in clinical dermatology. Indian J Dermatol Venereol
Leprol. 80:432–447. 2014. View Article : Google Scholar : PubMed/NCBI
|
|
2
|
Marija BB: The prevalence of precancerous
oral lesions: Oral leukoplakia. Archive of Oncology. 8:107–109.
2000.
|
|
3
|
Jha R and Parmar DV: A study of
precancerous lesions for oral cancer in Jamnagar City. Journal of
Indian Academy of Oral Medicine & Radiology. 23:S333–S335.
2011. View Article : Google Scholar
|
|
4
|
Field JK: Oncogenes and tumor-suppressor
genes in squamous cell carcinoma of the head and neck. Eur J Cancer
B Oral Oncol. 28B:67–76. 1992. View Article : Google Scholar : PubMed/NCBI
|
|
5
|
Kato K, Shimasaki M, Kato T, Segami N and
Ueda Y: Expression of Sphingosine Kinase-1 is associated with
invasiveness and poor prognosis of oral squamous cell carcinoma.
Anticancer Res. 38:1361–1368. 2018.PubMed/NCBI
|
|
6
|
Grimm M, Kraut W, Hoefert S, Krimmel M,
Biegner T, Teriete P, Cetindis M, Polligkeit J, Kluba S, Munz A and
Reinert S: Evaluation of a biomarker based blood test for
monitoring surgical resection of oral squamous cell carcinomas.
Clin Oral Investig. 20:329–338. 2016. View Article : Google Scholar : PubMed/NCBI
|
|
7
|
Xie L, Dang Y, Guo J, Sun X, Xie T, Zhang
L, Yan Z, Amin H and Guo X: High KRT8 expression independently
predicts poor prognosis for lung adenocarcinoma patients. Genes
(Basel). 10:362019. View Article : Google Scholar : PubMed/NCBI
|
|
8
|
Xie L, Li H, Zhang L, Ma X, Dang Y, Guo J,
Liu J, Ge L, Nan F, Dong H, et al: Autophagy-related gene P4HB: A
novel diagnosis and prognosis marker for kidney renal clear cell
carcinoma. Aging (Albany NY). 12:1828–1842. 2020. View Article : Google Scholar : PubMed/NCBI
|
|
9
|
Rivera C, Oliveira AK, Costa RAP, De Rossi
T and Paes Leme AF: Prognostic biomarkers in oral squamous cell
carcinoma: A systematic review. Oral Oncol. 72:38–47. 2017.
View Article : Google Scholar : PubMed/NCBI
|
|
10
|
Cssz V, Lábiscsák P, Kalló G, Márkus B,
Emri M, Szabó A, Tar I, Tőzsér J, Kiss C and Márton I: Proteomics
investigation of OSCC-specific salivary biomarkers in a Hungarian
population highlights the importance of identification of
population-tailored biomarkers. PLoS One. 12:e01772822017.
View Article : Google Scholar : PubMed/NCBI
|
|
11
|
Ali J, Sabiha B, Jan HU, Haider SA, Khan
AA and Ali SS: Genetic etiology of oral cancer. Oral Oncol.
70:23–28. 2017. View Article : Google Scholar : PubMed/NCBI
|
|
12
|
Sathyan KM, Nalinakumari KR and Kannan S:
H-Ras mutation modulates the expression of major cell cycle
regulatory proteins and disease prognosis in oral carcinoma. Mod
Pathol. 20:1141–1148. 2007. View Article : Google Scholar : PubMed/NCBI
|
|
13
|
Lord RV, Salonga D, Danenberg KD, Peters
JH, DeMeester TR, Park JM, Johansson J, Skinner KA, Chandrasoma P,
DeMeester SR, et al: Telomerase reverse transcriptase expression is
increased early in the Barrett's metaplasia, dysplasia,
adenocarcinoma sequence. J Gastrointest Surg. 4:135–142. 2000.
View Article : Google Scholar : PubMed/NCBI
|
|
14
|
Zhou Q, Wang XH, Jiang YH, Li RW and Zhong
M: Expression of telomerase genes hTRTmRNA in oral squamous cell
carcinomas. Shanghai Kou Qiang Yi Xue. 15:259–262. 2006.(In
Chinese). PubMed/NCBI
|
|
15
|
Umbreit C, Tuch D, Hoffmann F, Gräfe C,
Clement JH, Franz M, von Eggeling F, Berndt A and Guntinas-Lichius
O: Characterization of phenotype changes after long-term inhibition
of EGFR in OSCC and analysis by MALDI-MSI. Laryngorhinootologie.
97((S 02)): S137–S138. 2018.
|
|
16
|
Matsuhira A, Noguchi S, Sato K, Tanaka Y,
Yamamoto G, Mishima K and Katakura A: Cytokeratin 13, Cytokeratin
17, Ki-67 and p53 expression in upper layers of epithelial
dysplasia surrounding tongue squamous cell carcinoma. Bull Tokyo
Dent Coll. 56:223–231. 2015. View Article : Google Scholar : PubMed/NCBI
|
|
17
|
Bhosale PG, Cristea S, Ambatipudi S, Desai
RS, Kumar R, Patil A, Kane S, Borges AM, Schäffer AA, Beerenwinkel
N and Mahimkar MB: Chromosomal alterations and gene expression
changes associated with the progression of leukoplakia to advanced
gingivobuccal cancer. Transl Oncol. 10:396–409. 2017. View Article : Google Scholar : PubMed/NCBI
|
|
18
|
Ritchie ME, Phipson B, Wu D, Hu Y, Law CW,
Shi W and Smyth GK: limma powers differential expression analyses
for RNA-sequencing and microarray studies. Nucleic Acids Res.
43:e472015. View Article : Google Scholar : PubMed/NCBI
|
|
19
|
Wang L, Cao C, Ma Q, Zeng Q, Wang H, Cheng
Z, Zhu G, Qi J, Ma H, Nian H and Wang Y: RNA-seq analyses of
multiple meristems of soybean: Novel and alternative transcripts,
evolutionary and functional implications. BMC Plant Biol.
14:1692014. View Article : Google Scholar : PubMed/NCBI
|
|
20
|
Ghandhi SA, Sinha A, Markatou M and
Amundson SA: Time-series clustering of gene expression in
irradiated and bystander fibroblasts: An application of FBPA
clustering. BMC Genomics. 12:22011. View Article : Google Scholar : PubMed/NCBI
|
|
21
|
Huang da W, Sherman BT and Lempicki RA:
Systematic and integrative analysis of large gene lists using DAVID
bioinformatics resources. Nat Protoc. 4:44–57. 2009. View Article : Google Scholar : PubMed/NCBI
|
|
22
|
Szklarczyk D, Morris JH, Cook H, Kuhn M,
Wyder S, Simonovic M, Santos A, Doncheva NT, Roth A, Bork P, et al:
The STRING database in 2017: Quality-controlled protein-protein
association networks, made broadly accessible. Nucleic Acids Res.
45((D1)): D362–D368. 2017. View Article : Google Scholar : PubMed/NCBI
|
|
23
|
Bergholdt R, Brorsson C, Lage K, Nielsen
JH, Brunak S and Pociot F: Expression profiling of human genetic
and protein interaction networks in type 1 diabetes. PLoS One.
4:e62502009. View Article : Google Scholar : PubMed/NCBI
|
|
24
|
Jeong H, Mason SP, Barabási AL and Oltvai
ZN: Lethality and centrality in protein networks. Nature.
411:41–42. 2001. View Article : Google Scholar : PubMed/NCBI
|
|
25
|
Xu QS, Wang C, Li B, Li JZ, Mao MH, Qin
LZ, Li H, Huang X, Han Z and Feng Z: Prognostic value of pathologic
grade for patients with oral squamous cell carcinoma. Oral Dis.
24:335–346. 2018. View Article : Google Scholar : PubMed/NCBI
|
|
26
|
Livak KJ and Schmittgen TD: Analysis of
relative gene expression data using real-time quantitative PCR and
the 2(−Delta Delta C(T)) method. Methods. 25:402–408. 2001.
View Article : Google Scholar : PubMed/NCBI
|
|
27
|
Nomura H, Sakamoto K, Sugihara T, Okamoto
S, Aoki Y, Tanigawa T, Matoda M, Omatsu K, Kanao H, Kato K, et al:
Oral leukoplakia, a precancerous lesion of squamous cell carcinoma,
in patients with long-term pegylated liposomal doxorubicin
treatment. Medicine (Baltimore). 97:e99322018. View Article : Google Scholar : PubMed/NCBI
|
|
28
|
Cohen HV and Quek SYP: The molecular
biology of cancer-Part 1-cellular and genetic changes that lead to
the development of cancer. J N J Dent Assoc. 82:22–25.
2011.PubMed/NCBI
|
|
29
|
Ouaissi MA and Capron A: Fibronectins:
Structure and functions. Ann Inst Pasteur Immunol. (1985).
136C:169–185. 1985.(In French). View Article : Google Scholar : PubMed/NCBI
|
|
30
|
Nuttelman CR, Mortisen DJ, Henry SM and
Anseth KS: Attachment of fibronectin to poly(vinyl alcohol)
hydrogels promotes NIH3T3 cell adhesion, proliferation, and
migration. J Biomed Mater Res. 57:217–223. 2001. View Article : Google Scholar : PubMed/NCBI
|
|
31
|
Chen Z, Tao Q, Qiao B and Zhang L:
Silencing of LINC01116 suppresses the development of oral squamous
cell carcinoma by up-regulating microRNA-136 to inhibit FN1. Cancer
Manag Res. 11:6043–6059. 2019. View Article : Google Scholar : PubMed/NCBI
|
|
32
|
Yen CY, Huang CY, Hou MF, Yang YH, Chang
CH, Huang HW, Chen CH and Chang HW: Evaluating the performance of
fibronectin 1 (FN1), integrin α4β1 (ITGA4), syndecan-2 (SDC2), and
glycoprotein CD44 as the potential biomarkers of oral squamous cell
carcinoma (OSCC). Biomarkers. 18:63–72. 2013. View Article : Google Scholar : PubMed/NCBI
|
|
33
|
Suresh A, Vannan M, Kumaran D, Gümüs ZH,
Sivadas P, Murugaian EE, Kekatpure V, Iyer S, Thangaraj K and
Kuriakose MA: Resistance/response molecular signature for oral
tongue squamous cell carcinoma. Dis Markers. 32:51–64. 2012.
View Article : Google Scholar : PubMed/NCBI
|
|
34
|
Pavuluri S, Lefevre C, Sharp J, Vasireddi
SP and Nicholas KR: Abstract C37: Gene profiling predicts
biomarkers in oral squamous cell carcinoma with diagnostic and
therapeutic importance. Mol Cancer Ther. 12
(11_Supplement):C372014. View Article : Google Scholar
|
|
35
|
Stupack DG, Cho SY and Klemke RL:
Molecular signaling mechanisms of cell migration and invasion.
Immunol Res. 21:83–88. 2000. View Article : Google Scholar : PubMed/NCBI
|
|
36
|
Park JC, Kim HM and Ko J: Effects of
extracellular matrix constituents on the attachment of human oral
epithelial cells at the titanium surface. Int J Oral Maxillofac
Implants. 13:826–836. 1998.PubMed/NCBI
|
|
37
|
Yang T, Lu P, Zhang Y, Zheng YB, Wang L,
Zhou L and Liu J: Seeking colorectal carcinoma related genes based
on regulation network. Afr J Pharm Pharmacol. 5:1467–1474. 2011.
View Article : Google Scholar
|
|
38
|
Bhat GJ and Baker KM: Cross-talk between
angiotensin II and interleukin-6-induced signaling through Stat3
transcription factor. Basic Res Cardiol. 93 (Suppl 3):S26–S29.
1998. View Article : Google Scholar : PubMed/NCBI
|
|
39
|
Mori K, Haraguchi S, Hiori M, Shimada J
and Ohmori Y: Tumor-associated macrophages in oral premalignant
lesions coexpress CD163 and STAT1 in a Th1-dominated
microenvironment. BMC Cancer. 15:5732015. View Article : Google Scholar : PubMed/NCBI
|
|
40
|
Laimer K, Spizzo G, Obrist P, Gastl G,
Brunhuber T, Schäfer G, Norer B, Rasse M, Haffner MC and Doppler W:
STAT1 activation in squamous cell cancer of the oral cavity: A
potential predictive marker of response to adjuvant chemotherapy.
Cancer. 110:326–333. 2007. View Article : Google Scholar : PubMed/NCBI
|
|
41
|
Wu TS, Tan CT, Chang CC, Lin BR, Lai WT,
Chen ST, Kuo MY, Rau CL, Jaw FS and Chang HH: B-cell
lymphoma/leukemia 10 promotes oral cancer progression through
STAT1/ATF4/S100P signaling pathway. Oncogene. 34:1207–1219. 2014.
View Article : Google Scholar : PubMed/NCBI
|
|
42
|
Matsumiya T, Hayakari R, Narita N, Ito R,
Kon T, Kubota K, Sakaki H, Yoshida H, Imaizumi T, Kobayashi W and
Kimura H: Role of type I- and type II-interferon in expression of
melanoma differentiation-associated gene-5 in HSC-3 oral squamous
carcinoma cells. Biomed Res. 35:9–16. 2014. View Article : Google Scholar : PubMed/NCBI
|
|
43
|
Yokota S, Saito H, Kubota T, Yokosawa N,
Amano K and Fujii N: Measles virus suppresses interferon-alpha
signaling pathway: Suppression of Jak1 phosphorylation and
association of viral accessory proteins, C and V, with
interferon-alpha receptor complex. Virology. 306:135–146. 2003.
View Article : Google Scholar : PubMed/NCBI
|
|
44
|
Carretero A, Soares da Costa D, Reis RL
and Pashkuleva I: Extracellular matrix-inspired assembly of
glycosaminoglycan-collagen fibers. J Mater Chem B. 5:3103–3106.
2017. View Article : Google Scholar : PubMed/NCBI
|
|
45
|
Benbow U, Schoenermark MP, Mitchell TI,
Rutter JL, Shimokawa K, Nagase H and Brinckerhoff CE: A novel
host/tumor cell interaction activates matrix metalloproteinase 1
and mediates invasion through type I collagen. J Biol Chem.
274:25371–25378. 1999. View Article : Google Scholar : PubMed/NCBI
|
|
46
|
Li Y, Chai Z, Wan L and Ding Y: Analysis
of the gene expression profile for Oral tongue squamous cell
carcinoma. Int J Clin Exp Med. 9:7471–7480. 2016.
|
|
47
|
Wang H, Wu Q, Liu Z, Luo X, Fan Y, Liu Y,
Zhang Y, Hua S, Fu Q, Zhao M, et al: Downregulation of FAP
suppresses cell proliferation and metastasis through PTEN/PI3K/AKT
and Ras-ERK signaling in oral squamous cell carcinoma. Cell Death
Dis. 5:e11552014. View Article : Google Scholar : PubMed/NCBI
|
|
48
|
Zheng Y, Wang Z, Xiong X, Zhong Y, Zhang
W, Dong Y, Li J, Zhu Z, Zhang W, Wu H, et al: Membrane-tethered
Notch1 exhibits oncogenic property via activation of EGFR-PI3K-AKT
pathway in oral squamous cell carcinoma. J Cell Physiol.
234:5940–5952. 2019. View Article : Google Scholar : PubMed/NCBI
|
|
49
|
Sutinen M, Kainulainen T, Hurskainen T,
Vesterlund E, Alexander JP, Overall CM, Sorsa T and Salo T:
Expression of matrix metalloproteinases (MMP-1 and −2) and their
inhibitors (TIMP-1, −2 and −3) in oral lichen planus, dysplasia,
squamous cell carcinoma and lymph node metastasis. Br J Cancer.
77:2239–2245. 1998. View Article : Google Scholar : PubMed/NCBI
|
|
50
|
Katayama A, Bandoh N, Kishibe K, Takahara
M, Ogino T, Nonaka S and Harabuchi Y: Expressions of matrix
metalloproteinases in early-stage oral squamous cell carcinoma as
predictive indicators for tumor metastases and prognosis. Clin
Cancer Res. 10:634–640. 2004. View Article : Google Scholar : PubMed/NCBI
|
|
51
|
Arora KS, Nayyar A, Kaur P, Arora KS, Goel
A and Singh S: Evaluation of collagen in leukoplakia, oral
submucous fibrosis and oral squamous cell carcinomas using
polarizing microscopy and immunohistochemistry. Asian Pac J Cancer
Prev. 19:1075–1080. 2018.PubMed/NCBI
|