Introduction
Programmed death protein-1 (PD-1) and PD-ligand 1
(PD-L1) are the central factors of immune checkpoints that
intervene in immune escape. These immune checkpoints are actuated
by ligand and receptor binding, blocking their signaling pathways
(1). Previous studies have reported
that the PD-1/PD-L1 pathway has a role in resistance to antitumor
immunity in numerous types of cancer (1,2).
Immune checkpoint inhibitors (ICIs) are among the biggest
breakthroughs in immunotherapy, showing notable efficacy against
various cancer types by suppressing immune checkpoint-mediated
immune escape (3,4).
PD-L1 expression in tumor cells suppresses
activation of tumor-infiltrating lymphocytes and promotes tumor
progression (5,6). This suggests that the level of PD-L1
expression may have a greater than expected effect on tumor
dynamics. Moreover, cumulative evidence has indicated that not only
tumor cells with PD-L1 expression, as quantified by the tumor
proportion score (TPS), but also PD-L1-expressing immune cells, as
quantified by the combined positive score, play a crucial role in
predicting the response to ICIs (4,7,8). An
association has previously been reported between the therapeutic
efficiency of anti-PD-1 antibodies and PD-L1 expression in both
tumor and tumor-infiltrating immune cells in lung cancer (8), breast cancer (9) and malignant melanoma (10). Therefore, the expression levels of
PD-L1 molecules in either tumor cells or tumor-infiltrating immune
cells may serve as biomarkers to predict the therapeutic response
to ICIs. However, there are no ideal biomarkers for treatment
prediction (11), and PD-L1
expression, detected using immunohistochemistry (IHC), has several
limitations as a predictive biomarker. Tumor tissue collection can
be difficult in some patients; it is invasive and it cannot be
frequently monitored. Moreover, PD-L1 expression in either tumor or
immune cells is determined using immunostaining and through visual
inspection of tumor tissue by pathologists, which limits
objectivity in determining PD-L1 expression levels. In addition,
different IHC assays for PD-L1 have been developed for each ICI
drug, and different antibodies have been used to predict efficacy,
thus raising the question of how different these IHC assays are,
whether they need to be performed separately, and whether
harmonization is possible (12). To
validate this issue, an international comparative study was
conducted: The Blueprint study sought to differentiate between the
following four antibodies: 28–8, 22C3, SP142 and SP263 (13). The three antibodies 28–8, 22C3 and
SP263 showed similar positivity rates, whereas SP142 showed a lower
positivity rate for PD-L1. Although the three aforementioned assays
showed similar analytical performance for PD-L1 expression,
switching assays and cut-off values could lead to misclassification
of PD-L1 status. In addition, the cut-off values used in the
aforementioned clinical trials varied from 1 to 50% (13), creating bias in defining positive
PD-L1 expression. Furthermore, tissue-to-tissue and temporal
heterogeneity of PD-L1 expression limits accurate and precise
assessment, and there are a number of challenges associated with
assessing PD-L1 expression by IHC (12).
To overcome the aforementioned limitations, we have
focused on the immune checkpoint expression in circulating
peripheral blood. We have previously measured soluble forms of
PD-L1 (sPD-L1) and PD-1 (sPD-1) in the peripheral blood of patients
with non-small cell lung cancer (NSCLC), gastric cancer and bladder
cancer before treatment, as well as their relationship with
treatment response and prognosis in patients treated with PD-1
blockade monotherapy. The results indicated that the increase in
sPD-1 and sPD-L1 levels was associated with tumor size in patients
with various types of cancer who received anti-PD-1 antibody
monotherapy (14,15). Therefore, sPD-L1 and sPD-1 may be
used as predictive and prognostic biomarkers to identify primary
responders to anti-PD-1 antibody treatment. Furthermore, we
investigated the clinical significance of pretreatment PD-L1
expression levels in peripheral blood mononuclear cell (PBMC)
subsets such as CD3+, CD4+, CD8+
and CD14+ in patients with cancer treated with anti-PD-1
antibody monotherapy, as in a previous study (16). In the study, it was found that
increased CD14+ monocytes, which express PD-L1, were
significantly correlated with shorter overall survival (OS) time,
suggesting that PD-L1-expressing monocytes may contribute to poor
prognosis for patients with cancer treated with anti-PD-1 antibody
(16).
Monocytes are classified into three subsets
according to the expression levels of CD14 and CD16: Classical
(CD14 high and CD16−), intermediate (CD14 high and
CD16+), and non-classical (CD14 low and
CD16+) (17,18). Monocytes play key roles in tumor
metastasis, invasion, angiogenesis and immune regulation (19), and are thus associated with tumor
progression. Nevertheless, the role of each monocyte subset in
cancer prognosis remains unclear. Therefore, the present study
focused on the three subsets of monocytes, with PD-L1 and PD-1
expression analyzed in each subset, and their clinical significance
in patients treated with anti-PD-1 antibody monotherapy was
investigated. The current study assessed the immune response in
patients treated with anti-PD-1 antibody, to identify biomarkers
for the prediction of patient survival. The cell population and
immune-associated phenotypic markers in peripheral blood samples
collected from patients with various types of cancer before
anti-PD-1 antibody monotherapy were investigated.
Materials and methods
Patient population and treatment
schedule
The current study included patients with
unresectable or metastatic NSCLC, gastric cancer and esophageal
cancer treated with anti-PD-1 antibody monotherapy at the Division
of Medical Oncology, Department of Medicine, School of Medicine,
Showa University (Tokyo, Japan). All patients were treated between
January 2017 and January 2021 with an anti-PD-1 antibody; either
200 mg pembrolizumab given intravenously every 3 weeks or 240 mg
nivolumab given intravenously every 2 weeks. Regimens were
administered according to the clinical routine and preference of
the physician. A schematic diagram of the schedule is shown in
Fig. S1.
Assessment of treatment response
Radiologists and physicians performed imaging
assessments using computed tomography. The responses to anti-PD-1
antibody were evaluated according to the Response Evaluation
Criteria in Solid Tumors version 1.1 (20). OS was defined as the time from the
start of anti-PD-1 antibody treatment to either patient death from
any cause or last follow-up. Progression-free survival (PFS) was
defined as the time from the start of anti-PD-1 antibody treatment
to the first documented progressive disease, death from any cause
or the last follow-up, whichever occurred first. The follow-up
cutoff was August 2021.
Peripheral blood samples and PBMC
stock preparation
Peripheral blood samples were obtained from each
patient before the first administration of pembrolizumab or
nivolumab, and stored in BD Vacutainer CPT cell preparation tubes
containing sodium heparin (Becton, Dickinson and Company). The
supernatant was separated by centrifugation at 1,600 × g for 20 min
at 20°C, and the pellet was first resuspended and then washed in
PBS. The separated PBMCs were stored in BAMBANKER®
(Lymphotec Inc.) at −80°C in liquid nitrogen.
Flow cytometry
PBMCs were stained immediately as previously
described (14). For individual
evaluation, a total of 1×10⁷ PBMCs were resuspended in
PBS containing 2% fetal bovine serum (FBS) (Gibco; Thermo Fisher
Scientific, Inc.), incubated in human BD FC Block (cat. no. 564220;
Becton, Dickinson and Company) at 25°C for 10 min, stained with
7-AAD (cat. no. 559925; Becton, Dickinson and Company) at 4°C for
30 min to remove dead cells, PD-L1 phycoerythrin (PE)-labeled
antibody (cat. no. 557924; PE mouse anti-human CD274) and PD-1
Brilliant Violet 480 (BV480)-labeled antibody (cat. no. 566112;
BV480 mouse anti-human CD279), and stored on ice for 30 min with
anti-CD14 Brilliant Violet 650 (BV650)-labeled antibody (cat. no.
563419; mouse anti-human CD14) and anti-CD16 FITC-conjugated
antibody (cat. no. 555406; mouse anti-human CD16), which centered
on staining CD14+ and CD16+ monocytes (all
antibodies were used as provided by Becton, Dickinson and Company).
Thereafter, the cell suspension was washed twice in PBS containing
2% FBS, and the absorbance was detected at each wavelength [FITC,
515–545 nm; PE (Blue Laser), 562–588 nm; 7-AAD, 685–735 nm; BV650,
655–685 nm; BV480, 425–475 nm; PE-Cy7, 750–810 nm]. Flow cytometry
was performed using a BD LSRFortessa™ Cell Analyzer (Becton,
Dickinson and Company). The negative threshold strategies for
gating were set according to single-stained samples and isotype
controls. The data were analyzed using FlowJo (version 10.5.3;
Becton, Dickinson, and Company). The levels of CD14 were expressed
using ‘++’ as a higher positive than ‘+’.
IHC evaluation of PD-L1 expression on
tumor cells
Briefly, formalin-fixed paraffin-embedded tissue
samples with a thickness of 5 µm were obtained from the biopsy
specimens of the patients. The specimens were fixed in 10% neutral
buffered formalin for 12–72 h. For companion diagnostics, the PD-L1
IHC 28–8 PharmaDX kit (cat. no. SK005; Dako; Agilent Technologies,
Inc.) for nivolumab and PD-L1 IHC 22C3 PharmaDX kit (cat. no.
SK006; Dako; Agilent Technologies, Inc.) for pembrolizumab were
used, according to the manufacturer's instructions on the
appropriate automated staining devices [Dako Link AS-48 (Dako;
Agilent Technologies, Inc.)]. PD-L1 expression was assessed
quantitatively as the TPS with reference to previously conducted
clinical trials (21,22).
IHC evaluation of CD68-stained area in
tumor tissue
To evaluate the infiltration of macrophages into the
tumor tissue, the tissue specimens were immunostained for CD68
using the IHC-DAB method for the 31 patients whose tissue specimens
were available for analysis. Immunohistological analysis of CD68
expression in cancer tissues was performed using an automated
immunostainer (Bond III; Leica Microsystems, Ltd.) according to the
manufacturer's protocol. Briefly, 3-µm formalin-fixed
paraffin-embedded tissue sections underwent heat-mediated antigen
retrieval using Bond epitope retrieval solution 1 (Leica
Microsystems, Ltd.) at 98°C for 10 min. The sections were incubated
with an anti-CD68 antibody (clone E3O7V; 1:500 dilution; cat. no.
97778; Cell Signaling Technology, Inc.) for 15 min at room
temperature, and the signal was detected using a horseradish
peroxidase-conjugated compact polymer system (BOND Polymer Refine
Detection kit; cat. no. DS9800; Leica Microsystems, Ltd.) and DAB
as the chromogen. The slides were incubated with Post Primary
reagent (adjusted by manufacturer) at room temperature for 8 min,
following which, the slides were incubated with Polymer reagent
(adjusted by manufacturer) as a secondary antibody at room
temperature for an additional 8 min. Visualization with DAB was
performed at room temperature for 10 min. The sections were
counterstained with hematoxylin and viewed under a bright-field
fluorescence microscope. Pathological reviewing of the CD68-stained
tissue specimens was conducted by two independent pathologists. The
BZ-X800 microscope (Keyence Corporation) was used to semi-quantify
CD68+ cells. Tumor tissues were observed with 4×
magnification and three representative fields of view were
selected. The mean value of the three areas occupied by
CD68-stained cells was calculated using the hybrid cell count
function of the all-in-one fluorescence microscope (BZ-X800;
Keyence Corporation), which can objectively quantify the stained
area in the immunostained sections (23).
Statistical analysis
Pearson correlation coefficients were calculated to
analyze the association among the variables. Patient survival
duration was assessed using the Kaplan-Meier analysis and compared
using the log-rank test. A cut-off value was defined using the
receiver operating characteristic (ROC) curve for the Kaplan-Meier
analysis. The comparison of values between the two groups was
conducted using the Mann-Whitney U test. JMP® Pro
(version 15.0; SAS Institute, Inc.) and GraphPad Prism (version
9.4.1; Dotmatics) were used for analyses. All tests performed on
comparisons between the two groups were two-sided. P<0.05 was
considered to indicate a statistically significant difference.
Results
Patient characteristics
The present study included 44 patients with either
gastric cancer, NSCLC or esophageal cancer, and their
characteristics are summarized in Tables I and II. The histopathological types identified
were adenocarcinoma for gastric cancer and squamous cell carcinoma
for esophageal cancer. Regarding NSCLC, 12 patients had
adenocarcinoma, 4 had squamous cell carcinoma and 1 had not
otherwise specified lung cancer. A total of 2/17 patients with
NSCLC were positive for an EGFR mutation (Table SI). The Mann-Whitney U test was
performed to compare gene mutation status and monocyte percentages.
No association between gene mutation status and monocyte
percentages was observed (Fig.
S2).
 | Table I.Clinicopathological features of all
patients (n=44). |
Table I.
Clinicopathological features of all
patients (n=44).
| Case no. | Sex | Age, years | Cancer type | Stage | Performance
status | ICI regimen | ICI administration
cycles | Number of prior
systemic therapy regimens | Radiation therapy
history | Progression-free
survival, months | Overall survival,
months |
|---|
| 1 | M | 78 | NSCLC | IV | 1 | Nivolumab | 98 | 1 | - | 48.4 | 53.4 |
| 2 | M | 64 | NSCLC | IV | 1 | Nivolumab | 3 | 3 | + | 1 | 4.5 |
| 3 | M | 67 | NSCLC | IV | 0 | Nivolumab | 28 | 1 | + | 14.6 | 30.3 |
| 4 | M | 67 | NSCLC | IV | 1 | Nivolumab | 1 | 1 | + | 4.5 | 8.2 |
| 5 | M | 84 | NSCLC | IV | 0 | Nivolumab | 17 | 1 | + | 9 | 32.3 |
| 6 | F | 73 | NSCLC | IV | 1 | Nivolumab | 14 | 1 | - | 8.7 | 23.0 |
| 7 | F | 81 | NSCLC | IV | 1 | Nivolumab | 9 | 1 | - | 4.1 | 20.2 |
| 8 | M | 72 | NSCLC | IV | 1 | Pembrolizumab | 7 | 0 | + | 4.9 | 7.2 |
| 9 | F | 76 | NSCLC | IV | 2 | Pembrolizumab | 1 | 1 | + | 1 | 1.0 |
| 10 | M | 71 | NSCLC | IV | 1 | Pembrolizumab | 16 | 0 | + | 29 | 34.1 |
| 11 | M | 59 | NSCLC | IV | 1 | Pembrolizumab | 1 | 0 | - | 1 | 1.5 |
| 12 | M | 64 | NSCLC | IV | 3 | Pembrolizumab | 9 | 0 | + | 7.2 | 21.0 |
| 13 | M | 70 | NSCLC | IV | 1 | Pembrolizumab | 2 | 0 | + | 1.6 | 1.6 |
| 14 | M | 71 | NSCLC | IV | 2 | Pembrolizumab | 4 | 0 | + | 2.5 | 4.4 |
| 15 | M | 68 | NSCLC | IV | 1 | Pembrolizumab | 37 | 1 | + | 36.3 | 36.3 |
| 16 | M | 65 | NSCLC | IV | 1 | Pembrolizumab | 3 | 0 | - | 21.5 | 24.0 |
| 17 | M | 57 | NSCLC | IV | 1 | Pembrolizumab | 24 | 0 | - | 22.9 | 22.9 |
| 18 | M | 63 | GC | IV | 2 | Nivolumab | 10 | 4 | - | 3.4 | 4.2 |
| 19 | M | 74 | GC | IV | 1 | Nivolumab | 5 | 3 | - | 2.4 | 4.8 |
| 20 | F | 68 | GC | IV | 1 | Nivolumab | 5 | 2 | - | 2.3 | 2.3 |
| 21 | M | 60 | GC | IV | 2 | Nivolumab | 2 | 2 | + | 1.4 | 1.4 |
| 22 | F | 49 | GC | IV | 1 | Nivolumab | 1 | 2 | - | 2.4 | 2.4 |
| 23 | F | 75 | GC | IV | 1 | Nivolumab | 8 | 2 | - | 5.6 | 9.4 |
| 24 | F | 57 | GC | IV | 2 | Nivolumab | 2 | 2 | - | 1.1 | 1.5 |
| 25 | M | 62 | GC | IV | 2 | Nivolumab | 3 | 2 | - | 2.1 | 2.1 |
| 26 | M | 67 | GC | IV | 1 | Nivolumab | 4 | 2 | - | 2.3 | 4.2 |
| 27 | M | 77 | GC | IV | 1 | Nivolumab | 2 | 2 | - | 0.9 | 1.4 |
| 28 | M | 72 | GC | IV | 2 | Nivolumab | 4 | 2 | - | 1.6 | 2.7 |
| 29 | M | 73 | GC | IV | 1 | Nivolumab | 4 | 1 | + | 2.5 | 7.4 |
| 30 | F | 71 | GC | IV | 1 | Nivolumab | 5 | 2 | - | 2.5 | 4.9 |
| 31 | M | 60 | GC | IV | 2 | Nivolumab | 3 | 2 | - | 2.1 | 2.8 |
| 32 | M | 75 | GC | IV | 1 | Nivolumab | 31 | 2 | - | 13.8 | 13.8 |
| 33 | M | 82 | GC | IV | 1 | Nivolumab | 9 | 1 | - | 4 | 6.1 |
| 34 | M | 58 | GC | IV | 2 | Pembrolizumab | 2 | 1 | + | 1.3 | 7.8 |
| 35 | F | 73 | GC | IV | 2 | Nivolumab | 14 | 2 | - | 7.3 | 7.9 |
| 36 | M | 71 | GC | IV | 1 | Nivolumab | 4 | 2 | - | 4.7 | 6.7 |
| 37 | M | 75 | GC | IV | 1 | Nivolumab | 3 | 1 | - | 1.9 | 1.9 |
| 38 | M | 73 | EC | IV | 2 | Nivolumab | 4 | 1 | - | 2.3 | 4.2 |
| 39 | M | 64 | EC | IV | 1 | Nivolumab | 6 | 0 | + | 4.7 | 10.2 |
| 40 | F | 67 | EC | IV | 2 | Nivolumab | 4 | 1 | + | 2.1 | 3.2 |
| 41 | M | 74 | EC | IV | 1 | Nivolumab | 4 | 1 | - | 1.8 | 2.2 |
| 42 | M | 74 | EC | IV | 1 | Nivolumab | 4 | 0 | - | 1.4 | 9.0 |
| 43 | M | 66 | EC | IV | 1 | Nivolumab | 3 | 1 | + | 1.3 | 9.1 |
| 44 | M | 72 | EC | IV | 1 | Nivolumab | 24 | 0 | - | 10.3 | 10.3 |
| Table II.Summary of the clinicopathological
features of all patients (n=44). |
Table II.
Summary of the clinicopathological
features of all patients (n=44).
| Clinicopathological
characteristics | Total |
|---|
| Mean age ± SD,
years | 69.1±7.22 |
| Sex, n |
|
|
Male | 34 |
|
Female | 10 |
| Cancer type, n |
|
|
Non-small cell lung
cancer | 17 |
| Gastric
cancer | 20 |
|
Esophageal cancer | 7 |
| Performance status,
n |
|
| 0 | 2 |
| 1 | 29 |
| 2 | 12 |
| 3 | 1 |
| Type of ICIs,
n |
|
|
Nivolumab | 33 |
|
Pembrolizumab | 11 |
| Median no. of ICI
administration cycles (minimum-maximum) | 10 (1–98) |
| Median
progression-free survival time, months (minimum-maximum) | 3.0 (0.9–51.0) |
| Median overall
survival time, months (minimum-maximum) | 6.4 (1.4–53.4) |
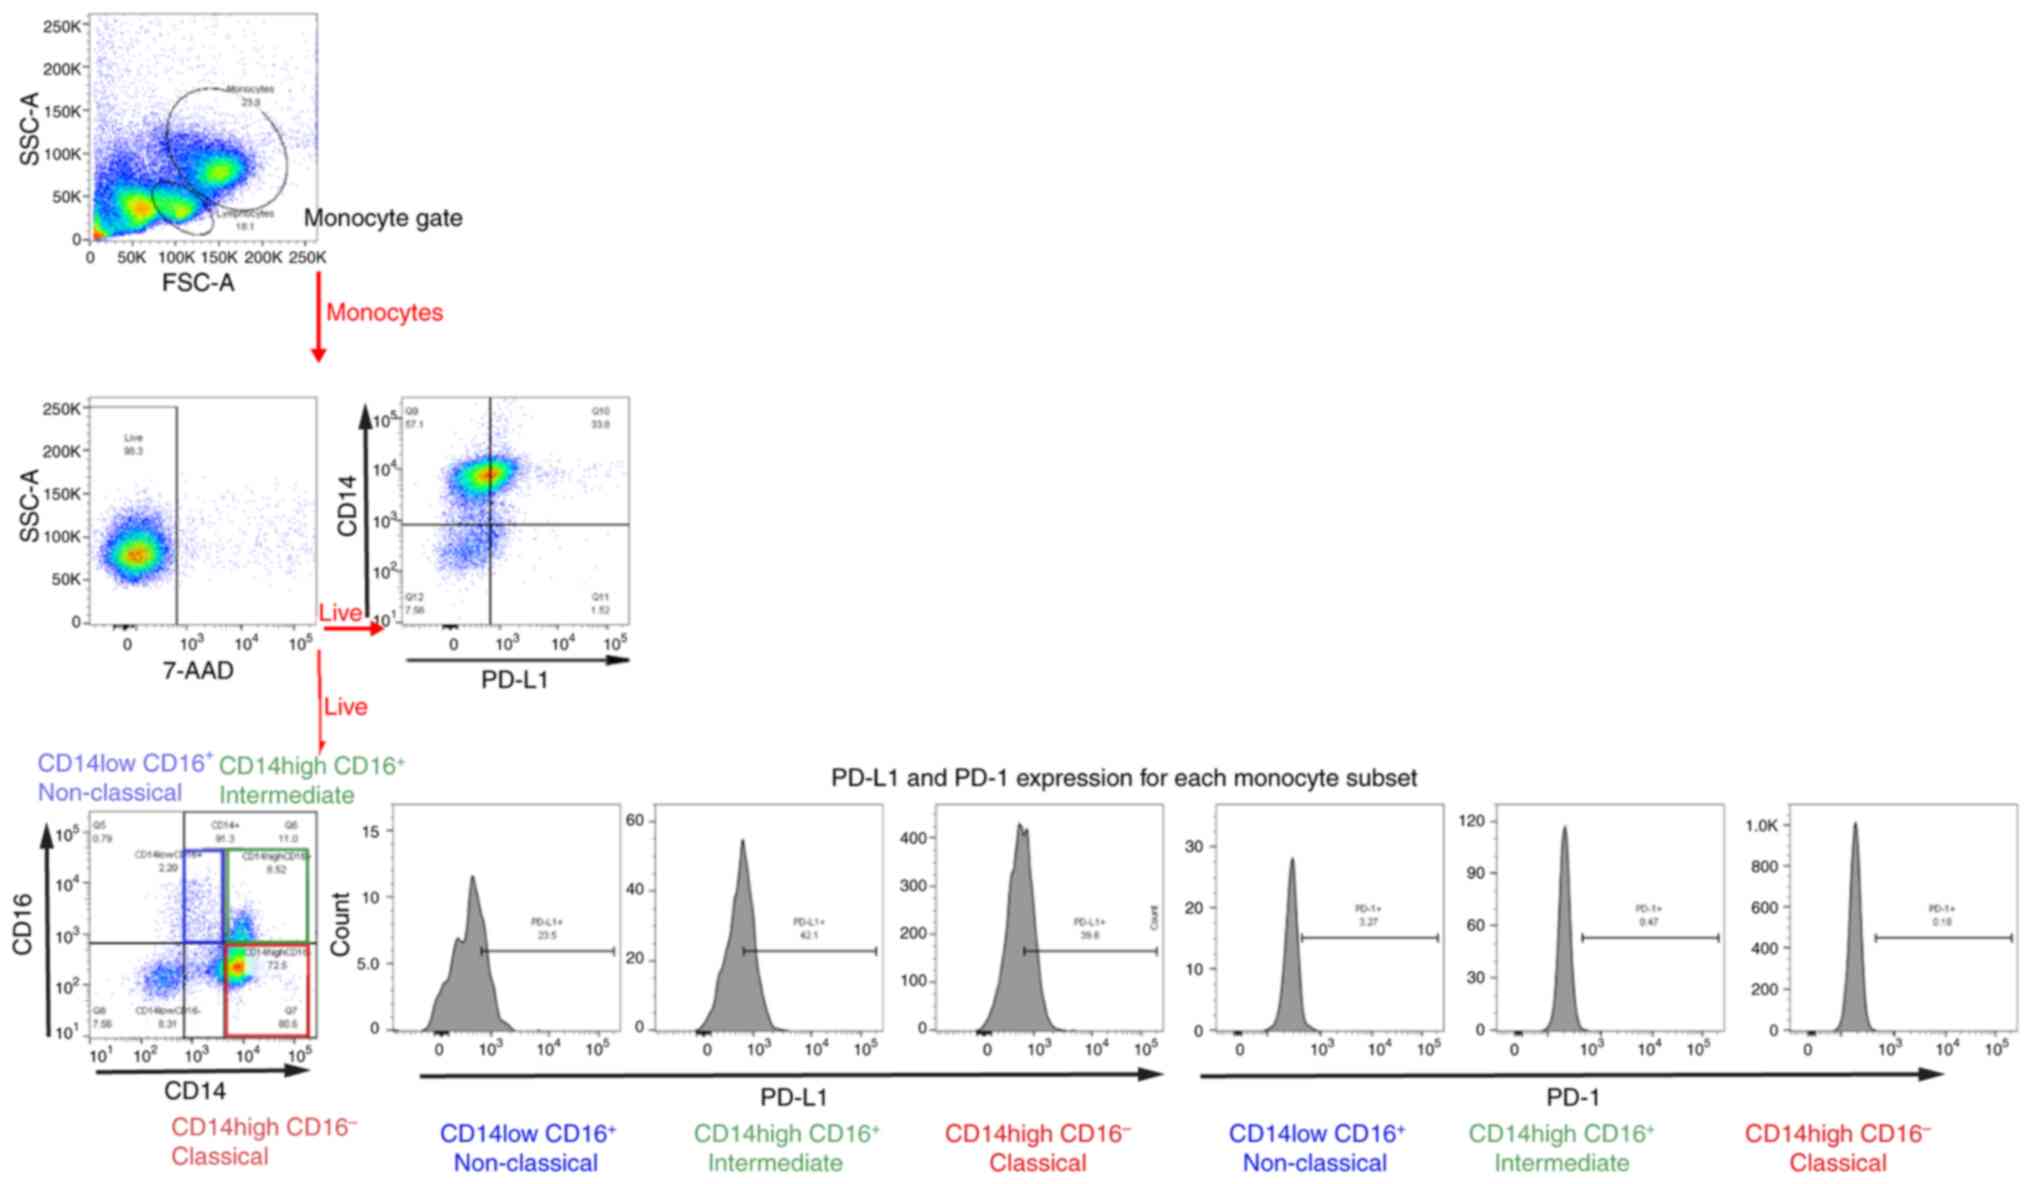
Flow cytometric analysis of each
subset of peripheral monocytes and their respective
percentages
Monocytes in human peripheral blood are
heterogeneous and categorized into three subsets based on their
CD14 and CD16 expression levels. In the present study, monocytes
were gated according to their size and granularity in forward and
side scatter plots using flow cytometry (Fig. 1). Classical monocytes expressed high
CD14 but no CD16 (CD14++ CD16−), intermediate
monocytes expressed CD16 and high CD14 (CD14++
CD16+), and non-classical monocytes expressed CD16 but
lower CD14 than intermediate monocytes (CD14+
CD16+; Fig. 1). The
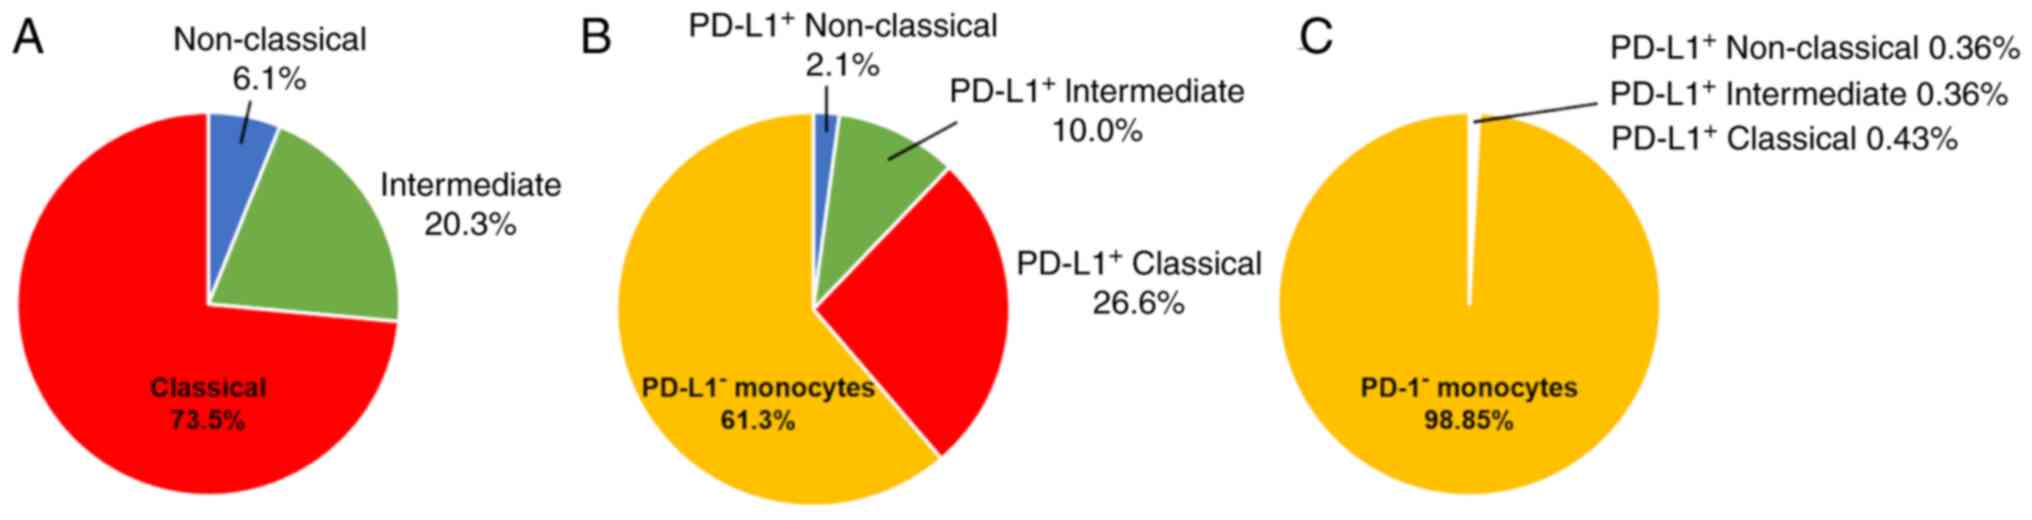
percentage of monocytes in each of the three subsets is shown in
Table SII. The percentages of
classical, intermediate and non-classical monocytes were 73.5, 20.3
and 6.1%, respectively (Fig. 2A),
which is similar to previously reported results (18).
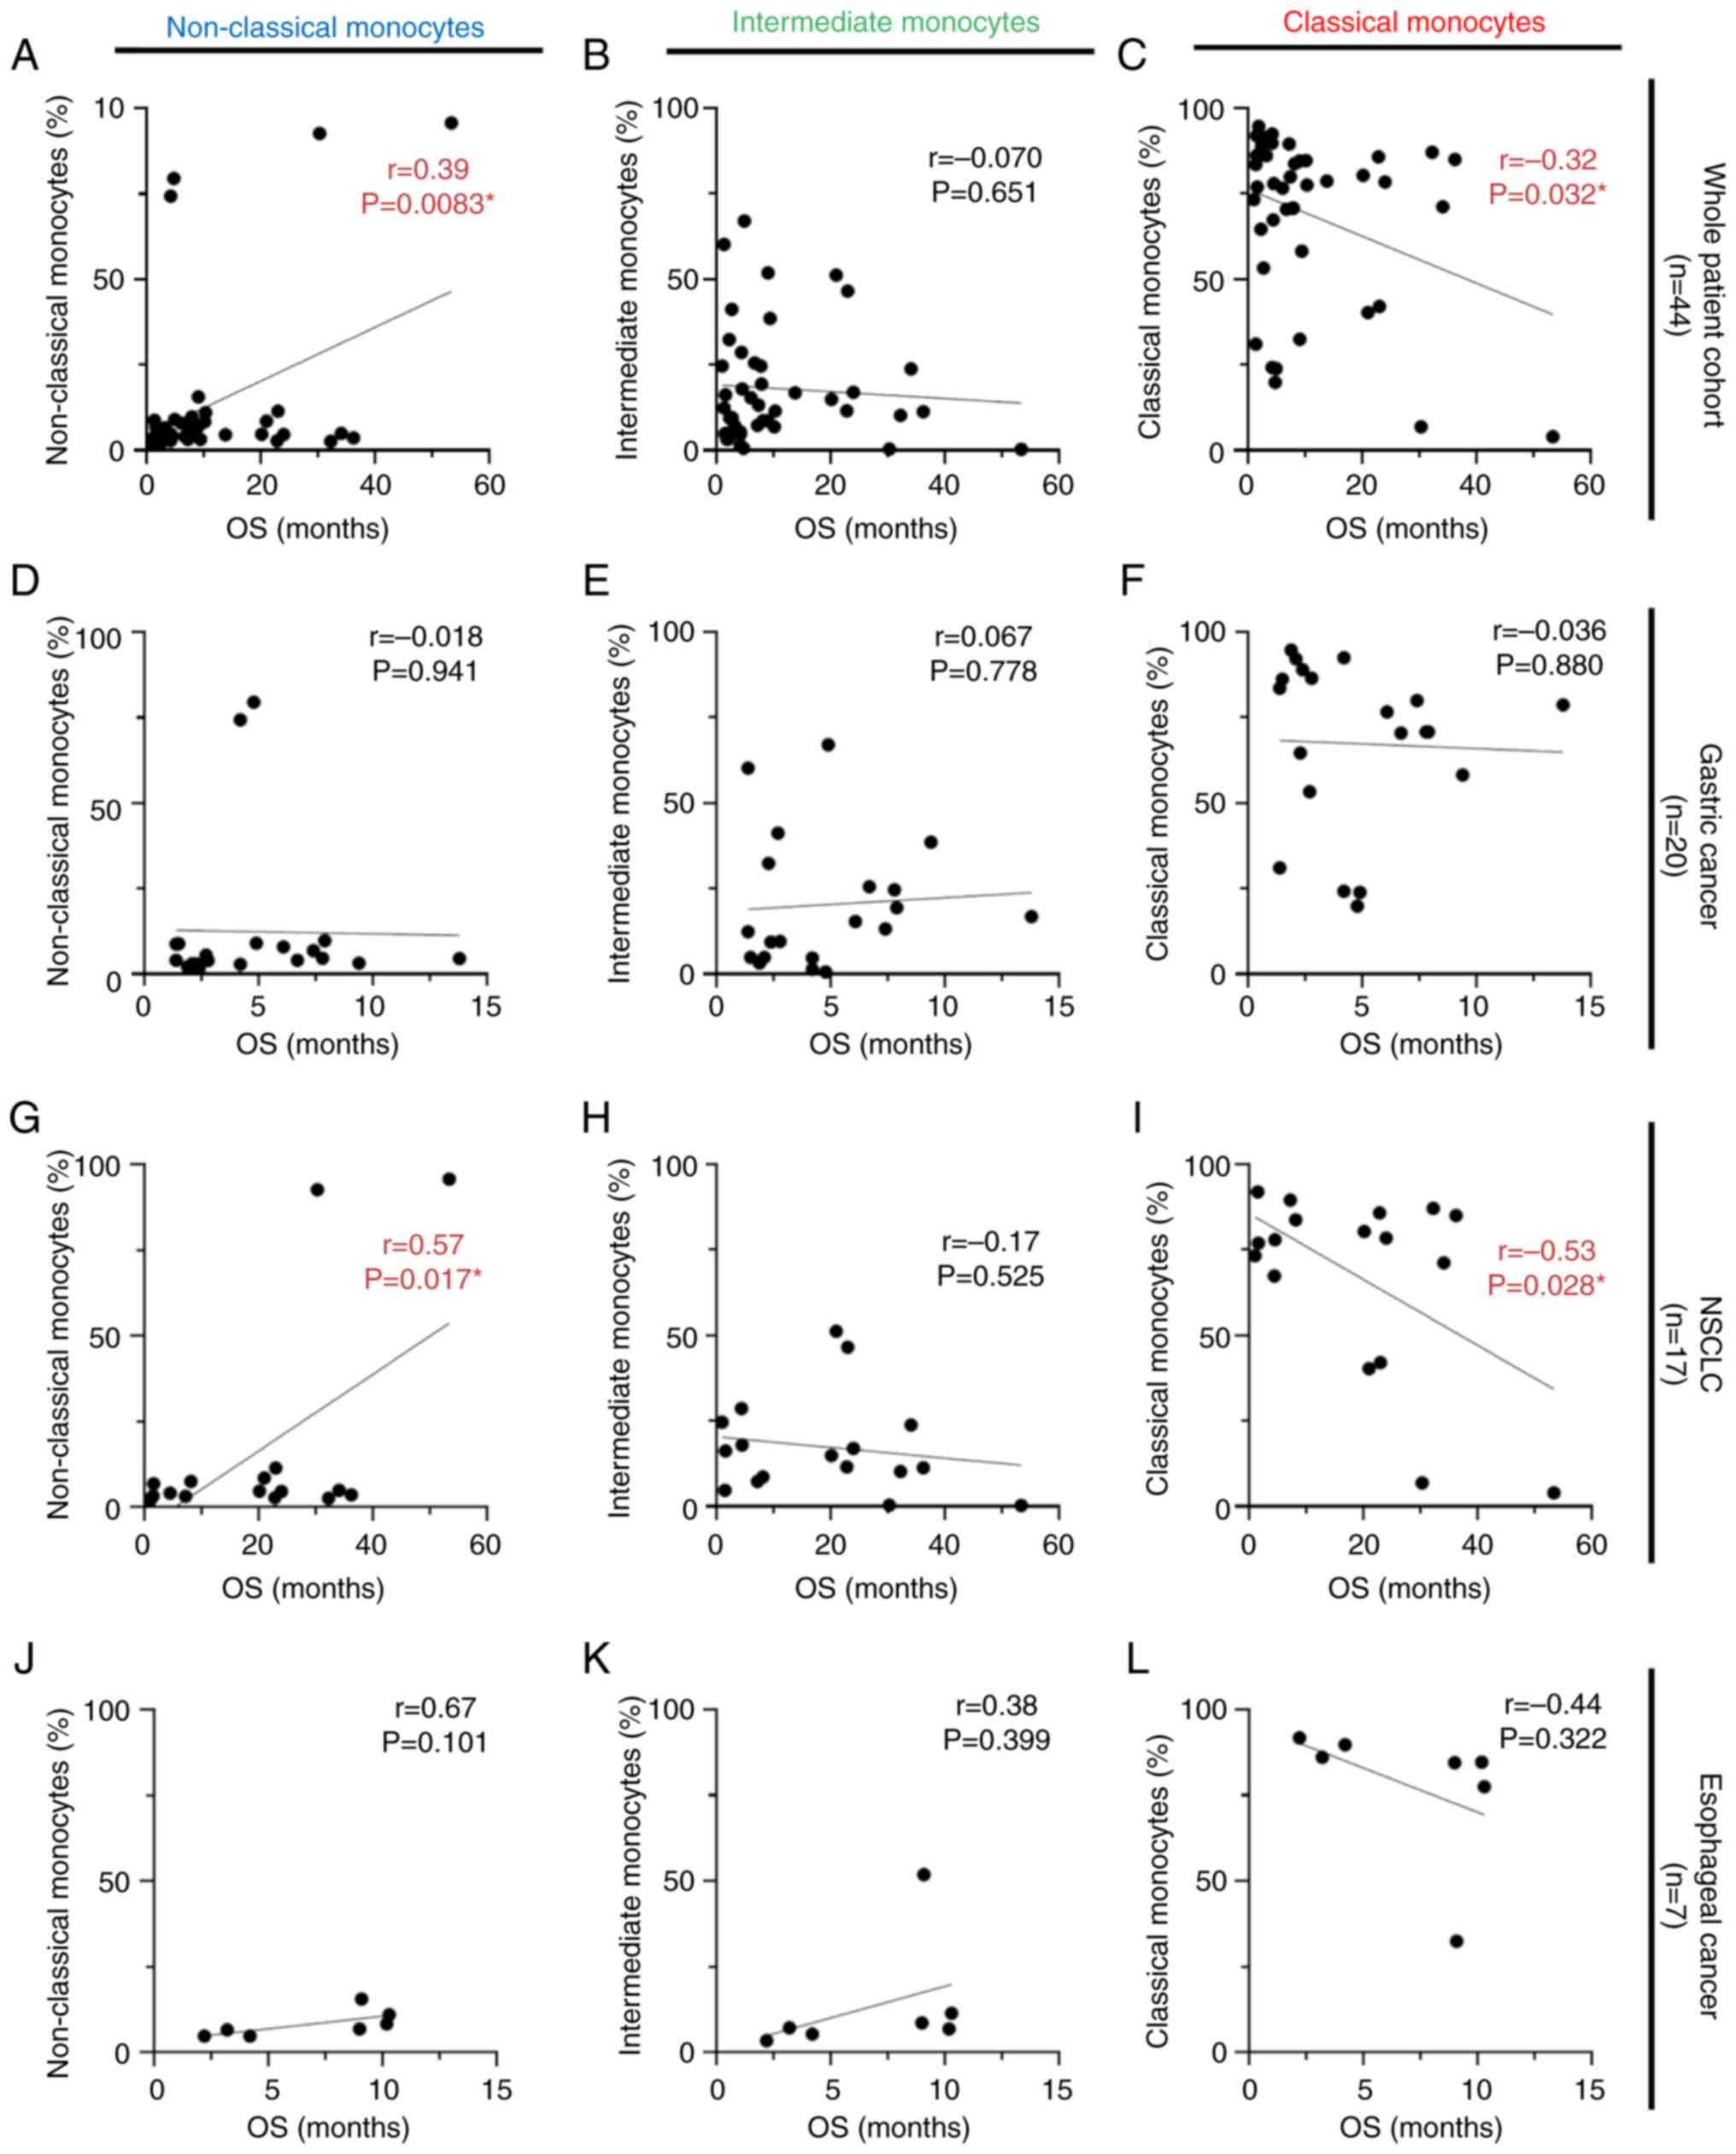
Correlation between each monocyte
subset and survival outcomes in patients with cancer receiving
anti-PD-1 antibody monotherapy
In the whole patient cohort (n=44), higher
percentages of non-classical monocytes were statistically
correlated with longer OS (r=0.39; P=0.0083; Fig. 3A). By contrast, a negative
correlation was simultaneously obtained for classical monocytes;
higher percentages of classical monocytes were significantly
correlated with shorter OS (r=−0.32; P=0.032; Fig. 3C). Additional analyses were
performed separately for each type of cancer. In patients with
gastric cancer (n=20) and esophageal cancer (n=7), no correlation
was shown between each monocyte subset and OS (Fig. 3D-F and J-L). Focusing on patients
with NSCLC (n=17), results demonstrated the same trend in the
monocyte populations as for the whole patient cohort. However, a
stronger correlation was observed between classical monocytes of
patients with NSCLC and shorter OS (r=−0.53; P=0.028; Fig. 3I), whereas a higher percentage of
non-classical monocytes was significantly related to longer OS
(r=0.57; P=0.017; Fig. 3G). There
was no correlation between the intermediate monocyte subset and OS
(Fig. 3B, E, H and K). Statistical
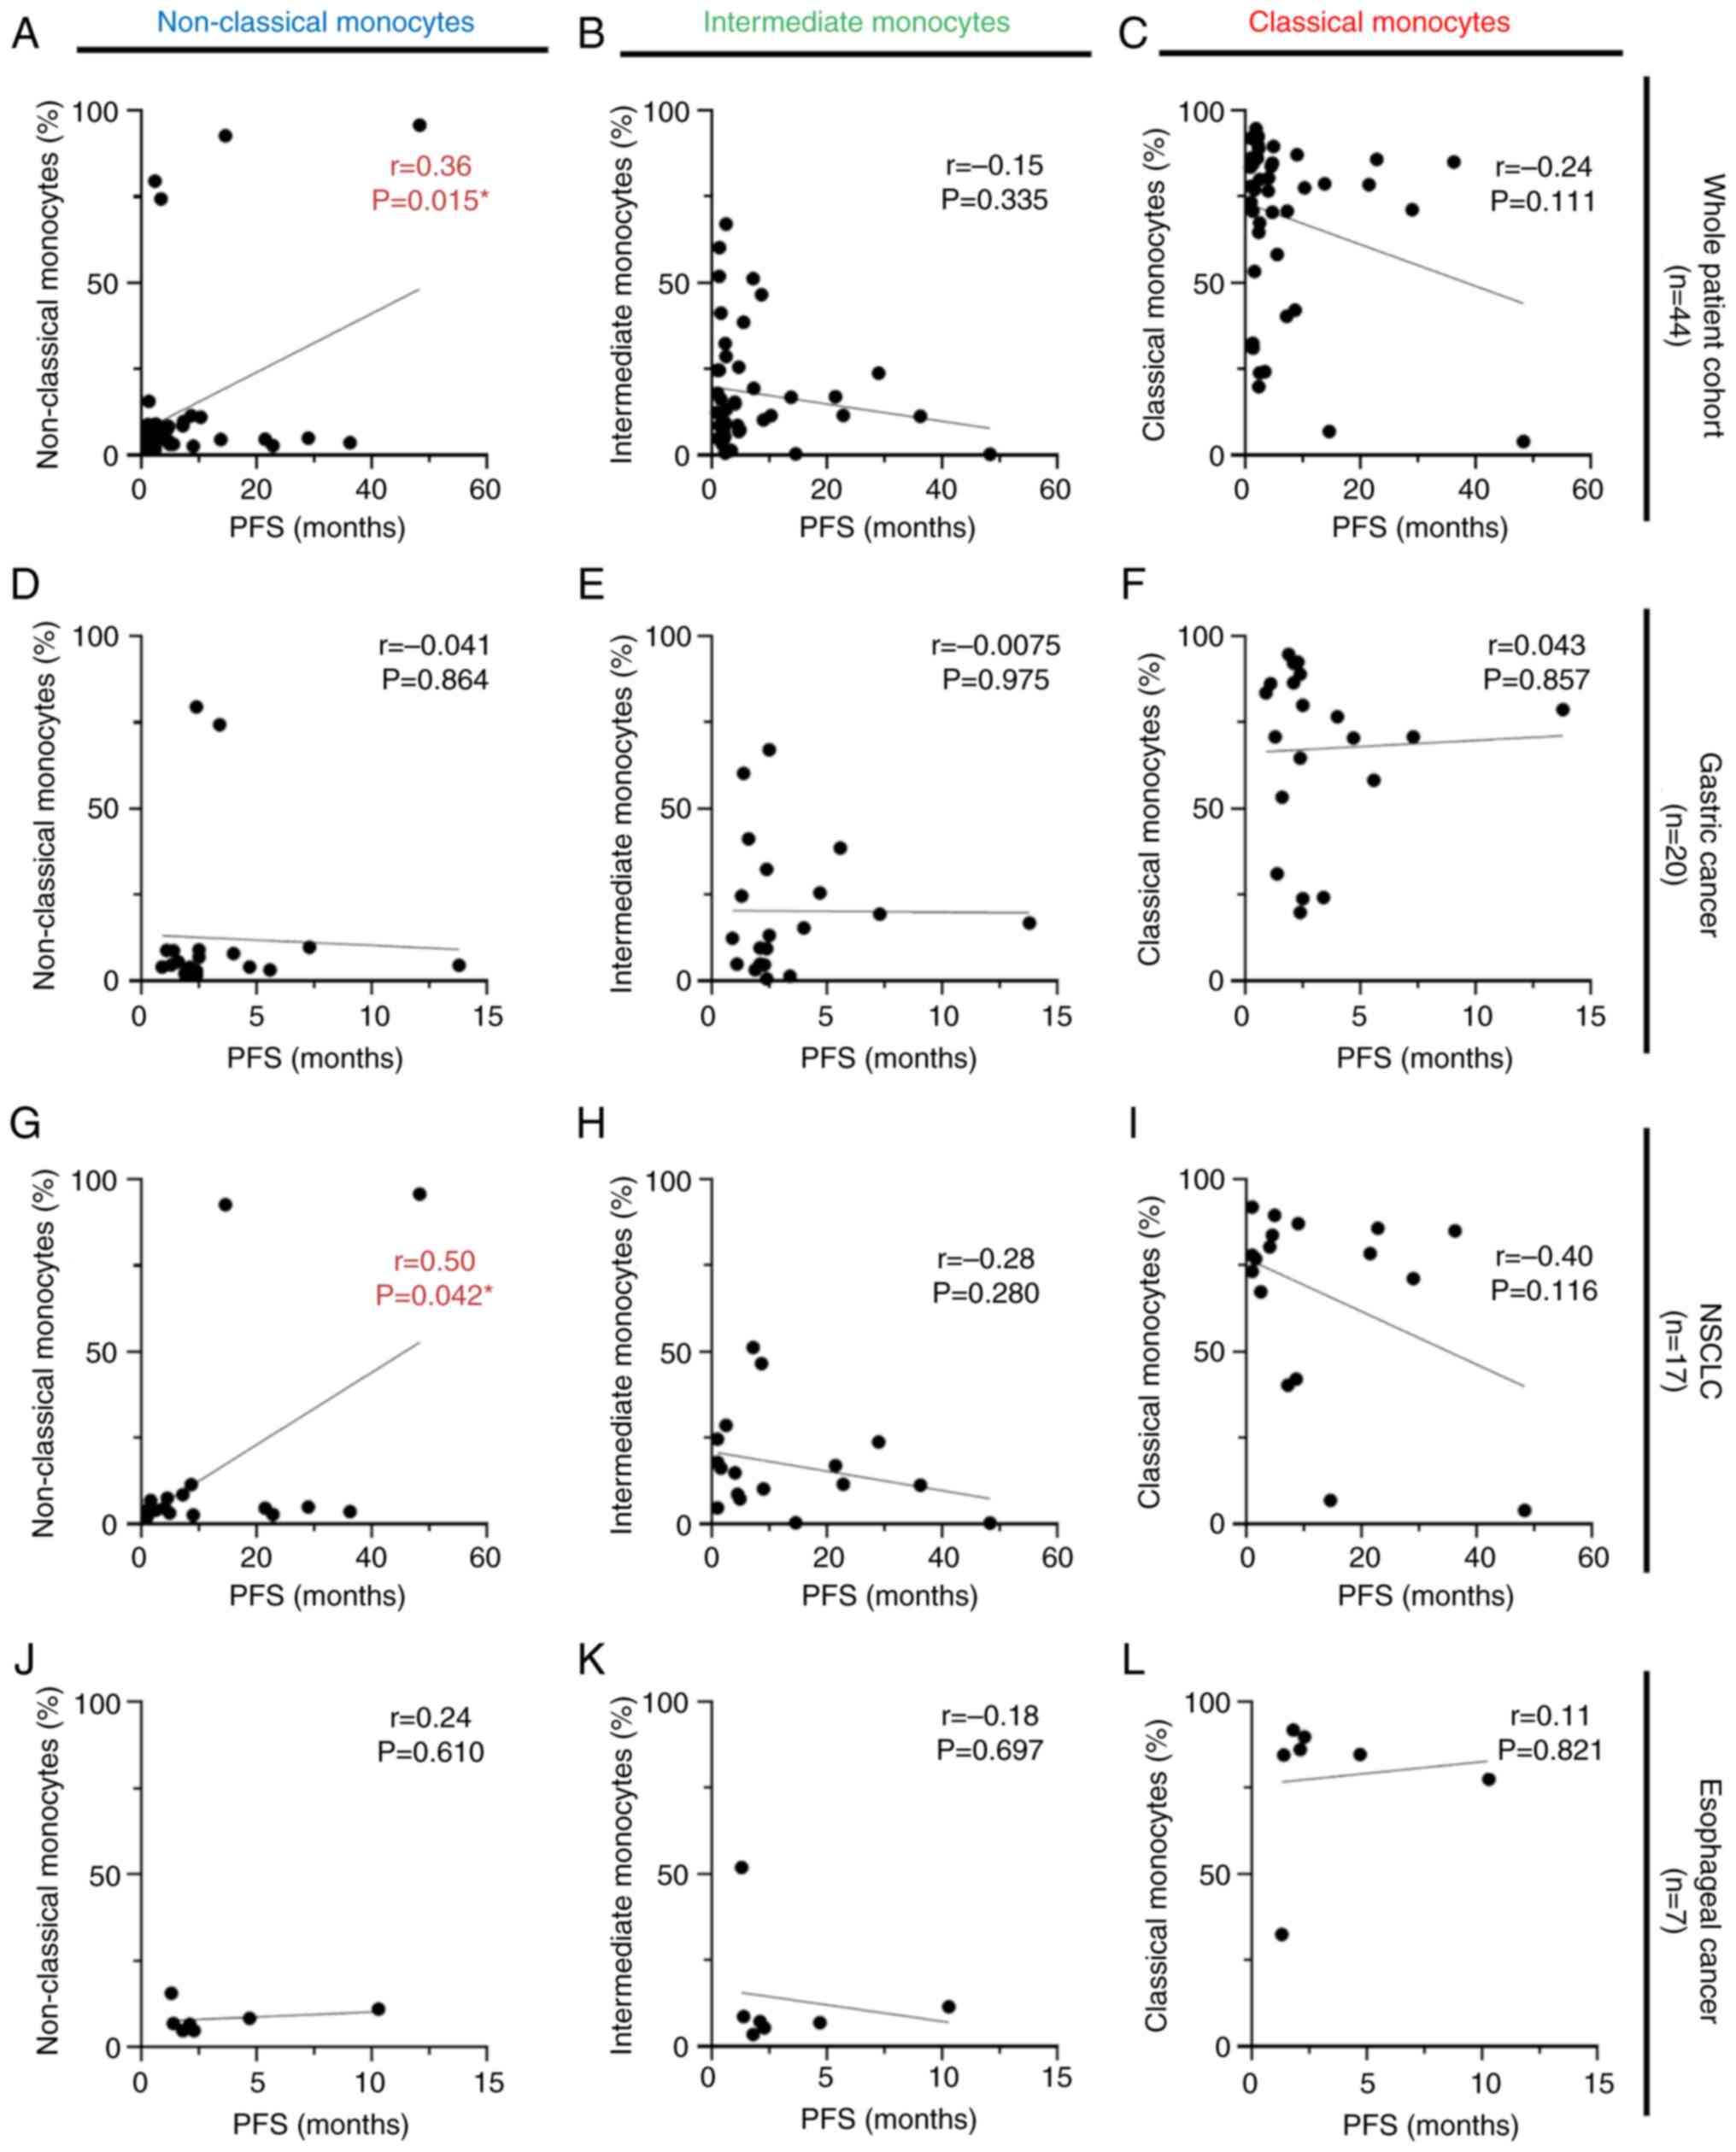
analysis was performed using the same strategy for PFS. There were
positive correlations between non-classical monocyte subsets and
PFS in the whole patient cohort and patients with NSCLC (r=0.36;
P=0.015; Fig. 4A, and r=0.50;
P=0.042; Fig. 4G, respectively). No
statistical correlation was observed between the other monocyte
subsets and PFS for any of the cancer types investigated (Fig. 4B-F and H-L).
Flow cytometric analysis of each
subset of peripheral monocytes expressing the immune checkpoints
(PD-L1 and PD-1) and their respective percentages
The expression of PD-L1 and PD-1 in each monocyte
subset was analyzed by flow cytometry. The percentage of
PD-L1-expressing cells in each monocyte subset was investigated
(Table SIII). In terms of the
percentage of monocytes that expressed PD-L1, classical monocytes
were the most common (26.6% of all monocytes), followed by
intermediate (10.0% of all monocytes) and non-classical monocytes
(2.1% of all monocytes; Fig. 2B).
For those monocytes expressing PD-L1, the classical monocyte subset
expressing PD-L1 accounted for a larger percentage compared with
the others. The percentage of PD-L1+ intermediate or
non-classical monocytes was lower than that of PD-L1+
classical monocytes. Similarly, the percentage of monocytes
expressing PD-1 within each monocyte subset is listed in Table SIV. A total of <2% of the sum of
the three monocyte subsets expressed PD-1 (Fig. 2C), indicating that the percentage of
monocytes expressing PD-1 was lower than that of the monocytes
expressing PD-L1.
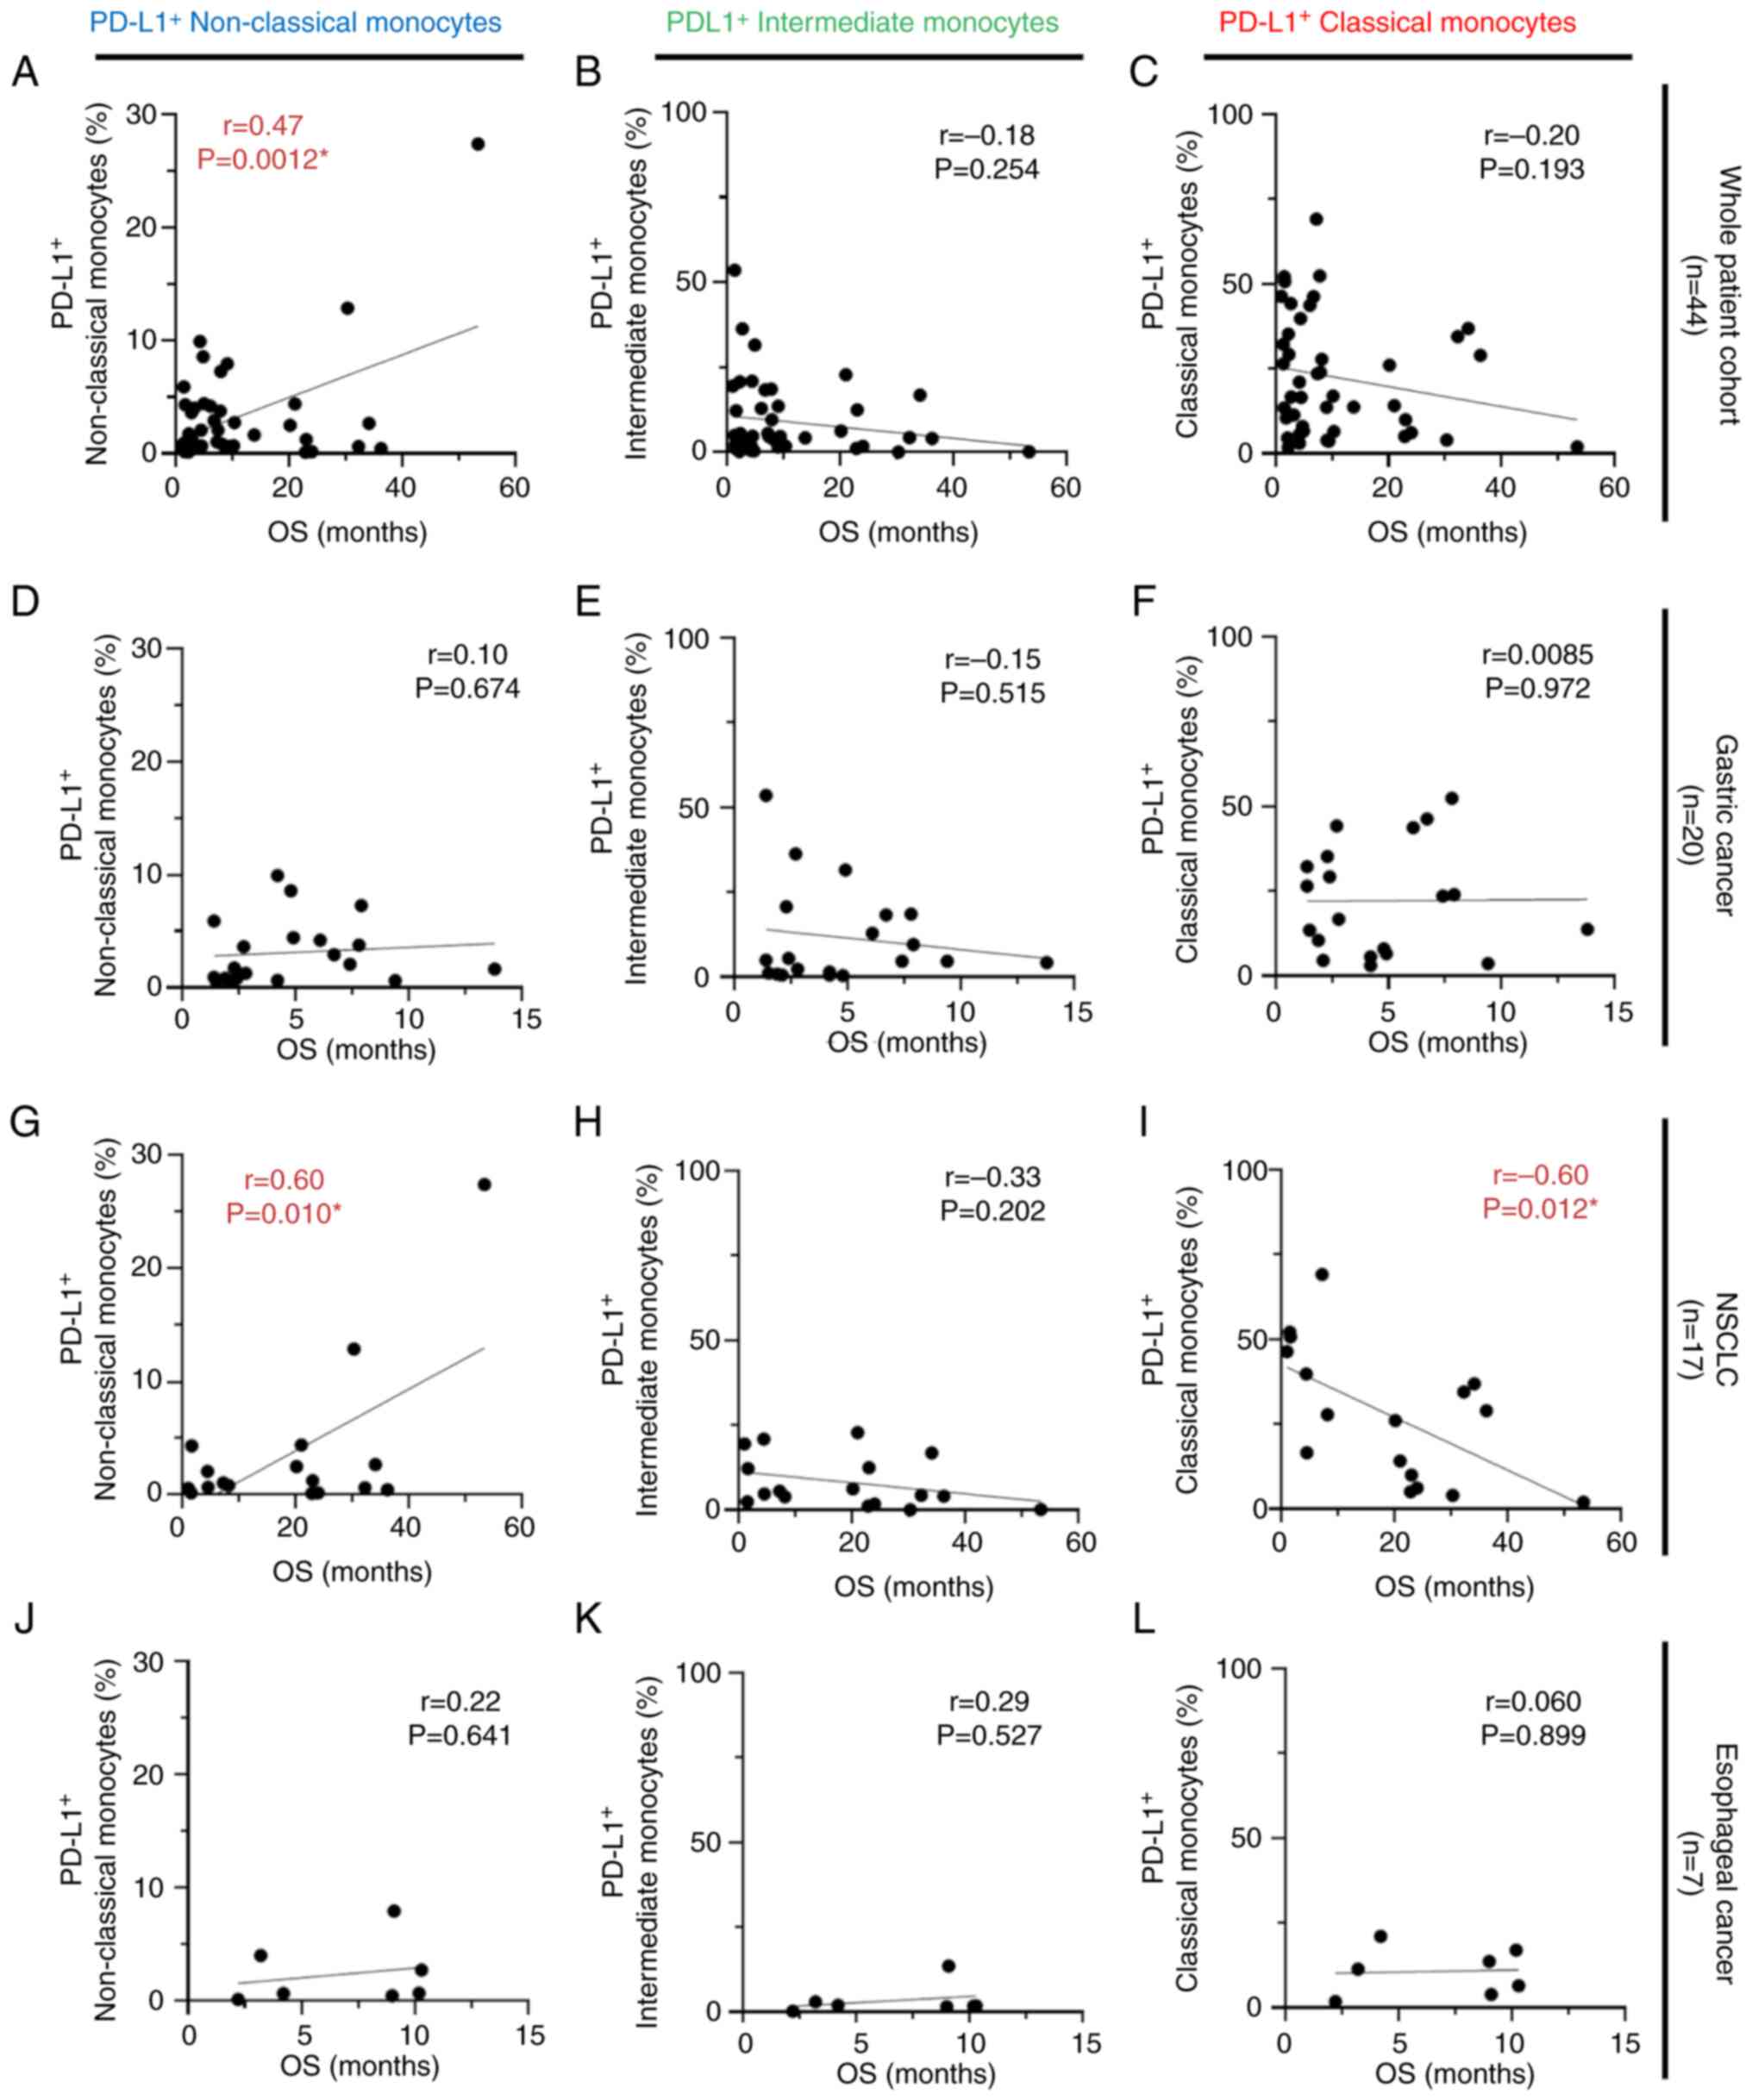
Correlation between PD-L1-expressing
monocytes and survival outcomes in patients with cancer receiving
anti-PD-1 antibody monotherapy
Within the whole patient cohort (n=44) and the NSCLC
cohort (n=17), positive correlations were observed between
PD-L1-expressing non-classical monocytes and OS (r=0.47; P=0.0012;
Fig. 5A, and r=0.60; P=0.010;
Fig. 5G, respectively). By
contrast, higher percentages of PD-L1-expressing classical
monocytes in the NSCLC cohort were statistically correlated with
shorter OS (r=−0.60; P=0.012; Fig.
5I). No significant correlation was observed between each
subset of PD-L1-expressing monocytes and OS in the gastric cancer
group (n=20; Fig. 5D-F) and
esophageal cancer group (n=7; Fig.
5J-L). No correlation was observed between the
PD-L1+ intermediate monocyte subset and OS (Fig. 5B, E, H and K). Moreover, statistical
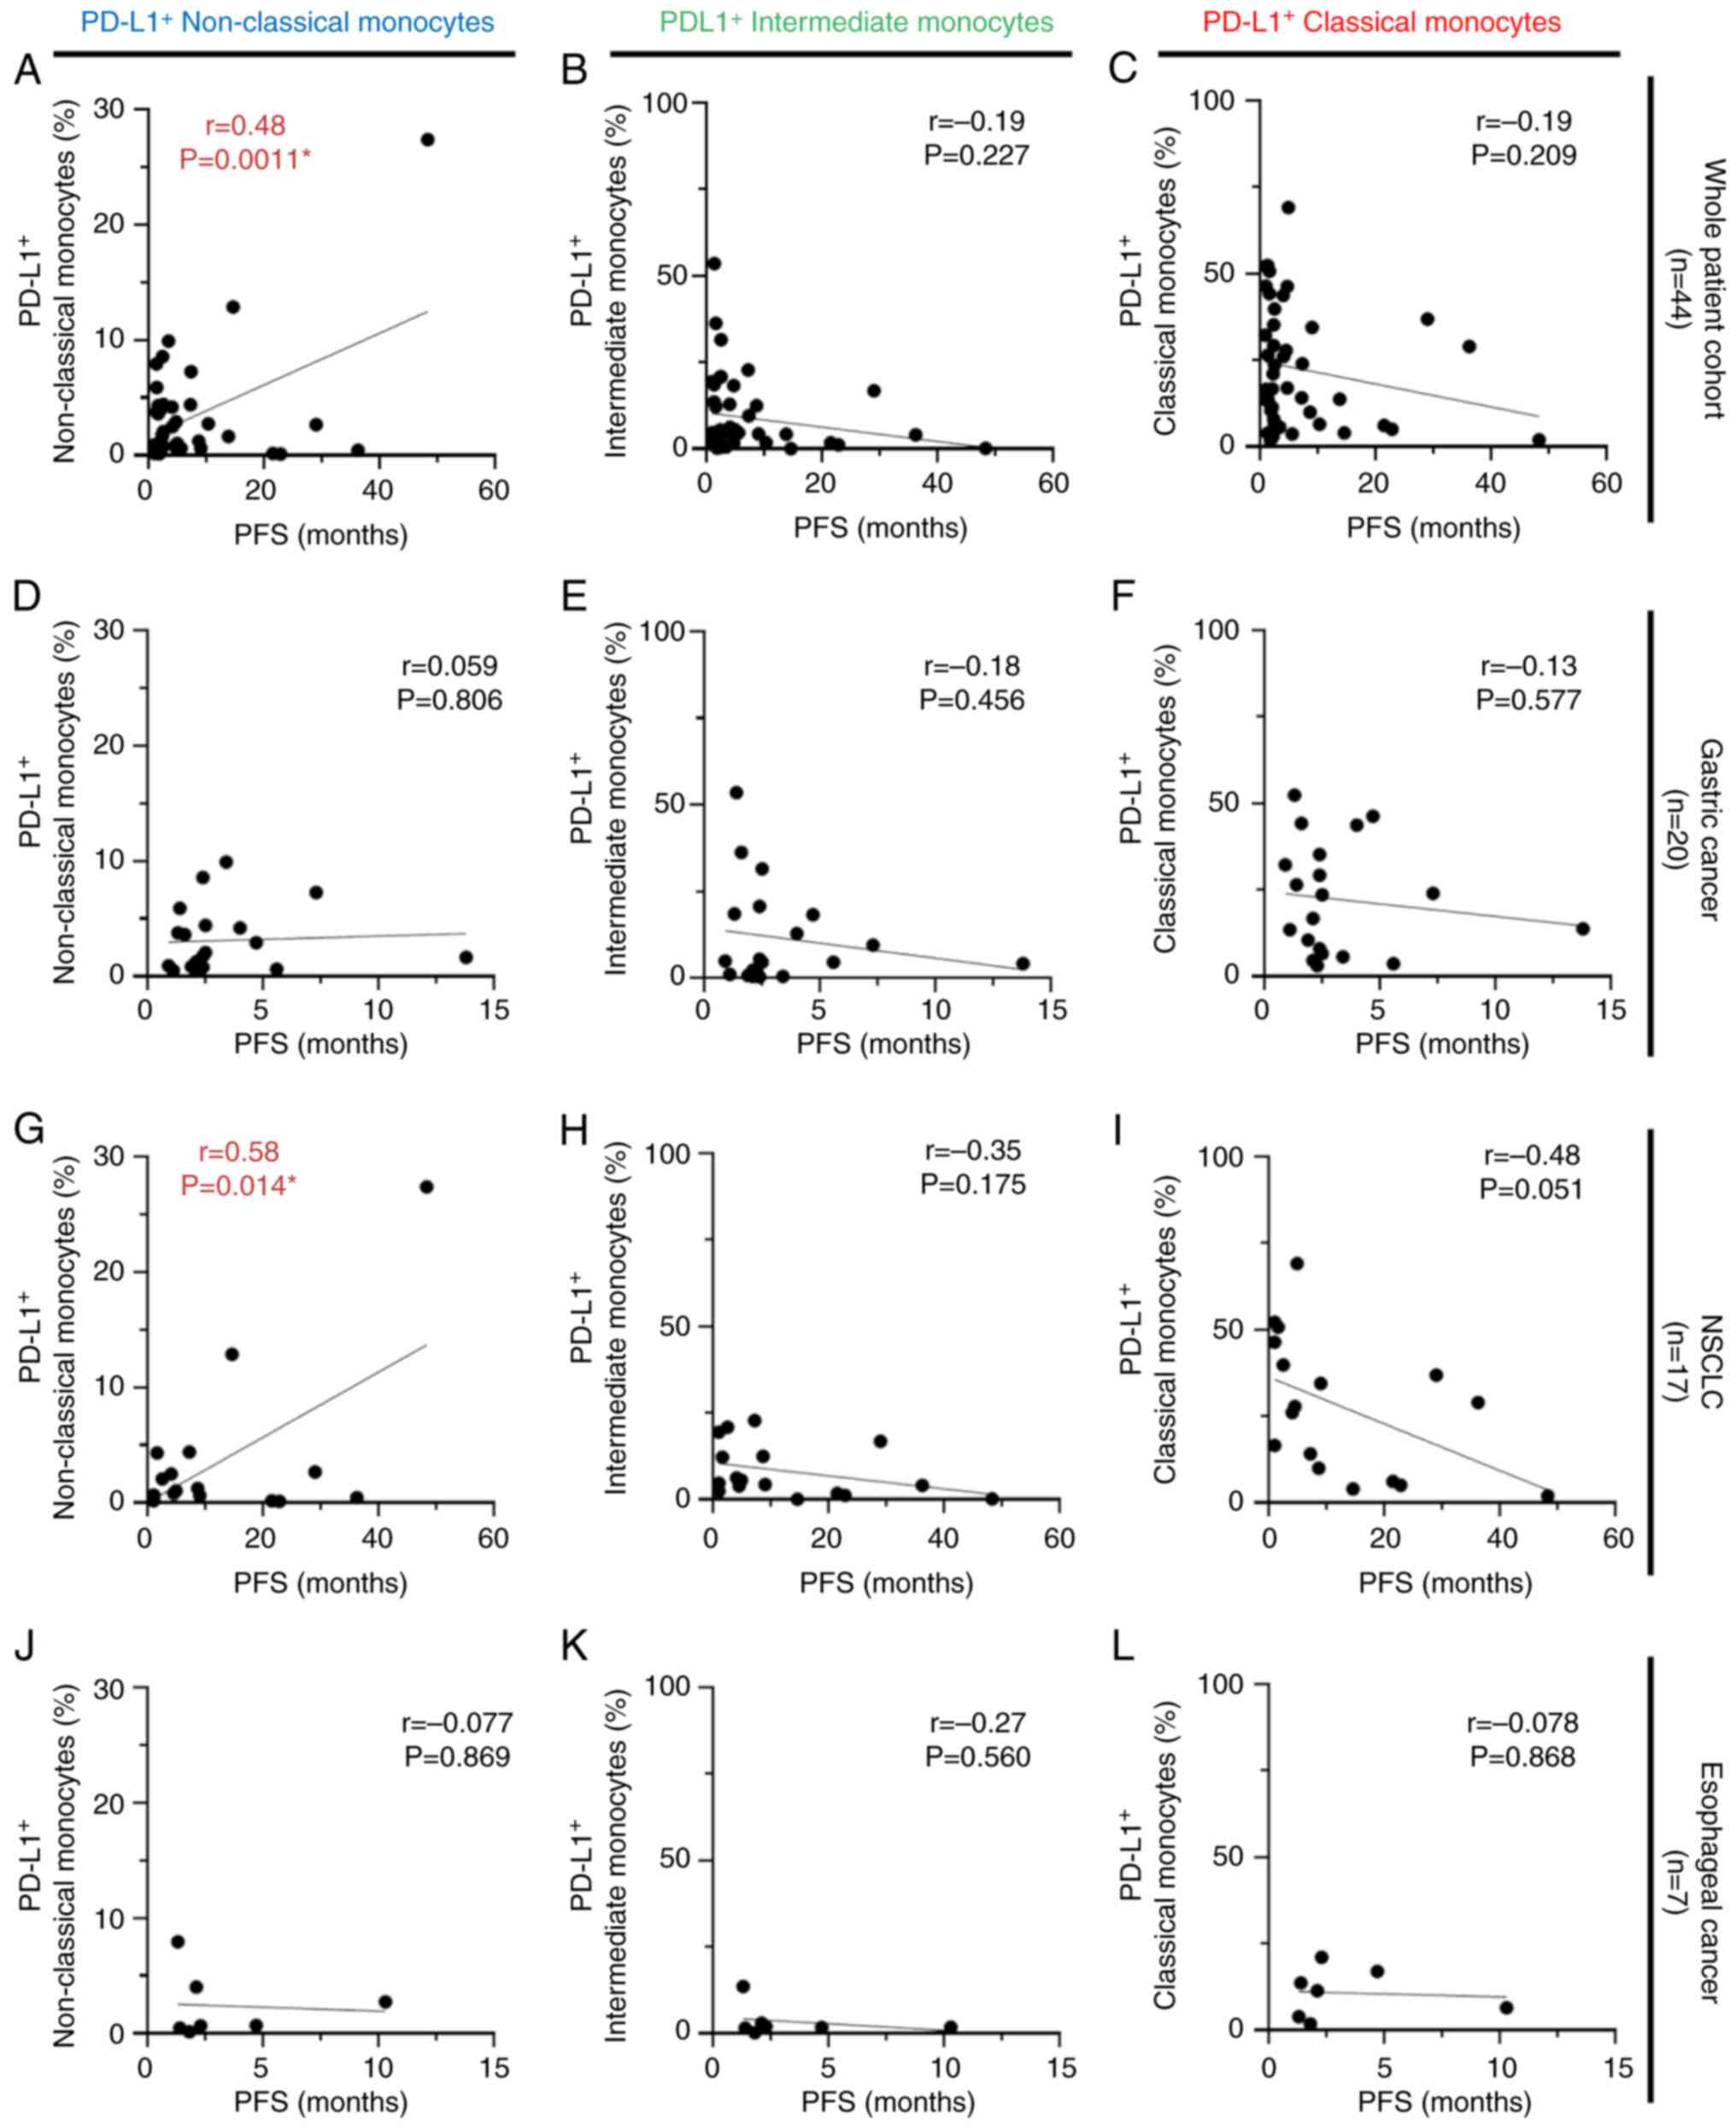
analyses were performed using the same strategy for PFS, and
similar trends were obtained as in the relationship between
PD-L1-expressing monocytes and OS. Within the whole patient cohort
(n=44), and particularly patients with NSCLC (n=17), a positive
correlation was observed between PD-L1-expressing non-classical
monocytes and PFS (r=0.48; P=0.0011; Fig. 6A, and r=0.58; P=0.014; Fig. 6G, respectively). No significant
correlation between PD-L1-expressing intermediate and classical
monocyte subsets and PFS was identified (Fig. 6B, C, E, F, H, I, K and L). Regarding
PD-L1-expressing classical monocytes, higher PD-L1-expressing
classical monocytes tended to be correlated with shorter PFS times
only in patients with NSCLC (r=−0.48; P=0.051; Fig. 6I).
Correlation between PD-1-expressing
monocytes and survival outcomes in patients with cancer receiving
anti-PD-1 antibody monotherapy
In the whole patient cohort (n=44), no correlation
was observed between any of the subsets of PD-1-expressing
monocytes and OS (Fig. S3A-C). For
the NSCLC cohort (n=17), both PD-1-expressing intermediate and
classical monocytes showed significant results; higher percentages
of PD-1-expressing monocytes were correlated with a shorter OS
(r=−0.53; P=0.029; Fig. S3H, and
r=−0.41; P=0.022; Fig. S3I,
respectively). No statistically significant correlations were found
for the cohort of patients with either gastric or esophageal cancer
(Fig. S3D-F and J-L) or for the
PD-1+ classical monocytes of the NSCLC cohort (Fig. S3G). Similar analyses were also
performed for PFS. There were no correlations between any of the
subsets of PD-1-expressing monocytes and PFS (Fig. S4A-L).
Survival time analysis using the
Kaplan-Meier method
Survival analyses using the Kaplan-Meier method were
additionally performed to determine the association between the
percentage of each monocyte subset and OS. A cut-off value was
defined using the ROC curve, and patients were divided into two
groups, namely ‘high’ and ‘low’, for each subset of monocytes
(Fig. S5A-I). The results of the
survival time analysis showed that high percentages of classical
monocytes were associated with a shorter OS in the whole patient
cohort and in the cohort of patients with NSCLC (P=0.0015; Fig. S6C, and P=0.037; Fig. S6I, respectively), but no
significant results were obtained for patients with either gastric
or esophageal cancer (Fig. S6F and
L). In addition, no significant findings were observed for
either the non-classical or intermediate monocytes and OS (Fig. S6A, B, D, E, G, H, J and K).
Survival analysis was performed using the same methods for PD-L1-
and PD-1-expressing monocytes. Similarly, for the whole patient
cohort and patients with NSCLC, high percentages of classical
monocytes expressing PD-L1 were associated with shorter OS compared
with the low group (P=0.046; Fig.
S7C, and P=0.0073; Fig. S7I),
but no statistically significant difference was obtained for the
PD-L1 expressing non-classical and intermediate monocytes (Fig. S7A, B, D, E, G, H, J and K). In
addition, no significant difference in OS was observed among the
other cancer types compared with that of NSCLC (Fig. S7F and L). Regarding PD-1-expressing
monocytes, high percentages of classical monocytes expressing PD-1
were associated with shorter OS compared with the low group for
patients with NSCLC (P=0.027; Fig.
S8I). There were no other statistically significant differences
between the percentages of PD-1-expressing monocytes and OS
(Fig. S8A-H and J-L).
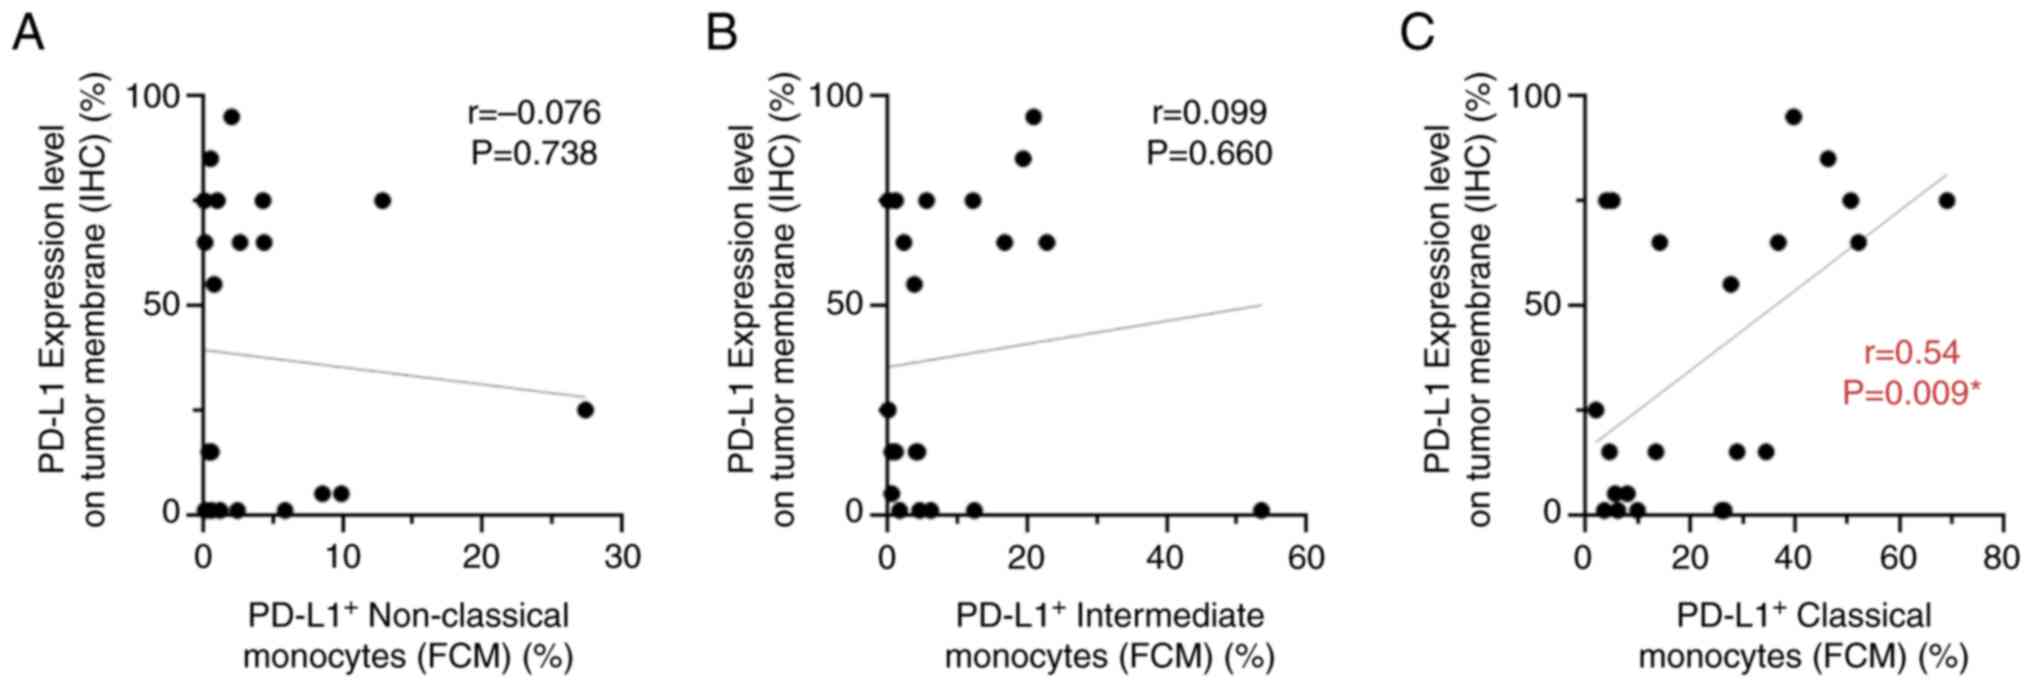
Correlation between PD-L1 expression
on tumor cells and circulating monocytes
The present study aimed to determine whether there
was a significant association between PD-L1 expression on tumor
cells and the percentage of each PD-L1-expressing monocyte subset
in the tissues of 22 patients with either gastric cancer (n=6) or
NSCLC (n=16), in which PD-L1 expression of tumor cells was
investigated in routine clinical settings. PD-L1 expression was
investigated on tumor cell membranes using IHC, in addition to
detecting the percentages of PD-L1-expressing monocyte subsets by
flow cytometry (Table SIII). A
representative image of PD-L1 expression analyzed using IHC is
shown in Fig. S9. The results
showed no significant correlation between immunohistochemical PD-L1
expression on tumor cells and the percentage of either circulating,
PD-L1-expressing non-classical or intermediate monocyte subsets
(Fig. 7A and B). By contrast, a
positive correlation was observed between PD-L1 expression on tumor
cells and the percentage of PD-L1-expressing classical monocytes in
22 patients (r=0.54; P=0.009; Fig.
7C).
Correlation between PD-L1-expressing
monocytes and survival outcome in patients with NSCLC with high
PD-L1 expression on tumor cells
NSCLC is known as a cancer type in which high PD-L1
expression on tumor cells is used as a predictive biomarker for
therapeutic response (21,22); therefore the present study focused
on patients with NSCLC (n=16). The Kaplan-Meier method was used to
assess the relationship between PD-L1 expression on tumor cells
(TPS), and OS and PFS in the high and low PD-L1 expression groups
with PD-L1 cutoffs of 50% (Fig. 8A and
B) and 1% (Fig. 8I and J).
These cut-off values are generally applied in clinical settings for
predicting the efficacy of anti-PD-1 antibodies in treating
patients with NSCLC (21,22). The patients with high PD-L1 (TPS)
≥50% had a more favorable OS than the low PD-L1 expression group
(P=0.0286; Fig. 8A); however, no
significant results were obtained using a cut-off value of 1% for
PD-L1 expression (P=0.870; Fig. 8I)
by Kaplan-Meier survival analysis. No significant association
between PD-L1 (TPS) and PFS was found in either group (P=0.139;
Fig. 8B, and P=0.682; Fig. 8J). Furthermore, patients with high
PD-L1 expression, including those with PD-L1 (TPS) ≥50% (n=10;
Fig. 8C-H) or PD-L1 (TPS) ≥1%
(n=13; Fig. 8K-P) were selected.
The focus was on the high PD-L1 group, and the association between
the percentage of each PD-L1-expressing monocyte subset and OS and
PFS was investigated. In patients with NSCLC whose PD-L1 (TPS) was
≥50%, there was an inverse correlation between PD-L1-expressing
classical monocytes and OS (r=−0.68; P=0.030; Fig. 8E), but not between non-classical and
intermediate monocyte subsets (Fig. 8C
and D). Meanwhile, regarding PD-L1 (TPS) ≥1%, PD-L1-expressing
non-classical monocytes showed a clear positive correlation with
both OS and PFS (r=0.63; P=0.022; Fig.
8K, and r=0.60; P=0.029; Fig.
8N). Conversely, higher PD-L1-expressing classical monocytes
were significantly correlated with poorer OS and PFS (r=−0.68;
P=0.010; Fig. 8M, and r=−0.58;
P=0.036; Fig. 8P). There was no
correlation between PD-L1-expressing intermediate monocytes and
either PFS or OS (Fig. 8L and O).
PD-L1 expression on tumor cells (TPS) alone is likely inadequate as
a biomarker for predicting therapeutic efficacy, especially when
the PD-L1 cut-off value is 1% (TPS). In light of these results, it
was hypothesized that focusing on the PD-L1-expressing circulating
monocytes in peripheral blood, in addition to PD-L1 expression on
tumor cells (TPS), might improve its usefulness as a predictive and
prognostic biomarker.
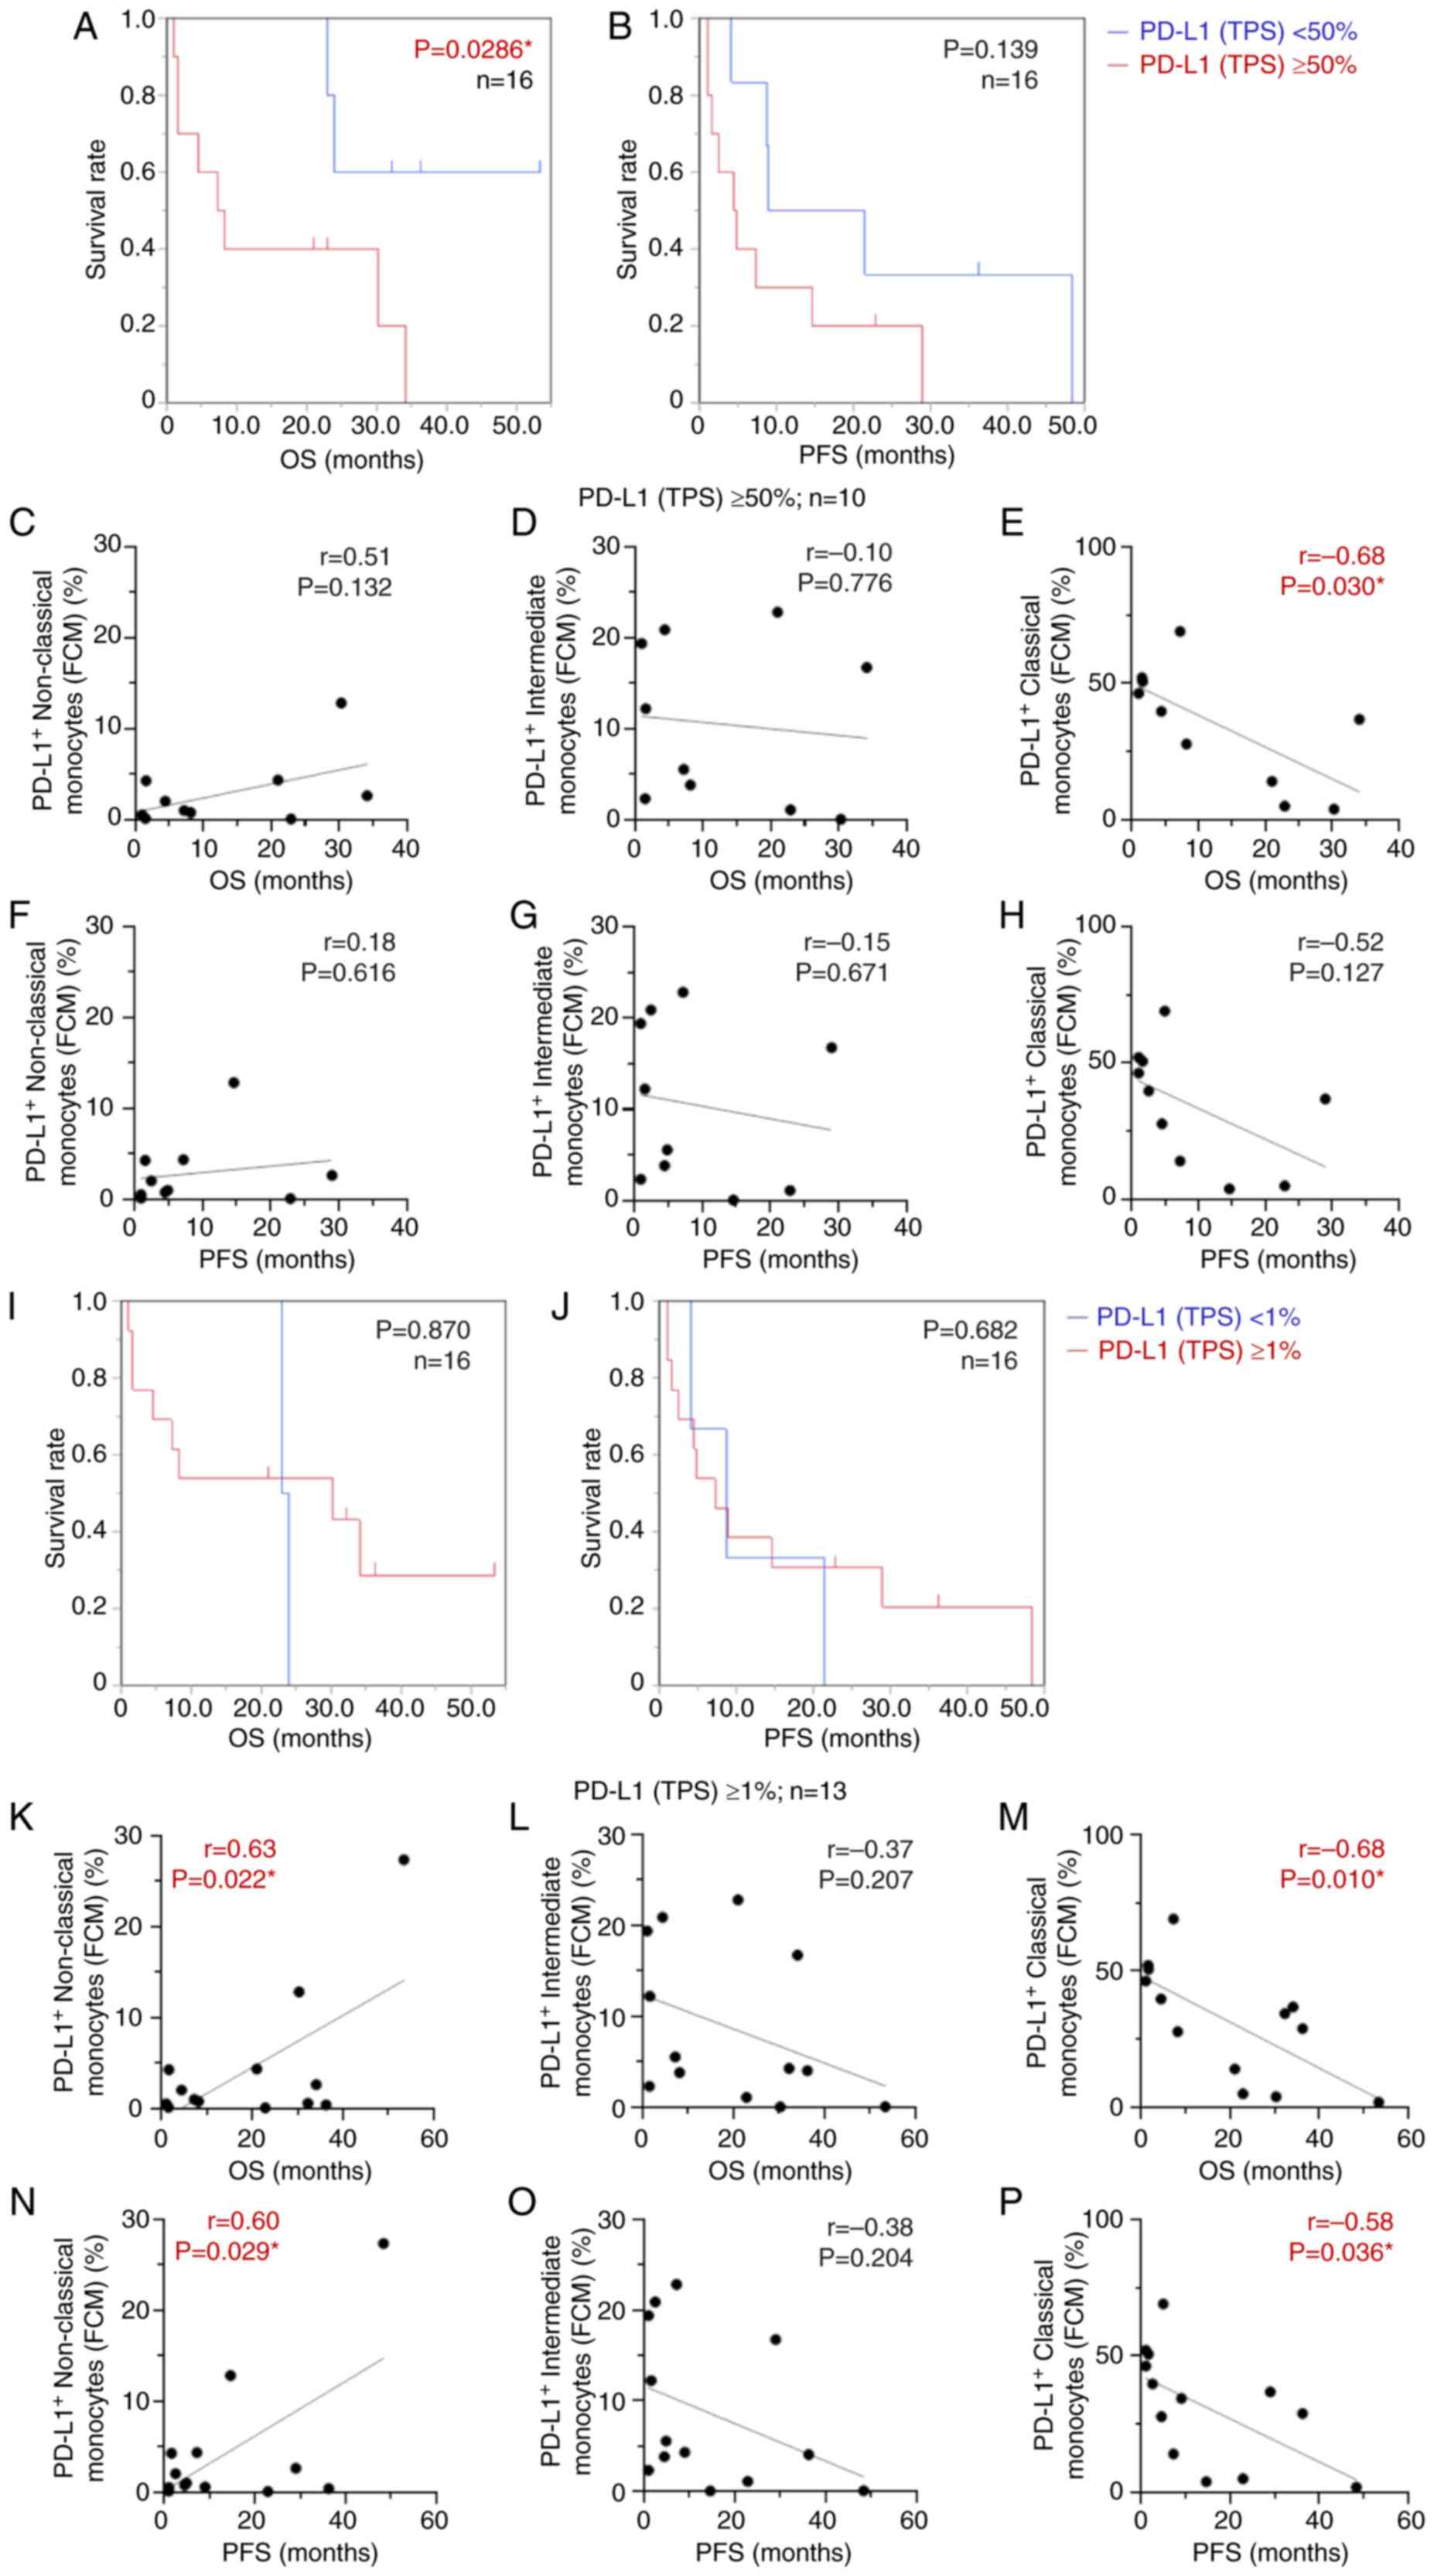 | Figure 8.Kaplan-Meier curve and correlation
analysis to evaluate the association between PD-L1-expressing
monocyte subsets, PD-L1 expression on tumor cells (TPS) and
survival duration. Kaplan-Meier analysis of the relationship
between PD-L1 expression on tumor cells (TPS) and (A and I) OS and
(B and J) PFS. Patients with non-small cell lung carcinoma (n=16)
were separated into high and low PD-L1 expression groups with PD-L1
cutoffs of either (A and B) <50% or ≥50%, or (I and J) <1% or
≥1%. Patients with NSCLC were split into high and low PD-L1
expression groups with PD-L1 cutoffs of either ≥50 or ≥1%. Patients
with high PD-L1 (TPS) ≥50% (n=10 in C-H) and PD-L1 (TPS) ≥1% (n=13
in K-P) were selected to analyze the association between the
percentage of each monocyte subset expressing PD-L1 and OS and PFS.
Correlation between (C) PD-L1+ non-classical monocytes,
(D) PD-L1+ intermediate monocytes and (E)
PD-L1+ classical monocytes, and OS was analyzed in
patients with PD-L1 expression ≥50%. Correlation between (F)
PD-L1+ non-classical monocytes, (G) PD-L1+
intermediate monocytes and (H) PD-L1+ classical
monocytes, and PFS was analyzed in patients with PD-L1 expression
≥50%. A similar analysis was conducted with a cutoff value of 1% of
PD-L1 expression. Correlation between (K) PD-L1+
non-classical monocytes, (L) PD-L1+ intermediate
monocytes and (M) PD-L1+ classical monocytes, and OS
were analyzed in patients with PD-L1 expression ≥1%. Correlation
between (N) PD-L1+ non-classical monocytes, (O)
PD-L1+ intermediate monocytes and (P) PD-L1+
classical monocytes, and PFS was analyzed in patients with PD-L1
expression ≥1%. Red line, high level; blue line, low level.
*P<0.05. PD-L1, programmed death-ligand 1; OS, overall survival;
PFS, progression-free survival; TPS, tumor proportion score; NSCLC,
non-small cell lung cancer. |
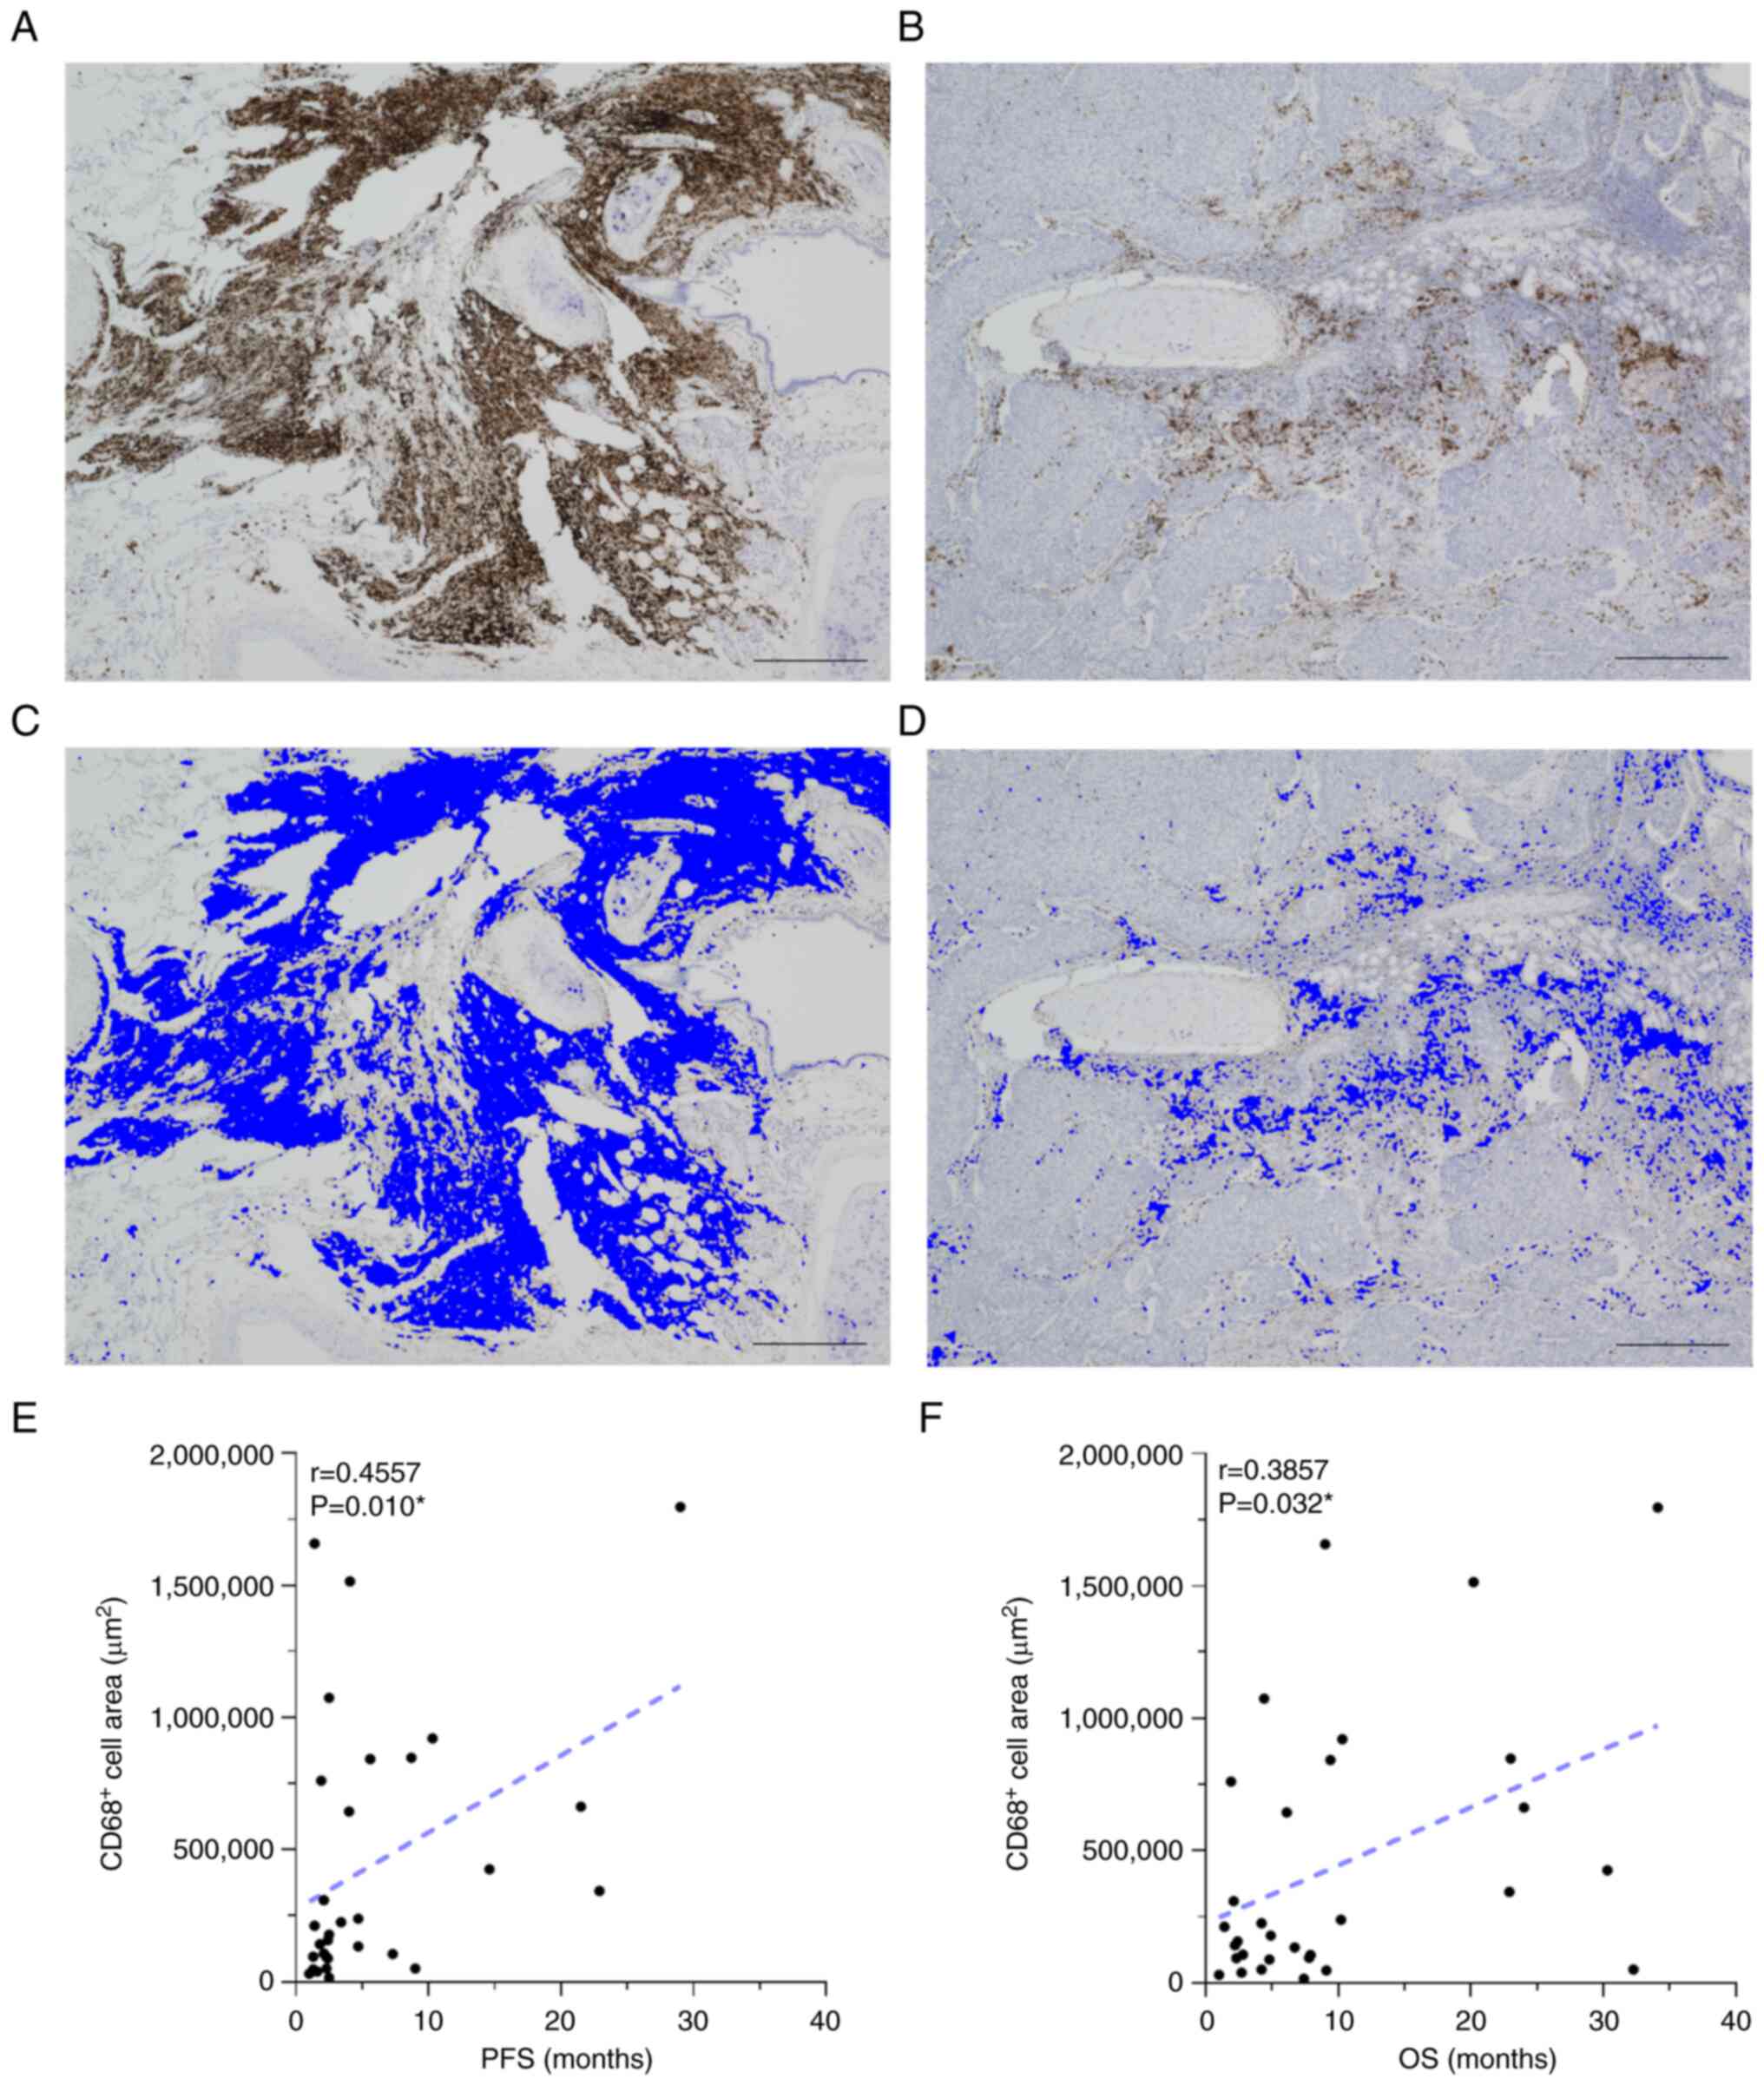
Correlation between CD68+
cells and survival outcome in patients with cancer
The CD68-stained area was calculated using the
hybrid cell count software function (Table SV), and the correlation with
survival duration was investigated. Representative images of CD68
immunostaining and CD68-stained areas assessed using the hybrid
cell count function are shown in Fig.
9A-D. The stained area of CD68+ cells was
statistically correlated with longer PFS and OS in the whole
patient cohort (n=31; r=0.4557; P=0.010; Fig. 9E, and r=0.3857; P=0.032; Fig. 9F). Therefore, macrophages in tumor
tissues may have a favorable effect on therapeutic efficacy and
prognosis. Furthermore, the association between CD68-stained cells
and percentages of non-classical, intermediate and classical
monocytes was analyzed. No statistical correlations were observed
between the CD68+ area and monocyte percentage of each
subset with or without expression of PD-L1 and PD-1 (Fig. S10).
Discussion
The present study demonstrated that higher
percentages of classical monocytes were associated with shorter OS.
By contrast, higher percentages of non-classical monocytes were
significantly associated with longer OS, particularly in the cohort
of patients with NSCLC. For non-classical monocytes, similar
statistically significant results were also obtained for PFS.
Namely, the percentage of each subset of monocytes, especially the
relative balance between non-classical and classical monocytes, was
suggested to be an essential factor for predicting prognosis and
therapeutic efficacy of anti-PD-1 antibodies.
Monocytes in human peripheral circulating blood play
a key role in cancer pathophysiology and progression, including
tumor angiogenesis, invasion, metastasis and immune regulation
(24,25). Moreover, each subset of monocytes
plays a specific role in tumor growth (26). This is thought to be due to
monocytes presenting pro- and antitumor immunity, such as the
secretion of mediators, promotion of angiogenesis, recruitment of
lymphocytes and differentiation into macrophages (25). Monocytes are heterologous and are
classified into three different subsets primarily based on the
expression levels of markers within the cluster of differentiation,
CD14 and CD16. The percentage of each subset of monocytes has been
reported as follows: Classical (~85%), intermediate (~5%) and
non-classical (~10% of the monocyte population) (17,18).
The current study showed a similar trend in terms of the highest
percentages of the classical monocyte subset. The study showed that
the percentages of intermediate monocytes were higher than those of
non-classical monocytes. Most monocytes that express CD14, but not
CD16, on their surface correspond to classical monocytes that
mediate inflammatory responses and differentiate into various
macrophages that can inhibit immune responses (27,28).
Moreover, classical monocytes are collected at tumor sites that
contribute to macrophage capacity, and promote tumor development
and metastasis (29). Human
circulating monocytes in peripheral blood migrate into the tumor
tissue and are differentiated into tumor-associated macrophages,
which are polarized into classically activated macrophages (M1) and
alternatively activated macrophages (M2) (30,31).
M1 macrophages have an antitumor role, whereas M2 macrophages have
a tumor-promoting role (32). It
remains unclear whether the main monocytes that differentiate into
M2 macrophages with tumor-promoting functions are classical or
non-classical monocytes (33). It
is possible that the classical monocytes present in the plasma
prior to anti-PD-1 antibody administration mobilize to the tumor
site as M2 macrophages and function in a tumor-promoting manner,
thereby explaining the positive correlation between the percentage
of classical monocytes and shorter OS observed in the present
study. By contrast, non-classical monocytes are involved in
complement and Fc γ-mediated phagocytosis. They also have functions
such as tumor cytotoxicity, natural killer cell recruitment,
adhesion and inhibition of regulatory T cells (25), which may be involved in favorable
cancer prognosis, as suggested by the results of the present study.
In addition, IHC of CD68-stained cells was performed to evaluate
the infiltration of macrophages into tumor tissues. As monocyte
subsets in the peripheral blood were not associated with
macrophages in the tumor tissue analyzed by IHC, the results
suggested the possibility that circulating monocytes and
macrophages in the tumor tissue could be independent factors.
Macrophages that are present in tumor tissues do not originate only
from monocytes in the peripheral blood, and the existence of
tissue-resident macrophages originating from the yolk sac during
the fetal period has been reported (34). Macrophages in tumor tissues are
generally considered to have a tumor-promoting function. However,
the present study indicated that macrophages in the tumor tissue
may have a favorable effect on therapeutic efficacy and prognosis.
Tumor-associated macrophages are thought to change between
antitumor and tumor-promoting roles during tumor development and
proliferation (35). In future
studies, subsets of macrophages will be analyzed and their
relationship to ICI treatment and monocyte subsets in the
peripheral blood will be further investigated.
To date, numerous studies have focused on bone
marrow-derived suppressor-like cells (MDSCs) (36–38).
MDSCs are myeloid immune cells that are more immature than
monocytes and are highly immunosuppressive, exerting negative
effects not only on the tumor microenvironment but also on the
tumor immune system of the patient as a whole (39). The immunosuppressive function of
MDSCs has been implicated in resistance to ICI treatment. Monocytic
MDSCs (M-MDSCs) have been reported to be involved in the resistance
to ICI treatment via TGF-β and IL-6 (40,41).
This finding supports the role of some immunosuppressive cytokines
in mediating the negative effects of M-MDSCs on the antitumor
immune response. M-MDSCs are abundant in the tumor
microenvironment, where they rapidly differentiate into
tumor-associated macrophages. Broute et al (42) showed that high M-MDSC levels are
strongly associated with primary resistance to immunotherapy.
However, a previous study reported controversial results (43), in which patients who responded to
anti-PD-1 antibodies had higher pretreatment MDSC levels. There is
no robust evidence that M-MDSCs are associated with resistance to
ICI treatment. The current exploratory study focused on monocytes.
The mechanism of tolerance to ICI through a series of immune cells,
including MDSCs, monocytes and macrophages, should be
systematically investigated in future studies.
Previous studies have shown that high circulating
monocyte levels are associated with worse prognosis in several
cancer types, such as prostate, hepatocellular cervical, pancreatic
and gastric cancer (27,44–48).
Additionally, it has been shown that higher pretreatment absolute
monocyte counts are associated with a shorter response time in
patients with NSCLC who responded to ICI therapies, underscoring
the impact of monocytes on predicting the efficacy of ICI (49). Further studies investigating the
association between the efficacy of ICIs and monocytes with PD-L1
expression have reported that higher pretreatment PD-L1-expressing
monocytes are associated with worse clinical outcomes for ICI
treatment (16,50–52).
However, data on the relationship between the efficacy of ICI,
focusing on each monocyte subset expressing immune checkpoints such
as PD-1 and PD-L1, remain limited (46). The current study is one of the few
valuable reports (53,54), examining the relationship between
each monocyte subset and immune checkpoints expressed on monocytes.
It was demonstrated that higher percentages of pretreatment
classical monocytes expressing PD-L1 were correlated with shorter
OS, whereas non-classical monocytes were correlated with favorable
survival, especially in patients with NSCLC. In patients with
hepatocellular carcinoma, Jeon et al (53) reported that PD-L1+
classical monocyte percentages were elevated after 1 week of
anti-PD-1 antibody therapy and were associated with a non-durable
clinical benefit. Meanwhile, it is not clear why high PD-L1
expression on monocytes, especially on classical monocytes, is
associated with poor prognosis. It has been suggested that either
IL-6 or IL-10 can contribute to a numerical increase in
PD-L1+ classical monocytes early after anti-PD-1 therapy
(53). Moreover, hypoxia has been
reported to increase surface PD-L1 expression on a variety of
immune cells, namely MDSCs, macrophages and antigen-presenting
dendritic cells, and tumor cells (55). Hypoxia has also been shown to play a
role in tumor aggressiveness (56);
therefore, hypoxia may influence PD-L1 expression on monocytes in
aggressive tumors. The origin and role of PD-L1-expressing
monocytes and their association with prognosis or treatment
efficacy remain to be elucidated. Furthermore, the association
between PD-1 molecules and therapeutic efficacy of anti-PD-1
antibody remains to be determined. The present study demonstrated
that PD-1 expression on monocytes was much lower than that of
PD-L1. It was hypothesized that PD-L1, but not PD-1, may have a
more essential role in the expression of immune checkpoints in
monocytes.
In some cancer types, high PD-L1 expression on
tumor cells has been used as a predictive biomarker for the
therapeutic efficacy of PD-1 blockade therapy, especially in lung
cancer (21,22), and PD-L1 expression levels in tumor
cells have been used as a companion diagnosis to determine the
indication of anti-PD-1 antibodies. However, PD-L1 expression in
tumor cells is not a perfect biomarker as there are some cases in
which anti-PD-1 antibody therapy does not respond even when PD-L1
expression in tumor cells is high as shown by IHC (57). In the present study, high or low
PD-L1 expression in tumor cells did not have a significant
association with PFS in patients with NSCLC. Moreover, patients
with NSCLC whose PD-L1 (TPS) was ≥1%, had notably positive
correlations between the PD-L1-expressing non-classical monocytes
and both OS and PFS. Contrary to this, higher PD-L1-expressing
classical monocytes were significantly correlated with poorer OS
and PFS. PD-L1 expression on tumor cells (TPS) alone is possibly
insufficient as a biomarker for predicting complete therapeutic
efficacy, especially in positive cases with a PD-L1 cut-off value
of ≥1%. In light of these results, it was hypothesized that
focusing on the circulating monocyte subsets in peripheral blood
that express PD-L1, in addition to the PD-L1 expression on tumor
cells (TPS), may improve its usefulness as a predictive and
prognostic biomarker.
No association was observed between genetic
alterations (EGFR, ALK, ROS1 and BRAF mutations) and monocyte
percentages in the present study. To date, to the best of our
knowledge, no studies have focused on the relationship between
genetic mutations and monocyte levels in lung cancer, and this will
be one of the subjects of future research.
Regarding statistical methodology, two methods were
used for analysis: The Pearson correlation coefficient was used to
evaluate linear correlation, and the Kaplan-Meier method with
cut-off values defined by a ROC curve analysis to compare survival
time at high and low levels for each monocyte subset. The results
were similar between the two types of methods. Although similar
trends were shown in part of the analysis, there were some results
that were not consistent. Comparison of two different statistical
methods for the overall population of the monocyte subset
significantly showed that high percentages of classical monocytes
were associated with shorter OS in the whole patient cohort and
patients with NSCLC by both methods of statistical analysis. On the
other hand, the Kaplan-Meier analysis did not show that
non-classical monocytes were associated with a better prognosis, as
indicated by the correlation analysis. Similarly, in the analysis
of PD-L1-expressing monocyte subsets, classical monocytes
expressing PD-L1 were similarly significant in both analyses, but
not PD-L1+ non-classical monocytes. For the whole
patient cohort, high percentages of classical monocytes expressing
PD-L1 were associated with favorable OS only using Kaplan-Meier
analysis. Furthermore, both analysis methods for PD-1+
monocytes showed that classical monocytes expressing PD-1 in
patients with NSCLC were associated with a shorter OS time, but the
other results regarding intermediate and non-classical monocytes
expressing PD-1 were not significantly different in patients with
NSCLC. Briefly, the two statistical methods showed similar results
with statistical significance for particularly classical monocyte
subsets. Since no clear standards to define the cut-off values of
high and low monocytes have previously been reported, there are
limitations in interpreting the analysis results using the
Kaplan-Meier method. In the present study, it was hypothesized that
the correlation analysis using the Pearson correlation method is
the more principal result. Regarding Kaplan-Meier analyses for
patients with esophageal cancer, when the patients were divided
into two groups, ‘high’ and ‘low’ groups, exactly the same number
of patients were classified into both groups. Therefore, in some
cases, the Kaplan-Meier curves and the analysis results completely
matched. These issues were due to the small number of patients with
esophageal cancer.
There are several notable limitations in the
present study. The patient population was heterogeneous and small,
including three cancer types: Lung, gastric and esophageal cancer.
Also, there was no single histological type for patients with lung
cancer. Future studies should unify the line of ICI administration.
In the current study, the focus was on patients who were treated
with anti-PD-1 antibody monotherapy. Selecting patients treated
with monotherapy enabled the direct examination of the relationship
between anti-PD-1 antibodies and monocytes, and excluded the
influence of concomitant agents. Of note, the number of patients
who met the eligibility criteria could not be increased due to the
increasing use of combination therapy. Additionally, the analysis
of gastric and esophageal cancer did not yield results similar to
those of NSCLC. Individual cancer types were analyzed and
cross-sectional data across all cancer types were compiled because
ICIs are used across different cancer types. Due to limited blood
samples from patients in the current study, the dynamic changes in
each monocyte subset before and after anti-PD-1 treatment could not
be analyzed. In addition, experiments could not be carried out to
explore molecular mechanisms. Prospective trials and elucidation of
molecular mechanisms are required to resolve these limitations.
In conclusion, despite the shortcomings associated
with the heterogeneity of the patient cohort, higher percentages of
classical monocytes were associated with shorter OS. In comparison,
higher percentages of non-classical monocytes were significantly
associated with longer OS, particularly in patients with NSCLC. For
non-classical monocytes, similar significant results were also
obtained for PFS. Moreover, focusing on PD-L1 expression in
monocytes, a higher percentage of classical monocytes expressed
PD-L1 than intermediate and non-classical monocytes. The analysis
of immune checkpoints on monocytes, especially in NSCLC, revealed
that classical monocytes expressing PD-L1 at a high level were
correlated with a shorter OS. By contrast, a positive correlation
between PD-L1-expressing non-classical monocytes, and longer OS and
PFS was observed. Classical and non-classical monocytes, especially
PD-L1-expressing monocytes, are potential candidate biomarkers for
predicting prognosis in patients treated with ICIs and treatment
response. PD-L1 expression on monocytes is superior because it can
be measured in circulating peripheral blood. Further studies are
warranted to resolve some of the limitations of the present
study.
Supplementary Material
Supporting Data
Supporting Data
Acknowledgements
Not applicable.
Funding
Funding: No funding was received.
Availability of data and materials
The datasets used and/or analyzed during the
current study are available from the corresponding author on
reasonable request.
Authors' contributions
RO, TaT and SW conceptualized the study. RO, YF,
KI, NO, MW, DT, TG, YS, MH, TY and SW designed the methodology
used. RO, YF and MW used software. AH, KH, HA, YH, TI, RS, NI, ToT,
KY, MT, YK, SK and TaT analyzed the data, and validated the
reproducibility of the data involved in the flow cytometry analysis
and clinical data of patients. YS, MH, and TY conducted IHC
experiments and performed data verification for data collection and
analysis. YS, MH, and TY validated the reproducibility of the IHC
data, then confirmed all the data involved in the pathological
experiment. RO and SW confirm the authenticity of all raw data. RO
carried out the formal analysis. RO, YF, KI, NO, MW, DT, TG, YS, MH
and TY carried out the investigation. RO, AH, KH, HA, YH, TI, RS,
NI, ToT, KY, TaT and SW provided resources. RO, YF and RS carried
out data curation; RO wrote and prepared the original draft. TaT
and SW reviewed and edited the manuscript. RO completed data
visualization. KY, MT, YK, SK, TaT and SW carried out project
supervision. SW carried out project administration. TaT and SW
acquired funding. All authors read and approved the final
manuscript.
Ethics approval and consent to
participate
The present study was conducted according to the
guidelines of The Declaration of Helsinki and was approved by the
Ethics Committee of Showa University School of Medicine, Tokyo,
Japan (approval nos. 2165, 2253, 283 and 285). All patients
provided written informed consent for their participation in the
current study.
Patient consent for publication
All patients provided written informed consent for
publication.
Competing interests
The authors declare that they have no competing
interests.
References
|
1
|
Dosset M, Vargas TR, Lagrange A, Boidot R,
Végran F, Roussey A, Chalmin F, Dondaine L, Paul C, Lauret
Marie-Joseph E, et al: PD-1/PD-L1 pathway: An adaptive immune
resistance mechanism to immunogenic chemotherapy in colorectal
cancer. Oncoimmunology. 7:e14339812018. View Article : Google Scholar : PubMed/NCBI
|
|
2
|
Han Y, Liu D and Li L: PD-1/PD-L1 pathway:
Current researches in cancer. Am J Cancer Res. 10:727–742.
2020.PubMed/NCBI
|
|
3
|
Vaddepally RK, Kharel P, Pandey R, Garje R
and Chandra AB: Review of indications of FDA-approved immune
checkpoint inhibitors per NCCN guidelines with the level of
evidence. Cancers (Basel). 12:7382020. View Article : Google Scholar : PubMed/NCBI
|
|
4
|
Gong J, Chehrazi-Raffle A, Reddi S and
Salgia R: Development of PD-1 and PD-L1 inhibitors as a form of
cancer immunotherapy: A comprehensive review of registration trials
and future considerations. J Immunother Cancer. 6:82018. View Article : Google Scholar : PubMed/NCBI
|
|
5
|
Yi M, Niu M, Xu L, Luo S and Wu K:
Regulation of PD-L1 expression in the tumor microenvironment. J
Hematol Oncol. 14:102021. View Article : Google Scholar : PubMed/NCBI
|
|
6
|
Bardhan K, Anagnostou T and Boussiotis VA:
The PD1:PD-L1/2 pathway from discovery to clinical implementation.
Front Immunol. 7:5502016. View Article : Google Scholar : PubMed/NCBI
|
|
7
|
De Marchi P, Leal LF, Duval da Silva V, da
Silva ECA, Cordeiro de Lima VC and Reis RM: PD-L1 expression by
tumor proportion score (TPS) and combined positive score (CPS) are
similar in non-small cell lung cancer (NSCLC). J Clin Pathol.
74:735–740. 2021. View Article : Google Scholar : PubMed/NCBI
|
|
8
|
Kulangara K, Zhang N, Corigliano E,
Guerrero L, Waldroup S, Jaiswal D, Ms MJ, Shah S, Hanks D, Wang J,
et al: Clinical utility of the combined positive score for
programmed death ligand-1 expression and the approval of
pembrolizumab for treatment of gastric cancer. Arch Pathol Lab Med.
143:330–337. 2019. View Article : Google Scholar : PubMed/NCBI
|
|
9
|
Noske A, Wagner DC, Schwamborn K, Foersch
S, Steiger K, Kiechle M, Oettler D, Karapetyan S, Hapfelmeier A,
Roth W and Weichert W: Interassay and interobserver comparability
study of four programmed death-ligand 1 (PD-L1)
immunohistochemistry assays in triple-negative breast cancer.
Breast. 60:238–244. 2021. View Article : Google Scholar : PubMed/NCBI
|
|
10
|
Daud AI, Wolchok JD, Robert C, Hwu WJ,
Weber JS, Ribas A, Hodi FS, Joshua AM, Kefford R, Hersey P, et al:
Programmed death-ligand 1 expression and response to the
anti-programmed death 1 antibody pembrolizumab in melanoma. J Clin
Oncol. 34:4102–4109. 2016. View Article : Google Scholar : PubMed/NCBI
|
|
11
|
Zeng Z, Yang B and Liao Z: Biomarkers in
immunotherapy-based precision treatments of digestive system
tumors. Front Oncol. 11:6504812021. View Article : Google Scholar : PubMed/NCBI
|
|
12
|
Hutarew G: PD-L1 testing, fit for routine
evaluation? From a pathologist's point of view. Memo. 9:201–206.
2016. View Article : Google Scholar : PubMed/NCBI
|
|
13
|
Hirsch FR, McElhinny A, Stanforth D,
Ranger-Moore J, Jansson M, Kulangara K, Richardson W, Towne P,
Hanks D, Vennapusa B, et al: PD-L1 immunohistochemistry assays for
lung cancer: Results from phase 1 of the blueprint PD-L1 IHC assay
comparison project. J Thorac Oncol. 12:208–222. 2017. View Article : Google Scholar : PubMed/NCBI
|
|
14
|
Ohkuma R, Ieguchi K, Watanabe M,
Takayanagi D, Goshima T, Onoue R, Hamada K, Kubota Y, Horiike A,
Ishiguro T, et al: Increased plasma soluble PD-1 concentration
correlates with disease progression in patients with cancer treated
with anti-PD-1 antibodies. Biomedicines. 9:19292021. View Article : Google Scholar : PubMed/NCBI
|
|
15
|
Ando K, Hamada K, Watanabe M, Ohkuma R,
Shida M, Onoue R, Kubota Y, Matsui H, Ishiguro T, Hirasawa Y, et
al: Plasma levels of soluble PD-L1 correlate with tumor regression
in patients with lung and gastric cancer treated with immune
checkpoint inhibitors. Anticancer Res. 39:5195–5201. 2019.
View Article : Google Scholar : PubMed/NCBI
|
|
16
|
Ando K, Hamada K, Shida M, Ohkuma R,
Kubota Y, Horiike A, Matsui H, Ishiguro T, Hirasawa Y, Ariizumi H,
et al: A high number of PD-L1+ CD14+
monocytes in peripheral blood is correlated with shorter survival
in patients receiving immune checkpoint inhibitors. Cancer Immunol
Immunother. 70:337–348. 2021. View Article : Google Scholar : PubMed/NCBI
|
|
17
|
Ziegler-Heitbrock L, Ancuta P, Crowe S,
Dalod M, Grau V, Hart DN, Leenen PJ, Liu YJ, MacPherson G, Randolph
GJ, et al: Nomenclature of monocytes and dendritic cells in blood.
Blood. 116:e74–e80. 2010. View Article : Google Scholar : PubMed/NCBI
|
|
18
|
Wong KL, Yeap WH, Tai JJ, Ong SM, Dang TM
and Wong SC: The three human monocyte subsets: Implications for
health and disease. Immunol Res. 53:41–57. 2012. View Article : Google Scholar : PubMed/NCBI
|
|
19
|
Sidibe A, Ropraz P, Jemelin S, Emre Y,
Poittevin M, Pocard M, Bradfield PF and Imhof BA: Angiogenic
factor-driven inflammation promotes extravasation of human
proangiogenic monocytes to tumours. Nat Commun. 9:3552018.
View Article : Google Scholar : PubMed/NCBI
|
|
20
|
Eisenhauer EA, Therasse P, Bogaerts J,
Schwartz LH, Sargent D, Ford R, Dancey J, Arbuck S, Gwyther S,
Mooney M, et al: New response evaluation criteria in solid tumours:
Revised RECIST guideline (version 1.1). Eur J Cancer. 45:228–247.
2009. View Article : Google Scholar : PubMed/NCBI
|
|
21
|
Borghaei H, Paz-Ares L, Horn L, Spigel DR,
Steins M, Ready NE, Chow LQ, Vokes EE, Felip E, Holgado E, et al:
Nivolumab versus docetaxel in advanced nonsquamous non-small-cell
lung cancer. N Engl J Med. 373:1627–1639. 2015. View Article : Google Scholar : PubMed/NCBI
|
|
22
|
Reck M, Rodríguez-Abreu D, Robinson AG,
Hui R, Csőszi T, Fülöp A, Gottfried M, Peled N, Tafreshi A, Cuffe
S, et al: Pembrolizumab versus chemotherapy for PD-L1-positive
non-small-cell lung cancer. N Engl J Med. 375:1823–1833. 2016.
View Article : Google Scholar : PubMed/NCBI
|
|
23
|
Iida Y, Tanaka H, Sano H, Suzuki Y,
Shimizu H and Urano T: Ectopic expression of PCSK9 by smooth muscle
cells contributes to aortic dissection. Ann Vasc Surg. 48:195–203.
2018. View Article : Google Scholar : PubMed/NCBI
|
|
24
|
Prat M, Le Naour A, Coulson K, Lemée F,
Leray H, Jacquemin G, Rahabi MC, Lemaitre L, Authier H, Ferron G,
et al: Circulating CD14high CD16low
intermediate blood monocytes as a biomarker of ascites immune
status and ovarian cancer progression. J Immunother Cancer.
8:e0004722020. View Article : Google Scholar : PubMed/NCBI
|
|
25
|
Olingy CE, Dinh HQ and Hedrick CC:
Monocyte heterogeneity and functions in cancer. J Leukoc Biol.
106:309–322. 2019. View Article : Google Scholar : PubMed/NCBI
|
|
26
|
Qian BZ, Li J, Zhang H, Kitamura T, Zhang
J, Campion LR, Kaiser EA, Snyder LA and Pollard JW: CCL2 recruits
inflammatory monocytes to facilitate breast-tumour metastasis.
Nature. 475:222–225. 2011. View Article : Google Scholar : PubMed/NCBI
|
|
27
|
Shigeta K, Kosaka T, Kitano S, Yasumizu Y,
Miyazaki Y, Mizuno R, Shinojima T, Kikuchi E, Miyajima A, Tanoguchi
H, et al: High absolute monocyte count predicts poor clinical
outcome in patients with castration-resistant prostate cancer
treated with docetaxel chemotherapy. Ann Surg Oncol. 23:4115–4122.
2016. View Article : Google Scholar : PubMed/NCBI
|
|
28
|
Xu H, Manivannan A, Crane I, Dawson R and
Liversidge J: Critical but divergent roles for CD62L and CD44 in
directing blood monocyte trafficking in vivo during inflammation.
Blood. 112:1166–1174. 2008. View Article : Google Scholar : PubMed/NCBI
|
|
29
|
Movahedi K, Laoui D, Gysemans C, Baeten M,
Stangé G, Van den Bossche J, Mack M, Pipeleers D, In't Veld P, De
Baetselier P and Van Ginderachter JA: Different tumor
microenvironments contain functionally distinct subsets of
macrophages derived from Ly6C(high) monocytes. Cancer Res.
70:5728–5739. 2010. View Article : Google Scholar : PubMed/NCBI
|
|
30
|
Robinson A, Han CZ, Glass CK and Pollard
JW: Monocyte regulation in homeostasis and malignancy. Trends
Immunol. 42:104–119. 2021. View Article : Google Scholar : PubMed/NCBI
|
|
31
|
Tarique AA, Logan J, Thomas E, Holt PG,
Sly PD and Fantino E: Phenotypic, functional, and plasticity
features of classical and alternatively activated human
macrophages. Am J Respir Cell Mol Biol. 53:676–688. 2015.
View Article : Google Scholar : PubMed/NCBI
|
|
32
|
Richards DM, Hettinger J and Feuerer M:
Monocytes and macrophages in cancer: Development and functions.
Cancer Microenviron. 6:179–191. 2013. View Article : Google Scholar : PubMed/NCBI
|
|
33
|
Italiani P and Boraschi D: From monocytes
to M1/M2 macrophages: Phenotypical vs functional differentiation.
Front Immunol. 5:5142014. View Article : Google Scholar : PubMed/NCBI
|
|
34
|
Gomez Perdiguero E, Klapproth K, Schulz C,
Busch K, Azzoni E, Crozet L, Garner H, Trouillet C, de Bruijn MF,
Geissmann F and Rodewald HR: Tissue-resident macrophages originate
from yolk-sac-derived erythro-myeloid progenitors. Nature.
518:547–551. 2015. View Article : Google Scholar : PubMed/NCBI
|
|
35
|
Allavena P, Sica A, Garlanda C and
Mantovani A: The Yin-Yang of tumor-associated macrophages in
neoplastic progression and immune surveillance. Immunol Rev.
222:155–161. 2008. View Article : Google Scholar : PubMed/NCBI
|
|
36
|
Xu Q, Liu H, Qile M and Wuren T: Dynamic
changes in myeloid-derived suppressor cells during the menstrual
cycle: A pilot study. Front Med (Lausanne). 9:9405542022.
View Article : Google Scholar : PubMed/NCBI
|
|
37
|
Nonaka K, Saio M, Umemura N, Kikuchi A,
Takahashi T, Osada S and Yoshida K: Th1 polarization in the tumor
microenvironment upregulates the myeloid-derived suppressor-like
function of macrophages. Cell Immunol. 369:1044372021. View Article : Google Scholar : PubMed/NCBI
|
|
38
|
Trikha P and Carson WE III: Signaling
pathways involved in MDSC regulation. Biochim Biophys Acta.
1846:55–65. 2014.PubMed/NCBI
|
|
39
|
Marvel D and Gabrilovich DI:
Myeloid-derived suppressor cells in the tumor microenvironment:
Expect the unexpected. Clin Invest. 125:3356–3364. 2015. View Article : Google Scholar : PubMed/NCBI
|
|
40
|
Pogoda K, Pyszniak M, Rybojad P and
Tabarkiewicz J: Monocytic myeloid-derived suppressor cells as a
potent suppressor of tumor immunity in non-small cell lung cancer.
Oncol Lett. 12:4785–4794. 2016. View Article : Google Scholar : PubMed/NCBI
|
|
41
|
Koh J, Kim Y, Lee KY, Hur JY, Kim MS, Kim
B, Cho HJ, Lee YC, Bae YH, Ku BM, et al: MDSC subtypes and CD39
expression on CD8+ T cells predict the efficacy of anti-PD-1
immunotherapy in patients with advanced NSCLC. Eur J Immunol.
50:1810–1819. 2020. View Article : Google Scholar : PubMed/NCBI
|
|
42
|
Broute G, Petracci E, De Matteis S, Canale
M, Zampiva I, Priano I, Cravero P, Andrikou K, Burgio MA, Ulivi P,
et al: High levels of circulating monocytic myeloid-derived
suppressive-like cells are associated with the primary resistance
to immune checkpoint inhibitors in advanced non-small cell lung
cancer: An exploratory analysis. Front Immunol. 13:8665612022.
View Article : Google Scholar : PubMed/NCBI
|
|
43
|
Feng J, Chen S, Li S, Wu B, Lu J, Tan L,
Li J, Song Y, Shi G, Shi YG and Jiang J: The association between
monocytic myeloid-derived suppressor cells levels and the
anti-tumor efficacy of anti-PD-1 therapy in NSCLC patients. Transl
Oncol. 13:1008652020. View Article : Google Scholar : PubMed/NCBI
|
|
44
|
Sasaki A, Iwashita Y, Shibata K, Matsumoto
T, Ohta M and Kitano S: Prognostic value of preoperative peripheral
blood monocyte count in patients with hepatocellular carcinoma.
Surgery. 139:755–764. 2006. View Article : Google Scholar : PubMed/NCBI
|
|
45
|
Lee YY, Choi CH, Sung CO, Do IG, Huh S,
Song T, Kim MK, Kim HJ, Kim TJ, Lee JW, et al: Prognostic value of
pre-treatment circulating monocyte count in patients with cervical
cancer: Comparison with SCC-Ag level. Gynecol Oncol. 124:92–97.
2012. View Article : Google Scholar : PubMed/NCBI
|
|
46
|
Sanford DE, Belt BA, Panni RZ, Mayer A,
Deshpande AD, Carpenter D, Mitchem JB, Plambeck-Suess SM, Worley
LA, Goetz BD, et al: Inflammatory monocyte mobilization decreases
patient survival in pancreatic cancer: A role for targeting the
CCL2/CCR2 axis. Clin Cancer Res. 19:3404–3415. 2013. View Article : Google Scholar : PubMed/NCBI
|
|
47
|
Hayashi T, Fujita K, Nojima S, Hayashi Y,
Nakano K, Ishizuya Y, Wang C, Yamamoto Y, Kinouchi T, Matsuzaki K,
et al: Peripheral blood monocyte count reflecting
tumor-infiltrating macrophages is a predictive factor of adverse
pathology in radical prostatectomy specimens. Prostate.
77:1383–1388. 2017. View Article : Google Scholar : PubMed/NCBI
|
|
48
|
Feng F, Zheng G, Wang Q, Liu S, Liu Z, Xu
G, Wang F, Guo M, Lian X and Zhang H: Low lymphocyte count and high
monocyte count predicts poor prognosis of gastric cancer. BMC
Gastroenterol. 18:1482018. View Article : Google Scholar : PubMed/NCBI
|
|
49
|
Parikh K, Kumar A, Ahmed J, Anwar A,
Puccio C, Chun H, Fanucchi M and Lim SH: Peripheral monocytes and
neutrophils predict response to immune checkpoint inhibitors in
patients with metastatic non-small cell lung cancer. Cancer Immunol
Immunother. 67:1365–1370. 2018. View Article : Google Scholar : PubMed/NCBI
|
|
50
|
Yasuoka H, Asai A, Ohama H, Tsuchimoto Y,
Fukunishi S and Higuchi K: Increased both PD-L1 and PD-L2
expressions on monocytes of patients with hepatocellular carcinoma
was associated with a poor prognosis. Sci Rep. 10:103772020.
View Article : Google Scholar : PubMed/NCBI
|
|
51
|
Riemann D, Schütte W, Turzer S, Seliger B
and Möller M: High PD-L1/CD274 expression of monocytes and blood
dendritic cells is a risk factor in lung cancer patients undergoing
treatment with PD1 inhibitor therapy. Cancers (Basel). 12:29662020.
View Article : Google Scholar : PubMed/NCBI
|
|
52
|
Zhang W, Liu Y, Yan Z, Yang H, Sun W, Yao
Y, Chen Y and Jiang R: IL-6 promotes PD-L1 expression in monocytes
and macrophages by decreasing protein tyrosine phosphatase receptor
type O expression in human hepatocellular carcinoma. J Immunother
Cancer. 8:e0002852020. View Article : Google Scholar : PubMed/NCBI
|
|
53
|
Jeon SH, Lee YJ, Kim HD, Nam H, Ryoo BY,
Park SH, Yoo C and Shin EC: Dynamic changes in peripheral blood
monocytes early after anti-PD-1 therapy predict clinical outcomes
in hepatocellular carcinoma. Cancer Immunol Immunother. 28:371–384.
2023. View Article : Google Scholar : PubMed/NCBI
|
|
54
|
Bianchini M, Duchêne J, Santovito D,
Schloss MJ, Evrard M, Winkels H, Aslani M, Mohanta SK, Horckmans M,
Blanchet X, et al: PD-L1 expression on nonclassical monocytes
reveals their origin and immunoregulatory function. Sci Immunol.
4:eaar30542019. View Article : Google Scholar : PubMed/NCBI
|
|
55
|
Noman MZ and Chouaib S: Targeting hypoxia
at the forefront of anticancer immune responses. Oncoimmunology.
3:e9544632015. View Article : Google Scholar : PubMed/NCBI
|
|
56
|
Reck M, Kerr KM, Grohé C, Manegold C,
Pavlakis N, Paz-Ares L, Huber RM, Popat S, Thatcher N, Park K, et
al: Defining aggressive or early progressing nononcogene-addicted
non-small-cell lung cancer: A separate disease entity? Future
Oncol. 15:1363–1383. 2019. View Article : Google Scholar : PubMed/NCBI
|
|
57
|
Shen X and Zhao B: Efficacy of PD-1 or
PD-L1 inhibitors and PD-L1 expression status in cancer:
Meta-analysis. BMJ. 362:k35292018. View Article : Google Scholar : PubMed/NCBI
|