Introduction
The incidence and mortality of cancer continue to
rise as the global population grows and ages. In 2020, an estimated
19.3 million new cancer cases and nearly 10 million cancer-related
deaths occurred (excluding non-melanoma skin cancer) (1). Current therapeutic approaches for
cancer include surgery, radiotherapy and chemotherapy. However,
their effectiveness is far from satisfactory (2,3).
Immunotherapy has revolutionized the field of cancer treatment,
offering a promising direction for tumor treatment research
(4). Immune checkpoint inhibitors
(ICIs) are monoclonal antibodies that reportedly strengthen T
cell-mediated antitumor immunity and improve immune clearance of
tumor cells (5,6). Antibodies for programmed death-1
(PD-1) and programmed death ligand-1 (PD-L1) (7) have been approved by the US Food and
Drug Administration for use in the treatment of malignant tumors
and have demonstrated promising results in clinical trials
(8). Given that only a small subset
of patients treated with these agents derive benefit (7), it is essential to identify robust
indicators for predicting treatment responses to immunotherapy.
Cathepsin S (CTSS), is a lysosomal protease-encoding
gene located on the human 1q21 chromosome, which is mainly
expressed in immune cells, including B cells, dendritic cells (DCs)
and macrophages (9). CTSS has been
reported to be associated with the development of numerous
diseases, including autoimmune diseases, inflammation, nervous
system diseases and cancers (such as pancreatic cancer, breast
cancer and glioblastoma) (10,11).
Notably, CTSS serves a pivotal role in major histocompatibility
complex class II (MHC-II) antigen presentation, thereby influencing
autoimmunity (12). Additionally,
it can also activate protease-activated receptor 2 (PAR2) to boost
the generation of tumor necrosis factor-α (TNF-α) and
interleukin-1β (IL-1β) (13). These
findings underscore the critical role of CTSS in regulating
inflammatory responses and immune modulation.
Furthermore, CTSS expression is elevated in certain
cancers, such as colorectal cancer (14), gastric cancer (15) and breast cancer (16), and has been demonstrated to serve a
crucial role in tumor invasion and metastasis by inducing tumor
angiogenesis and degradation of the tumor extracellular matrix
(ECM) (11,17). Silencing of CTSS expression has been
linked to the inhibition of malignant phenotypes in cancer cells
and improved clinical outcomes in patients with breast cancer
(16–19). Therefore, CTSS could be a potential
predictive and therapeutic biomarker for cancer. However, the role
of CTSS in tumorigenesis and its association with response rates to
antitumor agents remain obscure. Dheilly et al (20) reported that gene mutation and
amplification could contribute to the elevated expression of CTSS,
thus inducing a tumor-promoting immune microenvironment in
follicular lymphoma (FL), characterized by CD4+ T cell
enrichment and activation. In addition, their two independent
clinical studies on FL have reported a correlation between CTSS and
PDCD1 expression, further emphasizing its potential as a latent
predictive biomarker for responses to anti-PD1 therapy. These
observations suggest that CTSS may affect the tumor immune
microenvironment (TIME) and could become a latent biomarker to
predict patient response to ICIs (21).
The present study performed a comprehensive analysis
of CTSS expression and its implications for overall survival (OS),
progression-free interval (PFI) and disease-specific survival (DSS)
across multiple cancer types. The correlation between CTSS
expression and clinicopathological characteristics such as, the
tumor microenvironment (TME), tumor immune infiltration, tumor
mutational burden (TMB) and microsatellite instability (MSI) were
also assessed. The methodology employed in the present study is
outlined in Fig. 1, providing an
overview of the investigative approach.
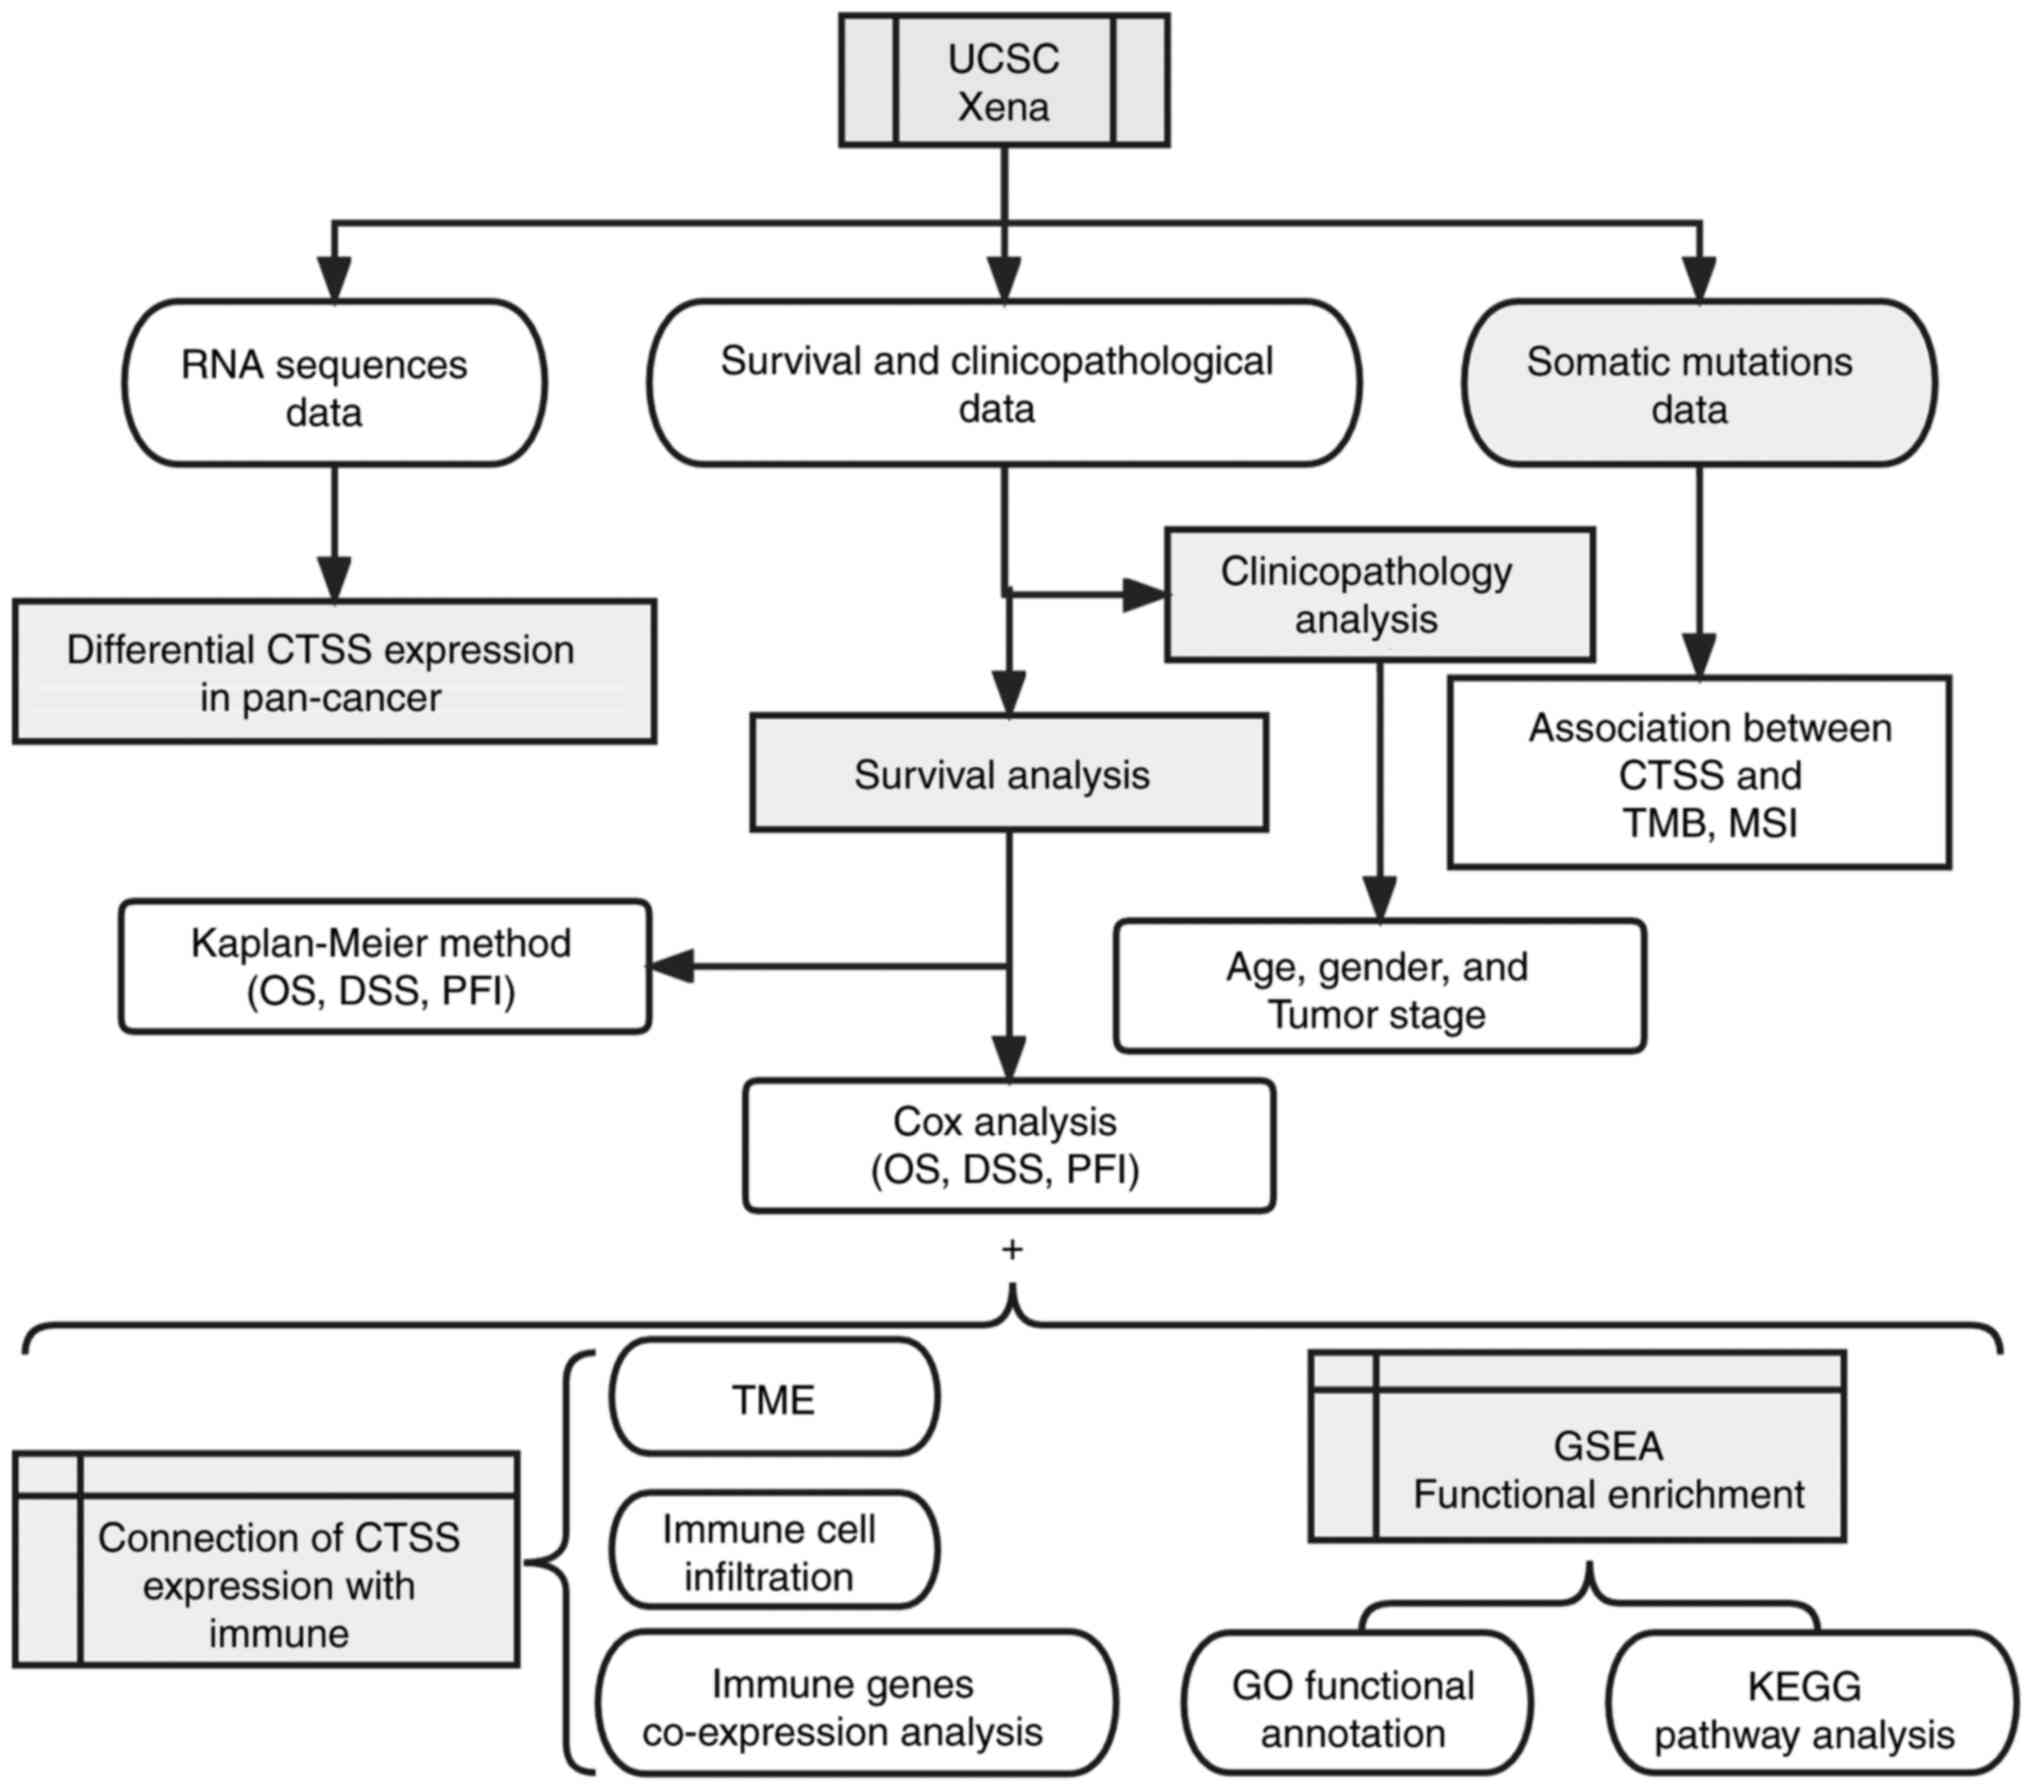 | Figure 1.Analytical flow chart of CTSS. CTSS,
cathepsin S; UCSC, University of California Santa Cruz; OS, overall
survival; DSS, disease-specific survival; PFI, progression free
interval; TMB, tumor mutational burden; MSI, microsatellite
instability; TME, tumor microenvironment; GSEA, Gene Set Enrichment
Analysis; GO, Gene Ontology; KEGG, Kyoto Encyclopedia of Genes and
Genomes. |
Materials and methods
Data acquisition and clinical specimen
information
Datasets comprising 33 tumors types [acute myeloid
leukemia, adrenocortical carcinoma (ACC), cholangiocarcinoma,
bladder urothelial carcinoma (BLCA), breast invasive carcinoma
(BRCA), cervical squamous cell carcinoma (CESC), colon
adenocarcinoma (COAD), uterine corpus endometrioid cancer (UCEC),
esophageal carcinoma (ESCA), glioblastoma (GBM), head and neck cell
carcinoma (HNSC), kidney chromophobe (KICH), kidney renal clear
cell carcinoma (KIRC), kidney renal papillary cell carcinoma
(KIRP), diffuse large B-cell lymphoma (DLBC), liver hepatocellular
carcinoma (LIHC), lower grade glioma (LGG), lung adenocarcinoma
(LUAD), lung squamous cell carcinoma (LUSC), skin cutaneous
melanoma (SKCM), mesothelioma, uveal melanomas (UVM), ovarian
serous cystadenocarcinoma (OV), pancreatic adenocarcinoma (PAAD),
pheochromocytoma and paraganglioma (PCPG), prostate adenocarcinoma
(PRAD), rectal adenocarcinoma (READ), sarcoma (SARC), stomach
adenocarcinoma (STAD), testicular germ cell tumors (TGCT), thymoma
(THYM), thyroid carcinoma (THCA) and uterine carcinosarcoma] were
obtained from The Cancer Genome Atlas (TCGA) from the University of
California Santa Cruz (UCSC Xena; http://xenabrowser.net/). These datasets contained RNA
sequences (HTSeq-FPKM), somatic mutations (VarScan2 Variant
Aggregation and Masking), survival (Survival data) and
clinicopathological data
(Survival_SupplementalTable_S1_20171025_xena_sp) of patients with
cancer. The clinical KIRC tissue samples (n=4) were acquired from
patients at The First Affiliated Hospital of Guangxi Medical
University from December 2022 to March 2023 (additional validation
sample added in October). The present study was approved by the
Medical Ethics Committee of The First Affiliated Hospital of
Guangxi Medical University (approval no. 2022-E387-01; Nanning,
China). Informed consent was provided by each patient.
Differential expression and genomic
alteration of CTSS in pan-cancer
CTSS expression extraction and integration
CTSS expression levels were extracted and integrated
for subsequent analysis from RNA sequences using Perl software.
Subsequently, differential CTSS expressions between cancerous and
normal tissues in various cancers were analyzed utilizing the
R-package ‘ggpubr’ (version 4.0; http://rpkgs.datanovia.com/ggpubr/) and shown as a box
plot with a cut off value of P=0.05.
Assessment of CTSS changes in multiple
cancers
CTSS alterations were assessed in multiple cancers
using the cBioPortal database v5.4.7 (https://www.cbioportal.org). Data from 32 studies,
including 10,953 patients (10,967 samples), were incorporated.
Connection of CTSS expression with
prognosis and clinicopathological indicators
Survival analysis
The survival information for each patient was
retrieved from the TCGA database and the CTSS expression matrix in
tumor tissue was integrated with the survival time utilizing the
‘limma’ package (version 3.46.0; http://bioinf.wehi.edu.au/limma). Kaplan-Meier curves
were made using the ‘survminer’ (version 0.4.9; http://rpkgs.datanovia.com/survminer/index.html)
and ‘survival’ (version 3.3–1; http://github.com/therneau/survivalpackages) to
visualize the connection between CTSS expression with patients'
prognosis in terms of OS, PFI, and DSS. Univariate Cox regression
analysis was performed to determine the hazard ratio (HR) with 95%
confidence intervals and the P-value. Log-rank analysis was
performed. A forest plot was delineated utilizing the ‘survival’
and ‘forestplot’ (version 2.0.1; http://gforge.se/packages/) packages.
Evaluation of CTSS expression with
clinicopathological indicators
The connection of CTSS expression with
clinicopathological indicators, including age, sex and tumor stage
(American Joint Committee on Cancer) (22), was evaluated using the ‘limma’ and
‘ggpubr’ packages. CTSS in different cancer types was further
analyzed using the ‘Gene Outcome’ module of TIMER2.0 (http://timer.cistrome.org/). This module used the Cox
proportional hazard model to evaluate the outcome significance of
CTSS gene expression, optionally adjusted by clinical factors
(including age, sex and stage) and a heatmap illustrated the
normalized coefficient of the CTSS gene in the Cox model.
Correlation between CTSS and
immunotherapeutic response
Somatic mutation and MSI score were obtained from
the TCGA database, and used to determine the normalization value of
each sample's TMB. The connection of CTSS with TMB and MSI was
visualized through radar maps generated using the ‘fmsb’ package
(version 0.7.5; http://minato.sip21c.org/msb/) ‘Biomarker evaluation’
and ‘query gene’ modules of the Tumor Immune Dysfunction and
Exclusion database (http://tide.dfci.harvard.edu/) were used to evaluate
the potential function of CTSS as a biomarker for
immunotherapy.
Connection of CTSS expression with
TME
The immune and stromal cell scores of CTSS
expression data were calculated using the ESTIMATE algorithm,
implemented through the R-packages ‘limma’ and ‘estimate’ (version
1.0.13; http://r-forge.r-project.org/projects/estimate/).
The connection of CTSS expression with stromal and immune scores
was visualized utilizing the ‘ggplot2’ (version 3.3.5; http://ggplot2.tidyverse.org), ‘ggpubr’ and ‘ggExtra’
(version 0.10.0; http://github.com/daattali/ggExtra) packages.
Connection of CTSS expression with
immune cell infiltration and immune-related genes
The CIBERSORT algorithm was used to analyze the
relative proportion of immune cell infiltration in each sample. The
connection between CTSS expression and immune cell infiltration was
visualized using the ‘ggplot2’, ‘ggpubr’ and ‘ggExtra’ packages.
Then, the relationship between CTSS mutation and immune
infiltration was further explored using the ‘Mutation’ module of
TIMER2.0 (http://timer.cistrome.org/).
Moreover, the correlation between immune-related genes and the CTSS
gene was analyzed using the ‘limma’ package, and the results were
visualized in a heatmap created with the ‘reshape2’ (version 1.4.4.
URL: http://github.com/hadley/reshape) and ‘RColorBrewer’
(version 1.1–3) packages.
Functional enrichment analysis of the
CTSS gene
The Gene Ontology (GO) and Kyoto Encyclopedia of
Genes and Genomes (KEGG) gene sets were downloaded from the Gene
Set Enrichment Analysis site (https://www.gsea-msigdb.org/gsea/downloads.jsp). The
GO functional annotation and KEGG pathway enrichment analyses of
CTSS were performed and visualized utilizing the ‘limma’,
‘org.Hs.eg.db’ (version 3.12.0), ‘clusterProfiler’ (version 3.18.1;
http://yulab-smu.top/biomedical-knowledge-mining-book/)
and ‘enrichplot’ (version 1.10.2; http://yulab-smu.top/biomedical-knowledge-mining-book/)
packages.
Validation of differential expression
of CTSS
Reverse transcription quantitative PCR
(RT-qPCR)
Total tissue RNA was extracted from the frozen
normal and KIRC tissues using the AxyPrep Total RNA Small Volume
Preparation Kit (cat. no. UEL-UE-MN-MS-RNA-50G; Corning, Inc.). The
Fast Start Essential DNA Green Master kit (Roche, USA) was utilized
for PCR amplification and fluorescence quantification of nucleic
acids. The PCR was performed on an Applied Biosystems 7500
Real-Time PCR System (Thermo Fisher Scientific, Inc.) with the
following thermocycling conditions: Initially, a three-step
amplification process was employed, comprising 10 sec at 95°C, 10
sec at 60°C and 10 sec at 72°C, for a total of 45 cycles.
Subsequently, a melting stage was executed, involving thermal
insulation at 95°C for 10 sec, 65°C for 60 sec and 97°C for 1 sec.
Finally, the reaction mixture was cooled at 37°C for 30 sec. The
primer sequences used were as follows: CTSS forward (F),
5′-TGACAACGGCTTTCCAGTACA-3′ and reverse (R),
5′-GGCAGCACGATATTTTGAGTCAT-3′; and β-actin F,
5′-GTCATTCCAAATATGAGATGCGT-3′ and R, 5′-GCTATCACCTCCCCTGTGTG-3′.
β-actin was used as an internal control gene and the
2−ΔΔCq method was used to calculate the relative
expression level (23,24).
Western blotting
Total tissue protein was extracted using RIPA lysate
buffer (Beijing Solarbio Science & Technology Co., Ltd.),
containing protease inhibitors (including 1% PMSF and 1%
phosphoprotease inhibitors) and the protein concentration was then
quantified using the BCA Protein Assay Kit (EpiZyme Scientific).
After adding 5× SDS-PAGE protein loading buffer, the protein sample
was boiled at 100°C for 10 min. The proteins (50 µg/lane) were
separated by SDS-PAGE on a 12% gel, then transferred to a
polyvinylidene fluoride membrane. The membrane was blocked with 5%
skimmed milk for 1 h and then washed thrice for 5 min each, in 1×
TBST. The membrane was then incubated with primary antibodies at
4°C overnight, washed in TBST, then incubated with secondary
antibodies at room temperature for 1 h. Finally, the blots were
visualized using the Immobilon Western Chemiluminescent HRP
substrate (Merck KGaA) and analyzed using Image J software 1.8.0
(National Institutes of Health) and GraphPad Prism 9.4.0
(Dotmatics). The antibody information is provided in Table I.
 | Table I.Antibody information. |
Table I.
Antibody information.
| Antibody | Host | Dilution | Manufacturer | Cat. no. |
|---|
| CTSS | Rabbit | 1:1,000 | Cusabio Technology,
LLC |
CSB-PA10729A0Rb |
| β-actin | Mouse | 1:2,000 | Proteintech Group,
Inc. | 66009-1-Ig |
| Goat
anti-rabbit | Goat | 1:5,000 | Thermo Fisher
Scientific, Inc. | 31460 |
| Goat
anti-mouse | Goat | 1:5,000 | Proteintech Group,
Inc. | SA00001-1 |
Immunohistochemistry
Immunohistochemical staining images of CTSS protein
expression in three normal tissues and malignant tumors tissues
were downloaded from the Tissue Atlas and Pathology Atlas of the
Human Protein Atlas (HPA) database (https://www.proteinatlas.org/).
Statistical analysis
The Wilcoxon signed-rank test was used to assess
differential CTSS expression in tumor and normal tissues.
Univariate Cox regression analysis and Kaplan-Meier methods were
used to assess the association of CTSS expression with patients'
survival. P<0.05 was considered to indicate a statistically
significant difference. All statistical analyses were processed
using R (version 4.0.3), Strawberry Perl (version 10.0.22000.527)
and GraphPad Prism (version 9.4.0).
Results
Expression and genomic alteration
profiles of CTSS in pan-cancer
To examine the variations in CTSS mRNA levels
between cancerous and normal tissues, R software was used to
analyze data from the TCGA database. These findings demonstrated
that CTSS expression was significantly higher in malignant tissues
compared with benign tissues in CESC, GBM, KIRC, KIRP, STAD, THCA
and UCEC. Conversely, significantly lower CTSS expression was
observed in COAD, LUAD, LUSC, PAAD, PRAD and READ (Fig. 2A). Moreover, changes in CTSS
expression were assessed across various cancers. According to the
cBioPortal database, there were changes to the CTSS gene in 518
(5%) of 10,953 patients, with amplification being the most common
alteration, followed by mutation. Notably, LIHC displayed the
highest frequency of CTSS alteration among all cancers assessed,
while SKCM had the highest mutation frequency relative to total
alterations (Fig. 2B). These
results underscored the abnormal expression and distinct genomic
alteration profiles of CTSS in pan-cancer datasets.
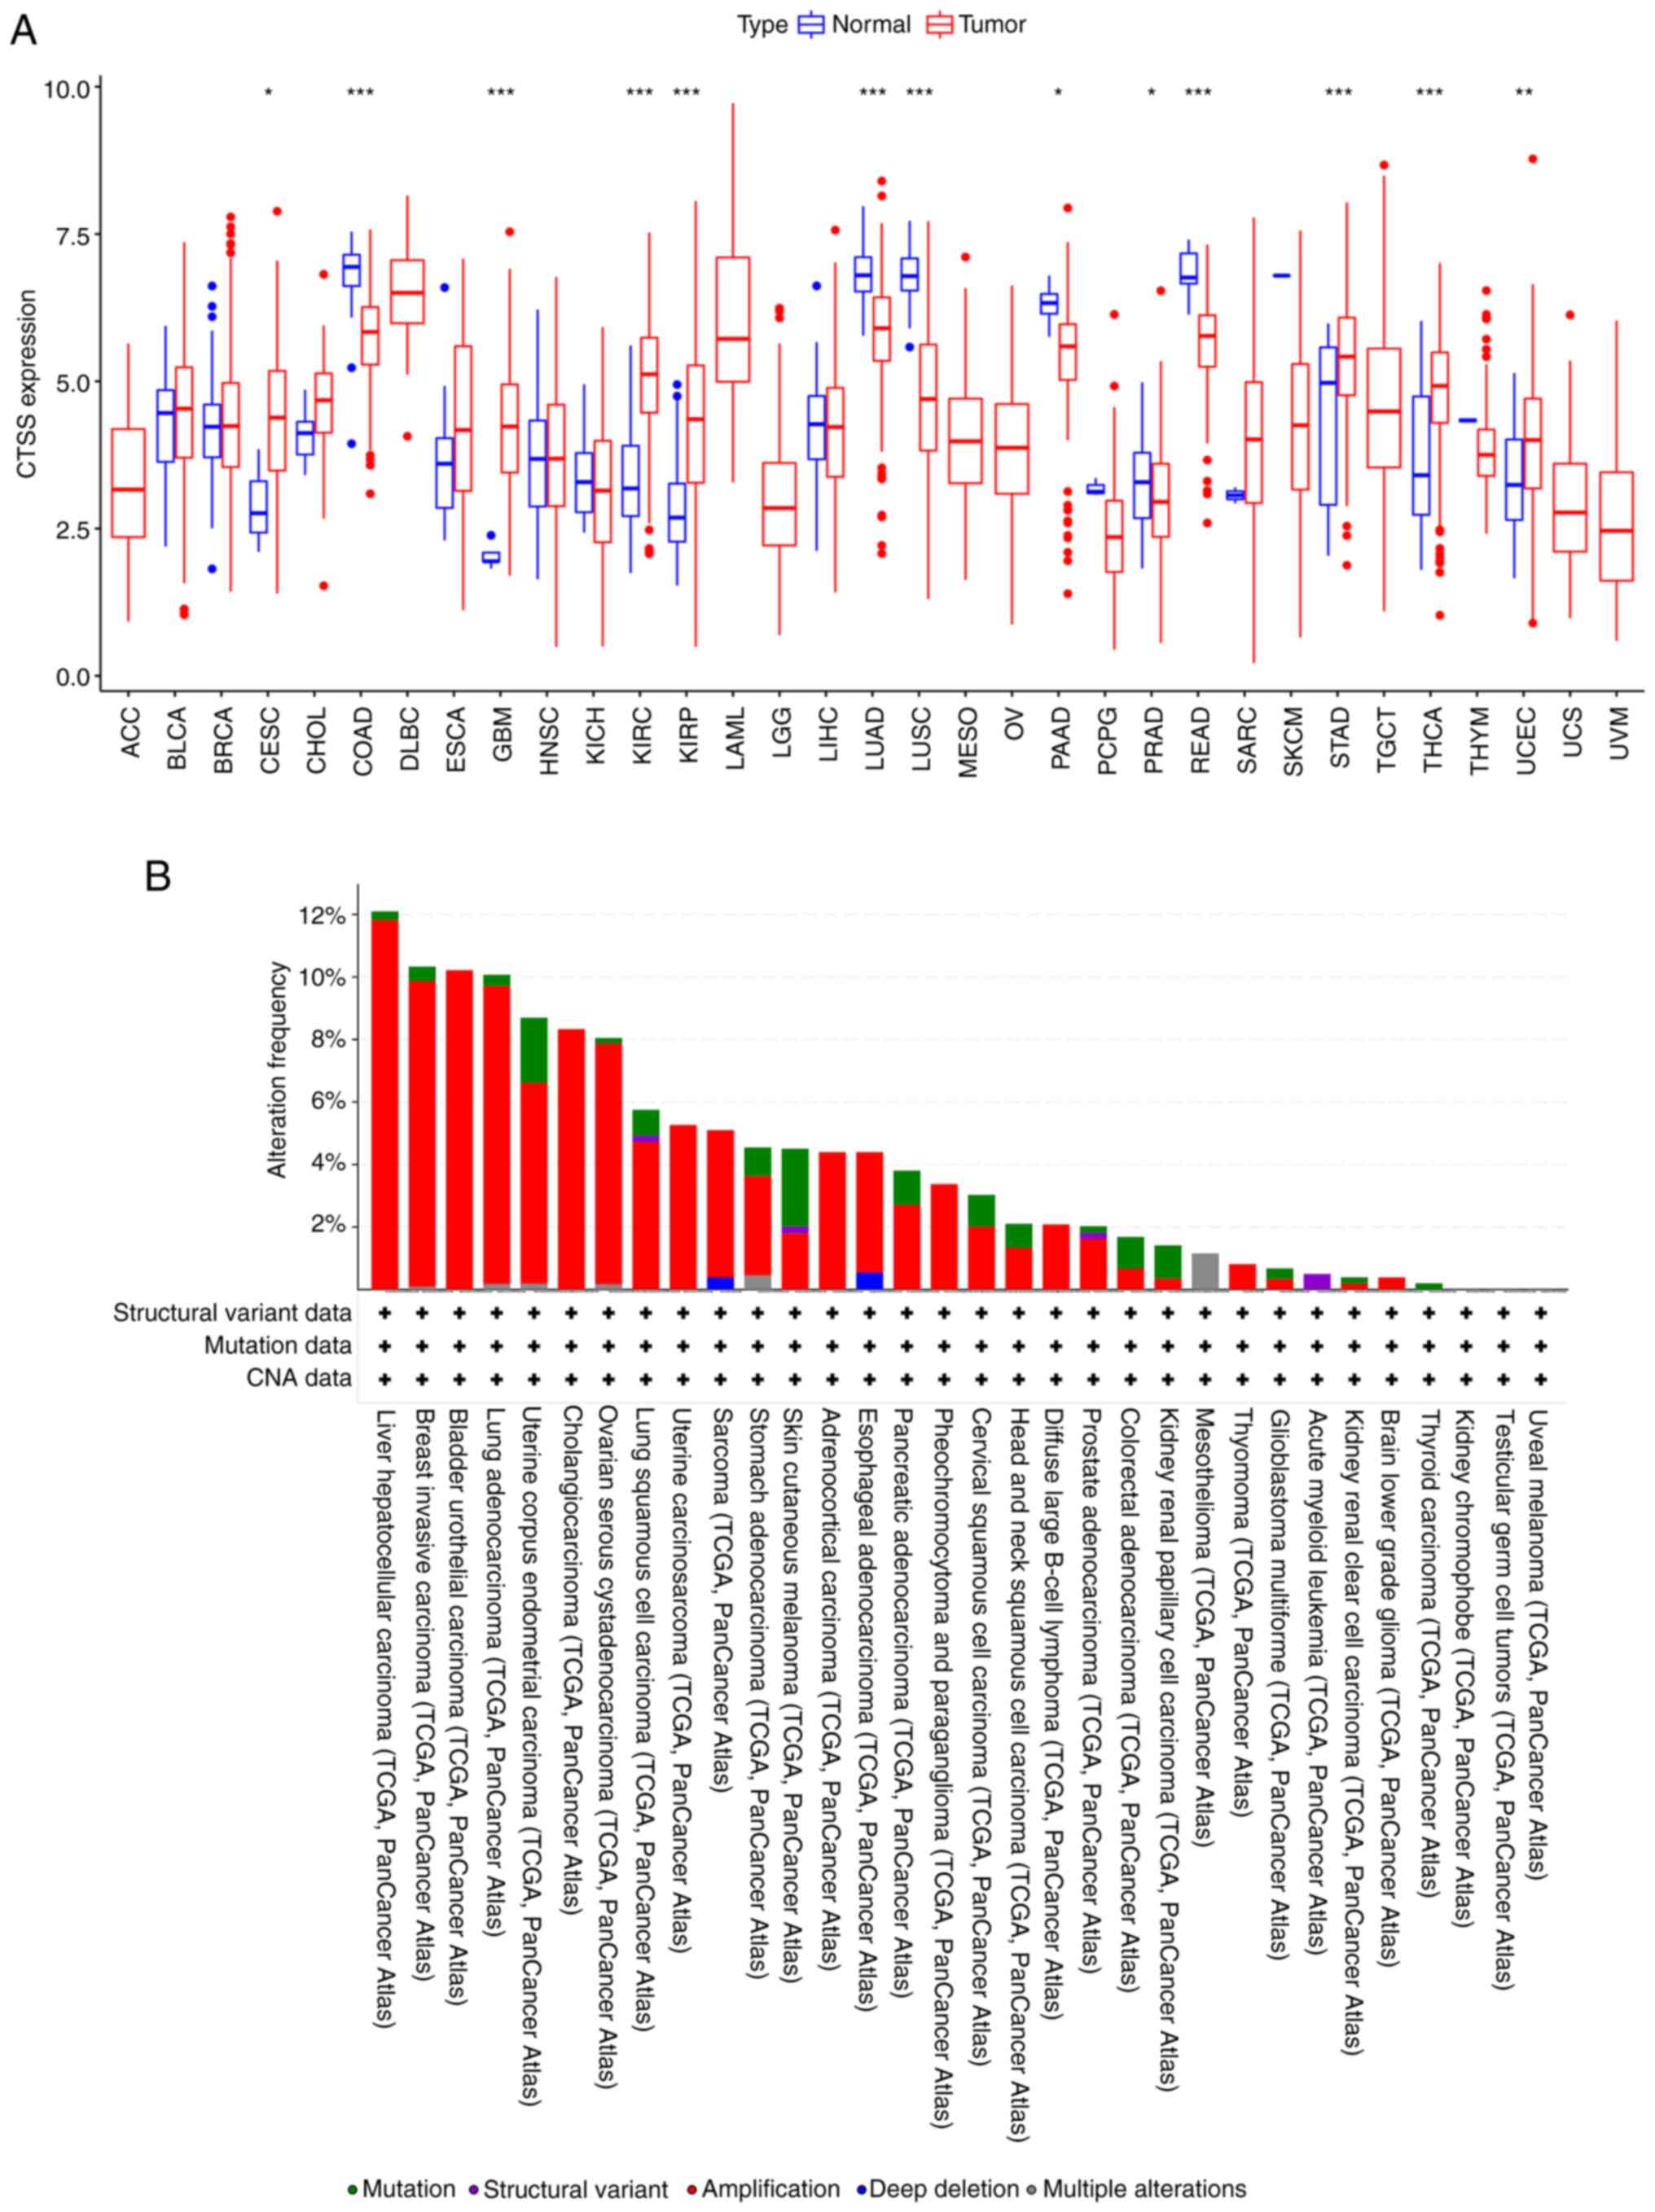 | Figure 2.Expression levels and genomic
alteration of CTSS gene. (A) CTSS expression in 33 human cancer
types. (B) Alteration profiles of the CTSS gene in diverse
malignant tumors from the cBioPortal database. *P<0.05,
**P<0.01 and ***P<0.001. ACC, adrenocortical carcinoma; BLCA,
bladder urothelial carcinoma; BRCA, breast invasive carcinoma;
CESC, cervical squamous cell carcinoma; CHOL, cholangiocarcinoma;
COAD, colon adenocarcinoma; DLBC, diffuse large B cell lymphoma;
ESCA, esophageal carcinoma; GBM, glioblastoma; HNSC, head-neck
squamous cell carcinoma; KICH, kidney chromophobe; KIRC, kidney
renal clear cell carcinoma; KIRP, kidney renal papillary cell
carcinoma; LAML, acute myeloid leukemia; LGG, lower grade glioma;
LIHC, liver hepatocellular carcinoma; LUAD, lung adenocarcinoma;
LUSC, lung squamous cell carcinoma; MESO, mesothelioma; OV, ovarian
serous cystadenocarcinoma; PAAD, pancreatic adenocarcinoma; PCPG,
pheochromocytoma and paraganglioma; PRAD, prostate adenocarcinoma;
READ, rectal adenocarcinoma; SARC, sarcoma; SKCM, skin cutaneous
melanoma; STAD, stomach adenocarcinoma; TGCT, testicular germ cell
tumors; THCA, thyroid carcinoma; THYM, thymoma; UCEC, uterine
corpus endometrial carcinoma; UCS, uterine carcinosarcoma; UVM,
uveal melanoma; TCGA, The Cancer Genome Atlas; CTSS, cathepsin S;
CNA, copy number alteration. |
Relationship between CTSS expression
and prognosis in multiple cancers
To comprehensively assess the correlation between
CTSS expression and prognosis in patients with cancer, the
relationship between CTSS and survival-related indicators OS, PFI
and DSS was analyzed for 33 cancer types using univariate Cox
analysis and Kaplan-Meier methods.
OS
The present study demonstrated significant
associations between CTSS expression and OS for seven cancer types,
including LGG (P<0.001, HR=1.492), BLCA (P=0.003,
HR=0.832), THYM (P=0.007, HR=2.487), PAAD (P=0.042,
HR=1.213), SKCM (P<0.001, HR=0.818), SARC
(P=0.025, HR=0.855) and UVM (P=0.004, HR=1.517)
(Fig. 3A).
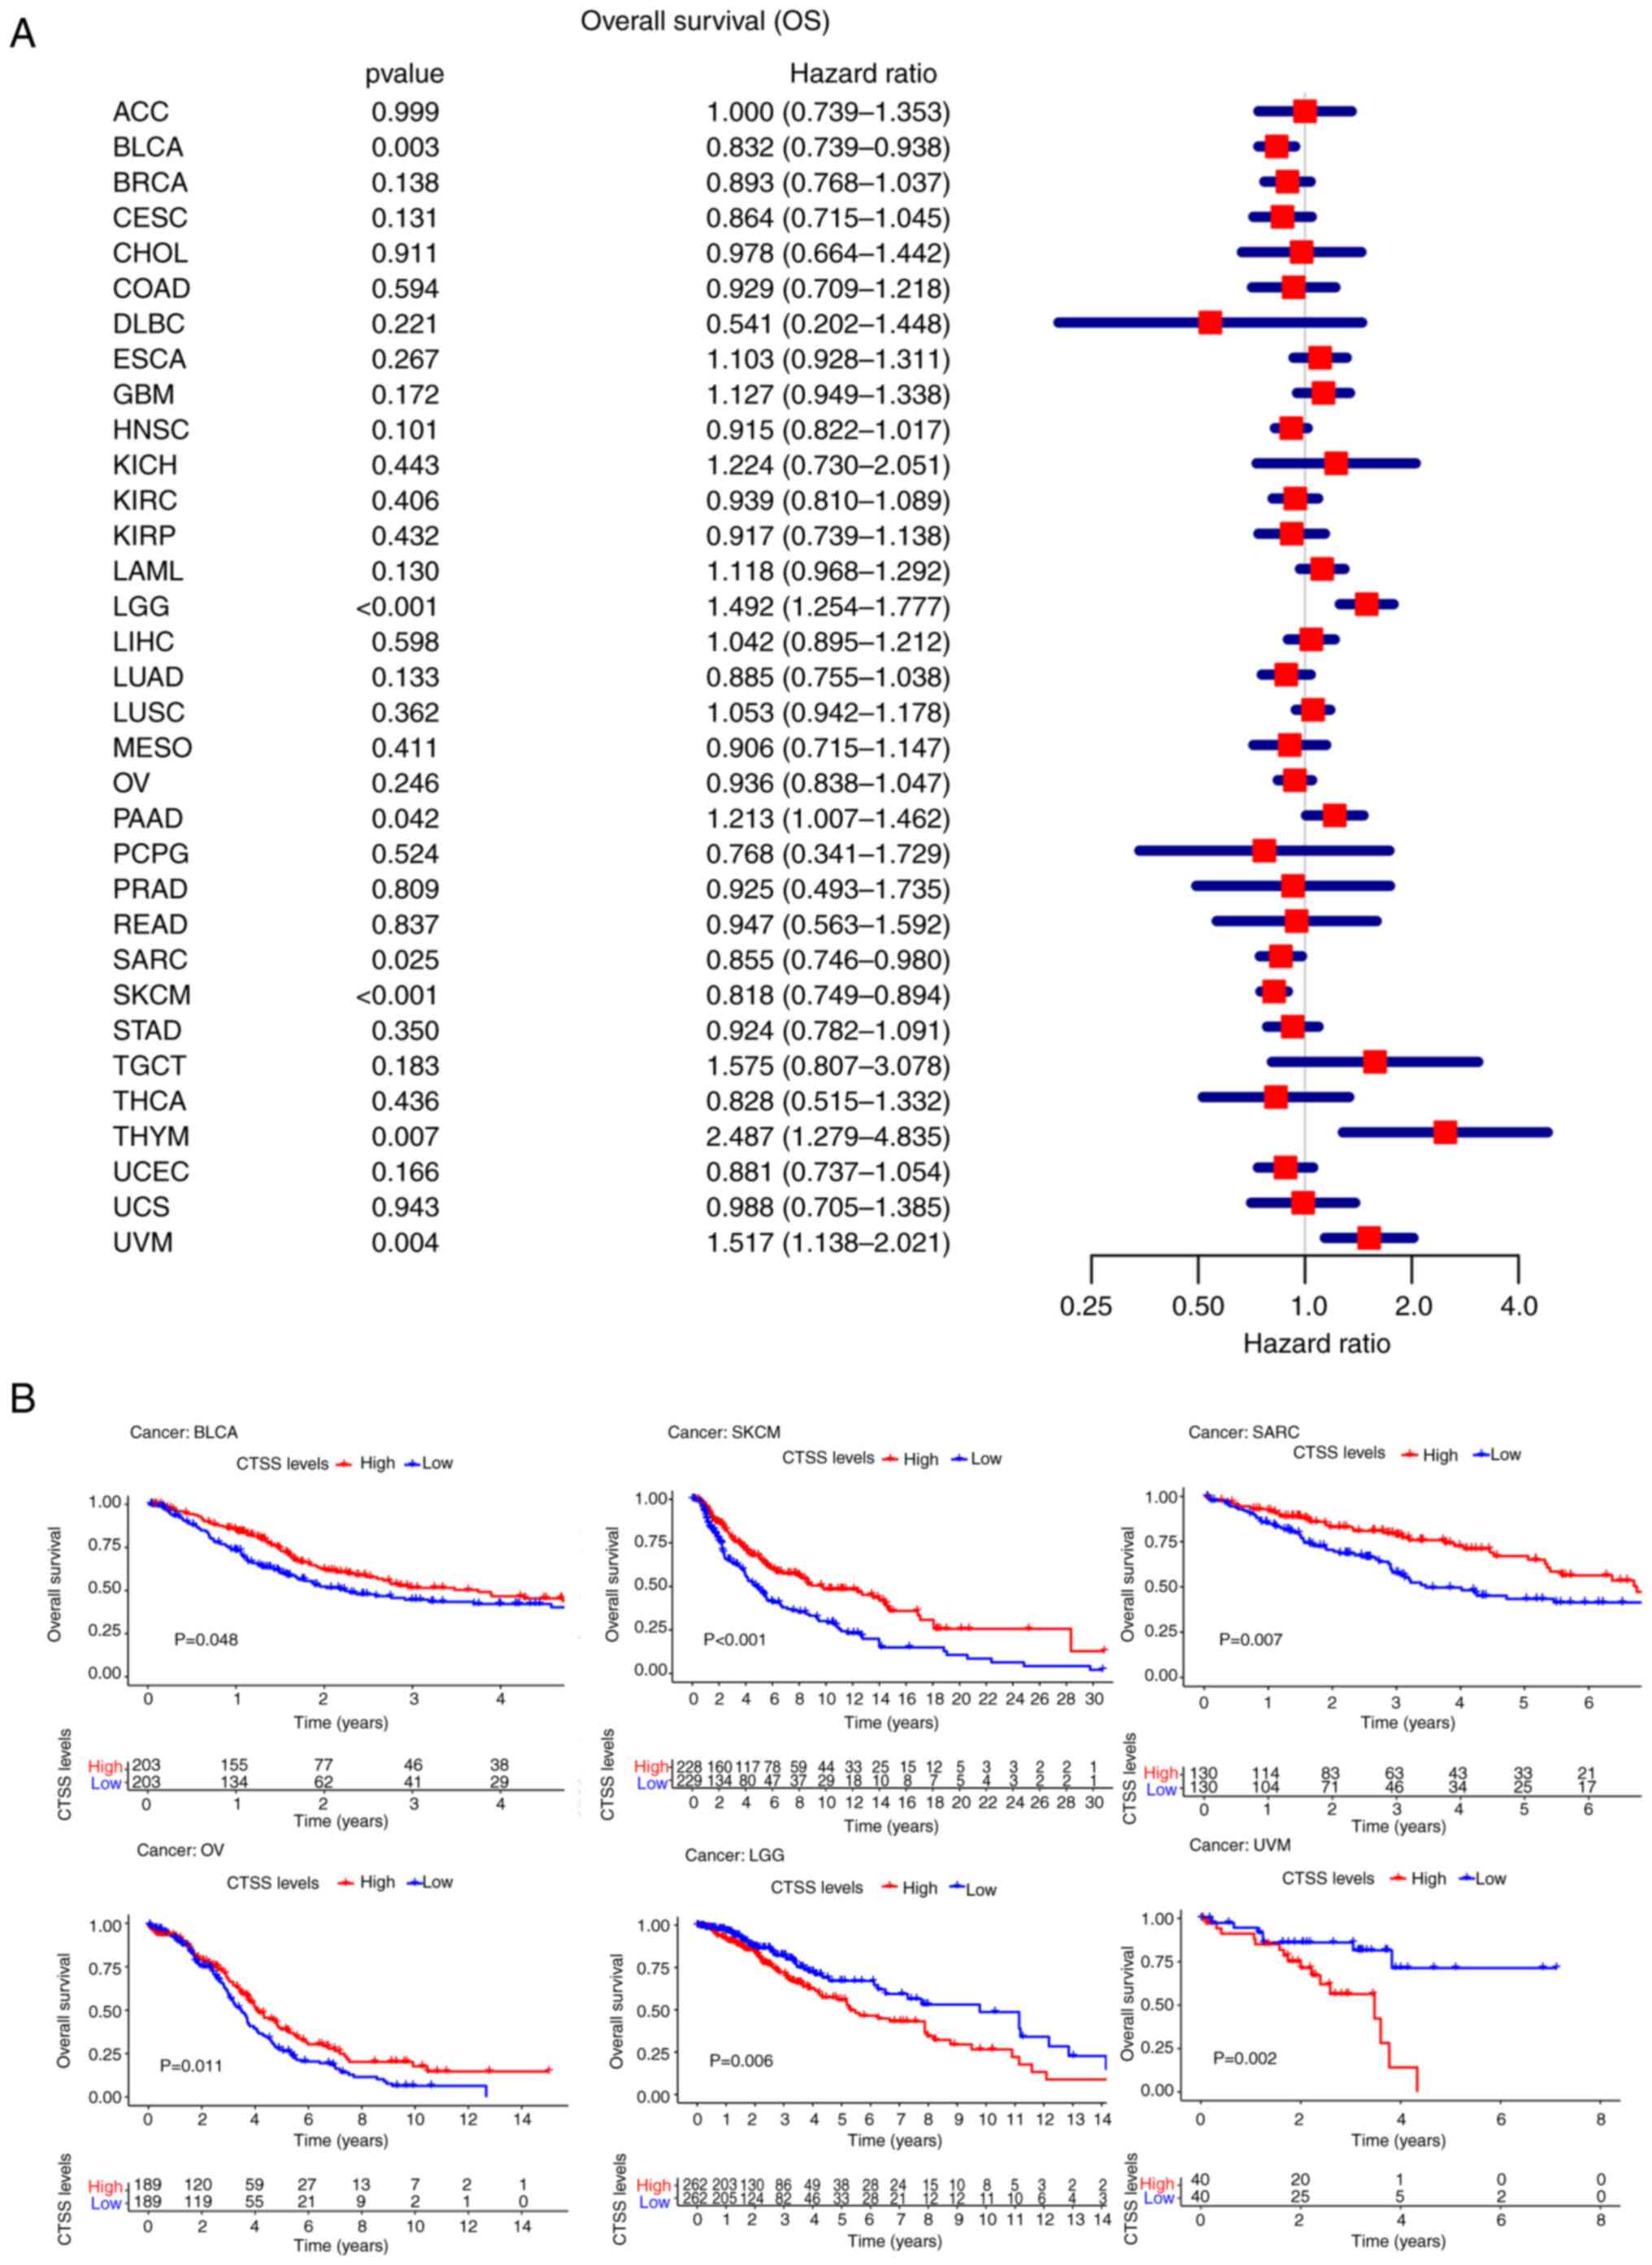 | Figure 3.Relationship between CTSS expression
and the overall survival (OS) in pan-cancer. (A) Forest plot
showing the hazard ratios of CTSS in pan-cancer. (B) Kaplan-Meier
curves demonstrate the correlation of CTSS expression with the
patients' OS in BLCA, SKCM, SARC, OV, LGG, and UVM. ACC,
adrenocortical carcinoma; BLCA, bladder urothelial carcinoma; BRCA,
breast invasive carcinoma; CESC, cervical squamous cell carcinoma;
CHOL, cholangiocarcinoma; COAD, colon adenocarcinoma; DLBC, diffuse
large B cell lymphoma; ESCA, esophageal carcinoma; GBM,
glioblastoma; HNSC, head-neck squamous cell carcinoma; KICH, kidney
chromophobe; KIRC, kidney renal clear cell carcinoma; KIRP, kidney
renal papillary cell carcinoma; LAML, acute myeloid leukemia; LGG,
lower grade glioma; LIHC, liver hepatocellular carcinoma; LUAD,
lung adenocarcinoma; LUSC, lung squamous cell carcinoma; MESO,
mesothelioma; OV, ovarian serous cystadenocarcinoma; PAAD,
pancreatic adenocarcinoma; PCPG, pheochromocytoma and
paraganglioma; PRAD, prostate adenocarcinoma; READ, rectal
adenocarcinoma; SARC, sarcoma; SKCM, skin cutaneous melanoma; STAD,
stomach adenocarcinoma; TGCT, testicular germ cell tumors; THCA,
thyroid carcinoma; THYM, thymoma; UCEC, uterine corpus endometrial
carcinoma; UCS, uterine carcinosarcoma; UVM, uveal melanoma; CTSS,
cathepsin S. |
Kaplan-Meier OS curves demonstrated a significant
positive association between OS and CTSS in BLCA (P=0.048),
OV (P=0.011), SKCM (P<0.001) and SARC (P=0.007)
however, a significant negative association was observed between OS
and CTSS in LGG (P=0.006) and UVM (P=0.002) (Fig. 3B).
DSS
CTSS expression was significantly correlated with
DSS in BLCA (P<0.001, HR=0.785), CESC (P=0.030,
HR=0.785), LGG (P<0.001, HR=1.539), LUAD (P=0.023,
HR=0.799), SKCM (P<0.001, HR=0.798), THCA
(P=0.004, HR=0.436), and UVM (P=0.017, HR=1.434)
(Fig. 4A).
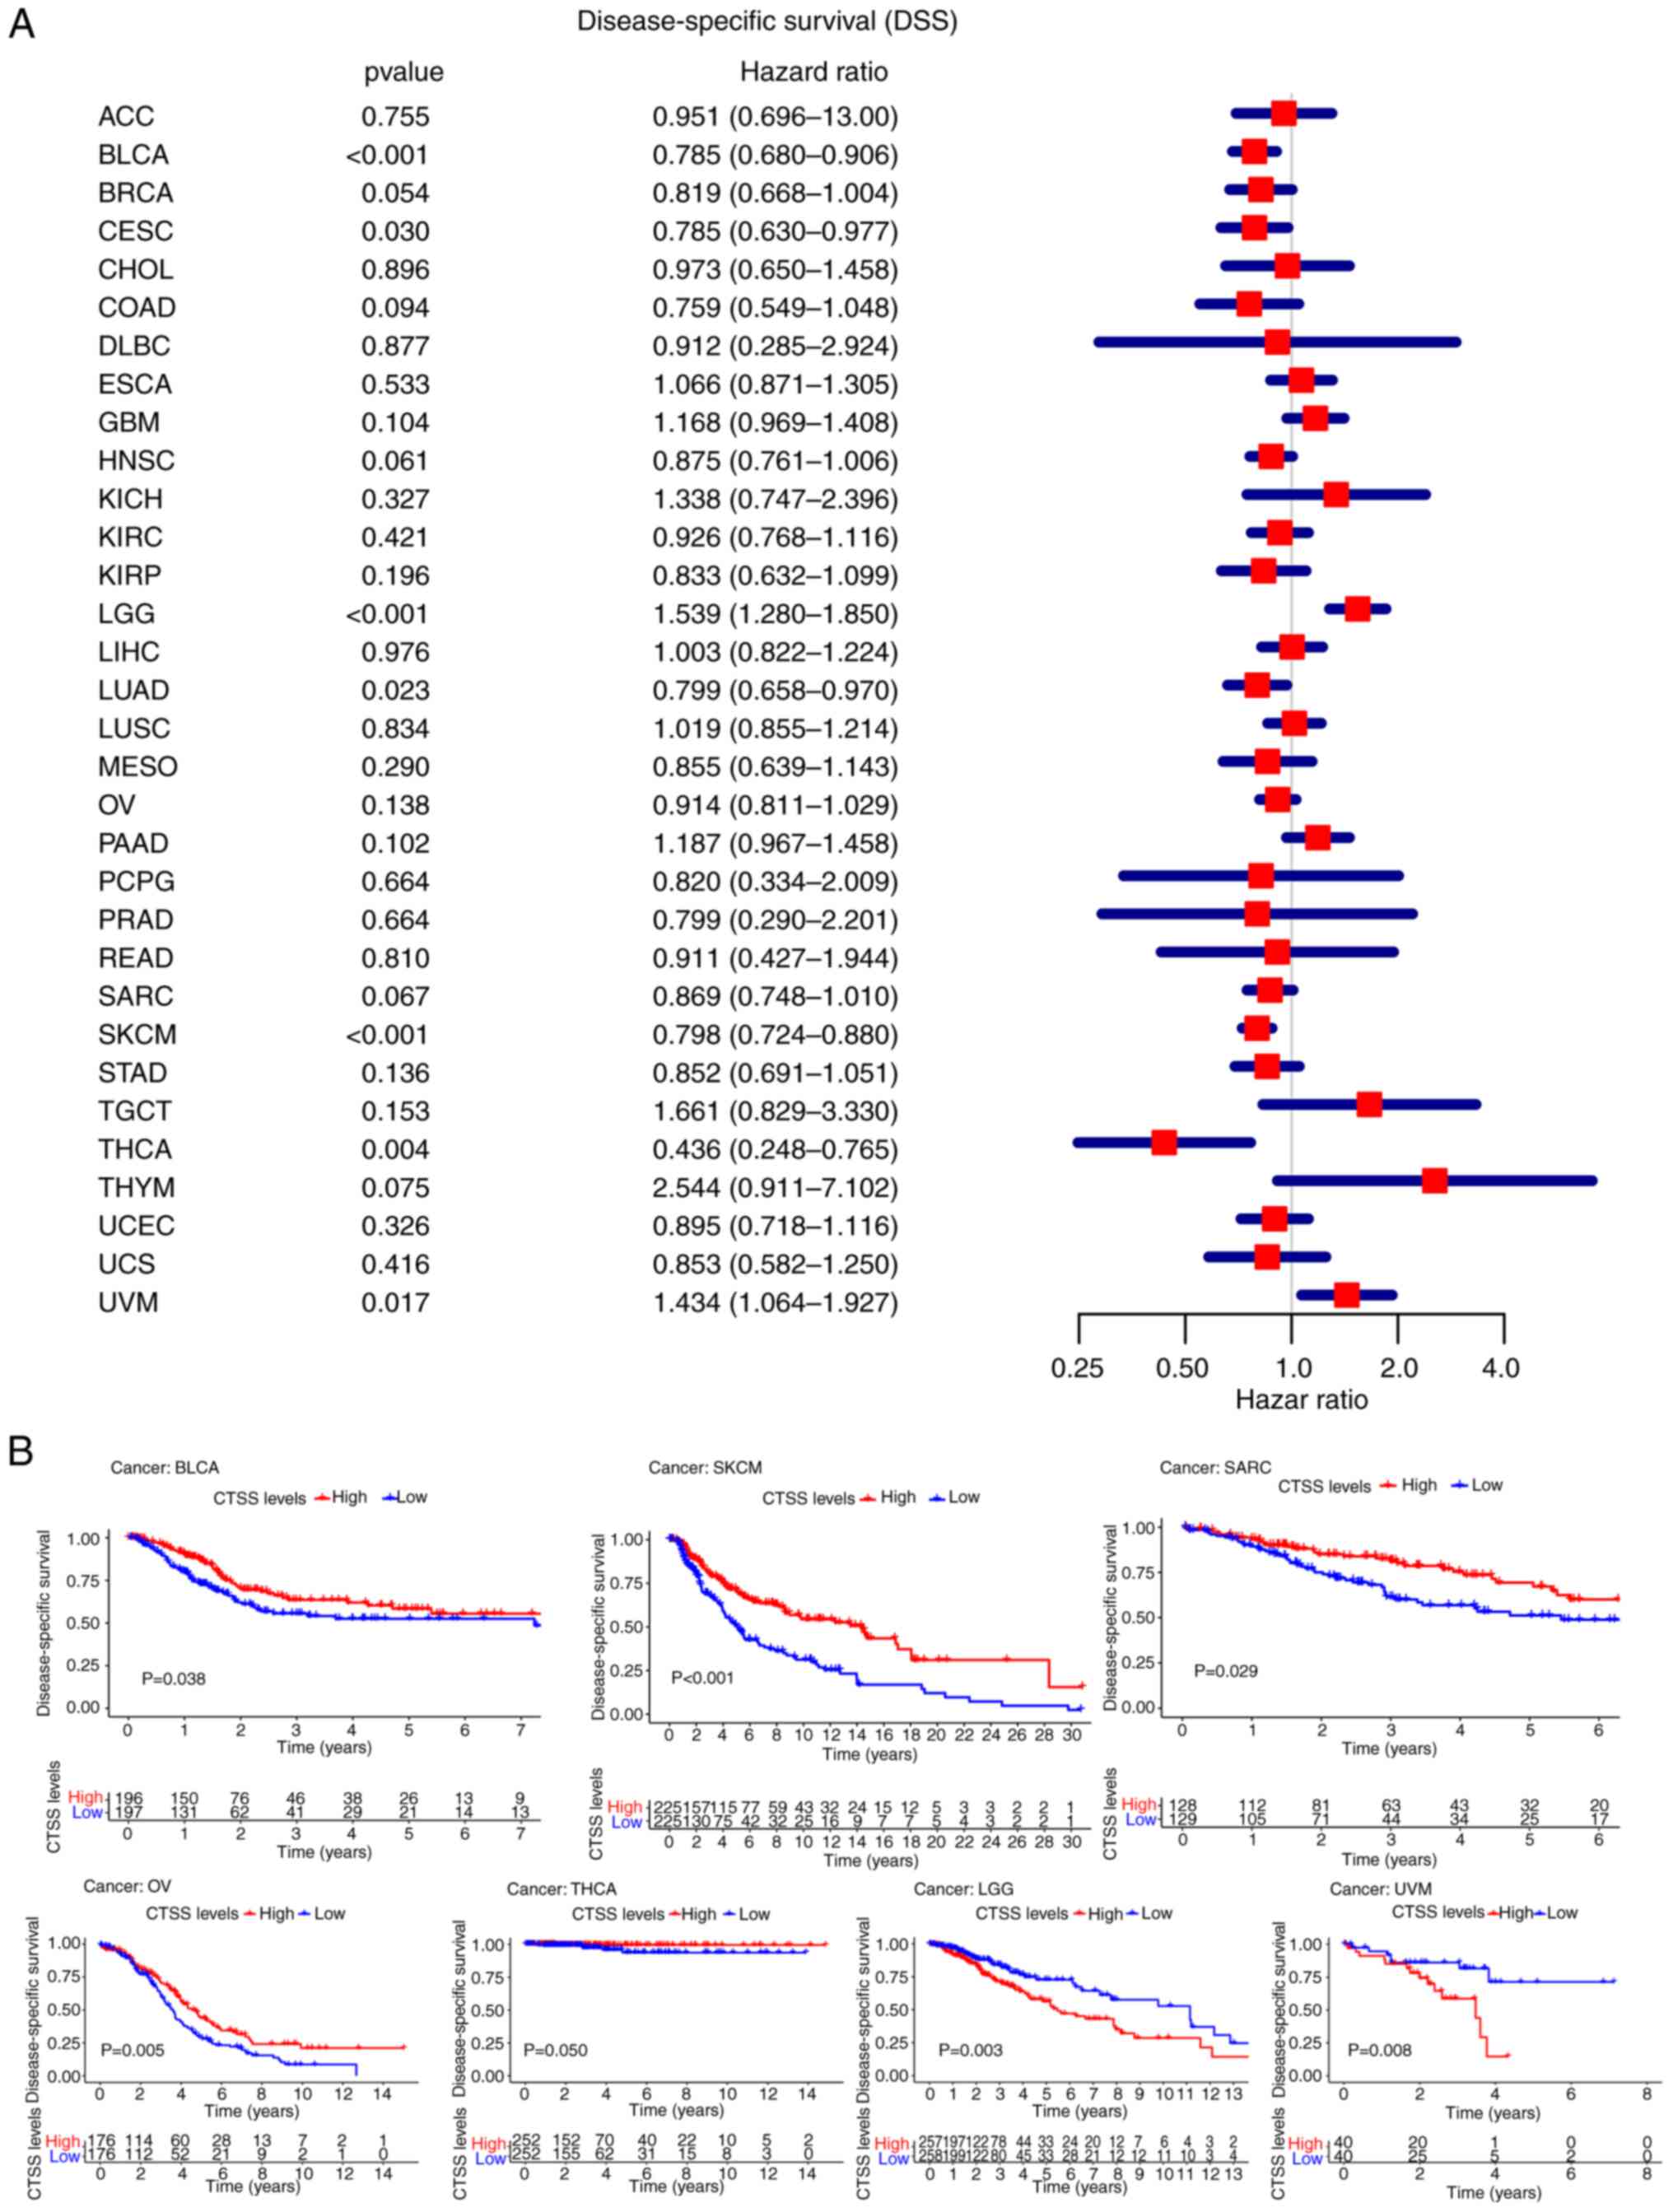 | Figure 4.Correlation analysis of CTSS
expression with the DSS in pan-cancer. (A) Forest plot showing the
hazard ratios of CTSS in pan-cancer. (B) Kaplan-Meier curves
demonstrate the connection of CTSS expression with the patients'
DSS in BLCA, SKCM, SARC, OV, THCA, LGG, and UVM. ACC,
adrenocortical carcinoma; BLCA, bladder urothelial carcinoma; BRCA,
breast invasive carcinoma; CESC, cervical squamous cell carcinoma;
CHOL, cholangiocarcinoma; COAD, colon adenocarcinoma; DLBC, diffuse
large B cell lymphoma; ESCA, esophageal carcinoma; GBM,
glioblastoma; HNSC, head-neck squamous cell carcinoma; KICH, kidney
chromophobe; KIRC, kidney renal clear cell carcinoma; KIRP, kidney
renal papillary cell carcinoma; LAML, acute myeloid leukemia; LGG,
lower grade glioma; LIHC, liver hepatocellular carcinoma; LUAD,
lung adenocarcinoma; LUSC, lung squamous cell carcinoma; MESO,
mesothelioma; OV, ovarian serous cystadenocarcinoma; PAAD,
pancreatic adenocarcinoma; PCPG, pheochromocytoma and
paraganglioma; PRAD, prostate adenocarcinoma; READ, rectal
adenocarcinoma; SARC, sarcoma; SKCM, skin cutaneous melanoma; STAD,
stomach adenocarcinoma; TGCT, testicular germ cell tumors; THCA,
thyroid carcinoma; THYM, thymoma; UCEC, uterine corpus endometrial
carcinoma; UCS, uterine carcinosarcoma; UVM, uveal melanoma; CTSS,
cathepsin S. |
Kaplan-Meier curves of DSS demonstrated that high
CTSS expression was significantly associated with a favorable
prognosis in BLCA (P=0.038), OV (P=0.005), SARC
(P=0.029), SKCM (P<0.001) and THCA
(P=0.050), and was significantly associated with an
unfavorable prognosis in LGG (P=0.003) and UVM
(P=0.008) (Fig. 4B).
PFI
Furthermore, the present study demonstrated
significant associations between CTSS expression and PFI in 6
cancer types; BLCA (P=0.003, HR=0.832), COAD
(P=0.013, HR=0.739), GBM (P=0.007, HR=1.257), LGG
(P<0.001, HR=1.374), SKCM (P=0.018, HR=0.910) and
THYM (P=0.041, HR=1.688) (Fig.
5A).
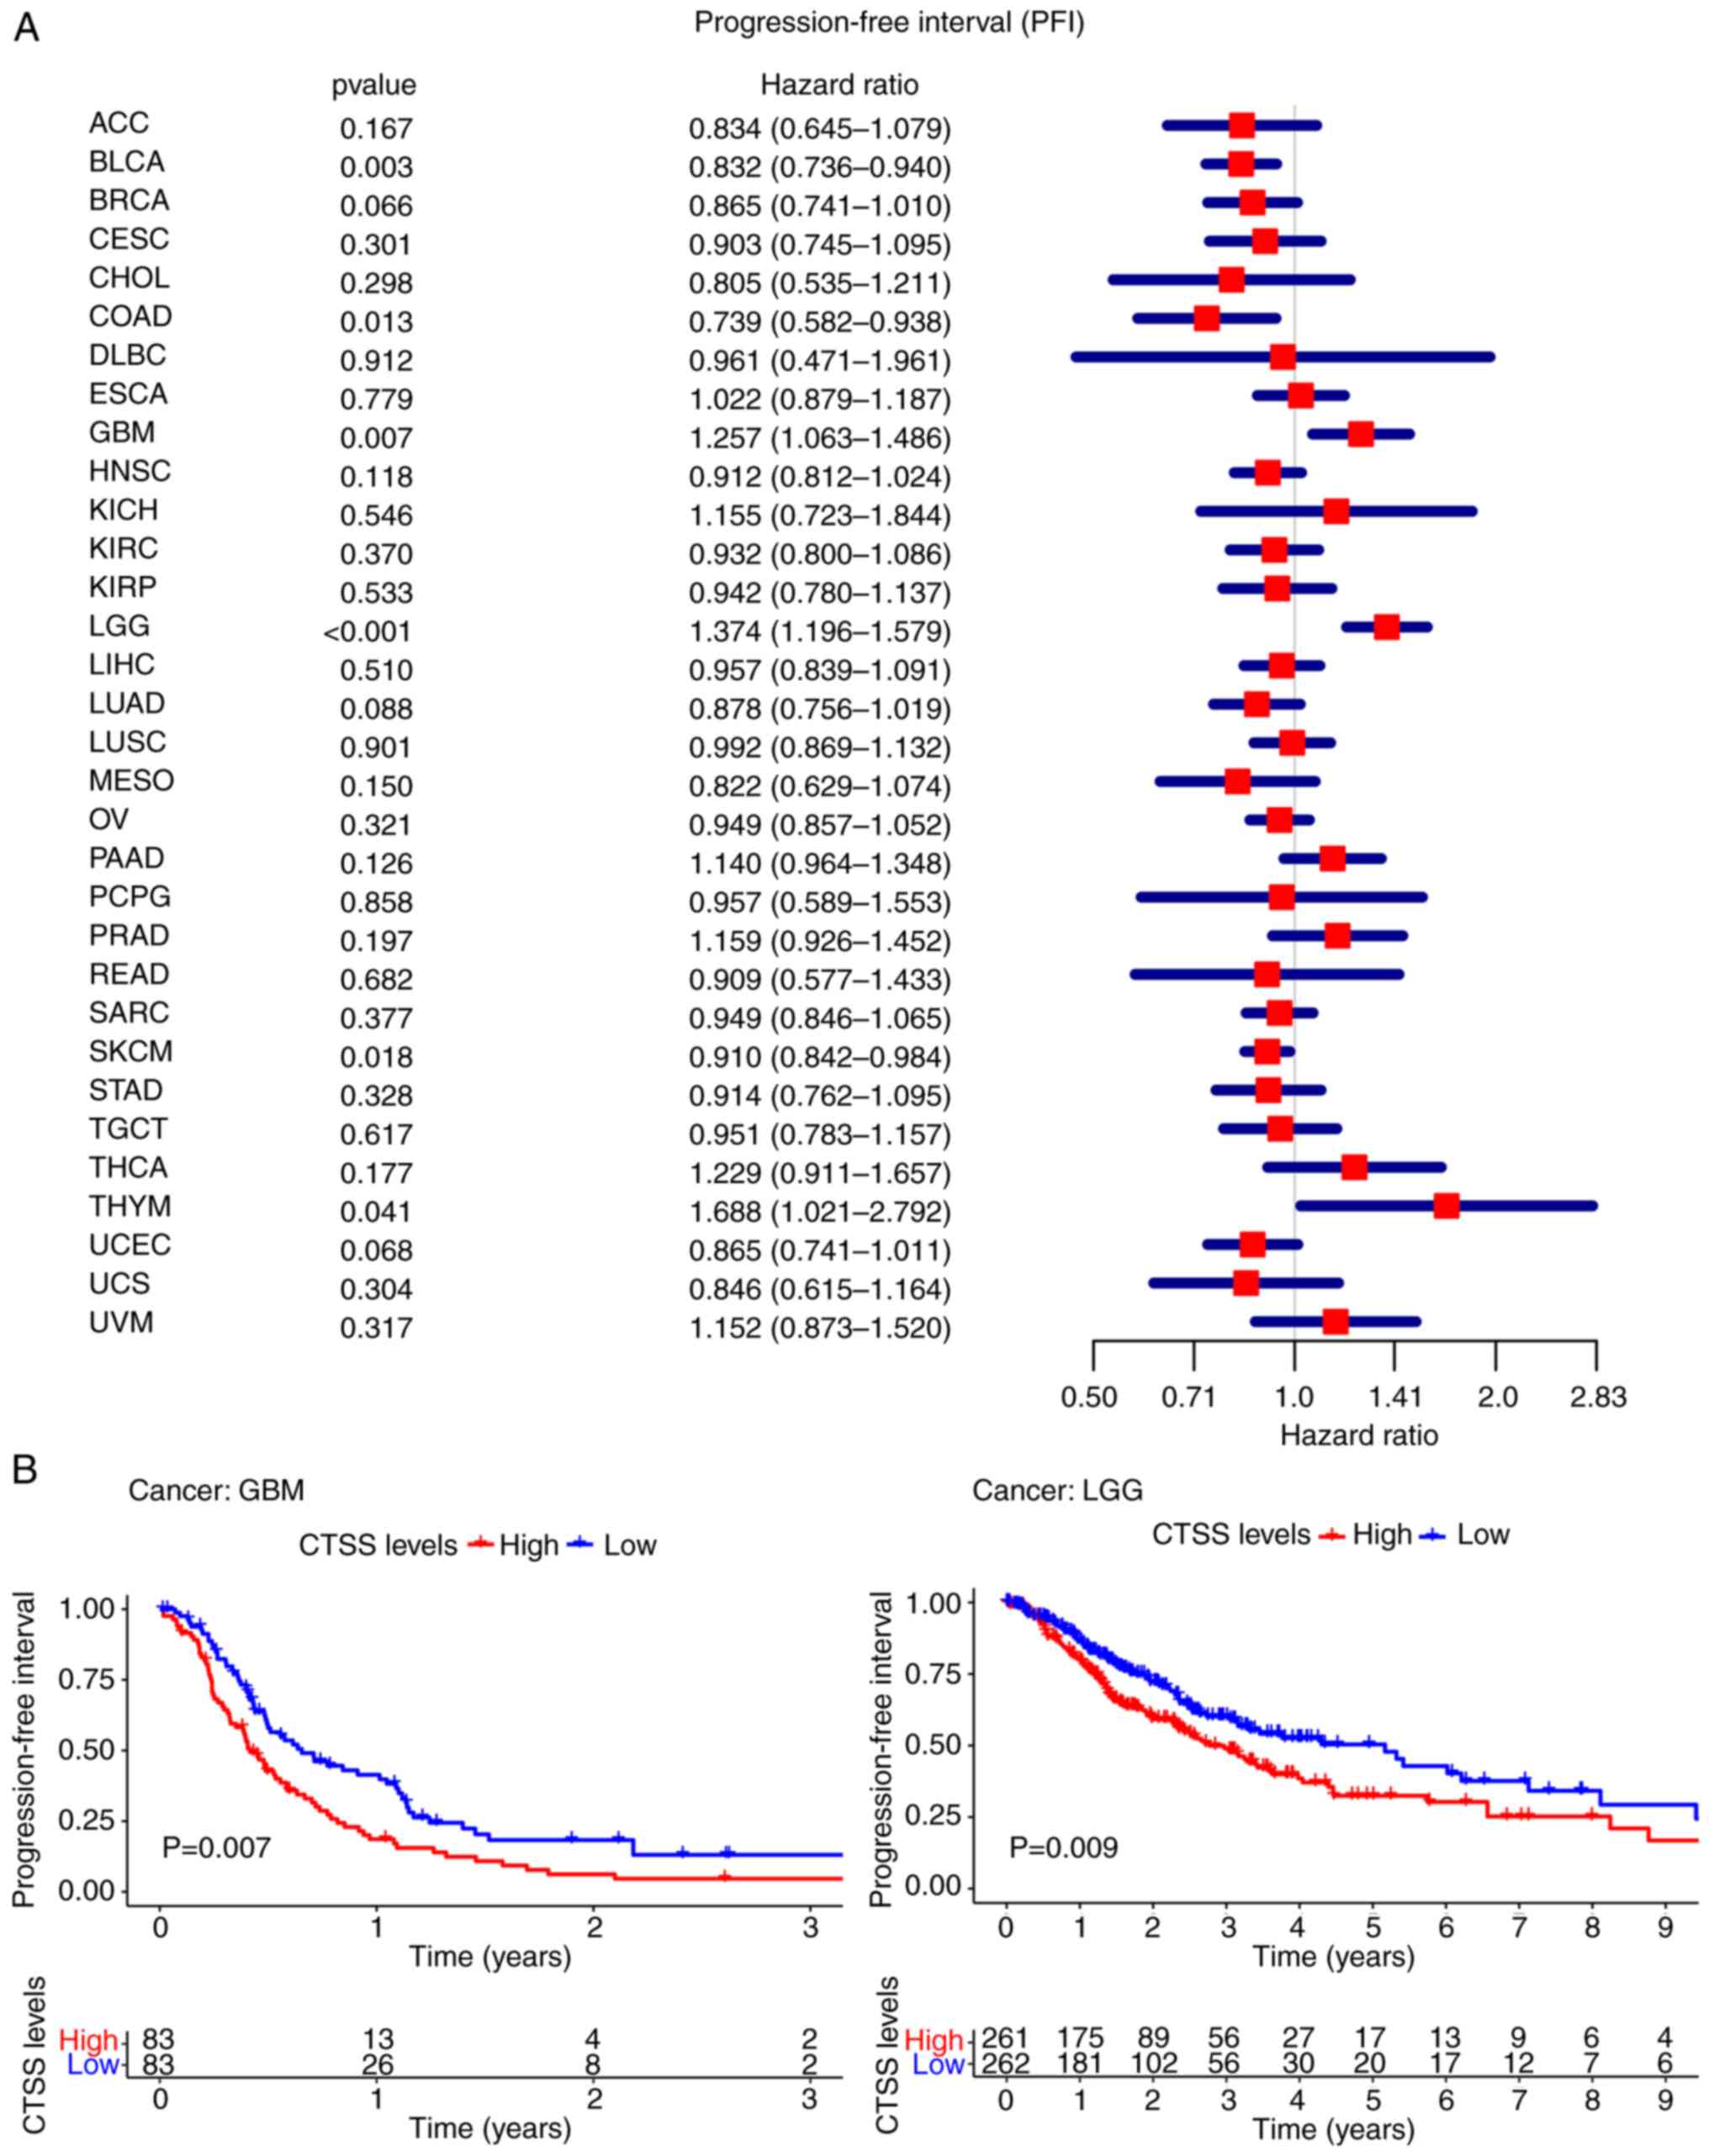 | Figure 5.Correlation of CTSS expression with
the PFI in pan-cancer. (A) Forest plot showing the hazard ratios of
CTSS. (B) Kaplan-Meier curves demonstrate the association between
CTSS expression and the patients' PFI in GBM and LGG. ACC,
adrenocortical carcinoma; BLCA, bladder urothelial carcinoma; BRCA,
breast invasive carcinoma; CESC, cervical squamous cell carcinoma;
CHOL, cholangiocarcinoma; COAD, colon adenocarcinoma; DLBC, diffuse
large B cell lymphoma; ESCA, esophageal carcinoma; GBM,
glioblastoma; HNSC, head-neck squamous cell carcinoma; KICH, kidney
chromophobe; KIRC, kidney renal clear cell carcinoma; KIRP, kidney
renal papillary cell carcinoma; LAML, acute myeloid leukemia; LGG,
lower grade glioma; LIHC, liver hepatocellular carcinoma; LUAD,
lung adenocarcinoma; LUSC, lung squamous cell carcinoma; MESO,
mesothelioma; OV, ovarian serous cystadenocarcinoma; PAAD,
pancreatic adenocarcinoma; PCPG, pheochromocytoma and
paraganglioma; PRAD, prostate adenocarcinoma; READ, rectal
adenocarcinoma; SARC, sarcoma; SKCM, skin cutaneous melanoma; STAD,
stomach adenocarcinoma; TGCT, testicular germ cell tumors; THCA,
thyroid carcinoma; THYM, thymoma; UCEC, uterine corpus endometrial
carcinoma; UCS, uterine carcinosarcoma; UVM, uveal melanoma; CTSS,
cathepsin S. |
Kaplan-Meier curves demonstrated that higher CTSS
expression was significantly correlated with poor PFI in GBM
(P=0.007) and LGG (P=0.009) (Fig. 5B).
Summary of patient prognosis
indicators
Collectively, these results indicated the
significant association between CTSS expression and patient
prognosis in various cancer types, including BLCA, SKCM, LGG and
UVM. Which supported the potential use of CTSS as a biomarker for
predicting patient prognosis.
Relationship between CTSS expression
and clinicopathological indicators in pan-cancers
To assess the relationship between CTSS expression
and clinicopathological indicators in pan-cancer, CTSS expression
was analyzed across different age groups, sexes and tumor stages in
patients with cancer.
Age
It was demonstrated that CTSS expression was
significantly higher among cancer patients ≥65 years compared with
patients <65 years old, in ESCA (Fig. 6A), LUAD (Fig. 6B) and PRAD (Fig. 6C).
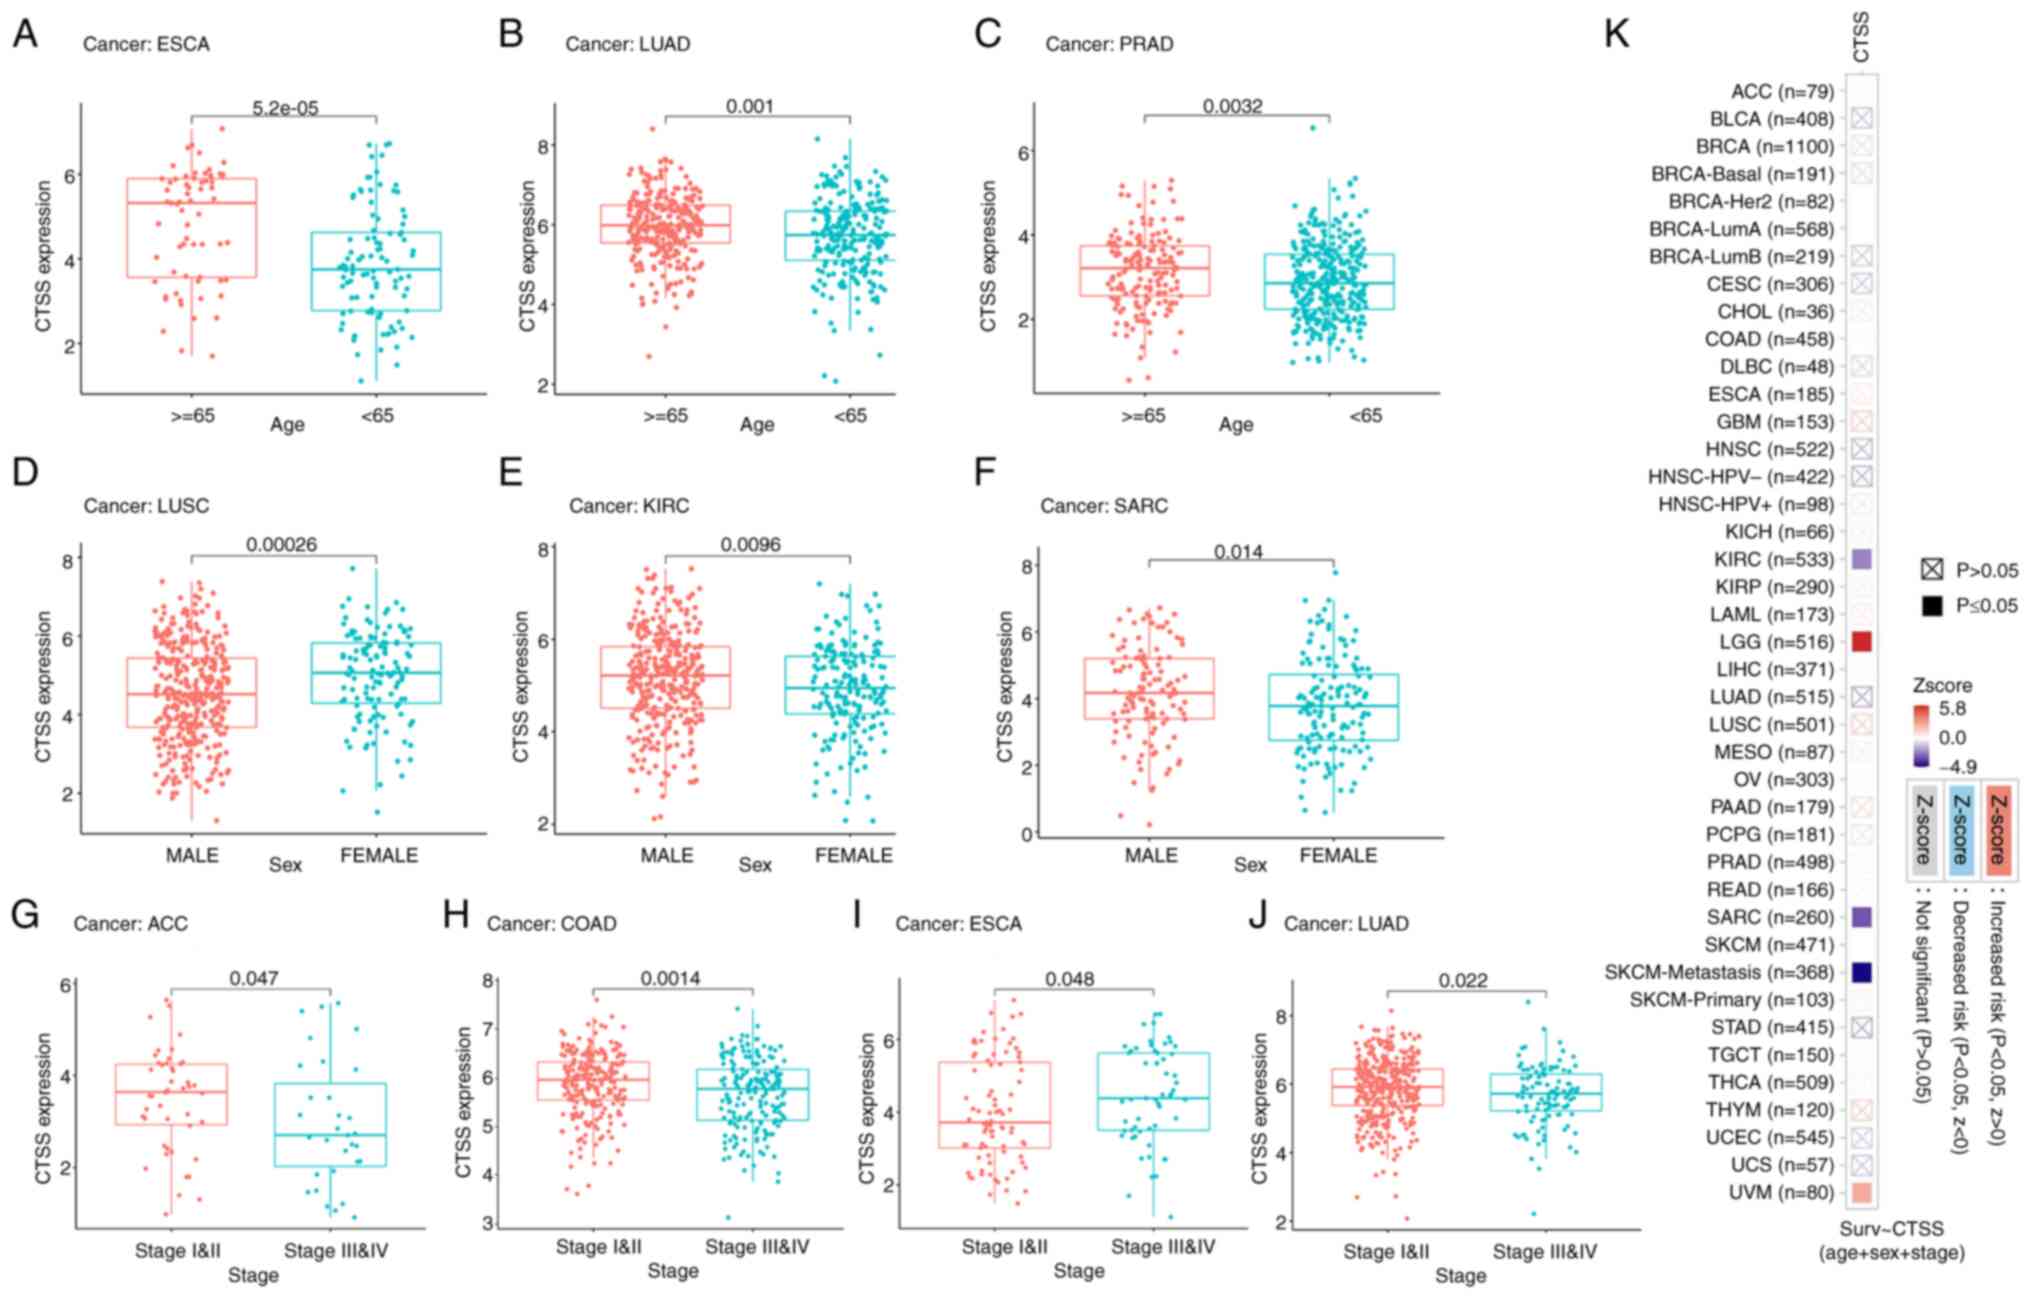 | Figure 6.Correlation of CTSS expression with
clinicopathological indicators in multiple cancers. Box plots
showing the correlation between CTSS expression and (A-C) age,
(D-F) sex and (G-J) cancer stage. (K) Heatmap showing clinical
correlation (multiple clinical factors including age, sex and
stage) of CTSS expression in different types of cancer. ACC,
adrenocortical carcinoma; BLCA, bladder urothelial carcinoma; BRCA,
breast invasive carcinoma; CESC, cervical squamous cell carcinoma;
CHOL, cholangiocarcinoma; COAD, colon adenocarcinoma; DLBC, diffuse
large B cell lymphoma; ESCA, esophageal carcinoma; GBM,
glioblastoma; HNSC, head-neck squamous cell carcinoma; KICH, kidney
chromophobe; KIRC, kidney renal clear cell carcinoma; KIRP, kidney
renal papillary cell carcinoma; LAML, acute myeloid leukemia; LGG,
lower grade glioma; LIHC, liver hepatocellular carcinoma; LUAD,
lung adenocarcinoma; LUSC, lung squamous cell carcinoma; MESO,
mesothelioma; OV, ovarian serous cystadenocarcinoma; PAAD,
pancreatic adenocarcinoma; PCPG, pheochromocytoma and
paraganglioma; PRAD, prostate adenocarcinoma; READ, rectal
adenocarcinoma; SARC, sarcoma; SKCM, skin cutaneous melanoma; STAD,
stomach adenocarcinoma; TGCT, testicular germ cell tumors; THCA,
thyroid carcinoma; THYM, thymoma; UCEC, uterine corpus endometrial
carcinoma; UCS, uterine carcinosarcoma; UVM, uveal melanoma; CTSS,
cathepsin S; LumA, luminal A; LumB, luminal B; Her2, HER2-enriched,
Basal, basal-like; HPV, human papillomavirus. |
Sex
There was significantly lower expression of CTSS in
males with LUSC (Fig. 6D).
Conversely, CTSS was expressed at significantly higher levels in
males with KIRC (Fig. 6E) and SARC
(Fig. 6F).
Cancer stage
It was demonstrated that CTSS was significantly
upregulated in patients with stage I–II ACC (Fig. 6G), COAD (Fig. 6H) and LUAD (Fig. 6J) compared with patients with the
respective cancers at stage III–IV. However, CTSS was significantly
downregulated in patients with stage I–II ESCA compared with
patients with stage III–IV ESCA (Fig.
6I).
Moreover, the ‘Gene Outcome’ module analysis results
indicated that CTSS was significantly correlated with multiple
clinical factors (including age, sex and stage) in KIRC, SARC, SKCM
and UVM (Fig. 6K). Collectively,
these results indicated that CTSS was strongly related to
clinicopathological indicators in multiple cancers, including ESCA,
KIRC and SARC.
Relationship between CTSS expression
and immunotherapeutic response
To examine the relationship between CTSS and
immunotherapy response, the association of CTSS with TMB and MSI in
multiple malignant tumors was analyzed. This analysis indicated
that CTSS was significantly related to TMB in eight cancer types,
with significant positive associations in LGG, BRCA and ESCA and
significant negative associations in LIHC, LUAD, LUSC, HNSC and GBM
(Fig. 7A).
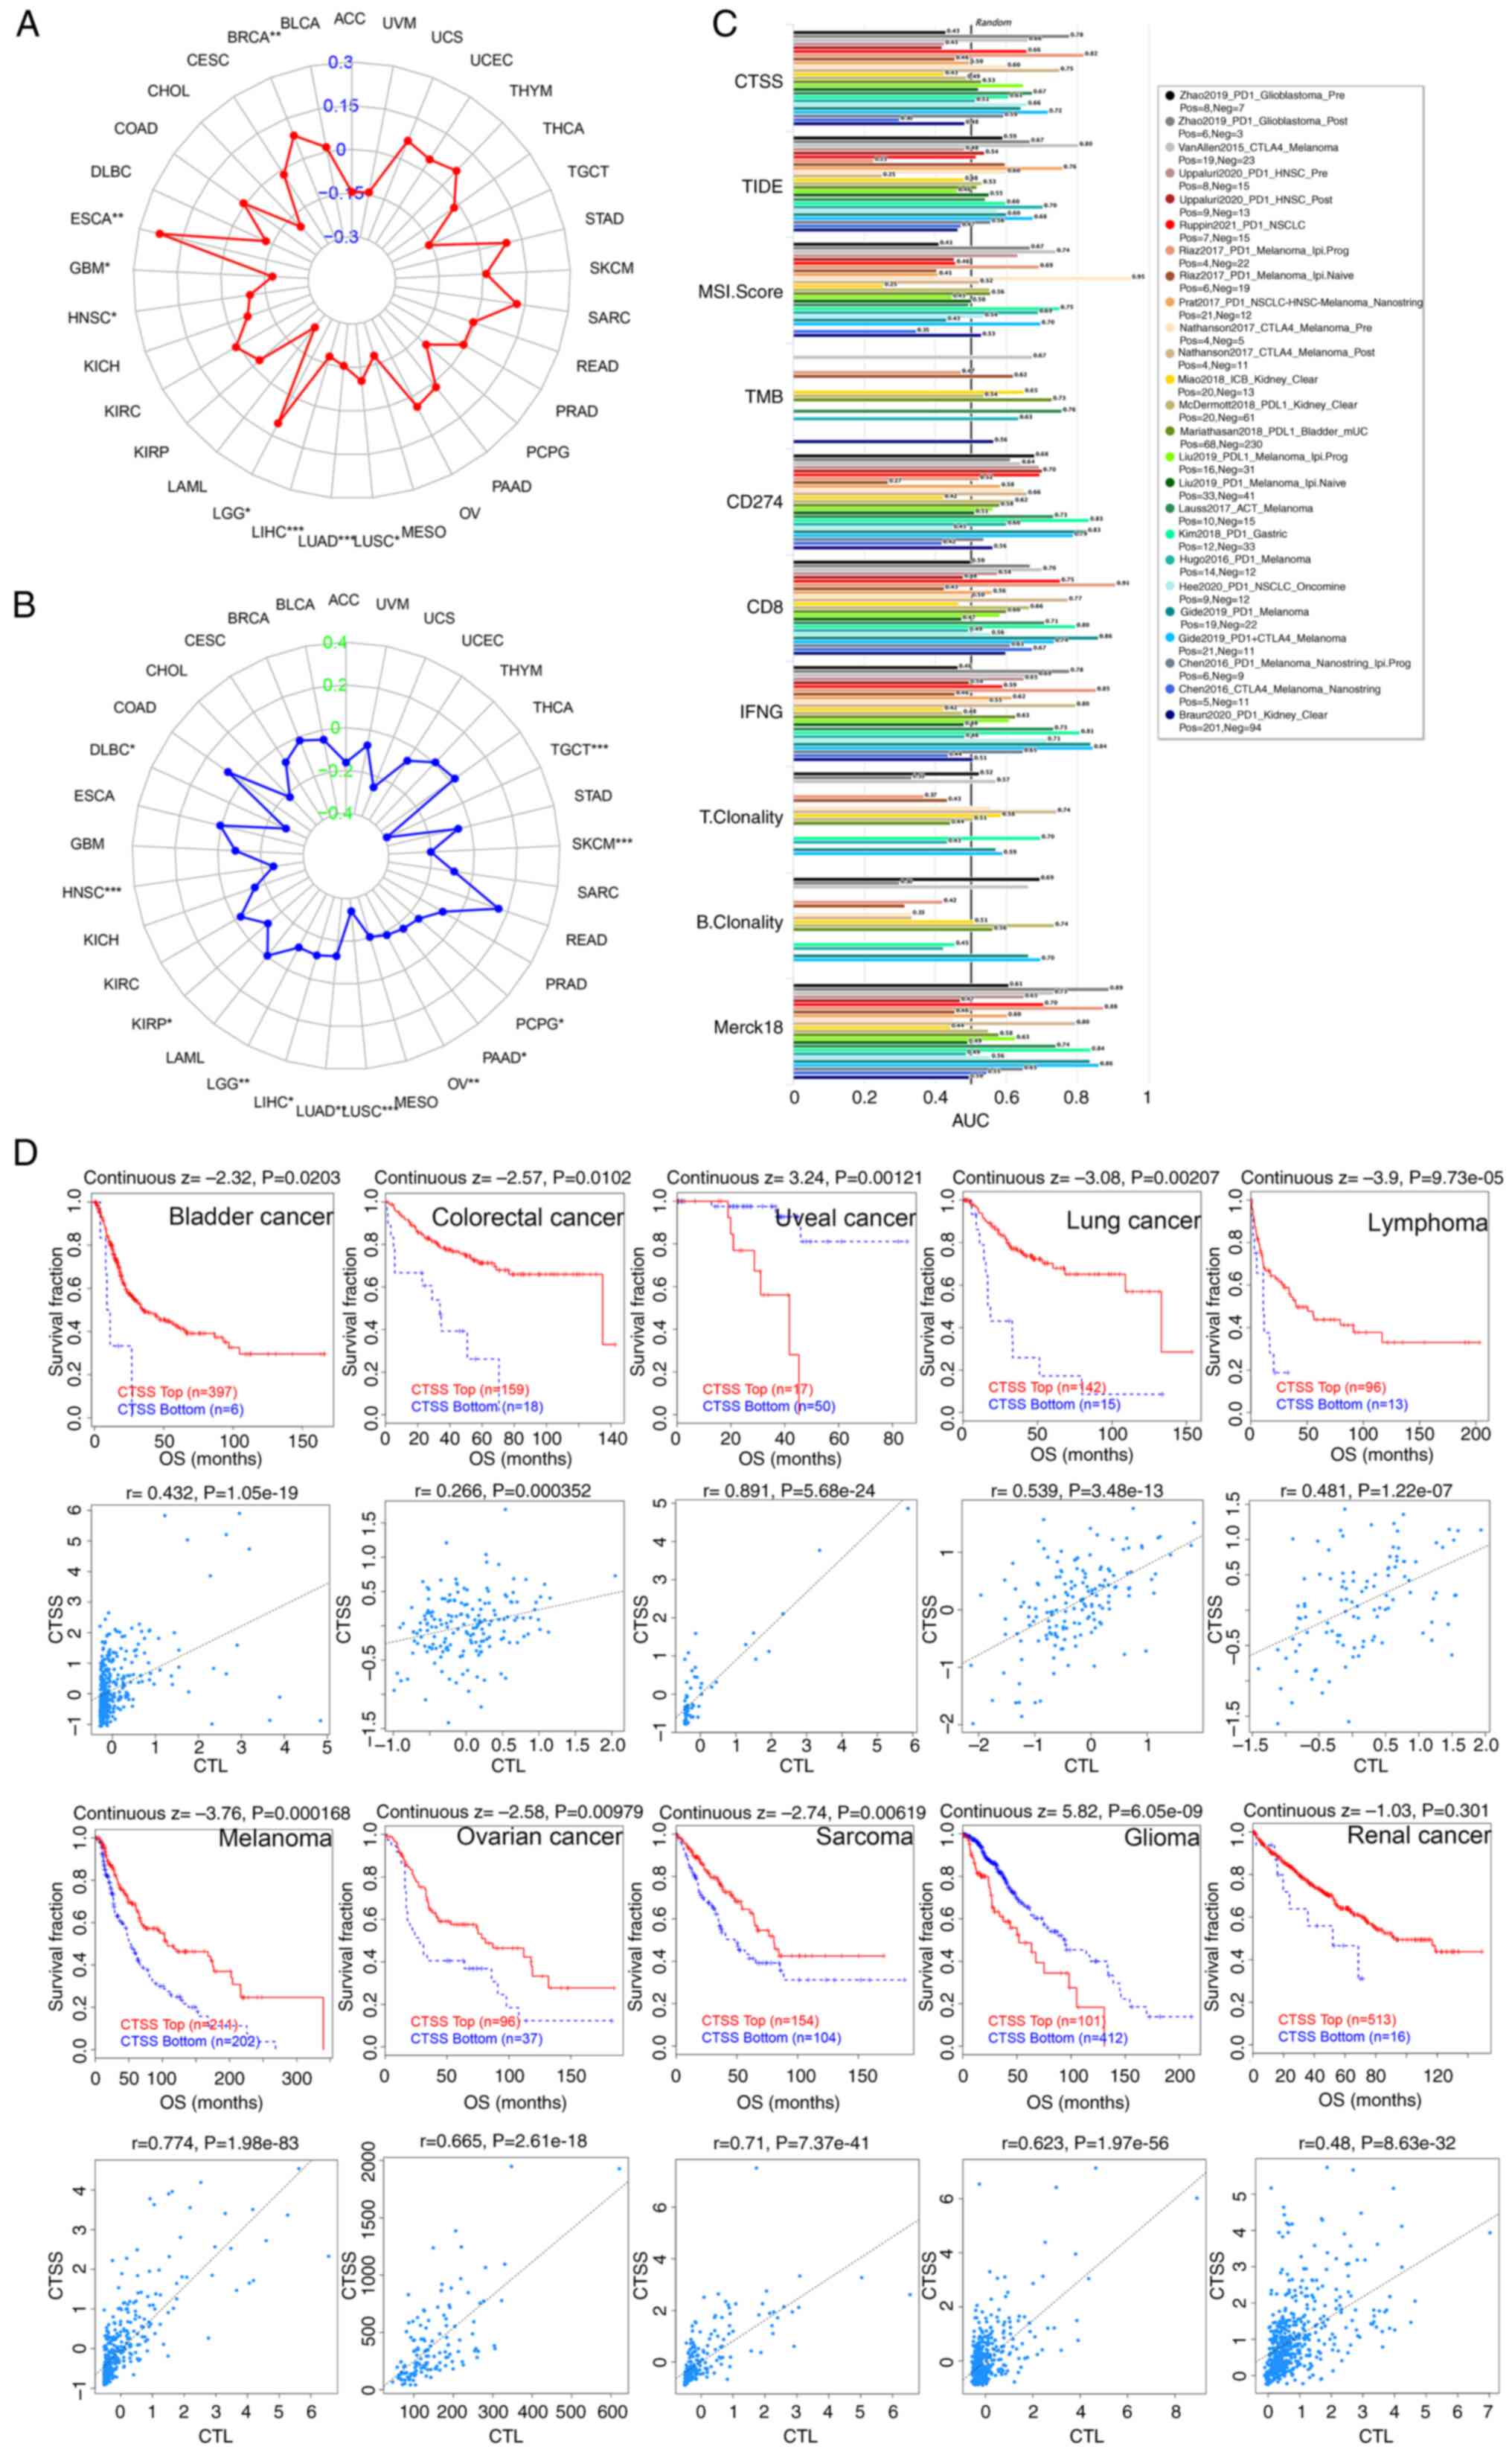 | Figure 7.Correlation of CTSS expression with
the immunotherapeutic response. Radar chart displaying the
connection of CTSS with TMB (A) and MSI (B) in pan-cancer. (C) Bar
plot showing the biomarker relevance of CTSS compared with other
canonical biomarkers in different immunotherapeutic sub-cohorts.
(D) Kaplan-Meier curves (upper panel) showing the connection
between survival ratios and CTSS in diverse cancer cohorts. The
figure below shows the relationship between CTSS expression and CTL
in different cancer cohorts. ACC, adrenocortical carcinoma; BLCA,
bladder urothelial carcinoma; BRCA, breast invasive carcinoma;
CESC, cervical squamous cell carcinoma; CHOL, cholangiocarcinoma;
COAD, colon adenocarcinoma; DLBC, diffuse large B cell lymphoma;
ESCA, esophageal carcinoma; GBM, glioblastoma; HNSC, head-neck
squamous cell carcinoma; KICH, kidney chromophobe; KIRC, kidney
renal clear cell carcinoma; KIRP, kidney renal papillary cell
carcinoma; LAML, acute myeloid leukemia; LGG, lower grade glioma;
LIHC, liver hepatocellular carcinoma; LUAD, lung adenocarcinoma;
LUSC, lung squamous cell carcinoma; MESO, mesothelioma; OV, ovarian
serous cystadenocarcinoma; PAAD, pancreatic adenocarcinoma; PCPG,
pheochromocytoma and paraganglioma; PRAD, prostate adenocarcinoma;
READ, rectal adenocarcinoma; SARC, sarcoma; SKCM, skin cutaneous
melanoma; STAD, stomach adenocarcinoma; TGCT, testicular germ cell
tumors; THCA, thyroid carcinoma; THYM, thymoma; UCEC, uterine
corpus endometrial carcinoma; UCS, uterine carcinosarcoma; UVM,
uveal melanoma; CTSS, cathepsin S; CTL, cytotoxic T-cell level;
TIDE, Tumor Immune Dysfunction and the Exclusion; MSI,
microsatellite instability; TMB, tumor mutational burden; CD274,
cluster of differentiation 274; IFNG, Interferon gamma; OS, overall
survival; CTL, cytotoxic T lymphocytes. |
Furthermore, CTSS was significantly negatively
associated with MSI in twelve cancer types; DLBC, HNSC, KIRP, LGG,
LIHC, LUAD, LUSC, OV, PAAD, PCPG, SKCM and TGCT (Fig. 7B).
Moreover, the significance of CTSS as a biomarker
was estimated by comparing it with other established biomarkers,
based on their predictive ability of the response in certain
immunotherapeutic sub-cohorts. The results indicated that CTSS,
whose area under the dose-response curve (AUC) value was >0.5 in
16 out of 25 sub-cohorts (64%), demonstrated a higher predictive
value than MSI and B-cell clonality, whose AUC values were >0.5
in 13 out of 24 sub-cohorts (54%) and 7 out of 14 sub-cohorts
(50%), respectively (Fig. 7C).
The relationship between CTSS expression and
immunotherapy clinical response in certain cancer types was then
assessed. It was shown that higher CTSS expression was
significantly associated with improved clinical outcomes of OS in
colorectal cancer and significantly correlated with improved OS in
renal cancer, melanoma, bladder cancer, lung cancer, lymphoma,
sarcoma and ovarian cancer. While low CTSS expression was
significantly correlated with a poor prognosis in glioma and uveal
cancer. Notably, CTSS expression was positively associated with
cytotoxic T lymphocytes (CTLs) in the aforementioned cancer cohorts
(Fig. 7D). Overall, these findings
indicated the intricate interplay between CTSS expression, immune
response and clinical prognosis in these specific cancer types.
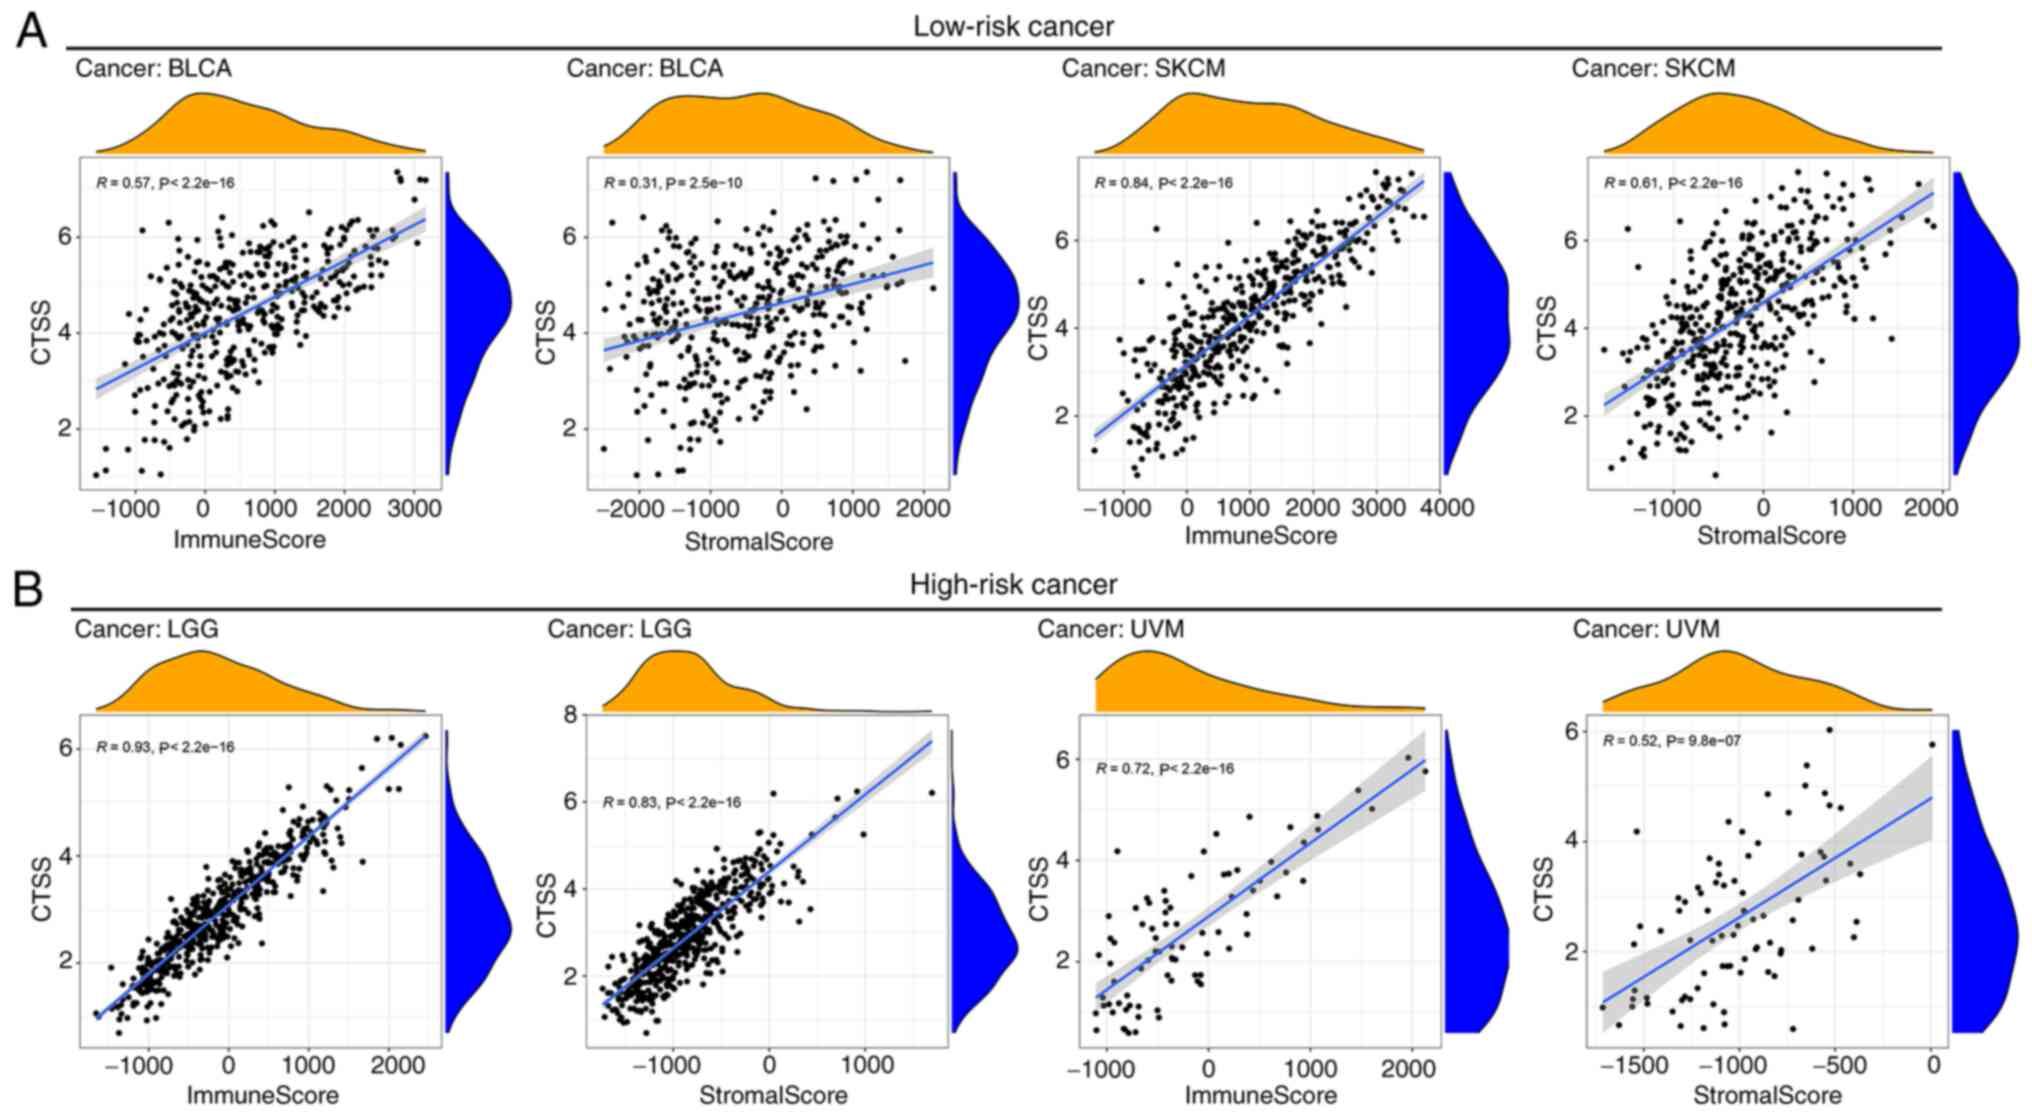
Relationship between CTSS expression
and TME in pan-cancer
Based on survival analysis, it was demonstrated that
high CTSS expression correlated with a good prognosis in BLCA and
SKCM but correlated with a poor prognosis in LGG and UVM.
Therefore, based on the correlation between these cancers and
prognosis (25), they were grouped
into low-risk cancer (BLCA and SKCM) and high-risk cancer (LGG and
UVM). To assess the relationship between CTSS expression and TME in
these cancer types, the ESTIMATE algorithm was applied to analyze
the stromal and immune scores for the four selected cancers. It was
found that CTSS was significantly correlated with stromal and
immune scores in BLCA, SKCM (Fig.
8A), LGG and UVM (Fig. 8B).
Correlation analyses of CTSS
expression with immune cell infiltration and immune-related
genes
The CIBERSORT algorithm was used to evaluate the
relationship between CTSS expression and the infiltrating levels of
immune cells. Analysis showed that CTSS expression was
significantly positively associated with the infiltration level of
activated memory CD4+ T cells and CD8+ T
cells in BLCA, SKCM, and UVM and significantly positively
correlated with the infiltration level of CD8+ T cells
in LGG (Fig. S1).
Moreover, CTSS expression had a significant positive
correlation with activated NK cells, but a significant negative
correlation with activated mast cells in BLCA. Furthermore, CTSS
exhibited a significant positive association with the infiltration
levels of M1 macrophages, monocytes, and activated NK cells but a
significant negative association with the infiltration levels of M2
macrophages, activated mast cells and resting NK cells in SKCM.
Moreover, CTSS was significantly positively correlated with the
infiltration level of follicular helper T cells (TFHs) and M1
macrophages in UVM and significantly negatively associated with
activated mast cells in LGG. It is worth noting that resting memory
CD4+T cells were significantly positively associated
with CTSS expression in LGG (Fig.
9A).
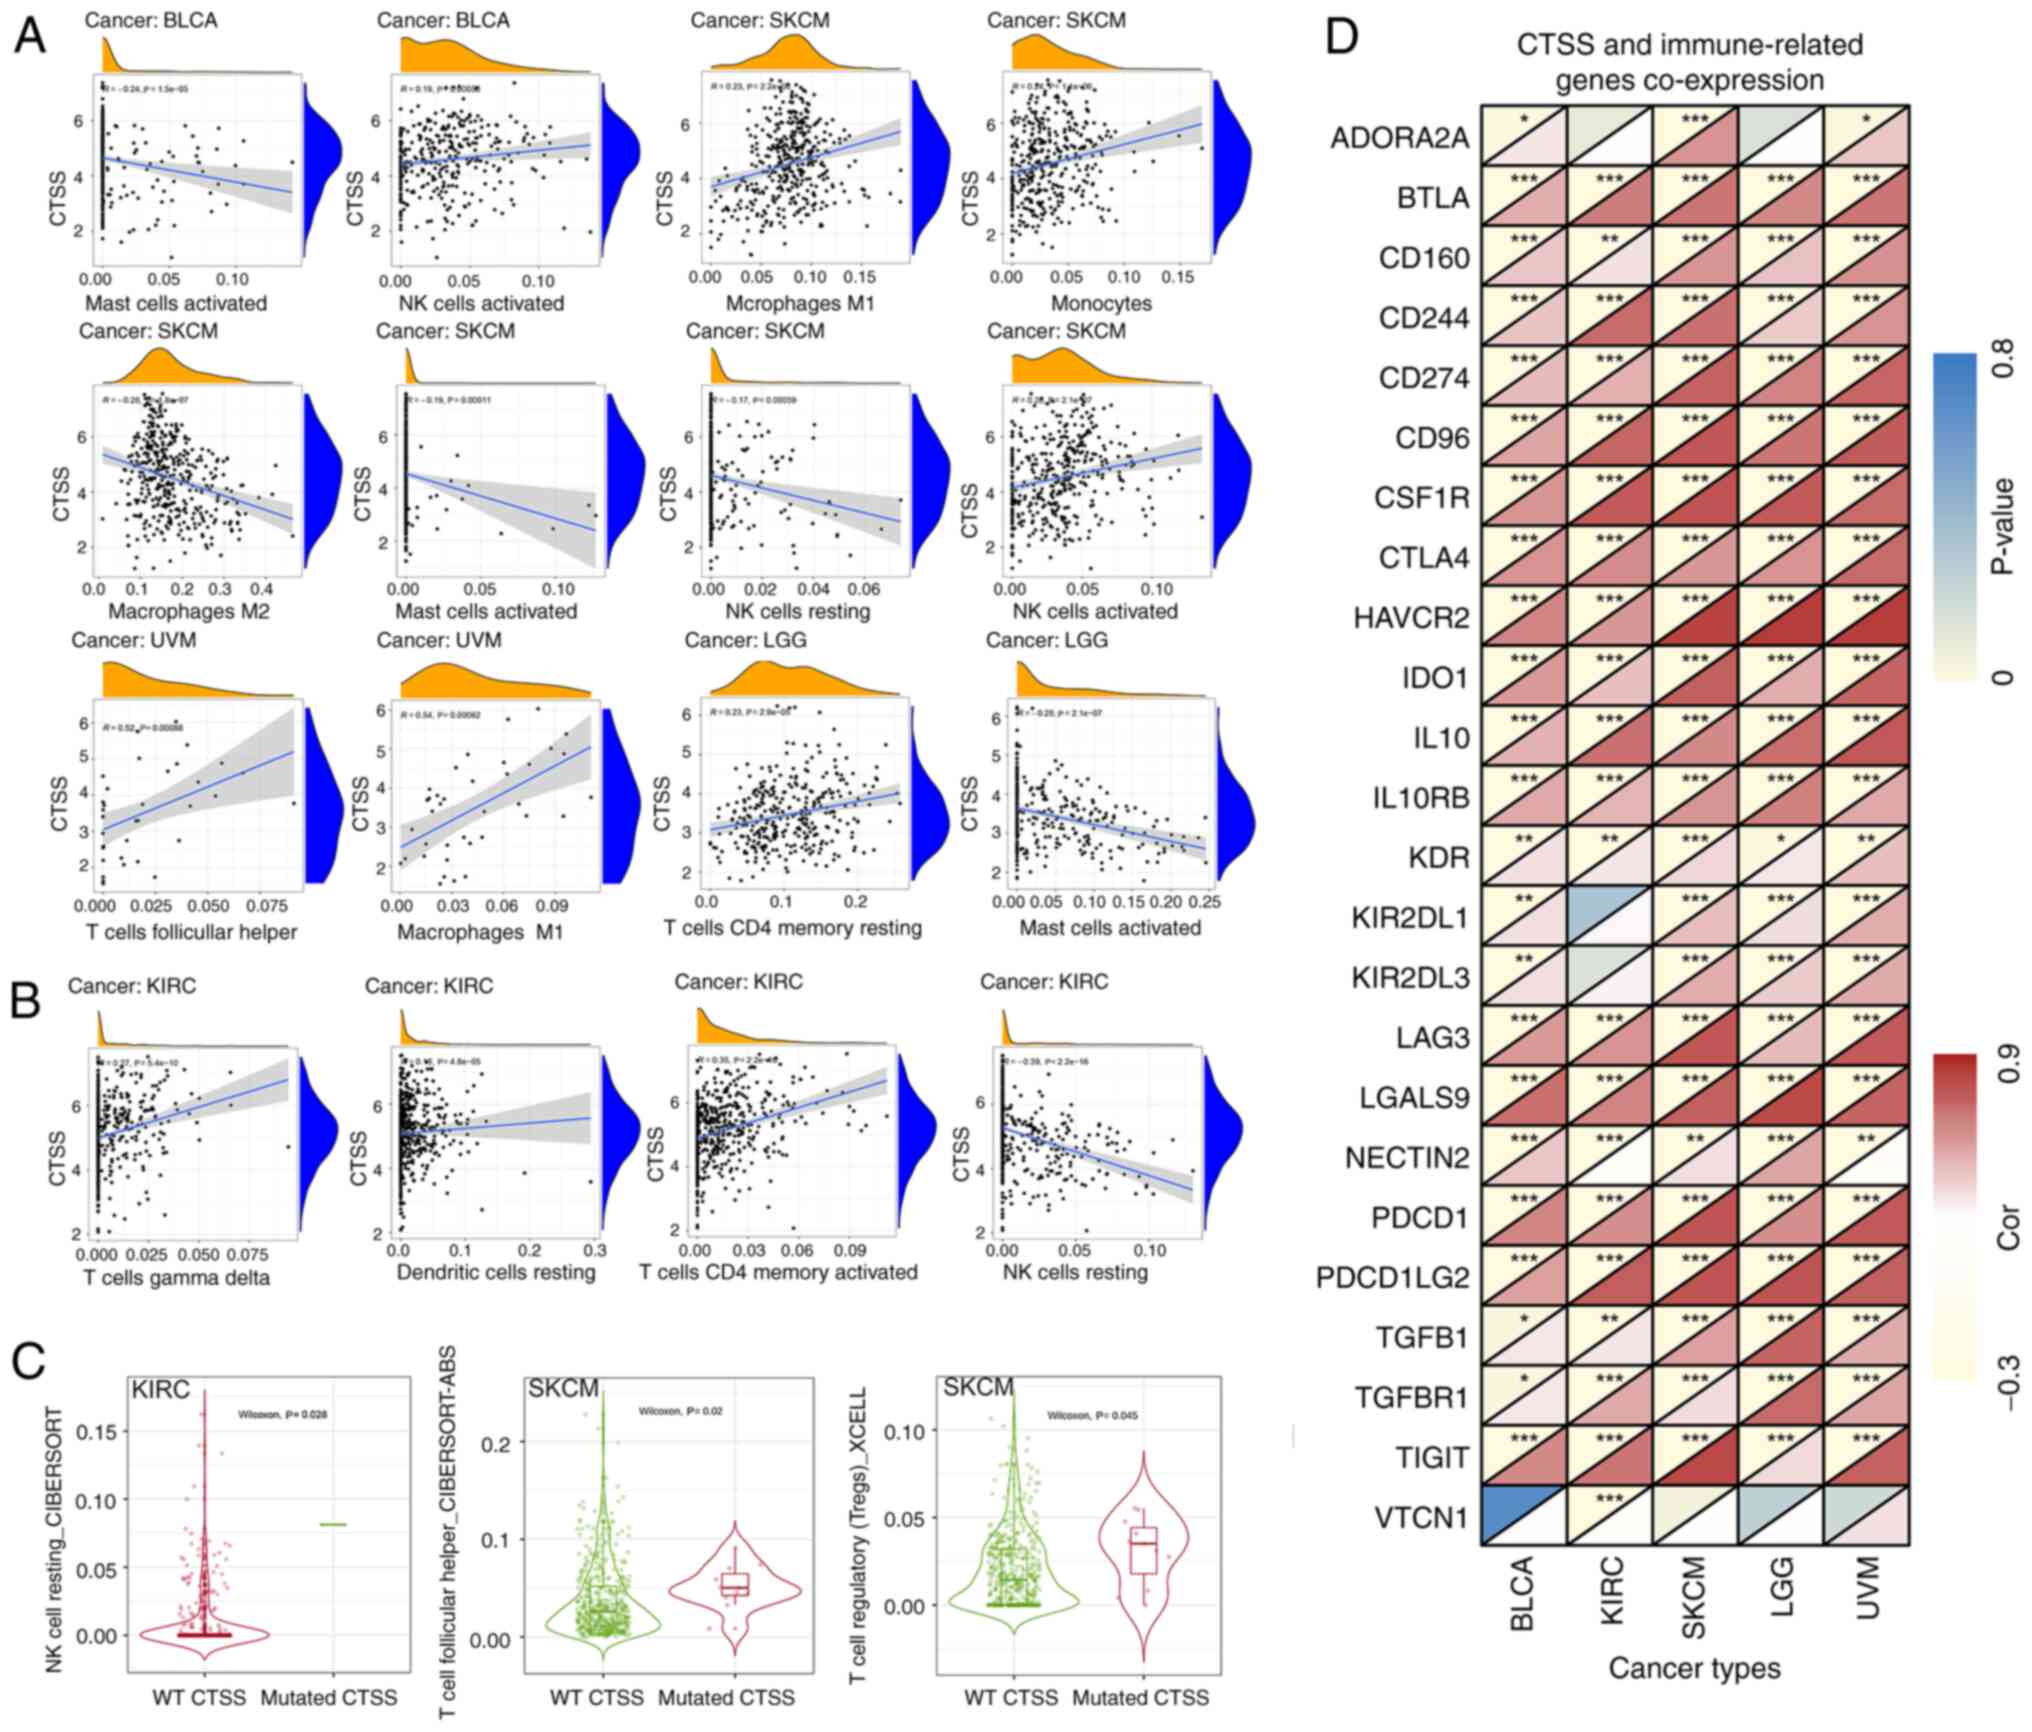 | Figure 9.Relationship between CTSS and immune
cell infiltration and immune-related genes. (A) Relationship
between CTSS expression and various infiltrating immune cells in
four cancer types. (B) Relationship between CTSS expression and
immune cell infiltration in KIRC. (C) The relationship between CTSS
mutation and immune cell infiltration. (D) Co-expression analysis
between CTSS and immune-related genes in BLCA, KIRC, SKCM, LGG and
UVM. BLCA, bladder urothelial carcinoma; SKCM, skin cutaneous
melanoma; UVM, uveal melanoma; LGG, lower grade glioma; KIRC,
kidney renal clear cell carcinoma; CTSS, cathepsin S; NK cell,
natural killer cell; WT, wild type. |
Differential expression analysis and
immunotherapeutic assessment demonstrated that CTSS was closely
related to the prognosis of immunotherapy and CTLs were
differentially expressed in KIRC (Fig.
7D). Therefore, the correlation between CTSS and immune cell
infiltration in KIRC was assessed. Results indicated that CTSS had
a significant negative correlation with resting NK cell
infiltration in KIRC. Conversely, CTSS had a significant positive
correlation with resting DCs, activated memory CD4+ T
cells and gamma-delta T (γδ T) cell infiltration (Fig. 9B). Moreover, KIRC with CTSS mutation
demonstrated significantly higher levels of infiltration of resting
NK cells compared with the wild type. TFHs and regulatory T cells
(Tregs) in SKCM with CTSS mutation exhibited significantly higher
levels of infiltration compared with the wild type (Fig. 9C).
The relationship between CTSS and 24 immune-related
genes in these cancer types was estimated by gene co-expression
analysis. This analysis showed that numerous immune-related genes,
such as PDCD1, LAG3, CTLA4, TIGIT and LGALS9 exhibited significant
positive co-expression with CTSS in all five cancer types assessed
(BCLA, KIRC, SKCM, LGG and UVM) (Fig.
9D). Overall, the analysis indicated that CTSS was closely
correlated with immune cell infiltration and immune-related genes
across different cancer types, which suggested that CTSS may serve
an important role in the TIME.
Functional enrichment analysis of
CTSS
To evaluate the biological functions of CTSS in
multiple malignant tumors, a functional enrichment analysis of the
selected cancer types (n=4) was performed. GO functional
annotation, demonstrated that CTSS was negatively correlated with
the negative regulation of sprouting angiogenesis, mRNA binding and
myoblast proliferation in BLCA. Conversely, CTSS positively
regulated numerous biological functions in SKCM, LGG and UVM,
including immune response-regulating signaling pathways and the
regulation of lymphocyte activation (Fig. 10A). Moreover, KEGG pathway
enrichment analysis demonstrated that CTSS was positively
correlated with numerous crucial biological pathways in BLCA, SKCM,
LGG and UVM, including type I diabetes mellitus and T cell receptor
singling pathway (Fig. 10B). These
findings suggested that CTSS may participate in tumorigenesis by
regulating multiple signaling pathways and biological processes
across different cancer types.
 | Figure 10.Functional enrichment analysis of the
CTSS gene. (A) GO function annotation of CTSS in BLCA, SKCM, LGG
and UVM. (B) KEGG pathway enrichment analysis of CTSS in BLCA,
SKCM, LGG and UVM. BLCA, bladder urothelial carcinoma; SKCM, skin
cutaneous melanoma; LGG, lower grade glioma; UVM, uveal melanoma;
CTSS, cathepsin S; GOBP, Gene Ontology Biological Process; HP,
Human Phenotype; GOMF, Gene Ontology Molecular Function; GO, Gene
Ontology; KEGG, Kyoto Encyclopedia of Genes and Genomes. |
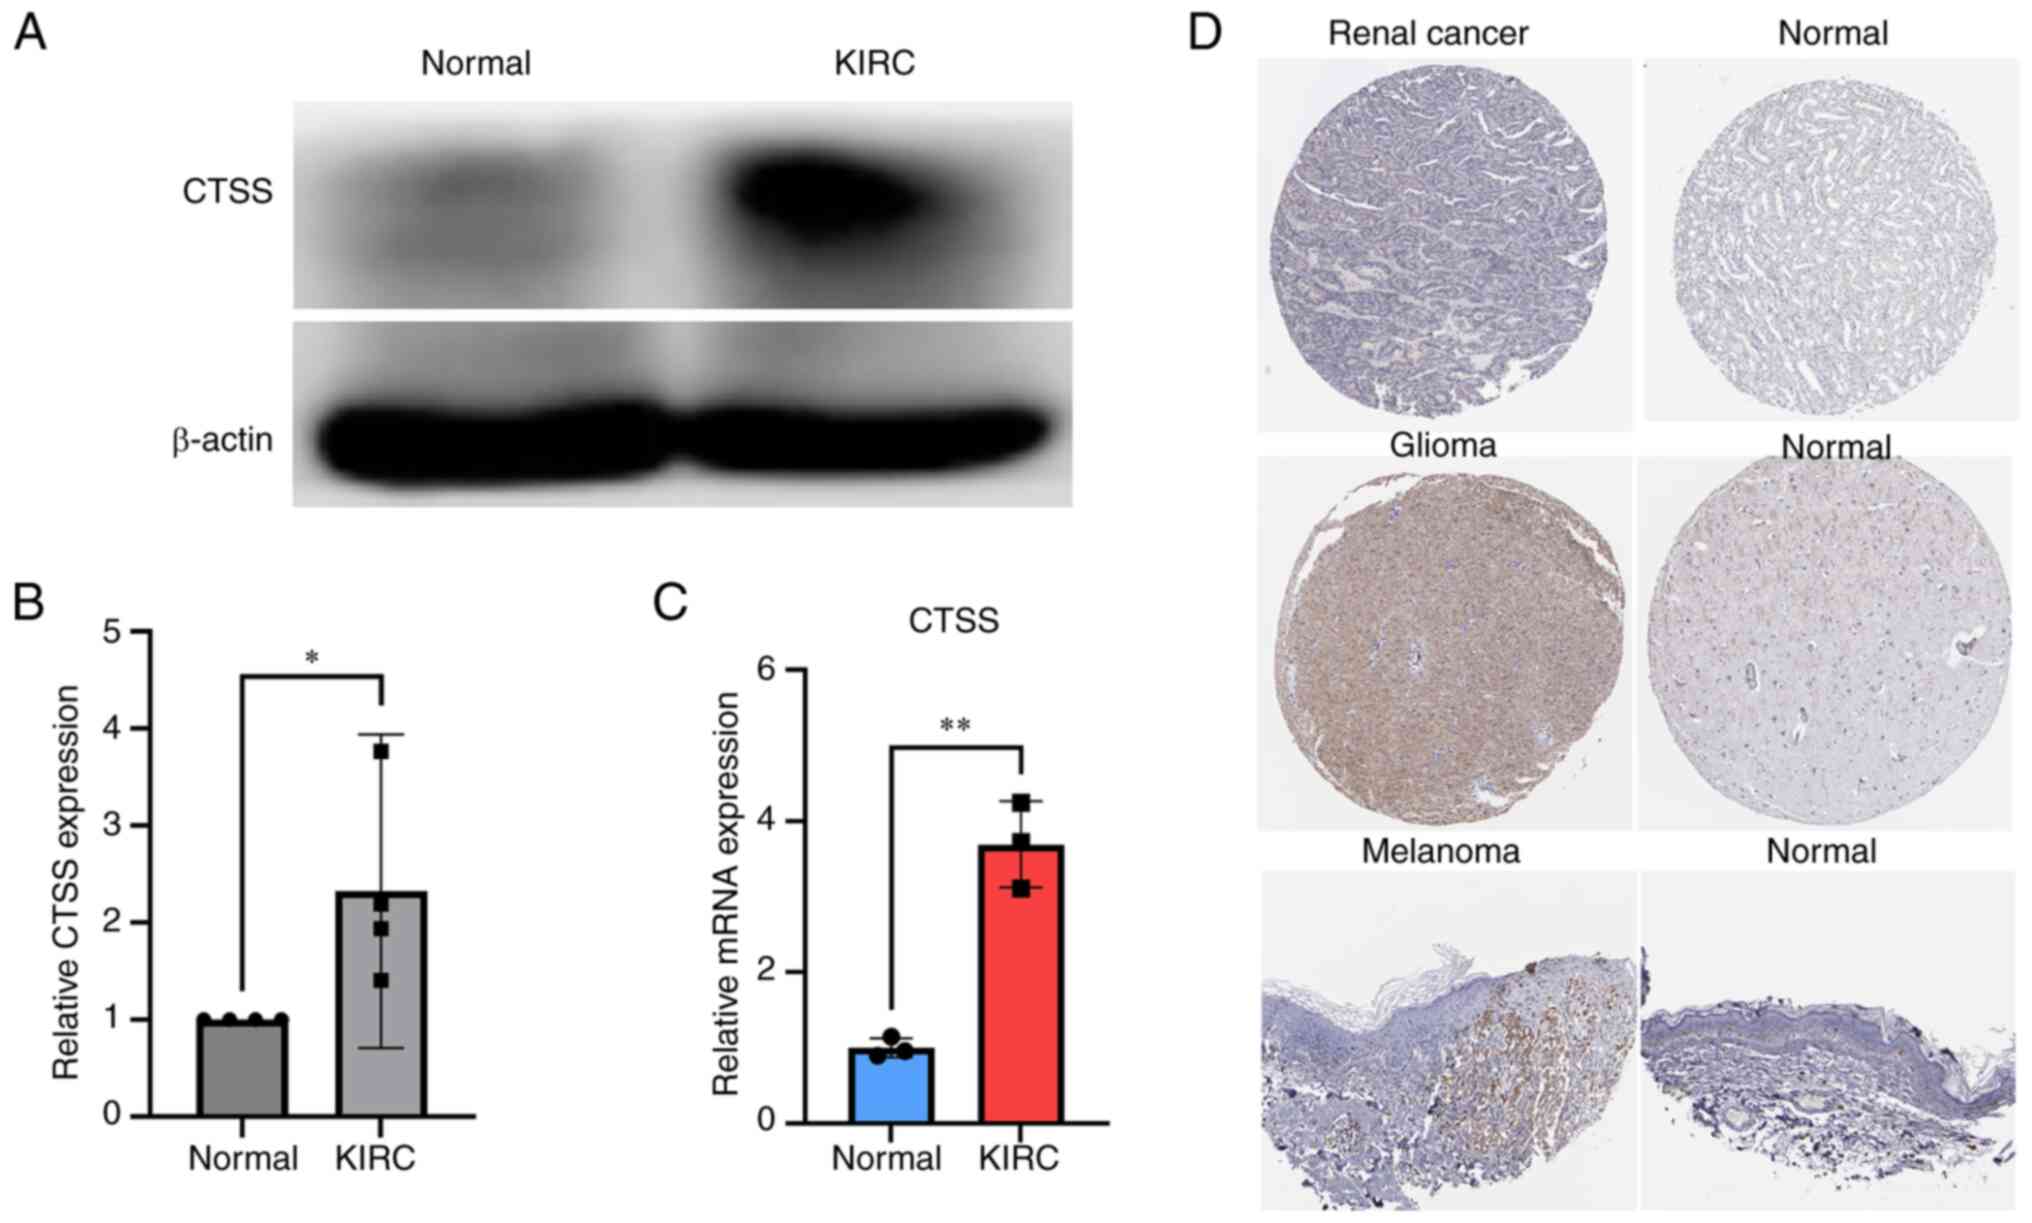
Differential expression of CTSS across
malignant and normal tissues
According to the differential expression and
clinical correlation analysis results of CTSS, KIRC was selected
for clinical validation. To further verify the differential
expression of CTSS in KIRC and normal adjacent tissues, RT-qPCR and
western blotting were performed. The results demonstrated
significant upregulation of CTSS mRNA and protein expression levels
in cancerous tissue compared with normal tissue in patients with
KIRC (Fig. 11A-C) which was
consistent with TCGA database analysis results. The full-length
gels of western blotting can be seen in Figure S2.
Moreover, to further assess the expression of CTSS
in these tumors with differential expression and clinical
prognostic relevance, immunohistochemistry images of three types of
malignant tissue (from renal cancer, melanoma and glioma) and
normal tissues (unpaired) were analyzed. A higher level of CTSS
antibody staining in malignant tissues compared with normal tissues
in the brain, kidney and skin tissue was observed (Fig. 11D). This finding highlights the
potential association between CTSS expression and malignancy at
these specific anatomical sites.
Discussion
Immunotherapy, especially immune checkpoint therapy,
has emerged as an epochal milestone in anti-cancer therapy.
Nevertheless, the efficacy of immunotherapy varies greatly among
individuals. Therefore, the identification of biomarkers that can
predict immunotherapy efficacy is vital. A previous study reported
significant breakthroughs in identifying biomarkers as molecular
mechanism studies of ICI treatment continue to advance (26), and a recent study reported MSI and
TMB as potential biomarkers of response to ICI therapy (27). However, there are ongoing debates
and challenges in their clinical application. For example,
consensus on TMB cutoff values for patient stratification remains
elusive and PD-L1 expression is only applicable to certain tumor
types (28,29). Therefore, selecting the optimal
biomarker that can accurately reflect the effectiveness of
immunotherapy and guide combination therapy poses a challenge for
cancer treatment. In recent years, pan-cancer analysis has aimed to
uncover gene mutations, mRNA variations and immune-related genes
across multiple tumor types (30–32).
It is widely thought that identifying sensitive biomarkers for
early cancer diagnosis and developing novel ideas for personalized
treatment strategies for cancer patients are of the utmost
importance.
The present study demonstrated the potential of CTSS
as a prognostic and immunological biomarker across numerous
cancers. The expression of CTSS across multiple human cancer
datasets obtained from TCGA was analyzed. The current study
demonstrated significant differential expression of CTSS in
numerous cancer types and that the upregulation of CTSS was
associated with the prognosis of multiple cancer types, including
BLCA, SKCM, SARC, OV, LGG and UVM. However, the impact of CTSS
varied across different cancer types, high CTSS expression was
associated with a good prognosis in BLCA and SKCM but a poor
prognosis in UVM and LGG.
Research has also demonstrated that elevated CTSS
expression in melanoma effectively enhances the antigen processing
and presentation of tumor-related antigens, which helps T cells
recognize melanoma cells and trigger immune responses against
tumors. Consequently, CTSS serves a crucial role in suppressing
melanoma metastasis and exhibits a positive correlation with
patient survival rates (33).
Furthermore, a previous study reported that CTSS can inhibit Tregs
and serve an important role in reducing bladder tumor cell
proliferation (34). Moreover, high
expression of CTSS may promote tumor occurrence and development in
UVM and glioblastoma by promoting angiogenesis and anti-apoptotic
mechanisms, and is associated with poor prognosis in patients
(35–38). The aforementioned studies overlap in
their assertion that CTSS likely influences immune responses, which
in turn affects the prognosis of cancer. These findings may
partially explain the difference in prognosis observed across
different cancers with high CTSS expression.
Additionally, in terms of predicting immunotherapy
response, CTSS showed significant associations with TMB and MSI in
eight and 12 cancer types, respectively. Compared with MIS, CTSS
exhibited a superior ability to predict response outcomes in
different immunotherapy sub-cohorts. Additionally, CTSS was
positively correlated with CTL levels in numerous tumors. CTLs
serve as pivotal immune cells responsible for combating tumors by
recognizing tumor-specific antigens and initiating robust
anti-tumor immune responses (39).
Studies have demonstrated that glioma cells possess intricate cell
surface morphology and release immunosuppressive molecules,
enabling them to evade lymphocyte-mediated cytotoxicity (40,41).
These immune evasion mechanisms have the potential to attenuate the
tumor-killing capacity of CTLs, resulting in a reduction in patient
survival. CTSS serves an essential role in tumor biology, including
tumor angiogenesis, ECM degradation and genomic alterations
(17,42). Bararia et al (43) reported that 6% (19/305) of FL
patients had CTSS Y132 mutations and 13% (37/286) of FL patients
had CTSS amplifications. Consistent with these findings, the
present study demonstrated that CTSS alterations primarily involved
amplification and mutation. For example, a high rate of CTSS
mutations were seen in SKCM, and SKCM with a CTSS mutation showed
higher levels of infiltration of TFHs and Tregs cells compared with
SKCM with wild type CTSS.
It is now understood that immune cells and related
matrix components in the TME can create an inflammatory
micro-environment that impedes tumor development (44). However, the TME can also cause the
depletion of effector T cells and transform into a tumor-associated
microenvironment after numerous stimuli, such as a hypoxic or
inflammatory response. This shift in the microenvironment can
markedly facilitate cancer progression (45). Thus, identification of new targets
or biomarkers that can reverse the immunosuppressive effect of the
TME is urgently needed. The present study evaluated the correlation
between CTSS and the immune microenvironment in numerous cancers.
Results demonstrated that CTSS positively correlated with both
stromal and immune cell scores in BLCA, SKCM, LGG and UVM.
Furthermore, previous studies have reported that
immune cells can exert anti-neoplastic and tumor-supportive
effects, which offer an avenue for interventions in the
immunosuppressive state of the TME (46). Immune cell infiltration has been
reported to be significantly related to improved survival (47,48).
However, the relationship between tumor-infiltrating immune cells
and patient survival can vary depending on tumor type. For example,
a previous study reported that tumor-infiltrating immune cells were
negatively related to survival of patients with KIRC (49), while another study indicated that
the differential infiltration of CD8+ T cells yielded
contrasting effects on the prognosis of KICH in patients with KIRP
(50). These observations provide
compelling evidence of the heterogeneity in immune cell
infiltration patterns and mechanisms among various tumor types. Kim
et al (51) demonstrated
that increased CTSS in DCs could alter the repertoire of TFHs,
change the presentation of antigens to CD4+ T cells and
destroy CD4+ T cell epitopes, which may contribute to
autoimmune or inflammatory diseases. However, the correlation
between CTSS and immune cell infiltration in cancers has not yet
been clarified. The present analysis of immune cell infiltration
revealed a notable correlation between CTSS and activated memory
CD4+ T cells in BLCA, KIRC, SKCM and UVM, as well as
CD8+ T cells in BLCA, SKCM, LGG and UVM. Likewise, a
previous study reported that in renal autoimmune diseases, CTSS
induced immune responses by driving MHC-II-mediated T and B cell
activation (52).
In addition, cysteine cathepsin exerts a regulatory
influence on the cytotoxicity of NK cells and T cells, serving a
pivotal role in modulating their immune responses (53). Macrophages exert a critical role in
modulating the immune microenvironment within tumors. M1
macrophages are known to impede tumor growth and secrete
pro-inflammatory cytokines, whereas M2 macrophages facilitate tumor
progression (54,55). In addition, owing to their
remarkable cytotoxic capabilities and capacity to secrete IFN-γ, γδ
T cells assume a pivotal role in anti-tumor immunity (56). The immune cell infiltration analysis
revealed CTSS expression had a significant positive association
with the infiltration level of γδ T cells while exhibiting a
significant negative correlation with resting NK cells in KIRC.
Additionally, CTSS displayed a positive association with the
infiltration levels of M1 macrophages and activated NK cells but
showed a negative association with the infiltration levels of M2
macrophages and resting NK cells in SKCM. These findings suggest
that CTSS may serve a crucial role in modulating the immune
response within the tumor microenvironment, providing further
support for the potential relationship between CTSS expression and
favorable prognosis in BLCA and SKCM.
Notably, the increased expression of certain immune
co-inhibitory proteins on the cell surface, such as LAG-3, TIGIT
and CTLA4, can cause the dysfunction of CD8+ T cells
(57). Thus, it is important to
identify biomarkers that can predict the expression of these
immune-related genes in malignant tumors. Gene co-expression
analysis showed that CTSS co-expressed with immune-related genes,
such as CTLA4, TIGIT, LAG-3, PDCD1 and LGALS9, in BLCA, KIRC, SKCM,
LGG and UVM. These findings suggest the predictive role of CTSS in
these cancers.
Previous research has suggested that CTSS is
significantly associated with pro-inflammation factors and
immunity. CTSS can alter the expression of inflammatory cytokines
(11) and activate them, and
affects psoriasis inflammation (58). CTSS serves a vital role in MHC-II
antigen presentation by promoting the degradation of invariant
chains (59). However, the
relationship between CTSS and inflammatory and immune-related
functions and pathways in pan-cancer remains unclear. Functional
enrichment analysis indicated a potential impact of CTSS expression
on biological functions and pathways, such as immune response
regulating signaling pathways, regulation of lymphocyte activation
and T cell receptor singling pathways in BLCA, SKCM, LGG and
UVM.
The present study relied predominantly on
bioinformatics techniques however, due to sample collection
feasibility and other limiting factors, validation of these results
was only performed experimentally on KIRC, which is a limitation of
the study. To bolster the credibility of the present findings, the
differential expression of CTSS in cancer was further investigated
using publicly available databases. However, these results are
exploratory and require further validation. Future research should
encompass a broader range of pan-cancer datasets and clinical
samples to further corroborate the findings of this study.
To summarize, the present study substantiated the
relationship between CTSS expression and prognosis, TME and immune
response in numerous cancers. The findings of the present study
suggest that CTSS may be a key biomarker for predicting the
prognosis of many cancers, such as BLCA, SKCM, UVM and LGG, and the
immune infiltration of cancers, such as KIRC and SKCM. These
findings provide novel insights that can contribute to advancements
in cancer prevention and treatment strategies.
Supplementary Material
Supporting Data
Acknowledgements
Not applicable.
Funding
This work was supported by the National Natural Science
Foundation of China (grant no. 81860142).
Availability of data and materials
The bioinformatics datasets analyzed during the
current study are available in the University of California Santa
Cruz repository (UCSC Xena, http://xenabrowser.net/datapages/), the cBioPortal
database (https://www.cbioportal.org), the
Human Protein Atlas database (https://www.proteinatlas.org/), the Mutation module of
TIMER2.0 (http://timer.cistrome.org/), the
Tumor Immune Dysfunction and the Exclusion (TIDE) database
(http://tide.dfci.harvard.edu/). The
other datasets used and/or analyzed during the current study are
available from the corresponding author on reasonable request.
Authors' contributions
HM and SC designed the study. BD prepared the
methodology and software. HM collected renal pathological tissue.
SL conducted formal analysis and validation. BD and SL wrote the
original draft. SC revised the manuscript, and HM was responsible
for the supervision, project administration, providing research
funding, and coordinating and resolving any issues related to
scientific accuracy during the research process. SL and BD confirm
the authenticity of all the raw data. All authors have read and
agreed to the published version of the manuscript.
Ethics approval and consent to
participate
The study was performed in line with the principles
of the Declaration of Helsinki. Approval was granted by the Medical
Ethics Committee of The First Affiliated Hospital of Guangxi
Medical University (approval no. 2022-E387-01). Informed consent
was acquired from each patient.
Patient consent for publication
Not applicable.
Competing interests
The authors declare that they have no competing
interests.
References
|
1
|
Sung H, Ferlay J, Siegel RL, Laversanne M,
Soerjomataram I, Jemal A and Bray F: Global Cancer Statistics 2020:
GLOBOCAN estimates of incidence and mortality worldwide for 36
cancers in 185 countries. CA Cancer J Clin. 71:209–249. 2021.
View Article : Google Scholar : PubMed/NCBI
|
|
2
|
Miriyala R, Mahantshetty U, Maheshwari A
and Gupta S: Neoadjuvant chemotherapy followed by surgery in
cervical cancer: Past, present and future. Int J Gynecol Cancer.
32:260–265. 2022. View Article : Google Scholar : PubMed/NCBI
|
|
3
|
van den Akker MJE, Horeweg N, Beltman JJ,
Creutzberg CL and Nout RA: Efficacy and toxicity of postoperative
external beam radiotherapy or chemoradiation for early-stage
cervical cancer. Int J Gynecol Cancer. 30:1878–1886. 2020.
View Article : Google Scholar : PubMed/NCBI
|
|
4
|
Topalian SL, Weiner GJ and Pardoll DM:
Cancer immunotherapy comes of age. J Clin Oncol. 29:4828–4836.
2011. View Article : Google Scholar : PubMed/NCBI
|
|
5
|
Abril-Rodriguez G and Ribas A: SnapShot:
Immune checkpoint inhibitors. Cancer Cell. 31:848.e12017.
View Article : Google Scholar : PubMed/NCBI
|
|
6
|
Washah HN, Salifu EY, Soremekun O,
Elrashedy AA, Munsamy G, Olotu FA and Soliman MES: Integrating
bioinformatics strategies in cancer immunotherapy: Current and
future perspectives. Comb Chem High Throughput Screen. 23:687–698.
2020. View Article : Google Scholar : PubMed/NCBI
|
|
7
|
Bagchi S, Yuan R and Engleman EG: Immune
checkpoint inhibitors for the treatment of cancer: Clinical impact
and mechanisms of response and resistance. Annu Rev Pathol.
16:223–249. 2021. View Article : Google Scholar : PubMed/NCBI
|
|
8
|
Robert C, Schachter J, Long GV, Arance A,
Grob JJ, Mortier L, Daud A, Carlino MS, McNeil C, Lotem M, et al:
Pembrolizumab versus ipilimumab in advanced melanoma. N Engl J Med.
372:2521–2532. 2015. View Article : Google Scholar : PubMed/NCBI
|
|
9
|
Matsunaga H, Ito K, Akiyama M, Takahashi
A, Koyama S, Nomura S, Ieki H, Ozaki K, Onouchi Y, Sakaue S, et al:
Transethnic Meta-analysis of genome-wide association studies
identifies three new loci and characterizes population-specific
differences for coronary artery disease. Circ Genom Precis Med.
13:e0026702020. View Article : Google Scholar : PubMed/NCBI
|
|
10
|
McDowell SH, Gallaher SA, Burden RE and
Scott CJ: Leading the invasion: The role of Cathepsin S in the
tumour microenvironment. Biochim Biophys Acta Mol Cell Res.
1867:1187812020. View Article : Google Scholar : PubMed/NCBI
|
|
11
|
Arnlov J: Cathepsin S as a biomarker:
Where are we now and what are the future challenges? Biomark Med.
6:9–11. 2012. View Article : Google Scholar : PubMed/NCBI
|
|
12
|
Unanue ER, Turk V and Neefjes J:
Variations in MHC Class II antigen processing and presentation in
health and disease. Annu Rev Immunol. 34:265–297. 2016. View Article : Google Scholar : PubMed/NCBI
|
|
13
|
Klinngam W, Fu R, Janga SR, Edman MC and
Hamm-Alvarez SF: Cathepsin S alters the expression of
pro-inflammatory cytokines and MMP-9, Partially through
Protease-activated receptor-2, in human corneal epithelial cells.
Int J Mol Sci. 19:35302018. View Article : Google Scholar : PubMed/NCBI
|
|
14
|
Gormley JA, Hegarty SM, O'Grady A,
Stevenson MR, Burden RE, Barrett HL, Scott CJ, Johnston JA, Wilson
RH, Kay EW, et al: The role of Cathepsin S as a marker of prognosis
and predictor of chemotherapy benefit in adjuvant CRC: A pilot
study. Br J Cancer. 105:1487–1494. 2011. View Article : Google Scholar : PubMed/NCBI
|
|
15
|
Yang Y, Lim SK, Choong LY, Lee H, Chen Y,
Chong PK, Ashktorab H, Wang TT, Salto-Tellez M, Yeoh KG and Lim YP:
Cathepsin S mediates gastric cancer cell migration and invasion via
a putative network of metastasis-associated proteins. J Proteome
Res. 9:4767–4778. 2010. View Article : Google Scholar : PubMed/NCBI
|
|
16
|
Gautam J, Bae YK and Kim JA: Up-regulation
of Cathepsin S expression by HSP90 and 5-HT7 receptor-dependent
serotonin signaling correlates with triple negativity of human
breast cancer. Breast Cancer Res Treat. 161:29–40. 2017. View Article : Google Scholar : PubMed/NCBI
|
|
17
|
Small DM, Burden RE, Jaworski J, Hegarty
SM, Spence S, Burrows JF, McFarlane C, Kissenpfennig A, McCarthy
HO, Johnston JA, et al: Cathepsin S from both tumor and
tumor-associated cells promote cancer growth and
neovascularization. Int J Cancer. 133:2102–2112. 2013. View Article : Google Scholar : PubMed/NCBI
|
|
18
|
Yang M, Liu J, Shao J, Qin Y, Ji Q, Zhang
X and Du J: Cathepsin S-mediated autophagic flux in
tumor-associated macrophages accelerate tumor development by
promoting M2 polarization. Mol Cancer. 13:432014. View Article : Google Scholar : PubMed/NCBI
|
|
19
|
Wilkinson RDA, Burden RE, McDowell SH,
McArt DG, McQuaid S, Bingham V, Williams R, Cox ÓT, O'Connor R,
McCabe N, et al: A novel role for Cathepsin S as a potential
biomarker in triple negative breast cancer. J Oncol.
2019:39802732019. View Article : Google Scholar : PubMed/NCBI
|
|
20
|
Dheilly E, Battistello E, Katanayeva N,
Sungalee S, Michaux J, Duns G, Wehrle S, Sordet-Dessimoz J, Mina M,
Racle J, et al: Cathepsin S regulates antigen processing and T cell
activity in non-Hodgkin lymphoma. Cancer Cell. 37:674–89.e12. 2020.
View Article : Google Scholar : PubMed/NCBI
|
|
21
|
Riether C and Ochsenbein AF: Genetic
alterations Impact immune microenvironment interactions in
follicular lymphoma. Cancer Cell. 37:621–622. 2020. View Article : Google Scholar : PubMed/NCBI
|
|
22
|
Liu J, Lichtenberg T, Hoadley KA, Poisson
LM, Lazar AJ, Cherniack AD, Kovatich AJ, Benz CC, Levine DA, Lee
AV, et al: An integrated TCGA Pan-cancer clinical data resource to
drive high-quality survival outcome analytics. Cell.
173:400–16.e11. 2018. View Article : Google Scholar : PubMed/NCBI
|
|
23
|
Livak KJ and Schmittgen TD: Analysis of
relative gene expression data using Real-time quantitative PCR and
the 2(−Delta Delta C(T)) method. Methods. 25:402–408. 2001.
View Article : Google Scholar : PubMed/NCBI
|
|
24
|
Pfaffl MW, Tichopad A, Prgomet C and
Neuvians TP: Determination of stable housekeeping genes,
differentially regulated target genes and sample integrity:
BestKeeper-Excel-based tool using pair-wise correlations.
Biotechnol Lett. 26:509–515. 2004. View Article : Google Scholar : PubMed/NCBI
|
|
25
|
Miao Y, Wang J, Li Q, Quan W, Wang Y, Li
C, Wu J and Mi D: Prognostic value and immunological role of PDCD1
gene in pan-cancer. Int Immunopharmacol. 89:1070802020. View Article : Google Scholar : PubMed/NCBI
|
|
26
|
Ma K, Jin Q, Wang M, Li X and Zhang Y:
Research progress and clinical application of predictive biomarker
for immune checkpoint inhibitors. Expert Rev Mol Diagn. 19:517–529.
2019. View Article : Google Scholar : PubMed/NCBI
|
|
27
|
Palmeri M, Mehnert J, Silk AW, Jabbour SK,
Ganesan S, Popli P, Riedlinger G, Stephenson R, de Meritens AB,
Leiser A, et al: Real-world application of tumor mutational
burden-high (TMB-high) and microsatellite instability (MSI)
confirms their utility as immunotherapy biomarkers. ESMO Open.
7:1003362022. View Article : Google Scholar : PubMed/NCBI
|
|
28
|
Balar AV and Weber JS: PD-1 and PD-L1
antibodies in cancer: Current status and future directions. Cancer
Immunol Immunother. 66:551–564. 2017. View Article : Google Scholar : PubMed/NCBI
|
|
29
|
Jardim DL, Goodman A, de Melo Gagliato D
and Kurzrock R: The challenges of tumor mutational burden as an
immunotherapy biomarker. Cancer Cell. 39:154–173. 2021. View Article : Google Scholar : PubMed/NCBI
|
|
30
|
Pare L, Pascual T, Segui E, Teixido C,
Gonzalez-Cao M, Galván P, Rodríguez A, González B, Cuatrecasas M,
Pineda E, et al: Association between PD1 mRNA and response to
anti-PD1 monotherapy across multiple cancer types. Ann Oncol.
29:2121–2128. 2018. View Article : Google Scholar : PubMed/NCBI
|
|
31
|
Chai P, Yu J, Ge S, Jia R and Fan X:
Genetic alteration, RNA expression, and DNA methylation profiling
of coronavirus disease 2019 (COVID-19) receptor ACE2 in
malignancies: A pan-cancer analysis. J Hematol Oncol. 13:432020.
View Article : Google Scholar : PubMed/NCBI
|
|
32
|
Yan C and Richmond A: Hiding in the dark:
Pan-cancer characterization of expression and clinical relevance of
CD40 to immune checkpoint blockade therapy. Mol Cancer. 20:1462021.
View Article : Google Scholar : PubMed/NCBI
|
|
33
|
Kremenovic M, Chan AA, Feng B, Bäriswyl L,
Robatel S, Gruber T, Tang L, Lee DJ and Schenk M: BCG hydrogel
promotes CTSS-mediated antigen processing and presentation, thereby
suppressing metastasis and prolonging survival in melanoma. J
Immunother Cancer. 10:e0041332022. View Article : Google Scholar : PubMed/NCBI
|
|
34
|
Yan X, Wu C, Chen T, Santos MM, Liu CL,
Yang C, Zhang L, Ren J, Liao S, Guo H, et al: Cathepsin S
inhibition changes regulatory T-cell activity in regulating bladder
cancer and immune cell proliferation and apoptosis. Mol Immunol.
82:66–74. 2017. View Article : Google Scholar : PubMed/NCBI
|
|
35
|
Gocheva V, Zeng W, Ke D, Klimstra D,
Reinheckel T, Peters C, Hanahan D and Joyce JA: Distinct roles for
cysteine cathepsin genes in multistage tumorigenesis. Genes Dev.
20:543–556. 2006. View Article : Google Scholar : PubMed/NCBI
|
|
36
|
Paraoan L, Gray D, Hiscott P,
Garcia-Finana M, Lane B, Damato B and Grierson I: Cathepsin S and
its inhibitor cystatin C: Imbalance in uveal melanoma. Front Biosci
(Landmark Ed). 14:2504–2513. 2009. View
Article : Google Scholar : PubMed/NCBI
|
|
37
|
Flannery T, McQuaid S, McGoohan C,
McConnell RS, McGregor G, Mirakhur M, Hamilton P, Diamond J, Cran
G, Walker B, et al: Cathepsin S expression: An independent
prognostic factor in glioblastoma tumours-a pilot study. Int J
Cancer. 119:854–860. 2006. View Article : Google Scholar : PubMed/NCBI
|
|
38
|
Zhang L, Wang H, Xu J, Zhu J and Ding K:
Inhibition of cathepsin S induces autophagy and apoptosis in human
glioblastoma cell lines through ROS-mediated PI3K/AKT/mTOR/p70S6K
and JNK signaling pathways. Toxicol Lett. 228:248–259. 2014.
View Article : Google Scholar : PubMed/NCBI
|
|
39
|
Golstein P and Griffiths GM: An early
history of T cell-mediated cytotoxicity. Nat Rev Immunol.
18:527–535. 2018. View Article : Google Scholar : PubMed/NCBI
|
|
40
|
Hoa N, Ge L, Kuznetsov Y, McPherson A,
Cornforth AN, Pham JT, Myers MP, Ahmed N, Salsman VS, Lamb LS Jr,
et al: Glioma cells display complex cell surface topographies that
resist the actions of cytolytic effector lymphocytes. J Immunol.
185:4793–4803. 2010. View Article : Google Scholar : PubMed/NCBI
|
|
41
|
Nakashima S, Sugita Y, Miyoshi H, Arakawa
F, Muta H, Ishibashi Y, Niino D, Ohshima K, Terasaki M, Nakamura Y
and Morioka M: Endothelin B receptor expression in malignant
gliomas: The perivascular immune escape mechanism of gliomas. J
Neurooncol. 127:23–32. 2016. View Article : Google Scholar : PubMed/NCBI
|
|
42
|
Beroukhim R, Mermel CH, Porter D, Wei G,
Raychaudhuri S, Donovan J, Barretina J, Boehm JS, Dobson J,
Urashima M, et al: The landscape of somatic copy-number alteration
across human cancers. Nature. 463:899–905. 2010. View Article : Google Scholar : PubMed/NCBI
|
|
43
|
Bararia D, Hildebrand JA, Stolz S, Haebe
S, Alig S, Trevisani CP, Osorio-Barrios F, Bartoschek MD, Mentz M,
Pastore A, et al: Cathepsin S alterations induce a tumor-promoting
immune microenvironment in follicular lymphoma. Cell Rep.
31:1075222020. View Article : Google Scholar : PubMed/NCBI
|
|
44
|
Rhim AD, Oberstein PE, Thomas DH, Mirek
ET, Palermo CF, Sastra SA, Dekleva EN, Saunders T, Becerra CP,
Tattersall IW, et al: Stromal elements act to restrain, rather than
support, pancreatic ductal adenocarcinoma. Cancer Cell. 25:735–747.
2014. View Article : Google Scholar : PubMed/NCBI
|
|
45
|
Junttila MR and de Sauvage FJ: Influence
of tumour micro-environment heterogeneity on therapeutic response.
Nature. 501:346–354. 2013. View Article : Google Scholar : PubMed/NCBI
|
|
46
|
Labani-Motlagh A, Ashja-Mahdavi M and
Loskog A: The Tumor Microenvironment: A Milieu Hindering and
Obstructing Antitumor Immune Responses. Front Immunol. 11:9402020.
View Article : Google Scholar : PubMed/NCBI
|
|
47
|
Pagès F, Mlecnik B, Marliot F, Bindea G,
Ou FS, Bifulco C, Lugli A, Zlobec I, Rau TT, Berger MD, et al:
International validation of the consensus Immunoscore for the
classification of colon cancer: A prognostic and accuracy study.
Lancet. 391:2128–2139. 2018. View Article : Google Scholar : PubMed/NCBI
|
|
48
|
Thomas NE, Busam KJ, From L, Kricker A,
Armstrong BK, Anton-Culver H, Gruber SB, Gallagher RP, Zanetti R,
Rosso S, et al: Tumor-infiltrating lymphocyte grade in primary
melanomas is independently associated with melanoma-specific
survival in the population-based genes, environment and melanoma
study. J Clin Oncol. 31:4252–4259. 2013. View Article : Google Scholar : PubMed/NCBI
|
|
49
|
Chen S, Wang C, Su X, Dai X, Li S and Mo
Z: KCNN4 is a potential prognostic marker and critical factor
affecting the immune status of the tumor microenvironment in kidney
renal clear cell carcinoma. Transl Androl Urol. 10:2454–2470. 2021.
View Article : Google Scholar : PubMed/NCBI
|
|
50
|
Chen S, Su X, Mi H, Dai X, Li S, Chen S
and Zhang S: Comprehensive analysis of glutathione peroxidase-1
(GPX1) expression and prognostic value in three different types of
renal cell carcinoma. Transl Androl Urol. 9:2737–2750. 2020.
View Article : Google Scholar : PubMed/NCBI
|
|
51
|
Kim SJ, Schatzle S, Ahmed SS, Haap W, Jang
SH, Gregersen PK, Georgiou G and Diamond B: Increased cathepsin S
in Prdm1−/− dendritic cells alters the TFH cell
repertoire and contributes to lupus. Nat Immunol. 18:1016–1024.
2017. View Article : Google Scholar : PubMed/NCBI
|
|
52
|
Rupanagudi KV, Kulkarni OP, Lichtnekert J,
Darisipudi MN, Mulay SR, Schott B, Gruner S, Haap W, Hartmann G and
Anders HJ: Cathepsin S inhibition suppresses systemic lupus
erythematosus and lupus nephritis because cathepsin S is essential
for MHC class II-mediated CD4 T cell and B cell priming. Ann Rheum
Dis. 74:452–463. 2015. View Article : Google Scholar : PubMed/NCBI
|
|
53
|
Perišić Nanut M, Sabotič J, Jewett A and
Kos J: Cysteine cathepsins as regulators of the cytotoxicity of NK
and T cells. Front Immunol. 5:6162014.PubMed/NCBI
|
|
54
|
Gunassekaran GR, Poongkavithai Vadevoo SM,
Baek MC and Lee B: M1 macrophage exosomes engineered to foster M1
polarization and target the IL-4 receptor inhibit tumor growth by
reprogramming tumor-associated macrophages into M1-like
macrophages. Biomaterials. 278:1211372021. View Article : Google Scholar : PubMed/NCBI
|
|
55
|
Xia Y, Rao L, Yao H, Wang Z, Ning P and
Chen X: Engineering macrophages for cancer immunotherapy and drug
delivery. Adv Mater. 32:e20020542020. View Article : Google Scholar : PubMed/NCBI
|
|
56
|
Mensurado S, Blanco-Dominguez R and
Silva-Santos B: The emerging roles of gammadelta T cells in cancer
immunotherapy. Nat Rev Clin Oncol. 20:178–191. 2023. View Article : Google Scholar : PubMed/NCBI
|
|
57
|
van der Leun AM, Thommen DS and Schumacher
TN: CD8+ T cell states in human cancer: Insights from
single-cell analysis. Nat Rev Cancer. 20:218–232. 2020. View Article : Google Scholar : PubMed/NCBI
|
|
58
|
Ainscough JS, Macleod T, McGonagle D,
Brakefield R, Baron JM, Alase A, Wittmann M and Stacey M: Cathepsin
S is the major activator of the psoriasis-associated
proinflammatory cytokine IL-36gamma. Proc Natl Acad Sci USA.
114:E2748–E2757. 2017. View Article : Google Scholar : PubMed/NCBI
|
|
59
|
Bania J, Gatti E, Lelouard H, David A,
Cappello F, Weber E, Camosseto V and Pierre P: Human cathepsin S,
but not cathepsin L, degrades efficiently MHC class II-associated
invariant chain in nonprofessional APCs. Proc Natl Acad Sci USA.
100:6664–6669. 2003. View Article : Google Scholar : PubMed/NCBI
|