Introduction
Glioma is the most common primary malignant brain
tumor in adults worldwide, often affecting individuals 55–60 years
of age (1). Gliomas are
characterized by diffuse infiltrative growth and high invasiveness,
making complete surgical resection challenging and yielding
suboptimal outcomes following postoperative traditional
chemotherapy with radiotherapy (2,3).
Compared with low-grade gliomas (LGGs) (grades II and III),
glioblastoma (GBM) (grade IV) is significantly more fatal to
patients (4). Patients diagnosed
with GBM have a median survival time of <15 months and a 5-year
survival rate of <5% (5).
Despite current therapies such as anti-angiogenic drugs and
electric field therapy, recent therapeutic advances have not
yielded substantial benefits, and disease control has remained
elusive (6–8). Thus, studying tumorigenesis mechanisms
to identify new therapeutic targets is critical (9).
Glioma, as with a number of other rapidly
proliferating tumor cells, requires abundant energy to thrive
(10). Furthermore, tumor cells
develop metabolic pathways to increase the synthesis and
transformation of carbohydrates, lipids and proteins (11,12).
Changes in tumor metabolism are closely associated with the tumor
microenvironment (TME) and immunity (13). The enhanced fatty acid (FA)
metabolism observed in glioma is a hallmark of cancer, with the FA
composition of cell membranes playing a crucial role in cell
survival, lipid peroxidative damage protection and the prevention
of ferroptosis (14). Glioma cells
derive FAs from exogenous sources or synthesize endogenous FAs
excessively through adipogenic pathways (15). Previous studies have found an
association between FA oxidation (FAO) and glioma prognosis and
malignancy (16–18). However, there has not been an
extensive exploration of the link between FA metabolism and tumor
immunity. Therefore, the present study aimed to analyze a
prognostic model of FAO-related genes in glioma and its association
with tumor immune infiltration, identify a new model and screen out
key molecular markers, to facilitate the development of improved
therapeutic strategies based on clinical and immune characteristics
and treatment responses.
Materials and methods
Data sources
RNA sequencing and clinical data were extracted from
The Cancer Genome Atlas (TCGA; http://tcga-data.nci.nih.gov/) LGG and GBM datasets
and the Chinese Glioma Genome Atlas (CGGA; http://www.cgga.org.cn/) database (CGGA.mRNAseq_693)
(19). A total of 1,363 glioma
samples, including 670 from TCGA and 693 from the CGGA were
included in the present study. The FAO-related gene signature
comprised of 15 genes was determined using the gene set,
‘GOBP_POSITIVE_REGULATION_OF_FATTY_ACID_OXIDATION’, in the MsigDB
database (https://www.gsea-msigdb.org/gsea/msigdb) (20). The genes included PPARG coactivator
1 α, carnitine palmitoyltransferase 1A, mitoregulin, AKT
serine/threonine kinase 2, ATP binding cassette subfamily D member
1 (ABCD1), fatty acid binding protein 1, ABCD2,
malonyl-CoA decarboxylase, insulin receptor substrate 1
(IRS1), perilipin 5, peroxisome proliferator activated
receptor α, peroxisome proliferator activated receptor δ, twist
family bHLH transcription factor 1, nuclear receptor subfamily 4
group A member 3 and IRS2. The subsequent analysis was
performed using the R software (version 4.1.1) (21).
Single-cell level analysis
The expression of FAO-related genes in glioma were
analyzed at the single-cell level using the Tumor Immune
Single-cell Hub 2 (TISCH2) database (http://tisch.comp-genomics.org/) (22). Furthermore, analyses were conducted
to investigate the features and traits of the FAO-related genes
located within glioma. The Gene Set Cancer Analysis (GSCA) database
(http://bioinfo.life.hust.edu.cn/GSCA/) (23) was used for these additional
analyses, which included gene mutation, DNA methylation, somatic
copy number variation and immune cell infiltrate analyses.
Principal component analysis
(PCA)
The present study utilized two R packages, ‘sva’ and
‘limma’, to remove batch effects and normalize samples obtained
from the TCGA and CCGA databases. PCA was conducted using two R
packages, ‘FactoMineR’ and ‘factoextra’ to visualize the principle
components. A correlation analysis was conducted to determine the
correlation between genes using the R package, ‘ggplot2’.
Additionally, the R package, ‘survival’, was used to analyze the
relationship between FAO-related gene expression and prognostic
values in patients with glioma. The R package, ‘TSHRC’, was used to
generate Kaplan-Meier (KM) survival curves, which uses the
two-stage test to generate P-values. P<0.05 was considered to
indicate a statistically significant difference.
Consensus clustering analysis
For exploring the functions of FAO-related genes in
glioma, unsupervised consensus cluster analysis was conducted using
the ‘ConsensusClusterPlus’ package in R, which classified patients
into different clusters based on the comparison of FAO-related gene
expression profiles. Survival analyses were undertaken for each
cluster by utilizing the ‘survival’ and ‘survminer’ R packages. The
‘limma’ R package was utilized to analyze the differential
expression of FAO-related genes between different clusters. The
correlation of gene expression patterns with clinicopathological
characteristics were presented as a heatmap using the ‘pheatmap’ R
package. To identify the enriched biological pathways in
FAO-related gene sets, the HALLMARK, Kyoto Encyclopedia of Genes
and Genomes (KEGG) and Reactome gene sets were downloaded from the
Molecular Signature Database, MsigDB 3.0 (http://www.broadinstitute.org/gsea/msigdb/index.jsp).
The enrichment of specific biological pathways was then analyzed
utilizing the R package, ‘GSEA’. The resulting data from the gene
set enrichment analysis (GSEA) was used to create a heatmap that
compared the enrichment across clusters using the R package
‘pheatmap’.
Gene subgroup construction
The R package ‘limma’ was used for differential
expression analysis, and the R package, ‘ggplot2’, was utilized to
visualize pairwise comparisons via Volcano plots. The screening
threshold applied for identifying differentially expressed genes
(DEGs) was log fold change >2 and P<0.05. The overlapping set
of the three differential results was obtained and analyzed further
utilizing the R package, ‘clusterprofiler’, for enrichment
analysis. KEGG pathway and Gene Ontology (GO) enrichment analyses
were conducted using the R packages, ‘enrichplot’ and
‘ggplot2’.
Gene subgroup immune infiltration
PCA was conducted using the R package, ‘prcomp’,
with default parameters. The R package, ‘ESTIMATE’, was used to
estimate immune infiltration based on the StromalScore, ImmuneScore
and ESTIMATEScore and the differences were compared between the
subgroups. Furthermore, the infiltration levels of the immune cell
types were estimated using the single-sample (ss)GSEA method via
the R package, ‘GSVA’, and the differences were compared between
the different subgroups. Finally, all results were visualized using
the R package ‘ggplot’.
Prognostic scoring model based on key
DEGs
To identify a set of candidate prognostic genes,
univariate Cox regression analysis was performed using the selected
DEGs by R package ‘survival’ (Table
SI). The DEGs were ranked by P-value from high to low, and the
top 50 DEGs were selected for unsupervised consensus cluster
analysis by R package ‘ConsensusClusterPlus’. Survival status,
heatmap distribution and differential expression of FAO-related
genes were compared between the different DEG subgroups. Following
PCA using the top 50 DEGs by R package ‘princomp’, principal
components 1 (PC1) and PC2 were extracted, which were then used to
construct the FAO-related DEGs score. The score for each sample was
determined based on the prognostic value of the gene signature
(24). The formula was as follows:
DEGs score=Σ(PC1i)-Σ(PC2i), where ‘i’ represents DEG expression.
Survival analysis was then performed with the ‘survival’ R package
and using KM survival analysis (log-rank test) to compare groups
with high and low scores; the cut-off value was determined by using
R package ‘maxstat’ (25). The
relationship between type of cluster, score and prognostic status
was displayed in a Sankey diagram, the relationship between FAO
gene subtypes, DEG subtypes and scores were separately compared,
and the correlation between scores and immune cell infiltration
were calculated. The χ2 test was used to analyze the
relationship between the risk score and clinicopathological
characteristics of the glioma samples by the ‘ggpubr’ R package.
Additionally, the expression of five immune checkpoints in glioma
samples were compared across score subgroups by the R package
‘ggpubr’.
Validation set validates scoring model
performance
Given the absence of a glioma-specific immunotherapy
database and the pan-cancer attributes of immunotherapy, certain
datasets containing abundant immunotherapy sample data were
selected as validation sets (26–28).
The two independent validation datasets, GSE135222 (29) and GSE61676 (30), were downloaded from the Gene
Expression Omnibus website (https://www.ncbi.nlm.nih.gov/geo/) (31), to further scrutinize the predictive
performance of the deployed scoring model in tumor treatment.
Moreover, another validation dataset was obtained from the R
package, ‘IMvigor210CoreBiologies’ (http://research-pub.gene.com/IMvigor210CoreBiologies)
(32), which contained a metastatic
urothelial tumors cohort. For each sample within the validation
sets, the score was calculated using the model constructed in the
training set. Next, the risk score, survival rate and recurrence
status of the patients were charted to demonstrate the correlation
between the risk score and patient response to immunotherapy.
Half maximal inhibitory concentration
(IC50) value based on the scoring model
To predict therapeutic response the R package
‘pRRophetic’ was used to calculate the IC50 values of
antitumor drugs for each sample. pRRophetic comprises ~700 cell
lines and 138 drugs and prognosticates the clinical responsiveness
of cancer to specific medications, predicated based on varying gene
expression levels in tumors (33,34).
The gene expression matrices of these samples were derived from the
aforementioned TCGA-LGG and TCGA-GBM datasets. Additionally, the
Wilcoxon rank-sum test was used to assess the variability in
estimated drug sensitivities between the high score and low score
groups. P<0.05 was considered to indicate a statistically
significant difference.
Screening of key genes through
protein-protein interaction (PPI) network construction
The PPI information of the top 50 DEGs was analyzed
using the Search Tool for the Retrieval of Interacting Genes
(STRING) database (http://www.string-db.org/) and the resulting PPI
network was visualized, where the genes represented nodes and the
interactions between nodes represented edges. Cytoscape software
(v3.7.2) (35). with the plug-in,
‘CytoNCA’, was then used to select the hub genes from the PPI
network. The expression and prognostic correlation of the screened
hub gene in different grades of glioma were verified using the
GEPIA database (http://gepia.cancer-pku.cn/).
Verification of hub gene
expression
The HMC3, HS683, A172 (CRL-1620), LN229 and SF539
cell lines were obtained from the American Type Culture Collection
(ATCC). All cell lines were maintained in DMEM (Shanghai Basal
Media Technologies Co., Ltd.) containing 10% fetal bovine serum
(cat. no. C04001-500; Shanghai VivaCell Biosciences, Ltd.) and 1%
penicillin/streptomycin (cat. no. S110B; Shanghai Basal Media
Technologies Co., Ltd.), respectively. Protein was extracted from
the cells using the RIPA buffer (Beyotime Institute of
Biotechnology). The protein expression levels of the hub gene
TIMP1 in various cells were examined using western blotting
(WB). The protein concentration was determined with the BCA Protein
Assay Kit (Beyotime Institute of Biotechnology). Protein samples
were electrophoresed on a 10% gel using SDS-PAGE, with 15 µg per
lane, and then transferred to an nitrocellulose membrane
(MilliporeSigma). The membrane was then blocked at room temperature
for 1 h with 5% skimmed milk/PBS. The tissue inhibitor of
metalloproteinase 1 (TIMP1) antibody (cat. no. K101524P) was
obtained from Beijing Solarbio Science & Technology and the
α-tubulin antibody (cat. no. ER130905) was obtained from Hangzhou
HuaAn Biotechnology Co., Ltd. The TIMP1 antibody was diluted
1:1,000 and the α-tubulin antibody was diluted 1:5,000. Samples
were incubated with the primary antibodies overnight on a shaker at
4°C. After washing with TBST containing 0.1% Tween, the membranes
were incubated with secondary antibodies (anti-Rabbit kit; cat. no.
A32732; Invitrogen; Thermo Fisher Scientific, Inc.) for 1 h at room
temperature. Protein bands were subsequently visualized using the
BeyoECL Star chemiluminescence substrate (cat. no. P0018AM;
Beyotime Institute of Biotechnology) under the ChemiDoc Imaging
System (Bio-Rad Laboratories, Inc.) and analyzed using ImageJ
software (1.47v; National Institutes of Health).
Immunohistochemistry images were downloaded from the
Human Protein Atlas (HPA) website (https://www.proteinatlas.org/humanproteome/pathology).
TIMP1 knockdown
The human glioblastoma cell lines, LN229 and SF539,
were cultured at 37°C in a 5% CO2 incubator, in High Glucose DMEM
(Shanghai Yuanpinghao Biotech Co., Ltd.) containing 10% fetal
bovine serum (Shanghai VivaCell Biosciences, Ltd.). Both cell lines
were obtained from preserved cells in our laboratory (36), originally purchased from the ATCC.
Two small interfering (si) RNAs targeting TIMP1 and a
negative control were designed and synthesized by Guangzhou RiboBio
Co., Ltd. The sequences were as follows: si-TIMP1−1 (sense,
5′-AGAUGACCAAGAUGUAUAAAG-3′; antisense,
5′-UUAUACAUCUUGGUCAUCUUG-3′); si-TIMP1−2 (sense,
5′-CACAGUGUUUCCCUGUUUAUC-3′; antisense,
5′-UAAACAGGGAAACACUGUGCA-3′) and si-NC (sense,
5′-UUCUCCGAACGUGUCACGUTT-3′; antisense,
5′-ACGUGACACGUUCGGAGAATT-3′). Lipofectamine 3000 (Thermo Fisher
Scientific, Inc.) was used for transfection into the LN229 and
SF539 cell lines, according to the manufacturer's instructions.
Colony formation assay
LN229 and SF539 cells were transfected with the
TIMP1 siRNAs or siNC for 48 h as aforementioned. Then, the
cells (1,500 cells/well) were inoculated into a 6-well plate and
transfected with siRNA again on the 6th day. Given the temporary
nature of transient transfection, transfection was performed twice
to ensure the knockdown effect of TIMP1. The cells were incubated
for a further 6 days when they were washed with PBS and stained
with 4% polyformaldehyde for 40 min, then stained with 0.1% crystal
violet for 2 h at room temperature. Colonies with >50 cells were
counted using the ImageJ software.
Cell viability
Cell viability was assessed using Cell Counting
Kit-8 (CCK-8; APeXBIO Technology LLC; lot no. K101826133EF5E). The
siRNA transfected LN229 and SF539 cells (3,000-4,000 cells/well)
were seeded into a 96-well plate. Fresh culture medium (100 µl)
containing CCK-8 solution (10 µl) was added to each well of the
plate in the dark, then the plated was incubated for 2 h in the
dark. The absorbance at a wavelength of 450 nm was measured to
detect cell viability.
5-ethynyl-2-deoxyuridine (EdU)
assay
An EdU kit (BeyoClick™ EDU-488; Beyotime Institute
of Biotechnology) was used to detect the effect of TIMP1
knockdown on GBM cell proliferation. LN229 and SF539 cells
transfected with si-TIMP1 or si-NC for 48 h were co-cultured
in EdU working solution (1:1,000) in a 37°C and 5% CO2
incubator for 3 h. After incubation, the cells were fixed with 4%
paraformaldehyde for 30 min at room temperature, washed and
incubated with reaction solution, according to the instruction
manual. Then, the cells were treated with Hoechst reagent at room
temperature for 10 min to label the cell nuclei. Detection was
conducted using a fluorescence microscope (Leica DMi8; Leica
Microsystems GmbH), and images were captured using ToupView (v3.7)
software (AmScope).
Flow cytometry
Cell apoptosis was detected by flow cytometry using
the annexin V-FITC/PI Apoptosis Detection Kit (Nanjing KeyGen
Biotech Co., Ltd.), with operations performed according to the
manufacturer's instructions. The BD FACSCelesta (BD Biosciences)
flow cytometer was used for detection, and statistical analysis was
conducted using Flow Jo (v10.8.1; FlowJo LLC) software.
Statistical analysis
Each experiment was repeated at least three times
independently. Data are presented as the mean ± standard deviation.
All statistical analyses were performed using GraphPad Prism (v9.0)
software (Dotmatics) with either unpaired Student's t-test or
one-way ANOVA with Bonferroni's adjustment. P<0.05 was
considered to indicate a statistically significant difference.
Results
Genetic mapping and epigenetic
landscape of glioma
In the present study, the genetic mapping and
epigenetic landscape of glioma were examined by investigating 13
FAO-related genes. Using TISCH analysis, the single-cell expression
of FAO-related genes in glioma were observed (Fig. S1). The analysis of somatic
mutations demonstrated a higher frequency of mutations in the GBM
cohort than in the LGG cohort (Fig.
1A). Furthermore, the distribution of mutations in the top 10
mutated genes in glioma were summarized, along with their copy
number variations (CNVs) and the ratio of somatic mutations
(Fig. 1B). A total of 30 samples
with complete single-cell information were obtained from the
‘glioma’ dataset on the TISCH2 website. Of the 30 samples analyzed,
28 had various genetic alterations, including missense mutations,
frame shift insertions and multi-hit mutations. Fig. 2A shows the distribution of the
frequency of harmful mutations in FAO-related genes in gliomas.
Specifically, a positive correlation between CNVs and mRNA
expression levels was found, while a negative correlation between
methylation levels and mRNA expression levels was observed
(Fig. 2B-D). The genetic landscape
and expression levels of FAO-related genes were significantly
different between different grades of glioma, indicating a
potential function of FAO-related genes in glioma initiation and
malignancy. Finally, the FAO-related genes show a strong
correlation with various immune cells, and this correlation is more
pronounced in LGG, suggesting a potential connection between
FAO-related genes and glioma immune infiltration (Fig. S2).
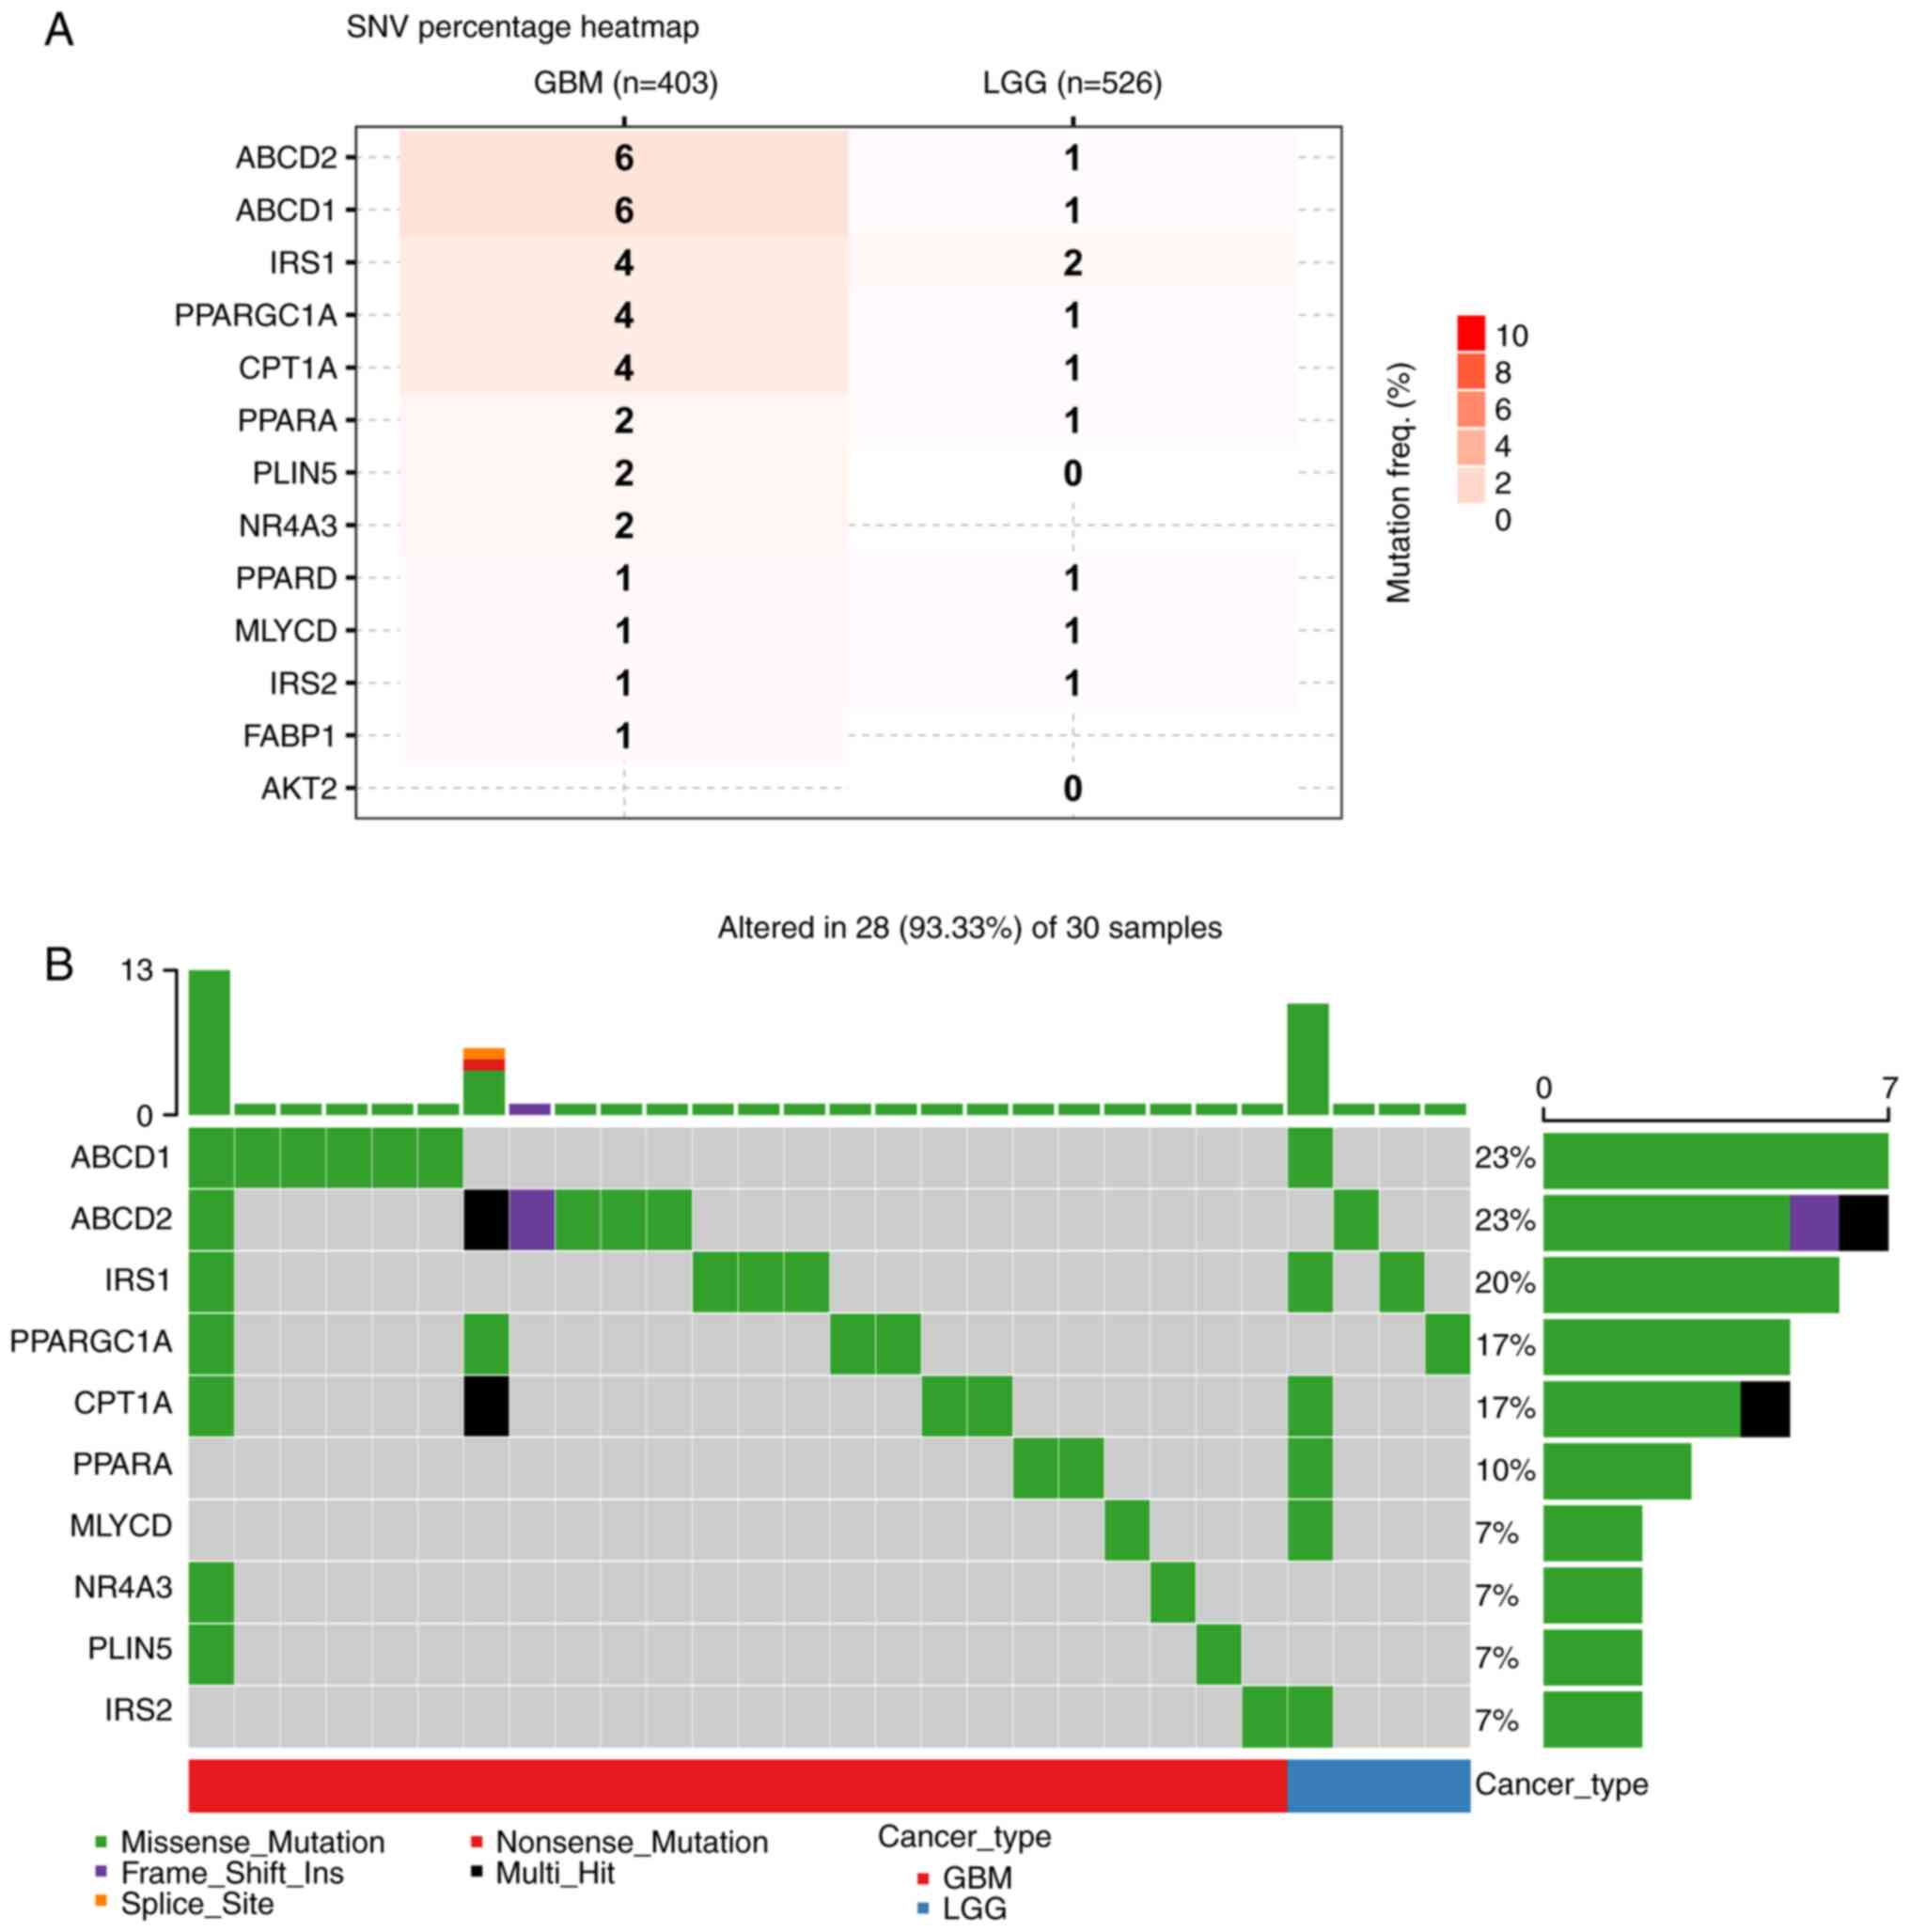 | Figure 1.SNV data of FAO-related genes in the
glioma cohort from the GSCA database (http://bioinfo.life.hust.edu.cn/GSCA/#/). (A) The SNV
frequency of FAO-related genes in the glioma cohort. (B) Summary of
the frequency of deleterious mutations in the glioma cohort. SNV,
single nucleotide variants; LGG, low grade glioma; GBM,
glioblastoma; FAO, fatty acid oxidation; PPARGC1A, PPARG
coactivator 1 α; CPT1A, carnitine palmitoyltransferase 1A; MTLN,
mitoregulin; AKT2, AKT serine/threonine kinase 2; ABCD1, ATP
binding cassette subfamily D member 1; FABP1, fatty acid binding
protein 1; ABCD2, ATP binding cassette subfamily D member 2; MLYCD,
malonyl-CoA decarboxylase; IRS1, insulin receptor substrate 1;
PLIN5, perilipin 5; PPARA, peroxisome proliferator activated
receptor α; PPARD, peroxisome proliferator activated receptor δ;
TWIST1, twist family bHLH transcription factor 1; NR4A3, nuclear
receptor subfamily 4 group A member 3; IRS2, insulin receptor
substrate 2. |
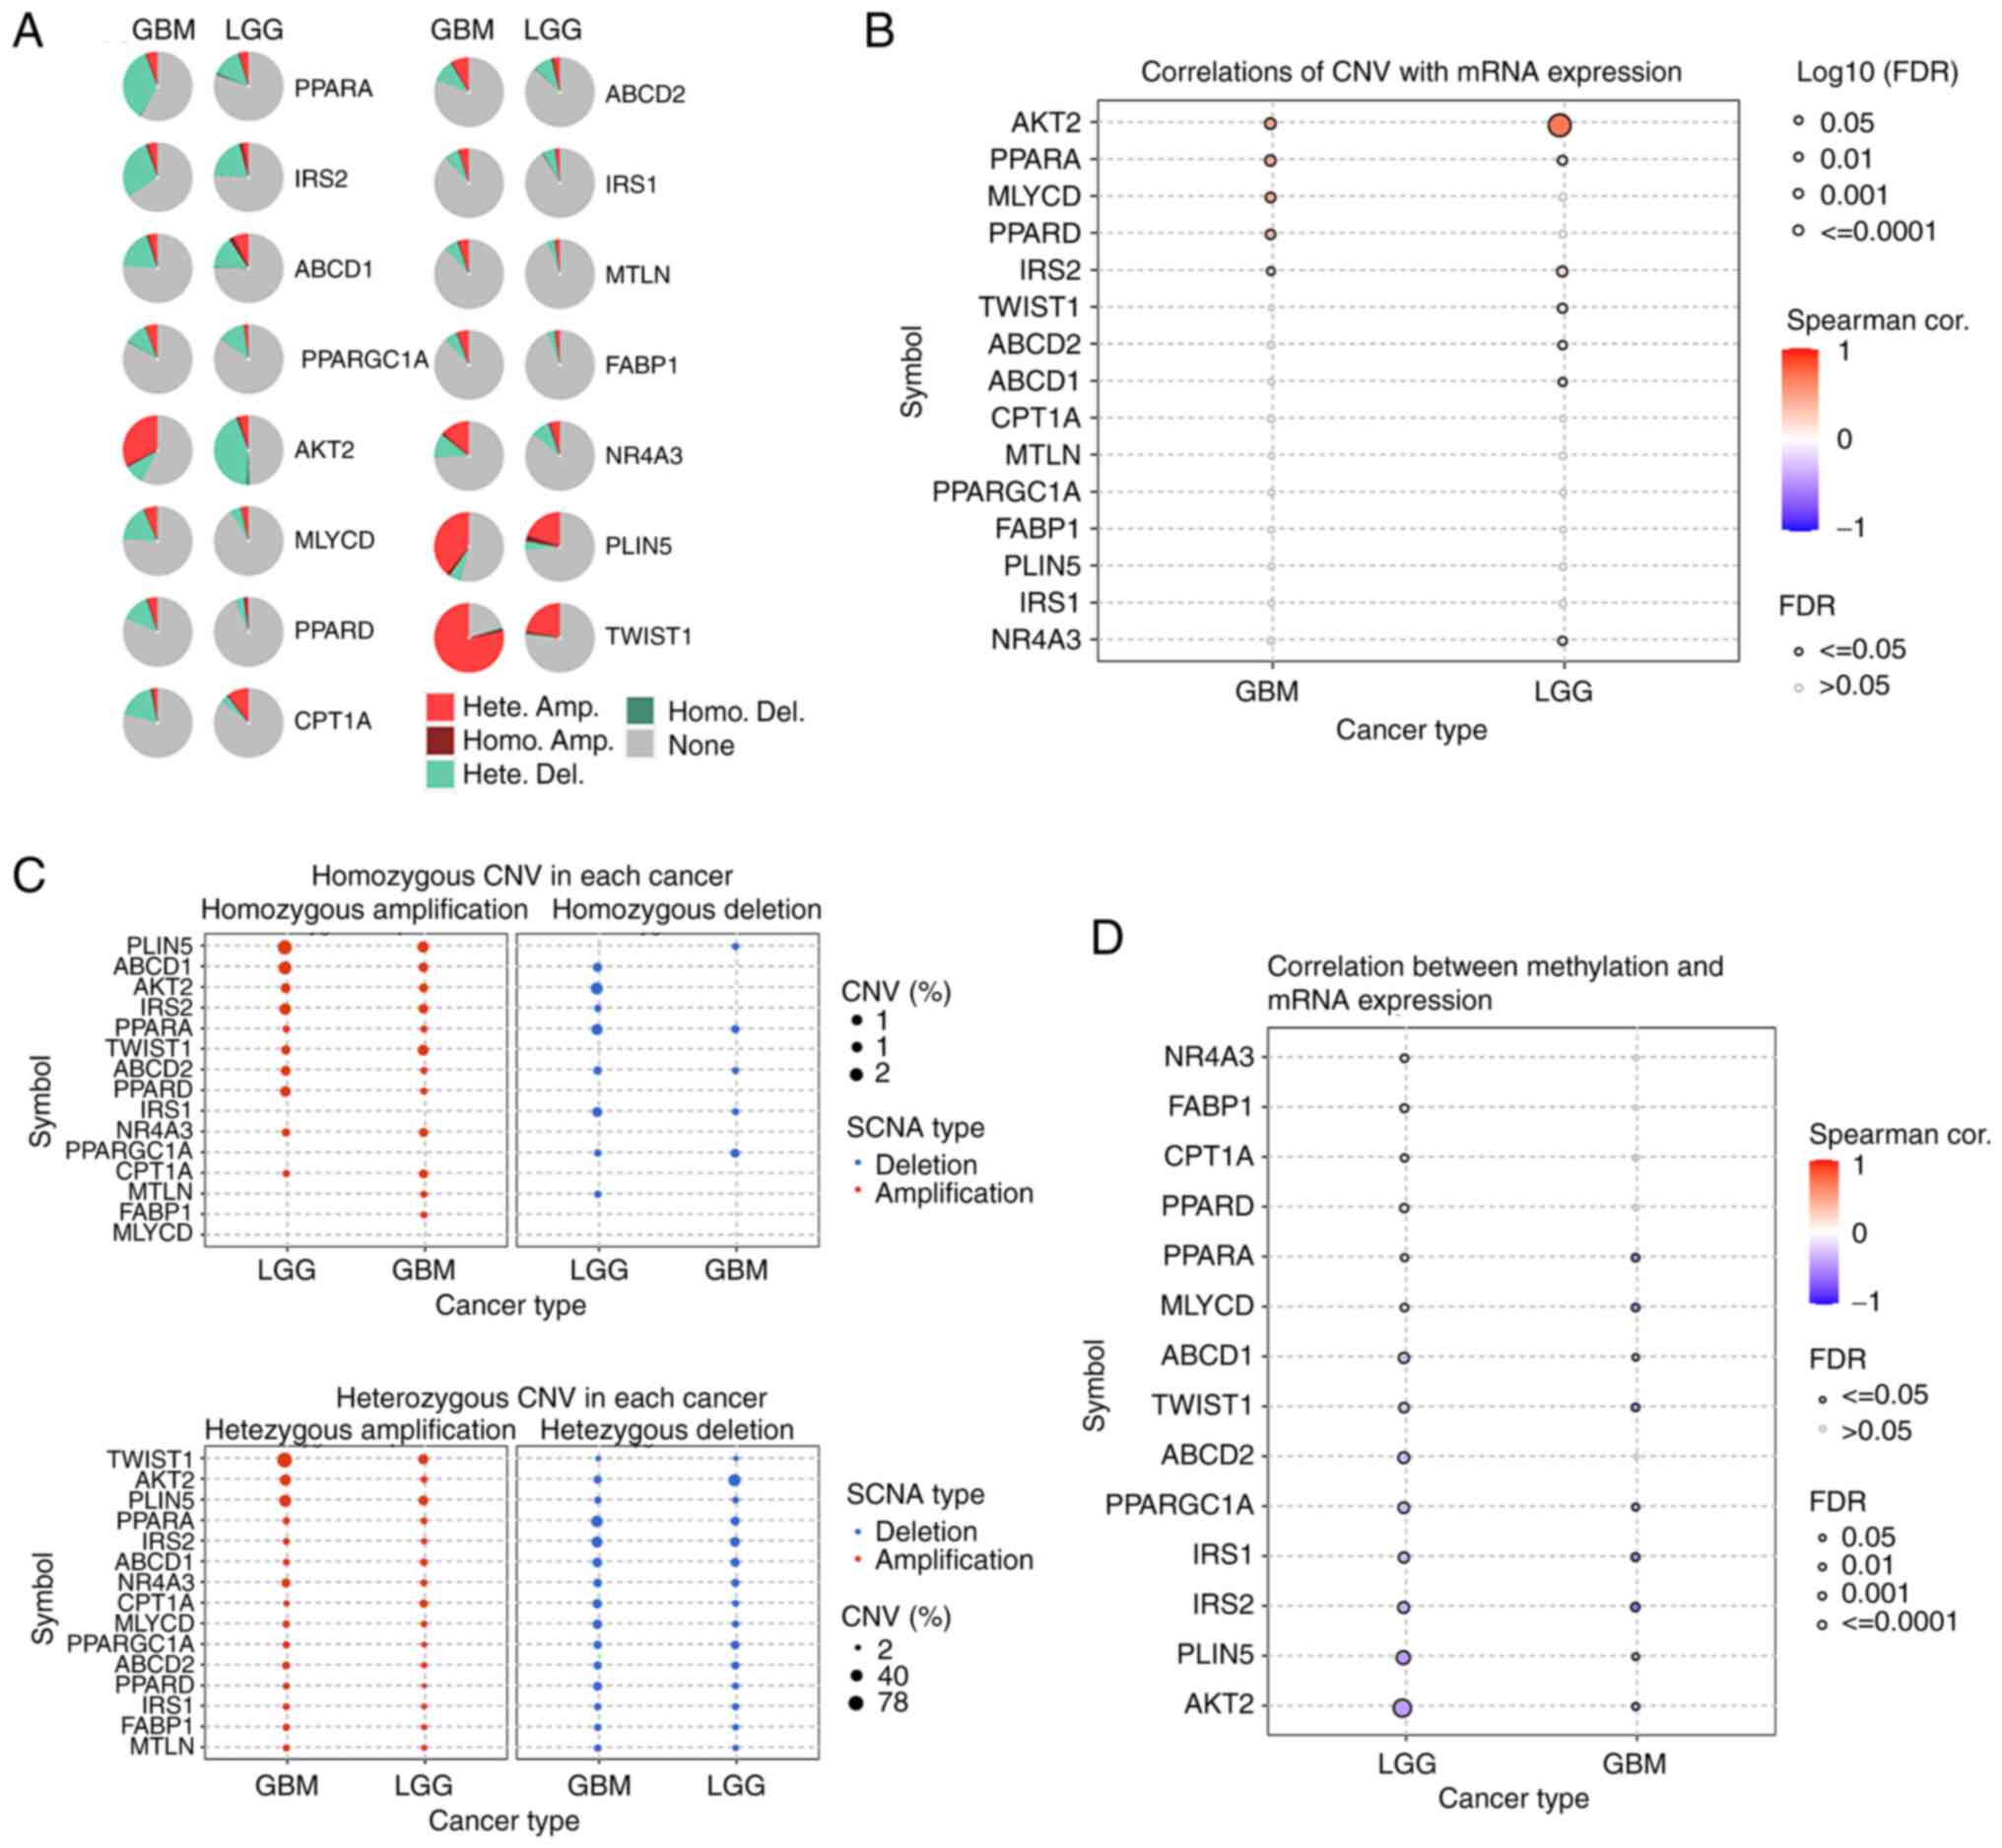 | Figure 2.CNV data of FAO-related genes in the
glioma cohort from the GSCA database (http://bioinfo.life.hust.edu.cn/GSCA/#/). (A) Pie
plots summarizing the CNV of FAO-related genes in the glioma
cohort. (B) The correlation between CNV and mRNA expression of
FAO-related genes in the glioma cohort. (C) The homozygous and
heterozygous CNV profiles of FAO-related genes in the glioma
cohort. (D) The correlation between methylation and mRNA expression
of FAO-related genes in the glioma cohort. CNV, copy number
variation; LGG, low grade glioma; GBM, glioblastoma; FAO, fatty
acid oxidation; cor., correlation; Hete., heterozygous; Homo.,
homozygous; SCNA, somatic copy number; FDR, false discovery rate;
PPARGC1A, PPARG coactivator 1 α; CPT1A, carnitine
palmitoyltransferase 1A; MTLN, mitoregulin; AKT2, AKT
serine/threonine kinase 2; ABCD1, ATP binding cassette subfamily D
member 1; FABP1, fatty acid binding protein 1; ABCD2, ATP binding
cassette subfamily D member 2; MLYCD, malonyl-CoA decarboxylase;
IRS1, insulin receptor substrate 1; PLIN5, perilipin 5; PPARA,
peroxisome proliferator activated receptor α; PPARD, peroxisome
proliferator activated receptor δ; TWIST1, twist family bHLH
transcription factor 1; NR4A3, nuclear receptor subfamily 4 group A
member 3; IRS2, insulin receptor substrate 2. |
Identification of FAO-related genes
clusters in glioma
After performing PCA analysis and visualization, a
total of 15,803 genes and 1,363 samples were obtained from LGG and
GBM in the TGGA and CCGA cohorts (Fig.
3A). Following survival analysis, the KM survival curves
demonstrated that the expression of 11 genes was significantly
correlated with prognosis (P<0.05; Fig. 3C). Of the 11 genes, high expression
of 8 genes was associated with a poor prognosis, and high
expression of 3 genes was associated with a good prognosis.
Additionally, through network analysis, the complete genetic
landscape was visualized, including the regulatory relationship
between genes and their prognostic implications in patients with
glioma (Fig. 3B).
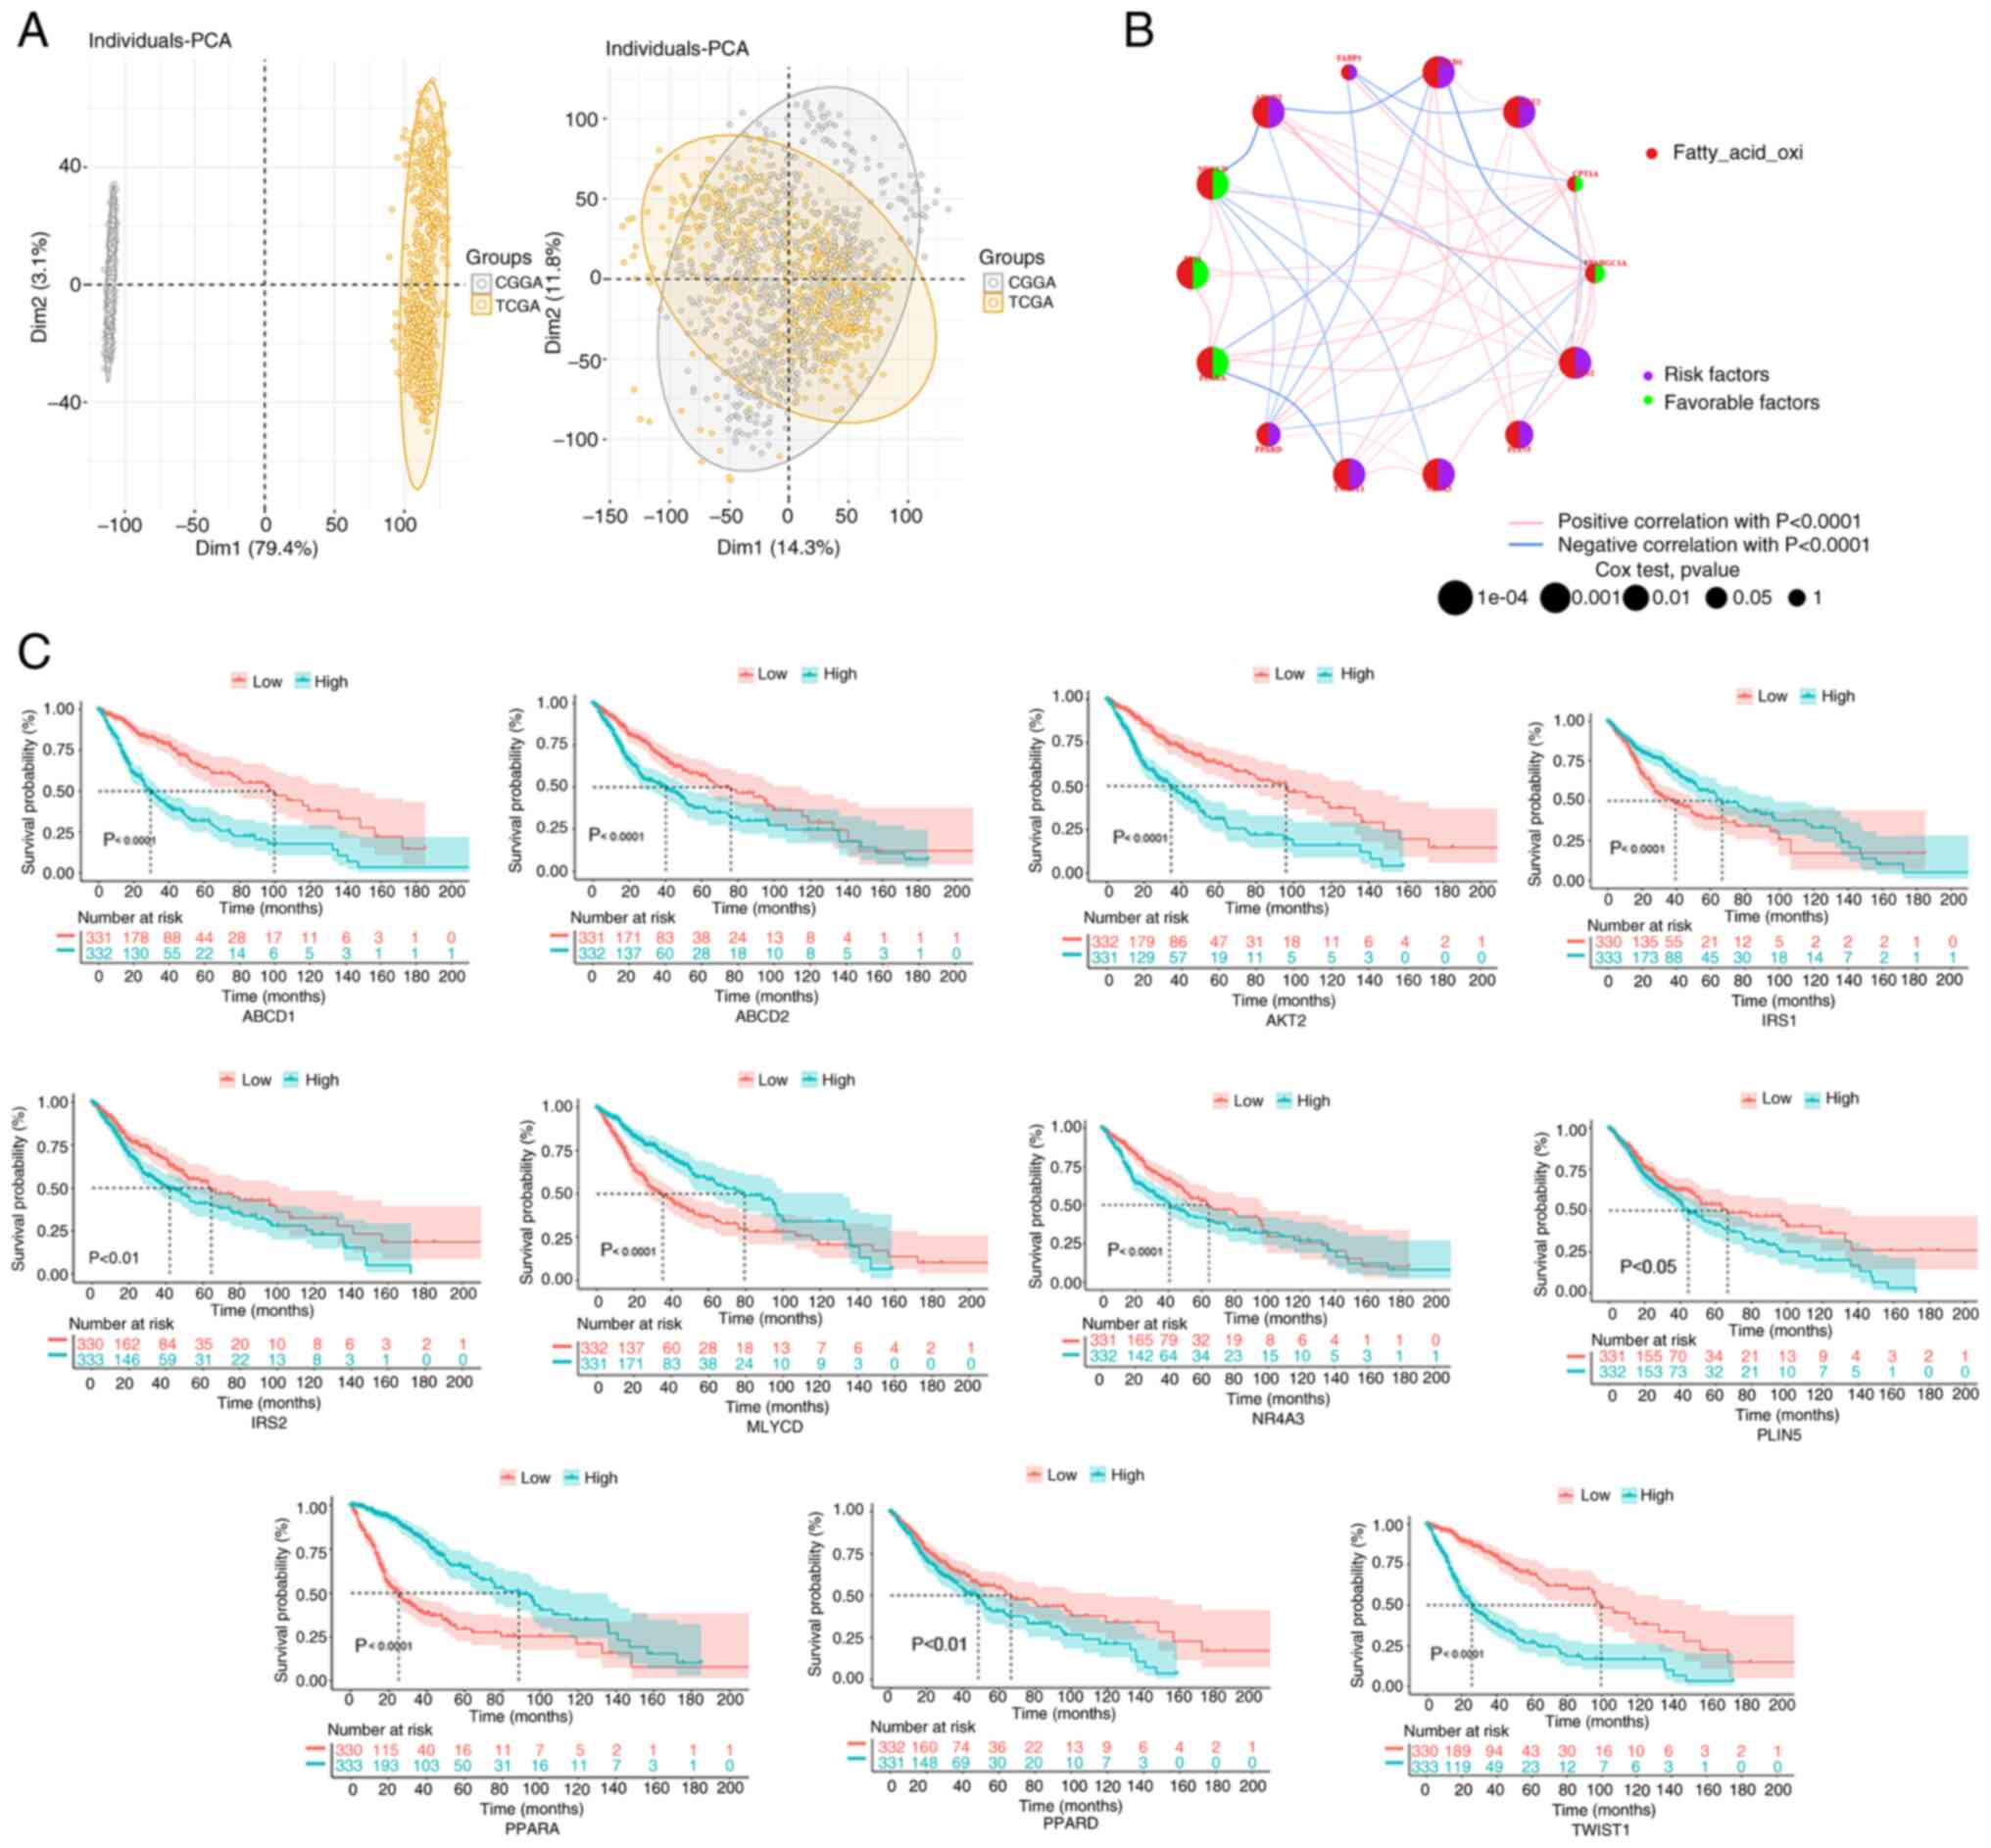 | Figure 3.FAO-related gene correlation and
prognostic analysis in the glioma cohort. (A) In the PCA, samples
from TCGA and CGGA databases were classified. (B) To predict the
relationship between FAO-related genes and glioma prognosis, the
‘survival’ and ‘survminer’ packages were used to perform the
log-rank test and Cox regression analysis. The circle size
indicates the P-value, and the lines linking the FAO-related genes
indicate their interactions. Circles in purple indicate prognostic
risk factors and green circles represent prognostic protective
factors. (C) Kaplan-Meier survival curves were used to observe the
relationship between FAO-related genes and survival in the
integrated samples. CGGA, Chinese Glioma Genome Atlas; FAO, fatty
acid oxidation; PCA, principal component analysis; TCGA, The Cancer
Genome Atlas; PPARGC1A, PPARG coactivator 1 α; CPT1A, carnitine
palmitoyltransferase 1A; AKT2, AKT serine/threonine kinase 2;
ABCD1, ATP binding cassette subfamily D member 1; FABP1, fatty acid
binding protein 1; ABCD2, ATP binding cassette subfamily D member
2; MLYCD, malonyl-CoA decarboxylase; IRS1, insulin receptor
substrate 1; PLIN5, perilipin 5; PPARA, peroxisome proliferator
activated receptor α; PPARD, peroxisome proliferator activated
receptor δ; TWIST1, twist family bHLH transcription factor 1;
NR4A3, nuclear receptor subfamily 4 group A member 3; IRS2, insulin
receptor substrate 2. |
An unsupervised cluster analysis identified three
optimal clusters (k=3), based on the relative change in the area
under the cumulative distribution function curve (Fig. 4A). KM curves indicated a poor
prognosis for patients in cluster B compared with the other two
clusters (P<0.001; Fig. 4B).
Notably, certain genes displayed different expression levels within
different clusters, which suggested that they may have prognostic
significance within the specific cluster (Fig. 4C). Moreover, comparing the
clinicopathological features of the different glioma clusters
revealed significant differences in the expression of FAO-related
genes and clinicopathological features. Cluster B displayed higher
World Health Organization grades (III–IV; P<0.01) and an older
age (P<0.01) compared with the other two clusters (Fig. 4D).
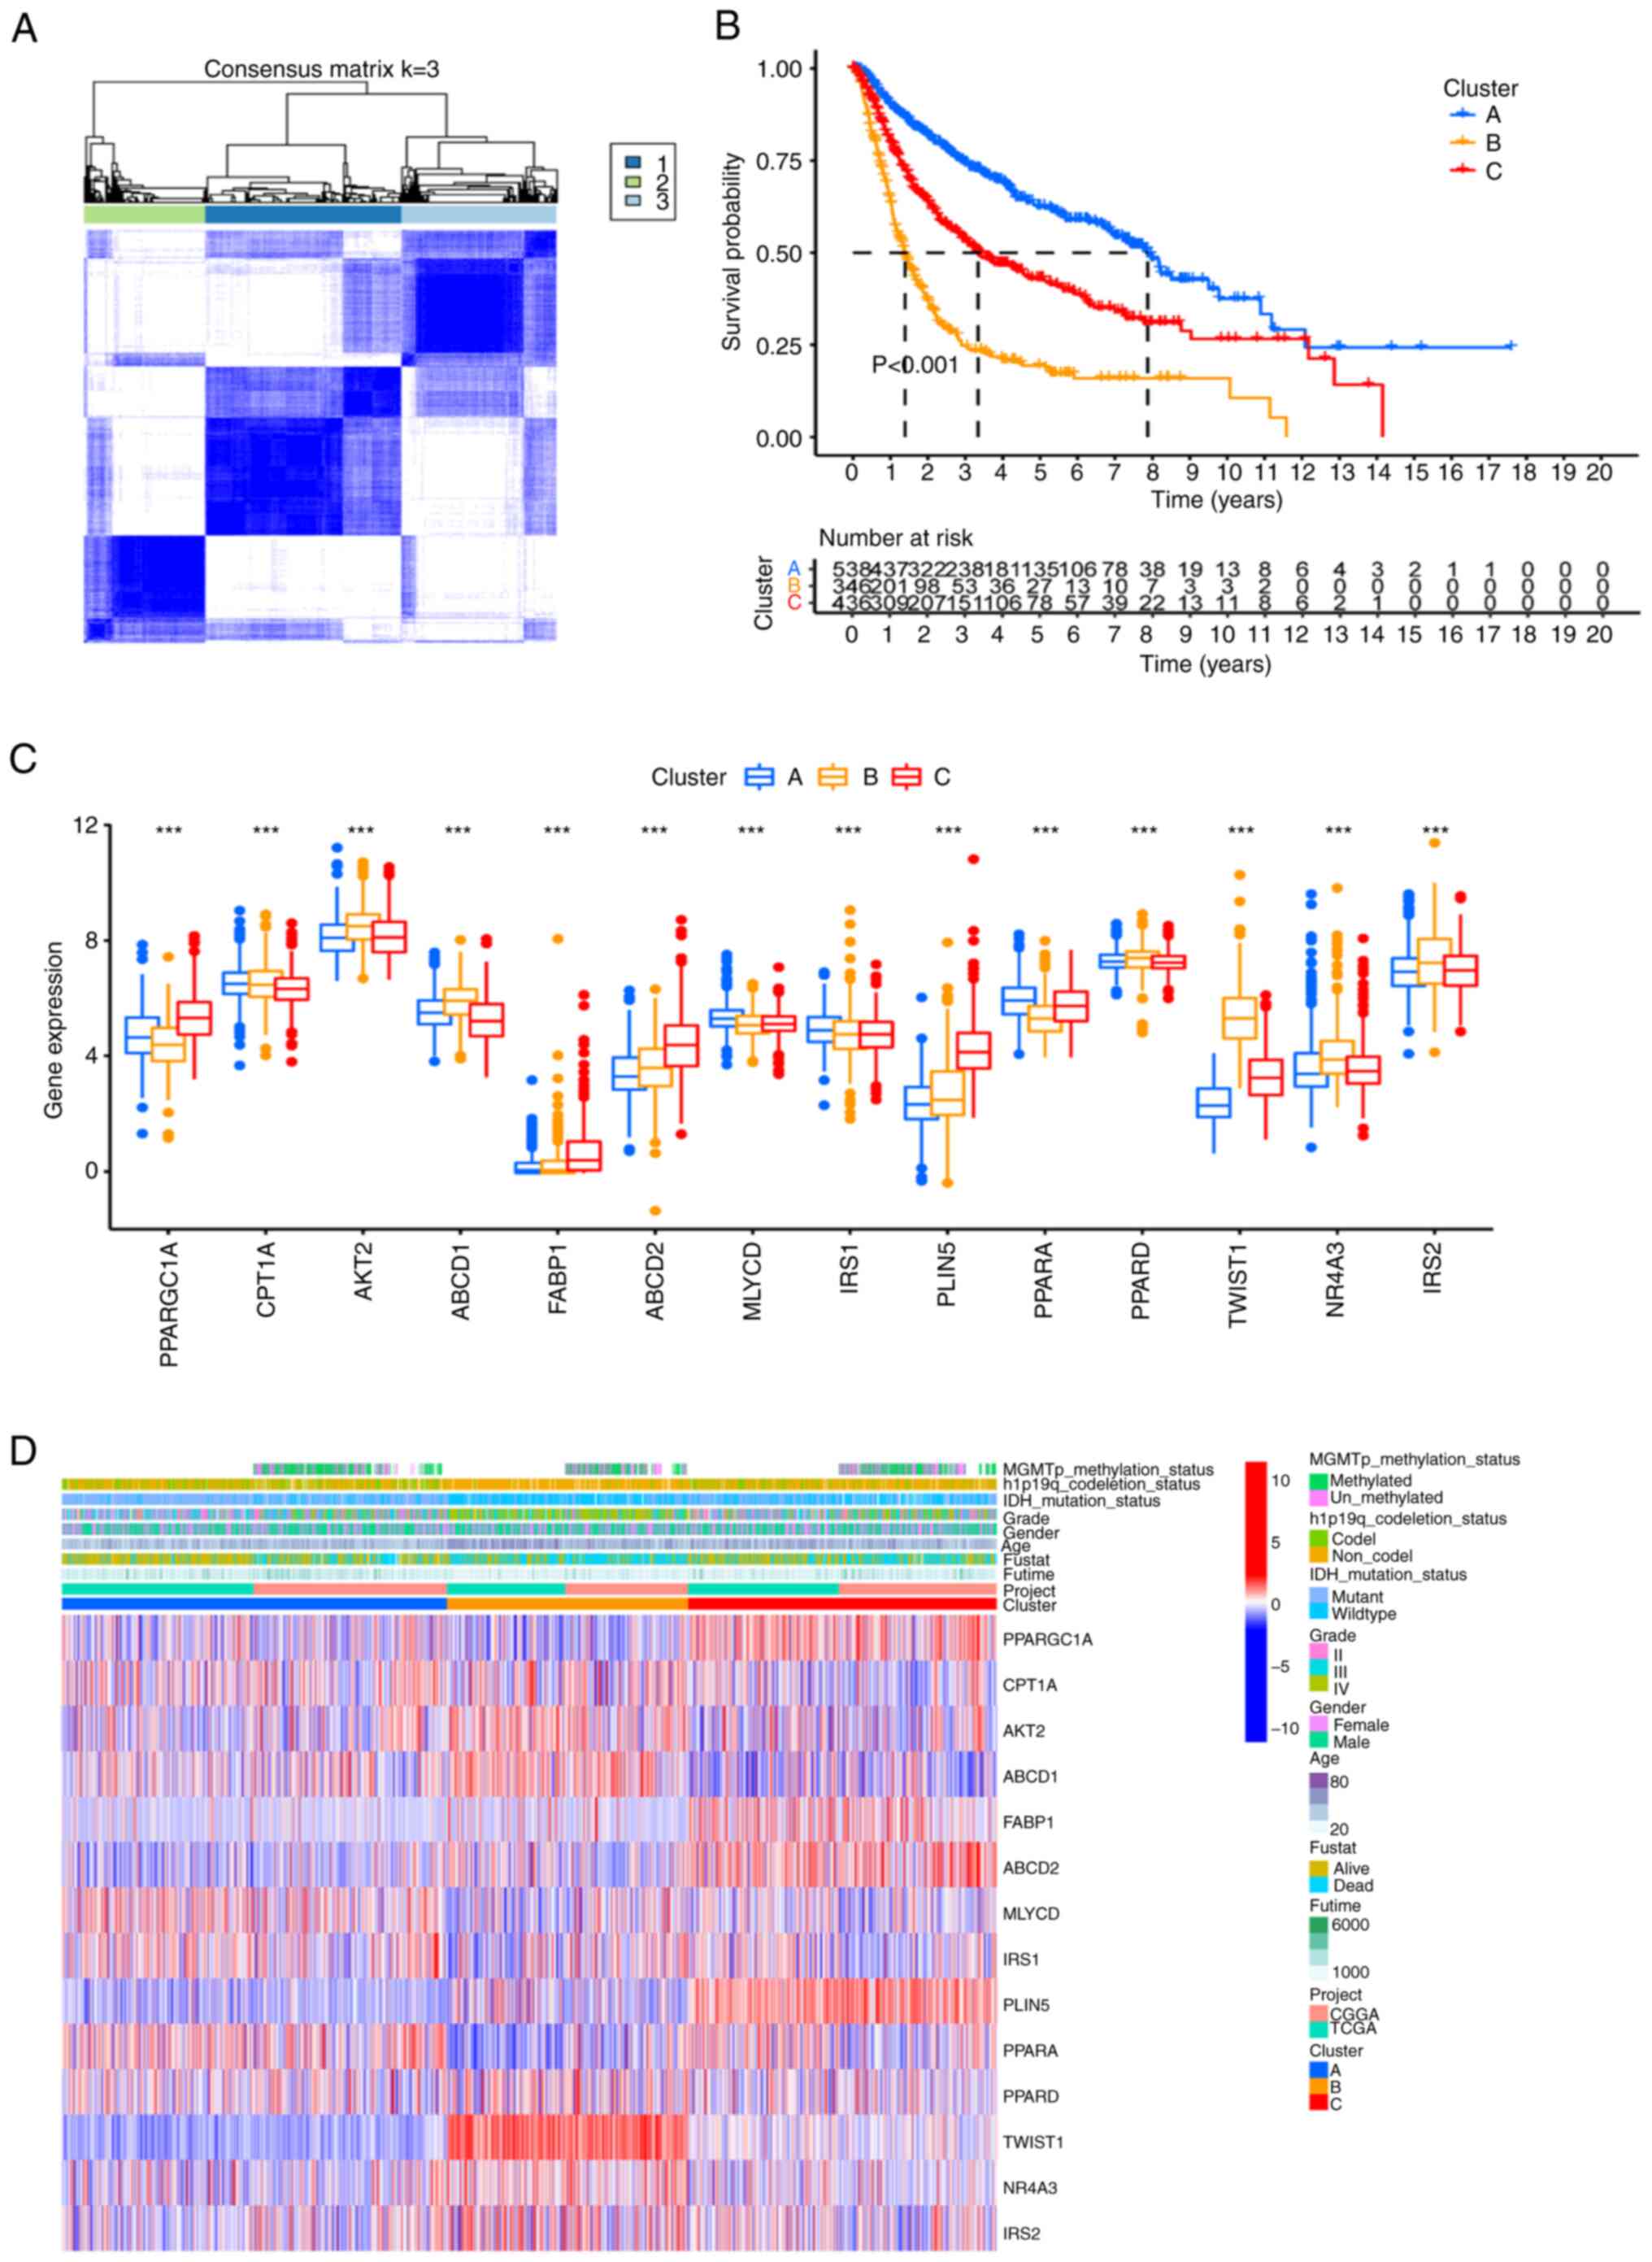 | Figure 4.Unsupervised clustering based on the
FAO-related gene signature. (A) The samples were clustered into
different subgroups by unsupervised clustering. The most suitable
value of k is k=3. (B) Prognostic Kaplan-Meier curves for the 3
clusters. (C) Differential expression of FAO-related genes among
the 3 clusters. (D) Heat map of the clinicopathological
characteristics and gene phenotypes in the 3 clusters.
***P<0.001. CGGA, Chinese Glioma Genome Atlas; FAO, fatty acid
oxidation; TCGA, The Cancer Genome Atlas; PPARGC1A, PPARG
coactivator 1 α; CPT1A, carnitine palmitoyltransferase 1A; AKT2,
AKT serine/threonine kinase 2; ABCD1, ATP binding cassette
subfamily D member 1; FABP1, fatty acid binding protein 1; ABCD2,
ATP binding cassette subfamily D member 2; MLYCD, malonyl-CoA
decarboxylase; IRS1, insulin receptor substrate 1; PLIN5, perilipin
5; PPARA, peroxisome proliferator activated receptor α; PPARD,
peroxisome proliferator activated receptor δ; TWIST1, twist family
bHLH transcription factor 1; NR4A3, nuclear receptor subfamily 4
group A member 3; IRS2, insulin receptor substrate 2. |
To further explore the differences between clusters,
HALLMARK, KEGG and Reactome pathway data were downloaded from the
MsigDB database, revealing significant variations in multiple
pathways among pairwise contrasted clusters, such as the p53
signaling pathway, apoptosis pathway, notch signaling pathway and
cell cycle (Fig. S3).
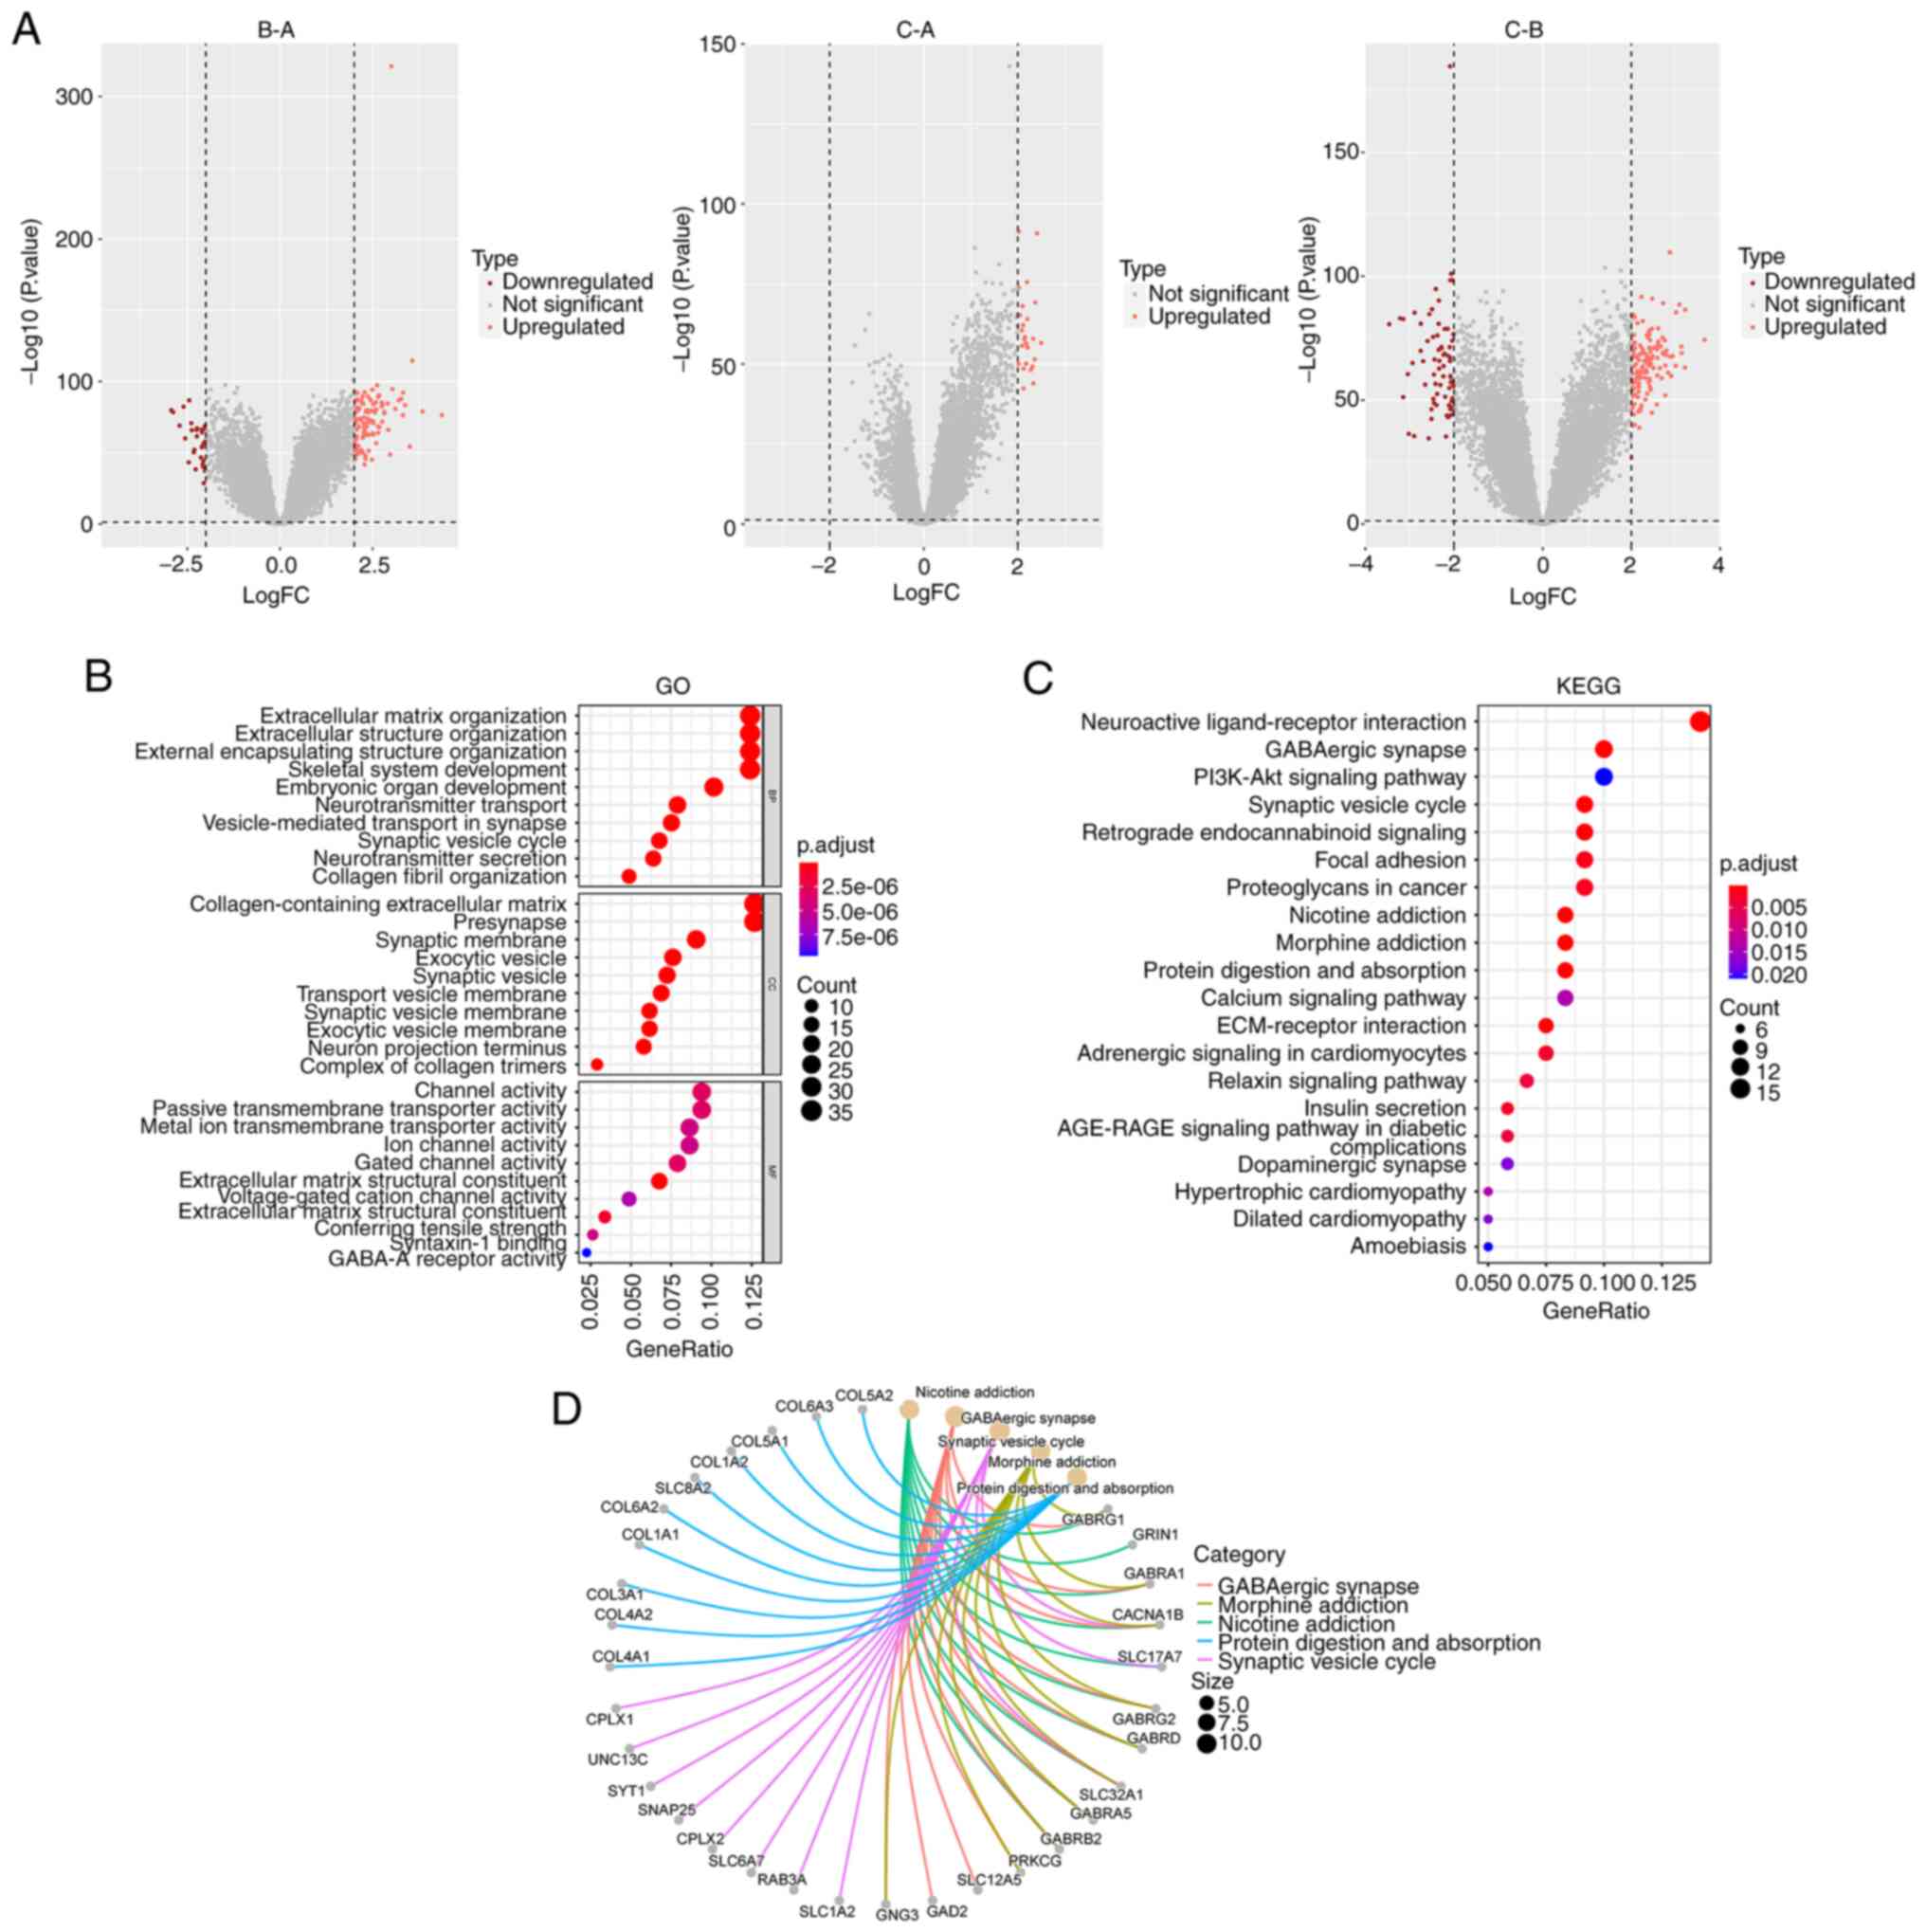
Screening DEGs based on the
FAO-related genes clusters
Differential analyses were employed to identify
three gene subtypes and the results were represented in a volcano
plot. By taking the intersection of the DEGs among the three
subtypes, 287 candidate DEGs were identified (Fig. 5A). GO and KEGG pathway analyses
revealed that the enriched pathways of the DEGs were primarily
associated with tumorigenesis and development (Fig. 5B and C). A visual network was
constructed to display the relationships between the top 5 DEGs and
the KEGG pathways (Fig. 5D).
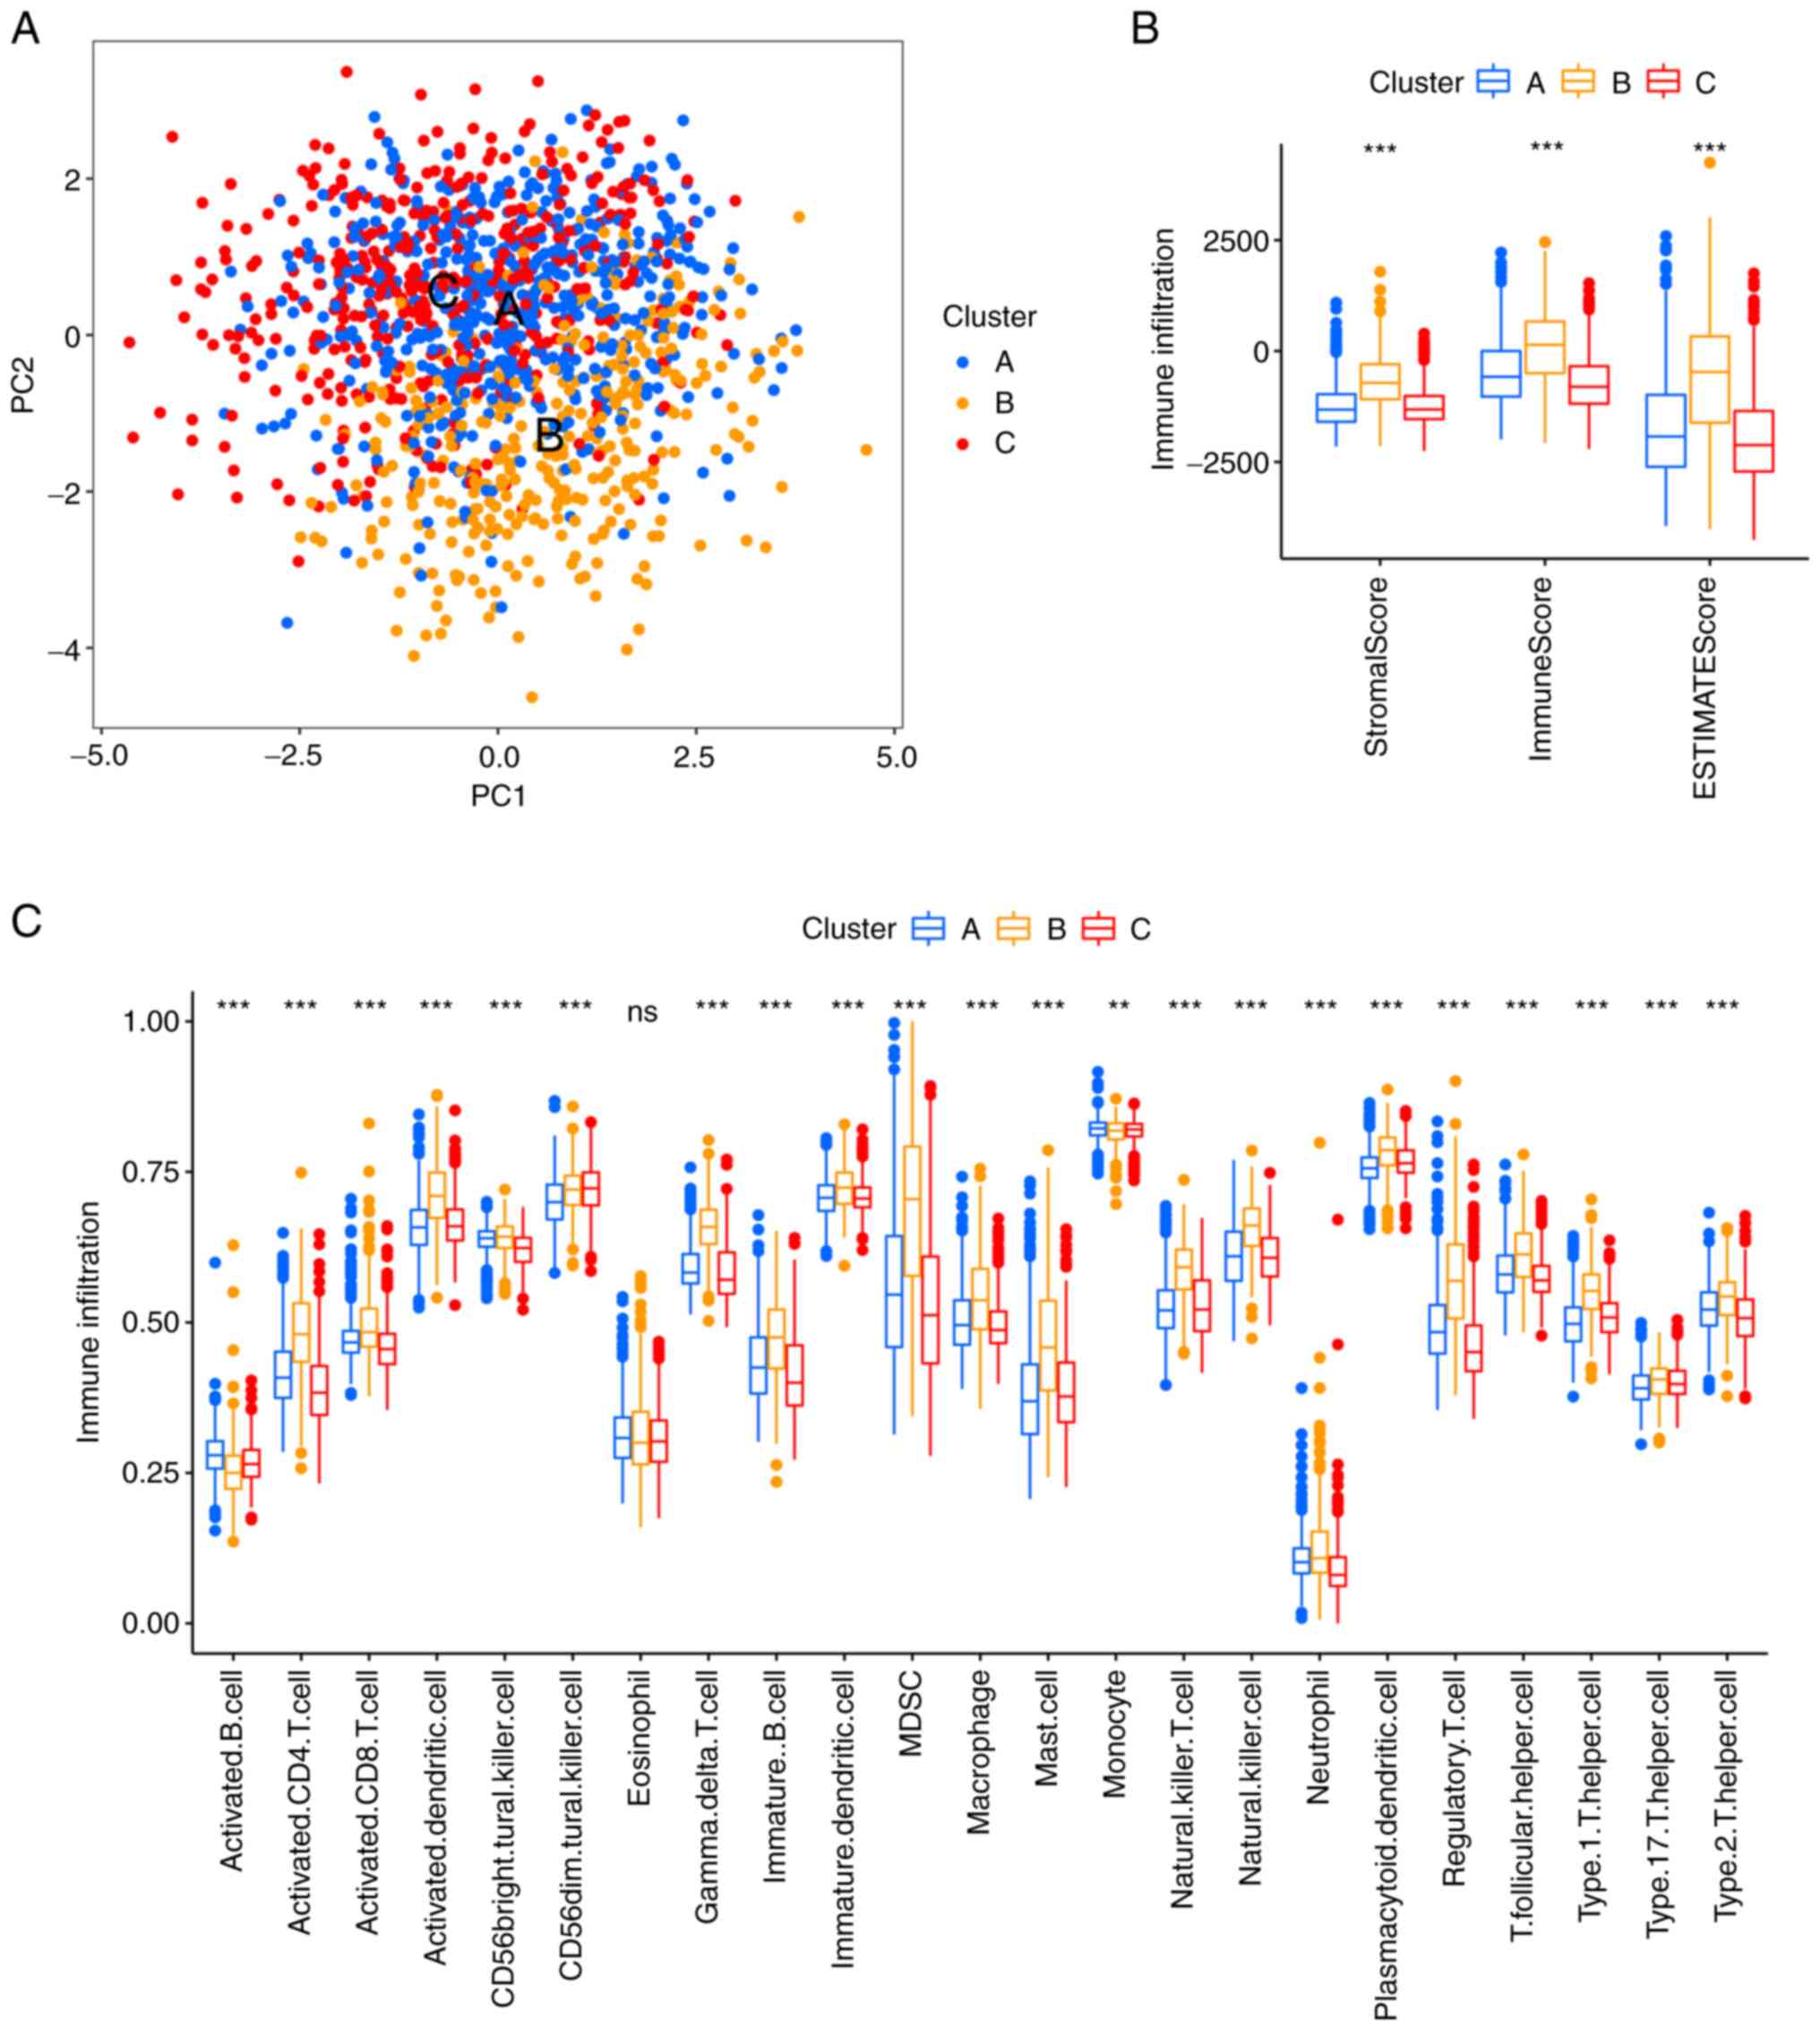
The subsequent PCA demonstrated significant
differences in transcriptional profiles between subtype B and the
other two subtypes (Fig. 6A). To
assess the TME score, which included the stromal, immune and
ESTIMATE scores, for the three gene subtypes, the ESTIMATE package
was utilized. A higher stromal or immune score indicated greater
proportions of stromal cells or immunocytes in the TME, while the
ESTIMATE score reflected the sum of these scores. The findings
indicated that patients with subtype B had higher TME scores
(Fig. 6B).
To compare immune cell infiltration across the
different gene subtypes, the ssGSEA function within the R package,
GSVA, was used. Notably, subtype B demonstrated higher immune
infiltration compared with the other subtypes, with a marked
increase in CD4+ T cells, CD8+ T cells, γδT
cells, mast cells, macrophages and regulatory T cells (P<0.01;
Fig. 6C).
Constructing gene subgroups based on
the DEGs
Since gene expression is controlled by a complex
regulatory network, the deep connections between genes were further
explored based on the screened DEGs. Single-factor regression
analysis was conducted using the identified 287 DEGs, which were
sorted by P-value, and the top 50 DEGs with the smallest P-values
were screened (Fig. S4). These
DEGs were subsequently divided into two subgroups based on
unsupervised clustering analysis (Fig.
7A). To compare the survival time of the patients in the two
groups, the ‘survival’ and ‘survminer’ packages in R were utilized.
The analysis demonstrated that the survival rate of patients in
subgroup A was significantly higher than that in subgroup B
(P<0.01; Fig. 7B).
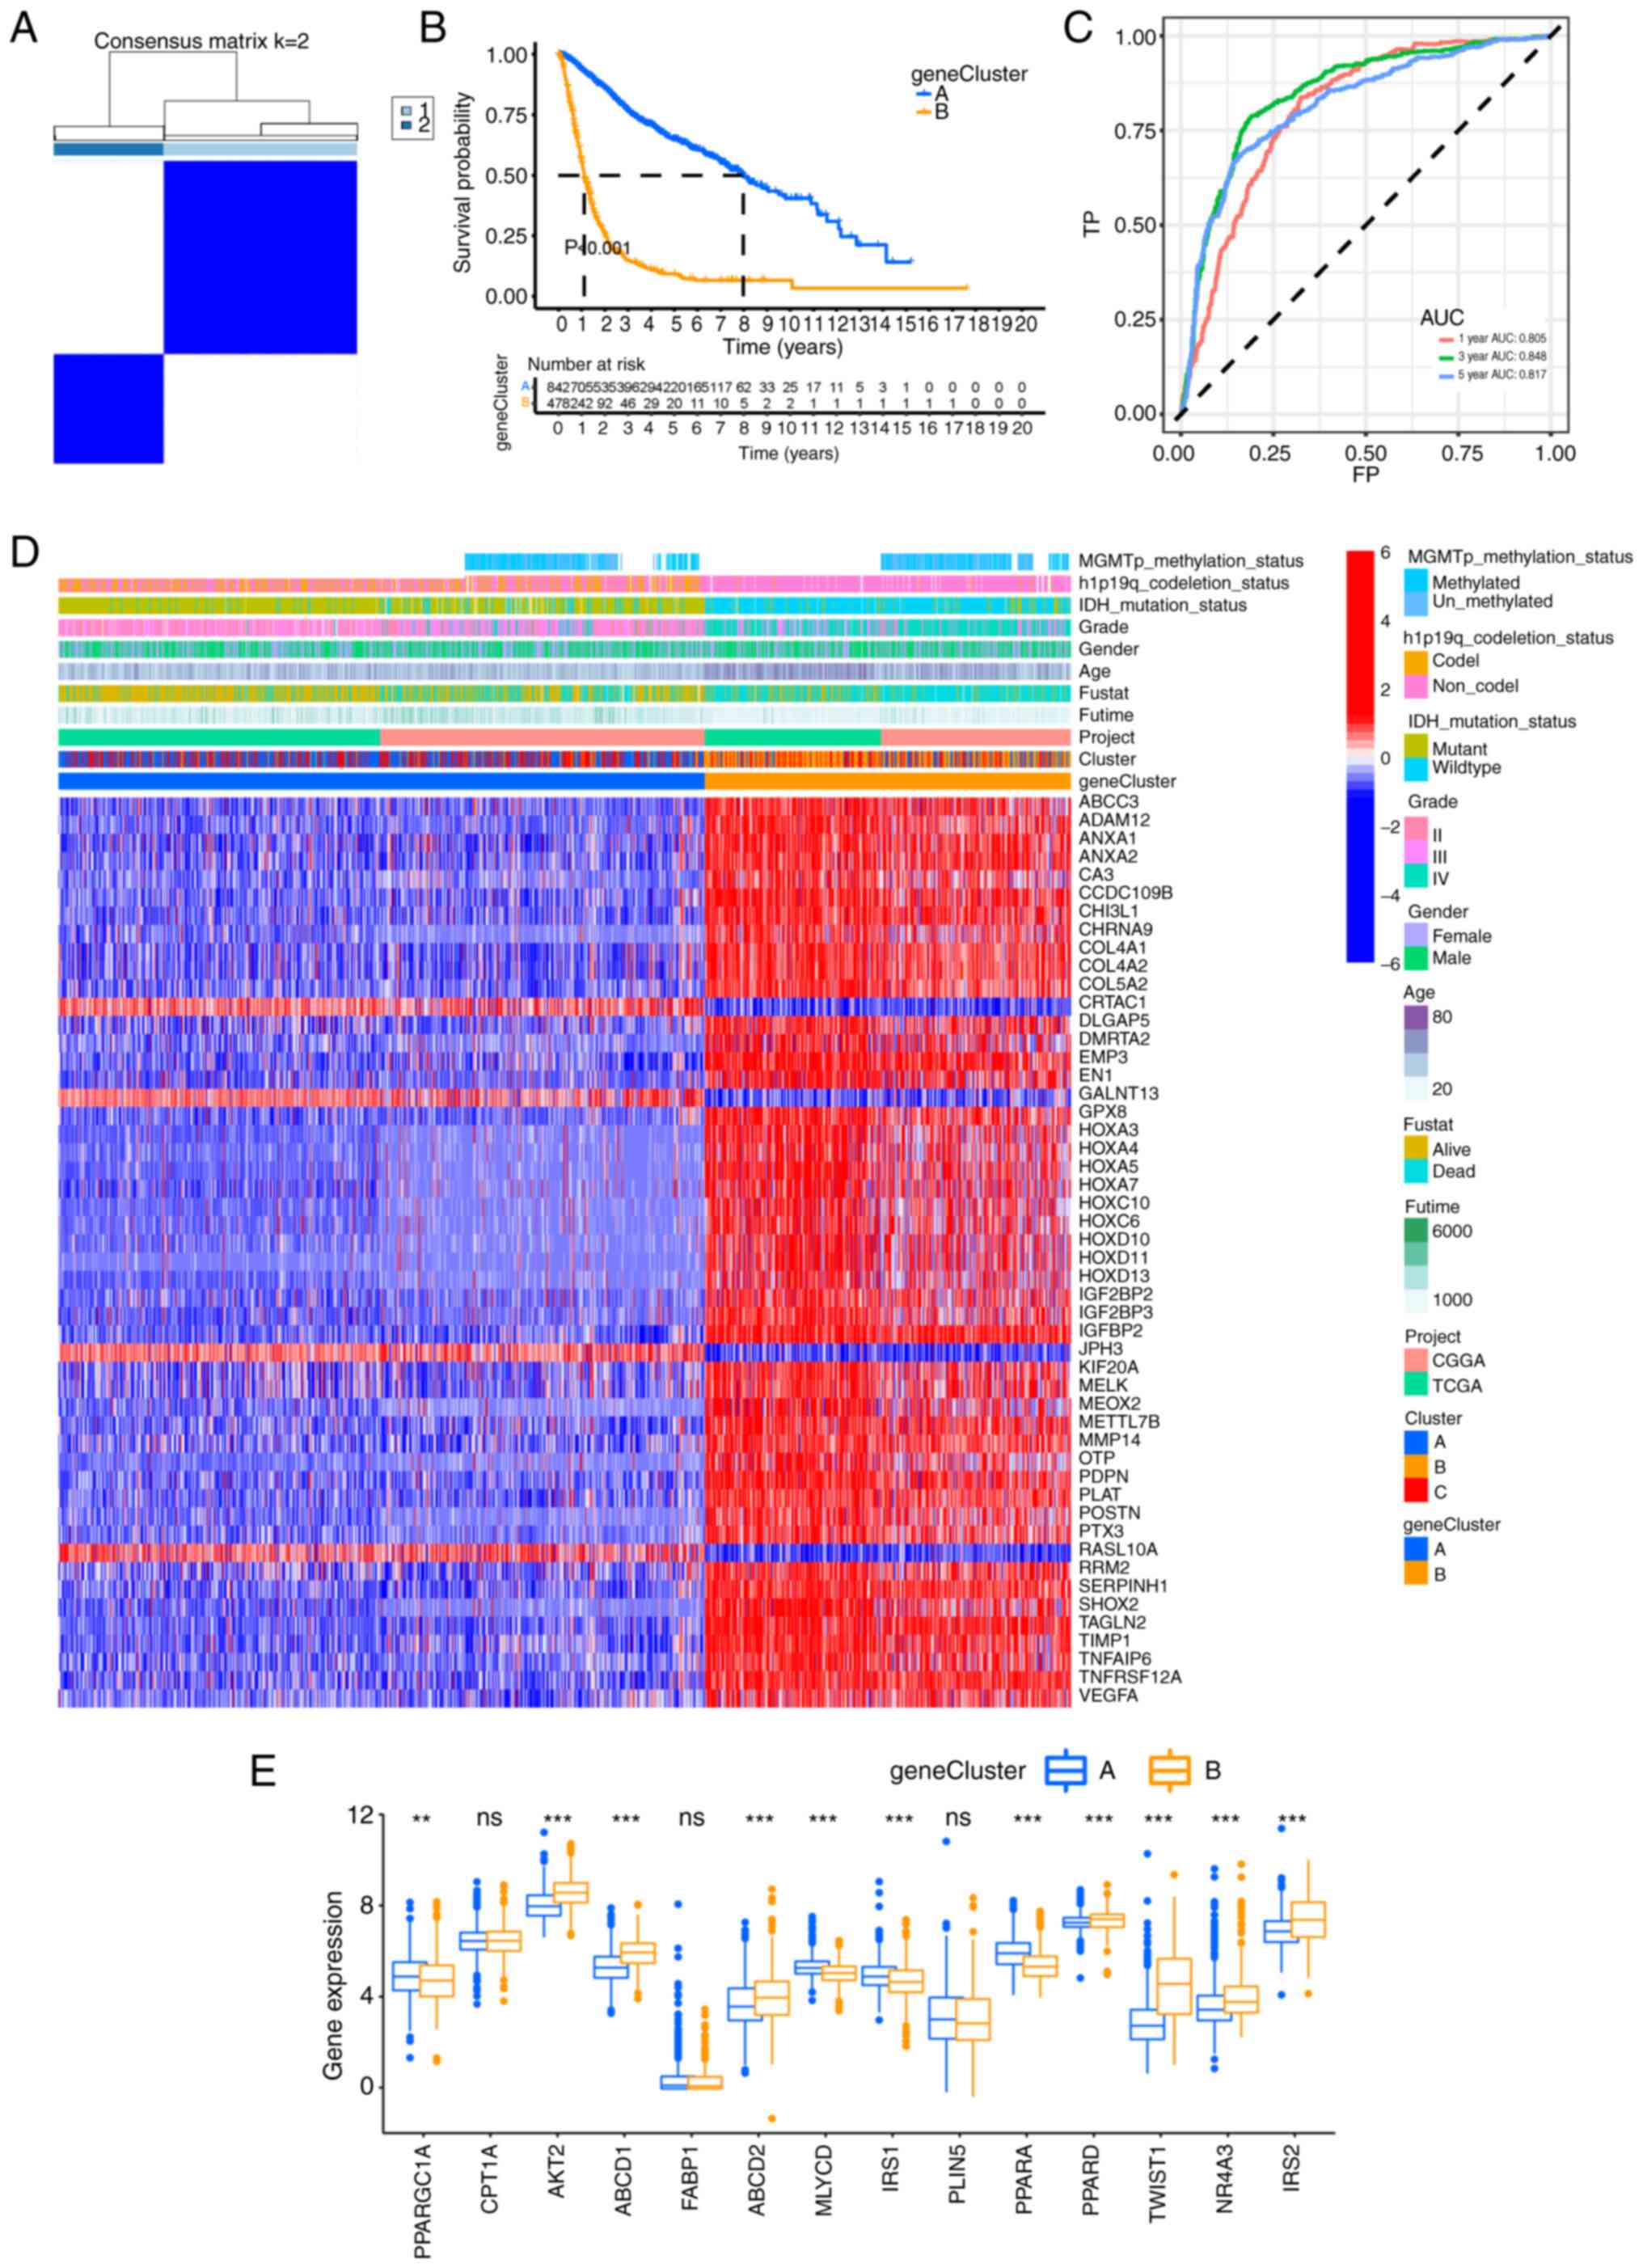 | Figure 7.Consensus clustering and risk scoring
model construction for the top 50 DEGs. (A) Clustering of the top
50 DEGs. The optimal number of clusters was k=2. (B) Kaplan-Meier
survival curve of the gene subtypes based on the top 50 DEGs. (C)
Receiver operating characteristic curve of the risk score model.
(D) Heat map illustrating the differences in the DEG expression
profiles and the clinicopathological characteristics between two
gene subtypes in the glioma cohort. (E) Differential expression of
fatty acid oxidation-related genes between the two gene subtypes.
**P<0.01; ***P<0.001. AUC, area under the curve; CGGA,
Chinese Glioma Genome Atlas; DEGs, differentially expressed genes;
ns, not significant; TCGA, The Cancer Genome Atlas; PPARGC1A, PPARG
coactivator 1α; CPT1A, carnitine palmitoyltransferase 1A; AKT2, AKT
serine/threonine kinase 2; ABCD1, ATP binding cassette subfamily D
member 1; FABP1, fatty acid binding protein 1; ABCD2, ATP binding
cassette subfamily D member 2; MLYCD, malonyl-CoA decarboxylase;
IRS1, insulin receptor substrate 1; PLIN5, perilipin 5; PPARA,
peroxisome proliferator activated receptor α; PPARD, peroxisome
proliferator activated receptor δ; TWIST1, twist family bHLH
transcription factor 1; NR4A3, nuclear receptor subfamily 4 group A
member 3; IRS2, insulin receptor substrate 2. |
The distribution and clinicopathological
characteristics of the DEGs in the two subgroups were visualized
using a heat map, which also revealed differences between the two
subgroups. Subgroup B was associated with a higher tumor grade and
a greater number of patients with isocitrate dehydrogenase
(NADP+) (IDH1) wild-type (Fig. 7D). Notably, genes related to FAO
exhibited significant differences between the two subtypes
(Fig. 7E).
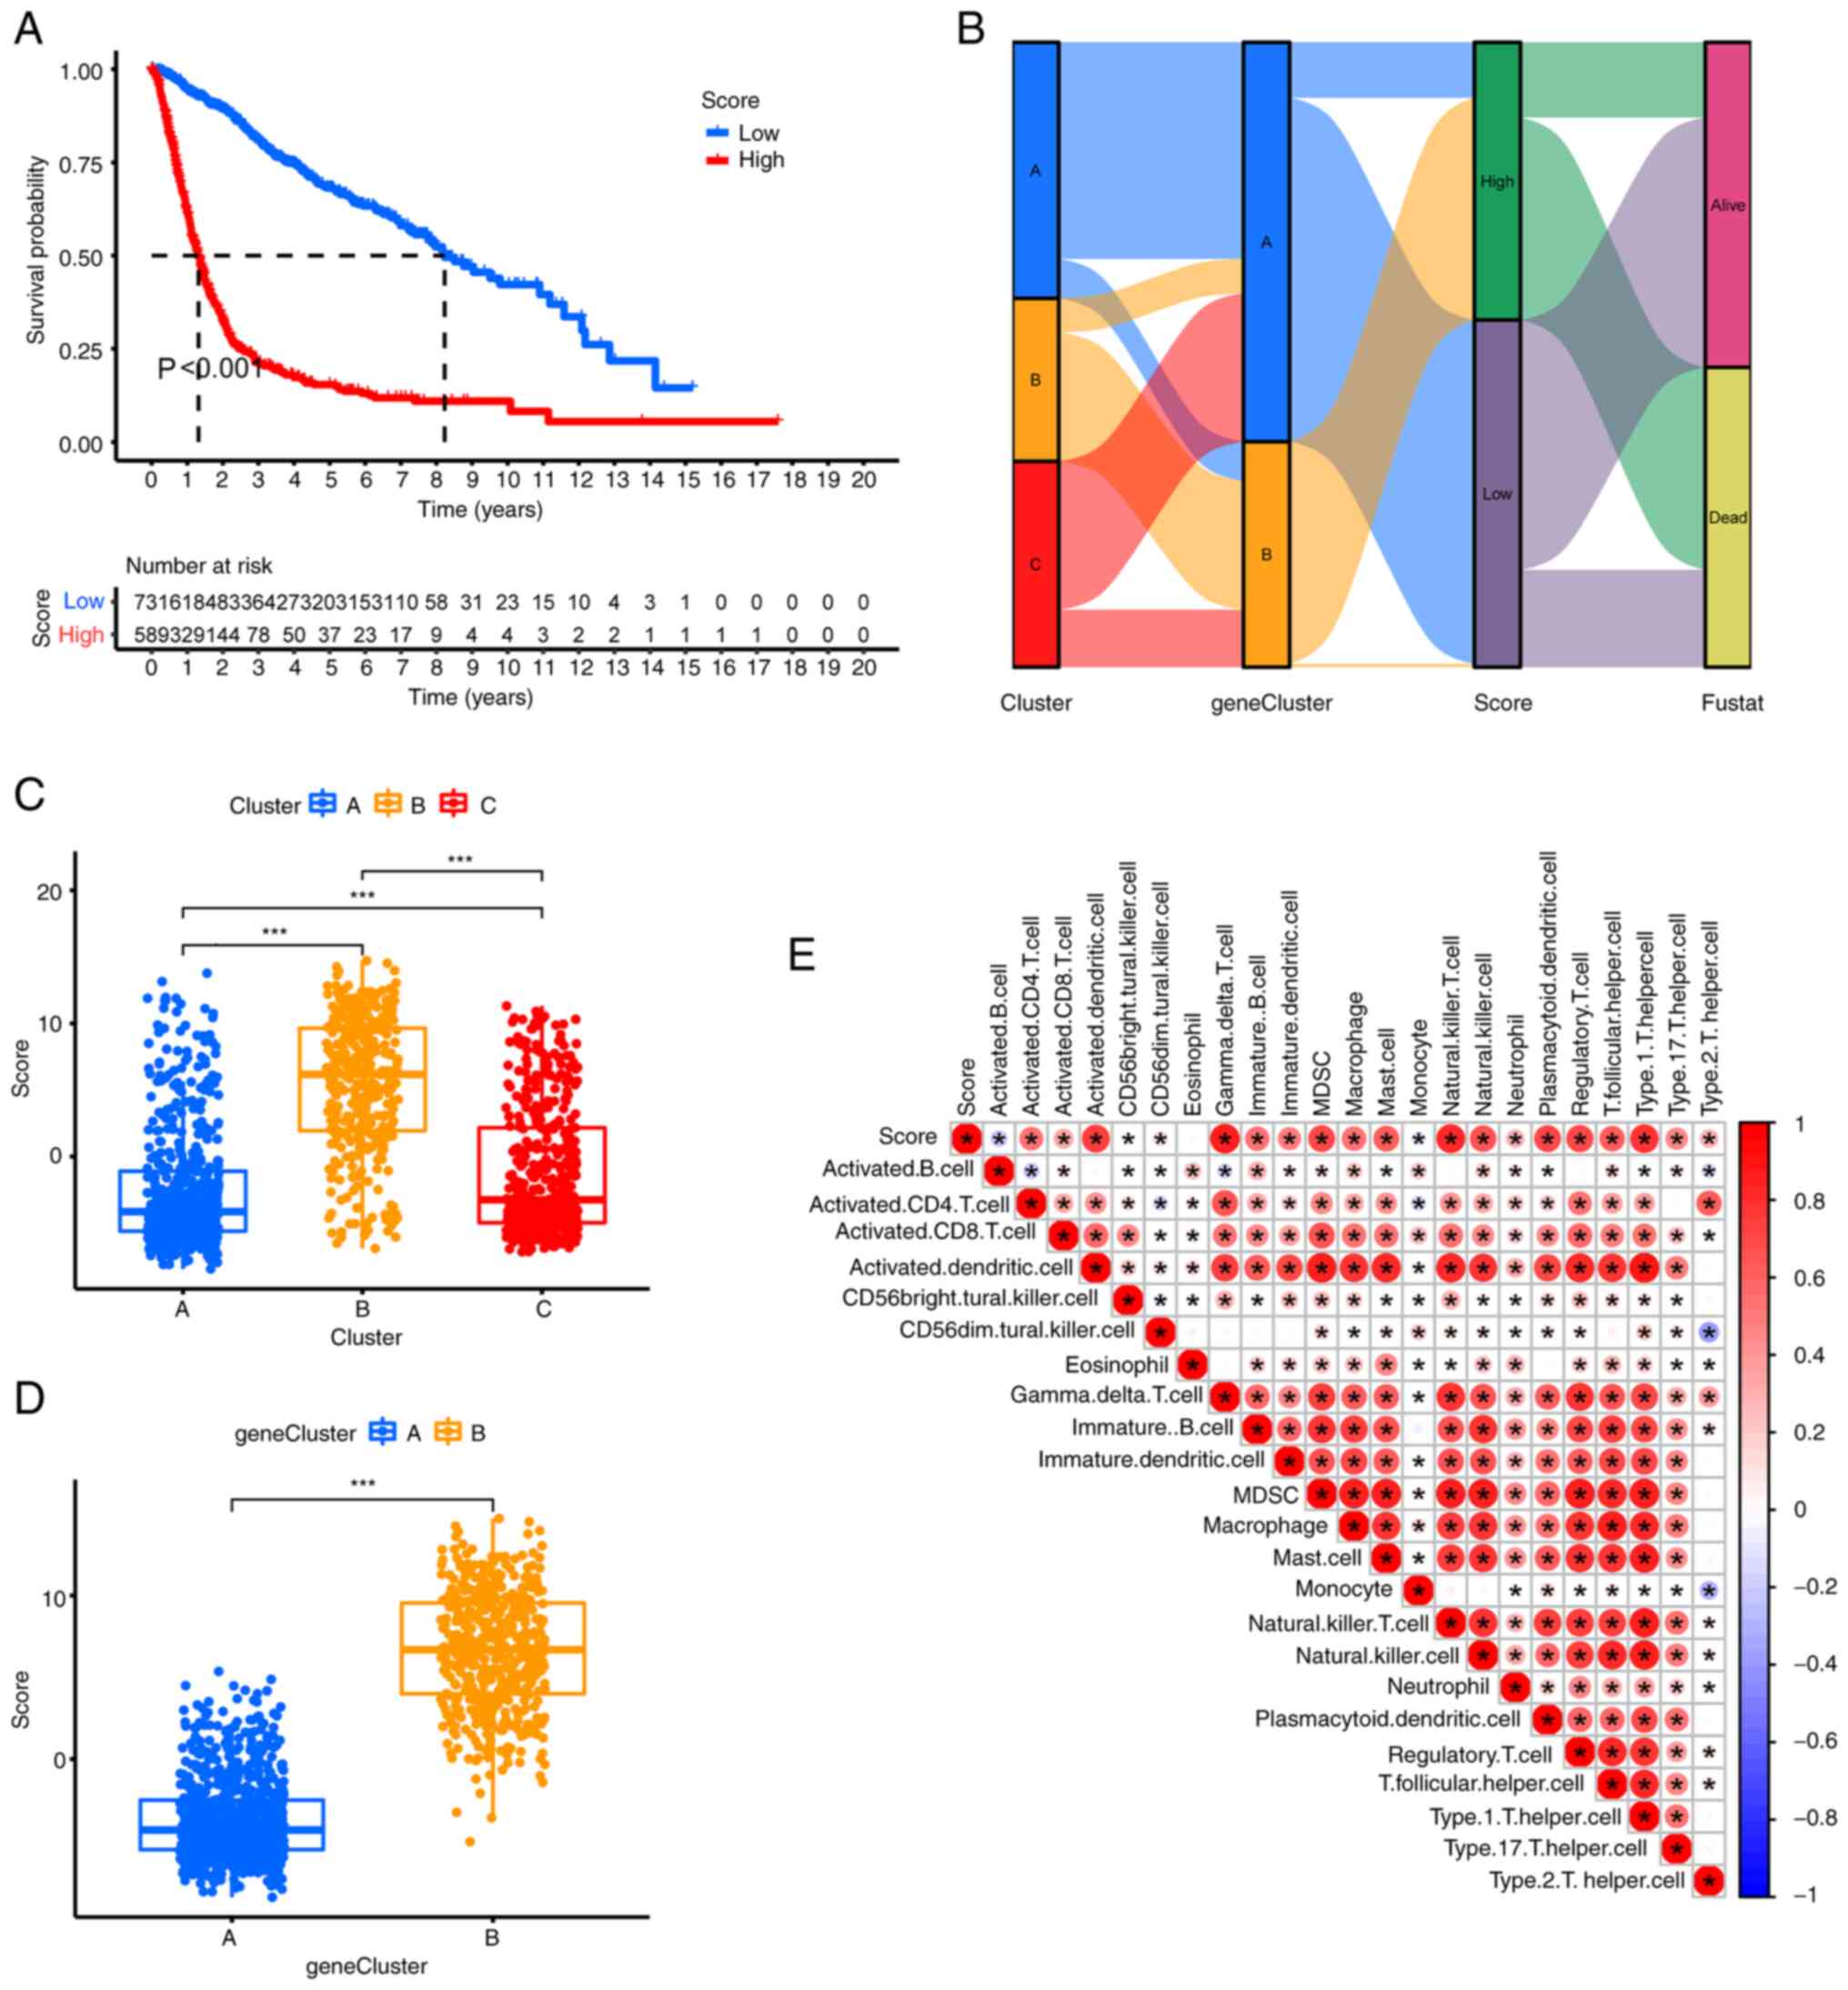
Construction of a score model based on
the PCA
The patients undergoing PCA analysis were divided
into the high score group (HSG) and the low score group (LSG) based
on the median value. The resultant KM curves indicated that the HSG
had a significantly lower survival rate compared with the LSG group
(P<0.01; Fig. 8A).
Time-dependent receiver operating characteristic curve analysis
revealed that the scoring model demonstrated good predictive
performance, with area under the curve values of 0.805, 0.848 and
0.817 for 1-, 3- and 5-years, respectively (Fig. 7C). The Sankey plot displayed the
distribution of patients in the three FAO-related gene clusters,
two gene subgroups and two score groups (Fig. 8B). Notable differences in the
distribution of scores among the different groups and gene
subgroups were found (Fig. 8C and
D). The score values were significantly and positively
correlated with immune cell infiltration, with a corresponding
distribution shown in Fig. 8E.
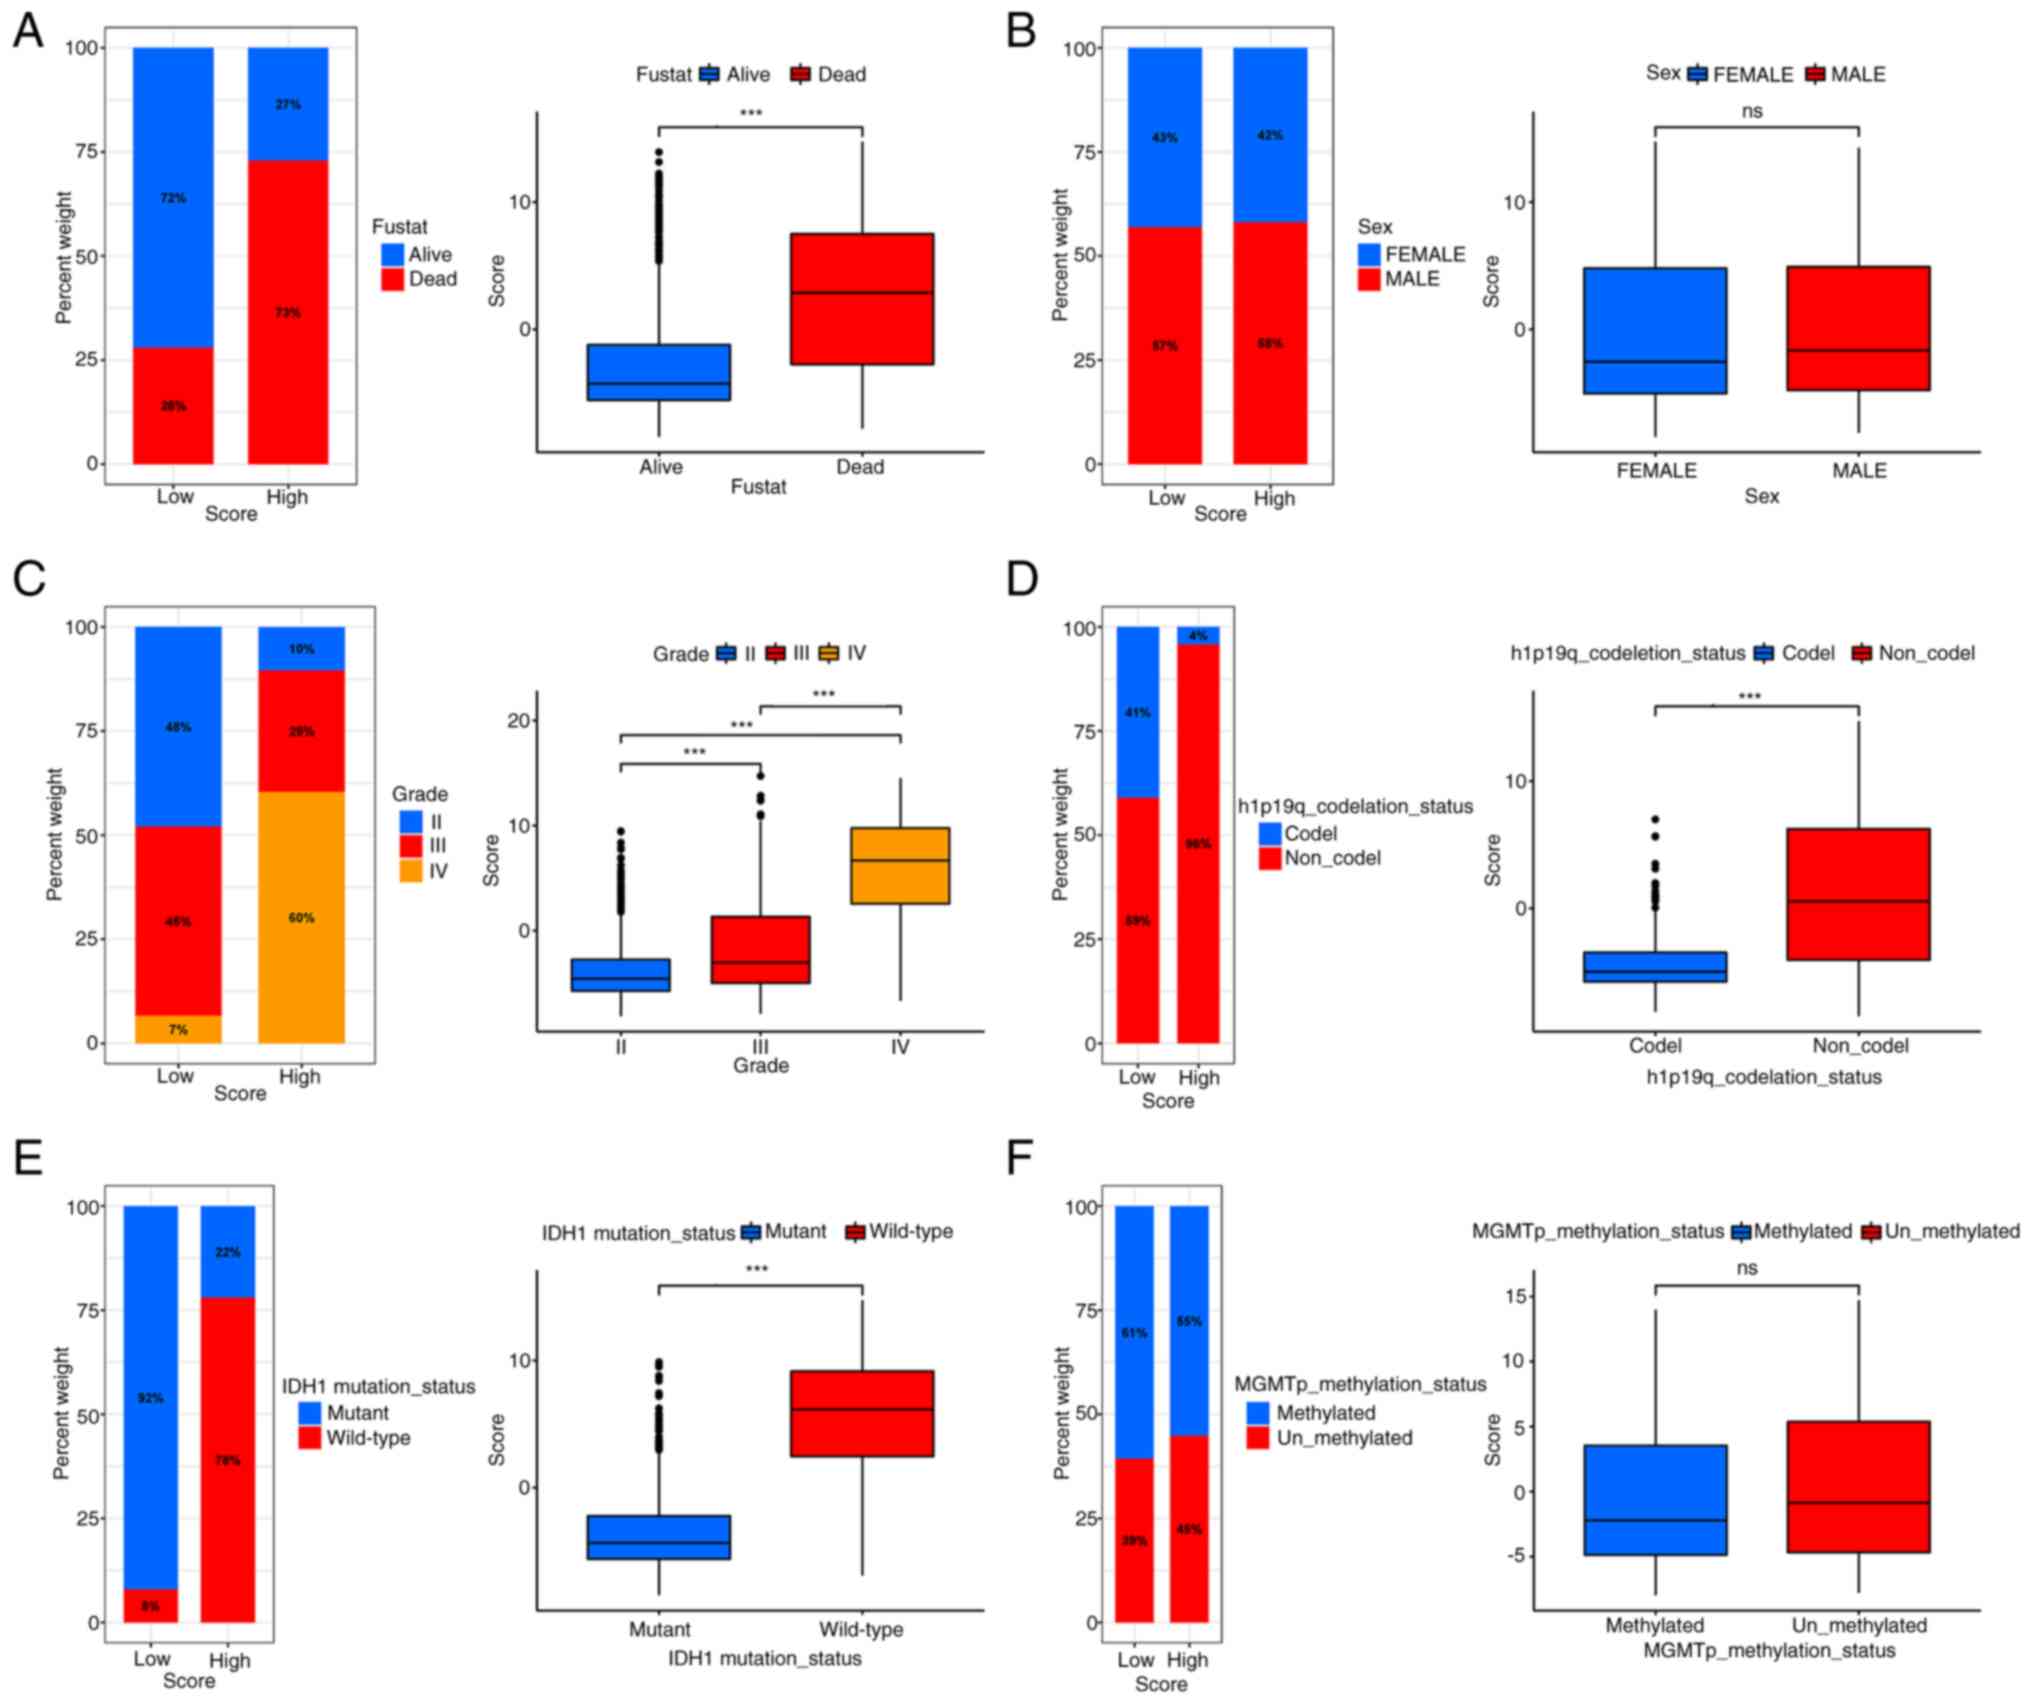
It was observed that the survival status was
diminished in the HSG, and that the HSG showed poor
characteristics, including higher grade, older age, IDH1
wild-type, 1p19q non-co-deletion and other poor prognostic factors
(Fig. 9A-F). These differences were
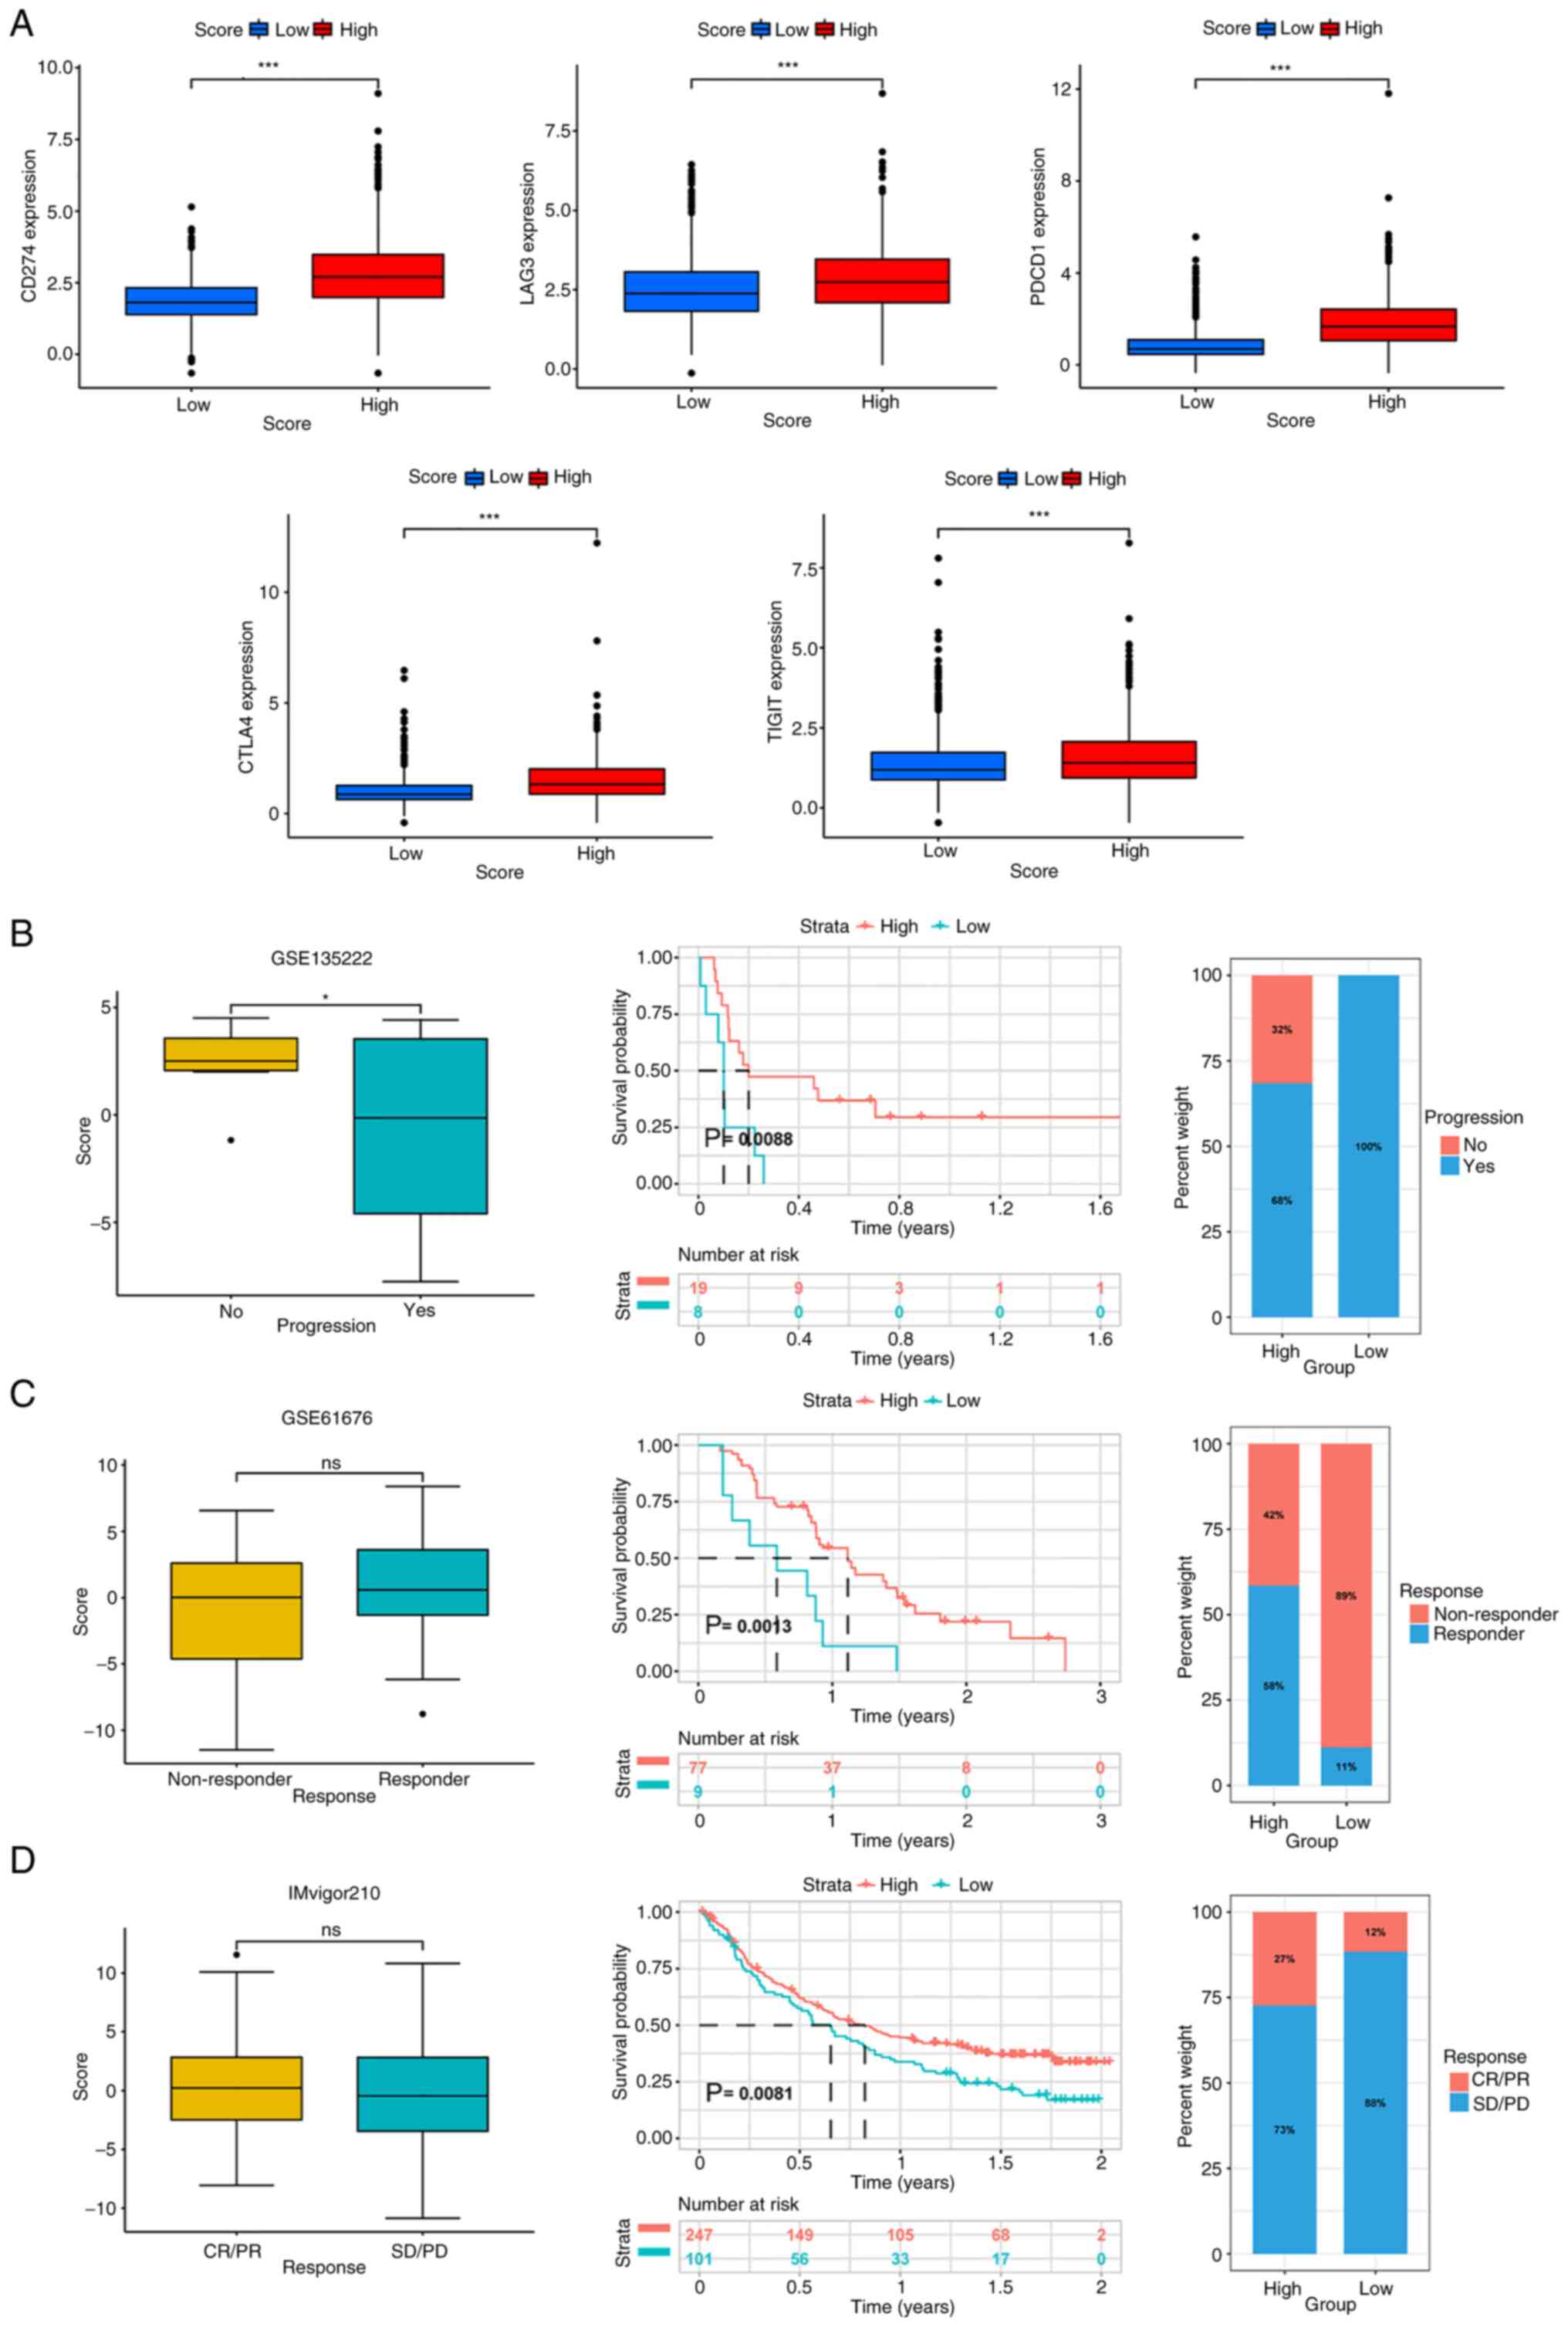
statistically significant (P<0.01). A total of five immune
checkpoints, including programmed cell death 1 ligand 1, Lymphocyte
activation gene 3 protein, programmed cell death protein 1,
cytotoxic T-lymphocyte protein 4 and T-cell immunoreceptor with Ig
and ITIM domains, were selected for analysis and it was found that
immune checkpoints were generally upregulated in the HSG (Fig. 10A). We hypothesize that the HSG has
enhanced sensitivity to immunotherapy and is more conducive to
treatment using immunosuppressants.
Assessing score model performance
using the validation sets
To evaluate the score model, it was verified using
external datasets, including GSE135222 (patients with advanced
non-small cell lung carcinoma) and GSE61676 (patients with
late-stage non-squamous non-small cell lung cancer), and the
IMvigor210CoreBiologies package. In the three validation datasets,
the KM curves showed that the survival rate of the HSG was better
than that of the LSG (P<0.01). In addition, in the GSE135222
dataset, the tumor progression rate of the HSG was lower
(P<0.05). In the GSE61676 dataset, the HSG seemed to have a
higher rate of immune therapy response. In the IMvigor210 dataset,
the rate of remission for tumor appeared to be higher in the HSG
(Fig. 10B-D). The aforementioned
results indicated that the score model could be applied to other
tumors and be beneficial for the immunosuppressive treatment of
glioma.
The differences in the effectiveness of various
immunosuppressants between the HSG and the LSG were analyzed by
comparing the IC50 values. The Wilcoxon rank-sum test
was employed to determine the statistical differences between the
two groups (Fig. S5).
Screening and experimental validation
of a key gene
The PPI network analysis revealed that TIMP1
is a key gene in glioma (Fig.
11A). Subsequent GEPIA analysis indicated a significant
upregulation of TIMP1 in high-grade glioma compared with
normal brain tissue (P<0.05; Fig.
11F), but no significant difference in low-grade glioma
compared with normal brain tissue. High TIMP1 expression was
associated with poor prognosis and increased risk of suboptimal
disease-free survival and overall survival rates in patients with
glioma (P<0.01; Fig. 11B).
Furthermore, results from the WB experiments corroborated this
finding, demonstrating high TIMP1 protein expression in all
high-grade glioma cell lines (A172, LN229 and SF539) and low
expression in low-grade glioma (HS683) and normal (HMC3) cell
lines, with statistically significant differences (Fig. 11D and E). Additionally,
immunohistochemical stained images from the HPA database revealed
positive staining for TIMP1 in the high-grade glioma tissue,
while low-grade glioma and normal human astrocyte tissues were
TIMP1− (Fig.
11C). The results of the flow cytometry experiments showed
that, compared with the si-NC group, knocking down TIMP1
expression did not significantly affect the apoptosis cycle of
LN229 and SF593 cells (Figs. 11I
and S6A). However, colony
formation assays demonstrated that, compared with the si-NC group,
knockdown of the TIMP1 gene by both TIMP1 si-RNAs
reduced the number of colonies in LN229 and SF539 cells (Fig. 11H and K). Consistent with the
colony formation assay results, the results of the EdU experiment
showed that the fluorescence intensity of both the
si-TIMP1−1 and si-TIMP1−2 groups was lower than that
of the si-NC group (P<0.01; Figs.
11L and S6B), indicating a
decline in cell proliferation capability. Consistent results were
also obtained in the CCK-8 assays (Fig. 11M). These experimental results
confirmed that knocking down TIMP1 expression inhibited the
proliferation of LN229 and SF539 cells. Overall, the comprehensive
analysis suggested that TIMP1 may play a critical role in
the development and progression of high-grade glioma and could
serve as a potential biomarker for prognostic and therapeutic
purposes.
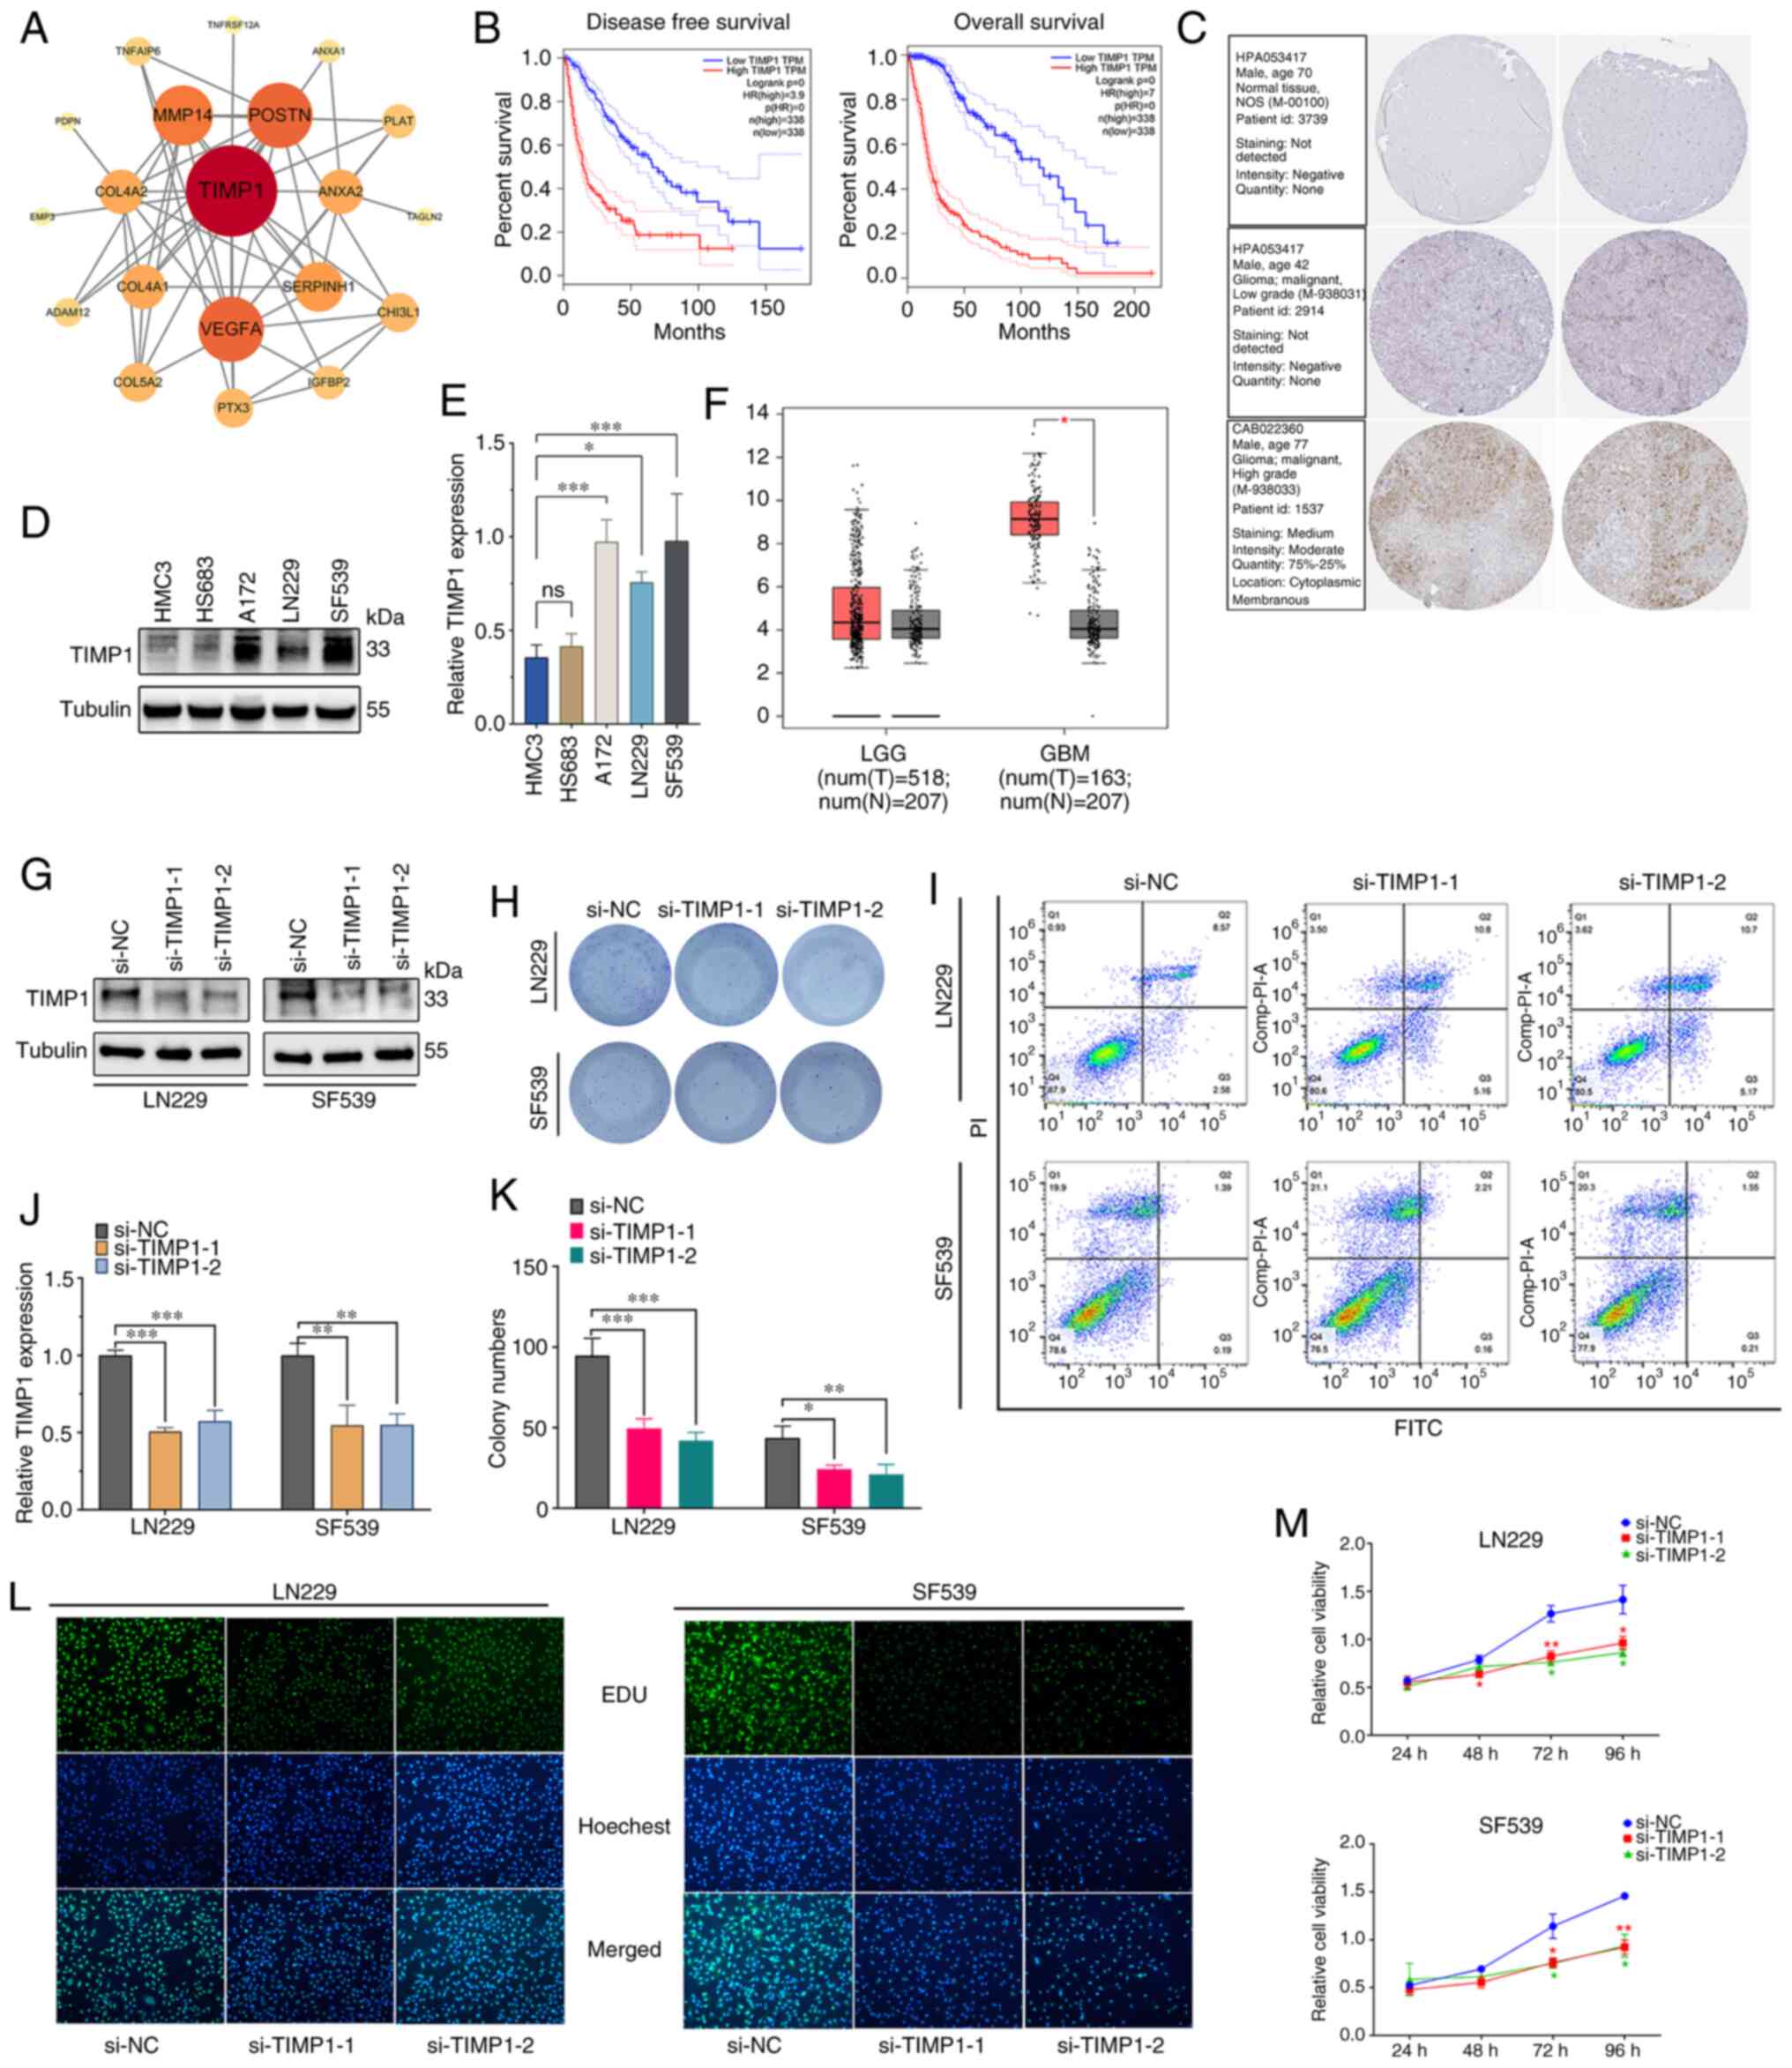 | Figure 11.Validation of the DEGs and
downregulation of TIMP1. (A) Protein-protein interaction
network of the top 50 key DEGs. (B) Kaplan-Meier survival curve
analysis of TIMP1 in the glioma cohort. (C) TIMP1
immunohistochemistry image from Human Protein Atlas database. (D)
TIMP1 expression levels in LGG and GBM. (E) WB and (F)
semi-quantification experiments of TIMP1 expression normal
human astrocytes and glioma cell lines. Efficiency of TIMP1
knockdown was confirmed by (G) WB and subsequently (H)
semi-quantified. The results and statistics of (I) Colony formation
assay in different transfection groups and subsequent (J)
quantification. (K) Apoptosis of transfected LN229 and SF539 cells
was assessed by flow cytometric assays. Proliferation of
transfected LN229 and SF539 cells was assessed by (L) EdU and (M)
Cell Counting Kit-8 assays. *P<0.05, **P<0.01, ***P<0.001.
DEGs, differentially expressed genes; EdU, 5-ethynyl-2-doxyuridine;
GBM, glioblastoma; HR, hazard ratio; LGG, low grade glioma; N,
normal tissue; NC, negative control; si(RNA), small interfering
(RNA); T, tumor tissue; TIMP1, tissue inhibitor of
metalloproteinase 1; WB, western blotting. |
Discussion
Cancer cells have a unique metabolism, which
requires complex and diverse metabolic pathways to meet their
specific needs such as for growth and invasion (37,38).
Furthermore, metabolic changes and regulation can significantly
impact the outcome of tumors (39).
Research demonstrates that glioma tumors primarily rely on FAO to
produce ATP and cytosolic NADPH, which provide essential energy to
tumor cells (34). The precursors
of signaling molecules that regulate important biological processes
of tumors are derived from FAs and their metabolic products. In
addition, FAs play a pivotal role in ferroptosis, a non-traditional
apoptosis mechanism, which is induced by the reaction of ferrous
ions and reactive oxygen species (ROS) (40). Moreover, the chemotherapy
resistance, angiogenesis, metastasis and invasion of glioma cells
are closely related to FA metabolism (41). Therefore, the occurrence and
development of glioma heavily depend on FA metabolism. Previous
studies have drawn attention to the immunosuppressive effects of FA
metabolism on tumors. For instance, Miska et al (42) reported that etomoxir, an inhibitor
of FA metabolism, inhibits the growth of MC38 tumor cells in
vivo, which is dependent on preventing the immunosuppressive
capabilities of CD8+ and CD4+ T cells.
Similarly, Zhao et al (43)
observed that FAO ultimately increases the tolerance of dendritic
cells to enhance the resistance to immunotherapy in melanoma and
generates tumor-regulatory T cells through indoleamine
2,3-dioxygenase-1 activity. In another study by Pearce et al
(44), it was demonstrated that
tumor necrosis factor receptor-associated factor 6 promotes FAO,
which enhances the development of long-lived memory CD8 T cells.
Notably, blocking FAO simultaneously boosts antitumor immunity and
the efficacy of anti-programmed cell death protein 1 inhibitors
(45).
Although some genes related to FA metabolism and the
immune microenvironment of glioma have been experimentally
verified, the research is still in its early stages and there is
currently no effective method to target this pathway in clinical
practice (14,46). Previous studies have used molecular
markers related to FA metabolism to construct glioma prognosis
models (33,34), but the link between the prognosis
model and the tumor immune microenvironment remains unclear.
Therefore, in the present study, a FAO-based model was
comprehensively and systematically constructed to evaluate immune
infiltration in patients with glioma and to discover the potential
relationship and clinical value of FA metabolism and the immune
microenvironment in glioma.
The findings of the present study revealed global
changes in FAO-related genes in glioma cells at the transcriptional
and genetic levels, which identified three distinct molecular
clusters based on 13 FAO-related genes. Cluster B, associated with
higher immune infiltration, displayed significantly worse
prognosis, and other significant differences in the TME
characteristics were observed between the clusters. The enrichment
features of cluster B included the p53 signaling pathway,
apoptosis, the ROS signaling pathway, DNA replication and mismatch
repair. Pairwise comparison of three molecular clusters yielded 287
DEGs, and the clusters were further classified to two different
gene subtypes based on the top 50 DEGs (rated according to the
P-value). Patients with subtype B had a higher tumor grade, poor
prognostic factors such as age, and a worse survival compared with
patients with subtype A. Analysis of the clinicopathological
information revealed poor prognostic indicators such as IDH1
wild-type, 1p19q non-co-deletion and high tumor grade in the HSG.
The expression of immune checkpoints was also generally higher in
the HSG, indicating potential benefits with the administration of
immune checkpoint inhibitors.
The scores from the model developed in the present
study, by comparing the HSG and the LSG, demonstrated significantly
different clinicopathological features, prognostic correlations,
immune checkpoints and drug sensitivity. The scores were validated
using an external validation set, and the immunotherapy response of
the validation set could be predicted from this model. We consider
that the findings of the present study provide critical insights
into the molecular mechanisms of the role of FA metabolism in
glioma and offer new ideas for drug development and targeted
therapy.
In addition, the TIMP1 gene was identified
through key protein interactions in the current study. One study
found that the expression of TIMP1 in HT-29 colon
adenocarcinoma cells increased the cell proliferation, migration
and growth of tumor xenografts (47). Another study found that, among
patients with endometrial cancer and breast cancer, patients with
shorter recurrence times and later tumor stages were significantly
positively correlated with the expression level of TIMP1
(48,49). Numerous studies have also revealed
the relationship between TIMP1 and tumor progression and the
TME (47–51). A recent study has also found that
TIMP1 is highly expressed in GBM, the TIMP1 gene
family is related to the immune infiltration of glioma and the
immune response-related transcription factor, Sp1, can regulate the
expression of TIMP1 in GBM (45). The results of the present study
further demonstrated the correlation between TIMP1
expression and increased tumor proliferation. In addition, the key
gene, TIMP1, was screened out to be included in the immune
score of the developed model, and the score indicated a better
immune response.. Furthermore, TIMP1 protein expression in
different glioma cell lines was verified, and it was found that the
expression level of TIMP1 increased with tumor grade. The present
study, to the best of our knowledge, confirmed for the first time
that the expression level of TIMP1 may be positively correlated
with the degree of malignancy in glioma, which provided a further
theoretical basis for the relationship between TIMP1 and the
growth, proliferation and immune infiltration of glioma. However,
more immunohistochemical samples and in vitro experimental
studies are required to verify this hypothesis.
In conclusion, the present study demonstrated that
FAO-related genes are closely linked to glioma oncogenesis and
progression, and that the clusters and scoring models constructed
based on the FAO-related genes were effective in evaluating
prognosis and immunotherapy response. FAO-related genes may be
involved in one of the immune mechanisms of tumor development and
therefore may be a new target for tumor treatment.
Supplementary Material
Supporting Data
Supporting Data
Acknowledgements
Not applicable.
Funding
This research was funded by the Guangxi Medical and Health
Appropriate Technology Development and Promotion Project (grant no.
S2020104).
Availability of data and materials
The datasets used and/or analyzed during the current
study are available from the corresponding author on reasonable
request.
Authors' contributions
YL contributed to data curation, conception and
design, and was responsible for supervision. GL and ZZ were
responsible for supervision, writing the original draft of the
manuscript and performing the formal analysis. FG was responsible
for the methodology, performing the formal analysis and experiment,
and review and editing the manuscript. LM and HP were responsible
for data curation, the formal analysis, and writing, reviewing and
editing the manuscript. All authors read and approved the final
version of the manuscript. FG, LM and HP confirm the authenticity
of all the raw data.
Ethics approval and consent to
participate
Not applicable.
Patient consent for publication
Not applicable.
Competing interests
The authors declare that they have no competing
interests.
Glossary
Abbreviations
Abbreviations:
|
DEGs
|
differentially expressed genes
|
|
EdU
|
5-ethynyl-2-doxyuridine
|
|
FA
|
fatty acid
|
|
FAO
|
fatty acid oxidation
|
|
GBM
|
glioblastoma
|
|
GO
|
Gene Ontology
|
|
HSG
|
high score group
|
|
IC50
|
half maximal inhibitory
concentration
|
|
KEGG
|
Kyoto Encyclopedia of Genes and
Genomes
|
|
LGG
|
low-grade glioma
|
|
LSG
|
low score group
|
|
PCA
|
principal component analysis
|
|
ROS
|
reactive oxygen species
|
|
TIMP1
|
tissue inhibitor of metalloproteinase
1
|
|
WB
|
western blotting
|
|
siRNA
|
small interfering RNA
|
|
si-NC
|
negative control siRNA
|
References
|
1
|
Lapointe S, Perry A and Butowski NA:
Primary brain tumours in adults. Lancet. 392:432–446. 2018.
View Article : Google Scholar : PubMed/NCBI
|
|
2
|
Yang K, Wu Z, Zhang H, Zhang N, Wu W, Wang
Z, Dai Z, Zhang X, Zhang L, Peng Y, et al: Glioma targeted therapy:
Insight into future of molecular approaches. Mol Cancer. 21:392022.
View Article : Google Scholar : PubMed/NCBI
|
|
3
|
Weller M, van den Bent M, Preusser M, Le
Rhun E, Tonn JC, Minniti G, Bendszus M, Balana C, Chinot O, Dirven
L, et al: EANO guidelines on the diagnosis and treatment of diffuse
gliomas of adulthood. Nat Rev Clin Oncol. 18:170–186. 2021.
View Article : Google Scholar : PubMed/NCBI
|
|
4
|
Jiang T, Nam DH, Ram Z, Poon WS, Wang J,
Boldbaatar D, Mao Y, Ma W, Mao Q, You Y, et al: Clinical practice
guidelines for the management of adult diffuse gliomas. Cancer
Lett. 499:60–72. 2021. View Article : Google Scholar : PubMed/NCBI
|
|
5
|
Stupp R, Taillibert S, Kanner A, Read W,
Steinberg D, Lhermitte B, Toms S, Idbaih A, Ahluwalia MS, Fink K,
et al: Effect of tumor-treating fields plus maintenance
temozolomide vs maintenance temozolomide alone on survival in
patients with glioblastoma: A randomized clinical trial. JAMA.
318:2306–2316. 2017. View Article : Google Scholar : PubMed/NCBI
|
|
6
|
Nicholson JG and Fine HA: Diffuse glioma
heterogeneity and its therapeutic implications. Cancer Discov.
11:575–590. 2021. View Article : Google Scholar : PubMed/NCBI
|
|
7
|
Przybylowski CJ, Hervey-Jumper SL and
Sanai N: Surgical strategy for insular glioma. J Neurooncol.
151:491–497. 2021. View Article : Google Scholar : PubMed/NCBI
|
|
8
|
Tan AC, Ashley DM, López GY, Malinzak M,
Friedman HS and Khasraw M: Management of glioblastoma: State of the
art and future directions. CA Cancer J Clin. 70:299–312. 2020.
View Article : Google Scholar : PubMed/NCBI
|
|
9
|
Yeo AT, Rawal S, Delcuze B, Christofides
A, Atayde A, Strauss L, Balaj L, Rogers VA, Uhlmann EJ, Varma H, et
al: Single-cell RNA sequencing reveals evolution of immune
landscape during glioblastoma progression. Nat Immunol. 23:971–984.
2022. View Article : Google Scholar : PubMed/NCBI
|
|
10
|
Wang LB, Karpova A, Gritsenko MA, Kyle JE,
Cao S, Li Y, Rykunov D, Colaprico A, Rothstein JH, Hong R, et al:
Proteogenomic and metabolomic characterization of human
glioblastoma. Cancer Cell. 39:509–528.e20. 2021. View Article : Google Scholar : PubMed/NCBI
|
|
11
|
Bian X, Liu R, Meng Y, Xing D, Xu D and Lu
Z: Lipid metabolism and cancer. J Exp Med. 218:e202016062021.
View Article : Google Scholar : PubMed/NCBI
|
|
12
|
Martínez-Reyes I and Chandel NS: Cancer
metabolism: Looking forward. Nat Rev Cancer. 21:669–680. 2021.
View Article : Google Scholar : PubMed/NCBI
|
|
13
|
Pavlova NN, Zhu J and Thompson CB: The
hallmarks of cancer metabolism: Still emerging. Cell Metab.
34:355–377. 2022. View Article : Google Scholar : PubMed/NCBI
|
|
14
|
Jiang N, Xie B, Xiao W, Fan M, Xu S, Duan
Y, Hamsafar Y, Evans AC, Huang J, Zhou W, et al: Fatty acid
oxidation fuels glioblastoma radioresistance with CD47-mediated
immune evasion. Nat Commun. 13:15112022. View Article : Google Scholar : PubMed/NCBI
|
|
15
|
Cheng X, Geng F, Pan M, Wu X, Zhong Y,
Wang C, Tian Z, Cheng C, Zhang R, Puduvalli V, et al: Targeting
DGAT1 ameliorates glioblastoma by increasing fat catabolism and
oxidative stress. Cell Metab. 32:229–242.e8. 2020. View Article : Google Scholar : PubMed/NCBI
|
|
16
|
Martin-Perez M, Urdiroz-Urricelqui U,
Bigas C and Benitah SA: The role of lipids in cancer progression
and metastasis. Cell Metab. 34:1675–1699. 2022. View Article : Google Scholar : PubMed/NCBI
|
|
17
|
Puca F, Yu F, Bartolacci C, Pettazzoni P,
Carugo A, Huang-Hobbs E, Liu J, Zanca C, Carbone F, Del Poggetto E,
et al: Medium-chain acyl CoA dehydrogenase protects mitochondria
from lipid peroxidation in glioblastoma. Cancer Discov.
11:2904–2923. 2021. View Article : Google Scholar : PubMed/NCBI
|
|
18
|
Bi J and Mischel PS: Acyl-CoA-binding
protein fuels gliomagenesis. Cell Metab. 30:229–230. 2019.
View Article : Google Scholar : PubMed/NCBI
|
|
19
|
Zhao Z, Zhang KN, Wang Q, Li G, Zeng F,
Zhang Y, Wu F, Chai R, Wang Z, Zhang C, et al: Chinese glioma
genome atlas (CGGA): A comprehensive resource with functional
genomic data from Chinese glioma patients. Genomics Proteomics
Bioinformatics. 19:1–12. 2021. View Article : Google Scholar : PubMed/NCBI
|
|
20
|
Liberzon A, Subramanian A, Pinchback R,
Thorvaldsdóttir H, Tamayo P and Mesirov JP: Molecular signatures
database (MSigDB) 3.0. Bioinformatics. 27:1739–1740. 2011.
View Article : Google Scholar : PubMed/NCBI
|
|
21
|
Gentleman RC, Carey VJ, Bates DM, Bolstad
B, Dettling M, Dudoit S, Ellis B, Gautier L, Ge Y, Gentry J, et al:
Bioconductor: Open software development for computational biology
and bioinformatics. Genome Biol. 5:R802004. View Article : Google Scholar : PubMed/NCBI
|
|
22
|
Sun D, Wang J, Han Y, Dong X, Ge J, Zheng
R, Shi X, Wang B, Li Z, Ren P, et al: TISCH: A comprehensive web
resource enabling interactive single-cell transcriptome
visualization of tumor microenvironment. Nucleic Acids Res.
49:D1420–D1430. 2021. View Article : Google Scholar : PubMed/NCBI
|
|
23
|
Canzler S and Hackermüller J: multiGSEA: A
GSEA-based pathway enrichment analysis for multi-omics data. BMC
Bioinformatics. 21:5612020. View Article : Google Scholar : PubMed/NCBI
|
|
24
|
Sotiriou C, Wirapati P, Loi S, Harris A,
Fox S, Smeds J, Nordgren H, Farmer P, Praz V, Haibe-Kains B, et al:
Gene expression profiling in breast cancer: understanding the
molecular basis of histologic grade to improve prognosis. J Natl
Cancer Inst. 98:262–272. 2006. View Article : Google Scholar : PubMed/NCBI
|
|
25
|
Laska E, Meisner M and Wanderling J: A
maximally selected test of symmetry about zero. Stat Med.
31:3178–3191. 2012. View Article : Google Scholar : PubMed/NCBI
|
|
26
|
Kim JC, Heo YJ, Kang SY, Lee J and Kim KM:
Validation of the combined biomarker for prediction of response to
checkpoint inhibitor in patients with advanced cancer. Cancers
(Basel). 13:23162021. View Article : Google Scholar : PubMed/NCBI
|
|
27
|
Zhang X, Shi M, Chen T and Zhang B:
Characterization of the immune cell infiltration landscape in head
and neck squamous cell carcinoma to aid immunotherapy. Mol Ther
Nucleic Acids. 22:298–309. 2020. View Article : Google Scholar : PubMed/NCBI
|
|
28
|
Tu B, Ye L, Cao Q, Gong S, Jiang M and Li
H: Identification of a five-miRNA signature as a novel potential
prognostic biomarker in patients with nasopharyngeal carcinoma.
Hereditas. 159:32022. View Article : Google Scholar : PubMed/NCBI
|
|
29
|
Jung H, Kim HS, Kim JY, Sun JM, Ahn JS,
Ahn MJ, Park K, Esteller M, Lee SH and Choi JK: DNA methylation
loss promotes immune evasion of tumours with high mutation and copy
number load. Nat Commun. 10:42782019. View Article : Google Scholar : PubMed/NCBI
|
|
30
|
Baty F, Joerger M, Früh M, Klingbiel D,
Zappa F and Brutsche M: 24 h-gene variation effect of combined
bevacizumab/erlotinib in advanced non-squamous non-small cell lung
cancer using exon array blood profiling. J Transl Med. 15:662017.
View Article : Google Scholar : PubMed/NCBI
|
|
31
|
Clough E and Barrett T: The gene
expression omnibus database. Methods Mol Biol. 1418:93–110. 2016.
View Article : Google Scholar : PubMed/NCBI
|
|
32
|
Braun DA, Hou Y, Bakouny Z, Ficial M,
Sant' Angelo M, Forman J, Ross-Macdonald P, Berger AC, Jegede OA,
Elagina L, et al: Interplay of somatic alterations and immune
infiltration modulates response to PD-1 blockade in advanced clear
cell renal cell carcinoma. Nat Med. 26:909–918. 2020. View Article : Google Scholar : PubMed/NCBI
|
|
33
|
Liu R, Liang W, Hua Q, Wu L, Wang X, Li Q,
Zhong F, Li B and Qiu Z: Fatty acid metabolic signaling pathway
alternation predict prognosis of immune checkpoint inhibitors in
glioblastoma. Front Immunol. 13:8195152022. View Article : Google Scholar : PubMed/NCBI
|
|
34
|
Lin H, Patel S, Affleck VS, Wilson I,
Turnbull DM, Joshi AR, Maxwell R and Stoll EA: Fatty acid oxidation
is required for the respiration and proliferation of malignant
glioma cells. Neuro Oncol. 19:43–54. 2017. View Article : Google Scholar : PubMed/NCBI
|
|
35
|
Otasek D, Morris JH, Bouças J, Pico AR and
Demchak B: Cytoscape automation: Empowering workflow-based network
analysis. Genome Biol. 20:1852019. View Article : Google Scholar : PubMed/NCBI
|
|
36
|
Xu H, Zhang Y, Liu J, Cui J, Gan Y, Wu Z,
Chang Y, Sui R, Chen Y, Shi J, et al: UM-164, a dual inhibitor of
c-Src and p38 MAPK, suppresses proliferation of glioma by reducing
YAP activity. Cancers (Basel). 14:53432022. View Article : Google Scholar : PubMed/NCBI
|
|
37
|
Luis G, Godfroid A, Nishiumi S, Cimino J,
Blacher S, Maquoi E, Wery C, Collignon A, Longuespée R,
Montero-Ruiz L, et al: Tumor resistance to ferroptosis driven by
Stearoyl-CoA Desaturase-1 (SCD1) in cancer cells and fatty acid
biding protein-4 (FABP4) in tumor microenvironment promote tumor
recurrence. Redox Biol. 43:1020062021. View Article : Google Scholar : PubMed/NCBI
|
|
38
|
Wu L, Zhang X, Zheng L, Zhao H, Yan G,
Zhang Q, Zhou Y, Lei J, Zhang J, Wang J, et al: RIPK3 orchestrates
fatty acid metabolism in tumor-associated macrophages and
hepatocarcinogenesis. Cancer Immunol Res. 8:710–721. 2020.
View Article : Google Scholar : PubMed/NCBI
|
|
39
|
Ma Y, Temkin SM, Hawkridge AM, Guo C, Wang
W, Wang XY and Fang X: Fatty acid oxidation: An emerging facet of
metabolic transformation in cancer. Cancer Lett. 435:92–100. 2018.
View Article : Google Scholar : PubMed/NCBI
|
|
40
|
Juraszek B, Czarnecka-Herok J and Nałęcz
KA: Glioma cells survival depends both on fatty acid oxidation and
on functional carnitine transport by SLC22A5. J Neurochem.
156:642–657. 2021. View Article : Google Scholar : PubMed/NCBI
|
|
41
|
Strickland M and Stoll EA: Metabolic
reprogramming in glioma. Front Cell Dev Biol. 5:432017. View Article : Google Scholar : PubMed/NCBI
|
|
42
|
Miska J, Lee-Chang C, Rashidi A, Muroski
ME, Chang AL, Lopez-Rosas A, Zhang P, Panek WK, Cordero A, Han Y,
et al: HIF-1α is a metabolic switch between glycolytic-driven
migration and oxidative phosphorylation-driven immunosuppression of
Tregs in glioblastoma. Cell Rep. 27:226–237.e4. 2019. View Article : Google Scholar : PubMed/NCBI
|
|
43
|
Zhao F, Xiao C, Evans KS, Theivanthiran T,
DeVito N, Holtzhausen A, Liu J, Liu X, Boczkowski D, Nair S, et al:
Paracrine Wnt5a-β-catenin signaling triggers a metabolic program
that drives dendritic cell tolerization. Immunity. 48:147–160.e7.
2018. View Article : Google Scholar : PubMed/NCBI
|
|
44
|
Pearce EL, Walsh MC, Cejas PJ, Harms GM,
Shen H, Wang LS, Jones RG and Choi Y: Enhancing CD8 T-cell memory
by modulating fatty acid metabolism. Nature. 460:103–107. 2009.
View Article : Google Scholar : PubMed/NCBI
|
|
45
|
Wang T, Fahrmann JF, Lee H, Li YJ,
Tripathi SC, Yue C, Zhang C, Lifshitz V, Song J, Yuan Y, et al:
JAK/STAT3-regulated fatty acid β-oxidation is critical for breast
cancer stem cell self-renewal and chemoresistance. Cell Metab.
27:136–150.e5. 2018. View Article : Google Scholar : PubMed/NCBI
|
|
46
|
Zhan Y, Qiao W, Yi B, Yang X, Li M, Sun L,
Ji L, Su P, Wang X, Zhang F, et al: Dual role of pseudogene
TMEM198B in promoting lipid metabolism and immune escape of glioma
cells. Oncogene. 41:4512–4523. 2022. View Article : Google Scholar : PubMed/NCBI
|
|
47
|
Song G, Xu S, Zhang H, Wang Y, Xiao C,
Jiang T, Wu L, Zhang T, Sun X, Zhong L, et al: TIMP1 is a
prognostic marker for the progression and metastasis of colon
cancer through FAK-PI3K/AKT and MAPK pathway. J Exp Clin Cancer
Res. 35:1482016. View Article : Google Scholar : PubMed/NCBI
|
|
48
|
Yi YC, Chen MK, Chen LY, Ho ES, Ying TH,
Wang PH and Yang SF: Genetic polymorphism of the tissue inhibitor
of metalloproteinase-1 is associated with an increased risk of
endometrial cancer. Clin Chim Acta. 409:127–131. 2009. View Article : Google Scholar : PubMed/NCBI
|
|
49
|
Eiro N, González L, Martínez-Ordoñez A,
Fernandez-Garcia B, González LO, Cid S, Dominguez F,
Perez-Fernandez R and Vizoso FJ: Cancer-associated fibroblasts
affect breast cancer cell gene expression, invasion and
angiogenesis. Cell Oncol (Dordr). 41:369–378. 2018. View Article : Google Scholar : PubMed/NCBI
|
|
50
|
Tian Z, Ou G, Su M, Li R, Pan L, Lin X,
Zou J, Chen S, Li Y, Huang K and Chen Y: TIMP1 derived from
pancreatic cancer cells stimulates schwann cells and promotes the
occurrence of perineural invasion. Cancer Lett. 546:2158632022.
View Article : Google Scholar : PubMed/NCBI
|
|
51
|
Yang L, Jiang Q, Li DZ, Zhou X, Yu DS and
Zhong J: TIMP1 mRNA in tumor-educated platelets is diagnostic
biomarker for colorectal cancer. Aging (Albany NY). 11:8998–9012.
2019. View Article : Google Scholar : PubMed/NCBI
|