Introduction
In previous years, despite advancements in
preventative measures and lifestyle changes, the incidence of skin
cutaneous melanoma (SKCM) has slowed its upward trend (1,2).
However, studies demonstrate that in the United States, ~97,610 new
melanoma cases were estimated to be diagnosed in 2023 (3), with cutaneous melanoma accounting for
72% of all skin cancer-related deaths (excluding basal cell
carcinoma and squamous cell carcinoma) (4). These data underscore the impact of
melanoma within the spectrum of skin cancer types. Consequently,
there remains a pressing need for continued research efforts to
explore effective treatment strategies and therapeutic targets for
cutaneous melanoma.
In general, the incidence of melanoma is often
associated with prolonged exposure to ultraviolet (UV) radiation,
primarily from UVA and UVB spectra. Genomic analyses across various
types of cancer have shown that cutaneous melanomas carry an
exceptionally high mutational burden, often >10 mutations per
megabase. These mutations frequently exhibit UV-specific
signatures, with a notable prevalence of C-to-T transitions and
G-to-T transversions (5,6). While the effects of radiation from
different UV spectra can overlap owing to their ability to induce
DNA mutation, UVA and UVB irradiation have distinct mechanisms in
promoting melanoma. For example, UVB mainly causes damage by being
absorbed by cellular components such as DNA, aromatic amino acids
and unsaturated lipids, while also generating some reactive oxygen
species (ROS). By contrast, UVA primarily causes damage through the
production of ROS, with less direct absorption by cellular
components such as DNA (7).
In contemporary melanoma management, therapeutic
decision-making is fundamentally driven by comprehensive tumour
genetic profiling, enabling precise alignment of targeted
interventions with specific driver mutations (8,9). This
approach is clearly demonstrated by BRAF inhibitors, with
vemurafenib emerging as a prototypical agent demonstrating >50%
objective response rates and clinically meaningful survival
improvements in phase 1/2 trials involving patients with BRAF V600E
mutations (10). The successful
advancement of RAF-MEK inhibitors into multi-phase clinical trials
(I–III) is fundamentally rooted in precision therapeutic paradigms
that strategically align tumour genotype with selective pathway
blockade, driving measurable survival benefits in genetically
defined patient populations (11).
However, this approach has its limitations. For example, some
patients may exhibit a suboptimal response to these inhibitors or
experience individual adverse reactions such as arthralgia, rash,
nausea, photosensitivity, fatigue, cutaneous squamous-cell
carcinoma, pruritus and palmar-plantar dysesthesia (12). When addressing the challenge of
mitigating the aforementioned side effects, a promising approach
lies in identifying an additional target for concurrent melanoma
treatment, thereby enabling RAF-MEK inhibitor dose reduction while
optimizing efficacy. Hence, a comprehensive exploration of the
interplay between genes and melanoma development is key for
devising personalized targeted treatments.
Elongator acetyltransferase complex subunit 6
(ELP6) (13) serves a
pivotal role within the elongator complex, together with ELP1,
ELP2, ELP3, ELP4 and ELP5 (14). Studies in this domain suggest that
within eukaryotic cells, the ELP6 subunit facilitates protein
translation by modifying tRNAs corresponding to specific codons,
including those containing the amino acids AAA (15), CAA (16) and GAA (17). Previous research has demonstrated
notable associations between the ELP subunits and tumorigenesis,
progression and/or metastasis across a spectrum of malignancies,
including gallbladder carcinoma (18,19),
sonic hedgehog pathway-associated medulloblastoma (20), brain cancer (21), breast carcinoma (22) and lung carcinoma (23). Notably, a previous study by Close
et al (24), which utilized
melanoma-derived cells in vitro, preliminarily established a
positive correlation between ELP6 expression and the ability
of melanoma to form clones and migrate. These findings suggest a
potential role for inhibiting ELP6 expression in melanoma
therapy. However, there are currently no reports on whether the
expression of ELP subunits, particularly ELP6, changes in patients
with melanoma, whether ELP6 gene expression levels are
associated with patient survival rates and the underlying reasons
for any alterations in ELP6 expression.
Therefore, the present study aimed to systematically
characterize the expression patterns and mutational profiles of
ELP1-6 in melanoma by integrating GEPIA and TCGA databases,
evaluate the clinical relevance of ELP1-6 expression levels
with patient prognosis and investigate the biological function of
ELP6 in melanoma progression as well as its regulatory
effects on targeted therapy sensitivity.
Materials and methods
Public data collection
Analyses were performed using the standardized
pipeline of the Gene Expression Profiling Interactive Analysis
(GEPIA, http://gepia.cancer-pku.cn/index.html) platform
(25), which provides
pre-integrated transcriptomic datasets from The Cancer Genome Atlas
(TCGA, http://portal.gdc.cancer.gov/) and
Genotype-Tissue Expression (GTEx, http://gtexportal.org/home/). Users input target gene
symbols (ELP1-6) to activate the platform's automated
analytical pipeline, which directly generates comparative
expression boxplots between SKCM and normal tissues. No local data
download or computational processing was performed, as all outputs
were produced through the platform's self-contained analytical
modules. Survival analyses utilized TCGA-derived clinical follow-up
data, with patient grouped by median ELP1-6 expression
levels and Kaplan-Meier curve. Publicly available RNA-seq data of
cutaneous melanoma (accession no, GSE15605) were retrieved from the
Gene Expression Omnibus (GEO, http://www.ncbi.nlm.nih.gov/geo/).
To examine ELP1-6 alterations, including
missense mutations, splice mutations, truncating mutations,
structural variants, amplifications and deep deletions, the
TCGA-SKCM dataset (PanCancer Atlas) using cBioPortal for Cancer
Genomics (https://www.cbioportal.org/, version
3.7.29) was analysed.
Survival analysis
Essential clinical data for patients with SKCM, such
as age, sex, survival time, survival status and stage, from the
TCGA database were obtained. These data were then matched with
whole-transcriptome profiling data for the ELP6high
(n=234) and ELP6low (n=234) groups, categorized on the
basis of the median expression of ELP6 [median log2(TPM +
1)=4.9055], using sample IDs. Patients without complete clinical
follow-up information were excluded. Kaplan-Meier survival analysis
was performed via R statistical software (version 4.1.2; https://www.r-project.org/; Posit Software, PBC) and
the ‘survival’ (version 3.3.1) and ‘survminer’ (version 0.4.9)
packages to assess the relationship between ELP6 mRNA
expression levels and survival outcomes of patients with SKCM. To
compare the survival distributions between the high and low
expression groups, the log rank test was applied, a non-parametric
method that evaluates the observed vs. expected events (such as
deaths) at each time point. The test calculates a χ2
statistic, with the resulting P-value determining the statistical
significance. P<0.05 was considered to indicate a statistically
significant difference.
Chemotherapeutic sensitivity
prediction
To predict drug sensitivity, the Cancer Cell Line
Encyclopaedia (version no. CCLE2012, http://sites.broadinstitute.org/ccle/) (26) and the R package ‘pRRopheticPredict’
(version 0.5) that employ the ridge regression model were utilized,
as previously published (27).
Statistical analysis was conducted using the Wilcoxon test.
P<0.05 was considered to indicate a statistically significant
difference.
Cell culture
The 293T, SK-MEL-2 and A375 cell lines were obtained
from Procell Life Science & Technology Co., Ltd., and were
authenticated using STR analysis. A375 cells, a melanoma cell line,
harbour the BRAF V600E mutation (28), and SK-MEL-2 cells, also
melanoma-derived, harbour an N-RAS mutation (29), both of which are relevant to the
study of melanoma. The cell lines were cultured according to
standard protocols in medium supplemented with 10% foetal bovine
serum (FBS) and 100 µg/ml penicillin. The cells were maintained at
37°C in a humidified atmosphere with 5% CO2.
Cell counting kit-8 (CCK-8)
cytotoxicity assay
The target cells were seeded at a density of 5,000
cells per well in 96-well plates and allowed to adhere overnight
under standard culture conditions (37°C, 5% CO2). Cells
were then treated with U0126 (0, 0.1, 0.2, 0.5 or 1 µM in 0.1%
DMSO) for 24 or 48 h at 37°C. Following treatment, the medium was
replaced with fresh serum-free medium supplemented with 10 µl of
CCK-8 solution (cat. no. HY-K0301; MedChemExpress) for 1 h at 37°C.
The optical density of each well was then measured at 450 nm using
a microplate reader (ELx800; BioTek; Agilent Technologies, Inc.).
Background absorbance, determined from wells containing only
culture medium and CCK-8 solution, was subtracted from the obtained
values. Relative cell viability was calculated by comparing the
absorbance of treated cells to that of untreated control cells.
RNA extraction and real-time
quantitative PCR (RT-qPCR)
Total RNA extraction was carried out using TRIzol
reagent (Invitrogen; Thermo Fisher Scientific, Inc.) following the
manufacturer's protocol. Following extraction, RNA quality and
quantity were assessed using a NanoDrop spectrophotometer
(NanodropTM lite; Thermo Fisher Scientific, Inc.) or agarose gel
electrophoresis. cDNA synthesis was subsequently performed using
reverse transcriptase M-MLV (RNase H-), and RT-qPCR was
subsequently conducted using TB Green® Premix Ex Taq™ II
(Tli RNaseH Plus; Takara Bio, Inc.) on a real-time PCR System
(Bio-Rad Laboratories, Inc.) under the following thermocycling
conditions: 95°C for 30 sec; 39 cycles of 95°C for 10 sec, 56°C for
15 sec and 72°C for 15 sec. Melt curve analysis was performed at
the following thermocycling conditions: 95°C for 15 sec, 55°C for
15 sec and continuous heating from 55–95°C at 0.5°C increments
every 5 sec to verify amplification specificity. Gene expression
levels were normalized to those of GAPDH, and relative expression
was calculated using the 2−ΔΔCq method (30,31).
To ensure accuracy and reproducibility, triplicate experiments were
performed for each sample. Target genes were amplified using the
following primers: ELP6 forward (F), 5′-TGGCTGTGCTAGACTTCAT-3′ and
reverse (R), 5′-GTCATTCTCCTCATCCTCC-3′; GAPDHF,
5′-ACAACTTTGGTATCGTGGAAGG-3′ and R, 5′-GCCATCACGCCACAGTTTC-3′;
proliferating cell nuclear antigen (PCNA) F,
5′-CCTGCTGGGATATTAGCTCCA-3′ and R, 5′-CAGCGGTAGGTGTCGAAGC-3′; Ki67
F, 5′-ACGCCTGGTTACTATCAAAAGG-3′ and R,
5′-CAGACCCATTTACTTGTGTTGGA-3′; KARS1 F, 5′-ACAGATAATGAGCCCTTTG-3′
and R, 5′-GTTGTTGGAGTCCGTGAG-3′; p44 MAPK F,
5′-CTACACGCAGTTGCAGTACAT-3′ and R, 5′-CAGCAGGATCTGGATCTCCC-3′; and
p42 MAPK F, 5′-CATGTCTGAAGCGCAGTAAGATT-3′ and R,
5′-TACACCAACCTCTCGTACATCG-3′.
Western blotting
ShCtrl and shELP6-3 293T cell lines were treated
with cycloheximide (CHX, cat. no. HY-12320; MedChemExpress) 0 or 10
µg/ml in serum free medium at 37°C with 5% CO2 for 0 or
24 h, while shCtrl and shELP6 A375 cells were exposed to CHX (0 or
10 µg/ml) under the aforementioned conditions for 0, 12 or 24 h.
Cellular proteins were extracted using RIPA lysis buffer (cat. no.
r0010-100; Beijing Solarbio Science & Technology Co., Ltd.)
supplemented with PMSF (cat. no. P0100; Beijing Solarbio Science
& Technology Co., Ltd.) and protease/phosphatase inhibitor
cocktail (cat. no. P6730; Beijing Solarbio Science & Technology
Co., Ltd.). After lysis on ice, the lysates were centrifuged at
16,000 × g for 30 min at 4°C to collect the protein-containing
supernatant, which was then quantified using the Bradford assay.
Equal amounts (50 µg) of protein samples were separated using 10 or
12% SDS-PAGE gels and transferred onto polyvinylidene fluoride
membranes (cat. no. SEQ00010; Merck KGaA). The membranes were
blocked with 5% milk at room temperature for 1 h and incubated
overnight at 4°C with primary antibodies targeting ERK1/2 (cat. no.
51068-1-AP; 1:1,000; Proteintech Group, Inc.), phospho-ERK1/2 (cat.
no. Thr202/Tyr204) (cat. no. 28733-1-AP; 1:500; Proteintech Group,
Inc.) or GFP (cat. no. 66002; 1:3,000; Proteintech Group, Inc.),
together with GAPDH (cat. no. 60004; 1:3,000; Proteintech Group,
Inc.) or tubulin (cat. no. 66031; 1:3,000; Proteintech Group, Inc.)
as the housekeeping proteins for normalization. After incubation
with goat anti-mouse (cat. no. SA00001-1; 1:5,000; Proteintech
Group, Inc.) or goat anti-rabbit (cat. no. SA00001-2; 1:5,000;
Proteintech Group, Inc.) secondary antibodies at room temperature
for 1 h, protein bands were subsequently visualized using the
Immobilon Western Chemiluminescent HRP substrate (cat. no.
WBKLS0100; Merck KGaA).
Plasmid constructs
The overexpression vector was constructed by
amplifying ELP6 cDNA from 293T cells using PCR. PCR
amplification was performed with PrimeSTAR HS DNA polymerase (cat.
no. R010A; Takara Bio, Inc.) using the following primers: F,
5′-GGAATTCATGTTCGTGGAACTTAATAACC-3′ and R,
5′-AAGGTACCTCACAGAACAGCAGGAGACAT-3′. The following thermocycling
conditiona were used: 98°C for 2 min; 35 cycles of 98°C for 10 sec,
55°C for 15 sec, 72°C for 1 min and 72°C for 5 min. The PCR product
was separated on a 1% agarose gel (cat. no. 9012-36-6, Sangon
Biotech Co., Ltd.) stained with GeneRed (cat. no. RT211, Tiangen
Biotech Co., Ltd.), and the target band (~0.8 kb) was excised and
purified using a Gel Extraction Kit (cat. no. DP209-02; Tiangen
Biotech Co., Ltd.). Both the PCR product and the PEGFP-C2 plasmid
(Runyan Laboratory Reagents Co., Ltd.) were subsequently digested
with EcoRI (cat. no. 1040S; Takara Bio, Inc.) and
KpnI (cat. no. 1068S; Takara Bio, Inc.) enzymes. The
digested fragments were ligated together via T4 DNA ligase (cat.
no. 2011A; Takara Bio, Inc.) and transformed into competent
Eschericia coli DH5α cells (cat. no. 9027; Takara Bio,
Inc.). Positive transformants were selected on LB agar plates
containing 50 µg/ml kanamycin (cat. no. K8020; Beijing Solarbio
Science & Technology Co., Ltd.), and the resulting plasmid was
purified using the Rapid Plasmid Extraction Kit (cat. no. DP105-02;
Tiangen Biotech Co., Ltd.) according to the manufacturer's
protocol. Verification of the construct was achieved through
restriction enzyme digestion and Sanger sequencing (data not
shown), which confirmed the successful integration of ELP6
into the pEGFP-C2 plasmid. The p42-MAPK-pcDNA3.10V5-HisB plasmid
was obtained from Genewiz, Inc.
Cell transfection
The 293T or A375 cells were transfected with
Lipofectamine™ 2000 transfection reagent (cat. no. 11668019; Thermo
Fisher Scientific, Inc.) in accordance with the manufacturer's
instructions. Briefly, 293T or A375 cells were seeded to achieve
60–70% confluency prior to transfection. Plasmid DNA (2 µg/well in
6-well plates) or siRNA (50 nM final concentration) and the
transfection reagent, were separately diluted in Opti-MEM reduced
serum medium (cat. no. 31985070; Gibco; Thermo Fisher Scientific,
Inc.), mixed at a 1:3 ratio (DNA/siRNA : reagent), and incubated at
20°C for 20 min to form complexes. These complexes were then gently
added dropwise to the cells and swirled to ensure an even
distribution. After incubation at 37°C (5% CO2) for 4 h
(plasmid) or 24 h (siRNA), the medium was replaced with fresh
complete growth medium. The siRNA sequences used were as follows:
siNC sense, 5′-UUCUCCGAACGUGUCACGUTT-3′ and antisense,
5′-ACGUGACACGUUCGGAGAATT-3′; and lysyl tRNA synthetase (LysRS; T4)
sense, 5′-GGAGAAUGUAGCAACCACUUU-3′ and antisense,
5′-AGUGGUUGCUACAUUCUCCUU-3′. Cells were harvested for downstream
analyses at 24, 48 72 h post-transfection.
Virus preparation
Specific short hairpin RNA (shRNA) sequences
designed to target ELP6 were integrated into psi-LVRU6GP
vector backbones (GeneCopoeia, Inc.) using BamHI (cat. no.
1010S; Takara Bio, Inc.) and EcoRI (cat. no. 1040S; Takara
Bio, Inc.) restriction enzyme digestion, followed by ligation with
T4 DNA ligase (cat. no. 2011A; Takara Bio, Inc.). The integrity of
the construct was confirmed by Sanger sequencing (data not shown).
Subsequently, viruses were generated using 293T cells. Initially,
293T cells were cultured and expanded in 10-cm dishes to an
appropriate density. The constructed shRNA vector was transfected,
along with the helper virus packaging vectors pMD2.G and psPAX2
(Runyan Laboratory Reagents Co., Ltd.), into 293T cells using
Lipofectamine™ 2000 transfection reagent (cat. no. 11668019; Thermo
Fisher Scientific, Inc.). The transfected cells were incubated at
37°C for 48 h to facilitate virus production, after which the
culture supernatant was collected. Finally, the virus was stored at
−80°C for subsequent experiments. The shRNA sequences used are
listed in Table I.
 | Table I.shRNA sequences. |
Table I.
shRNA sequences.
| shRNA | Sequence
(5′-3′) |
|---|
|
H-ELP6-psi-shRNA-1 | S:
GATCCGCTTTCTCTCCTTCTATCTCAATCAAGAGTTGAGATAGAAGGAGAGAAAGTTTTTTGG |
|
| AS:
AATTCCAAAAAACTTTCTCTCCTTCTATCTCAACTCTTGATTGAGATAGAAGGAGAGAAAGCG |
|
H-ELP6-psi-shRNA-2 | S:
GATCCGGAAACTGACTCTACTCTGTGATCAAGAGTCACAGAGTAGAGTCAGTTTCTTTTTTGG |
|
| AS:
AATTCCAAAAAAGAAACTGACTCTACTCTGTGACTCTTGATCACAGAGTAGAGTCAGTTTCCG |
|
H-ELP6-psi-shRNA-3 | S:
GATCCGCAGTCATCAGAGCCATCTGATTCAAGAGATCAGATGGCTCTGATGACTGTTTTTTGG |
|
| AS:
AATTCCAAAAAACAGTCATCAGAGCCATCTGATCTCTTGAATCAGATGGCTCTGATGACTGCG |
| Non-targeting
sequence | S:
GATCCGGCTTCGCGCCGTAGTCTTATCAAGAGTAAGACTACGGCGCGAAGCTTTTTTGG |
|
| AS:
AATTCCAAAAAAGCTTCGCGCCGTAGTCTTACTCTTGATAAGACTACGGCGCGAAGCCG |
Establishing stable cell lines via
lentiviral infection
Following the transfection of 293T and A375 cells
with a lentivirus targeting ELP6, the cells were allowed to
incubate for 24 h to facilitate viral infection. The infected cells
were subsequently selected using puromycin antibiotic resistance
(1.5 µg/ml; cat. no. p8230; Beijing Solarbio Science &
Technology Co., Ltd.). This selection process was maintained for 2
weeks to establish stable cell lines, including shCtrl, shELP6-2
and shELP6-3 in 293T cells, as well as shCtrl and shELP6 in A375
cells. Characterization of these cell lines, aimed at confirming
the expression of the ELP6 gene, was conducted through qPCR
analysis as aforementioned.
Cell cycle analysis
shCtrl and shELP6 A375 cells (generated by
lentiviral-mediated stable ELP6 knockdown as aforementioned) were
seeded into T25 flasks at a density of 1×10⁶ cells per
flask. After overnight culture, cells were serum-starved in
serum-free medium for 24 h, followed by stimulation with complete
medium containing 10% FBS for another 24 h. Cells were harvested
with 0.25% trypsin (cat. no. 12604013; Gibco; Thermo Fisher
Scientific, Inc.), washed twice with phosphate-buffered saline
(PBS; cat. no. C10010500BT; Gibco; Thermo Fisher Scientific, Inc.),
and fixed in 75% ice-cold ethanol at 4°C for 12 h. Fixed cells were
washed with PBS, treated with 100 µg/ml RNase A (cat. no.
9001-99-4; Beijing Solarbio Science & Technology Co., Ltd.) at
37°C for 30 min to digest RNA and then stained with 50 µg/ml
propidium iodide (PI) (cat. no. 25535-16-4; Beijing Solarbio
Science & Technology Co., Ltd.) in the dark at 4°C for 30 min
for DNA quantification. For flow cytometric analysis, a FACSVerse
flow cytometer (BD Biosciences) equipped with PI fluorescence
captured was used, and cell cycle distribution (G0/G1, S, G2/M
phases) was quantified using ModFit LT software (version 4.0.5;
Verity Software House, Inc.).
Statistical analysis
All experiments were independently conducted at
least three times. Data were expressed as mean ± SEM. Statistical
comparisons were performed using the two-tailed unpaired student's
t-test for two-group analyses. For multi-group comparisons, one-way
ANOVA was applied followed by Tukey's test or Dunnett's test.
Non-normally distributed data were analysed with Wilcoxon paired
signed-rank test. P<0.05 was considered to indicate a
statistically significant difference.
Results
ELP6 is highly expressed in SKCM
Previous investigations have demonstrated the
growth-promoting effects of ELP subunits in sonic hedgehog-related
medulloblastoma (15), brain cancer
(16), breast cancer (17) and lung cancer (18). The present study investigated the
potential anticancer activities of ELP subunits in SKCM. Using the
GEPIA database, systematic examination of whether the mRNA
expression levels of ELP subunits (including ELP1-6) were altered
in various types of cancer was conducted. Compared with that in
normal tissues, the mRNA expression levels of ELP1, ELP2,
ELP3 and ELP4 in SKCM remained unchanged (Fig. 1A-D). By contrast, when the same
criteria were used, the expression levels of ELP5 and
ELP6 SKCM were significantly increased compared with that in
normal tissues (Fig. 1E and F).
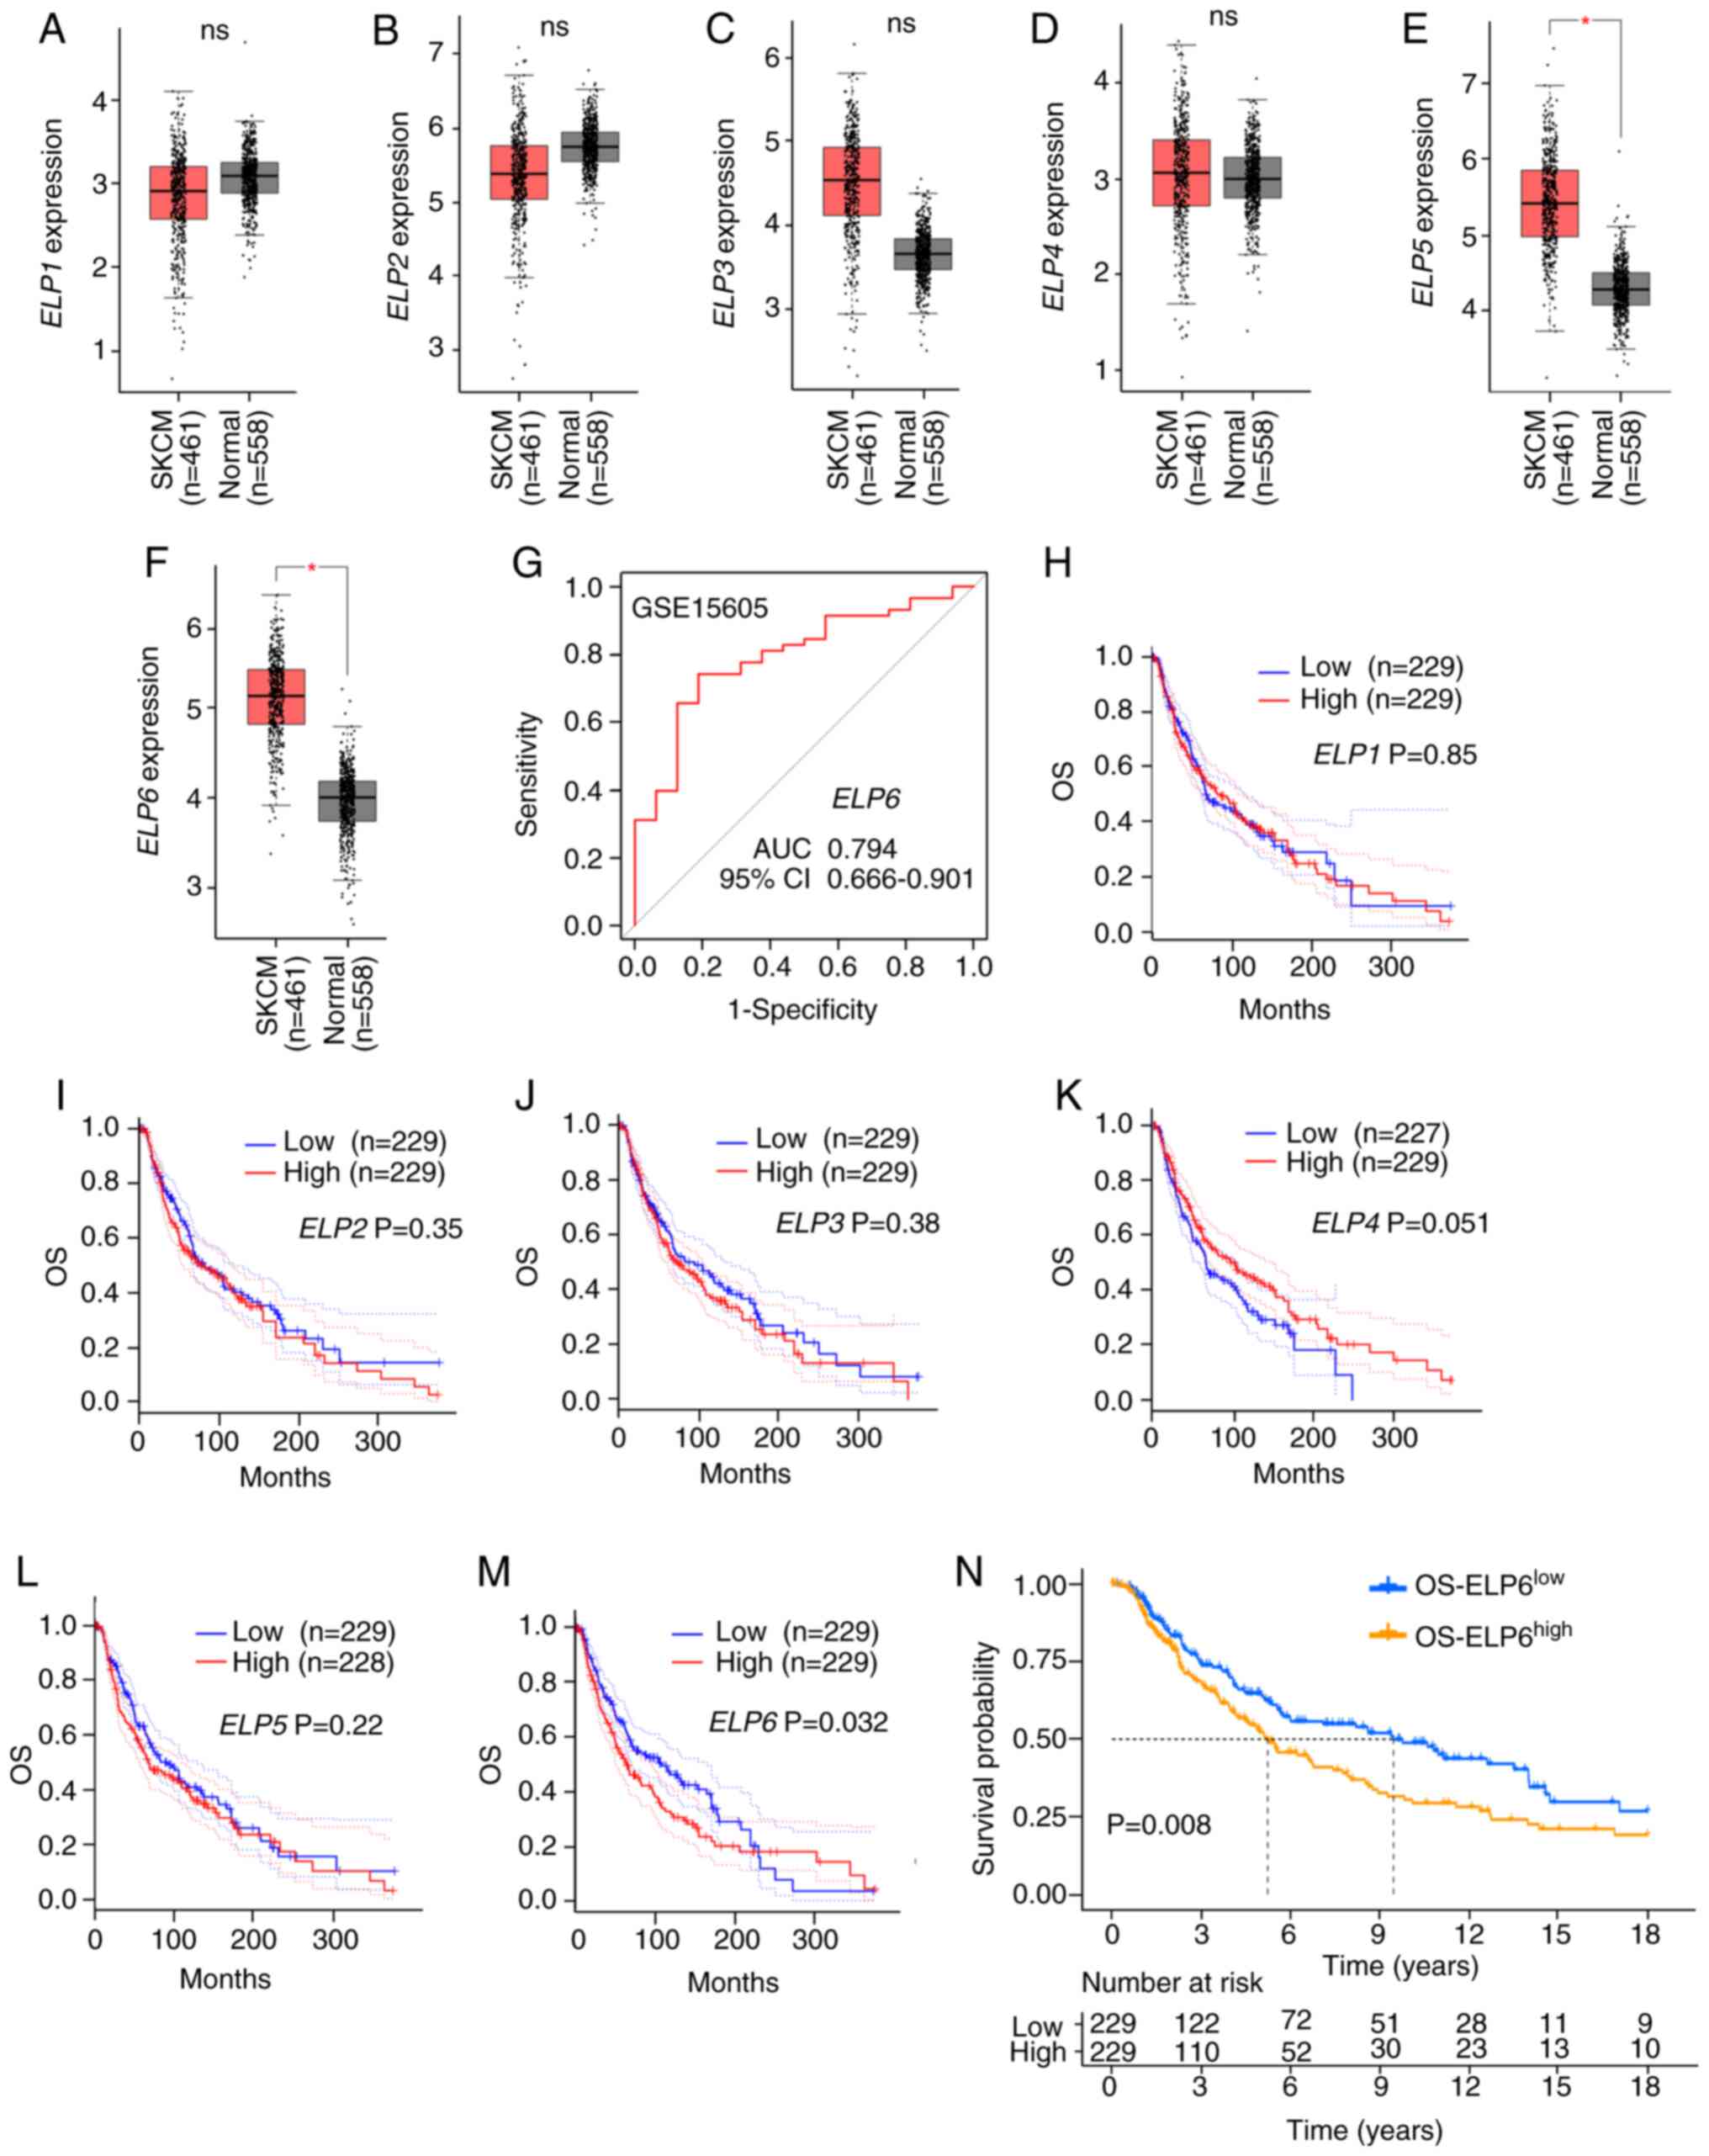 | Figure 1.Prognostic impact of ELP1, ELP2,
ELP3, ELP4, ELP5 and ELP6 expression levels in patients
with SKCM. The transcriptional levels of (A) ELP1 (ns), (B)
ELP2 (ns), (C) ELP3 (ns), (D) ELP4 (ns), (E)
ELP5 (*P<0.05) and (F) ELP6 (*P<0.05) in the
normal (grey) and SKCM (red) groups according to the GEPIA
database. (G) The predictive performance of ELP6 to distinguish
between normal and SKCM samples was high, demonstrated using the
GSE15605 dataset. (H-M) Kaplan-Meier plotter analysis of OS rates
between patients with SCKM stratified into the following groups:
(H) ELP1high and ELP1low, (I)
ELP2high and ELP2low, (J) ELP3high
and ELP3low, (K) ELP4high and
ELP4low, (L) ELP5high and ELP5low
and (M) ELP6high and ELP6low, according to
GEPIA data. (N) The Kaplan-Meier survival curves by ELP6
transcript levels in patients with TCGA-SKCM (n=458). ELP6,
elongator acetyltransferase complex subunit 6; SKCM, skin cutaneous
melanoma; GEPIA, Gene Expression Profiling Interactive Analysis;
GSE, gene set enrichment; OS, overall survival; ns, not
significant. |
Next, the potential impact of increased expression
levels of ELP subunits on clinical outcomes was examined. Using
transcriptomic data from the GEO database (dataset accession no.
GSE15605), receiver operating characteristic curve analysis
demonstrated that ELP6 expression levels significantly
distinguished SKCM samples from normal tissues, with an area under
the curve of 0.794 (95% CI, 0.666–0.901) (Fig. 1G). Using the GEPIA database to
generate Kaplan-Meier curves, it was determined that increased mRNA
expression levels of ELP1, 2, 3, 4 and 5 did not have
a significant effect on the prolonged time to recurrence or death
(Fig. 1H-L). However, increased
expression levels of the specific subunit ELP6 were significantly
associated with shorter overall survival (OS) in patients with SKCM
(Fig. 1M), whereas increased
ELP6 expression levels had no significant impact on
disease-free survival (Fig. S1A).
The survival analysis from the GEPIA database (Fig. 1M) showed lower survival rates
between 100 to 200 months, followed by a reversal of survival
trends between 250 to 300 months. To account for this,
transcriptome profiling data was utilized with complete clinical
information from the TCGA-SKCM cohort, which includes patients with
SKCM categorized into two groups based on the median expression
level of ELP6: OS-ELP6high (n=229) and
OS-ELP6low (n=229). To further refine the analysis, the
follow-up period was restricted to the first 18 years (216 months).
The truncated analysis still demonstrated significant survival
differences (Fig. 1N; P<0.05),
with higher ELP6 expression levels being associated with
poorer prognosis and a shorter median OS in patients with SKCM.
When comparing OS across different stages, ELP6 expression
levels were closely associated with poorer OS in both stage 0/I/II
(Fig. S1B) and stage III/IV groups
(Fig. S1C). Moreover, subgroup
analysis based on sex demonstrated that elevated ELP6
expression levels were significantly associated with worse OS
specifically in male patients with SKCM (Fig. S1D and E).
To investigate the underlying causes of the abnormal
expression of ELP6, the cBioPortal database was utilized to
analyse the mutation rates of ELP1, ELP2, ELP3, ELP4, ELP5
and ELP6 in TCGA-SKCM (PanCancer Atlas) in 363 SKCM samples.
As shown in Fig. S2A, the
incidence of mutations in ELP1-6 was markedly low in SKCM.
Notably, while the mutation rates in ELP1, ELP2, ELP3, ELP4
and ELP5 were 6.0, 2.8, 4.0, 2.2 and 2.2%, respectively,
ELP6 presented the lowest mutation rate at 1.4%, which
included four missense mutations and one amplification, suggesting
that there were no significant alterations in the sequence of
ELP6 that could account for its upregulation. Moreover,
associations between ELP6 expression levels and the sex or
age of patients with SKCM were explored using TCGA clinical
characteristics; however, no significant differences were detected
either between the ≥50 and <50 years of age groups, or between
males and females (Fig.
S2B-E).
Positive association between ELP6
expression levels and cell proliferation capability
To ascertain whether increased ELP6
expression contributed to SKCM progression, Gene Set Enrichment
Analysis (GSEA) was performed to predict potential mediators of its
effects. This analysis showed that cell cycle progression
pathways-driven by CDK1, E2F1-4, and PCNA-were
positively enriched (data not shown), suggesting that ELP6
may promote tumorigenesis by enhancing proliferative signalling. To
further validate this association, ELP6-knockdown clones were
generated in 293T cells using four different shRNAs: shCtrl,
shELP6-1, shELP6-2 and shELP6-3. The RNA knockdown efficiency
reached ~20 and 70% inhibition of ELP6 expression levels in
shELP6-2 and shELP6-3 cells, respectively (Fig. 2A), whereas no significant changes
were observed in shELP6-1 (data not shown). Therefore, shELP6-2 and
shELP6-3 were selected for the CCK-8 assay. ELP6 knockdown
led to a significant reduction in cell viability (Fig. 2B and C). Given the significant
inhibitory effects observed with shELP6-3, shELP6-3 was used to
establish stable ELP6 knockdown clones in A375 cells and in
SK-MEL-2 cells, denoted as shELP6-A375 (Fig. 2D) and shELP6-SK-MEL-2 (Fig. S3A). Consistent with these results,
ELP6 suppression led to a significant reduction in the
proliferation rate, as demonstrated by the CCK-8 assay (Figs. 2E and S3B).
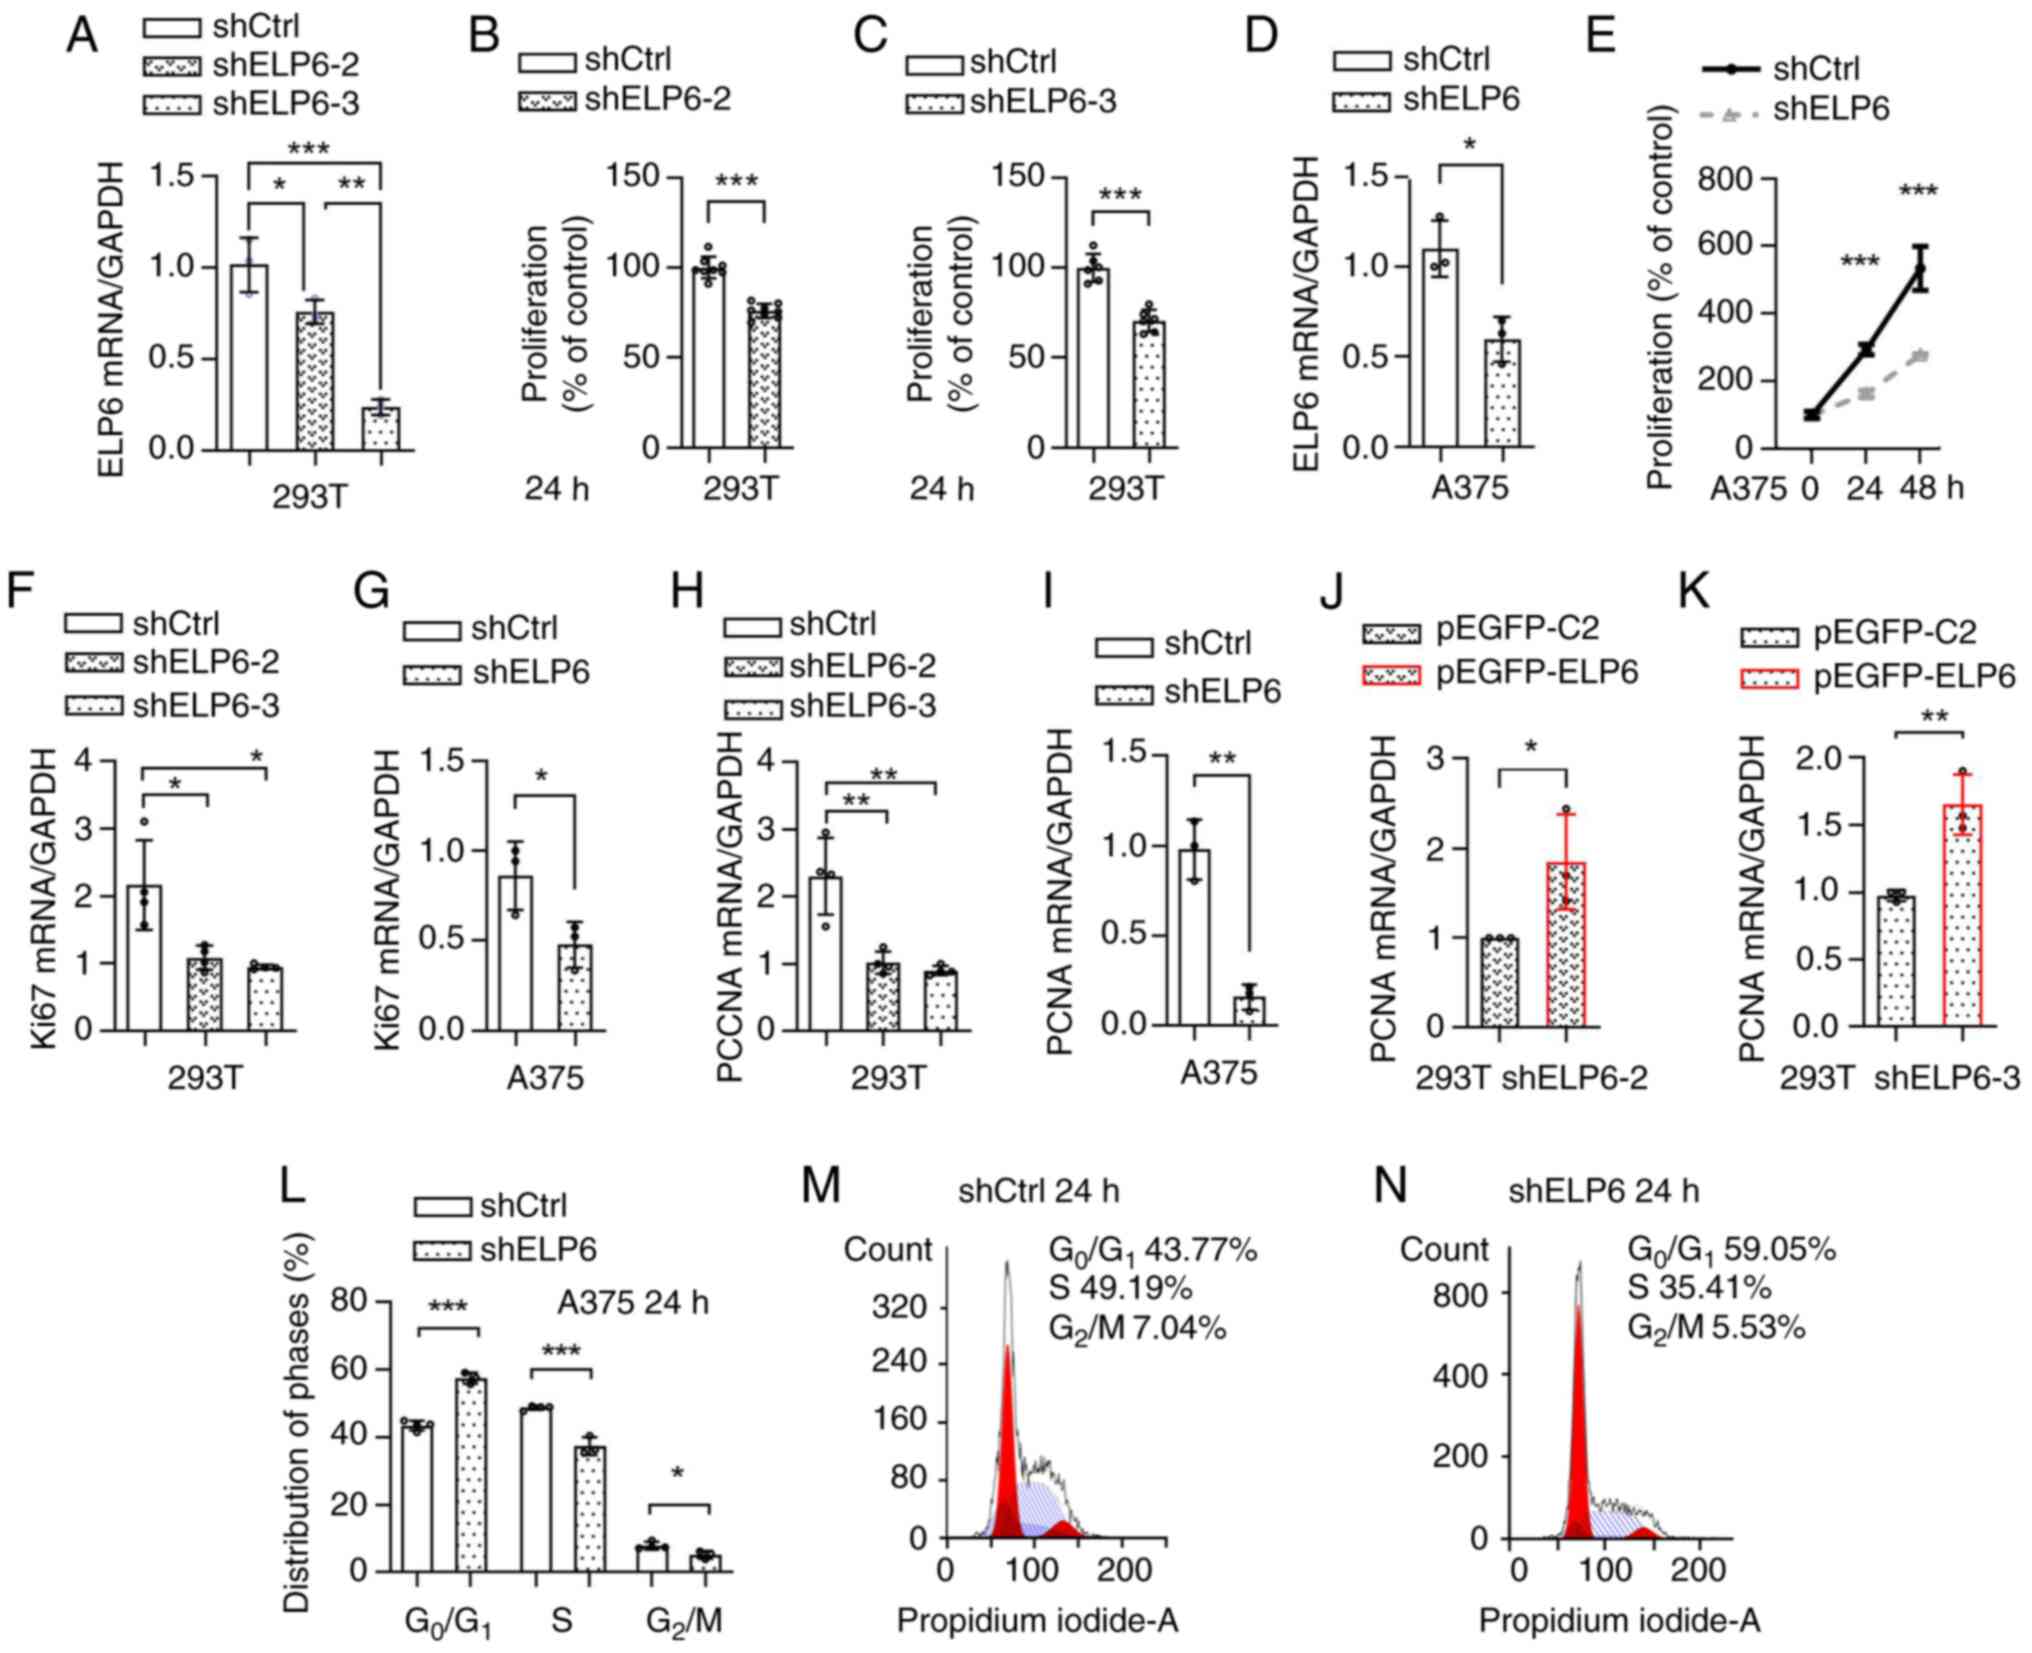 | Figure 2.ELP6 is essential for driving
SKCM progression. (A) ELP6 knockdown efficiencies were assessed in
293T cells using two independent shRNAs, shELP6-2 and shELP6-3. The
viability of shCtrl, (B) shELP6-2 and (C) shELP6-3 cells was
assessed at 0 and 24 h. (D) ELP6 knockdown efficiency using shELP6
was assessed in A375 cells. (E) The viability of shCtrl and shELP6
A375 cells was assessed at 0, 24 and 48 h. The relative mRNA
expression levels of Ki67 (F and G) and PCNA (H and I) were
evaluated in shCtrl, shELP6-2 and shELP6-3 293T cells, as well as
in shELP6 A375 cells. The levels of PCNA mRNA expression levels
were evaluated in (J) shELP6-2 and (K) shELP6-3 cells after
transfection with either the pEGFP-C2 or pEGFP-ELP6 plasmid. (L)
Cell cycle distribution was analysed using flow cytometry, and the
percentage of cells in each phase of the cell cycle was calculated.
(M) shCtrl and (N) shELP6 A375 cells were exposed to 10% serum for
24 h, followed by staining with propidium iodide. *P<0.05; **P
<0.01; ***P<0.001. ELP6, elongator acetyltransferase complex
subunit 6; SKCM, skin cutaneous melanoma; sh, short hairpin; m,
messenger; Ctrl, control; PCNA, proliferating cell nuclear
antigen. |
In response to uncontrolled proliferation
conditions, cells can experience excessive activation of both Ki67
(32) and PCNA (33,34).
Therefore, the mRNA expression levels of Ki67 (Fig. 2F and G) and PCNA (Fig. 2H and I) were analysed in stable cell
lines with varying levels of ELP6 expression. Downregulation
of Ki67 and PCNA mRNA expression levels in the shELP6-2, shELP6-3
and shELP6 cell lines were observed, compared with their respective
controls. To further confirm the role of ELP6 expression in
tumour progression, a GFP-tagged ELP6 plasmid was constructed and
transiently transfected into both the shELP6-2 and shELP6-3 cell
lines, in which ELP6 was silenced as aforementioned. The
reintroduction of ELP6 resulted in a significant increase in
PCNA mRNA expression levels (Fig. 2J
and K; Fig. S3C), providing
evidence that ELP6-mediated tumour promotion is linked to
cell proliferation.
Next, the impact of ELP6 on the re-entry of
quiescent A375 cells into the cell cycle when stimulated with serum
was assessed. After a 24 h incubation of both shELP6 and shCtrl
cells with FBS, flow cytometry was used to assess the cells ability
to progress through the G1 phase (Fig. 2L-N). shELP6 cells predominantly
experienced a G1 arrest, with only a limited number of
cells advancing to the first S phase and reaching G2/M
phases. By contrast, the control cells exhibited a greater
propensity to enter the G1 phase. Therefore, the absence
of ELP6 prevented FBS-stimulated cell cycle re-entry,
leading to the arrest of A375 cells in the G1 phase.
ELP6 drives proliferation via the
ERK1/2 pathway
Given the frequent activation of the RAS-BRAF-ERK1/2
pathway in melanoma and the analogous impact on the cell cycle
observed with alterations in pathway activity (35), as observed with ELP6-mediated
changes, it was investigated whether the RAS-BRAF-ERK1/2 pathway
mediated ELP6-induced cell proliferation. In ELP6-deficient
cells, a marked reduction in both total and phosphorylated p42 MAPK
levels in 293T (Fig. 3A) and A375
(Fig. 3B) cells was observed, while
total p42 MAPK levels were also significantly lower in SK-MEL-2
cells compared with that in the control cells (Fig. S3D). ERK phosphorylation efficiency
(p-p42/total p42) remained unchanged in knockdown cells. However,
both total and phosphorylated ERK levels (normalized to either
GAPDH or tubulin) decreased correspondingly (P<0.01; Fig. 3C and D), demonstrating that reduced
ERK protein abundance drives the decline in active signaling
molecules. qPCR analysis was used to assess the mRNA expression
levels of p42 MAPK and p44 MAPK in both the ELP6-normal and the
ELP6-silenced cell lines (Fig. 3E and
F). A significant decrease in the expression levels of both p42
MAPK and p44 MAPK in A375 cells following ELP6 silencing was
demonstrated (Fig. 3F). By
contrast, while p44 MAPK expression levels remained stable, there
was a notable increase in p42 MAPK expression levels in
ELP6-silenced 293T cells compared with their respective parental
lines (Fig. 3E).
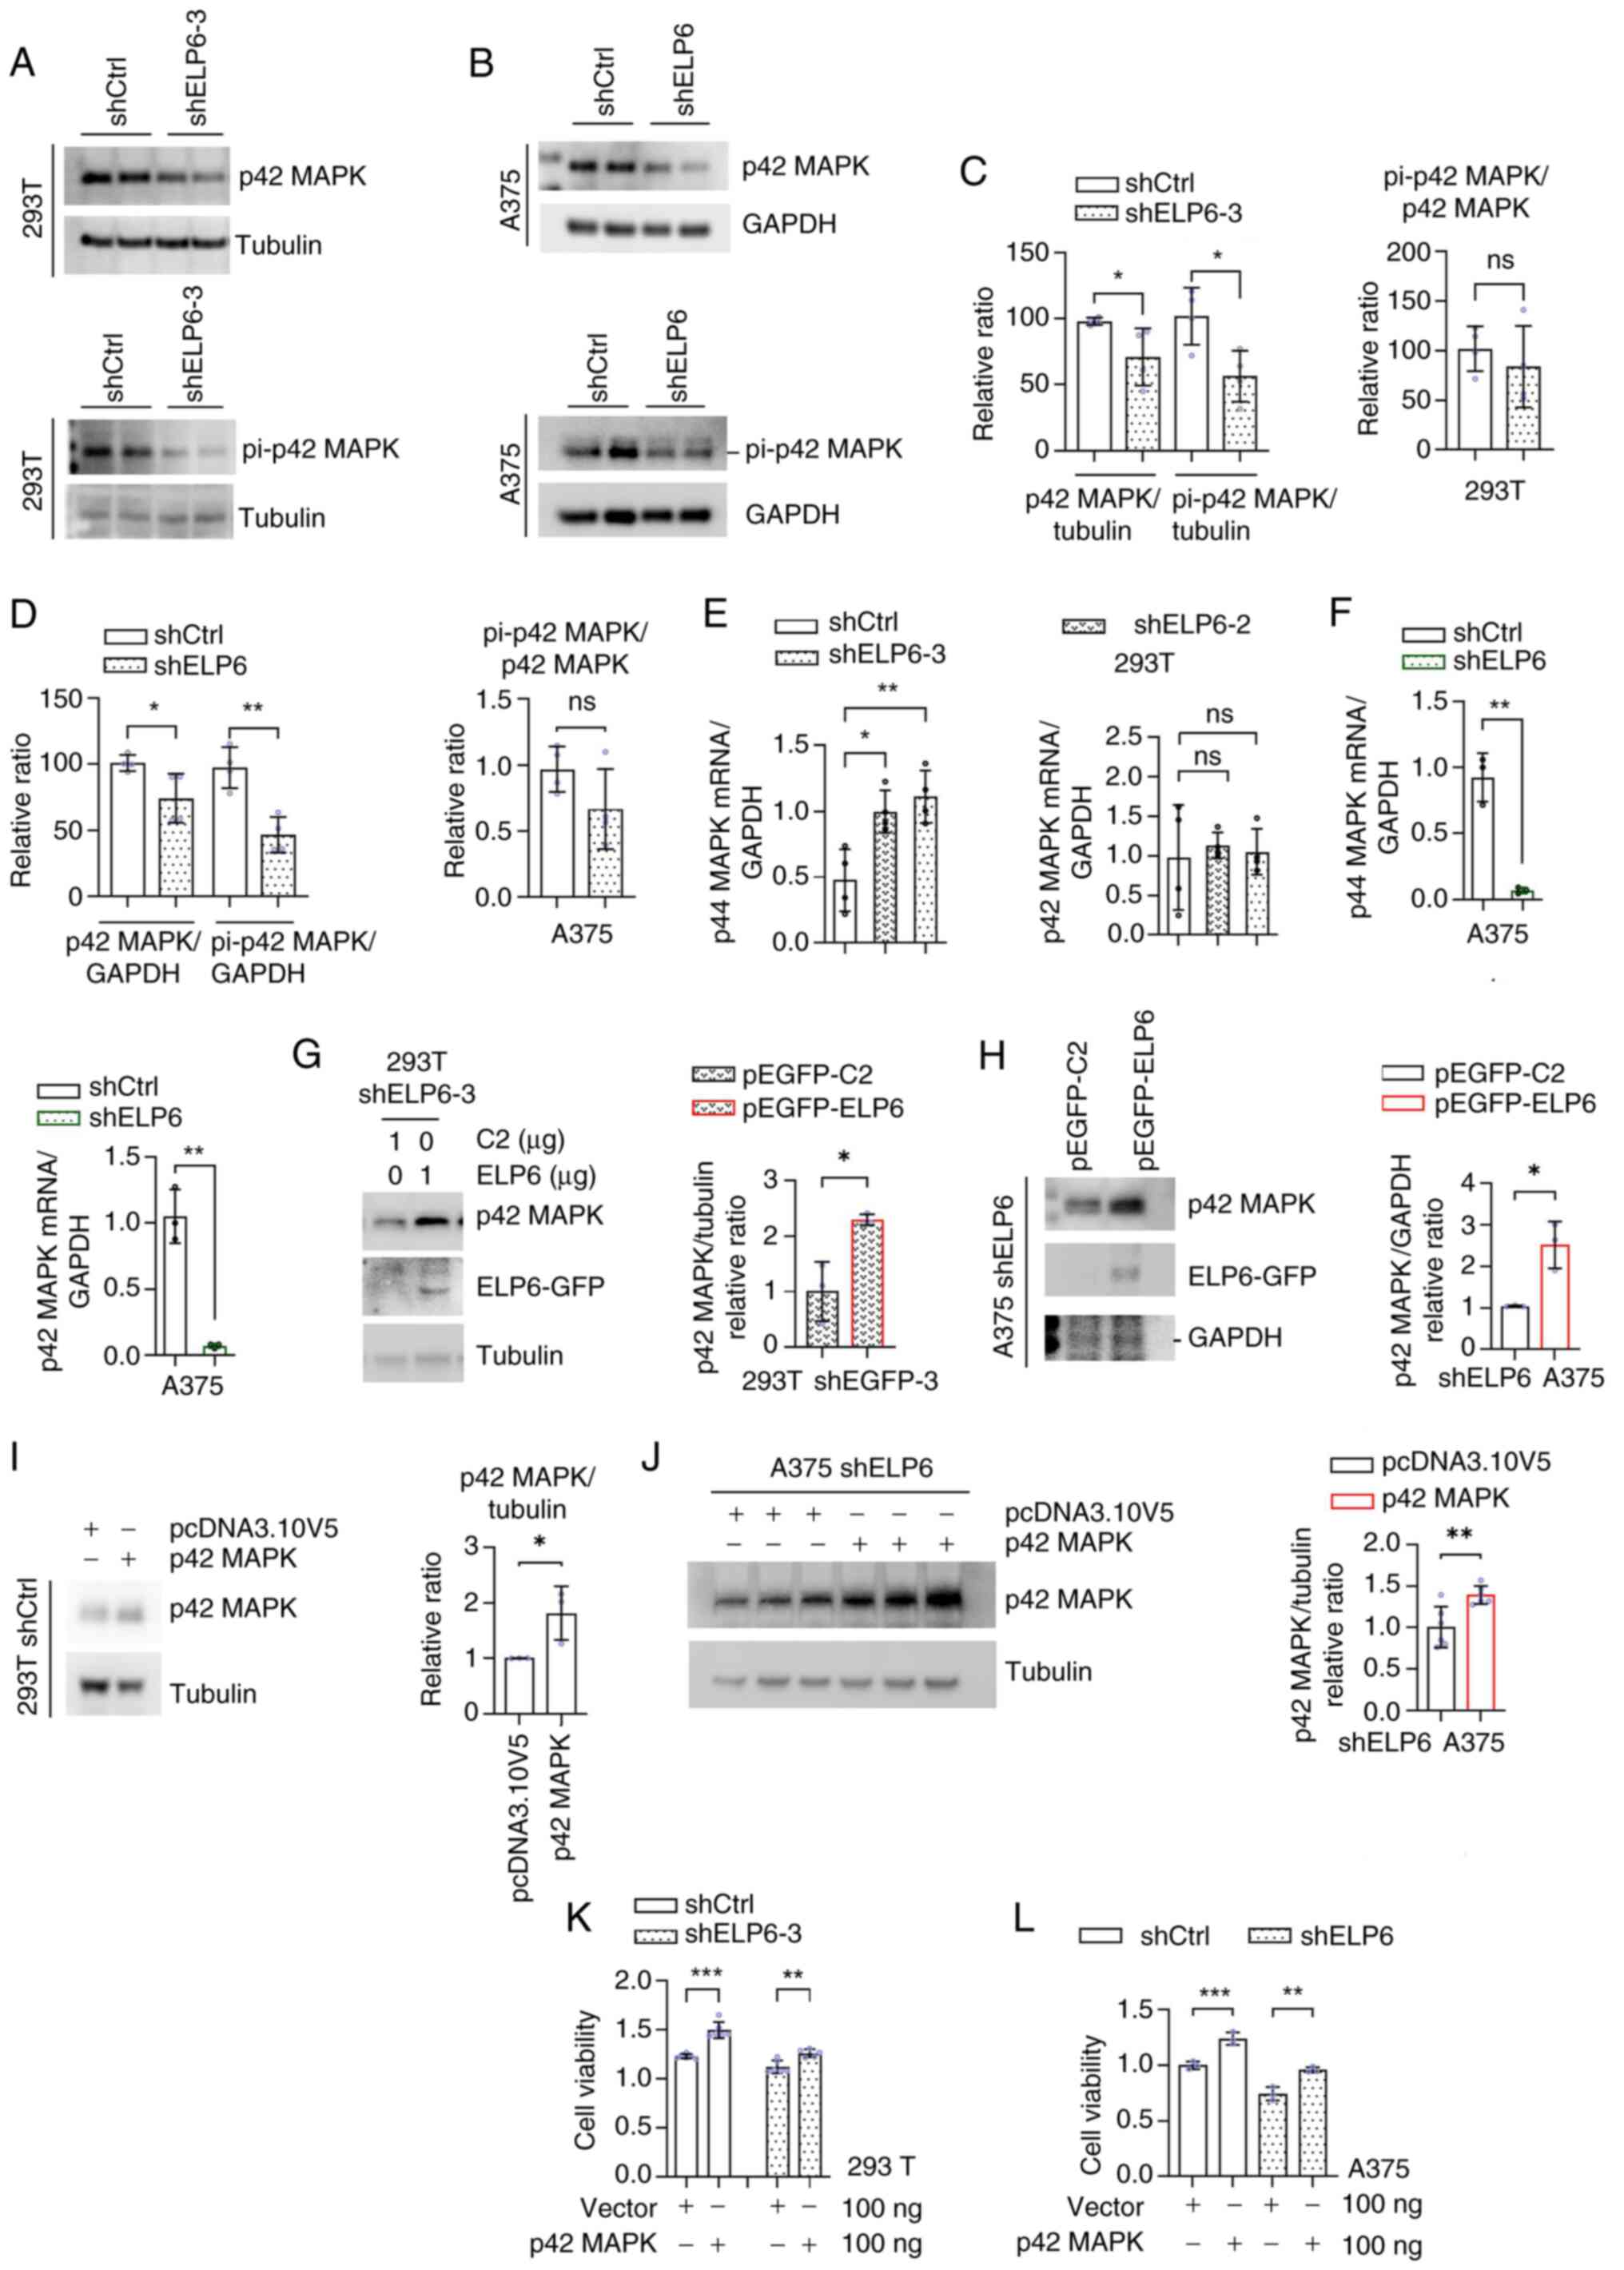 | Figure 3.p42 MAPK serves a key role in
mediating the proliferative effects induced by ELP6 in SKCM.
Western blot analysis in shCtrl, (A) shELP6-3 293T and (B) shELP6
A375 cells of p42 MAPK or pi-p42 MAPK (Thr202/Tyr204) expression
levels. (C and D) Quantification of p42 MAPK or pi-p42 MAPK
(Thr202/Tyr204) protein expression levels. mRNA expression levels
of p44 MAPK and p42 MAPK, normalized to the GAPDH, in the shCtrl,
(E) shELP6-2, shELP6-3 293T and (F) sh-ELP6 A375 cells. Western
blot analysis of ELP6-GFP, tubulin and p42 MAPK in (G) shELP6-3
293T and (H) shELP6 A375 cells transfected with either the pEGFP-C2
or pEGFP-ELP6 plasmids, with quantification of p42 MAPK protein
expression levels. pcDNA3.10V5-HisB or p42 MAPK-pcDNA3.10V5-HisB
transfected into shCtrl, (I) shELP6-3 293T and (J) shELP6 A375
cells were subject to western blot analysis of p42 MAPK expression
levels and (K and L) cell viability assays under the same treatment
conditions. *P<0.05; **P<0.01; ***P<0.001. ELP6, elongator
acetyltransferase complex subunit 6; ns, not significant; pi,
phosphorylated; SKCM, skin cutaneous melanoma; sh, short hairpin;
Ctrl, control. |
Next, to gain insight into the influence of
ELP6 on p42 MAPK protein regulation, a GFP-tagged
ELP6 plasmid was introduced into the 293T and A375 cell
lines. Transfection of the shELP6-3 293T and shELP6 A375 cells with
the GFP-tagged ELP6 plasmid resulted in a marked increase in total
p42 MAPK levels, suggesting a positive relationship between ELP6
and p42 MAPK (Fig. 3G and H).
Additionally, conditions without viral infection (Fig. S4) and conditions with viral
infection but without ELP6 knockdown were examined.
Transfection with pEGFP-ELP6 increased p42 MAPK protein expression
regardless of viral infection or ELP6 knockdown status (data not
shown). To further investigate whether ELP6 expedited cell
proliferation by increasing p42 MAPK activity, a HisB-tagged p42
MAPK plasmid was constructed and both western blot analysis and a
CCK-8 assay on treated cells were conducted. A substantial increase
in the intracellular p42 MAPK protein level in 293T and A375 cells
upon transfection with the p42 MAPK plasmid (Fig. 3I and J). Moreover, reinstating p42
MAPK expression levels promoted proliferation in both the
ELP6-disrupted cells and the control cells (Fig. 3K and L). These findings collectively
underscored the pivotal contribution of p42 MAPK to ELP6-induced
cell proliferation.
Given the consistent modulation of p42 MAPK protein
levels and the distinct patterns of altered mRNA expression caused
by changes in ELP6 levels across both cell lines, it was
hypothesized that ELP6 may influence p42 MAPK through
posttranscriptional regulation, such as by affecting the RNA
translation efficiency or protein degradation rates. To investigate
this, 293T and A375 cells were treated with CHX, a eukaryotic
protein synthesis inhibitor that selectively binds to ribosomes and
inhibits eEF2 mediated translocation. CHX treatment resulted in a
notable decrease in p42 MAPK protein levels at 16 and 24 h in
shCtrl 293T and A375 cells, respectively (Fig. 4A-D). However, no significant effect
was observed in cells with silenced ELP6 at 16 and 24 h, suggesting
that the absence of ELP6 in cells slowed the degradation rate of
the p42 MAPK protein. This finding suggested that protein
degradation speed might not be the primary factor contributing to
the decrease in p42 MAPK protein levels caused by ELP6
deficiency.
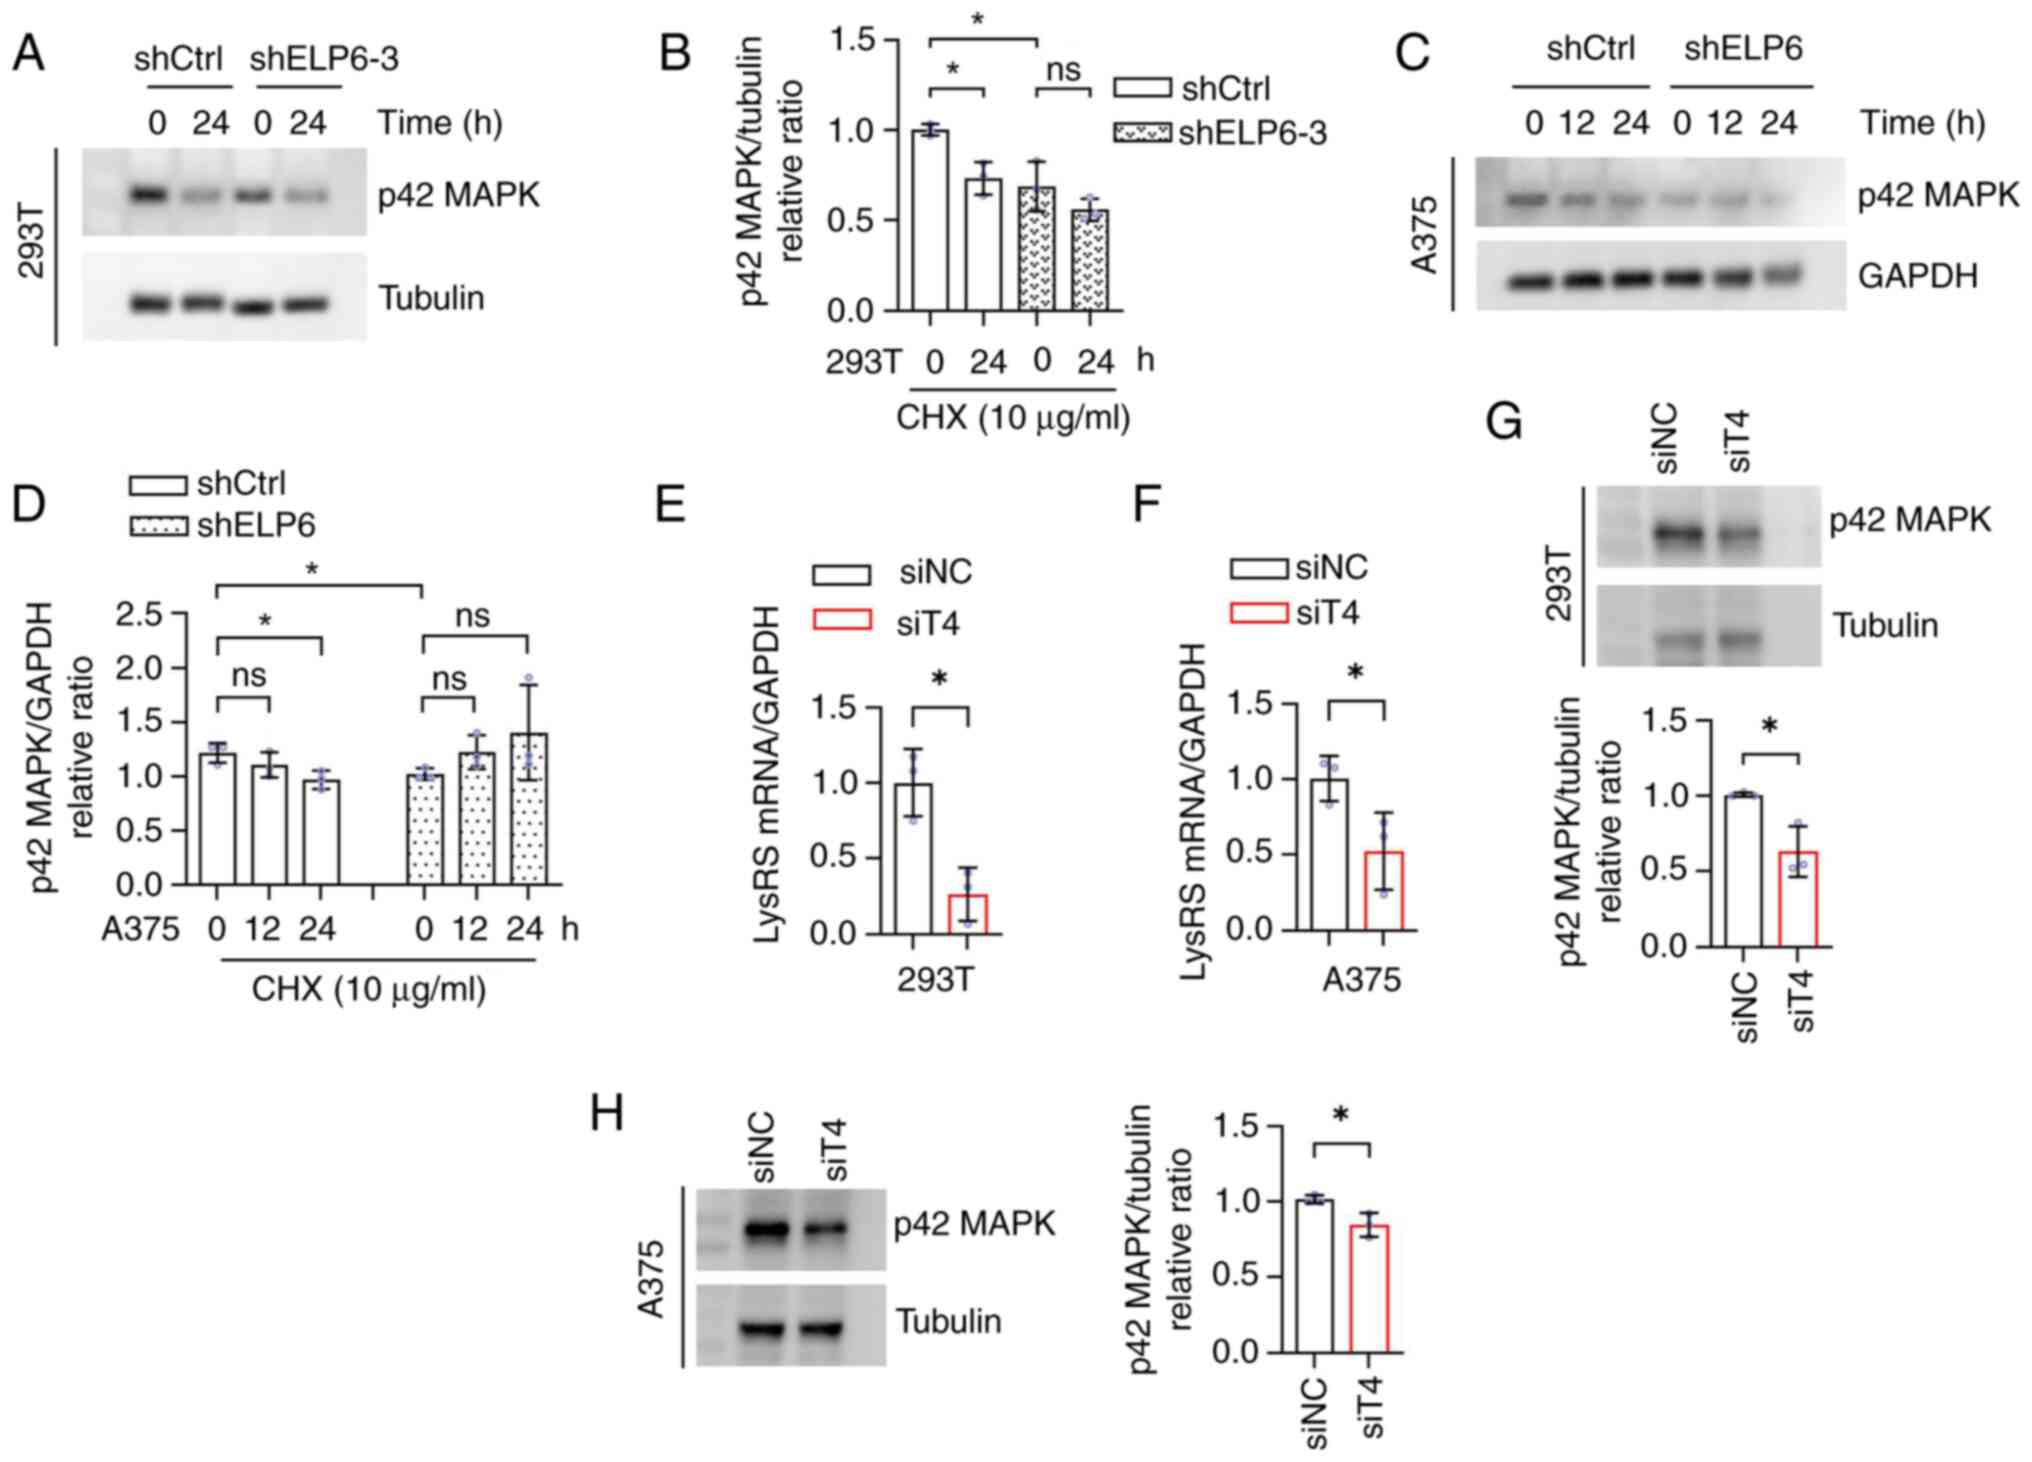 | Figure 4.ELP6 stimulates p42 MAPK at the
post-transcriptional level. (A) shCtrl and shELP6-3 293T cell lines
were treated with CHX followed by western blotting for p42 MAPK and
tubulin, quantified in (B). (C) shCtrl and shELP6 A375 cells lines
were similarly treated, followed by western blotting for p42 MAPK
and GAPDH, quantified in (D). The (E) 293T and (F) A375 cell lines
were treated with siT4 or siNC and mRNA expression levels of LysRS,
normalized to the GAPDH, were determined to detect knockdown
efficiencies. p42 MAPK protein expression levels, normalized to
tubulin, were determined in the (G) 293T and (H) A375 cell lines
treated with siT4 or siNC. *P<0.05. ns, not significant; NC,
negative control; t, transfer; sh, short hairpin; si, silencing;
LysRS, lysyl tRNA synthetase; ELP6, elongator acetyltransferase
complex subunit 6; SKCM, skin cutaneous melanoma; Ctrl, control;
CHX, cycloheximide; siT4, LysRS siRNA. |
By modifying the wobble base, U34, of tRNA and
disrupting codon-anticodon interactions, ELP6 has the potential to
induce ribosomal pausing specifically at CAA and AAA codons
(36), thereby impacting
translation efficiency. Consequently, it was hypothesized that ELP6
could inhibit p42 MAPK protein expression by modulating codon
translation rates. To investigate this possibility, qPCR was
initially conducted (Fig. 4E and
F), which demonstrated successful inhibition of newly
synthesized LysRS, an enzyme responsible for accurately pairing
lysine with the AAA codon during translation, upon silencing with
siRNA, which was consistent with prior findings (37). Notably, within the subgroup
exhibiting decreased production of newly synthesized cellular
LysRS, there was a concurrent decline in p42 MAPK protein
expression (Fig. 4G and H),
resembling the phenotype observed in ELP6 deficiency. These data
suggested that ELP6 regulated p42 MAPK through ribosomal
pausing.
ELP6 sensitizes melanoma to ERK1/2
pathway inhibitors
To investigate whether ELP6 affected the
antitumour effects of inhibitors targeting the RAF-MEK-ERK pathway,
the BRAF mutation status between patients with SKCM with high and
low ELP6 expression was compared. No significant difference in the
BRAF mutation rate between the two groups was observed (Fig. S5). The R software package,
pRRophetic (27), was used to
predict and calculate the sensitivity values of several drugs,
including the RAF inhibitors, AZ628 and sorafenib. A significant
trend was demonstrated in that patients with SKCM exhibiting higher
ELP6 levels displayed greater sensitivity to AZ628 and sorafenib
inhibitors compared with those with lower ELP6 levels (Fig. 5A and B). By contrast, when the
commercially available PI3K inhibitor BEZ235 and the P38 MAPK
inhibitor VX702 were examined, the opposite pattern was observed
(Fig. 5C and D).
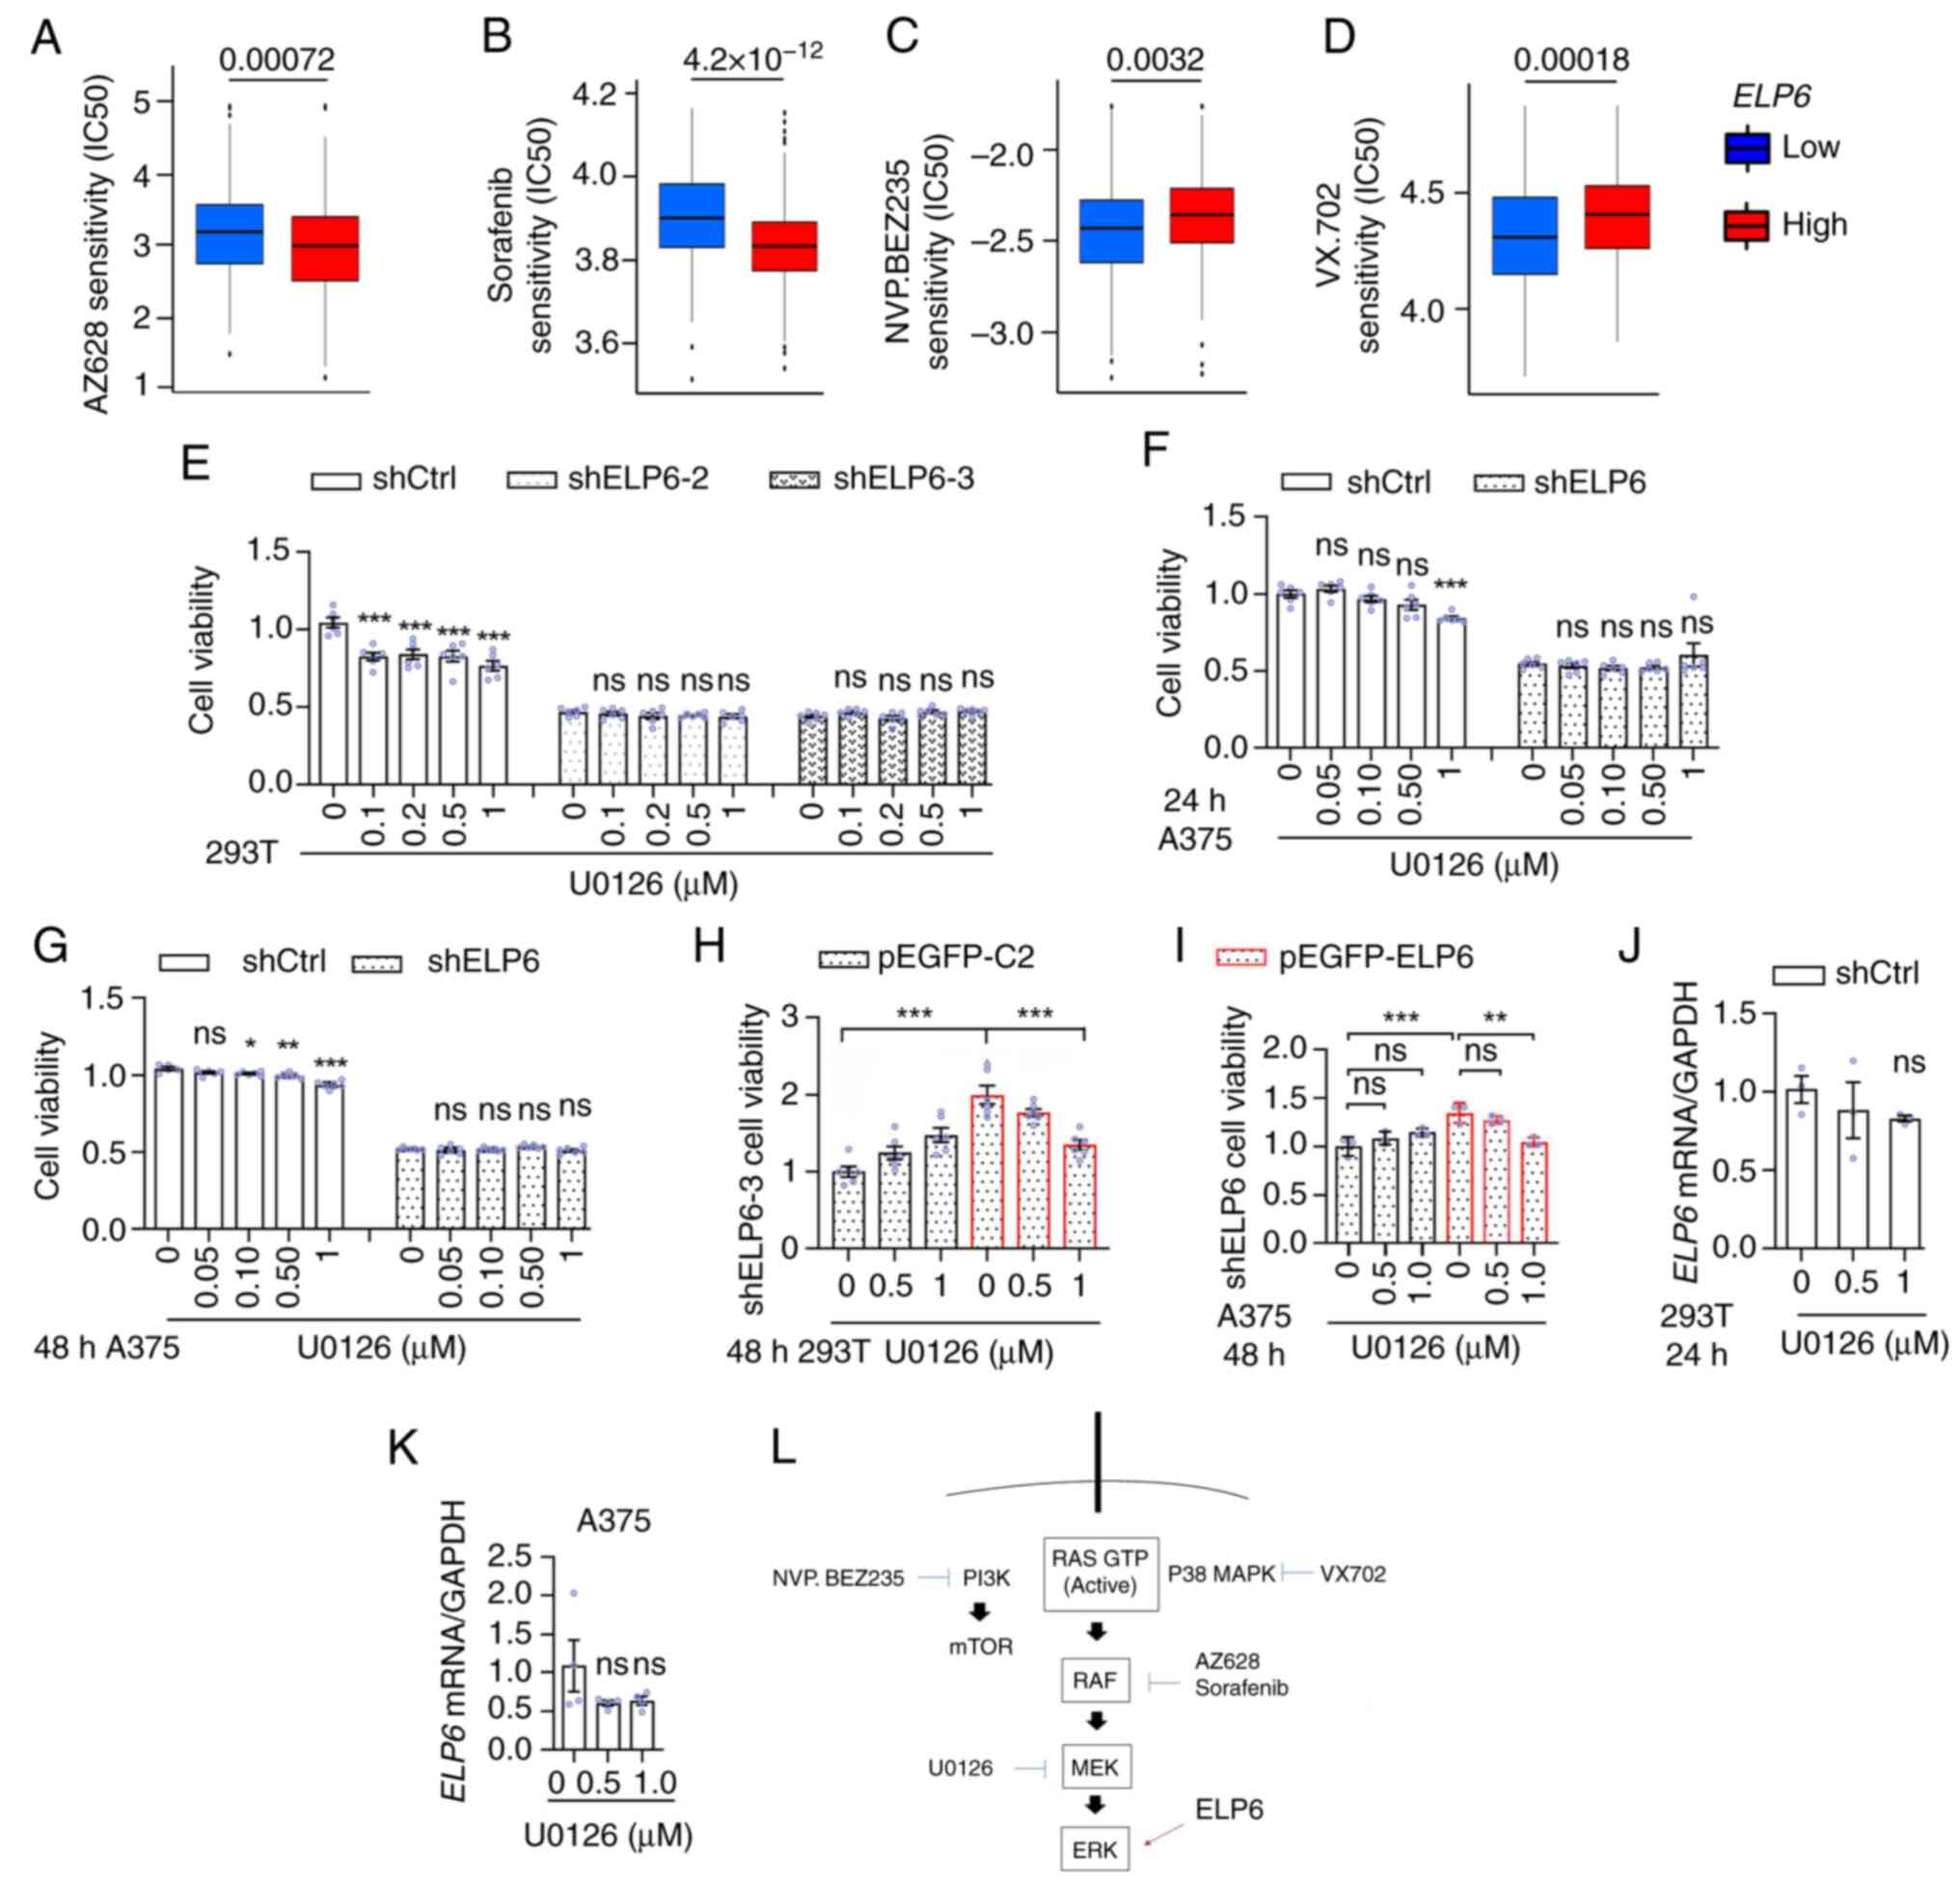 | Figure 5.ELP6 modulates drug
sensitivity in melanoma cell lines. Box plots of the predicted
clinical sensitivity of (A) AZ628, (B) Sorafenib, (C) NVP.BEZ235
and (D) VX702 in patients with SKCM categorized into
ELP6high (red) or ELP6low (blue) groups from
the The Cancer Atlas Genome database (n=468). (E) shCtrl, shELP6-2
and shELP6-3 293T cells were treated with U0126 for 0 and 48 h, and
CCK-8 assays were performed to measure cell viability. shCtrl and
shELP6 A375 cells were treated with U0126 for (F) 0, 24 and (G) 48
h, followed by a CCK-8 assay to assess cell viability. (H and I)
shELP6-3 293T and shELP6 A375 cell lines were transfected with
either the pEGFP-C2 or pEGFP-ELP6 plasmid, and treated U0126
for 48 h, followed by a CCK8 assay to evaluate cell viability.
shCtrl (J) −293T and (K) -A375 cells were treated with U0126 for 24
h, ELP6 mRNA levels expression levels, normalized to GAPDH, were
assessed. (L) Schematic illustrating the modulation of ERK1/2 by
ELP6. Data are presented as mean ± SEM. Error bars represent the
SEM and each point in the graph corresponds to an individual
sample. *P<0.05; **P<0.01; ***P<0.001. ns, not
significant; ELP6, elongator acetyltransferase complex subunit 6;
SKCM, skin cutaneous melanoma; Ctrl, control; CCK-8, cell counting
kit-8; Sh, short hairpin; SEM, standard error of the mean. |
Based on the aforementioned present findings which
demonstrated a positive association between ELP6 and p42
MAPK expression levels, coupled with the observation that patients
lacking ELP6 exhibit poor responses to drugs targeting the
RAF-MEK-ERK pathway, a possible explanation for this sensitivity
could be that patients lacking sufficient ELP6 have less active p42
MAPK protein compared with those with higher ELP6 expression
levels. To investigate this hypothesis, shCtrl, shELP6-2 and
shELP6-3 293T cells were treated with the MEK1/2 inhibitor U0126.
Growth inhibition assays demonstrated that the lack of ELP6
resulted in reduced sensitivity to U0126 (Fig. 5E). Notably, this diminished
responsiveness was consistent across different cell types, as
evidenced by similar trends observed in A375 cells lacking ELP6
(Fig. 5F and G) and SK-MEL-2 cells
(Fig. S6). Furthermore,
reintroduction of a GFP-tagged ELP6 plasmid restored the
sensitivity of shELP6-3 and shELP6 cells to U0126 (Fig. 5H and I). Short-term exposure to
U0126 did not significantly affect ELP6 mRNA levels
(Fig. 5J and K), suggesting that
ELP6 functioned as an upstream regulator of ERK1/2 and was not
promptly modulated by ERK1/2 activity. Taken together, these
findings suggested that ELP6 expression may have
contributed, at least in part, to the diminished response of
patients to RAF-MEK-ERK pathway inhibitors and highlighted its
potential as a biomarker for guiding therapy.
Discussion
Melanoma presents a significant global public health
challenge, contributing to 80% of skin cancer-related deaths due to
its aggressive metastatic behaviour (38). Reducing melanoma mortality and
improving patient responses to traditional chemotherapy remains
crucial priorities in global healthcare. Previous studies have
demonstrated the function of ELP6, a member of the elongator
complex, in promoting cancer proliferation (18,19,21).
For example, ELP6 has been shown to stabilize the elongator
complex, thereby enhancing the metastatic potential of melanoma
(24). In the present study,
bioinformatics analysis of the TCGA SKCM dataset (via the GEPIA
database) demonstrated that, among the elongator complex subunits,
ELP6 was the only subunit that was both significantly upregulated
in SKCM and closely associated with patient survival. However,
survival analysis from the GEPIA database revealed lower survival
rates between 100–200 months, followed by a reversal of survival
trends between 250–300 months. The GEPIA database uses the log-rank
test by default to assess survival curve differences, which assumes
proportional hazard rates. When survival curves cross over, as
observed between 250–300 months, this assumption is violated, which
can affect the stability of the statistical results. Additionally,
during the 250–300-month follow-up period, the number of patients
alive in each group was relatively small (~10 individuals), which
increases susceptibility to statistical fluctuations. The survival
or death of a small number of individuals can disproportionately
impact the survival curve. To address this issue, data were
downloaded from the TCGA database for further analysis. The
truncated analysis still showed significant survival differences.
Based on these findings, we suggested that elevated ELP6
expression levels may serve as a marker of SKCM progression and has
potential as a predictive biomarker for this cancer.
To further explore the underlying mechanisms, a
preliminary GSEA was conducted, which demonstrated enrichment in
the cell cycle signalling pathway. To investigate the potential
role of ELP6 in cell proliferation via cell cycle
regulation, 293T cells, known for their high transfection
efficiency (39), were used to
establish effective ELP6 knockdown during early experimental
stages. In vitro cellular experiments demonstrated that
ELP6 downregulation significantly impaired cell
proliferation, as indicated by a reduced expression of the
proliferation markers Ki67 and PCNA. To establish melanoma-specific
relevance despite the non-melanoma origin of 293T cells (40), these findings were validated in two
melanoma cell lines: A375 (BRAF V600E mutation) (28) and SK-MEL-2 (N-RAS mutation)
(29). It was demonstrated that
ELP6 knockdown consistently suppressed proliferation in both lines.
Furthermore, cell cycle analysis of A375 cells further demonstrated
that the loss of ELP6 led to an increased proportion of cells in
the G1/G0 phase. These findings suggest that
ELP6 deficiency causes cell cycle arrest in melanoma cells,
hindering the transition from the G1 to the S phase,
which may contribute to tumour development and progression.
BRAF V600E mutation (41), a hallmark driver in melanoma,
promotes tumorigenesis through hyperactivation of the intracellular
MAPK signalling cascade, wherein p42 MAPK critically regulates the
G0/G1 phase arrest. In the present study, it
was demonstrated that ELP6 controlled cell cycle progression
at the G1/G0 phase and tumour proliferation,
yet its potential interplay with p42 MAPK remained unexplored.
Therefore, whether ELP6 modulated both phosphorylated and
total p42 MAPK protein levels was explored by using ELP6 knockdown
models in melanoma A375 cells and non-melanoma 293T cells. Notably,
ELP6 depletion led to a significant reduction in both
phosphorylated and total p42 MAPK protein expression levels in both
cell lines. However, the regulatory effects on p42 MAPK mRNA
diverged between A375 cells (significant downregulation) and 293T
cells (no significant change). This discrepancy prompted the
present study to investigate whether ELP6 modulated p42 MAPK at the
post-transcriptional level. Using the protein synthesis inhibitor
CHX, a time dependent decline of total p42 MAPK levels was observed
in parental A375 cells, reaching statistical significance at 24 h.
However, in A375 cells with low ELP6 expression, no
statistically significant difference in p42 MAPK levels was
observed at 24 h. Thus, it could be considered that the
downregulation of ELP6 in melanoma cell lines led to a
decrease in the p42 MAPK protein, resulting in cell cycle arrest
and reduced cell proliferation, a process not driven by accelerated
protein degradation. Nevertheless, it is currently unclear if
ELP6 specifically governs the translation termination
fidelity of p42 MAPK, which is sensitive to translation termination
control by ELP6 during ribosomal pausing, while the
translation termination of other genes such as GAPDH or tubulin are
not significantly changed, which requires further
investigation.
Given the high prevalence of RAF mutations in
melanoma (41), significant efforts
have been made to develop RAF-MEK-ERK pathway inhibitors for
effective melanoma treatment (42).
However, the therapeutic responses observed in certain patients may
be partially attributed to individual genetic heterogeneity.
Consequently, understanding these resistance mechanisms holds
promise for improving the clinical management of SKCM, especially
in cases with limited therapeutic options. The results demonstrated
in the present study that ELP6 governs p42 MAPK protein may
suggest that interpatient variability in ELP6 levels could lead to
differential clinical responses to MAPK cascade inhibitors, such as
BRAF/MEK/ERK inhibitors. To explore this possibility, response of
two sample groups (high ELP6 levels vs. low ELP6
levels) to inhibitors targeting the RAF-MEK-ERK signalling pathway
was evaluated. This investigation indicated that patients with
melanoma with lower ELP6 levels exhibited reduced
sensitivity to these inhibitors, whereas alternative pathway
inhibitors, such as p38 MAPK or PI3K inhibitors, demonstrated
greater efficacy. On the basis of these findings, it could be
suggested that in the absence of ELP6, the significant reduction in
the downstream key protein p42 MAPK limits the effectiveness of
re-inhibiting the same pathway, such as adding RAF and MEK
inhibitors, thereby failing to further restrict melanoma growth.
Conversely, when ELP6 is overexpressed or present in excess,
it selectively could enhance the translation of p42 MAPK, leading
to overactivation of ERK under conditions of upstream RAS and RAF
mutations, supporting melanoma cell growth and survival. Therefore,
in melanoma treatment, selecting appropriate therapeutic strategies
based on the basis of ELP6 expression may potentially
improve patient outcomes in the future.
Melanin deposition has been recognized as having a
significant effect on the efficacy of melanoma treatment. Studies
have shown that, among patients undergoing radiotherapy, survival
times are notably longer for amelanotic metastatic patients with
melanoma than for melanotic patients. In terms of immunotherapy
(43), melanin promotes melanoma
progression by inhibiting immune responses through the induction of
glycolysis and the activation of hypoxia-inducible factor 1α
(44,45). Additionally, melanin is associated
with the production of specific neurotransmitters, such as L-DOPA
(a precursor to melanin and regarded as a neurohormone) (46), which regulates the tumour
microenvironment and protects cancer cells from the host immune
response. In the present study, amelanotic melanoma cell lines A375
and SK-MEL-2 were used (47–50) to
investigate the effects of ELP6 on melanoma development.
However, these results may not fully reflect whether the function
of ELP6 changes in the context of melanin deposition.
Therefore, further evaluation using melanotic melanoma cell lines
to assess the role of ELP6 in MAPK cascade inhibitor
treatment may provide a more comprehensive understanding of the
role of melanin in tumour progression and treatment resistance.
In the present study, a significant increase in
ELP6 expression levels in tissue samples of patient with
SKCM was demonstrated, which was significantly associated with
reduced survival rates. The present findings demonstrate that
ELP6 upregulation may accelerate melanoma progression
through the ERK1/2 signalling pathway. Consequently, targeting the
ERK1/2 pathway potentially represents a promising therapeutic
strategy for patients with elevated ELP6 expression levels.
Furthermore, the RAF-RAS-MEK pathway inhibitors, such as ERK1/2
inhibitors, have diminished efficacy in patients with low
ELP6 expression levels, potentially due to reduced ERK1/2
activity. These insights underscore the key role of ELP6 in
both melanoma progression and treatment response, suggesting
valuable implications for therapeutic intervention in the
future.
Supplementary Material
Supporting Data
Acknowledgements
Not applicable.
Funding
The present work was supported by the National Natural Science
Foundation of China Grants (grant no. 81960655), Guizhou Provincial
Basic Research Program [grant. no. qiankehejichu ZK(2022)372] and
the Guizhou Provincial Basic Research Program [Natural Science;
grant. no. ZK(2022)041].
Availability of data and materials
The data generated in the present study may be
requested from the corresponding author.
Authors' contributions
YL and QW analysed data and performed experiments.
QL assisted with experiments, data analysis, data verification and
revision of the manuscript. PR designed the study and wrote the
manuscript. YL and QL confirm the authenticity of all the raw data.
All authors participated in writing the manuscript. All authors
read and approved the final version of the manuscript.
Ethics approval and consent to
participate
Not applicable.
Patient consent for publication
Not applicable.
Competing interests
The authors declare that they have no competing
interests.
References
|
1
|
Garbe C, Keim U, Gandini S, Amaral T,
Katalinic A, Hollezcek B, Martus P, Flatz L, Leiter U and Whiteman
D: Epidemiology of cutaneous melanoma and keratinocyte cancer in
white populations 1943–2036. Eur J Cancer. 152:18–25. 2021.
View Article : Google Scholar : PubMed/NCBI
|
|
2
|
Dulskas A, Cerkauskaite D, Vincerževskiene
I and Urbonas V: Trends in incidence and mortality of skin melanoma
in Lithuania 1991–2015. Int J Environ Res Public Health.
18:41652021. View Article : Google Scholar : PubMed/NCBI
|
|
3
|
Radomir MS, Tae-Kang K, Zorica J, Anna AB,
Ewa P, Katie MD, Rebecca SM, Robert CT, Rahul S, David KC, et al:
Malignant melanoma: An overview, new perspectives, and vitamin D
signaling. Cancers (Basel). 16:22622024. View Article : Google Scholar
|
|
4
|
Siegel R, Miller K and Jemal A: Cancer
statistics, 2017. CA Cancer J Clin. 67:7–30. 2017. View Article : Google Scholar : PubMed/NCBI
|
|
5
|
Alexandrov L, Nik-Zainal S, Wedge D,
Aparicio S, Behjati S, Biankin A, Bignell G, Bolli N, Borg A,
Børresen-Dale A, et al: Signatures of mutational processes in human
cancer. Nature. 500:415–421. 2013. View Article : Google Scholar : PubMed/NCBI
|
|
6
|
Hodis E, Watson I, Kryukov G, Arold S,
Imielinski M, Theurillat J, Nickerson E, Auclair D, Li L, Place C,
et al: A landscape of driver mutations in melanoma. Cell.
150:251–263. 2012. View Article : Google Scholar : PubMed/NCBI
|
|
7
|
Radomir MS, Jake YC, Chander R and Andrzej
TS: Photo-neuro-immuno-endocrinology: How the ultraviolet radiation
regulates the body, brain, and immune system. Proc Natl Acad Sci
USA. 121:e23083741212024. View Article : Google Scholar
|
|
8
|
Álvarez-Prado ÁF, Maas RR, Soukup K, Klemm
F, Kornete M, Krebs FS, Zoete V, Berezowska S, Brouland JP,
Hottinger AF, et al: Immunogenomic analysis of human brain
metastases reveals diverse immune landscapes across genetically
distinct tumors. Cell Rep Med. 4:1009002023. View Article : Google Scholar : PubMed/NCBI
|
|
9
|
Hanrahan AJ and Solit DB: BRAF mutations:
The discovery of Allele- and Lineage-specific differences. Cancer
Res. 82:12–14. 2022. View Article : Google Scholar : PubMed/NCBI
|
|
10
|
Chapman PB, Hauschild A, Robert C, Haanen
JB, Ascierto P, Larkin J, Dummer R, Garbe C, Testori A, Maio M, et
al: Improved survival with vemurafenib in melanoma with BRAF V600E
mutation. N Engl J Med. 364:2507–2516. 2011. View Article : Google Scholar : PubMed/NCBI
|
|
11
|
Schadendorf D, van Akkooi ACJ, Berking C,
Griewank KG, Gutzmer R, Hauschild A, Stang A, Roesch A and Ugurel
S: Melanoma. Lancet. 392:971–984. 2018. View Article : Google Scholar : PubMed/NCBI
|
|
12
|
Flaherty K, Puzanov I, Kim K, Ribas A,
McArthur G, Sosman J, O'Dwyer P, Lee R, Grippo J, Nolop K and
Chapman PB: Inhibition of mutated, activated BRAF in metastatic
melanoma. N Engl J Med. 363:809–819. 2010. View Article : Google Scholar : PubMed/NCBI
|
|
13
|
Otero G, Fellows J, Li Y, de Bizemont T,
Dirac A, Gustafsson C, Erdjument-Bromage H, Tempst P and Svejstrup
J: Elongator, a multisubunit component of a novel RNA polymerase II
holoenzyme for transcriptional elongation. Mol Cell. 3:109–118.
1999. View Article : Google Scholar : PubMed/NCBI
|
|
14
|
Wittschieben B, Otero G, de Bizemont T,
Fellows J, Erdjument-Bromage H, Ohba R, Li Y, Allis C, Tempst P and
Svejstrup J: A novel histone acetyltransferase is an integral
subunit of elongating RNA polymerase II holoenzyme. Mol Cell.
4:123–128. 1999. View Article : Google Scholar : PubMed/NCBI
|
|
15
|
Winkler G, Kristjuhan A, Erdjument-Bromage
H, Tempst P and Svejstrup J: Elongator is a histone H3 and H4
acetyltransferase important for normal histone acetylation levels
in vivo. Proc Natl Acad Sci USA. 99:3517–3522. 2002. View Article : Google Scholar : PubMed/NCBI
|
|
16
|
Glatt S, Létoquart J, Faux C, Taylor N,
Séraphin B and Müller C: The Elongator subcomplex Elp456 is a
hexameric RecA-like ATPase. Nat Struct Mol Biol. 19:314–320. 2012.
View Article : Google Scholar : PubMed/NCBI
|
|
17
|
Rahl P, Chen C and Collins R: Elp1p, the
yeast homolog of the FD disease syndrome protein, negatively
regulates exocytosis independently of transcriptional elongation.
Mol Cell. 17:841–853. 2005. View Article : Google Scholar : PubMed/NCBI
|
|
18
|
Xu S, Jiang C, Lin R, Wang X, Hu X, Chen
W, Chen X and Chen T: Epigenetic activation of the elongator
complex sensitizes gallbladder cancer to gemcitabine therapy. J Exp
Clin Cancer Res. 40:3732021. View Article : Google Scholar : PubMed/NCBI
|
|
19
|
Xu S, Zhan M, Jiang C, He M, Yang L, Shen
H, Huang S, Huang X, Lin R, Shi Y, et al: Genome-wide CRISPR screen
identifies ELP5 as a determinant of gemcitabine sensitivity in
gallbladder cancer. Nat Commun. 10:54922019. View Article : Google Scholar : PubMed/NCBI
|
|
20
|
Waszak S, Robinson G, Gudenas B, Smith K,
Forget A, Kojic M, Garcia-Lopez J, Hadley J, Hamilton K, Indersie
E, et al: Germline elongator mutations in sonic hedgehog
medulloblastoma. Nature. 580:396–401. 2020. View Article : Google Scholar : PubMed/NCBI
|
|
21
|
Feng X, Zhang H, Meng L, Song H, Zhou Q,
Qu C, Zhao P, Li Q, Zou C, Liu X and Zhang Z: Hypoxia-induced
acetylation of PAK1 enhances autophagy and promotes brain
tumori-genesis via phosphorylating ATG5. Autophagy. 17:723–742.
2021. View Article : Google Scholar : PubMed/NCBI
|
|
22
|
Cruz-Gordillo P, Honeywell M, Harper N,
Leete T and Lee M: MCL1ELP-dependent expression of promotes
resistance to EGFR inhibition in triple-negative breast cancer
cells. Sci Signal. 13:eabb98202020. View Article : Google Scholar : PubMed/NCBI
|
|
23
|
Zhao Y, Tang D, Yang S, Liu H, Luo S,
Stinchcombe T, Glass C, Su L, Shen S, Christiani DC and Wei Q:
ELP2novel variants of and in the interferon gamma signaling pathway
are associated with non-small cell lung cancer survival. Cancer
Epidemiol Biomarkers Prev. 29:1679–1688. 2020. View Article : Google Scholar : PubMed/NCBI
|
|
24
|
Close P, Gillard M, Ladang A, Jiang Z,
Papuga J, Hawkes N, Nguyen L, Chapelle J, Bouillenne F, Svejstrup
J, et al: DERP6 (ELP5) and C3ORF75 (ELP6) regulate tumorigenicity
and migration of melanoma cells as subunits of Elongator. J Biol
Chem. 287:32535–32545. 2012. View Article : Google Scholar : PubMed/NCBI
|
|
25
|
Tang Z, Li C, Kang B, Gao G, Li C and
Zhang Z: GEPIA: A web server for cancer and normal gene expression
profiling and interactive analyses. Nucleic Acids Res. 45:W98–W102.
2017. View Article : Google Scholar : PubMed/NCBI
|
|
26
|
Barretina J, Caponigro G, Stransky N,
Venkatesan K, Margolin AA, Kim S, Wilson CJ, Lehár J, Kryukov GV,
Sonkin D, et al: The cancer cell line encyclopedia enables
predictive modelling of anticancer drug sensitivity. Nature.
483:603–607. 2012. View Article : Google Scholar : PubMed/NCBI
|
|
27
|
Geeleher P, Cox N and Huang R: pRRophetic:
An R package for prediction of clinical chemotherapeutic response
from tumor gene expression levels. PLoS One. 9:e1074682014.
View Article : Google Scholar : PubMed/NCBI
|
|
28
|
Davide C, Paola C, Marzia C, Mirella B,
Elisa S, Luca M, Jessica G, Elisabetta G, Veronica DG, Marcello M
and Presta M: The Pro-oncogenic Sphingolipid-metabolizing enzyme
β-galactosylceramidase modulates the proteomic landscape in
BRAF(V600E)-Mutated human melanoma cells. Int J Mol Sci.
24:105552023. View Article : Google Scholar
|
|
29
|
Whiteaker JR, Sharma K, Hoffman MA, Kuhn
E, Zhao L, Cocco AR, Schoenherr RM, Kennedy JJ, Voytovich U, Lin C,
et al: Targeted mass spectrometry-based assays enable multiplex
quantification of receptor tyrosine kinase, MAP Kinase, and AKT
signaling. Cell Rep Methods. 1:1000152021. View Article : Google Scholar : PubMed/NCBI
|
|
30
|
Livak KJ and Schmittgen TD: Analysis of
relative gene expression data using Real-time quantitative PCR and
the 2(−Delta Delta C(T)) method. Methods. 25:402–408. 2001.
View Article : Google Scholar : PubMed/NCBI
|
|
31
|
Bustin SA, Benes V, Garson JA, Hellemans
J, Huggett J, Kubista M, Mueller R, Nolan T, Pfaffl MW, Shipley GL,
et al: The MIQE guidelines: Minimum information for publication of
quantitative real-time PCR experiments. Clin Chem. 55:611–622.
2009. View Article : Google Scholar : PubMed/NCBI
|
|
32
|
Scholzen T and Gerdes J: The Ki-67
protein: From the known and the unknown. J Cell Physiol.
182:311–322. 2000. View Article : Google Scholar : PubMed/NCBI
|
|
33
|
Vecchiato A, Rossi CR, Montesco MC,
Frizzera E, Seno A, Piccoli A, Martello T, Ninfo V and Lise M:
Proliferating cell nuclear antigen (PCNA) and recurrence in
patients with cutaneous melanoma. Melanoma Res. 4:207–211. 1994.
View Article : Google Scholar : PubMed/NCBI
|
|
34
|
Roels S, Tilmant K and Ducatelle R: PCNA
and Ki67 proliferation markers as criteria for prediction of
clinical behaviour of melanocytic tumours in cats and dogs. J Comp
Pathol. 121:13–24. 1999. View Article : Google Scholar : PubMed/NCBI
|
|
35
|
Hulleman E, Bijvelt JJ, Verkleij AJ,
Verrips CT and Boonstra J: Nuclear translocation of
mitogen-activated protein kinase p42MAPK during the ongoing cell
cycle. J Cell Physiol. 180:325–333. 1999. View Article : Google Scholar : PubMed/NCBI
|
|
36
|
Nedialkova D and Leidel S: Optimization of
codon translation rates via tRNA modifications maintains proteome
integrity. Cell. 161:1606–1618. 2015. View Article : Google Scholar : PubMed/NCBI
|
|
37
|
Guo F, Cen S, Niu M, Javanbakht H and
Kleiman L: Specific inhibition of the synthesis of human lysyl-tRNA
synthetase results in decreases in tRNA(Lys) incorporation,
tRNA(3)(Lys) annealing to viral RNA, and viral infectivity in human
immunodeficiency virus type 1. J Virol. 77:9817–9822. 2003.
View Article : Google Scholar : PubMed/NCBI
|
|
38
|
Chatzilakou E, Hu Y, Jiang N and Yetisen
A: Biosensors for melanoma skin cancer diagnostics. Biosens
Bioelectron. 250:1160452024. View Article : Google Scholar : PubMed/NCBI
|
|
39
|
Mao Y, Yan R, Li A, Zhang Y, Li J, Du H,
Chen B, Wei W, Zhang Y, Sumners C, et al: Lentiviral vectors
mediate Long-term and high efficiency transgene expression in HEK
293T cells. Int J Med Sci. 12:407–415. 2015. View Article : Google Scholar : PubMed/NCBI
|
|
40
|
Stepanenko AA and Dmitrenko VV: HEK293 in
cell biology and cancer research: phenotype, karyotype,
tumorigenicity, and stress-induced genome-phenotype evolution.
Gene. 569:182–190. 2015. View Article : Google Scholar : PubMed/NCBI
|
|
41
|
Ascierto PA, Kirkwood JM, Grob JJ, Simeone
E, Grimaldi AM, Maio M, Palmieri G, Testori A, Marincola FM and
Mozzillo N: The role of BRAF V600 mutation in melanoma. J Transl
Med. 10:852012. View Article : Google Scholar : PubMed/NCBI
|
|
42
|
Morris EJ, Jha S, Restaino CR, Dayananth
P, Zhu H, Cooper A, Carr D, Deng Y, Jin W, Black S, et al:
Discovery of a novel ERK inhibitor with activity in models of
acquired resistance to BRAF and MEK inhibitors. Cancer Discov.
3:742–750. 2013. View Article : Google Scholar : PubMed/NCBI
|
|
43
|
Brożyna AA, Jóźwicki W, Carlson JA and
Slominski AT: Melanogenesis affects overall and disease-free
survival in patients with stage III and IV melanoma. Hum Pathol.
44:2071–2074. 2013. View Article : Google Scholar : PubMed/NCBI
|
|
44
|
Radomir MS, Tadeusz S, Przemysław MP,
Chander R, Anna AB and Andrzej TS: Melanoma, melanin, and
melanogenesis: The yin and yang relationship. Front Oncol.
12:8424962022. View Article : Google Scholar : PubMed/NCBI
|
|
45
|
Slominski A, Kim TK, Brożyna AA,
Janjetovic Z, Brooks DL, Schwab LP, Skobowiat C, Jóźwicki W and
Seagroves TN: The role of melanogenesis in regulation of melanoma
behavior: Melanogenesis leads to stimulation of HIF-1α expression
and HIF-dependent attendant pathways. Arch Biochem Biophys.
563:79–93. 2014. View Article : Google Scholar : PubMed/NCBI
|
|
46
|
Radomir MS, Chander R, Jake YC and Andrzej
TS: How cancer hijacks the body's homeostasis through the
neuroendocrine system. Trends Neurosci. 46:263–275. 2023.
View Article : Google Scholar : PubMed/NCBI
|
|
47
|
Vitiello M, Tuccoli A, D'Aurizio R, Sarti
S, Giannecchini L, Lubrano S, Marranci A, Evangelista M, Peppicelli
S, Ippolito C, et al: Context-dependent miR-204 and miR-211 affect
the biological properties of amelanotic and melanotic melanoma
cells. Oncotarget. 8:25395–25417. 2017. View Article : Google Scholar : PubMed/NCBI
|
|
48
|
Militaru IV, Rus AA, Munteanu CVA, Manica
G and Petrescu SM: New panel of biomarkers to discriminate between
amelanotic and melanotic metastatic melanoma. Front Oncol.
12:10618322023. View Article : Google Scholar : PubMed/NCBI
|
|
49
|
Kaczmarek-Szczepańska B, Kleszczyński K,
Zasada L, Chmielniak D, Hollerung MB, Dembińska K, Pałubicka K,
Steinbrink K, Swiontek Brzezinska M and Grabska-Zielińska S:
Hyaluronic Acid/ellagic acid as materials for potential medical
application. Int J Mol Sci. 25:58912024. View Article : Google Scholar : PubMed/NCBI
|
|
50
|
Magina S, Vieira-Coelho MA, Serrão MP,
Kosmus C, Moura E and Moura D: Ultraviolet B radiation
differentially modifies catechol-O-methyltransferase activity in
keratinocytes and melanoma cells. Photodermatol Photoimmunol
Photomed. 28:137–141. 2012. View Article : Google Scholar : PubMed/NCBI
|


