Introduction
Gastric cancer (GC) poses a major global health
challenge, ranking as one of the most common and deadly
malignancies. With ~769,000 annual deaths, the high mortality of GC
is largely attributed to its aggressive progression and the
tendency for diagnosis at advanced stages (1). Despite substantial advancements in
surgical techniques and therapeutic interventions, the overall
survival (OS) rate for patients with advanced GC remains poor, with
a median survival time of 10–14 months (2). This underscores the urgent need to
further elucidate the molecular mechanisms driving GC progression,
with the goal of discovering novel therapeutic targets and
improving patient outcomes.
Owing to the intrinsic characteristics of most
tumors and their reliance on metabolic reprogramming, targeting
tumor metabolism has increasingly been recognized as a promising
therapeutic approach (3).
α-Ketoglutarate (α-KG), a crucial metabolite in cancer metabolism,
serves a pivotal role in regulating cellular energy production and
epigenetic modifications (4).
Within the tricarboxylic acid (TCA) cycle, α-KG acts as an
intermediate metabolite that helps maintain cellular energy
homeostasis (5). In addition to its
metabolic function, α-KG acts as a cofactor for a range of
dioxygenases, including ten-eleven translocation (TET) enzymes and
JmjC domain-containing histone demethylases, which mediate DNA and
histone demethylation, thereby regulating gene expression and
cellular differentiation (6,7).
Consequently, α-KG has emerged as a potential tumor suppressor by
modulating dysregulated metabolic and epigenetic pathways in cancer
cells.
Numerous studies have assessed the mechanisms
through which α-KG suppresses cancer. In colorectal cancer,
glutamine limitation reduces cellular α-KG levels, which enhances
Wnt signaling in APC-mutated intestinal organoids. This promotes
stemness characteristics, inhibits cellular differentiation, and
ultimately leads to adenocarcinoma formation (8). Supplementing exogenous α-KG can
reverse the overactivation of Wnt signaling and enhanced stemness
caused by low glutamine levels, thereby promoting cellular
differentiation and inhibiting tumor growth (8). Regarding the epigenetic regulatory
role of α-KG, studies in a 4T1 breast cancer orthotopic mouse model
have reported that utilizing an α-KG dehydrogenase (KGDH)
inhibitor, AA6, leads to intracellular accumulation of α-KG, which
increases the activity of α-KG-dependent epigenetic enzymes
(9). This metabolic environment
facilitates epigenetic reprogramming, effectively counteracting
tumor invasion by inhibiting epithelial-to-mesenchymal transition
(EMT). It establishes an α-KG-dependent epigenetic regulatory axis
in the TET-microRNA200-Zinc finger E-box-binding homeobox
1/C-terminal-binding protein 1-matrix metalloproteinase 3 pathway,
which brought anti-metastatic effects in a breast cancer metastasis
mouse model (9). Additionally, in
glioma and non-small cell lung cancer, α-KG was reported to inhibit
cancer progression through its roles in the TCA cycle and
epigenetic regulation (10,11). However, the heterogeneity of
different tumor types markedly impacts the mechanisms by which α-KG
exerts its effects. The specific impact of α-KG on cell
proliferation, apoptosis and the tumor microenvironment in GC
remains to be fully elucidated.
Notably, previous studies have revealed that several
α-KG-related genes serve as valuable prognostic biomarkers in
cancer. Isocitrate dehydrogenase 1 (IDH1) serves a crucial role in
malignancies and is considered a marker for liver metastasis
(12). Mutant (m)IDH1 produces the
carcinogenic metabolite (R)-2-hydroxyglutarate (R-2HG), which
promotes cancer by inactivating DNA and histone demethylases
(13). Additionally, mutations in
IDH1 are a defining feature of a subset of primary gliomas
(14). Moreover, research has
demonstrated that a single amino acid residue mutation in the
active site of IDH1 in gliomas disrupts its ability to catalyze the
conversion of isocitrate to α-KG. Instead, it catalyzes the
NADPH-dependent conversion of α-KG to R-2HG, and the resulting
accumulation of 2-HG is associated with an increased risk for
malignant brain tumors (14,15).
KGDH, another α-KG-related gene, functions alongside lysine
acetyltransferase 2A to execute its succinyltransferase activity.
This process promotes glioma growth by succinylating histone H3K79
(16). Therefore, a deeper
understanding of α-KG-related genes could aid in identifying
potential biomarkers and guide immunotherapy strategies for GC.
The present study aimed to construct a predictive
model based on α-KG-related genes to evaluate their utility in
forecasting therapy responses and to explore prognostic and immune
microenvironment characteristics in GC. Public data from 1,397
patients across The Cancer Genome Atlas (TCGA) and Gene Expression
Omnibus (GEO) datasets were analyzed, with the TCGA-stomach
adenocarcinoma (STAD) cohort designated for model training and GEO
datasets (including GSE26899 and GSE13861) allocated for validation
and treatment prediction. By integrating α-KG-related genes, the
study employed bioinformatic and statistical approaches to assess
associations with survival and prognosis, thereby providing a
framework for understanding GC outcomes and immune landscape
features. This methodology aimed to support clinical
decision-making by linking molecular profiles to potential
therapeutic responses.
Materials and methods
Data acquisition
Bulk RNA-sequencing data and associated
clinicopathological details for GC samples were sourced from TCGA
official data portal (https://gdc portal.nci.nih.gov/). The mRNA and long
noncoding RNA transcriptome profiles were obtained via the
TCGAbiolinks package (https://bioconductor.org/packages/release/bioc/html/TCGAbiolinks.html)
(17). Additionally,
clinicopathological data and comprehensive expression data were
obtained from three validated GC cohorts: GSE15459 (18), GSE84433 (19) and GSE84437 (19). Furthermore, two chemotherapy
datasets were used to assess the contribution of the α-KG-related
gene index (AKGI) to the prediction of therapy benefits: GSE26899
(20) and GSE13861 (21). Raw count data underwent transcripts
per million normalization for standardization.
Identification of the expression and
variation levels of α-KG-related genes
To construct the signatures list of α-KG-related
genes, genes associated with eight distinct α-KG-related pathways
were obtained from trusted scientific databases, including Gene Set
Enrichment Analysis (GSEA) gene sets (https://www.gsea-msigdb.org/gsea/index.jsp), Kyoto
Encyclopedia of Genes and Genomes (KEGG) (https://www.genome.jp/kegg/) and through manual
compilation. After removing duplicates, a total of 508 α-KG-related
genes were selected for subsequent analysis. Differential
expression analysis was conducted using the ‘limma’ package to
identify genes critical to α-KG-related functions (22). Differentially expressed α-KG-related
genes between tumor and normal were identified by setting a cutoff
value of P<0.05 and |Log2FoldChange (FC)|>1.0. Enrichment
analysis was performed using the ‘clusterProfiler’ package
(23).
Establishment of a consensus machine
learning-driven prognostic signature
To improve the comparability across different
cohorts, all data were standardized by first performing Z-score
transformation. Cox regression analysis was then performed to
identify differentially expressed α-KG-related genes that were
significantly associated with patient survival. Genes with a
P-value of <0.05 were considered statistically significant and
were included for further investigation. To construct an AKGI with
high accuracy and generalizability, a combination of 10 machine
learning algorithms were used, including supervised principal
components (SuperPC), partial least squares regression for Cox
(plsRcox), gradient boosting machine (GBM), stepwise Cox, least
absolute shrinkage and selection operator (LASSO), Ridge, survival
support vector machine (survival-SVM), CoxBoost and elastic net
(Enet). By harnessing the distinct advantages of each algorithm,
their integration enhanced the overall performance of the
prognostic model in predicting STAD outcomes. Among the 10 machine
learning algorithms employed in this model, the LASSO, StepCox and
CoxBoost algorithms, which are capable of feature selection and
dimensionality reduction, were combined with other machine learning
methods to construct 115 prognostic signatures.
To identify the best algorithmic combination for
constructing the optimal prognostic model, the C-index values was
calculated for each model across the GSE15459, GSE84433, GSE84437
and TCGA cohorts. By comparing the average C-index values across
these cohorts, the prognostic signature with the highest score was
selected as the optimal model for further analysis. The risk score
for each patient was then computed using the algorithmic
combination selected for the optimal model. To divide patients into
high- and low-risk groups, the ‘surv_cutpoint’ function in the
‘survminer’ package was used to determine the optimal cutoff point,
which corresponded to the risk score that maximized the distinction
in OS time between the two groups.
Performance evaluation of the
prognostic model
The optimal predictive model was derived from the
training and validation cohorts, risk scores were calculated for
each sample using this model, and samples were subsequently
classified into high- and low-AKGI groups based on these scores. To
evaluate the predictive performance of the constructed signature,
Kaplan-Meier survival analysis was performed using the ‘survival’
and ‘survminer’ packages in both the training and validation
cohorts. Decision curve analysis (DCA) images were drawn to reflect
the clinical benefit of the predictive nomogram model using
‘stdca.R’ package. The discriminative ability of the model
between the high- and low-risk groups was assessed by calculating
the area under the curve (AUC) in the receiver operating
characteristic (ROC) analysis. Furthermore, the ‘timeROC’ and
‘cmprsk’ packages were used to plot time-dependent ROC and decision
curves to further gauge the predictive accuracy of the model in the
TCGA-STAD cohort.
Construction and performance analysis
of the prognostic nomogram
A prognostic nomogram was developed based on
independent prognostic factors, including the risk score derived
from the signature and key clinical features, using the
‘nomogramEx’ package in the TCGA-STAD cohort. To assess the ability
of the nomogram to predict OS, several analyses were performed in
the TCGA-STAD cohort. A calibration curve analysis was then
performed using the ‘calibrate’ package, allowing for a comparison
between the predicted survival probabilities and the actual
survival outcomes observed in the cohort.
Comprehensive analysis of immune-omics
molecular characterization and immunotherapy response based on
AKGI
Several previously published signatures related to
tumor microenvironment (TME) cell types, immunotherapy responses,
immune suppression and immune exclusion were obtained using the
IOBR package. A standardized approach was then used to calculate
the enrichment score for each sample, facilitating a thorough
analysis of the immunological differences between high- and
low-AKGI patients (24).
Subsequently, a correlation analysis between AKGI and the
enrichment scores of several immune characteristics and biological
functions was performed. Using P<0.05 and |r|>0.3 as the
selection criteria, items significantly associated with AKGI were
identified. Additionally, certain prominent indicators were focused
on, such as the stemness (25) and
m6A index (26). The distribution
of tumor mutational burden (TMB), silent mutations and missense
mutations were also compared between the two groups and patients
were reclassified based on AKGI. For evaluating the immunotherapy
response, the survival of patients was first assessed with delayed
response to immunotherapy, followed by the use of the Tumor Immune
Dysfunction and Exclusion (TIDE) algorithm (http://tide.dfci.harvard.edu/). to estimate their
likelihood of responding to treatment (27). In addition, the predictive role of
AKGI was also evaluated using two chemotherapy treatment cohorts,
GSE26899 and GSE13861.
In silico analysis to screen potential
therapy agents for patients with high AKGI scores
To screen potential therapy agents for patients with
high AKGI scores, expression data from human cancer cell lines
sourced from the Broad Institute's Cancer Cell Line Encyclopedia
(https://sites.broadinstitute.org/ccle) was utilized.
This provides extensive molecular profiles across several cancer
types and their corresponding cell lines, offering insights into
genetic alterations and drug responses. To obtain drug sensitivity
data, two comprehensive datasets we used: the Cancer Therapeutics
Response Portal (CTRP) v.2.0 (https://portals.broadinstitute.org/ctrp) and the
Profiling Relative Inhibition Simultaneously in Mixtures (PRISM)
Repurposing datasets (19Q4; http://depmap.org/portal/prism/). The area under the
dose-response curve (AUC) was used as a key measure of drug
sensitivity, where lower AUC values indicated higher drug
sensitivity. When evaluating the evidence for candidate drugs,
Connectivity Map (CMap) identified potential therapeutic compounds
for GC by revealing small molecules whose gene expression
signatures inversely correlated with GC-specific transcriptional
profiles (connectivity scores: −100 to 0), thereby nominating drug
candidates for experimental validation, and PubMed (https://pubmed.ncbi.nlm.nih.gov/) was searched
for literature related to the candidates, and all available
clinical trials and descriptions involving these drugs were
analyzed.
Cell culture and α-KG treatments
GC AGS and MKN74 cells, obtained from Procell Life
Science & Technology, Co., Ltd., were used in the current study
and cultured in a saturated humidity atmosphere (37°C and 5%
CO2). AGS cells were cultured in Ham's F-12 medium (cat.
no. PM150810; Pricella®; Elabscience Bionovation Inc.)
containing 10% fetal bovine serum (FBS; cat. no. C04001; VivaCell,
Shanghai, China) and 100 IU/ml penicillin/ streptomycin antibiotics
(P/S; cat. no. 15070063, Thermo Fisher Scientific, Inc.).
Meanwhile, RPMI-1640 medium (cat. no. PM150110; Pricella;
Elabscience Bionovation Inc.) containing 10% FBS and 100 IU/ml P/S
was used to culture MKN74 cells.
Proliferation, wound healing and
Transwell assays
A Cell Counting Kit-8 (CCK-8) assay was applied to
confirm the cytotoxicity effect of α-KG interventions against the
GC progression. Briefly, AGS and MKN74 cells
(5×10³/well) were plated in 96-well plates (Corning,
Inc.) and cultured at 37°C for 24 h. For the α-KG interventions, 2,
4, 8, 10 and 20 mM α-KG was individually supplemented into the
culture medium with the cells incubated at 37°C for a further 24 h.
In addition, both GC cells treated with the culture medium
supplemented with Dulbecco's phosphate-buffered saline (DPBS; cat.
no. 14190250; Thermo Fisher Scientific, Inc.) were set as the
negative control (NC) group. After the α-KG interventions, 100 µl
CCK-8 reagents (cat. no. MA0218; Dalian Meilun Biotech Co., Ltd.)
were added to the 96-well plates with the plates further incubated
at 37°C for another 4 h. Lastly, the absorbance of 96-well plates
at 450 nm was recorded using a microtiter plate reader (Multiskan™;
Thermo Fisher Scientific, Inc.), and the inhibiting rates (IR) of
α-KG interventions on the proliferation were calculated.
After the optimization of α-KG concentration based
on the viability and 50% IR data, a wound healing assay was
performed to analyze the effects of α-KG interventions on the
migration potentials of GC cells (28). Accordingly, 5×10⁵ AGS or
MKN74 cells were seeded in 6-well plates (Corning, Inc.) and
further cultured at 37°C for 24 h. Prior to the α-KG intervention,
cells were allowed to grow until reaching a high confluence (90–100
%) to ensure consistency across cell lines. A wound across the cell
monolayer was prepared by scratching the plates with 200 µl plastic
pipette tips, and cellular debris and non-adherent cells were
removed by washing with DPBS solution. Cells were subsequently
incubated in serum-free medium with α-KG or DPBS at 37°C for 24 h.
After treatment, the wound closure was microscopically (TI-S; Nikon
Corporation) recorded and further analyzed using ImageJ software
(V1.8.0; National Institutes of Health). Furthermore, the effect of
α-KG interventions on the invasion potentials of GC cells was
assessed using a Transwell invasion assay (29). AGS or MKN74 cells
(2×10³/well) were collected, resuspended in serum-free
medium containing α-KG or DPBS solution and seeded into the upper
Transwell chamber precoated with Matrigel at 37°C for 0.5 h
(Corning, Inc.). Moreover, the lower chamber was supplemented with
600 µl culture medium containing 10% FBS (cat. no. C04001; Shanghai
VivaCell Biosciences, Ltd.). After culturing at 37°C for 24 h, the
GC cells in the upper chamber were removed using a cotton swab, and
the Transwell chambers were fixed with methanol at room temperature
for 10 min, stained with crystal violet solution (cat. no. G1062;
Beijing Solarbio Science & Technology Co., Ltd.) at room
temperature for 10 min, and microscopically (TI-S; Nikon
Corporation) recorded. The number of GC cells that migrated through
the Transwell system was quantified using ImageJ software (V1.8.0;
National Institutes of Health).
Clonogenicity assay
The potential effect of α-KG treatments on the
malignant characteristics of GC cells was assessed using a
clonogenicity assay. A total of 1×10³ AGS or MKN74 cells
were collected, seeded in a 6-well culture plate (Corning, Inc.)
and cultured at 37°C for a further 7 days. The culture medium
containing α-KG or DPBS solution was replaced daily. Once the
visible colonies developed, the colonies were incubated with 4%
paraformaldehyde solution (cat. no. P1110, Beijing Solarbio Science
& Technology Co., Ltd.) at 37° for 15 min and stained with
crystal violet solution at room temperature for 30 min. The number
of colonies was further microscopically (TI-S; Nikon Corporation)
assessed. Quantification was performed using ImageJ software
(V1.8.0; National Institutes of Health), with the colony area
threshold adjusted to identify clusters containing >50
cells.
Cell cycle assay
The effect of α-KG treatments on inducing the cell
cycle arrest of AGS or MKN74 cells was detected using a Cell Cycle
and Apoptosis Analysis Kit (cat. no. MA0334; Dalian Meilun Biotech
Co., Ltd.). As previously reported (3), after treatment with α-KG or DPBS, GC
cells were collected and fixed with ice-cold 70% ethanol at −20°C.
After fixation, cells were stained at room temperature for 15 min
with a propidium iodide (PI) solution, which served as the analyte
reporter by intercalating with DNA to allow quantification of DNA
content. Flow cytometry analysis was performed using a FACSCalibur™
flow cytometer (BD Biosciences). Cell cycle distribution across the
G0/G1, S, and G2/M phases was
analyzed using FlowJo software (version 10.8.1; BD
Biosciences).
Annexin V-FITC/PI staining. The potential effect of
α-KG treatments on triggering apoptosis in AGS or MKN74 cells was
quantitatively assessed using Annexin V-FITC/PI staining. As per
the manufacturer's manual, GC cells of both groups post-treatment
were collected and incubated with Annexin V-FITC solution (cat. no.
CA1020; Beijing Solarbio Science & Technology Co., Ltd.) in the
dark at 37°C for 5 min. After PI solution staining, apoptosis was
immediately analysed using a FACSCalibur™ flow cytometer (BD
Biosciences, San Jose, CA, USA). Flow cytometric data were analysed
using FlowJo software (version 10.8.1; BD Biosciences, http://www.flowjo.com/).
Mitochondrial dysfunction
assessment
MitoTracker staining and JC-1 staining were utilized
to assess α-KG treatment-induced mitochondrial dysfunctions. For
MitoTracker staining to assess mitochondrial activity, GC cells of
both groups post-treatment were incubated at 37°C with 200 nM
MitoTracker staining regent (cat. no. C1049; Beyotime Institute of
Biotechnology) for 30 min and further counterstained with DAPI
solution at 37°C for 10 min. The MitoTracker staining of both
groups was assessed under a microscope (TI-S; Nikon Corporation),
and the MitoTracker staining intensity of both groups was further
analyzed using ImageJ software (V1.8.0; National Institutes of
Health). For assessing the mitochondrial membrane potential (ΔΨm),
GC cells of both groups post-treatment were incubated with 10 µM
JC-1 staining solution (cat. no. C2006; Beyotime Institute of
Biotechnology) for 20 min, followed by an analysis of JC-1 staining
intensity under a microscope (TI-S; Nikon Corporation) using ImageJ
software (V1.8.0; National Institutes of Health).
Biochemical assessment
Levels of oxidative stress and ferroptosis-related
biomarkers [superoxide dismutase (SOD), malondialdehyde (MDA),
reactive oxygen species (ROS) and iron] in GC cells of both groups
post-treatment were measured using the following commercial kits
according to the manufacturers' protocols: MDA (cat. no. S0131;
Beyotime Institute of Biotechnology); ROS (cat. no. S0033; Beyotime
Institute of Biotechnology); SOD (cat. no. BC5165; Beijing Solarbio
Science & Technology Co., Ltd.); and iron (cat. no. BC5315;
Beijing Solarbio Science & Technology Co., Ltd.).
Reverse transcription-quantitative PCR
(RT-qPCR)
The anticancer effects of α-KG treatments against GC
progression were analyzed using RT-qPCR of apoptosis, oxidative
stress, and ferroptosis-related genes. Accordingly, the mRNA of GC
cells of both groups post-treatment was extracted using TRIzol™
reagent (cat. no. 12183555; Thermo Fisher Scientific, Inc.) with
the synthesis of cDNA performed at 65°C for 10 min using the Prime
Script™ RT reagent kit (cat. no. RR047A; Takara Biotechnology Co.,
Ltd.). For PCR amplification, specific primers targeting genes
related to apoptosis (Bax and Bcl-2), oxidative
stress [nuclear factor erythroid 2-related factor-2 (Nrf2)
and Kelch-like ECH-associated protein 1 (Keap1)] and
ferroptosis [glutathione peroxidase 4 (GPX4) and solute
carrier family 7 member 11 (SLC7A11)] were designed using
the National Center for Biotechnology Information website
(https://blast.ncbi.nlm.nih.gov/Blast.cgi) and
commercially synthesized by Invitrogen™ (Thermo Fisher Scientific,
Inc.). RT-qPCR of each group was then performed using the PikoReal
system (Thermo Fisher Scientific, Inc.) with a commercial kit (cat.
no. RR820A; Takara Biotechnology Co., Ltd.). The thermocycling
conditions used in this study were as follows: An initial
denaturation at 9°C for 3 min; followed by 8 cycles of denaturation
at 98°C for 15 sec, annealing at 60°C for 15 sec and extension at
72°C for 30 sec; with a final extension at 72°C for 5 min. After
RT-qPCR, relative gene expression was calculated using the
2−ΔΔCq method with the ubiquitously expressed
GAPDH used as an internal control (30). Primer sequences were as follows:
Bax, forward 5′-CCCGAGAGGTCTTTTTCCGAG-3′ and reverse
5′-CCAGCCCATGATGGTTCTGAT-3′; Bcl-2, forward
5′-GGTGGGGTCATGTGTGTGG-3′ and reverse 5′-CGGTTCAGGTACTCAGTCATCC-3′;
Nrf2, forward 5′-TTCCCGGTCACATCGAGAG-3′ and reverse
5′-TCCTGTTGCATACCGTCTAAATC-3′; Keap1, forward
5′-GTGTCCATTGAGGGTATCCACC-3′ and reverse 5′-GCTCAGCGAAGTTGGCGAT-3′;
GPX4, forward 5′-GAGGCAAGACCGAAGTAAACTAC-3′ and reverse
5′-CCGAACTGGTTACACGGGAA-3′; SLC7A11, forward
5′-TCTCCAAAGGAGGTTACCTGC-3′ and reverse
5′-AGACTCCCCTCAGTAAAGTGAC-3′; and GAPDH, forward
5′-CTGGGCTACACTGAGCACC-3′ and reverse
5′-AAGTGGTCGTTGAGGGCAATG-3′.
Transcriptomic analysis
To further investigate the regulatory mechanism by
which α-KG treatment suppresses GC progression, total RNA was
extracted from GC cells in both treated and control groups using
TRIzol® reagent (cat. no. 15596018; Invitrogen; Thermo
Fisher Scientific, Inc.) according to the manufacturer's
instructions. For transcriptomic analysis, polyadenylated mRNA was
enriched using oligo(dT) magnetic beads, fragmented into short
sequences and reverse transcribed into cDNA using the SuperScript
III First-Strand Synthesis System (cat. no. 18080051; Invitrogen;
Thermo Fisher Scientific, Inc.) with dNTPs (cat. no. R0192; Thermo
Fisher Scientific, Inc.) and random hexamer primers. The reverse
transcription temperature protocol was as follows: 2°C for 10 min,
50°C for 50 min and 70°C for 15 min. Double-stranded cDNA was
synthesized, end-repaired, A-tailed and ligated to sequencing
adapters using the NEBNext Ultra II DNA Library Prep Kit for
Illumina (cat. no. E7645S; New England Biolabs, Inc.). The ligation
products were purified using AMPure XP beads and amplified by PCR
to construct the cDNA library. DNA library quality was assessed
using an Agilent 2100 Bioanalyzer with the High Sensitivity DNA Kit
(cat. no. 5067-4626; Agilent Technologies, Inc.) to verify
integrity, and concentrations were quantified using Qubit 4
Fluorometer (Thermo Fisher Scientific, Inc.). Libraries were
sequenced using an Illumina NovaSeq 6000 platform with 150-bp
paired-end reads. The sequencing kit used was the NovaSeq 6000 S4
Reagent Kit (300 cycles) (cat. no. 20028312; Illumina, Inc.). The
final library was loaded at a concentration of 300 pM, determined
using qPCR with the KAPA Library Quantification Kit (cat. no.
KK4824; Roche Diagnostics), reported in molar concentration. Raw
sequencing reads were processed by trimming low-quality bases and
adapter sequences using Trimmomatic (v0.39; http://github.com/usadellab/Trimmomatic). Clean reads
were aligned to the human genome reference hg19 using STAR
(v2.7.3a). Gene expression levels were quantified as fragments per
kilobase of transcript per million mapped reads using featureCounts
(v2.0.1). Differentially expressed genes were identified with a
threshold of P<0.05 and |log2(fold change)|≥1.
Subsequent functional analyses, including Gene Ontology and KEGG
pathway enrichment, were performed using the DAVID database
(https://david.ncifcrf.gov/). GSEA was
also conducted to identify significantly enriched signaling
pathways related to α-KG treatment (31–33).
Statistical analysis
In the present study, all statistical analyses were
performed in R v.4.1.0 (The R Foundation). Each experiment was
conducted in triplicate, unless otherwise specified. Descriptive
data were analysed using the Student's t-test and are presented as
the mean±standard deviation, unless otherwise indicated. For
comparisons, normally distributed variables were analyzed using
unpaired Student's t-tests, whilst non-normally distributed
variables were assessed using the Wilcoxon rank-sum test. A
two-sided Fisher's exact test was performed for the contingency
tables. Correlation analyses were performed using Spearman's rank
correlation. P<0.05 was considered to indicate a statistically
significant difference.
Results
Screening and expression analysis of
α-KG-related genes in GC
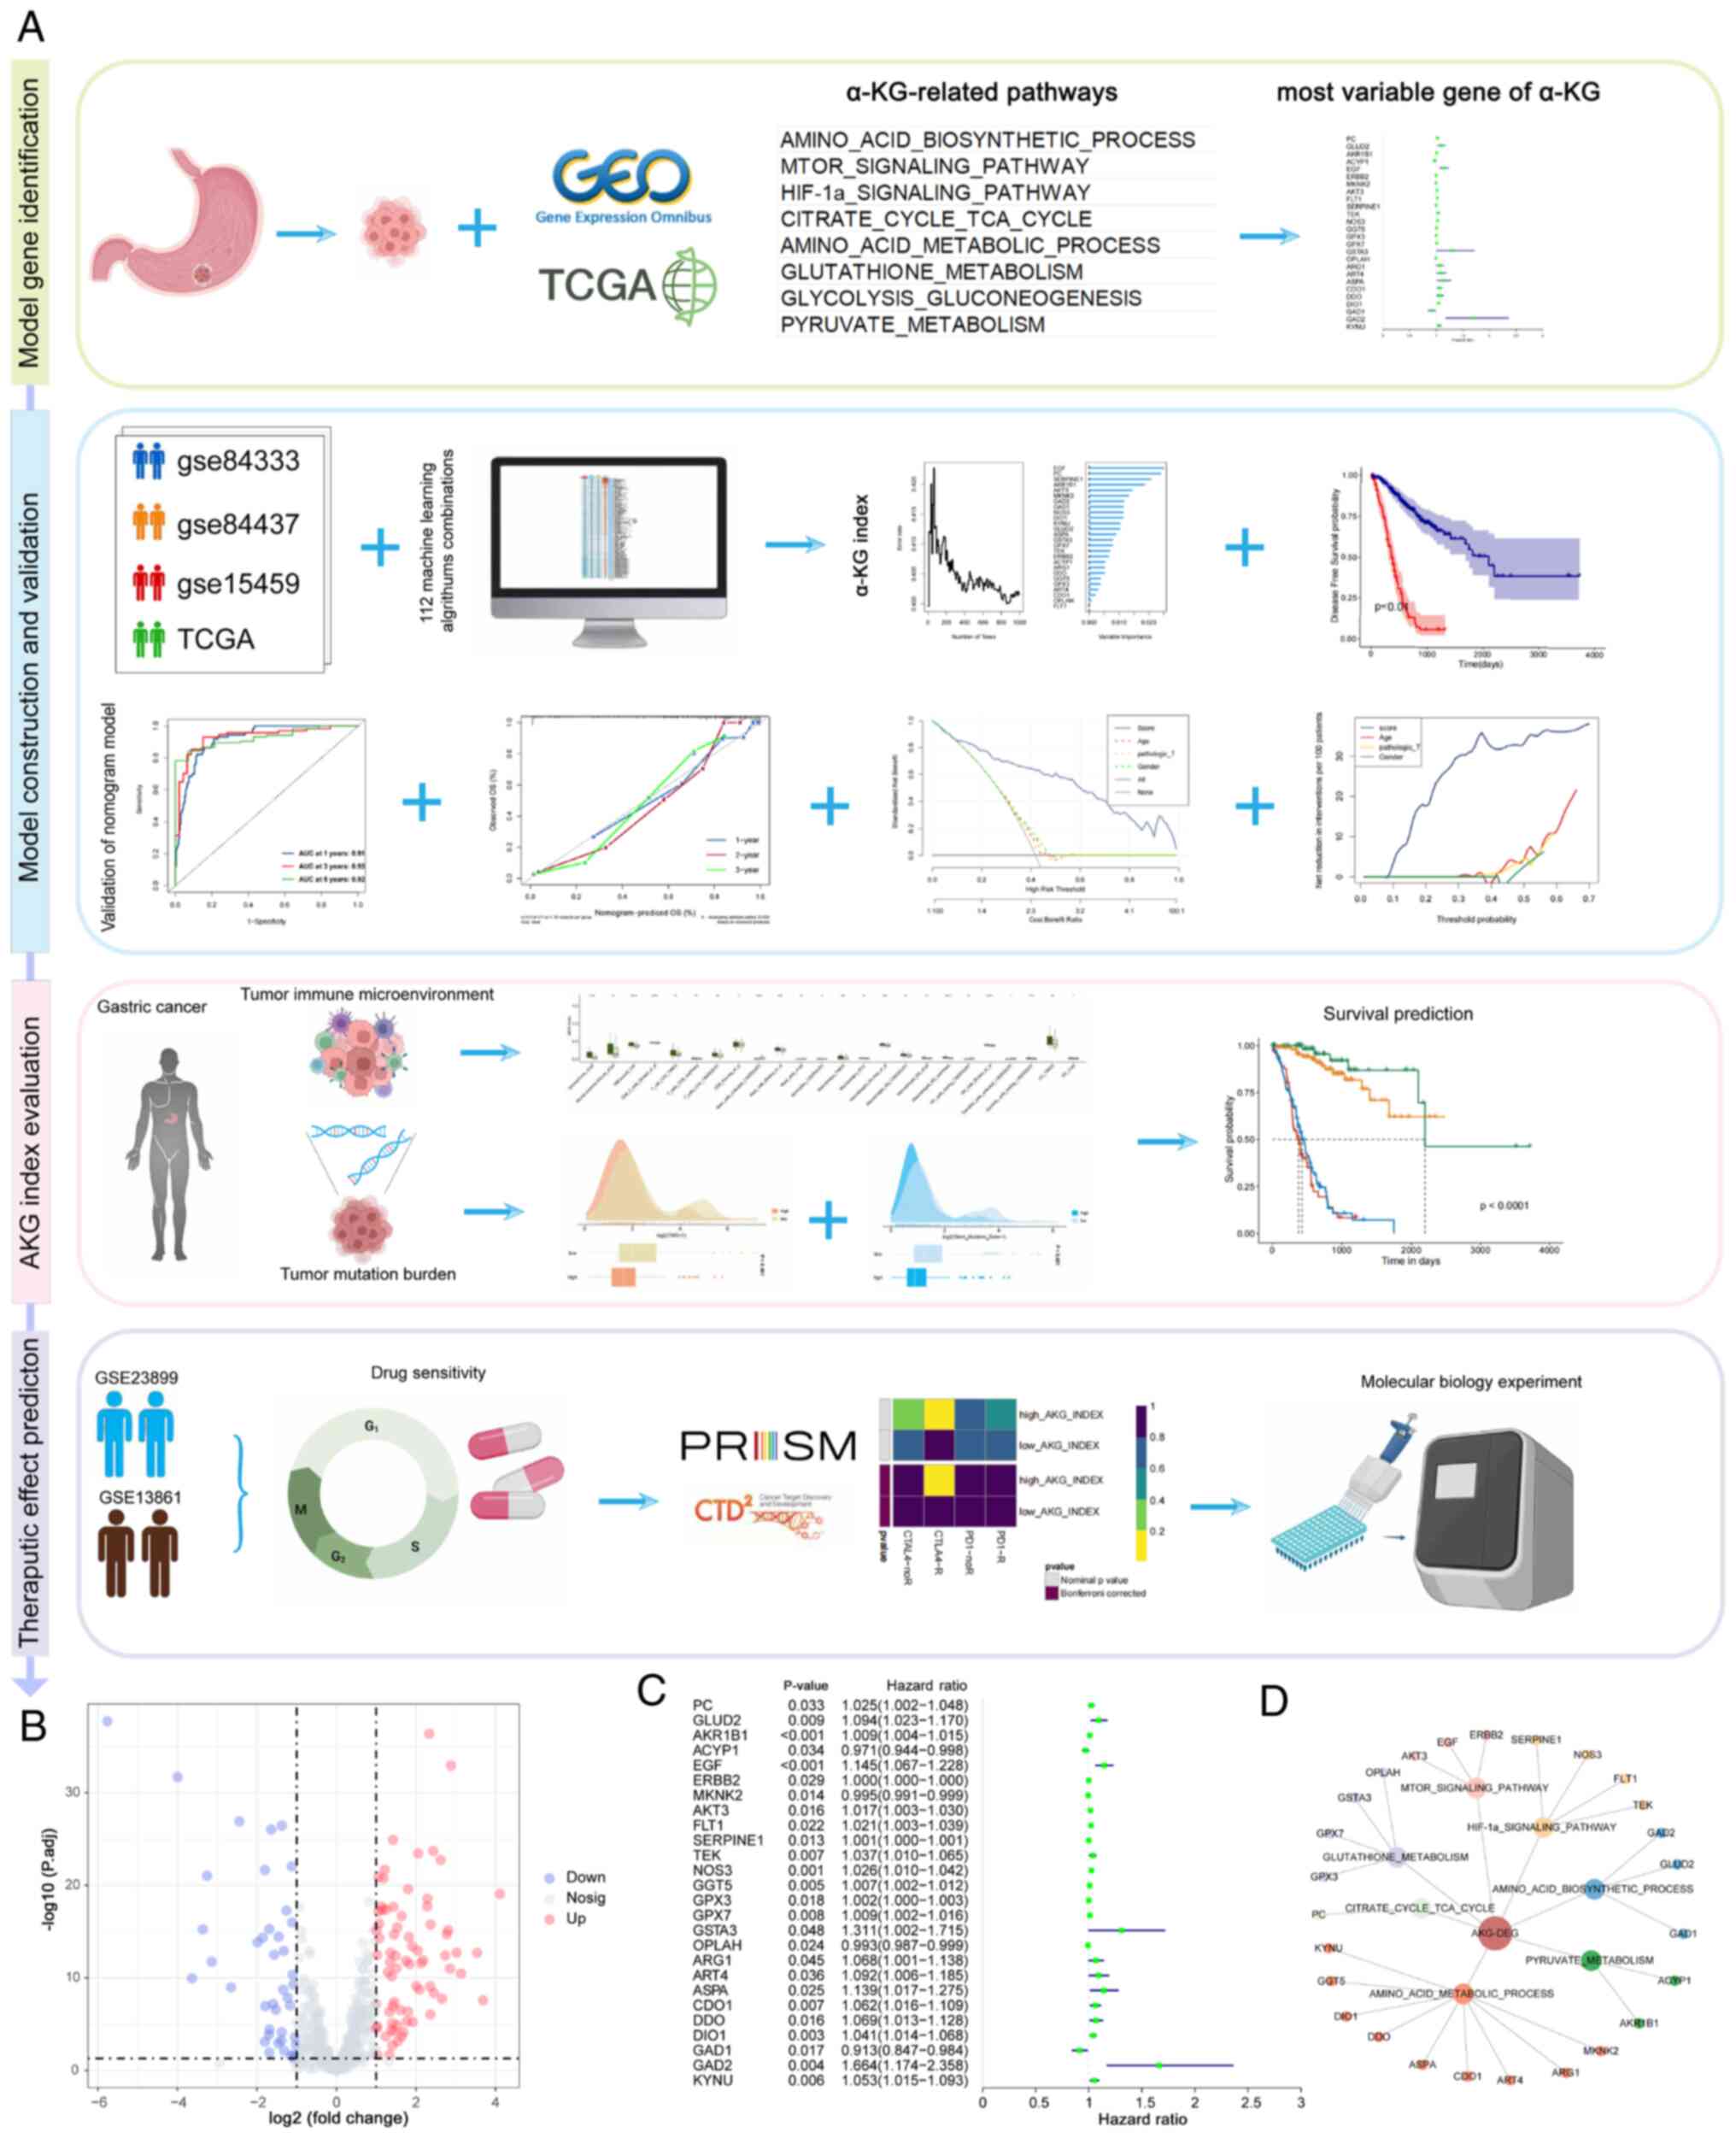
As shown in Fig. 1A,
an in-depth reanalysis of several previously published cohorts was
performed to train and validate the predictive model in the present
study. This included four bulk RNA sequencing datasets (TCGA-STAD,
GSE84437, GSE8433 and GSE15459) as well as two treatment-related
cohorts (GSE26899 and GSE13861). In total, a concatenated set of
509 genes (Table SI) derived from
eight KEGG pathways associated with α-KG synthesis, metabolism and
regulation were analyzed.
Based on the TCGA-STAD cohort data, 105 α-KG-related
genes were identified that exhibited significant differential
expression between tumor and normal samples (adjusted P<0.05 and
|log2FC|>1; Fig. 1B and S1). Subsequently, using patient survival
data, univariate Cox analysis was performed and 26 prognostic genes
were identified from the differentially expressed α-KG-related
genes (Fig. 1C and D). These were
then used to construct a predictive model.
Construction and evaluation of
prognostic models using 115 machine learning algorithms
Using the 26 α-KG-related candidate genes, the AKGI
was developed using an ensemble machine learning algorithm. In the
TCGA-STAD cohort, the Leave-One-Out Cross Validation strategy was
applied to construct 115 predictive models and compute the C-index
for each model across all validation cohorts (Fig. 2A). Among the four datasets, the
random survival forest (RSF) model demonstrated the highest average
C-index of 0.66, establishing it as the most robust AKGI model
(Fig. 2A and B). By using RSF we
scored the samples, and based on their risk scores, patients were
classified into high- and low-AKGI groups according to the optimal
cutoff. Using the optimal cutoff value, patients were stratified
into high and low AKGI groups (Figs.
2C and S2). Survival analysis
revealed that in all four datasets, patients with GC with low AKGI
levels had significantly longer OS and disease-free survival
compared with those with high AKGI levels (Figs. 2D and E, and S2). These findings highlight the
potential of AKGI as a prognostic predictor for patients with
GC.
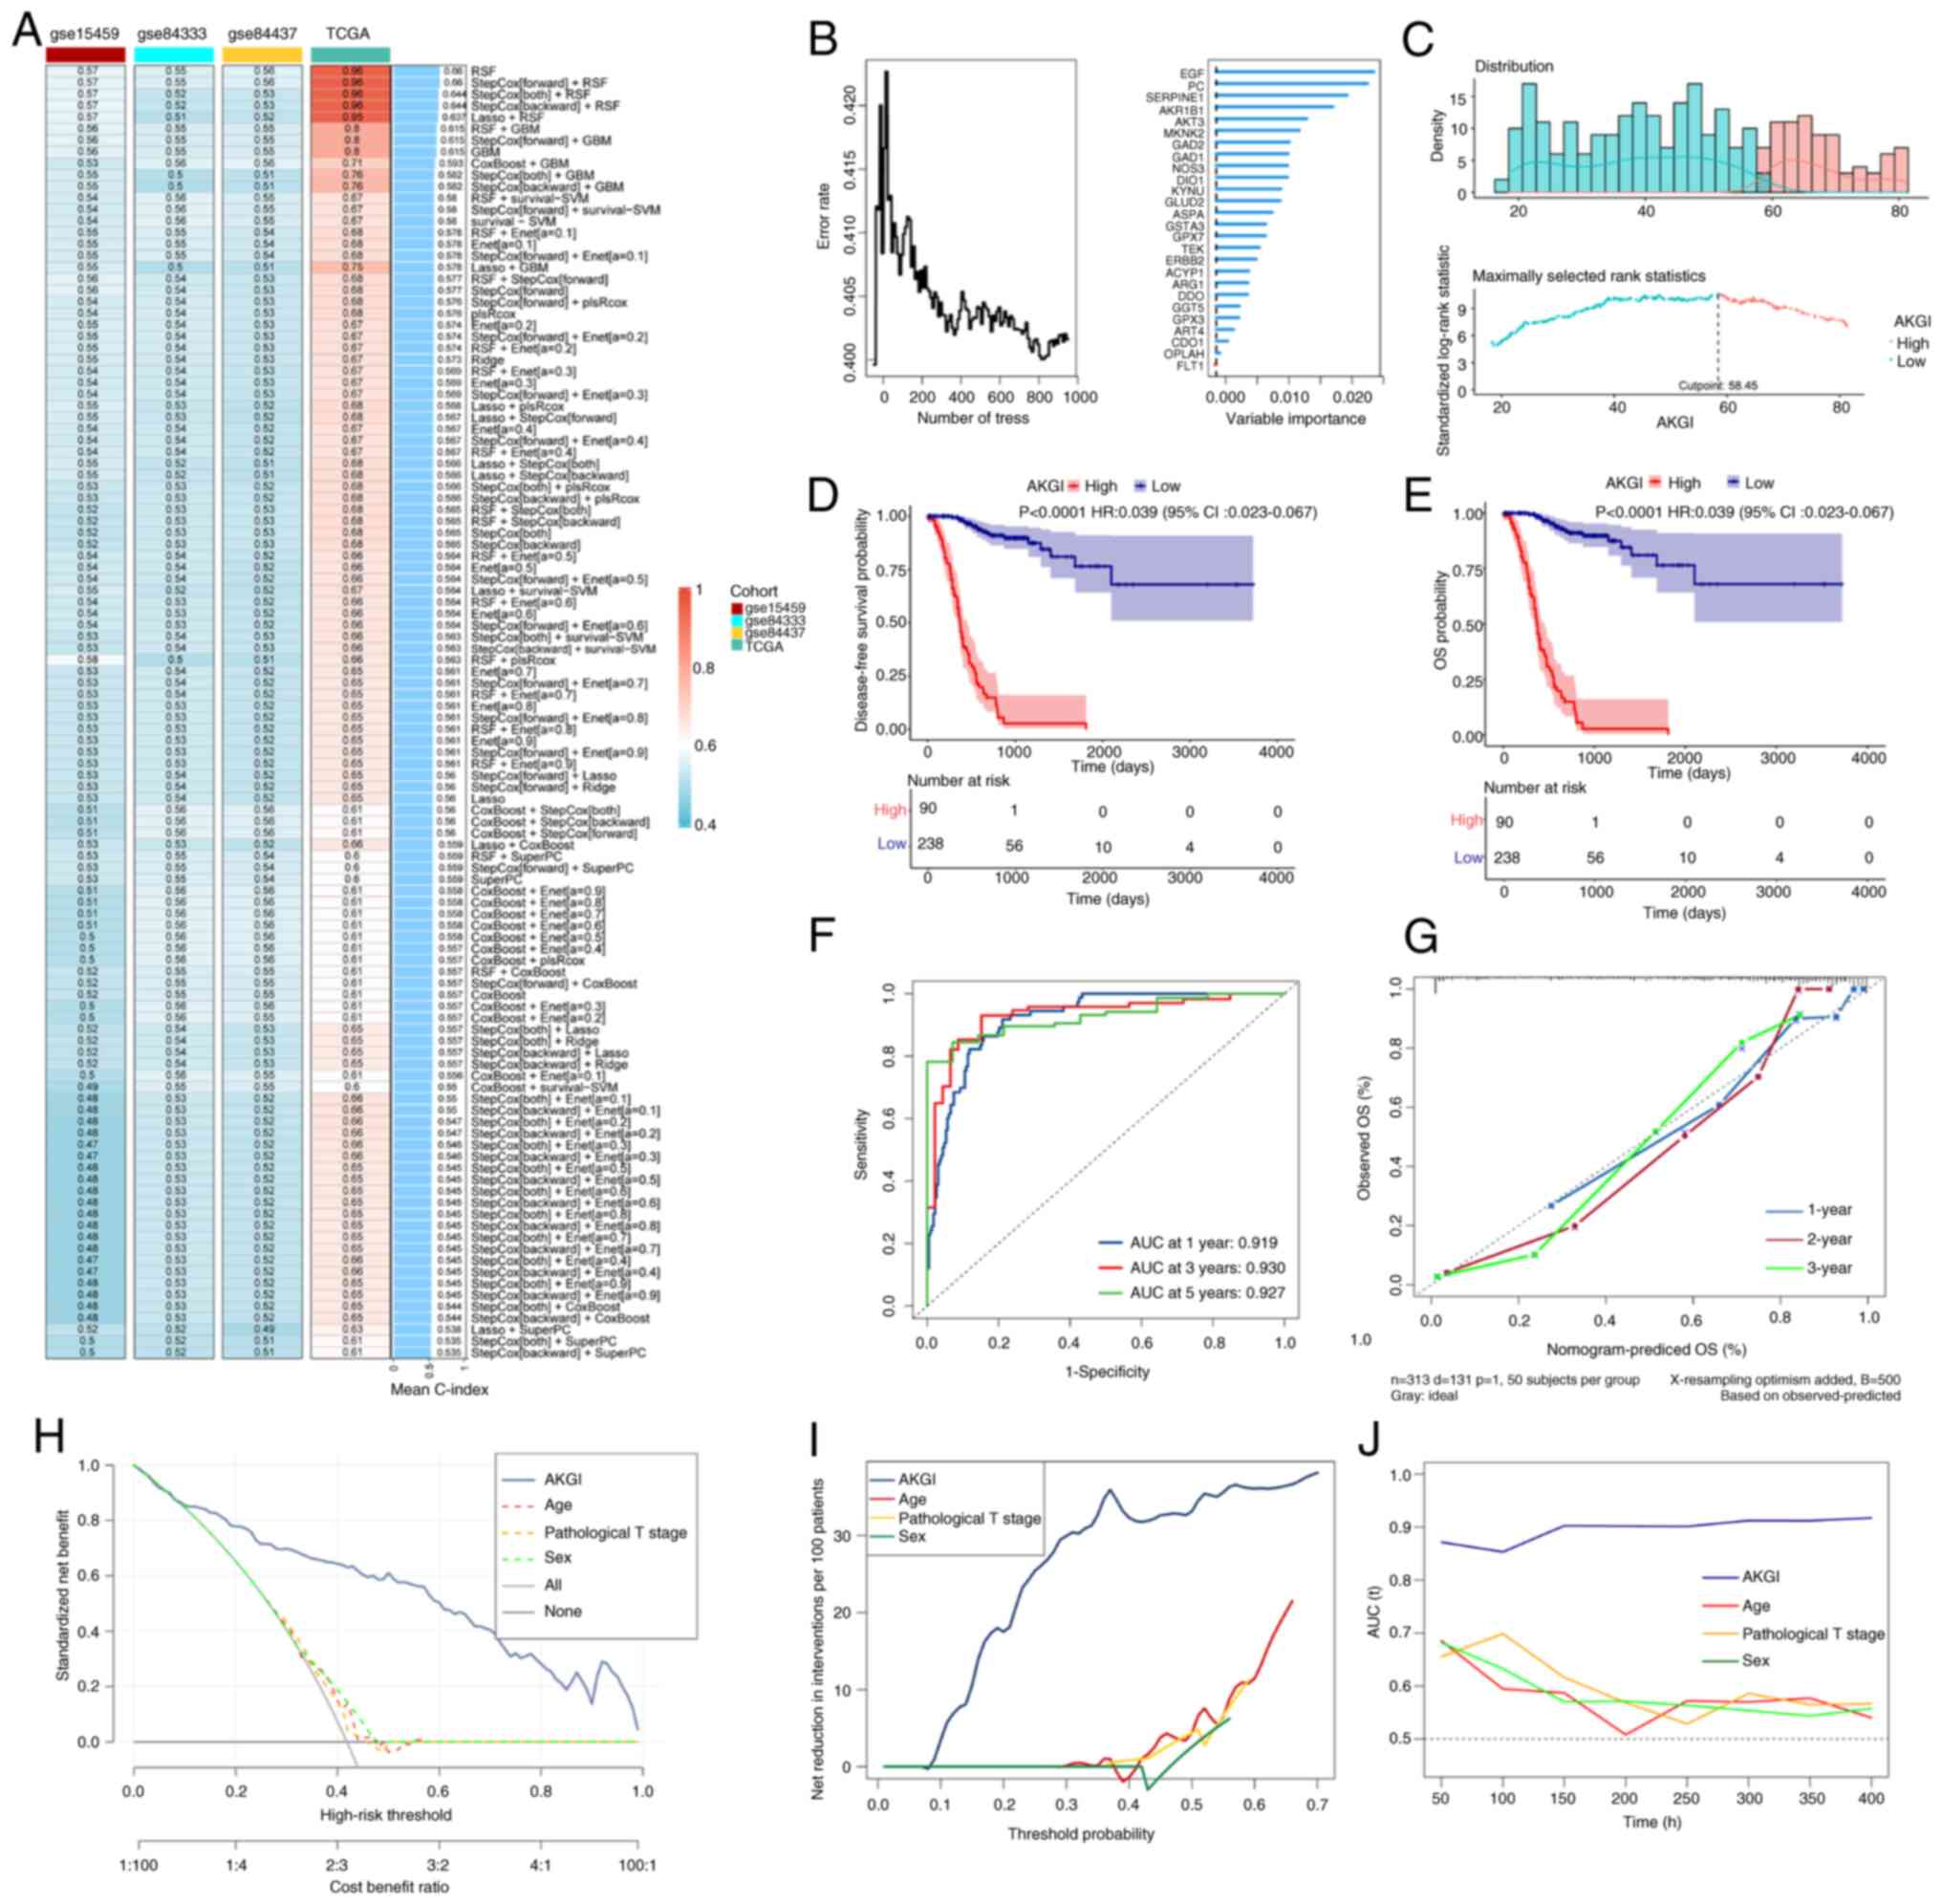 | Figure 2.Development of AKGI using integrative
machine learning algorithms. (A) AKGI was evaluated using 115
machine learning combinations. The C-index was calculated for each
model in the TCGA and Gene Expression Omnibus datasets. The optimal
machine learning model was determined based on the mean C-index.
(B) Error rate of the data as a function of the classification tree
(left panel) and the out-of-bag importance values for the
predictors (right panel). (C) Cutoff values calculated for
stratifying AKGI groups. (D) Disease-free survival and (E) and OS
curves stratified by AKGI in the TCGA dataset. (F) Receiver
operating characteristic curves for 1-, 3- and 5-year OS
predictions in the TCGA dataset. (G) Calibration plots for 1-, 2-
and 3-year OS predictions in the TCGA-STAD cohort. (H) Standardized
net benefit. (I) Net reduction in interventions per 100 patients.
(J) Comparison of the time-dependent C-index among AKGI, age, sex
and pathologic T stage. AKGI, α-ketoglutarate index; C-index,
concordance index; TCGA, The Cancer Genome Atlas; OS, overall
survival; STAD, stomach adenocarcinoma; T, tumor; AUC, area under
the curve; HR, hazard ratio; CI, confidence interval. |
Assessment of the AKGI model
To evaluate the independent predictive ability of
AKGI, further assessments were performed using multiple approaches.
ROC curves based on the TCGA-STAD cohort demonstrated that the AUC
values for AKGI were 0.91, 0.93 and 0.92 for predicting 1-, 3- and
5-year survival, respectively (Fig.
2F). Calibration curves confirmed the accuracy of the AKGI
prediction model for reflecting actual observations (Fig. 2G).
Subsequently, multivariate Cox regression analysis
was performed to evaluate the impact of several clinical factors on
the prognosis of patients with GC, including AKGI, sex, age,
clinical stage and pathological tumor (T) stage. Based on this
analysis, a nomogram was constructed to predict patient outcomes,
which indicated that AKGI was a significant prognostic risk factor
for patients with GC (P<0.05; Fig.
S3), with statistical significance observed at 1-, 2- and
3-year intervals. Additionally, sex, age and pathological T stage
were also identified as high-risk factors for GC prognosis.
Moreover, DCA revealed that AKGI provided
significantly better clinical outcomes than other indicators for
patients with GC, including age, T stage and sex (Fig. 2H and I). Finally, time-dependent
C-index analysis further demonstrated that AKGI exhibited superior
predictive performance compared with other clinical factors
(Fig. 2J).
Biological function analysis of
AKGI
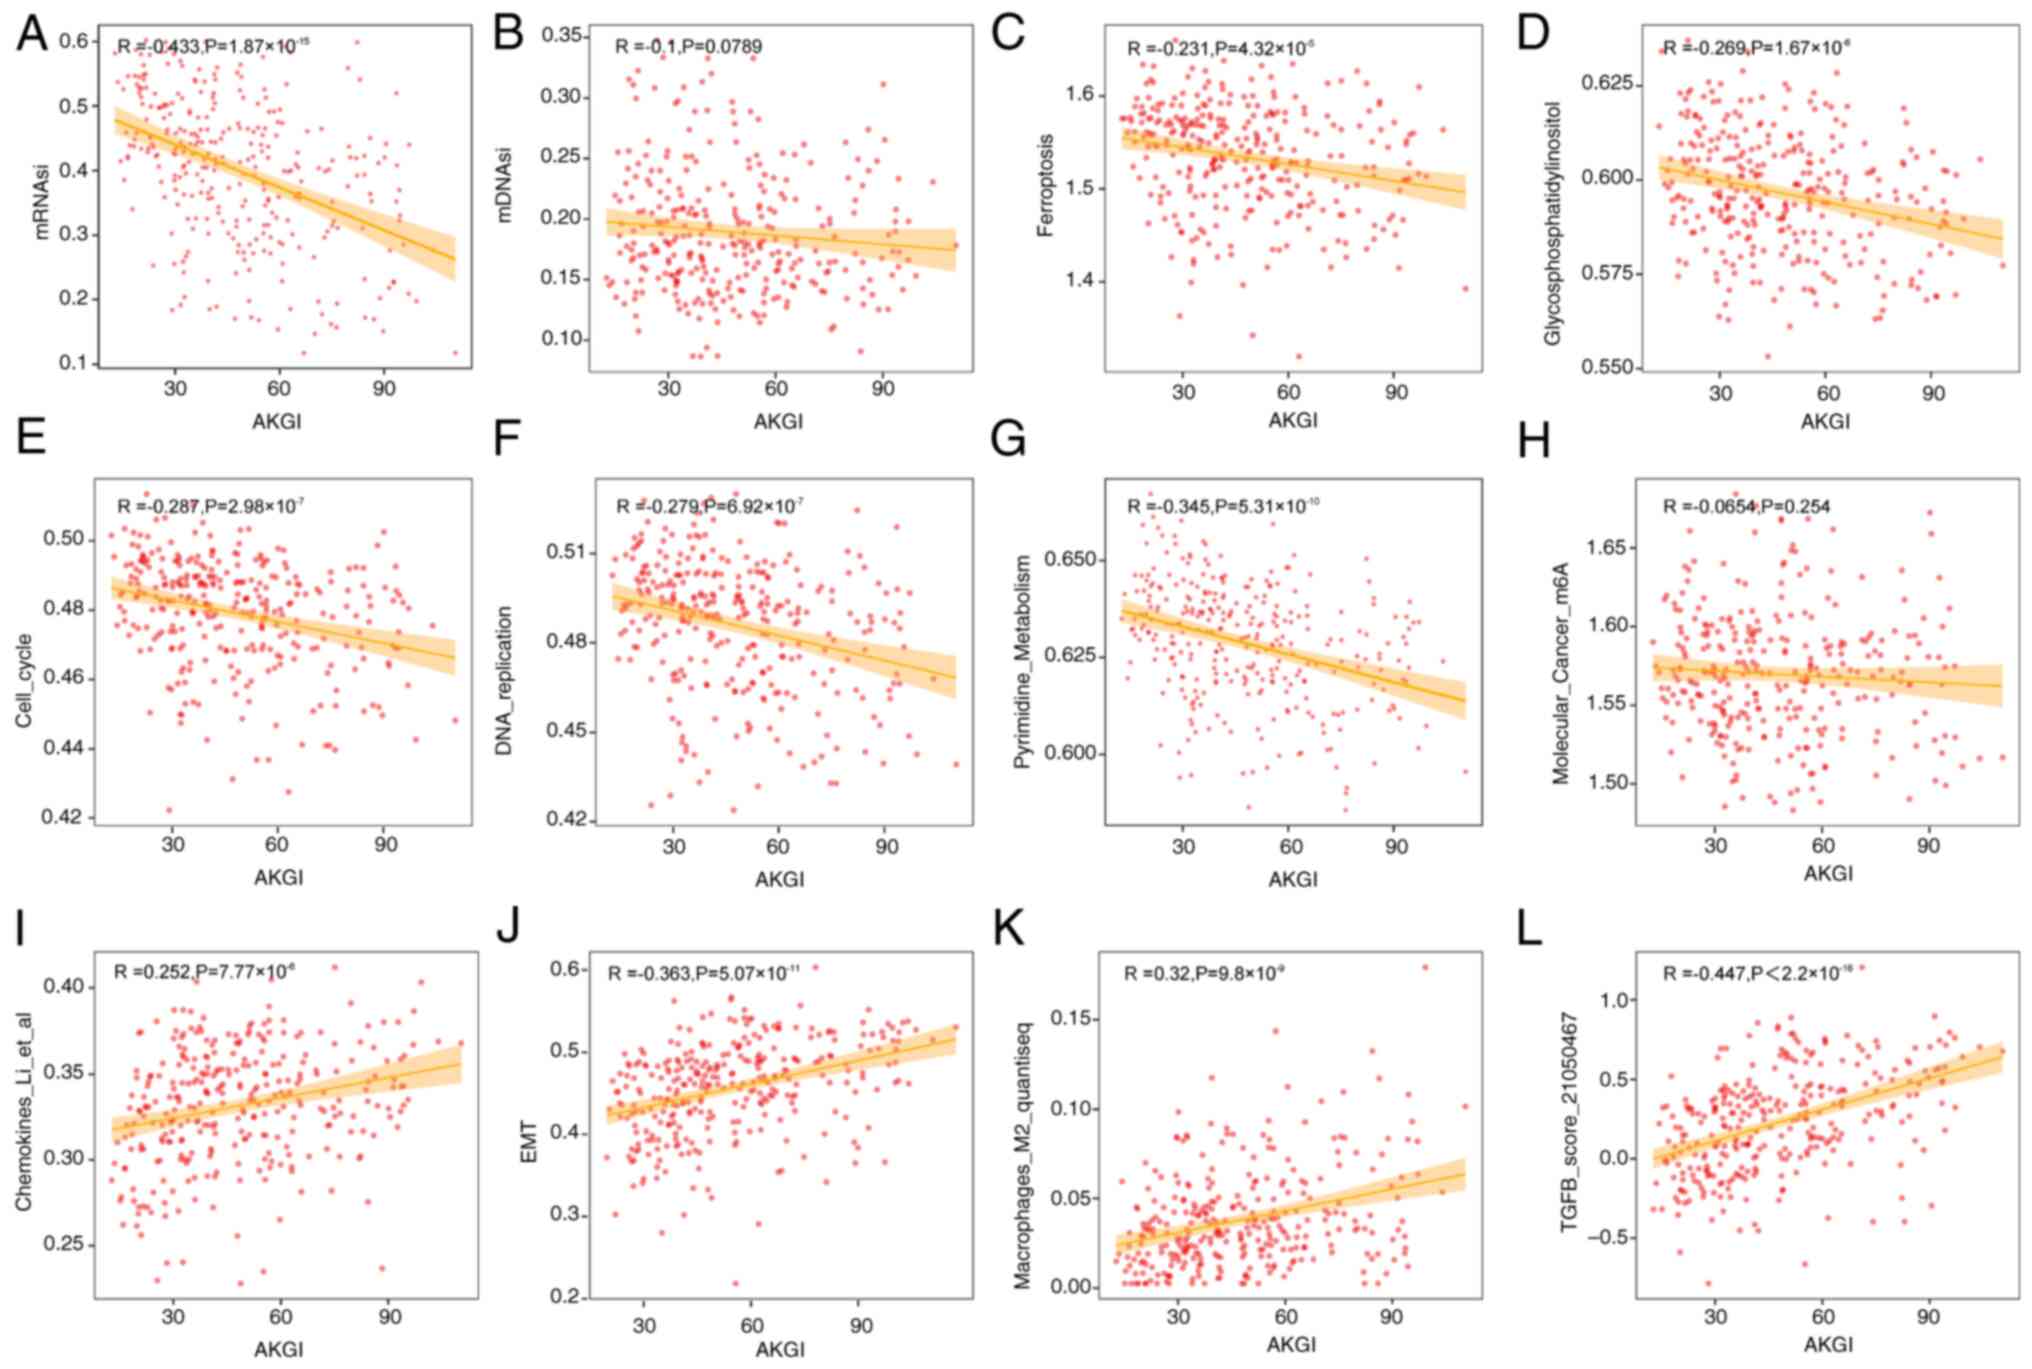
To assess the biological functions associated with
the AKGI prognostic model score, 501 gene sets and functional
scores were collected and a correlation analysis was performed with
AKGI (Table SII). The analysis
identified 34 gene sets significantly correlated with AKGI
(|R|>0.25; P<0.05; Fig. S4).
Among these, the mRNA stemness index (mRNAsi) exhibited the
strongest negative correlation with AKGI (R=−0.433; Fig. 3A). Notably, another stemness index,
the DNA methylation stemness index, demonstrated a weaker
correlation with AKGI (R=−0.1; Fig.
3B).
In addition to mRNAsi, gene sets related to
glycosylphosphatidylinositol, ferroptosis, cell cycle, TGF-β
signaling, EMT and DNA replication demonstrated significant
correlations with AKGI; however, notable m6A scores were not
correlated with AKGI (Fig. 3).
Furthermore, AKGI demonstrated associations with several
immune-related gene sets, including chemokines and macrophage M2
regulation, suggesting that AKGI may be involved in immune
modulation and shaping the immune microenvironment in GC (Fig. 3).
Analysis of immune correlation with
AKGI
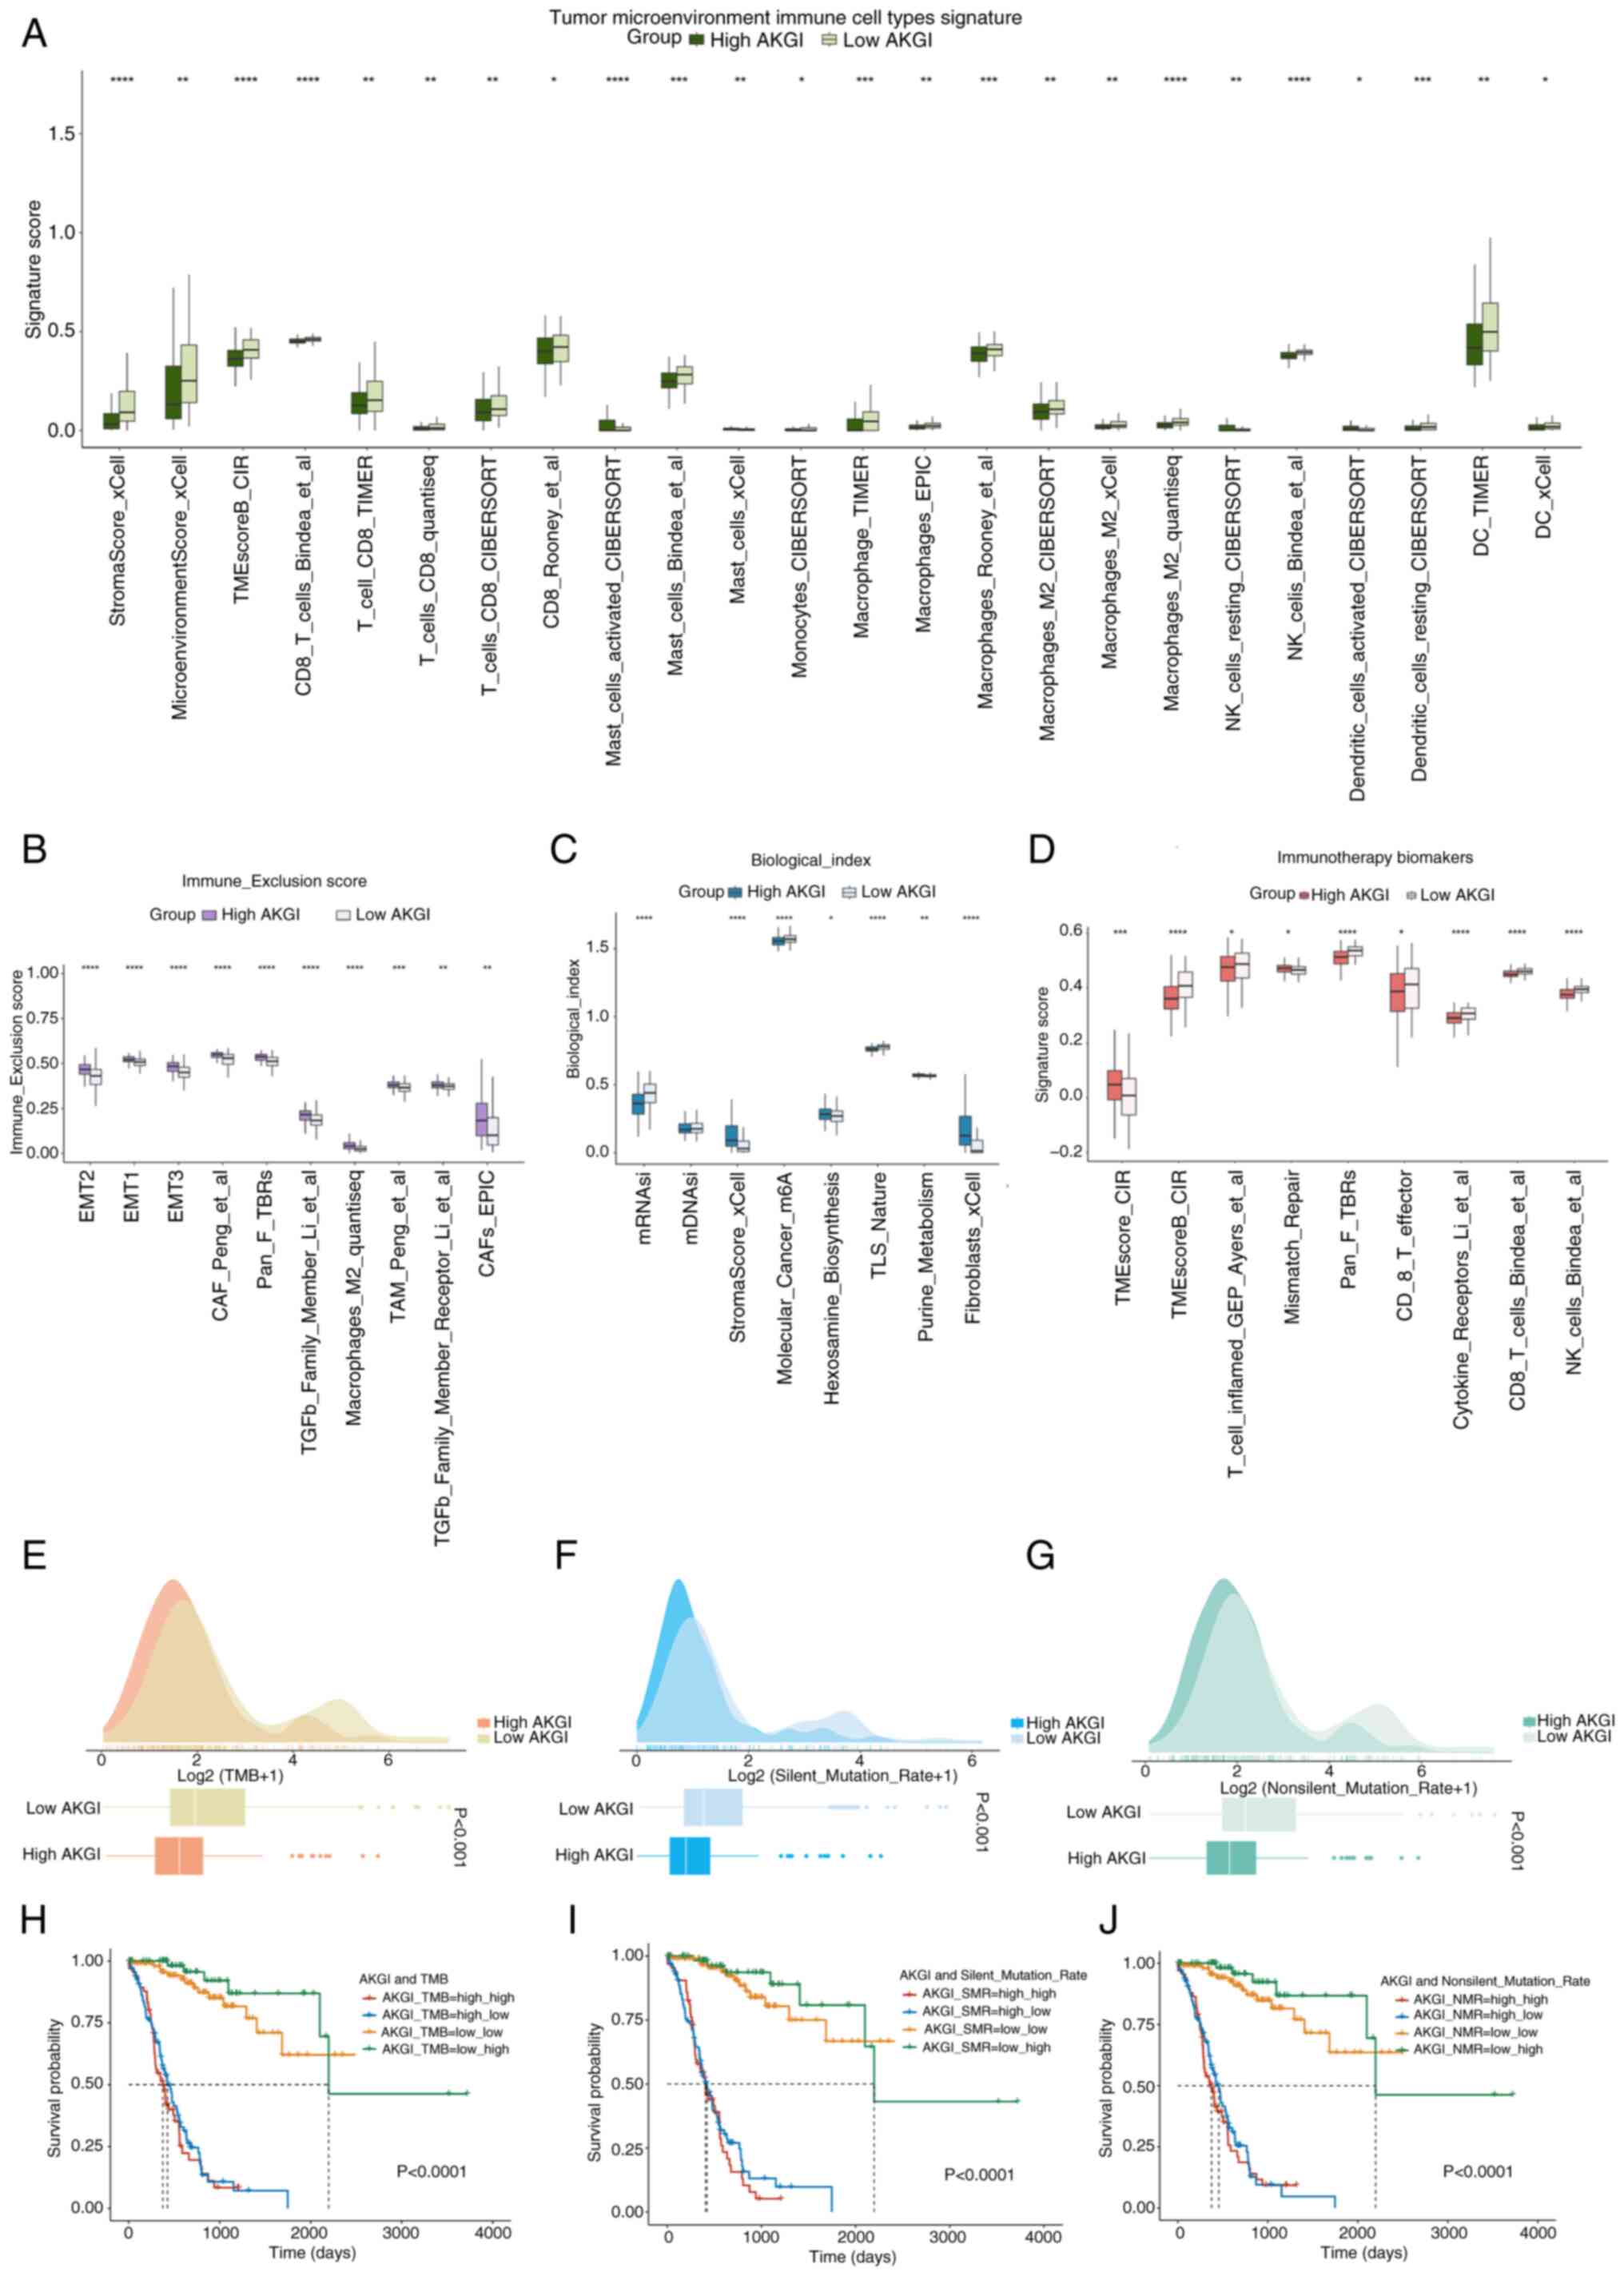
Given the correlation between AKGI and several
immune-related markers in GC, the role of AKGI in the immune
microenvironment was comprehensively evaluated. Results from
multiple immune cell infiltration algorithms demonstrated
significantly lower infiltration levels of tumor-associated immune
cells, including T, natural killer (NK) and stromal cells, in the
high AKGI group, suggesting an immunosuppressive state in this
group (Fig. 4A). Additionally,
molecular markers associated with immune suppression and rejection,
such as those involved in the EMT pathway and TGF-β signaling, were
predominantly enriched in the high AKGI group (Fig. 4B). This finding further supports
that the high AKGI group exhibits characteristics consistent with
an immunosuppressive state.
Gene sets related to malignant tumor treatment and
immunotherapy markers were also assessed. The results revealed that
markers associated with favorable immunotherapy outcomes were
significantly enriched in the low AKGI group compared with the high
AKGI group (Fig. 4C and D). TMB was
compared between high and low AKGI groups. The results revealed
that TMB, silent mutations and missense mutations were
significantly higher in the low AKGI group compared with the low
AKGI group (Fig. 4E-G), indicating
greater immunogenicity in this subgroup.
Further joint analyses of several mutation metrics
demonstrated that AKGI could synergize with TMB, silent mutations
and missense mutations to predict patient prognosis more
effectively. Notably, patients with GC with lower AKGI and higher
TMB levels exhibited significantly improved survival outcomes than
those with higher AKGI (Fig.
4H-J).
Role of AKGI in GC treatment
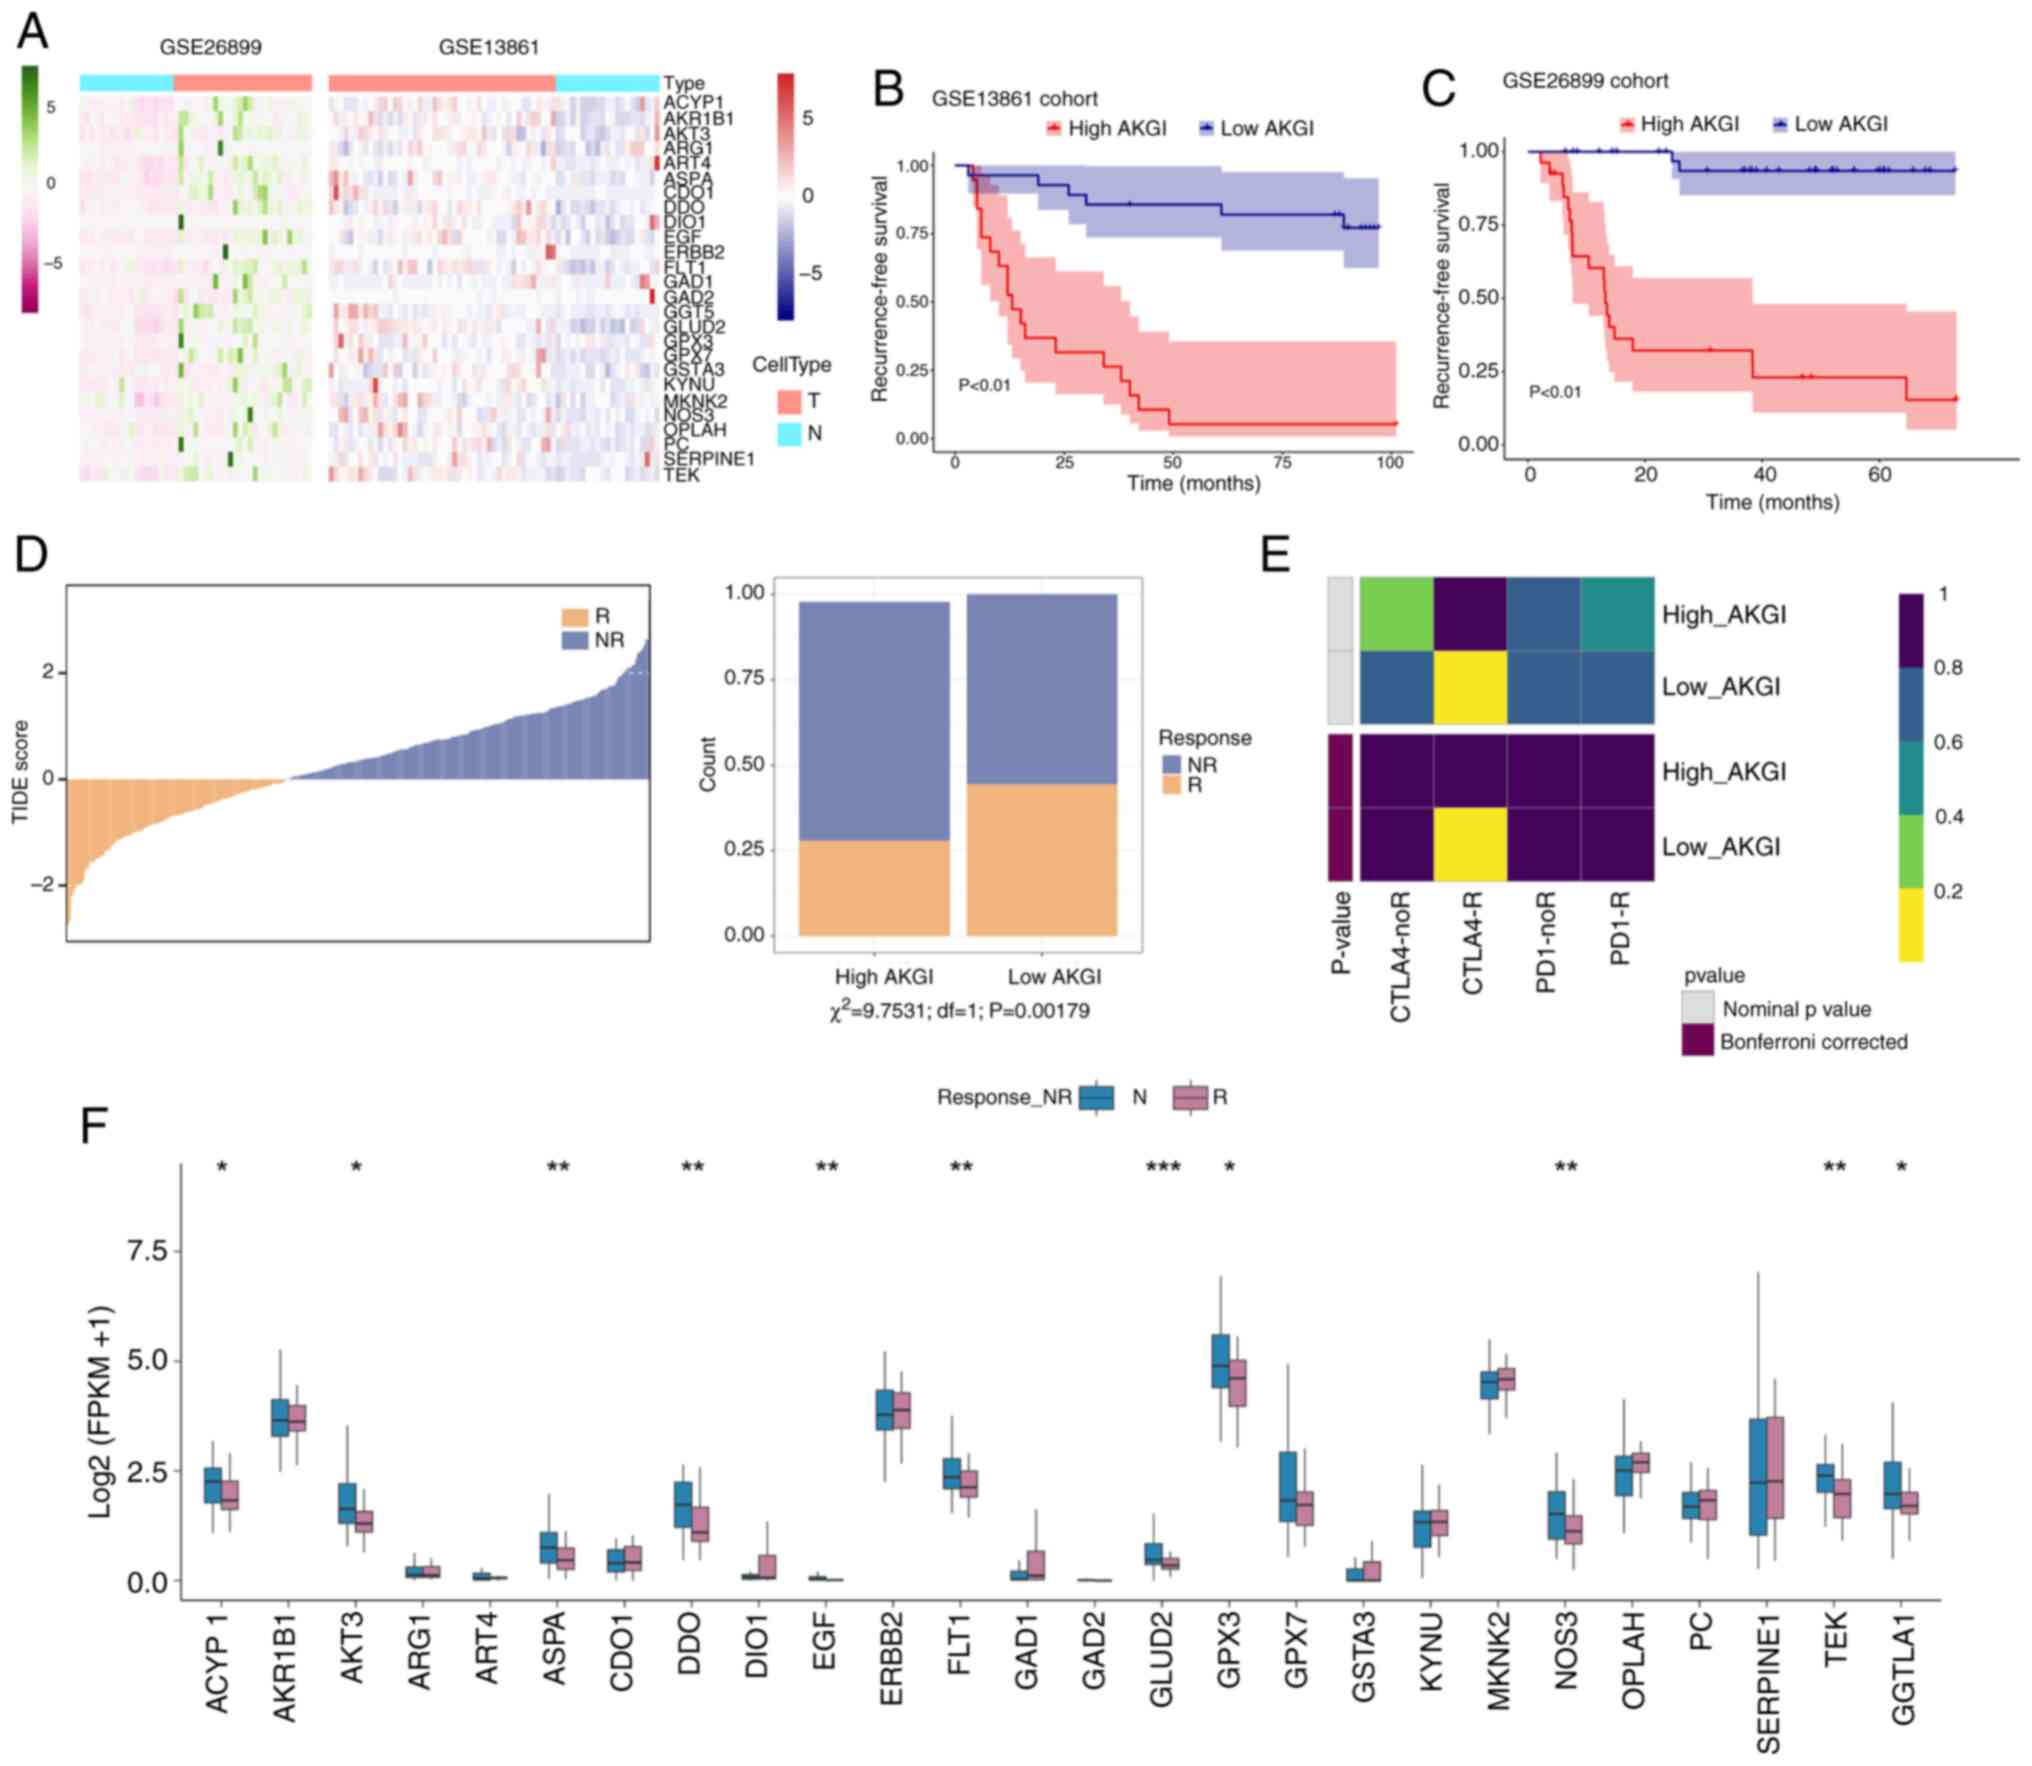
To comprehensively evaluate the potential
application of AKGI in GC therapy, two treatment cohorts were
analyzed, GSE26899 and GSE13861, which provided extensive
prognostic and treatment-related data for this patient population.
In both cohorts, the 26 genes used to construct the AKGI
demonstrated significant differences in expression levels (Fig. 5A). After performing AKG scoring
using the RSF model and determining the cut-point for high/low
group division (Fig. S5).
Prognostic analysis revealed that the high and low AKGI groups had
markedly different survival outcomes, with the low AKGI group
showing a significantly improved prognosis (Fig. 5B and C). These findings further
indicate the utility of low AKGI in assessing therapy outcomes.
Additionally, the TIDE algorithm was applied to
evaluate the responses of patients to immunotherapy. The results
revealed that the low AKGI group exhibited a significantly improved
response to immunotherapy compared with the high AKGI group
(P=0.00179; Fig. 5D). In subgroup
mapping analysis of patients with GC receiving immunotherapy, a
high AKGI level was significantly associated with an improved
response to cytotoxic T-lymphocyte associated protein 4 treatment
in comparison with a low AKGI level (Bonferroni-corrected P=0.008;
Fig. 5E).
Finally, the expression differences of AKGI-related
genes between treatment responder and non-responder groups were
assessed. A total of 11 genes demonstrated a significantly higher
expression trend in the high AKGI group compared with in the low
AKGI group (Fig. 5F), further
confirming that AKGI and its associated genes may provide a
valuable predictive insight into the efficacy of immunotherapy and
chemotherapy for patients with GC.
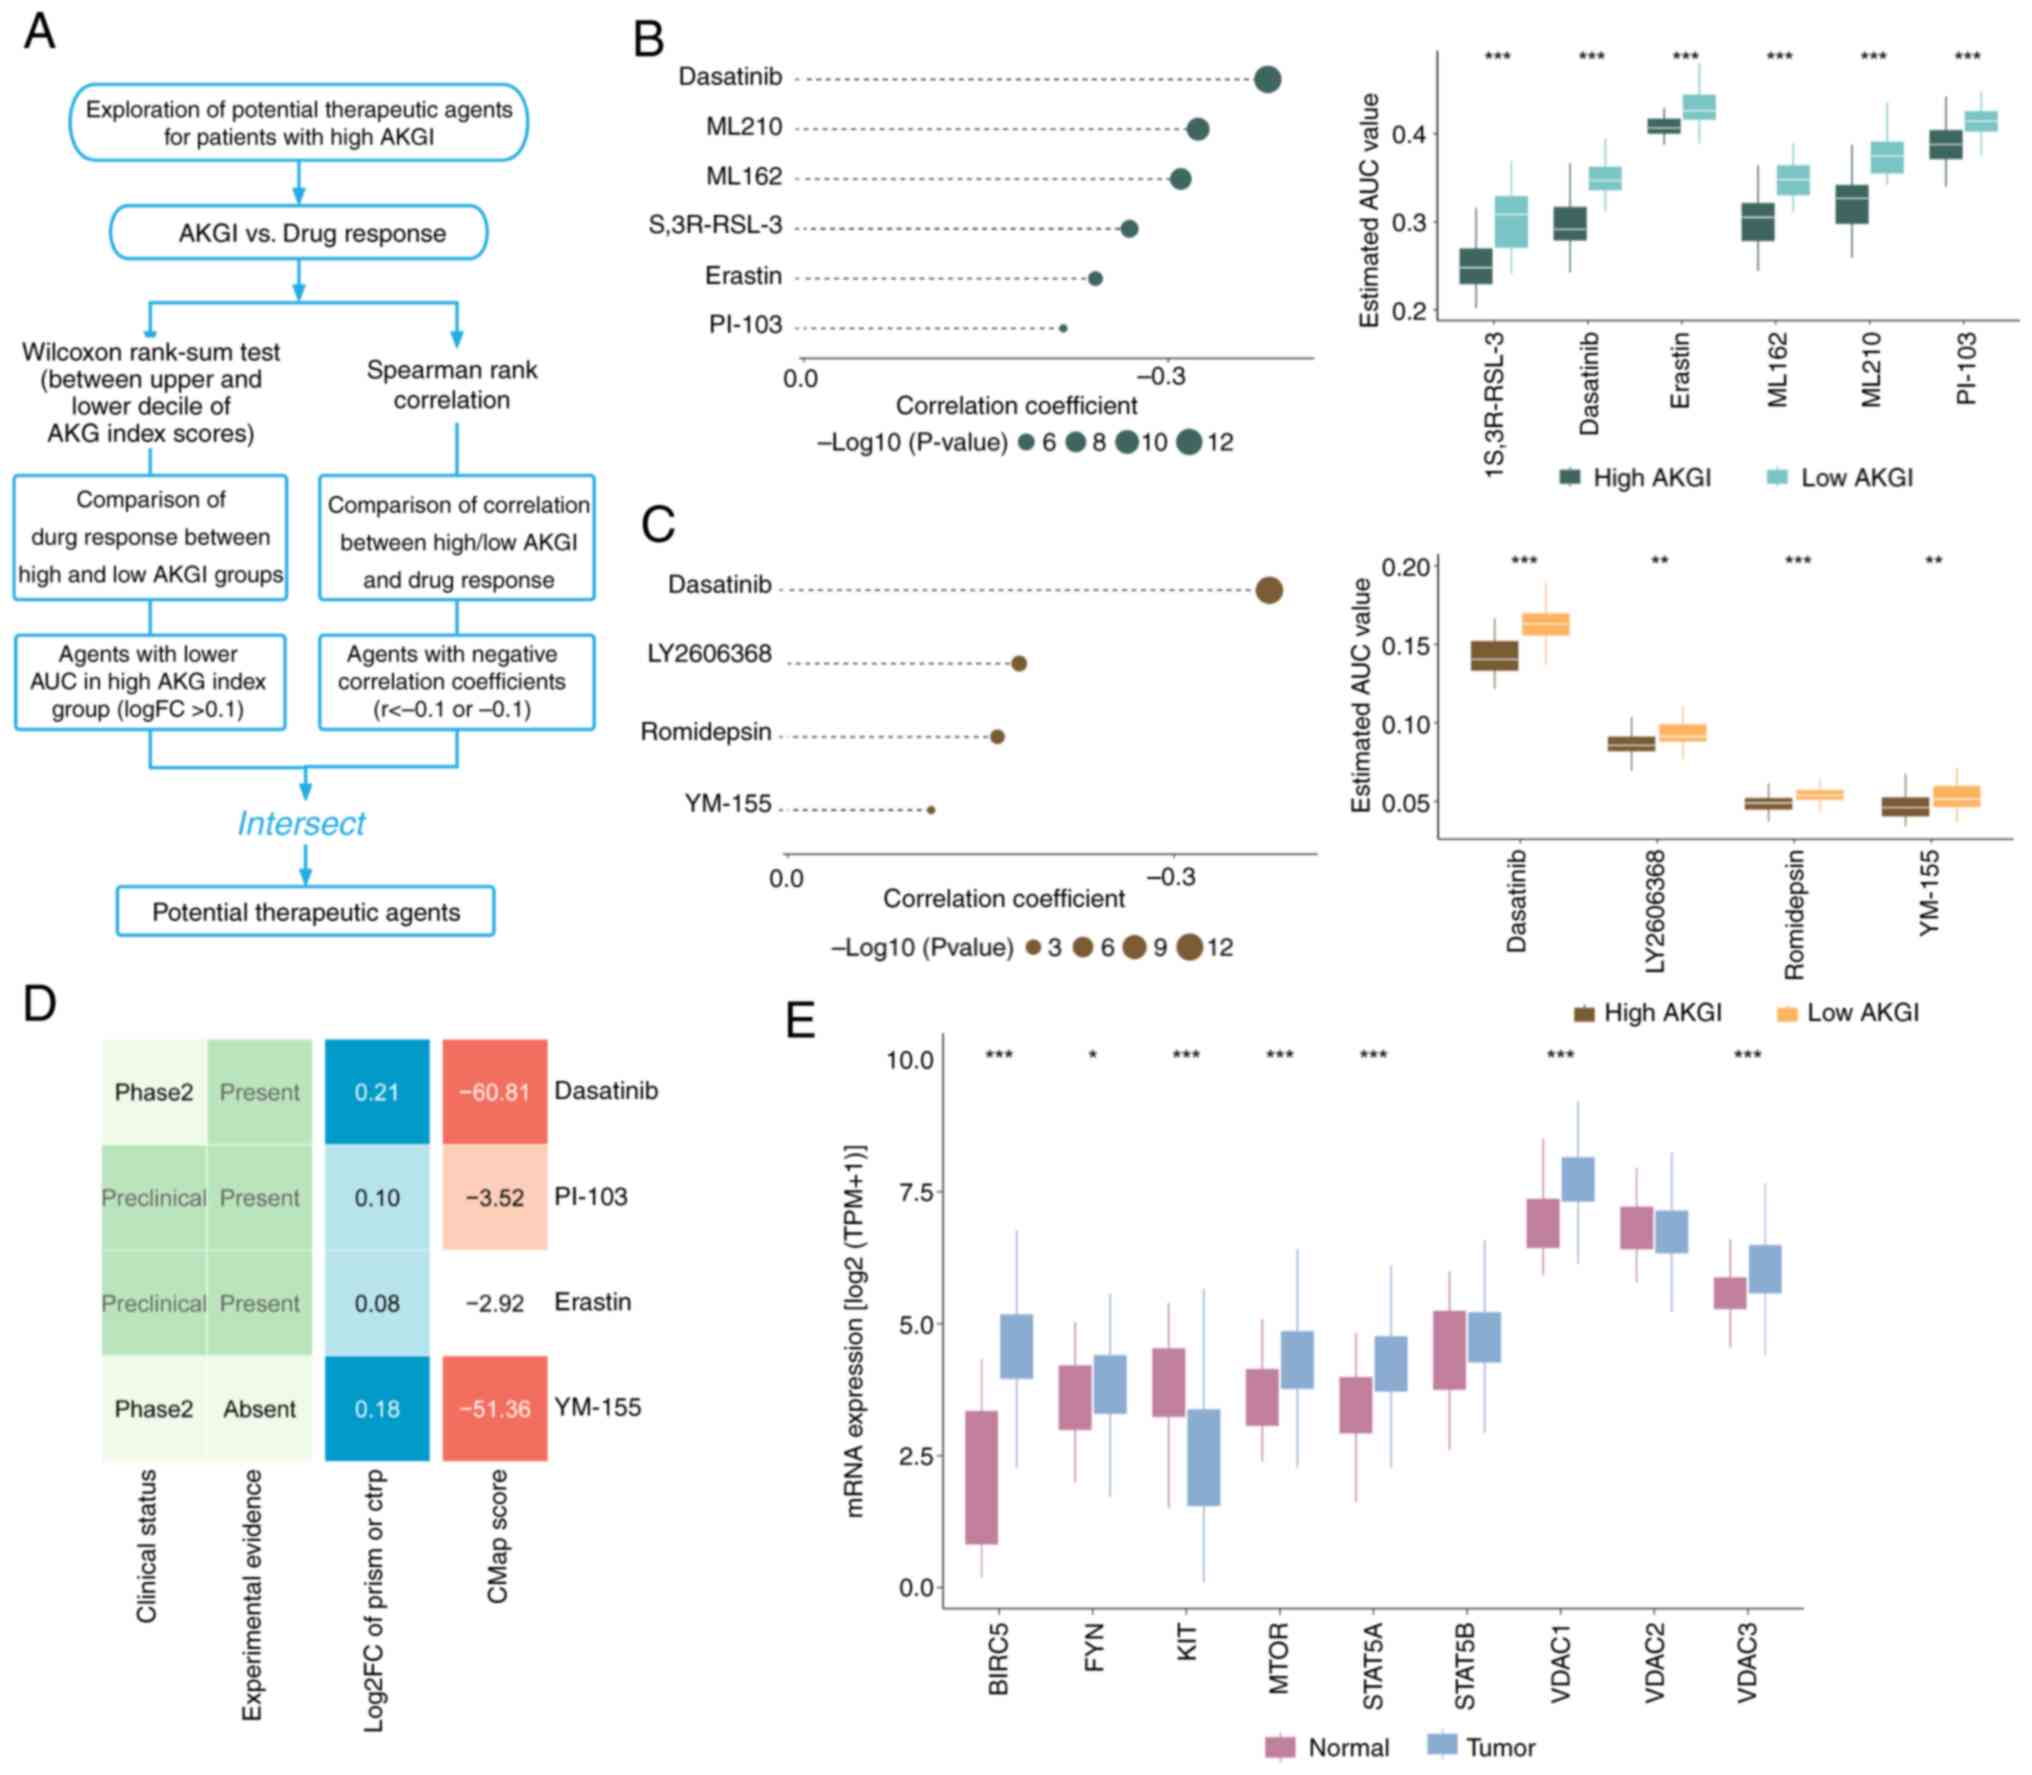
Drug sensitivity prediction based on
AKGI
Given the poor response to therapy in patients with
high AKGI, the CTRP and PRISM databases were utilized to identify
potential therapeutic drugs for this patient group (Fig. 6A). The algorithm produced meaningful
insights through differential drug response analysis between high
AKGI (top decile) and low AKGI (bottom decile) groups.
Specifically, compounds with lower AUC values in the high AKGI
group were identified (log2FC>0.10). To further refine the
selection, Spearman correlation analysis was performed between AUC
values and AKGI scores, focusing on compounds with a negative
correlation coefficient (Spearman r<-0.20 for CTRP and PRISM).
As a result, six potential compounds were identified from the CTRP
database (Fig. 6B) and four from
the PRISM database (Fig. 6C). All
10 compounds exhibited lower AUC values in the high AKGI group
compared with in the low AKGI group, indicating a negative
correlation with AKGI.
Although the 10 candidate compounds demonstrated
higher drug sensitivity in patients with high AKGI scores, this
alone does not confirm their therapeutic efficacy in GC. Therefore,
to evaluate their therapeutic potential, four compounds with more
comprehensive information were selected from the CMap and PubMed
databases for further investigation. First, CMap was used to
identify compounds with gene expression patterns opposite to those
observed in GC-specific profiles. Specifically, compounds that
could downregulate gene expression in tumor tissues after treatment
were focused on, countering the elevated expression seen in
untreated tumor tissues. A total of two of the selected compounds
exhibited CMap scores of <-50, suggesting potential therapeutic
effects in GC. Subsequently, an extensive literature review was
performed using PubMed to identify clinical trials and supporting
evidence regarding the use of the four candidate compounds for GC
treatment. To further assess their potential, the fold change
differences in mRNA expression levels of the target genes between
tumor and normal tissues were calculated. A higher fold change
indicated a greater potential for targeting GC (Fig. 6D).
Among the candidate compounds, the drug targets of
dasatinib and YM-155 exhibited significant expression differences
between tumor and normal tissues (Fig.
6E). Overall, the analysis identified dasatinib and YM-155 as
strong candidates with promising therapeutic potential for patients
with GC with high AKGI signatures.
Functional analysis of α-KG treatment
in GC cells
The aforementioned results demonstrated the
prognostic predictive value of AKGI for patients with GC as well as
the biological functions of α-KG in GC. To validate these findings,
the GC cell lines, MKN74 and AGS, were treated with α-KG and
transcriptomic sequencing was performed on the treated cells.
Phenotypic analysis revealed that compared with the NC group, α-KG
treatment significantly inhibited AGS and MKN74 cell viability
(Figs. 7A and S6A), migration (Figs. 7B and S6B), invasion (Figs. 7C and S6C) and colony formation (Figs. 7D and S6D), which is consistent with previous
reports highlighting the suppressive effects of α-KG on malignant
tumors (8,34,35).
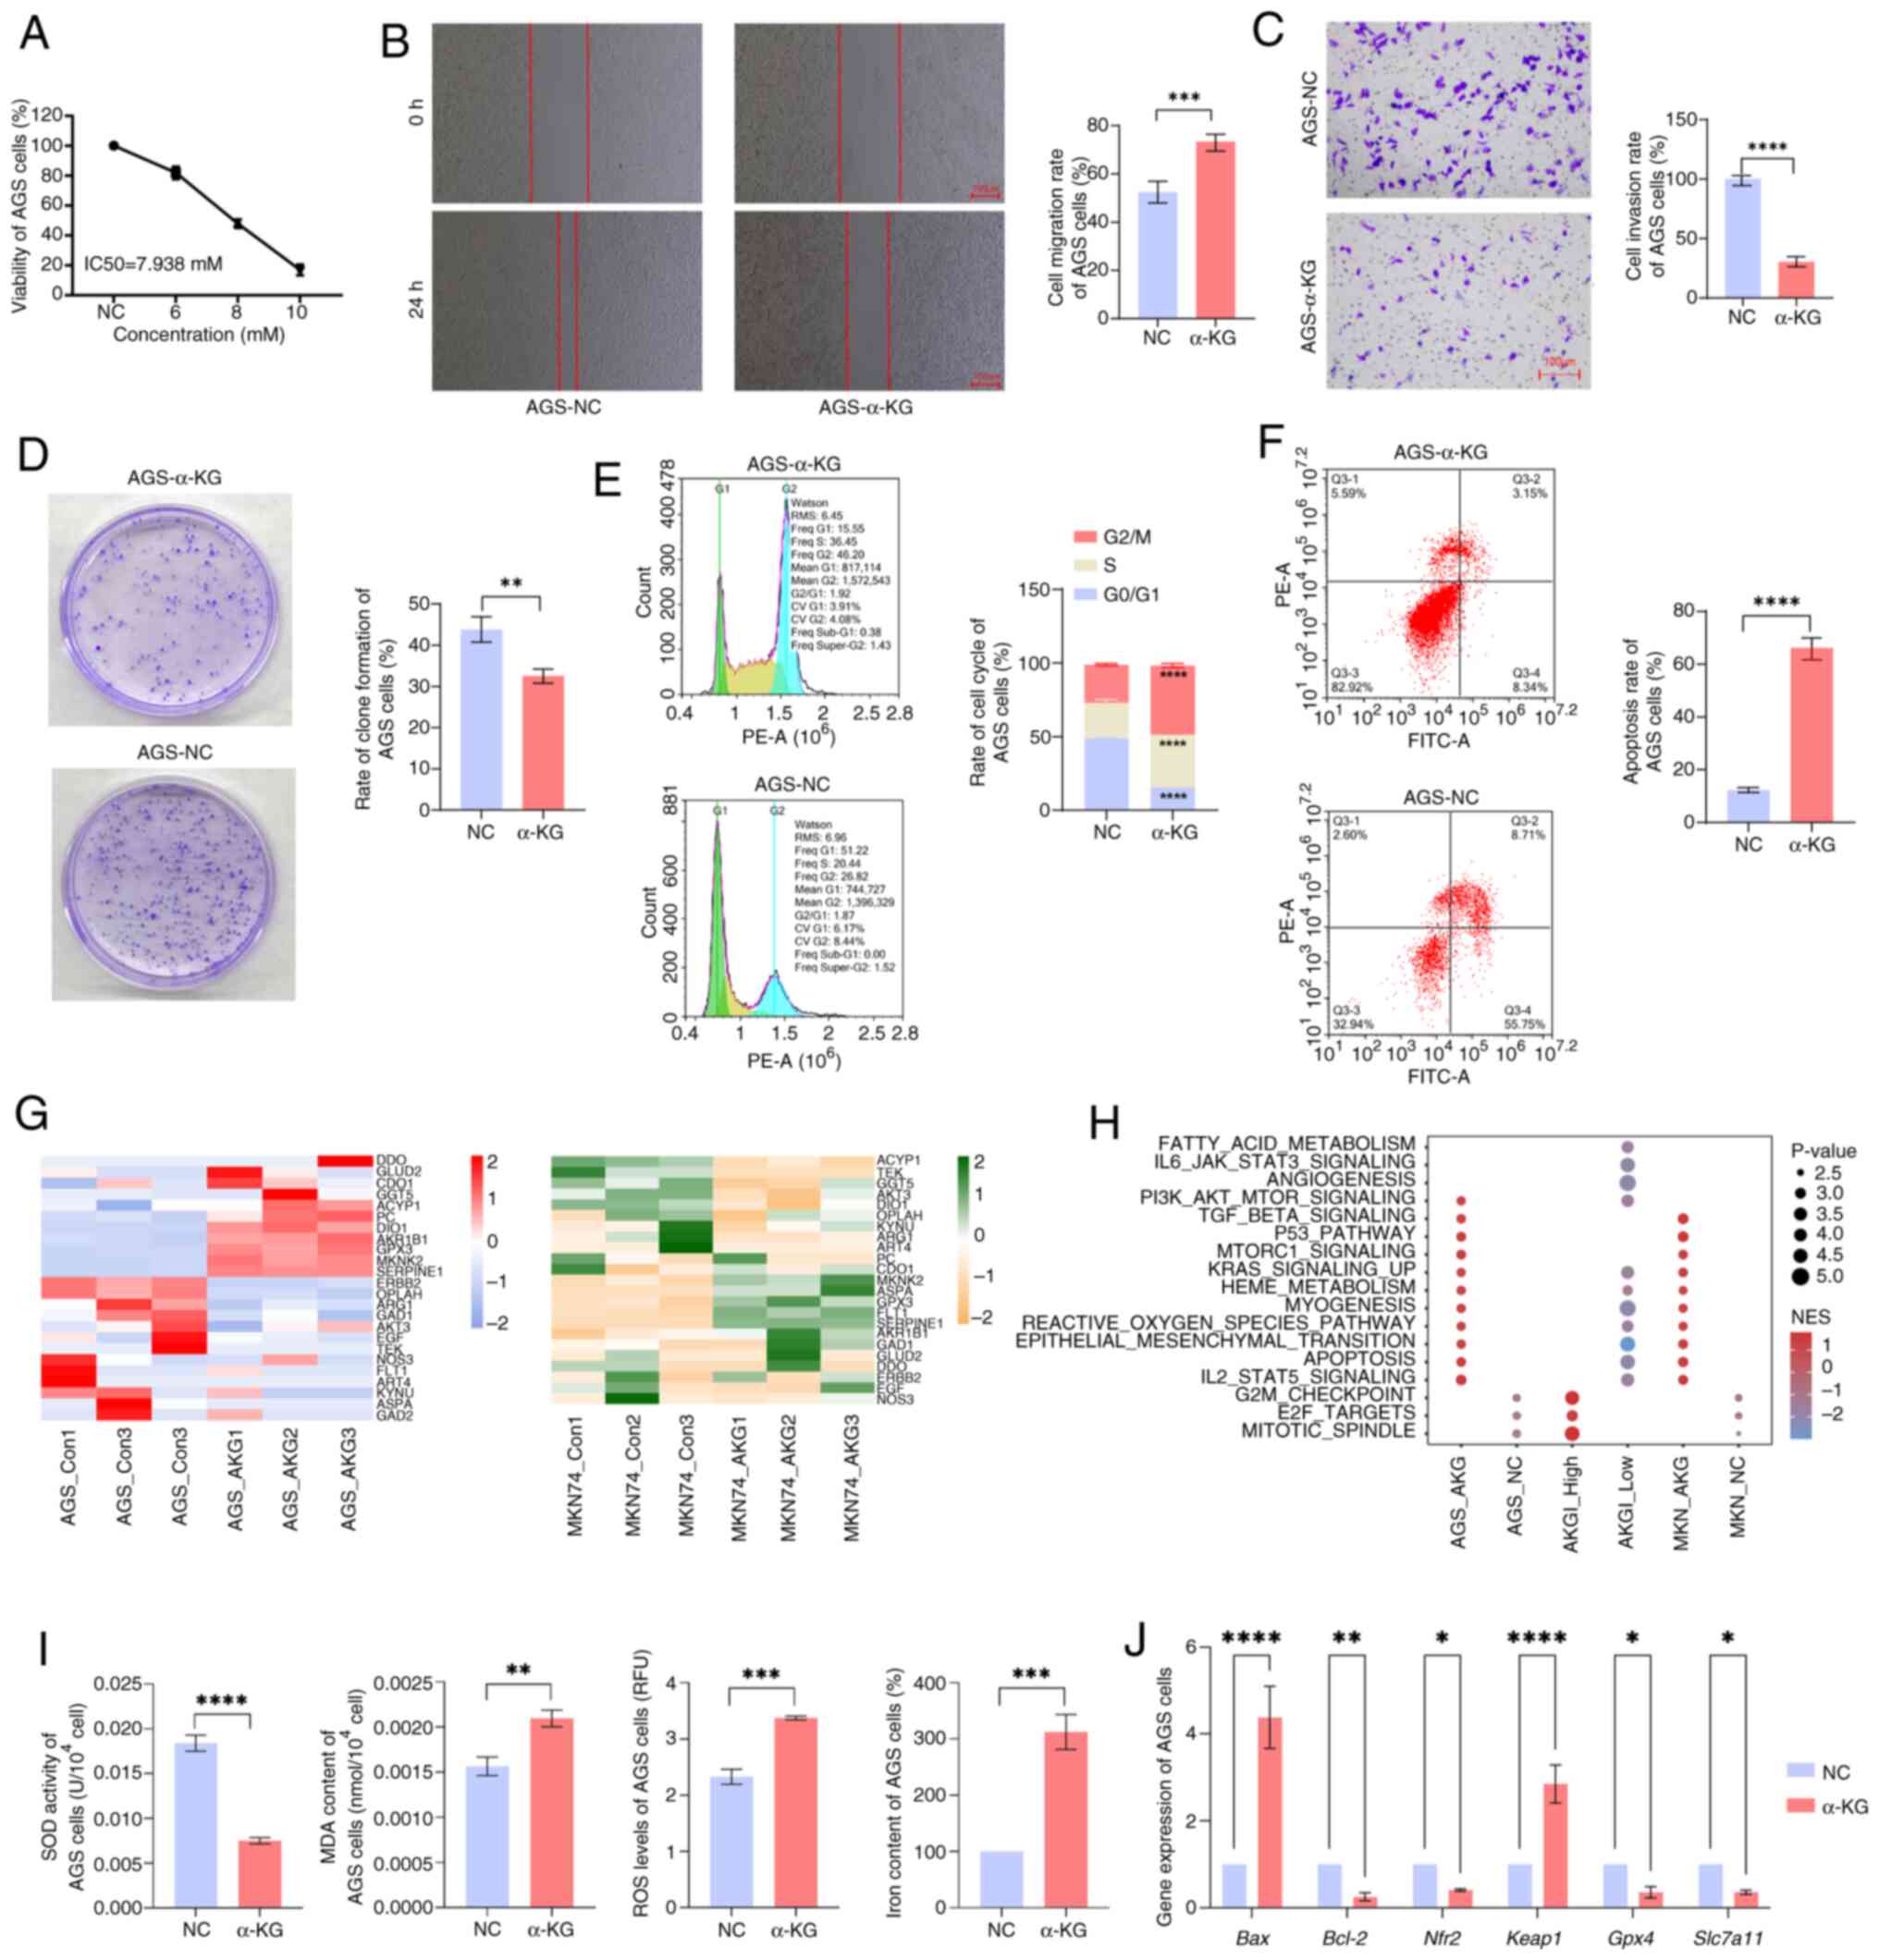 | Figure 7.Validation of experimental results of
gastric cancer cells treated with α-KG. (A) Viability of AGS cells.
Representative and quantitative result of (B) cell migration, (C)
invasion and (D) clone formation. (E) Cell cycle distribution and
percentage of cells in each cell cycle phase. (F) Representative
FACS result of Annexin V/PI staining and quantitative result of
apoptosis rate. (G) Expression profiles of α-KG-related genes in
α-KG-treated AGS and MKN74 cells. (H) Enrichment of signaling
pathways in AKGI high/low groups and α-KG-treated AGS and MKN74
cells. (I) Quantitative result of oxidative stress and
ferroptosis-related biomarkers. (J) Reverse
transcription-quantitative PCR results of apoptosis, oxidative
stress and ferroptosis-related genes. *P<0.05; **P<0.01;
***P<0.001; ****P<0.0001. α-KG, α-ketoglutarate; AKGI, α-KG
index; NC, negative control; NES, nuclear export signal; SOD,
superoxide dismutase; MDA, malondialdehyde; ROS, reactive oxygen
species; Nrf2, nuclear factor erythroid 2-related factor-2; Keap1,
Kelch-like ECH-associated protein 1; GPX4, glutathione peroxidase
4; SLC7A11, solute carrier family 7 member 11. |
Flow cytometry analysis further demonstrated that
compared with the NC group, α-KG-treated cells exhibited cell cycle
arrest in the G2 and S phases (Figs.
7E and S6E), accompanied by a
significant increase in apoptosis levels (Figs. 7F and S6F). This observation aligns with the
aforementioned conclusion that AKGI is closely associated with cell
cycle regulation and ferroptosis.
Subsequently, the impact of α-KG treatment on
AKGI-related gene expression was assessed. Comparative
transcriptomic analysis between α-KG-treated cells and the control
group revealed significant differential expression of genes within
the AKGI model (Fig. 7G). As the
RFS model did not yield conclusive gene regression coefficients,
single-sample (ss)GSEA for KEGG enrichment analysis was applied on
both the transcriptomic data from α-KG-treated cells and the
expression profiles of high and low AKGI groups from TCGA. The
results demonstrated that the transcriptomic expression patterns of
α-KG-treated cells closely resembled those of the low AKGI group,
with significant enrichment in pathways such as KRAS signaling,
EMT, apoptosis and ROS signaling pathways (Fig. 7H).
Further validation of genes significantly enriched
in both the AKGI model and transcriptomic sequencing data was
performed using RT-qPCR analysis (Figs.
7J and S6H). These experiments
demonstrated that, in α-KG-treated MKN74 and AGS cells, the
expression levels of genes involved in apoptosis, ROS-related
pathways and ferroptosis signaling were significantly disturbed in
the α-KG treatment group with the NC group. In addition, the
quantitative result of oxidative stress and ferroptosis-related
biomarkers, as well as the RT-qPCR results of oxidative stress and
ferroptosis-related genes, further indicated the potential effect
of α-KG for inducing oxidative stress and ferroptosis in GC cells
(Figs. 7I and S6G). Additionally, mitochondrial activity
was assessed in α-KG-treated cells. Mitochondrial activity was
significantly reduced following α-KG treatment, in comparison with
negative controls, suggesting impaired mitochondrial function,
possibly associated with apoptosis or oxidative stress (Fig. S7).
In summary, the aforementioned findings suggest that
the inhibitory effects and mechanisms of α-KG on GC cell lines
in vitro are closely aligned with the biological processes
observed in the low AKGI group. This provides further evidence
supporting the molecular mechanisms by which α-KG exerts its role
in GC.
Discussion
Integrated machine learning methods have been widely
applied to the development of cancer prediction models and target
gene screening, achieving excellent predictive outcomes in
colorectal cancer, lung adenocarcinoma and GC (36–38).
The present study used machine learning methods to systematically
evaluate the prognostic significance of α-KG-related genes in GC
and analyzed the mechanisms of α-KG in GC based on a prediction
model. By integrating machine learning approaches, 26 α-KG-related
genes were identified, which were used to construct a prognostic
model, AKGI, via RSF. Using nomograms, DCA and AUC curves, it was
demonstrated that AKGI has excellent predictive performance.
Furthermore, the results revealed a complex and multifaceted
relationship between AKGI, the TME and drug sensitivity in GC.
These findings underscore the potential clinical application of
AKGI in guiding personalized treatment decisions.
As an important factor involved in cellular
metabolism, the TCA cycle and epigenetic modifications, α-KG has
demonstrated notable inhibitory effects on tumors (4). Based on the constructed AKGI, the
results of the present study revealed that AKGI is closely
associated with key processes such as stemness, ferroptosis and EMT
in GC. This is a finding that is consistent with the reported
biological functions of α-KG in other cell types. For example, in
naive embryonic stem cells (ESCs), exogenous α-KG maintains ESC
self-renewal and regulates the expression of pluripotency-related
genes by altering the α-KG/succinate ratio, which influences
chromatin modifications such as H3K27me3 and TET-dependent DNA
demethylation (39). In diffuse
large B-cell lymphoma, treatment with α-KG derivatives promotes
oxidative stress in double-hit lymphoma through malate
dehydrogenase 1-mediated 2-HG conversion. This process increases
ROS, leading to lipid peroxidation, tumor protein p53 activation,
ferroptosis, and, ultimately, tumor growth inhibition (40).
Tumor cells possess mechanisms to evade immune
surveillance and resist therapeutic drugs, promoting survival and
progression (41). The findings of
the present study revealed a complex relationship between AKGI and
tumor immunity in GC. By exploring AKGI features at the
immune-infiltration level using several algorithms, it was
demonstrated that the high-AKGI group exhibited lower enrichment of
several immune cell types, including T cells, macrophages and NK
cells. According to Suzuki et al (42), α-KG can counteract CD8 T-cell
dysfunction triggered by glutamine metabolism disruptions, thereby
enhancing T-cell functionality. Furthermore, α-KG modulates gene
expression patterns in CD8 T cells by participating in the
regulation of H3K27 demethylation, thus fine-tuning their activity
(42). The regulatory effects of
α-KG on NK cells likely occur primarily through the TCA cycle and
redox reactions. Although direct evidence linking α-KG to NK cell
activity regulation remains elusive, as a key TCA cycle substrate,
α-KG may contribute indirectly. For example, when NK cells uptake
exogenous pyruvate, it is reduced to lactate to regenerate
glycolytic NAD+ and oxidized in the TCA cycle to produce
ATP, thereby fueling NK cell effector functions (43). This finding underscores the
potential role of α-KG in NK cell modulation.
As T cells and NK cells serve pivotal roles in
suppressing tumor growth in GC, with associations demonstrated with
improved prognosis and heightened immunotherapy responses, reduced
infiltration of these immune cells is associated with unfavorable
outcomes and accelerated malignant progression (44). Low infiltration levels of T cells or
NK cells have been reported to be associated with a worse prognosis
and malignant progression in GC (44). Furthermore, ssGSEA-based correlation
analysis revealed that cancer progression-related pathways,
including the TGF-β signaling pathway, EMT signaling pathway and
cell cycle signaling pathway, were significantly correlated with
AKGI. These findings provide further insights into the mechanisms
through which AKGI and α-KG influence tumor immunity in GC.
Given the association between AKGI and tumor
immunity, the present study further evaluated its significance in
immunotherapy using TIDE, immune evasion and TMB analyses. As a key
index for evaluating tumor immunotherapy, the results demonstrated
that the low-AKGI group exhibited higher TMB levels, potentially
contributing to an improved immune response (45). As a tool for evaluating tumor
immunotherapy, TIDE provides scores that indicate the likelihood of
immune evasion in malignant tumors (46). The elevated TIDE scores observed in
the high AKGI group support the concept that immune evasion is
associated with high AKGI.
However, in the AKGI model in the present study, the
correlation between AKGI and immune infiltration was primarily
derived from bulk-seq-based immune-infiltration analysis tools
(such as CIBERSORT). Single-cell sequencing offers a more precise
depiction of the immune microenvironment in malignant tumors
(47). Therefore, further analyses
and experimental validation of AKGI and α-KG at the single-cell
level in GC are warranted to deepen the understanding of their
roles.
As the AKGI model in the present study demonstrated
an excellent performance in predicting GC prognosis and serving as
a predictive marker for personalized treatment selection, a drug
sensitivity analysis was performed that was based on AKGI to
identify several potential compounds that could benefit patients
with GC. This analysis may facilitate the development of more
effective therapeutic strategies for GC. Notably, dasatinib has
been reported to exert tumor-suppressive effects in GC (48). Dasatinib, a potent SRC family kinase
(SFK) inhibitor, disrupts critical signaling pathways involved in
cell proliferation, migration and survival. By inhibiting SFKs,
dasatinib affects cell cycle regulation and DNA replication, which
are pathways closely linked to AKGI. SFK inhibition also impacts
pyrimidine metabolism, crucial for nucleotide biosynthesis, thus
interfering with cancer cell metabolism. Additionally, dasatinib
may enhance immune modulation, as it influences tumor-associated
macrophages and immune checkpoints, complementing AKGI-related
immune evasion mechanisms. When used in combination with cisplatin
or oxaliplatin, it notably inhibits GC progression. Cadherin 1,
bromodomain containing 4 and TNF-related apoptosis-inducing ligand
receptor 1 have been identified as therapeutic targets of dasatinib
in GC cells (49–51).
Another predicted compound, YM-155, is a small
imidazolium-based agent that has specific activity against the
survival of cancer cells. It has been reported to inhibit colony
formation in GC cells, promote apoptosis and ultimately suppress GC
progression (52,53). In a mouse model using
patient-derived GC xenografts, injection of YM-155 markedly
inhibited cell proliferation, induced apoptosis, reduced cancer
stem cell expansion and suppressed xenograft tumor growth in GC
cells (54), reinforcing
AKGI-regulated pathways. Moreover, YM-155 has demonstrated a
favorable safety profile and notable anticancer activity in several
Phase I/II clinical trials, particularly in esophageal cancer,
prostate cancer and non-Hodgkin lymphoma (55,56).
Originally introduced as an imidazolium-based survivin suppressant,
YM-155 exhibits potent antitumor effects, especially in
hormone-refractory prostate cancer (53). Its therapeutic action was initially
attributed to the suppression of survivin expression, which
subsequently induced apoptosis. Survivin, a critical regulator of
cellular homeostasis, serves a key role in several cellular
processes, including the inhibition of apoptosis and regulation of
cell division. Beyond its effects on survivin, YM-155 operates
through multiple mechanisms, including the modulation of epigenetic
regulation, which has also been reported to be associated with the
functional role of AKG (57).
Specifically, YM-155 influences the expression of genes involved in
DNA repair and cellular stress responses, which are vital for
maintaining cellular integrity under oncogenic stress (53,58,59).
These epigenetic alterations are crucial in cancer therapy, as they
can enhance the ability of a tumor to repair DNA damage and manage
stress-induced signals.
Through the bioinformatics analysis in the present
study, the potential role and biological function of α-KG in GC was
demonstrated. To corroborate the bioinformatic observations, two GC
cell lines (AGS and MKN74) were treated with α-KG in vitro
and cell proliferation, migration and apoptosis were assessed. The
results revealed that α-KG treatment mimicked the biological
functions observed in the low-AKGI group. Significant enrichment of
ferroptosis, cell cycle regulation and ROS signaling pathways was
also demonstrated in the α-KG-treated group. These pathways not
only show a strong negative association with AKGI, but have also
been shown to serve a critical inhibitory role in the progression
of GC (60,61).
In conclusion, the results of the present study
highlight that α-KG-related genes have significant prognostic value
in GC and are potential therapeutic targets. While the findings
offer valuable insights into the clinical implications of the AKGI
signature, several limitations must be acknowledged. First, the
analyses relied heavily on retrospective data, necessitating future
studies to validate the clinical relevance of the findings.
Additionally, the limited sample size and incomplete clinical
information mean that AKGI cannot yet be considered an independent
predictor. The combination of machine learning methods with
biological validation provides a powerful framework for identifying
new biomarkers and therapeutic strategies for cancer. Future
research should explore the clinical applicability of α-KG-related
prognostic models. Moreover, given the complex nature of GC and its
diverse histological phenotypes, comprehensive mechanistic and
clinical investigations are required to elucidate the role of
α-KG-related genes in different GC subtypes. Further in vivo
and in vitro studies are warranted to clarify the mechanisms
underlying GC prognosis. Overall, the AKGI model established in the
present study provide a novel prognostic predictor and theoretical
foundation for the diagnosis, prognosis assessment and mechanistic
investigation of α-KG in GC. However, addressing the aforementioned
limitations will be essential to strengthen the validity and
applicability of the findings.
Supplementary Material
Supporting Data
Supporting Data
Supporting Data
Acknowledgements
Not applicable.
Funding
The present research was supported by the National Natural
Science Foundation of China (grant no. 82060567) and Scientific
Research Projects of the Inner Mongolian Higher Educational System
(grant no. NJZY22674).
Availability of data and materials
The transcriptomic data generated in the present
study may be found in the Gene Expression Omnibus under the
accession number GSE285448 or at the following URL: https://www.ncbi.nlm.nih.gov/geo/query/acc.cgi?acc=GSE285448.
All other data generated in the present study may be requested from
the corresponding author.
Authors' contributions
FL, GL and LS designed the study. FL, XS and YZ
performed data management and statistical analysis, and drafted the
manuscript. YZ helped with cohort identification and data
management. XS, XM and RZ performed the molecular experiments. GL
contributed to the critical revision of the manuscript. FL and GL
confirm the authenticity of all the raw data. All authors read and
approved the final manuscript.
Ethics approval and consent to
participate
The present study was approved by the Ethical Review
Committee of Inner Mongolia Medical University and performed
according to the Declaration of Helsinki.
Patient consent for publication
Not applicable.
Competing interests
The authors declare that they have no competing
interests.
References
|
1
|
Bray F, Laversanne M, Sung H, Ferlay J,
Siegel RL, Soerjomataram I and Jemal A: Global cancer statistics
2022: GLOBOCAN estimates of incidence and mortality worldwide for
36 cancers in 185 countries. CA Cancer J Clin. 74:229–263. 2024.
View Article : Google Scholar : PubMed/NCBI
|
|
2
|
He Y, Zhang H, Zhang Y, Wang P, Zhu K and
Ba Y: Comprehensive characterization of transforming growth factor
beta receptor 1 in stomach adenocarcinoma identifies a prognostic
signature for predicting clinical outcomes and immune infiltrates.
Int J Gen Med. 15:3375–3391. 2022. View Article : Google Scholar : PubMed/NCBI
|
|
3
|
Mao Y, Xia Z, Xia W and Jiang P: Metabolic
reprogramming, sensing, and cancer therapy. Cell Rep.
43:1150642024. View Article : Google Scholar : PubMed/NCBI
|
|
4
|
Xiao D, Zeng L, Yao K, Kong X, Wu G and
Yin Y: The glutamine-alpha-ketoglutarate (AKG) metabolism and its
nutritional implications. Amino Acids. 48:2067–2080. 2016.
View Article : Google Scholar : PubMed/NCBI
|
|
5
|
Naeini SH, Mavaddatiyan L, Kalkhoran ZR,
Taherkhani S and Talkhabi M: Alpha-ketoglutarate as a potent
regulator for lifespan and healthspan: Evidences and perspectives.
Exp Gerontol. 175:1121542023. View Article : Google Scholar : PubMed/NCBI
|
|
6
|
Tran KA, Dillingham CM and Sridharan R:
The role of α-ketoglutarate-dependent proteins in pluripotency
acquisition and maintenance. J Biol Chem. 294:5408–5419. 2019.
View Article : Google Scholar : PubMed/NCBI
|
|
7
|
Huang F, Luo X, Ou Y, Gao Z, Tang Q, Chu
Z, Zhu X and He Y: Control of histone demethylation by
nuclear-localized α-ketoglutarate dehydrogenase. Science.
381:eadf88222023. View Article : Google Scholar : PubMed/NCBI
|
|
8
|
Tran TQ, Hanse EA, Habowski AN, Li H,
Ishak Gabra MB, Yang Y, Lowman XH, Ooi AM, Liao SY, Edwards RA, et
al: α-ketoglutarate attenuates Wnt signaling and drives
differentiation in colorectal cancer. Nat Cancer. 1:345–358. 2020.
View Article : Google Scholar : PubMed/NCBI
|
|
9
|
Atlante S, Visintin A, Marini E, Savoia M,
Dianzani C, Giorgis M, Sürün D, Maione F, Schnütgen F, Farsetti A,
et al: α-ketoglutarate dehydrogenase inhibition counteracts breast
cancer-associated lung metastasis. Cell Death Dis. 9:7562018.
View Article : Google Scholar : PubMed/NCBI
|
|
10
|
Zhang B, Peng H, Zhou M, Bao L, Wang C,
Cai F, Zhang H, Wang JE, Niu Y, Chen Y, et al: Targeting BCAT1
Combined with α-ketoglutarate triggers metabolic synthetic
lethality in glioblastoma. Cancer Res. 82:2388–2402. 2022.
View Article : Google Scholar : PubMed/NCBI
|
|
11
|
Greilberger J, Erlbacher K, Stiegler P,
Wintersteiger R and Herwig R: Different RONS generation in MTC-SK
and NSCL cells lead to varying antitumoral effects of
α-ketoglutarate + 5-HMF. Curr Issues Mol Biol. 45:6503–6525. 2023.
View Article : Google Scholar : PubMed/NCBI
|
|
12
|
Wang B, Ye Y, Yang X, Liu B, Wang Z, Chen
S, Jiang K, Zhang W, Jiang H, Mustonen H, et al: SIRT2-dependent
IDH1 deacetylation inhibits colorectal cancer and liver metastases.
EMBO Rep. 21:e481832020. View Article : Google Scholar : PubMed/NCBI
|
|
13
|
Gunn K, Myllykoski M, Cao JZ, Ahmed M,
Huang B, Rouaisnel B, Diplas BH, Levitt MM, Looper R, Doench JG, et
al: (R)-2-hydroxyglutarate inhibits KDM5 histone lysine
demethylases to drive transformation in IDH-mutant cancers. Cancer
Discov. 13:1478–1497. 2023. View Article : Google Scholar : PubMed/NCBI
|
|
14
|
Chou FJ, Liu Y, Lang F and Yang C:
D-2-hydroxyglutarate in glioma biology. Cells. 10:23452021.
View Article : Google Scholar : PubMed/NCBI
|
|
15
|
Bhavya B, Anand CR, Madhusoodanan UK,
Rajalakshmi P, Krishnakumar K, Easwer HV, Deepti AN and Gopala S:
To be wild or mutant: Role of Isocitrate Dehydrogenase 1 (IDH1) and
2-Hydroxy Glutarate (2-HG) in gliomagenesis and treatment outcome
in glioma. Cell Mol Neurobiol. 40:53–63. 2020. View Article : Google Scholar : PubMed/NCBI
|
|
16
|
Wang Y, Guo YR, Liu K, Yin Z, Liu R, Xia
Y, Tan L, Yang P, Lee JH, Li XJ, et al: KAT2A coupled with the
KAT2A coupled with the α-KGDH complex acts as a histone H3
succinyltransferase. Nature. 552:273–277. 2017. View Article : Google Scholar : PubMed/NCBI
|
|
17
|
Colaprico A, Silva TC, Olsen C, Garofano
L, Cava C, Garolini D, Sabedot TS, Malta TM, Pagnotta SM,
Castiglioni I, et al: TCGAbiolinks: An R/Bioconductor package for
integrative analysis of TCGA data. Nucleic Acids Res. 44:e712016.
View Article : Google Scholar : PubMed/NCBI
|
|
18
|
Muratani M, Deng N, Ooi WF, Lin SJ, Xing
M, Xu C, Qamra A, Tay ST, Malik S, Wu J, et al: Nanoscale chromatin
profiling of gastric adenocarcinoma reveals cancer-associated
cryptic promoters and somatically acquired regulatory elements. Nat
Commun. 5:43612014. View Article : Google Scholar : PubMed/NCBI
|
|
19
|
Yoon SJ, Park J, Shin Y, Choi Y, Park SW,
Kang SG, Son HY and Huh YM: Deconvolution of diffuse gastric cancer
and the suppression of CD34 on the BALB/c nude mice model. BMC
Cancer. 20:3142020. View Article : Google Scholar : PubMed/NCBI
|
|
20
|
Oh SC, Sohn BH, Cheong JH, Kim SB, Lee JE,
Park KC, Lee SH, Park JL, Park YY, Lee HS, et al: Clinical and
genomic landscape of gastric cancer with a mesenchymal phenotype.
Nat Commun. 9:17772018. View Article : Google Scholar : PubMed/NCBI
|
|
21
|
Cho JY, Lim JY, Cheong JH, Park YY, Yoon
SL, Kim SM, Kim SB, Kim H, Hong SW, Park YN, et al: Gene expression
signature-based prognostic risk score in gastric cancer. Clin
Cancer Res. 17:1850–1857. 2011. View Article : Google Scholar : PubMed/NCBI
|
|
22
|
Ritchie ME, Phipson B, Wu D, Hu Y, Law CW,
Shi W and Smyth GK: limma powers differential expression analyses
for RNA-sequencing and microarray studies. Nucleic Acids Res.
43:e472015. View Article : Google Scholar : PubMed/NCBI
|
|
23
|
Yu G, Wang LG, Han Y and He QY:
clusterProfiler: An R package for comparing biological themes among
gene clusters. OMICS. 16:284–287. 2012. View Article : Google Scholar : PubMed/NCBI
|
|
24
|
Zeng D, Ye Z, Shen R, Yu G, Wu J, Xiong Y,
Zhou R, Qiu W, Huang N, Sun L, et al: IOBR: Multi-omics
immuno-oncology biological research to decode tumor
microenvironment and signatures. Front Immunol. 12:6879752021.
View Article : Google Scholar : PubMed/NCBI
|
|
25
|
Malta TM, Sokolov A, Gentles AJ,
Burzykowski T, Poisson L, Weinstein JN, Kamińska B, Huelsken J,
Omberg L, Gevaert O, et al: Machine learning identifies stemness
features associated with oncogenic dedifferentiation. Cell.
173:338–354.e15. 2018. View Article : Google Scholar : PubMed/NCBI
|
|
26
|
Zhang B, Wu Q, Li B, Wang D, Wang L and
Zhou YL: m6A regulator-mediated methylation modification
patterns and tumor microenvironment infiltration characterization
in gastric cancer. Mol Cancer. 19:532020. View Article : Google Scholar : PubMed/NCBI
|
|
27
|
Jiang P, Gu S, Pan D, Fu J, Sahu A, Hu X,
Li Z, Traugh N, Bu X, Li B, et al: Signatures of T cell dysfunction
and exclusion predict cancer immunotherapy response. Nat Med.
24:1550–1558. 2018. View Article : Google Scholar : PubMed/NCBI
|
|
28
|
Jin Q, Dai Y, Wang Y, Zhang S and Liu G:
High kinesin family member 11 expression predicts poor prognosis in
patients with clear cell renal cell carcinoma. J Clin Pathol.
72:354–362. 2019. View Article : Google Scholar : PubMed/NCBI
|
|
29
|
Wang X, Wei P, Yang L, Liu F, Tong X, Yang
X and Su L: MicroRNA-20a-5p regulates the epithelial-mesenchymal
transition of human hepatocellular carcinoma by targeting RUNX3.
Chin Med J (Engl). 135:2089–2097. 2022. View Article : Google Scholar : PubMed/NCBI
|
|
30
|
Liu G, Li S, Yuan H, Hao M, Wurihan, Yun
Z, Zhao J, Ma Y and Dai Y: Effect of sodium alginate on mouse ovary
vitrification. Theriogenology. 113:78–84. 2018. View Article : Google Scholar : PubMed/NCBI
|
|
31
|
Dobin A, Davis CA, Schlesinger F, Drenkow
J, Zaleski C, Jha S, Batut P, Chaisson M and Gingeras TR: STAR:
Ultrafast universal RNA-seq aligner. Bioinformatics. 29:15–21.
2013. View Article : Google Scholar : PubMed/NCBI
|
|
32
|
Liao Y, Smyth GK and Shi W: featureCounts:
An efficient general purpose program for assigning sequence reads
to genomic features. Bioinformatics. 30:923–930. 2014. View Article : Google Scholar : PubMed/NCBI
|
|
33
|
Subramanian A, Tamayo P, Mootha VK,
Mukherjee S, Ebert BL, Gillette MA, Paulovich A, Pomeroy SL, Golub
TR, Lander ES and Mesirov JP: Gene set enrichment analysis: A
knowledge-based approach for interpreting genome-wide expression
profiles. Proc Natl Acad Sci USA. 102:15545–15550. 2005. View Article : Google Scholar : PubMed/NCBI
|
|
34
|
Xiong J, Yan C, Zhang Q and Zhang J:
α-ketoglutarate-dependent enzymes in breast cancer and therapeutic
implications. Endocrinology. 164:bqad0802023. View Article : Google Scholar : PubMed/NCBI
|
|
35
|
Zhang JY, Zhou B, Sun RY, Ai YL, Cheng K,
Li FN, Wang BR, Liu FJ, Jiang ZH, Wang WJ, et al: The metabolite
α-KG induces GSDMC-dependent pyroptosis through death receptor
6-activated caspase-8. Cell Res. 31:980–997. 2021. View Article : Google Scholar : PubMed/NCBI
|
|
36
|
Wang C, Wang B, Wei Y, Li S, Ren J, Dai Y
and Liu G: Effect of Gentianella acuta (Michx.) Hulten against the
arsenic-induced development hindrance of mouse oocytes. BioMetals.
37:1411–1430. 2024. View Article : Google Scholar : PubMed/NCBI
|
|
37
|
Liu Z, Liu L, Weng S, Guo C, Dang Q, Xu H,
Wang L, Lu T, Zhang Y, Sun Z and Han X: Machine learning-based
integration develops an immune-derived lncRNA signature for
improving outcomes in colorectal cancer. Nat Commun. 13:8162022.
View Article : Google Scholar : PubMed/NCBI
|
|
38
|
Chen H, Zheng Z, Yang C, Tan T, Jiang Y
and Xue W: Machine learning based intratumor heterogeneity
signature for predicting prognosis and immunotherapy benefit in
stomach adenocarcinoma. Sci Rep. 14:233282024. View Article : Google Scholar : PubMed/NCBI
|
|
39
|
Carey BW, Finley LW, Cross JR, Allis CD
and Thompson CB: Intracellular α-ketoglutarate maintains the
pluripotency of embryonic stem cells. Nature. 518:413–416. 2015.
View Article : Google Scholar : PubMed/NCBI
|
|
40
|
Cai Y, Lv L, Lu T, Ding M, Yu Z, Chen X,
Zhou X and Wang X: α-KG inhibits tumor growth of diffuse large
B-cell lymphoma by inducing ROS and TP53-mediated ferroptosis. Cell
Death Discov. 9:1822023. View Article : Google Scholar : PubMed/NCBI
|
|
41
|
Mayakonda A, Lin DC, Assenov Y, Plass C
and Koeffler HP: Maftools: Efficient and comprehensive analysis of
somatic variants in cancer. Genome Res. 28:1747–1756. 2018.
View Article : Google Scholar : PubMed/NCBI
|
|
42
|
Suzuki J, Yamada T, Inoue K, Nabe S,
Kuwahara M, Takemori N, Takemori A, Matsuda S, Kanoh M, Imai Y, et
al: The tumor suppressor menin prevents effector CD8 T-cell
dysfunction by targeting mTORC1-dependent metabolic activation. Nat
Commun. 9:32962018. View Article : Google Scholar : PubMed/NCBI
|
|
43
|
Kern Coquillat N, Picq L, Hamond A, Megy
P, Benezech S, Drouillard A, Lager-Lachaud N, Cahoreau E, Moreau M
and Fallone L: Pivotal role of exogenous pyruvate in human natural
killer cell metabolism. Nat Metab. 7:336–347. 2025. View Article : Google Scholar : PubMed/NCBI
|
|
44
|
Yu W, Wang S, Rong Q, Ajayi OE, Hu K and
Wu Q: Profiling the tumor-infiltrating lymphocytes in gastric
cancer reveals its implication in the prognosis. Genes (Basel).
13:10172022. View Article : Google Scholar : PubMed/NCBI
|
|
45
|
Palmeri M, Mehnert J, Silk AW, Jabbour SK,
Ganesan S, Popli P, Riedlinger G, Stephenson R, de Meritens AB,
Leiser A, et al: Real-world application of tumor mutational
burden-high (TMB-high) and microsatellite instability (MSI)
confirms their utility as immunotherapy biomarkers. ESMO Open.
7:1003362022. View Article : Google Scholar : PubMed/NCBI
|
|
46
|
Fu J, Li K, Zhang W, Wan C, Zhang J, Jiang
P and Liu XS: Large-scale public data reuse to model immunotherapy
response and resistance. Genome Med. 12:212020. View Article : Google Scholar : PubMed/NCBI
|
|
47
|
Ye J, Qin SS, Hughson AL, Hannon G, Salama
NA, Vrooman TG, Lesch ML, Lesser S, Eckl SL, Jewell R, et al:
Blocking LIF and PD-L1 enhances the antitumor efficacy of SBRT in
murine PDAC models. J Immunother Cancer. 13:e0108202025. View Article : Google Scholar : PubMed/NCBI
|
|
48
|
Pytel D, Sliwinski T, Poplawski T,
Ferriola D and Majsterek I: Tyrosine kinase blockers: New hope for
successful cancer therapy. Anticancer Agents Med Chem. 9:66–76.
2009. View Article : Google Scholar : PubMed/NCBI
|
|
49
|
Shen H, Hu X, Yang X, Chen J, Fu Y, He H,
Shi Y, Zeng R, Chang W and Zheng S: Inhibition of BRD4 enhanced the
tumor suppression effect of dasatinib in gastric cancer. Med Oncol.
40:92022. View Article : Google Scholar : PubMed/NCBI
|
|
50
|
Bougen-Zhukov N, Decourtye-Espiard L,
Mitchell W, Redpath K, Perkinson J, Godwin T, Black MA and Guilford
P: E-cadherin-deficient cells are sensitive to the multikinase
inhibitor dasatinib. Cancers (Basel). 14:16092022. View Article : Google Scholar : PubMed/NCBI
|
|
51
|
Wang X, Xue Q, Wu L, Wang B and Liang H:
Dasatinib promotes TRAIL-mediated apoptosis by upregulating
CHOP-dependent death receptor 5 in gastric cancer. FEBS Open Bio.
8:732–742. 2018. View Article : Google Scholar : PubMed/NCBI
|
|
52
|
Li X, Yang F, He N, Zhang M, Lv Y, Yu Y,
Dong Q, Hou X, Hao Y, An Z, et al: YM155 inhibits neuroblastoma
growth through degradation of MYCN: A new role as a USP7 inhibitor.
Eur J Pharm Sci. 181:1063432023. View Article : Google Scholar : PubMed/NCBI
|
|
53
|
Majera D and Mistrik M: Effect of
sepatronium bromide (YM-155) on DNA double-strand breaks repair in
cancer cells. Int J Mol Sci. 21:94312020. View Article : Google Scholar : PubMed/NCBI
|
|
54
|
Cheng XJ, Lin JC, Ding YF, Zhu L, Ye J and
Tu SP: Survivin inhibitor YM155 suppresses gastric cancer xenograft
growth in mice without affecting normal tissues. Oncotarget.
7:7096–7109. 2016. View Article : Google Scholar : PubMed/NCBI
|
|
55
|
Kita A, Nakahara T, Yamanaka K, Nakano K,
Nakata M, Mori M, Kaneko N, Koutoku H, Izumisawa N and Sasamata M:
Antitumor effects of YM155, a novel survivin suppressant, against
human aggressive non-Hodgkin lymphoma. Leuk Res. 35:787–792. 2011.
View Article : Google Scholar : PubMed/NCBI
|
|
56
|
Wang Q, Chen Z, Diao X and Huang S:
Induction of autophagy-dependent apoptosis by the survivin
suppressant YM155 in prostate cancer cells. Cancer Lett. 302:29–36.
2011. View Article : Google Scholar : PubMed/NCBI
|
|
57
|
Gyanwali B, Lim ZX, Soh J, Lim C, Guan SP,
Goh J, Maier AB and Kennedy BK: Alpha-Ketoglutarate dietary
supplementation to improve health in humans. Trends Endocrinol
Metab. 33:136–146. 2022. View Article : Google Scholar : PubMed/NCBI
|
|
58
|
Mazzio EA, Lewis CA, Elhag R and Soliman
KF: Effects of sepantronium bromide (YM-155) on the whole
transcriptome of MDA-MB-231 cells: Highlight on impaired ATR/ATM
fanconi anemia DNA damage response. Cancer Genomics Proteomics.
15:249–264. 2018. View Article : Google Scholar : PubMed/NCBI
|
|
59
|
Cheng SM, Lin TY, Chang YC, Lin IW, Leung
E and Cheung CHA: YM155 and BIRC5 downregulation induce genomic
instability via autophagy-mediated ROS production and inhibition in
DNA repair. Pharmacol Res. 166:1054742021. View Article : Google Scholar : PubMed/NCBI
|
|
60
|
Li Y, Liu J, Wu S, Xiao J and Zhang Z:
Ferroptosis: Opening up potential targets for gastric cancer
treatment. Mol Cell Biochem. 479:2863–2874. 2024. View Article : Google Scholar : PubMed/NCBI
|
|
61
|
Pérez S, Taléns-Visconti R, Rius-Pérez S,
Finamor I and Sastre J: Redox signaling in the gastrointestinal
tract. Free Radic Biol Med. 104:75–103. 2017. View Article : Google Scholar : PubMed/NCBI
|