Introduction
Colorectal cancer (CRC) is the third most common
cancer worldwide, accounting for almost 10% of all cancers
(1). Although molecular targeted
therapy and immune checkpoint inhibitors have improved clinical
outcomes (2), CRC remains the
second leading cause of cancer-related deaths. The development of
biomarkers for the early and accurate evaluation of tumor grade is
crucial for more efficient treatment strategies (3).
Syndecan-1 (SDC1) is a transmembrane heparan sulfate
proteoglycan that is mostly present in epithelial cells. It is
involved in various biological processes, such as growth,
differentiation, cell proliferation, cell adhesion, migration,
invasion, and angiogenesis (4).
Consequently, SDC1 is also involved in inflammatory and infectious
diseases, including tumorigenesis (5). During malignant transformation of
normal cells, SDC1 is shed from the epithelial cell membrane and
released into the stromal and cytoplasmic compartments. The
shedding of SDC1 promotes oncogene and growth factor signaling,
inhibits cancer cell apoptosis, and promotes angiogenesis (6–8).
Consequently, decreased SDC1 expression on the cell membranous,
stromal, and cytoplasmic compartments are poor prognostic factors
in various cancers; thus, SDC1 has been reported as a potential
biomarker for prognosis evaluation (9).
In CRC, decreased or absent SDC1 expression on
cancer cell membranes compared to normal cell membranes has been
observed, and this reduction correlates with tumor progression
(10). In metastatic colorectal
cancer, high serum SDC1 levels have also been reported to be
associated with chemotherapy resistance and decreased
progression-free survival and overall survival (OS) (11,12).
In contrast, stromal SDC1 expression has been reported to be
associated with good prognosis (13). SDC1 has also been reported to
inhibit tumor progression depending on the tumor type, location of
activation, or regulatory mechanism (5). Despite previous research, the
association between SDC1 expression and prognosis in CRC remains
controversial.
We have previously reported dynamic changes in serum
SDC1 levels from preoperative to postoperative CRC and their
prognostic impact (14) and
conducted SDC1 staining on tumor tissues. This study aimed to
evaluate the association between SDC1 expression in tumor tissues
and prognosis as well as its association with serum SDC1 levels to
assess its usefulness as a prognostic biomarker.
Materials and methods
Study populations
Consecutive patients who underwent radical surgery
for CRC between July and December 2019 were identified from a
prospectively maintained institutional database at the Department
of Gastrointestinal Surgery, Gifu University Hospital (Gifu,
Japan). Patients whose surgical specimens were pathologically
diagnosed with CRC were included, and those with a history of
cancer, synchronous double cancer, familial adenomatous polyposis
or hereditary non-polyposis CRC, or inflammatory bowel disease were
excluded. This study was conducted in accordance with the World
Medical Association Declaration of Helsinki and approved by the
Ethics Committee of Gifu University (approval nos. 2019-074 and
2021-C162). All patients provided written informed consent.
Measurement of serum SDC1 levels
As previously reported (14), blood was collected preoperatively
and 7 days after surgery. The blood samples were centrifuged at 4°C
and 2,000 × g and were frozen at −80°C. The samples were thawed,
and SDC1 levels were measured using an enzyme-linked immunosorbent
assay (Diaclone, Besançon, France).
Immunohistochemical staining of tissue
and SDC1 scoring
Immunostaining was performed on formalin-fixed,
paraffin-embedded colorectal tumors. Paraffin blocks were cut into
3-µm-thick sections, deparaffinized with xylene, and rehydrated
thorough graded ethanol into distilled water. Deparaffinized
sections were subjected to autoclave boiling in 5X Tris-EDTA buffer
solution (pH 9.0) for 10 min at 110°C as an antigen retrieval
procedure, followed by cooling down for 2 h at room temperature.
After washing with phosphate-buffered saline (PBS), the sections
were incubated with 3% H2O2 diluted in
methanol for 10 min and blocked with 2% normal bovine serum for 40
min at room temperature. The sections were incubated with rabbit
anti-SDC1 antibody (dilution 1:8,000, clone EPR6459, cat. ab128936;
Abcam, Cambridge, UK) overnight at 4°C as the primary antibody and
washed with PBS. Subsequently, the sections were incubated with the
Histofine Simple Stain MAX-PO (R) kit (no dilution required; cat.
424132; Nichirei Biosciences Inc., Tokyo, Japan), which contains
peroxidase-labeled polymer-conjugated goat anti-rabbit IgG Fab'
fragments, for 30 min at room temperature as the secondary antibody
and washed with PBS.
Immunoreaction was visualized using
3,3′-diaminobenzidine tetrahydrochloride (cat. D5637;
Sigma-Aldrich, St. Louis, MO, USA). Sections were counterstained
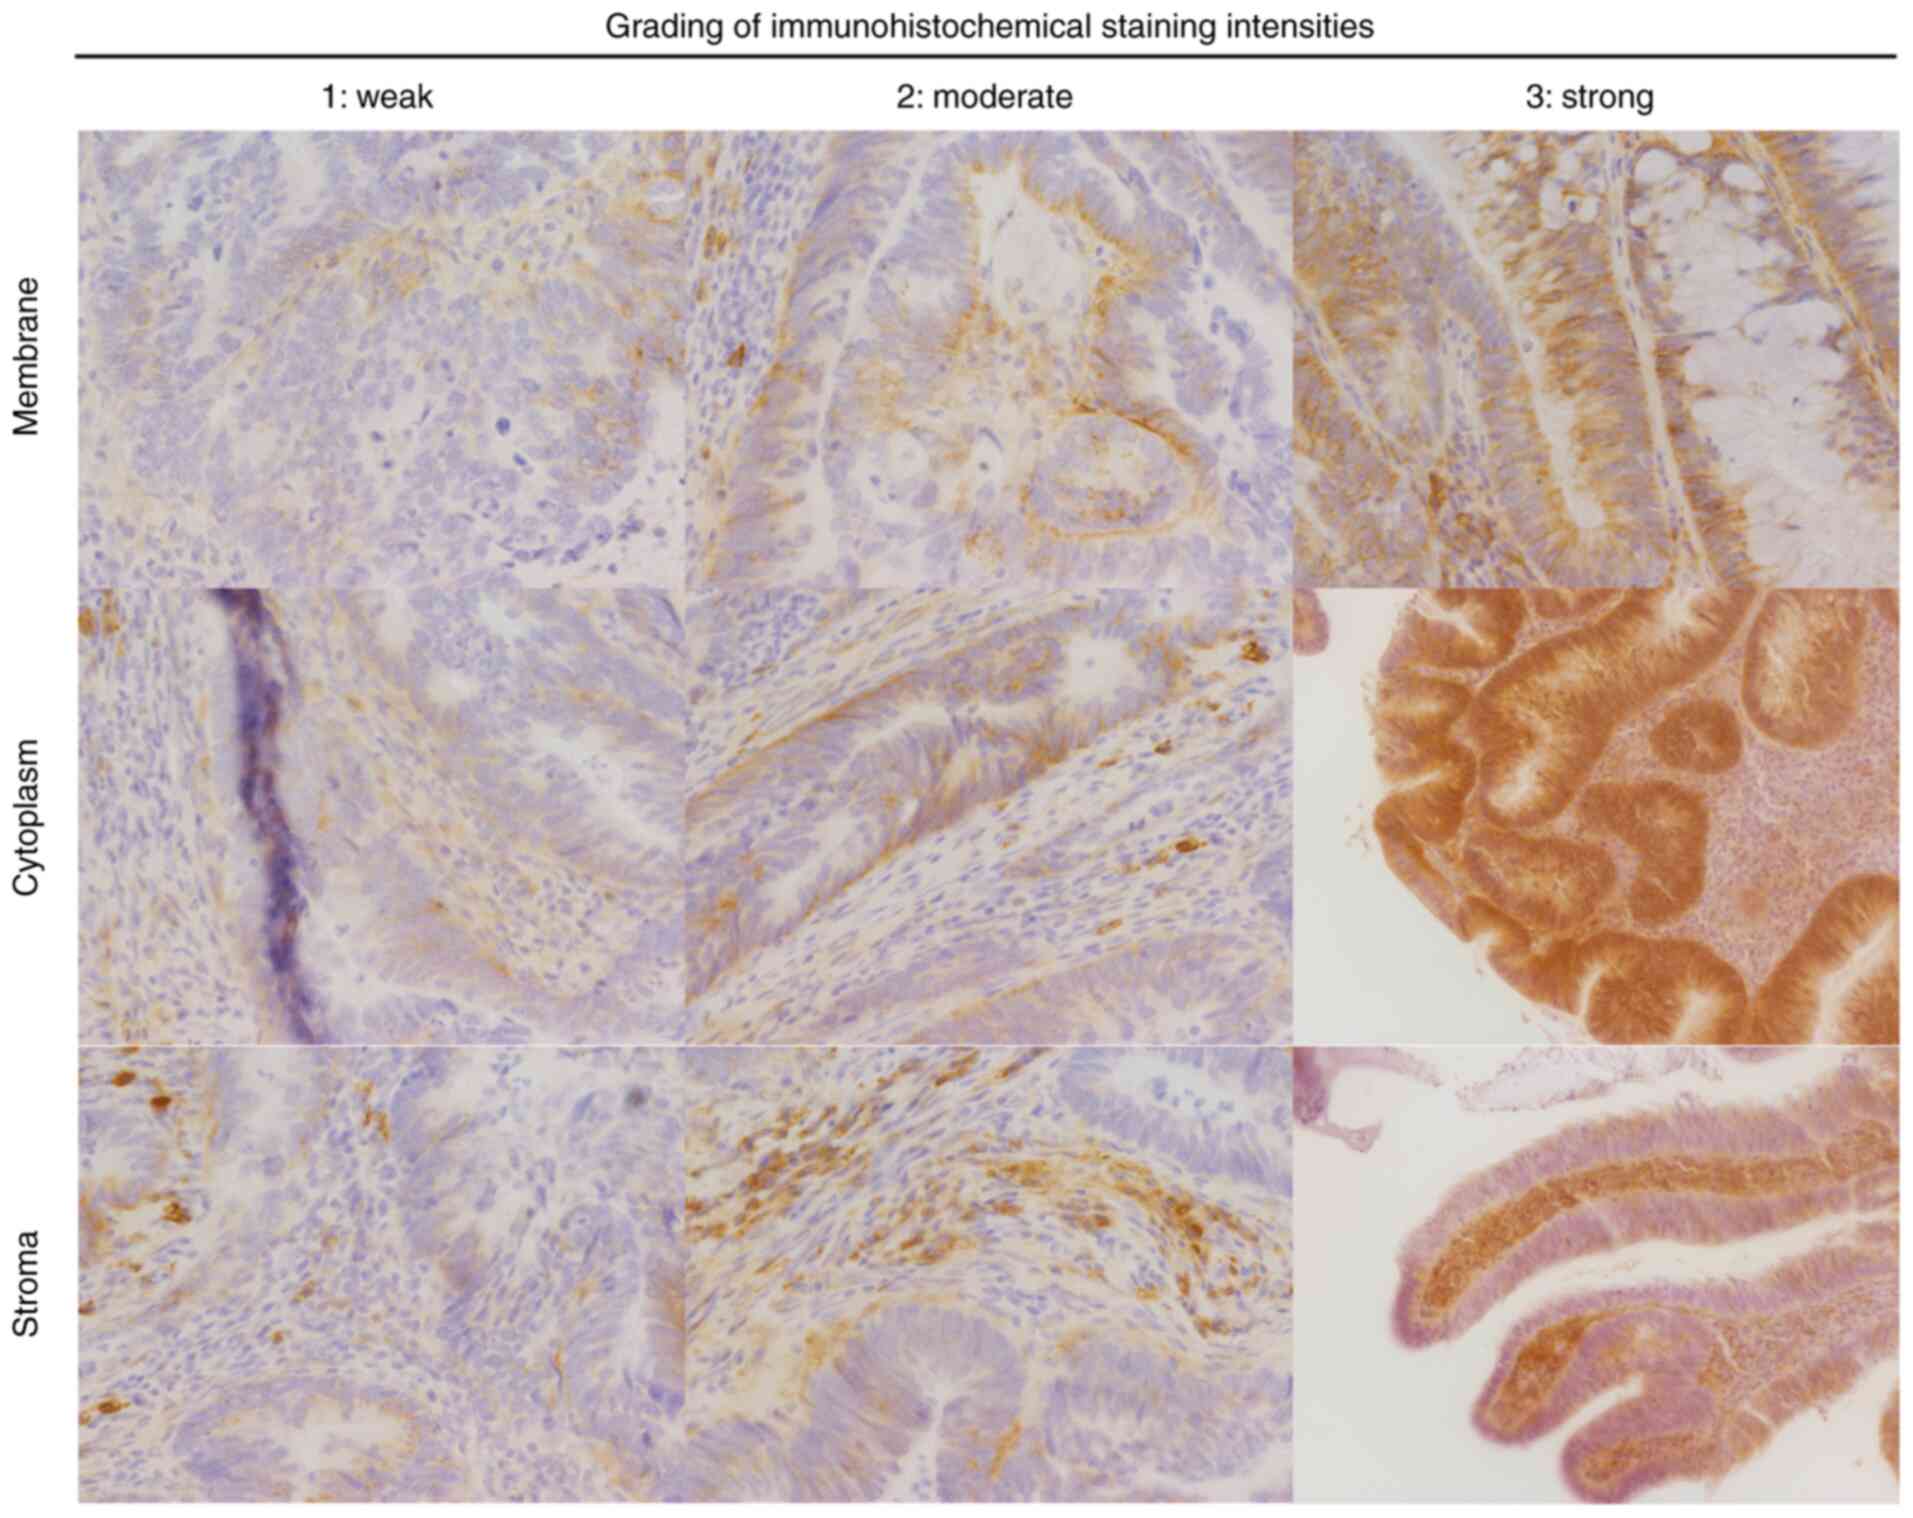
with hematoxylin. SDC1 immunoreactivity was classified as
membranous, cytoplasmic, or stromal. Staining intensity was defined
as follows: 0, no staining; 1, weak; 2, moderate; 3, strong
(Fig. 1). The percentage of cells
stained was as follows: 0, no staining; 1, 1–25%; 2, 26–50%; 3,
51–75%; 4, 76–100%. The immunohistochemical (IHC) score was
calculated by multiplying the staining intensities and percentages
rated on a score of 0–12 (15). The
IHC scores were categorized into quartiles (Qs) based on the median
score: Q1-Q2 (negative/low) and Q3-Q4 (medium/high). Staining was
evaluated independently and in a blinded manner by two individuals,
including a pathologist.
Outcome measures and statistical
analyses
The preoperative variables included age, sex, body
mass index, and tumor markers (carcinoembryonic antigen and
carbohydrate antigen 19-9). The pathological variables included
SDC1 score, grade, pathological T (pT) and N (pN) stage according
to the 8th edition of the Union for International Cancer Control's
tumor-node-metastasis classification and lymphovascular invasion
(16).
The primary endpoint was disease-free survival
(DFS), which was defined as the interval from the date of surgery
to the date of recurrence, death, or most recent follow-up. DFS was
compared among membranous, cytoplasmic, and stromal SDC1 scores,
and histopathological risk factors for recurrence were
investigated. To further reveal the association between SDC1
staining and serum SDC1 levels, the correlation between the SDC1
staining score and preoperative and postoperative serum SDC1 levels
was evaluated.
All statistical analyses were performed using EZR
version 1.68 (Easy R; Saitama Medical Center, Jichi Medical
University, Saitama, Japan). Categorical variables were summarized
as numbers (percentages) and analyzed using the Pearson
χ2 test or Fisher's exact test. The Pearson
χ2 test was applied when the expected frequency in each
cell was 5 or more, whereas Fisher's exact test was used when any
expected frequency was less than 5. Continuous variables are
expressed as median (interquartile range) and were compared using
the Mann-Whitney U test. DFS was calculated using the Kaplan-Meier
method and compared using the log-rank test. Preoperative and
histopathological factors (log-rank test, P<0.05) were entered
into a multivariable Cox proportional hazards model.
Firth-penalized Cox proportional hazards model was applied to
address small sample bias, thereby identifying the independent
predictors of recurrence. The results were expressed as hazard
ratios and 95% confidence intervals. The correlation between the
different SDC1 scores and serum SDC1 levels was tested using
Spearman's correlation analysis after outliers were excluded using
the Smirnov-Grubbs test (α=0.05). All tests were two-sided, and
P<0.05 was considered to indicate a statistically significant
difference.
Results
Clinical and pathological
characteristics
During the study period, 48 patients underwent
radical surgery; however, two patients were excluded due to
difficult IHC staining, leaving 46 patients in the final cohort.
The clinicopathological characteristics are summarized in Table I. The median age was 70 (61–74)
years, and the male-to-female ratio was 1:1. Of the 46 patients, 31
(67.4%) had CRC or rectosigmoid cancer, and 15 (32.6%) had rectal
cancer. Tumor invasion deeper than T3, lymph node metastasis, and
vascular invasion were observed in 28 (60.9%), 18 (39.1%), and 33
(71.7%) patients, respectively. Recurrence was observed in 11
patients (23.9%), and 6 patients (13.0%) died.
 | Table I.Clinicopathological
characteristics. |
Table I.
Clinicopathological
characteristics.
| Characteristic | Results |
|---|
| Age, years
(IQR) | 70 (61–74) |
| Sex, n (%) |
|
|
Male/Female | 23 (50.0)/23
(50.0) |
| BMI,
kg/m2 (IQR) | 22.0
(19.6–24.5) |
| CEA, ng/ml
(IQR) | 3.0 (2.1–4.6) |
| CA19-9, units/ml
(IQR) | 10.0
(7.0–25.2) |
| Tumor location, n
(%) |
|
| Colon
and rectosigmoid colon | 31 (67.4) |
| Rectum | 15 (32.6) |
| Histological
differentiation, n (%) |
|
|
Well/moderate/por/muc | 14 (30.4)/29
(63.0)/1 (2.2)/2 (4.4) |
| Pathological T
stage, n (%)a |
|
|
T0/T1/T2/T3/T4 | 4 (8.7)/9 (19.6)/5
(10.9)/23 (50.0)/5 (10.9) |
| Pathological N
stage, n (%)a |
|
|
N0/N1/N2 | 28 (60.9)/12
(16.1)/6 (13.0) |
| Pathological stage,
n (%)a |
|
|
0/I/II/III | 4 (8.7)/12
(26.1)/12 (26.1)/18 (39.1) |
| Lymphovascular
invasion, n (%) | 33 (71.7) |
| Recurrence, n
(%) | 11 (23.9) |
SDC1 expression and comparison of
clinicopathological characteristics
The results of the IHC staining of the membranous,
cytoplasmic, and stromal compartments are presented in quartiles
(Table II). The median membranous
score was 2, and 30 patients (65.2%) had medium/high scores
(Q3-Q4). The median cytoplasmic and stromal scores were 2 and 3,
respectively, and 26 (56.5%) and 23 (50.0%) patients had
medium/high scores (Q3-Q4), respectively. Table III summarizes the comparison of
clinicopathological characteristics between Q1-Q2 and Q3-Q4 for
each compartment. In both compartments, the frequency of pT3-pT4
was significantly higher in Q1-Q2 than in Q3-Q4 (membrane, 87.5%
vs. 46.7%, P=0.017; cytoplasm, 85.0% vs. 42.3%, P=0.008; stroma,
78.3% vs. 43.5%, P=0.035). Lymphovascular invasion was observed
more frequently in the cytoplasmic compartments in Q1-Q2 than in
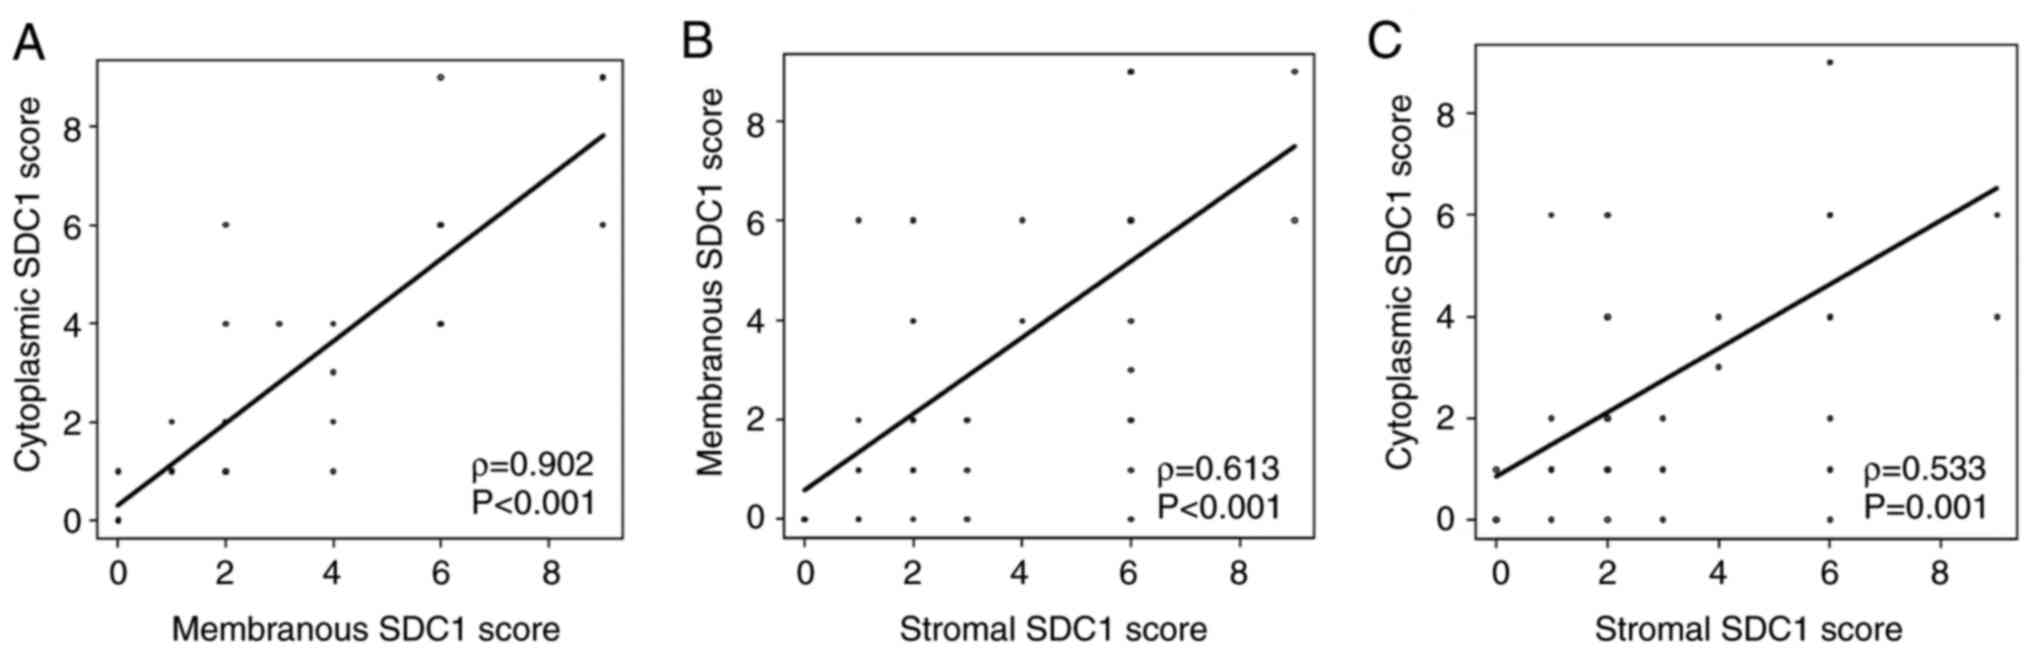
Q3-Q4 (90.0% vs. 57.7%, P=0.037). The membranous SDC1 score showed
a significant positive correlation with the cytoplasmic score
(ρ=0.902, P<0.001). Similarly, significant positive correlations
were observed between the membranous and stromal SDC1 scores
(ρ=0.613, P<0.001) and between the cytoplasmic and stromal SDC1
scores (ρ=0.533, P=0.001; Fig.
2).
| Table II.Immunohistochemistry of SDC1 scoring
by Qs. |
Table II.
Immunohistochemistry of SDC1 scoring
by Qs.
| Cellular
compartment | Median (IQR) | Q | Corresponding IHC
score | Frequency | Percent |
|---|
| Membranous | 2 (1–6) | Q1 | 0 | 8 | 17.4 |
|
|
| Q2 | 1 | 8 | 17.4 |
|
|
| Q3 | 2, 3, 4 | 15 | 32.6 |
|
|
| Q4 | 6, 9 | 15 | 32.6 |
| Cytoplasmic | 2 (1–6) | Q1 | 0 | 6 | 13.1 |
|
|
| Q2 | 1 | 14 | 30.4 |
|
|
| Q3 | 2, 3, 4 | 14 | 30.4 |
|
|
| Q4 | 6, 9 | 12 | 26.1 |
| Stromal | 2.5 (2–6) | Q1 | 0, 1 | 9 | 19.6 |
|
|
| Q2 | 2 | 14 | 30.4 |
|
|
| Q3 | 3, 4 | 6 | 13.0 |
|
|
| Q4 | 6, 8, 9 | 17 | 37.0 |
| Table III.Comparison of clinicopathological
characteristics. |
Table III.
Comparison of clinicopathological
characteristics.
|
| Membranous SDC1
score | Cytoplasmic SDC1
score | Stromal SDC1
score |
|---|
|
|
|
|
|
|---|
| Characteristic | Q1-2 (n=16) | Q3-4 (n=30) | P-value | Q1-2 (n=20) | Q3-4 (n=26) | P-value | Q1-2 (n=23) | Q3-4 (n=23) | P-value |
|---|
| Age, year |
|
| 0.153 |
|
| 0.494 |
|
| 0.489 |
|
<75 | 10 (63.5) | 25 (83.3) |
| 14 (70.0) | 21 (80.8) |
| 16 (69.6) | 19 (82.6) |
|
|
≥75 | 6 (37.5) | 5 (16.7) |
| 6 (50.0) | 5 (19.2) |
| 7 (30.4) | 4 (17.4) |
|
| Sex |
|
| 0.353 |
|
| 0.372 |
|
| 0.555 |
|
Female | 6 (37.5) | 17 (56.7) |
| 8 (40.0) | 15 (57.7) |
| 10 (43.5) | 13 (56.5) |
|
|
Male | 10 (63.5) | 13 (43.3) |
| 12 (60.0) | 11 (42.3) |
| 13 (56.5) | 10 (43.5) |
|
| BMI,
kg/m2 |
|
| 0.649 |
|
| 0.684 |
|
| 0.665 |
|
>18.5 | 15 (93.8) | 25 (83.3) |
| 18 (90.0) | 22 (84.6) |
| 21 (91.3) | 19 (82.6) |
|
|
≤18.5 | 1 (6.2) | 5 (16.7) |
| 2 (10.0) | 4 (15.4) |
| 2 (8.7) | 4 (17.4) |
|
| CEA, ng/ml |
|
| 0.463 |
|
| 0.262 |
|
| >0.999 |
|
<5 | 14 (87.5) | 23 (76.7) |
| 18 (90.0) | 19 (73.1) |
| 19 (82.6) | 18 (78.3) |
|
| ≥5 | 2 (12.5) | 7 (23.3) |
| 2 (10.0) | 7 (26.9) |
| 4 (17.4) | 5 (21.7) |
|
| CA19-9,
units/ml |
|
| 0.463 |
|
| >0.999 |
|
| 0.459 |
|
<37 | 14 (87.5) | 23 (76.7) |
| 16 (80.0) | 21 (80.8) |
| 20 (87.0) | 17 (73.9) |
|
|
≥37 | 2 (12.5) | 7 (23.3) |
| 4 (20.0) | 5 (19.2) |
| 3 (13.0) | 6 (26.1) |
|
| Tumor location |
|
| 0.852 |
|
| >0.999 |
|
| 0.208 |
| Colon
or RS | 10 (63.5) | 21 (70.0) |
| 13 (65.0) | 18 (69.2) |
| 13 (56.5) | 18 (78.3) |
|
|
Rectum | 6 (37.5) | 9 (30.0) |
| 7 (35.0) | 8 (30.8) |
| 10 (43.5) | 5 (21.7) |
|
| Histological
differentiation |
|
| 0.274 |
|
| 0.572 |
|
| 0.233 |
|
Well-moderate | 14 (87.5) | 29 (96.7) |
| 18 (90.0) | 25 (96.2) |
| 20 (87.0) | 23 (100.0) |
|
| Por or
muc | 2 (12.5) | 1 (3.3) |
| 2 (10.0) | 1 (3.8) |
| 3 (13.0) | 0 |
|
| Pathological T
stagea |
|
| 0.017b |
|
| 0.008b |
|
| 0.035b |
|
T1-2 | 2 (12.5) | 16 (53.3) |
| 3 (15.0) | 15 (57.7) |
| 5 (21.7) | 13 (56.5) |
|
|
T3-4 | 14 (87.5) | 14 (46.7) |
| 17 (85.0) | 11 (42.3) |
| 18 (78.3) | 10 (43.5) |
|
| Pathological N
stagea |
|
| 0.432 |
|
| 0.308 |
|
| 0.131 |
| N0 | 8 (50.0) | 20 (66.7) |
| 10 (50.0) | 18 (69.2) |
| 11 (47.8) | 17 (73.9) |
|
|
N1-2 | 8 (50.0) | 10 (33.3) |
| 10 (50.0) | 8 (30.8) |
| 12 (52.2) | 6 (26.1) |
|
| Pathological
stagea |
|
| 0.046b |
|
| 0.031b |
|
| 0.030b |
|
0-I | 2 (12.5) | 14 (46.7) |
| 3 (15.0) | 13 (50.0) |
| 4 (17.4) | 12 (52.2) |
|
|
II–III | 14 (87.5) | 16 (53.3) |
| 17 (85.0) | 13 (50.0) |
| 19 (82.6) | 11 (47.8) |
|
| Lymphovascular
invasion |
|
| 0.101 |
|
| 0.037b |
|
| 0.208 |
|
Absent | 2 (12.5) | 11 (36.7) |
| 2 (10.0) | 11 (42.3) |
| 13 (56.5) | 18 (78.3) |
|
|
Present | 14 (87.5) | 19 (63.3) |
| 18 (90.0) | 15 (57.7) |
| 10 (43.5) | 5 (21.7) |
|
Correlation between serum SDC1 levels
and membranous SDC1 expression
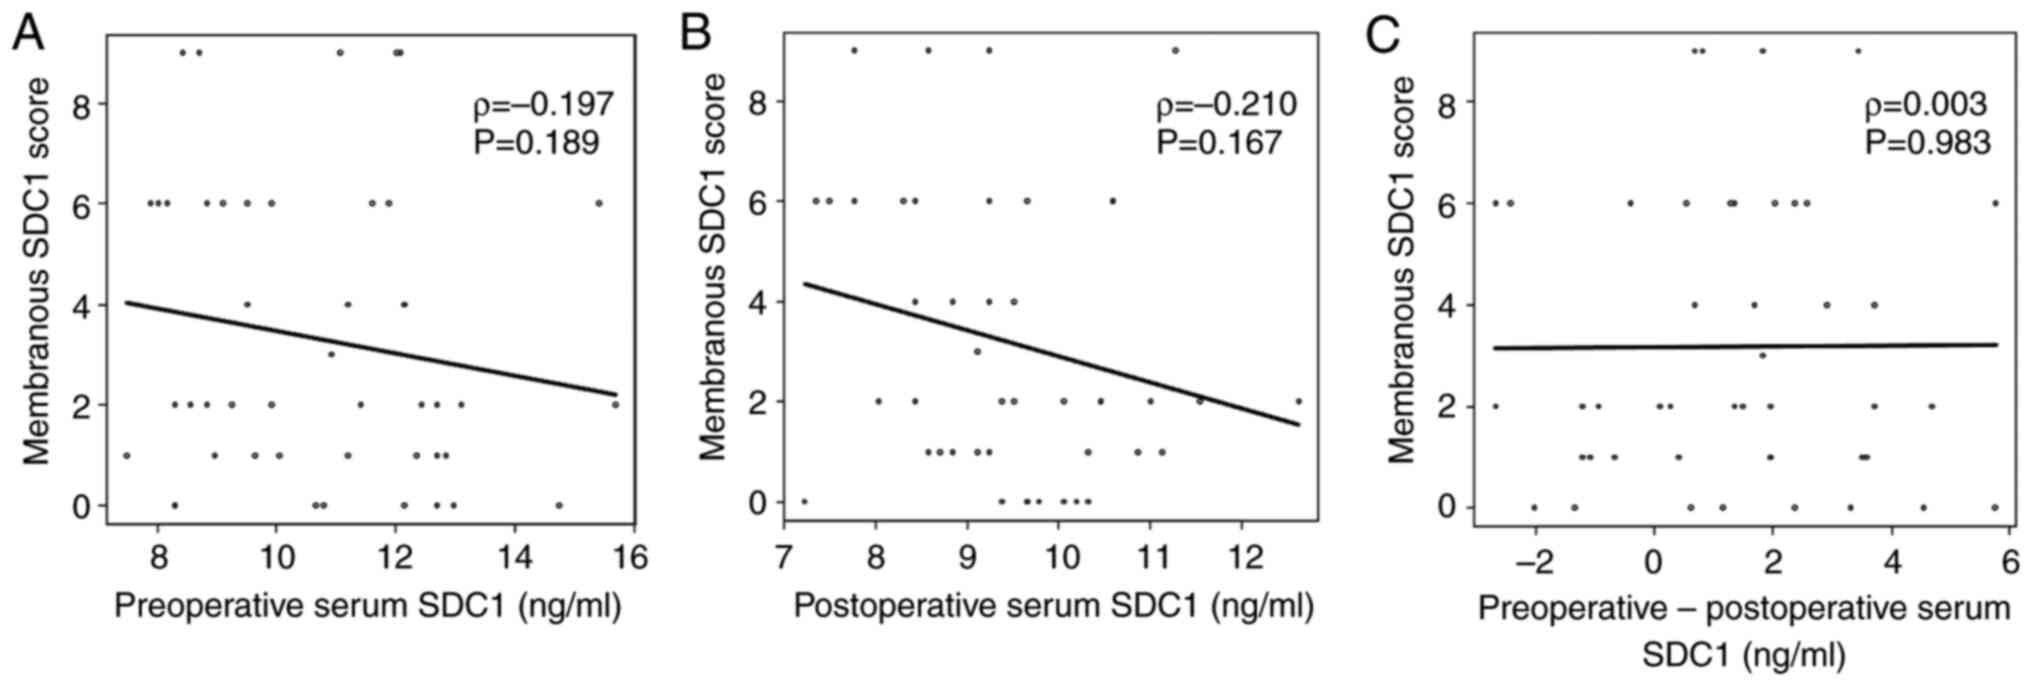
One data point was removed because it significantly
deviated from the distribution of postoperative serum SDC1 values,
and serum SDC1 levels changed from before to after the operation.
No significant correlation was observed between preoperative serum
SDC1 levels and membranous SDC1 scores (ρ=−0.197, P=0.189; Fig. 3). Similarly, no significant
correlation was observed between postoperative serum SDC1 levels
and membranous SDC1 scores (ρ=0.138, P=0.361). The change in serum
SDC1 levels from preoperative to postoperative showed no
significant correlation with the membranous SDC1 scores (ρ=−0.056,
P=0.714). The results were the same as those obtained before
excluding the outlier (Fig.
S1).
Survival analysis
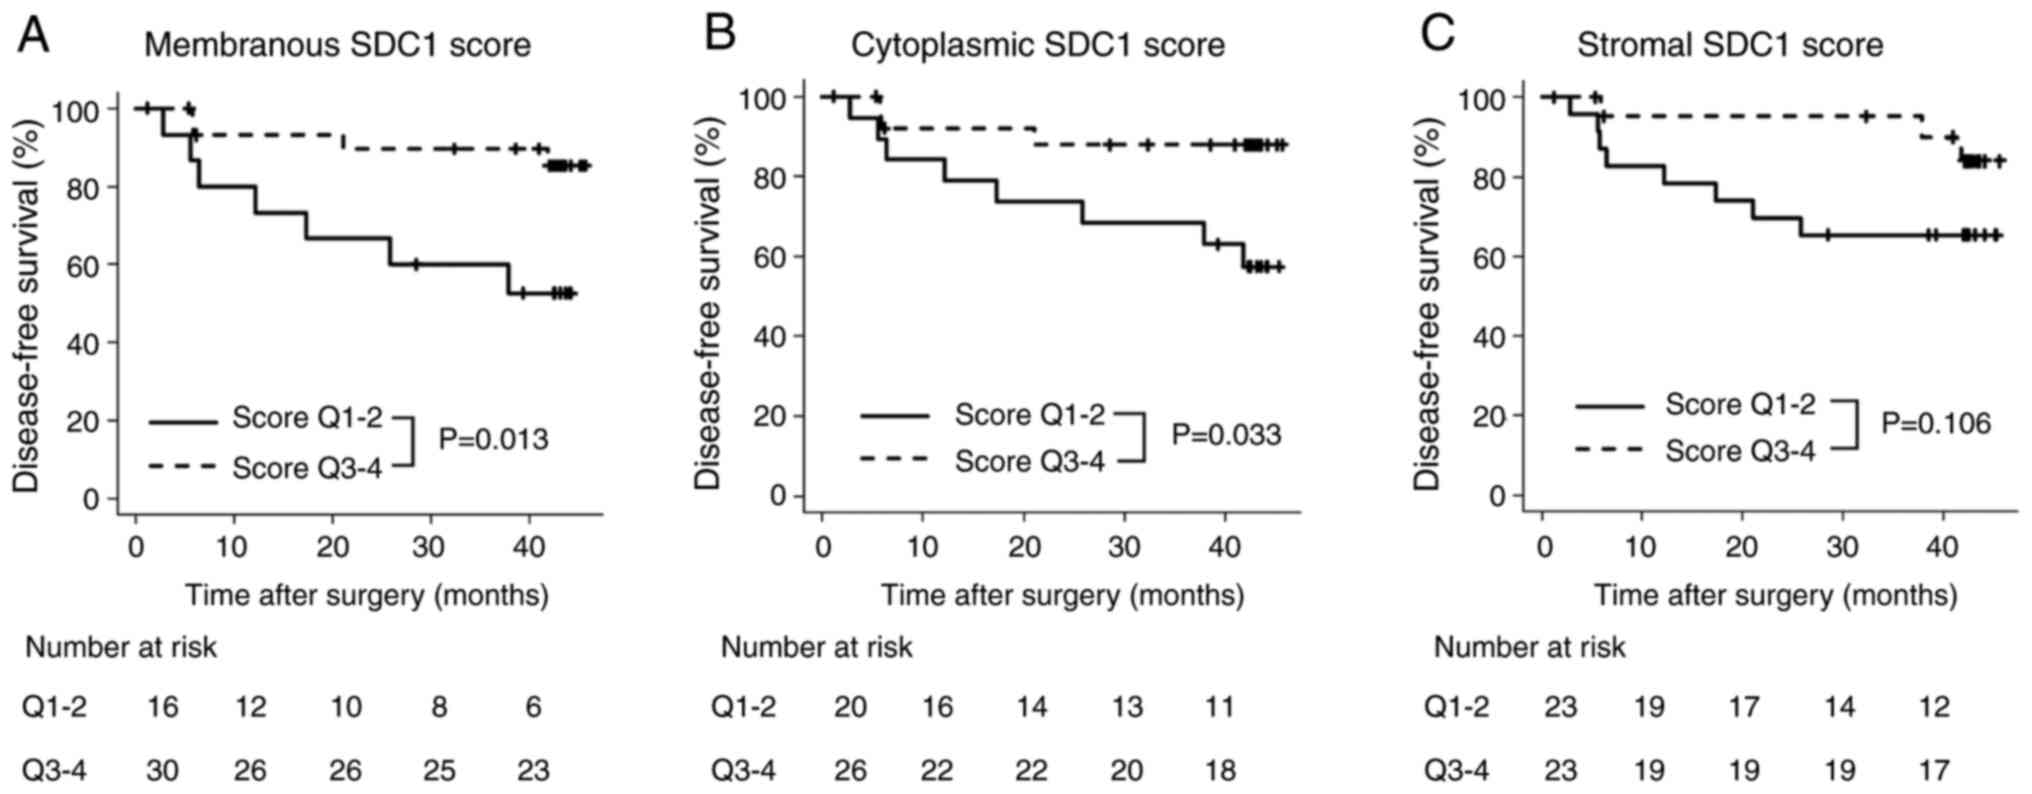
The median follow-up period for the DFS analysis was
42 months (interquartile range, 27–43 months), and 11 patients
experienced recurrence. Comparisons of the DFS based on the SDC1
score for each compartment are shown in Fig. 4. The 3-year DFS rates were
significantly different between Q1-Q2 and Q3-Q4 for membranous SDC1
scores (50.0% vs. 80.0%, P=0.013). A significant difference was
also observed in the 3-year DFS rate between Q1-Q2 and Q3-Q4 for
cytoplasmic SDC1 scores (65.0% vs. 80.0%, P=0.033). However, no
significant difference was found in the 3-year DFS rate between
Q1-Q2 and Q3-Q4 for stromal SDC1 scores (60.9% vs. 78.3%,
P=0.106).
Log-rank tests were performed to identify the risk
factors for recurrence. Univariate analyses showed that
pathological grade, pT and pN stage, and lymphovascular invasion
were significant risk factors for recurrence (Table SI). In the multivariable analysis,
which included the SDC1 score for each compartment and variables
identified as significant risk factors for recurrence in the
univariate analyses, Q1-Q2 membranous SDC1 score was identified as
an independent risk factor for recurrence (hazard ratio, 6.32; 95%
confidence interval, 1.12–35.64; P=0.037; Table IV). The statistical significance of
the Q1-Q2 membranous SDC1 score was retained in the Firth-penalized
Cox proportional hazards model (hazard ratio, 4.78; 95% confidence
interval, 1.15–26.35; P=0.031; Table
SII).
| Table IV.Multivariable analysis of
disease-free survival. |
Table IV.
Multivariable analysis of
disease-free survival.
| Variable | HR | 95% CI | P-value |
|---|
| Membranous
SDC1 |
|
|
|
|
Q1-2 | Reference |
|
|
|
Q3-4 | 0.158 | 0.03–0.89 | 0.037a |
| Cytoplasmic
SDC1 |
|
|
|
|
Q1-2 | Reference |
|
|
|
Q3-4 | 0.195 | 0.02–1.57 | 0.124 |
| Stromal SDC1 |
|
|
|
|
Q1-2 | Reference |
|
|
|
Q3-4 | 0.756 | 0.17–330 | 0.710 |
Discussion
This study investigated the association between SDC1
expression, as identified using IHC staining, and prognosis in CRC,
as well as evaluated its correlation with serum SDC1 levels.
Decreased or absent SDC1 expression in all compartments was
associated with tumor depth, and decreased or absent membranous
SDC1 expression was identified as an independent risk factor for
recurrence. SDC1 expression was not associated with serum SDC1
levels.
The cell surface is covered with a layer of
carbohydrate-rich glycocalyx, which is bound to the cell through
several backbone molecules, such as proteoglycans and
glycoproteins. SDC1 bears diverse heparan sulfate chains capable of
interacting with extracellular matrix compartments, growth factors,
cytokines, chemokines, lipid metabolites, and morphogenetic factors
(9,17). During malignant transformation of
normal cells or acquisition of invasive and metastatic potential by
cancer cells, epithelial cells undergo multiple organized molecular
alterations, which lead to the development of mesenchymal
characteristics and migratory phenotypes. At the time of
epithelial-mesenchymal transition, transcriptional repression of
epithelial markers and loss of SDC1 on the cell membrane occur
(18). In normal colons, it has
been reported that SDC1 is expressed around the columnar epithelial
basement membrane and plasma cells and that SDC1 is reduced or
absent in the majority of adenocarcinoma cells (10). Loss of SDC1 expression has been
reported to be associated with histological differentiation,
clinical stage, OS, and DFS (19–21).
There are two possible mechanisms for the prognostic impact of
reduced membranous SDC1 expression: i) disruption of cell-cell and
cell-extracellular matrix adhesion causes proliferation and
migration of cancer cells (22);
ii) shedding of SDC1 forms a vascular endothelial growth factor
(VEGF) complex that activates integrin and VEGF receptors, thereby
promoting cancer cell proliferation (23,24).
In the present study, reduced membranous SDC1 expression was
associated with the pT and pN stage, pathological TNM stage, and
DFS. Considering these findings, SDC1 expression on the membrane of
cancer cells is a potential biomarker of poor prognosis in patients
with CRC.
In cancer cells, SDC1 is expressed in the
cytoplasmic and stromal compartments, whereas membranous SDC1
expression is either decreased or lost. In breast and prostate
cancer, cytoplasmic SDC1 expression has been reported to be
associated with tumor stage, lymph node metastasis, recurrence, and
poor prognosis (25,26). Cytoplasmic SDC1 expression is
considered to be the accumulation of SDC1 shed from the cell
membrane; however, SDC1 expression in the cytoplasmic compartments
remains unclear. Previous reports on cytoplasmic SDC1 expression in
CRC have demonstrated that epithelial SDC1 expression, which
consists of cytoplasmic and membranous expression, is associated
with advanced tumor stage, with no association to prognosis
(27). In a previous study,
cytoplasmic SDC1 expression was not found to be associated with
prognosis. Nevertheless, cytoplasmic SDC1 expression was strongly
correlated with membranous SDC1 expression and was associated with
early tumor stage. The discrepancies in previous studies may be
partly explained by differences in the evaluation of staining
scores.
Stromal SDC1 expression has also been described as a
poor prognostic factor for breast, prostate, ovarian, and
pancreatic cancer (25,28–30).
In breast cancer, stromal SDC1 expression may reflect its
expression in fibroblasts. Fibronectin levels are elevated in the
presence of fibroblasts that express SDC1, which is considered to
promote tumor adhesion and invasion (31). In contrast, stromal SDC1 expression
in CRC is a good prognostic factor, and fibroblasts that express
SDC1 have been suggested to be responsible for tumor suppression
(13). In the present study,
stromal SDC1 expression was not associated with prognosis but was
significantly associated with early tumor stage. In contrast to a
previous report by Yang et al (31), stromal SDC1 expression was
positively correlated with membranous SDC1 expression, and
differences in staining patterns may be involved in the role of
fibroblasts with SDC1 expression. However, the mechanism and
function of SDC1 expression in stromal fibroblasts remain unclear
and require further investigation.
Serum SDC1 levels have been reported to be
associated with progression-free survival, OS, and chemotherapy
resistance in CRC with distant metastasis, suggesting that soluble
SDC1, shed from the cell membrane, interacts with heparin-binding
epidermal growth factor (EGF), enhancing and activating the EGF
receptor and downstream signaling (11,12).
In contrast to previous reports, our study showed that elevated
serum SDC1 levels after surgery significantly improved DFS and may
be an indicator of prognosis in stages II–III (14). Our study included patients with
curatively resectable CRC, which may be one of the reasons why
serum SDC1 levels were not associated with poor prognosis. Although
serum SDC1 levels were elevated by SDC1 shedding from the tumor
cell membrane, there was no correlation between perioperative serum
SDC1 levels and membranous SDC1 expression, suggesting that some
differences might exist in the origin of serum SDC1. In animal
studies, chemokine-1 and chemokine-2 clearance was promoted after
the administration of vascular endothelium-derived SDC1, which has
a homeostatic function by regulating inflammatory factors to
resolve inflammation (5). The
glycocalyx function of the vascular endothelium has been suggested
to vary depending on the medical condition (32), and postoperative elevation of serum
SDC1 levels may reflect differences in glycocalyx function in
maintaining homeostasis. The heparan sulfate chain of SDC1 contains
sequences that promote and inhibit tumor growth (33); thus, the functions of SDC1 may
differ depending on the carcinoma type, location, and regulatory
mechanisms (5,27).
This study has some limitations. First, this was a
single-institution retrospective cohort study, which may have
introduced selection bias. However, a strength of the study is that
histopathological assessments were performed by a single
pathologist (HT) throughout the study period, ensuring uniform
evaluation. Second, the small sample size may have also caused
bias. To reduce bias, we investigated the predictors for recurrence
using Cox regression analysis with Firth's penalized method. The
statistical significance of membranous SDC1 expression was
maintained (Table SII). Although
Firth's correction can reduce bias, it may not be suitable for all
scenarios. Thus, the results should be interpreted with caution.
Despite the limitations, our findings provide practical clinical
data showing the association between SDC1 expression and outcomes
in CRC.
In conclusion, decreased or absent membranous SDC1
expression was associated with tumor grade and was an independent
risk factor for recurrence. Elevated serum SDC1 levels after
surgery may reflect the homeostatic function of the vascular
endothelium, suggesting its potential as a prognostic
indicator.
Supplementary Material
Supporting Data
Supporting Data
Acknowledgments
Not applicable.
Funding
This study was supported by JSPS KAKENHI [grant nos.
JP20K0758723 (HT) and JP23H03326 (HT)] and the JST FOREST Program
[grant no. JPMJFR220W (HT)].
Availability of data and materials
The data generated in the present study may be
requested from the corresponding author.
Authors' contributions
KT, HH, YS and HT conceived and designed the study.
HH, TH, ME, RY, KM, MK, MF, RA, JYT, TT and NM collected the data.
KT, IY and YT performed the analysis and interpretation of the
data. KT drafted the manuscript. HH, TH, KM, MK, NM and HT revised
the manuscript. HH and NM confirm the authenticity of all the raw
data. All authors have read and approved the final manuscript.
Ethics approval and consent to
participate
The present study was conducted in accordance with
the World Medical Association Declaration of Helsinki and was
approved by the Ethics Committee of Gifu University (approval nos.
2019-074 and 2021-C162). All patients provided written informed
consent.
Patient consent for publication
Written informed consent for publication was
obtained from all participants prior to study enrollment.
Competing interests
The authors declare that they have no competing
financial interests.
Glossary
Abbreviations
Abbreviations:
|
CRC
|
colorectal cancer
|
|
DFS
|
disease-free survival
|
|
EGF
|
epidermal growth factor
|
|
OS
|
overall survival
|
|
IHC
|
immunohistochemical
|
|
PBS
|
phosphate-buffered saline
|
|
pN
|
pathological N
|
|
pT
|
pathological T
|
|
Q
|
quartile
|
|
VEGF
|
vascular endothelial growth factor
|
References
|
1
|
Bray F, Laversanne M, Sung H, Ferlay J,
Siegel RL, Soerjomataram I and Jemal A: Global cancer statistics
2022: GLOBOCAN estimates of incidence and mortality worldwide for
36 cancers in 185 countries. CA Cancer J Clin. 74:229–263. 2024.
View Article : Google Scholar : PubMed/NCBI
|
|
2
|
Tzang CC, Lee YW, Lin WC, Lin LH, Kang YF,
Lin TY, Wu WT and Chang KV: Evaluation of immune checkpoint
inhibitors for colorectal cancer: A network meta-analysis. Oncol
Lett. 28:5692024. View Article : Google Scholar : PubMed/NCBI
|
|
3
|
Batsalova T, Uzunova D, Chavdarova G,
Apostolova T and Dzhambazov B: Some glycoproteins expressed on the
surface of immune cells and cytokine plasma levels can be used as
potential biomarkers in patients with colorectal cancer.
Biomolecules. 14:13142024. View Article : Google Scholar : PubMed/NCBI
|
|
4
|
Szatmári T, Ötvös R, Hjerpe A and Dobra K:
Syndecan-1 in cancer: Implications for cell signaling,
differentiation, and prognostication. Dis Markers. 2015:7960522015.
View Article : Google Scholar : PubMed/NCBI
|
|
5
|
Teng YHF, Aquino RS and Park PW: Molecular
functions of syndecan-1 in disease. Matrix Biol. 31:3–16. 2012.
View Article : Google Scholar : PubMed/NCBI
|
|
6
|
Beauvais DM, Ell BJ, McWhorter AR and
Rapraeger AC: Syndecan-1 regulates alphavbeta3 and alphavbeta5
integrin activation during angiogenesis and is blocked by
synstatin, a novel peptide inhibitor. J Exp Med. 206:691–705. 2009.
View Article : Google Scholar : PubMed/NCBI
|
|
7
|
Khotskaya YB, Dai Y, Ritchie JP, MacLeod
V, Yang Y, Zinn K and Sanderson RD: Syndecan-1 is required for
robust growth, vascularization, and metastasis of myeloma tumors in
vivo. J Biol Chem. 284:26085–26095. 2009. View Article : Google Scholar : PubMed/NCBI
|
|
8
|
Maeda T, Desouky J and Friedl A:
Syndecan-1 expression by stromal fibroblasts promotes breast
carcinoma growth in vivo and stimulates tumor angiogenesis.
Oncogene. 25:1408–1412. 2006. View Article : Google Scholar : PubMed/NCBI
|
|
9
|
Couchman JR: Syndecan-1 (CD138),
carcinomas and EMT. Int J Mol Sci. 22:42272021. View Article : Google Scholar : PubMed/NCBI
|
|
10
|
Hashimoto Y, Skacel M and Adams JC:
Association of loss of epithelial syndecan-1 with stage and local
metastasis of colorectal adenocarcinomas: An immunohistochemical
study of clinically annotated tumors. BMC Cancer. 8:1852008.
View Article : Google Scholar : PubMed/NCBI
|
|
11
|
Wang X, Zuo D, Chen Y, Li W, Liu R, He Y,
Ren L, Zhou L, Deng T, Wang X, et al: Shed Syndecan-1 is involved
in chemotherapy resistance via the EGFR pathway in colorectal
cancer. Br J Cancer. 111:1965–1976. 2014. View Article : Google Scholar : PubMed/NCBI
|
|
12
|
Muendlein A, Severgnini L, Decker T,
Heinzle C, Leiherer A, Geiger K, Drexel H, Winder T, Reimann P,
Mayer F, et al: Circulating syndecan-1 and glypican-4 predict
12-month survival in metastatic colorectal cancer patients. Front
Oncol. 12:10459952022. View Article : Google Scholar : PubMed/NCBI
|
|
13
|
Li Z, He S, Liu J, Zhi X, Yang L, Zhang J,
Zhao R, Zhang R, Li L and Wang W: High expression of SDC1 in
stromal cells is associated with good prognosis in colorectal
cancer. Anticancer Drugs. 34:479–482. 2023. View Article : Google Scholar : PubMed/NCBI
|
|
14
|
Tanaka H, Hayashi H, Tomita H, Tokumaru Y,
Fukada M, Tajima JY, Yokoi R, Tsuchiya H, Kuno M, Sato Y, et al:
Association of preoperative and postoperative plasma syndecan-1 and
colorectal cancer outcome. Anticancer Res. 44:1611–1618. 2024.
View Article : Google Scholar : PubMed/NCBI
|
|
15
|
Ismail Y, Zakaria AS, Allam R, Götte M,
Ibrahim SA and Hassan H: Compartmental Syndecan-1 (CD138)
expression as a novel prognostic marker in triple-negative
metaplastic breast cancer. Pathol Res Pract. 253:1549942024.
View Article : Google Scholar : PubMed/NCBI
|
|
16
|
Union for International Cancer Control, .
TNM classification of malignant tumours. 8th Edition. Wiley
Publications; 2017
|
|
17
|
Bishop JR, Schuksz M and Esko JD: Heparan
sulphate proteoglycans fine-tune mammalian physiology. Nature.
446:1030–1037. 2007. View Article : Google Scholar : PubMed/NCBI
|
|
18
|
Kalluri R and Weinberg RA: The basics of
epithelial-mesenchymal transition. J Clin Invest. 119:1420–1428.
2009. View
Article : Google Scholar : PubMed/NCBI
|
|
19
|
Wei HT, Guo EN, Dong BG and Chen LS:
Prognostic and clinical significance of syndecan-1 in colorectal
cancer: A meta-analysis. BMC Gastroenterol. 15:1522015. View Article : Google Scholar : PubMed/NCBI
|
|
20
|
Li K, Li L, Wu X, Yu J, Ma H, Zhang R, Li
Y and Wang W: Loss of SDC1 expression is associated with poor
prognosis of colorectal cancer patients in Northern China. Dis
Markers. 2019:37687082019. View Article : Google Scholar : PubMed/NCBI
|
|
21
|
Al-Maghrabi J: Loss of expression of
syndecan-1 is associated with tumor recurrence, metastatic
potential, and poor survival in patients with colorectal carcinoma.
Pak J Med Sci. 37:114–120. 2021.PubMed/NCBI
|
|
22
|
Hassan H, Greve B, Pavao MSG, Kiesel L,
Ibrahim SA and Götte M: Syndecan-1 modulates β-integrin-dependent
and interleukin-6-dependent functions in breast cancer cell
adhesion, migration, and resistance to irradiation. FEBS J.
280:2216–2227. 2013. View Article : Google Scholar : PubMed/NCBI
|
|
23
|
Choi S, Lee H, Choi JR and Oh ES:
Shedding; towards a new paradigm of syndecan function in cancer.
BMB Rep. 43:305–310. 2010. View Article : Google Scholar : PubMed/NCBI
|
|
24
|
Yang Z, Chen S, Ying H and Yao W:
Targeting syndecan-1: New opportunities in cancer therapy. Am J
Physiol Cell Physiol. 323:C29–C45. 2022. View Article : Google Scholar : PubMed/NCBI
|
|
25
|
Kind S, Jaretzke A, Büscheck F, Möller K,
Dum D, Höflmayer D, Hinsch A, Weidemann S, Fraune C, Möller-Koop C,
et al: A shift from membranous and stromal syndecan-1 (CD138)
expression to cytoplasmic CD138 expression is associated with poor
prognosis in breast cancer. Mol Carcinog. 58:2306–2315. 2019.
View Article : Google Scholar : PubMed/NCBI
|
|
26
|
Kind S, Kluth M, Hube-Magg C, Möller K,
Makrypidi-Fraune G, Lutz F, Lennartz M, Rico SD, Schlomm T, Heinzer
H, et al: Increased cytoplasmic CD138 expression is associated with
aggressive characteristics in prostate cancer and is an independent
predictor for biochemical recurrence. Biomed Res Int.
2020:58453742020. View Article : Google Scholar : PubMed/NCBI
|
|
27
|
Kim SY, Choi EJ, Yun JA, Jung ES, Oh ST,
Kim JG, Kang WK and Lee SH: Syndecan-1 expression is associated
with tumor size and EGFR expression in colorectal carcinoma: A
clinicopathological study of 230 cases. Int J Med Sci. 12:92–99.
2015. View Article : Google Scholar : PubMed/NCBI
|
|
28
|
Mennerich D, Vogel A, Klaman I, Dahl E,
Lichtner RB, Rosenthal A, Pohlenz HD, Thierauch KH and Sommer A:
Shift of syndecan-1 expression from epithelial to stromal cells
during progression of solid tumours. Eur J Cancer. 40:1373–1382.
2004. View Article : Google Scholar : PubMed/NCBI
|
|
29
|
Davies EJ, Blackhall FH, Shanks JH, David
G, McGown AT, Swindell R, Slade RJ, Martin-Hirsch P, Gallagher JT
and Jayson GC: Distribution and clinical significance of heparan
sulfate proteoglycans in ovarian cancer. Clin Cancer Res.
10:5178–5186. 2004. View Article : Google Scholar : PubMed/NCBI
|
|
30
|
Juuti A, Nordling S, Lundin J, Louhimo J
and Haglund C: Syndecan-1 expression-a novel prognostic marker in
pancreatic cancer. Oncology. 68:97–106. 2005. View Article : Google Scholar : PubMed/NCBI
|
|
31
|
Yang N, Mosher R, Seo S, Beebe D and
Friedl A: Syndecan-1 in breast cancer stroma fibroblasts regulates
extracellular matrix fiber organization and carcinoma cell
motility. Am J Pathol. 178:325–335. 2011. View Article : Google Scholar : PubMed/NCBI
|
|
32
|
Okada H, Yoshida S, Hara A, Ogura S and
Tomita H: Vascular endothelial injury exacerbates coronavirus
disease 2019: The role of endothelial glycocalyx protection.
Microcirculation. 28:e126542021. View Article : Google Scholar : PubMed/NCBI
|
|
33
|
Liu D, Shriver Z, Venkataraman G, El
Shabrawi Y and Sasisekharan R: Tumor cell surface heparan sulfate
as cryptic promoters or inhibitors of tumor growth and metastasis.
Proc Natl Acad Sci USA. 99:568–573. 2002. View Article : Google Scholar : PubMed/NCBI
|