Introduction
Pancreatic ductal adenocarcinoma (PDAC) is one of
the most lethal and aggressive cancer types, ranking as the fourth
leading cause of cancer-related deaths globally. The bleak outlook
and elevated mortality rates associated with pancreatic cancer are
chiefly due to its aggressive characteristics and the absence of
efficient early detection techniques. In 2021, the United States
recorded ~60,430 new instances of pancreatic cancer, resulting in
~48,220 deaths, highlighting its considerable impact on public
health (1). The prevalence of PDAC
is increasing, and it is anticipated to emerge as the second
leading cause of cancer-related mortality in the United States by
2030, provided that existing trends continue (2).
PDAC is frequently identified at advanced stages,
resulting in a scarcity of curative treatment options. A total of
~80% of individuals receive a diagnosis of locally advanced or
metastatic pancreatic cancer, which makes surgical resection
unattainable for most, despite it being the sole potential curative
intervention (3). Additionally,
individuals diagnosed with metastatic PDAC exhibit a median overall
survival (OS) of <1 one year, whilst the 5-year survival rate is
~10% (4). The inherent resistance
of PDAC to chemotherapeutic agents and radiation modalities
complicates therapeutic interventions, as most patients encounter
recurrence or disease progression within a few months following
initial treatment (5).
The absence of effective early detection methods
notably contributes to the high mortality rate. Most patients do
not exhibit symptoms until the disease advances, and current
imaging modalities, such as CT and MRI, lack sufficient sensitivity
for early diagnosis (6). Although
biomarkers such as cancer antigen 19-9 are recognized as potential
diagnostic and prognostic tools, their usefulness in clinical
settings is limited by their low specificity and sensitivity,
especially during the early stages of the disease (7).
Current treatment strategies for PDAC encompass
surgical resection for localized cases, alongside chemotherapy and
radiation therapy. The prevalent chemotherapy regimen for advanced
PDAC is FOLFIRINOX, which consists of fluorouracil, leucovorin,
irinotecan and oxaliplatin. This combination yields modest
enhancements in OS relative to earlier treatment modalities
(8). Furthermore, the pairing of
gemcitabine and nab-paclitaxel is employed as a first-line
approach, yielding moderate outcomes (9). Nevertheless, despite these therapeutic
advancements, the prognosis for PDAC remains unfavorable, primarily
due to its inherent resistance to chemotherapy and the presence of
a dense desmoplastic stroma that obstructs effective drug delivery
(10).
Given the aggressive nature of PDAC and the limited
efficacy of current treatment options, there is an urgent need to
discover new therapeutic targets. Molecular investigations of PDAC
have identified several promising targets, such as KRAS mutations,
which are present in ~90% of patients, along with heightened
expression of epidermal growth factor receptor and vascular
endothelial growth factor (11,12).
However, clinical trials targeting these pathways have so far
produced limited outcomes, underscoring the challenges in
developing effective treatments for this malignancy (13–15).
To improve the outcomes of patients with PDAC, it is
essential to develop more advanced prognostic models and tailored
treatment strategies. The combination of molecular biomarkers,
including genetic mutations, alongside clinical parameters, holds
potential for forecasting patient outcomes and informing
therapeutic choices (16).
Furthermore, the advent of immunotherapy as a prospective treatment
approach for PDAC, whilst still in its early phases, could provide
renewed optimism for patients who have depleted standard treatment
options (17). Immunotherapy
approaches, especially those utilizing programmed cell death
protein 1/programmed death-ligand 1 inhibitors, have demonstrated
constrained efficacy in initial clinical trials. Nonetheless, the
integration of immune checkpoint inhibitors with additional
modalities like chemotherapy or targeted therapies could
potentially improve the efficacy of these strategies (18).
In summary, PDAC presents a marked obstacle in the
realm of cancer treatment, characterized by its rapid advancement,
diagnosis at advanced stages and notable resistance to current
therapeutic approaches. Despite advancements in therapeutic
approaches, the outlook for patients with PDAC remains unfavorable.
Continued research is essential for identifying novel biomarkers,
uncovering new therapeutic targets and developing personalized
treatment strategies that could improve clinical outcomes. The
creation of new prognostic models incorporating genetic, molecular
and clinical data is vital for advancing targeted therapies and
enhancing survival rates for this devastating cancer.
Manganese (Mn) is a crucial trace element in
biological systems, involved in regulating essential cellular
functions such as antioxidant defense and enzyme activation. Mn
serves as an important cofactor for several enzymes, particularly
Mn-dependent superoxide dismutase (MnSOD), which is vital for
maintaining cellular homeostasis. Whilst Mn is essential, excessive
accumulation can lead to toxicity, particularly in the brain, where
high Mn levels have been associated with neurodegenerative
conditions such as Parkinson's disease and Huntington's disease
(19,20). Beyond its neurotoxic effects, recent
research indicates that Mn may also serve a role in the initiation
and progression of cancer (21).
However, its precise role in cancers, including PDAC, remains
poorly understood.
Mn deficiency has been reported to induce cellular
stress and activate pathways related to apoptosis and oxidative
damage. A key mechanism by which Mn deficiency affects cellular
function is through the activation of the tumor suppressor protein
p53, which promotes mitochondrial-mediated apoptosis (22). Mn is crucial for maintaining the
equilibrium of reactive oxygen species (ROS) within cells.
Mn-dependent enzymes, particularly MnSOD, are vital components of
the cellular antioxidant defense system. Imbalances in this system
can lead to carcinogenesis. In cancer, Mn deficiency compromises
the antioxidant defense, causing oxidative damage and genomic
instability, which may lead to tumorigenesis (23).
Furthermore, research has reported that Mn modulates
signaling pathways that support the survival, proliferation and
spread of cancer cells. Specifically, in oral squamous cell
carcinoma, Mn has been reported to activate the YAP/TAZ signaling
pathway, enhancing ferroptosis, a type of cell death dependent on
iron (24). Similarly, alterations
in Mn metabolism have been associated with the progression of
prostate cancer, with reduced serum Mn concentrations observed in
patients. This suggests that Mn deficiency may contribute to cancer
development (25).
Whilst marked advancements have been achieved in
elucidating the function of Mn and Mn-related genes in cancer,
their precise influence on the prognosis of PDAC is still
inadequately investigated. The poor prognosis of PDAC is largely
attributed to factors such as late-stage diagnosis, swift
metastatic progression and a pronounced resistance to standard
treatment modalities, including chemotherapy and radiation
(26). Similar to other cancers,
alterations in metal metabolism, particularly involving Mn, are
thought to serve a role in the development and advancement of PDAC.
Moreover, Mn is integral to cellular signaling, the management of
oxidative stress and mitochondrial functionality, highlighting its
potential as a focal point for further research in the realm of
PDAC.
Recent studies have emphasized the significance of
metabolism-related genes (MRGs) in cancer prognosis. In particular,
Mn-associated pathways are thought to influence the tumor
microenvironment (TME) and immune responses, offering potential
insights for the development of new prognostic models for PDAC
(27). However, the exact
contributions of Mn-related genes to PDAC prognosis remain unclear.
Therefore, the present study aimed assess the association between
MRGs and PDAC outcomes through the evaluation of transcriptomic
data from The Cancer Genome Atlas (TCGA) and Gene Expression
Omnibus (GEO) databases. Differential expression analysis was also
performed to identify MRGs that are significantly altered in PDAC
tissues. Furthermore, prognostic MRGs were identified through
univariate Cox regression and Least Absolute Shrinkage and
Selection Operator (LASSO) regression analyses, leading to the
development of a predictive risk model. This model then underwent
validation with independent PDAC cohorts. Gene Ontology (GO) and
Kyoto Encyclopedia of Genes and Genomes (KEGG) enrichment analyses
were performed to provide insights into the biological pathways
affected by these genes. Additionally, an evaluation of the immune
microenvironment was performed to elucidate the influence of these
MRGs on immune cell infiltration and their role in modulating
immune responses in PDAC. Drug sensitivity analysis was performed
to identify compounds targeting PDAC with disrupted Mn metabolism.
Furthermore, reverse transcription-quantitative (RT-qPCR) and
Kaplan-Meier (KM) survival analysis were used for experimental
validation of key MRGs. This comprehensive methodology aimed to
identify prognostic biomarkers, develop a risk model and
investigate therapeutic strategies for improving the outcomes of
patients with PDAC.
Materials and methods
Datasets
The TCGA-PDAC dataset was obtained from TCGA
(https://portal.gdc.cancer.gov/),
including 176 PDAC samples. Of these, 84 samples were from
survivors and 92 from deceased patients, forming the training set.
Additionally, the GSE62452 and GSE28735 datasets were downloaded
from the GEO database (http://www.ncbi.nlm.nih.gov/geo/) (28,29).
These datasets were merged and served as the external validation
set. After excluding samples lacking mRNA data, complete survival
information and clinical pathological data, the final cohort
included tissue samples from 107 patients with PDAC, consisting of
30 survivors and 77 deceased patients. The Genomics of Drug
Sensitivity in Cancer database (https://www.cancerRxgene.org/) was used to obtain
IC50 values for 198 drugs, which were utilized to assess
drug sensitivity in PDAC samples.
Mn MRGs as the target gene set
MRGs were defined as genes associated with Mn
metabolism. Initially, 1,829 genes were identified from the
GeneCards database (https://www.genecards.org/) using ‘Mn metabolism’ as
the search keyword (Table SI). To
confirm their functional relevance, GO and KEGG analyses were
performed.
Gene set enrichment analysis (GSEA) of
Mn metabolism pathways
A predetermined MRG set (derived from the GeneCards
database using ‘Mn metabolism’ as the search key word) was used to
perform GSEA to further elucidate the function of Mn metabolism in
PDAC. Expression data (sourced from TCGA-PDAC and GEO datasets:
GSE62452 and GSE28735) collected from PDAC samples were subjected
to the GSEA. GSEA was run once for the whole collection of genes, a
second time for genes demonstrating reduced expression (in PDAC
tumor tissues compared to normal controls, defined by log2FC
<-1.5 and adj.P<0.05) and a third time for genes with higher
expression (in PDAC tumor tissues compared to normal controls,
defined by log2FC >1.5 and adj.P<0.05).
Gene Set Variation Analysis
(GSVA)
GSVA was performed utilizing the GSVA package
(version 2.2.0; Bioconductor, http://www.bioconductor.org/packages/release/bioc/html/GSVA.html)
to assess variations in signaling pathways among the high- and
low-risk groups. The analysis was conducted using a significance
threshold defined by an adjusted P-value of <0.05. The GSVA
algorithm was applied to evaluate the enrichment of predefined gene
sets, with the x-axis representing the t-value calculated using a
t-test. Larger t-values indicate more significant differences
between groups, with blue bars representing upregulated pathways
and green bars representing downregulated pathways.
Identification of differentially
expressed MRGs
Under the conditions of |log2FoldChange
(FC)| >1.5 and adj.P<0.05, the DESeq2 program (version
1.30.1; Bioconductor, http://bioconductor.org/packages/DESeq2) was used to
identify differentially expressed genes (DEGs) between the PDAC and
control groups. Subsequently, the biological roles of the DEGs were
assessed by performing analyses in GO and KEGG using the
‘clusterProfiler’ software (version 4.0.5; Bioconductor, https://bioconductor.org/packages/clusterProfiler;
adj.P<0.05). By intersecting the DEGs with Mn MRGs, the
‘VennDiagram’ tool in R (version 1.7.3; CRAN, http://cran.r-project.org/package=VennDiagram) was
utilized to elucidate possible candidate genes. A Venn diagram was
then used to identify the overlap. The candidate genes were
subjected to additional GO and KEGG analyses using the
‘clusterProfiler’ package, and the ‘GOplot’ program (version 1.0.2;
CRAN, http://cran.r-project.org/package=GOplot) was used to
display the top five enriched pathways.
Tumor Immune Dysfunction and Exclusion
(TIDE) Score Analysis
The TIDE score was calculated using the TIDE
algorithm (version 1.0.0, http://github.com/nangong/TIDE) to assess tumor immune
dysfunction and exclusion in both high- and low-risk groups. The
TIDE algorithm integrates tumor expression profiles with
single-cell reference datasets to infer the degree of immune
dysfunction and exclusion within the tumor microenvironment. The
TIDE score is composed of two components: The dysfunction score,
which reflects the impairment of T cell function, and the exclusion
score, which indicates the degree to which T cells are excluded
from the tumor. A higher TIDE score is associated with poorer
clinical outcomes.
Regulatory and co-expression network
analysis
To investigate molecular regulatory mechanisms,
miRNAs associated with the prognostic genes were predicted using
the miRWalk database (version 2.0, http://mirwalk.umm.uni-heidelberg.de/) and miRNet
(version 2.0, http://www.mirnet.ca/). miRNAs
identified by both databases were selected as key candidates.
Potential lncRNAs interacting with these miRNAs were predicted
using StarBase (version 3.0, http://starbase.sysu.edu.cn/) and miRNet (version
2.0). The intersecting lncRNAs from both databases were chosen as
key lncRNAs. The lncRNA-miRNA-mRNA regulatory network was
visualized using Cytoscape (version 3.9.1; http://cytoscape.org/). Additionally, the GeneMANIA
database (version 3.6.0, http://genemania.org/) was used to identify genes
functionally related to the prognostic genes and construct a
co-expression network.
Development and validation of the MRGs
prognostic model
Gene selection was performed using univariate Cox
regression, multivariate Cox models and LASSO regression to
elucidate genes associated with PDAC prognosis. Using the survival
program (version 3.2–13; CRAN, http://cran.r-project.org/package=survival), PDAC
samples from the training cohort with full survival data were first
subjected to univariate Cox regression. The identification of genes
with a strong association with PDAC survival was performed using
the criterion of hazard ratio (HR) ≠1 and P<0.01. Further
refinement of the results was performed using the proportional
hazards (PH) assumption test, with a significance threshold of
P>0.05. Genes that passed the PH assumption test (P>0.05) and
the univariate Cox regression criteria (P<0.01) were then
analyzed using the glmnet software (version 4.1–3; CRAN, http://cran.r-project.org/package=glmnet) for LASSO
regression. To optimize gene selection, L1 regularization was first
used to minimize the gene coefficients, and then 10-fold
cross-validation was performed. A total of 12 genes were used to
build the risk model after they were identified to be significant
prognostic factors. The risk score for every PDAC sample was
determined using the following algorithm, taking into account all
available survival data from the training and validation cohorts:
Risk score = ∑ni=1 (βi ×
xi). In this model: βi, coefficient of each
prognostic gene; i, multivariate Cox regression model;
xi, expression level of prognostic gene, i. The PDAC
samples that had available survival data were divided into two
groups: High-risk and low-risk, according to the median risk score.
These groups were assessed for clustering using principal component
analysis (PCA). The survival package was utilized to perform a
Kaplan-Meier survival analysis, and a log-rank test was used to
determine whether there were statistically significant differences
between the survival curves of the two groups. Using ggplot2
software (version 3.3.5; CRAN, http://cran.r-project.org/package=ggplot2), Receiver
Operating Characteristic (ROC) curves were created to assess the
predictive performance of the model across a 1–5 year time frame.
The area under the curve was computed as part of the performance
evaluation using the timeROC program (version 0.4; CRAN, http://cran.r-project.org/package=timeROC). For
improved visualization of survival distributions in both risk
groups, survival curves and status plots were generated using the
Survminer package (version 0.4.9; CRAN, http://cran.r-project.org/package=survminer).
Furthermore, to demonstrate how the expression patterns of the
prognostic genes varied among different groups, a heatmap was
generated using the ggheat function in the tinyarray package
(version 2024; GitHub, http://github.com/xjsun1221/tinyarray). To ensure the
robustness of the model, it was externally validated using the
GSE62452 and GSE28735 datasets. These external datasets were
subjected to PCA once more to assess clustering. ROC curves were
then utilized to evaluate the performance of the models and
Kaplan-Meier survival analysis and log-rank tests were performed to
validate them on the test set. Additionally, heatmaps of the
prognostic gene expression patterns, survival status plots and risk
curves were generated for the test set.
To assess the association between clinical
pathological factors and the prognostic model, the survival package
was used to perform univariate and multivariate Cox regression
analyses on PDAC samples with full survival data from the training
set. Clinical variables, such as age and sex were analyzed, as well
as pathological stages [metastasis (M), lymph node (N) and tumor
(T) stages, and tumor stage] and the risk score. In the
multivariate analysis, factors were considered to be independent
prognostic markers if they met the PH assumption (P>0.05).
Furthermore, the rms program was used to create a
nomogram that predicted the survival probabilities for patients
with PDAC at 1, 3 and 5 years using the independent prognostic
factors revealed in the training set. The prediction accuracy of
the nomogram was evaluated by creating ROC curves for time periods
ranging from 1–5 years using the riskRegression software. The
performance of the nomogram was compared with those of other
independent prognostic indicators using these curves. To assess
specificity and sensitivity, the AUC was computed. In addition, the
predictive accuracy of the nomogram was evaluated by drawing
calibration curves for 1–5 years and comparing the anticipated
survival probability with theoretical survival curves. By comparing
the net benefit of the nomogram model with that of other
independent predictive indicators, the rmda program was used to
perform a decision curve analysis (DCA) evaluation of the clinical
utility of the nomogram.
Clinical feature association
analysis
Using the pheatmap software, a heatmap was created
to assess the relationships between the risk score, prognostic
genes and clinical features in PDAC samples and the whole survival
data of the training cohort. Using risk ratings and several
clinical variables, this heatmap demonstrated how the predictive
genes were expressed. The Wilcoxon rank-sum test or χ2
test (P<0.05) was used to evaluate differences in clinical
features between the two groups, and the findings were displayed in
a heatmap. To further distinguish between the high- and low-risk
groups, functional enrichment analysis was used to find DEGs.
Cell culture
The human PDAC cell lines PANC-1 (RRID: CVCL_0480)
and PaTu-8988t (RRID: CVCL_1847) were purchased from the Cell Bank
of the Chinese Academy of Sciences, and the human pancreatic duct
epithelial cell line hTERT-HPNE (RRID: CVCL_C466) was purchased
from the American Type Culture Collection (ATCC). All cell lines
were authenticated using short tandem repeat profiling and
routinely tested for mycoplasma contamination using Mycoplasma
Removal Agent (cat. no. BL591B; Biosharp Life Sciences).
PANC-1 and PaTu-8988t cells were cultured in
Dulbecco's Modified Eagle Medium (DMEM; cat. no. MA0212;
MeilunBio®; Dalian Meilun Biotech Co., Ltd.)
supplemented with 10% fetal bovine serum (FBS; cat. no. S1001-500;
BIOAGRIO; Shanghai Yuli Biotechnology Co., Ltd.) and 1%
penicillin-streptomycin (cat. no. C100C5; New Cell and Molecular
Biotech Co., Ltd.). They were maintained in a humidified incubator
(Heal Force Bio-meditech Holdings Ltd.) at 37°C with 5%
CO2.
hTERT-HPNE cells were cultured according to ATCC
recommendations using a base medium composed of 75% glucose-free
DMEM (cat. no. D5030; Sigma-Aldrich; Merck KGaA) and 25%
M3:BaseF™ medium (cat. no. M300F-500; INCELL Corporation
LLC), supplemented with 5% FBS (FBS; cat. no. S1001-500; BIOAGRIO;
Shanghai Yuli Biotechnology Co., Ltd.), 10 ng/ml recombinant human
EGF (PeproTech China), 5.5 mM D-glucose and 750 ng/ml puromycin
(Sigma-Aldrich; Merck KGaA). Cells were maintained in T25/T75
culture flasks with medium refreshed every 2–3 days and subcultured
at 80–90% confluence using 0.25% trypsin-EDTA.
Transfection
Kynureninase (KYNU) gene knockdown was performed in
human PDAC PANC-1 (RRID: CVCL_0480) and PaTu-8988t (RRID:
CVCL_1847) cell lines using small interfering (si)RNAs synthesized
by Bioscien Biotech Co., Ltd. The sequences used were as follows:
KYNU-siRNA, 5′-CCTCCAGTTGATTTATCATTAtt-3′ and negative control
(NC)-siRNA, 5′-UUCUCCGAACGUGUCACGUtt-3′. siRNAs (6 pmol/well) were
diluted in serum-free Opti-MEM™ (Gibco; Thermo Fisher
Scientific, Inc.) and mixed with Lipofectamine™ RNAiMAX
Transfection Reagent (cat. no. 13778075; Invitrogen™;
Thermo Fisher Scientific, Inc.). After 15 min of incubation at room
temperature, the mixture was added to the cells. Cells were
incubated at 37°C for 6 h, after which the medium was replaced with
complete growth medium. Cells were harvested at 48 h
post-transfection for downstream analysis.
For Cytochrome P450 Family 27 Subfamily A Member 1
(CYP27A1) overexpression, pcDNA3.1-CYP27A1 and the corresponding
empty vector were purchased from Shanghai GenePharma Co., Ltd.
Transfection was performed using Lipofectamine 3000 (cat. no.
L3000015; Invitrogen; Thermo Fisher Scientific, Inc.), with 2 µg
plasmid DNA/well, following the manufacturer's instructions. Cells
were collected for analysis at 48 h after transfection. All
experiments were independently performed in triplicate to ensure
reproducibility.
RT-qPCR validation
Total RNA was extracted from PDAC cell lines (PANC-1
and PaTu-8988t) using the RNA extraction kit (cat. no. AC0202;
Shandong Sikejie Biotechnology Co., Ltd.). A 20 µl reverse
transcription reaction was prepared for cDNA synthesis, utilizing
the ABScript Neo RT Master Mix for qPCR with gDNA Remover (cat. no.
RK20433; ABclonal Biotech Co., Ltd.). Reverse transcription was
performed as follows: 37°C for 2 min (pre-denaturation), 55°C for
15 min (cDNA synthesis) and 85°C for 5 min (enzyme inactivation).
qPCR was performed using 10 µl 2X Universal SYBR Green Fast qPCR
Mix (cat. no. RK21203; ABclonal Biotech Co., Ltd.). The
thermocycling protocol included an initial denaturation at 95°C for
3 min, followed by 40 cycles of denaturation at 95° for 5 sec and
annealing at 60°C for 30–34 sec. Table
SII presents the primer sequences. The 2−ΔΔCq method
was used to calculate relative mRNA levels, which were then
normalized to the control group (30). Sangon Biotech Co., Ltd. synthesized
the primers.
Cell viability assay
A Cell Counting Kit-8 (CCK-8; cat. no. MA0218-1;
MeilunBio; Dalian Meilun Biotech Co., Ltd.) was used to measure
cell viability in human PDAC PANC-1 (RRID: CVCL_0480) and
PaTu-8988t (RRID: CVCL_1847) cell lines. Briefly, cells in the
logarithmic phase of growth were treated with 0.25% trypsin,
suspended in medium supplemented with 10% FBS and plated in 96-well
plates at a density of 5,000 cells/well. After the cells adhered,
the culture medium was replaced with 10 µl CCK-8 solution and 90 µl
fresh medium, and the cells were incubated for 2 h. The absorbance
was then measured at 450 nm.
Colony formation assay
Pancreatic cancer 8988 and PANC-1 cell lines from
both experimental and control groups were harvested during the
logarithmic growth phase. Cell counting was performed using an
automated cell counter (Countstar Rigel S2, Countstar, Inc.).
Subsequently, 800 viable cells per well were seeded in 6-well
plates for further experiments. Following seeding, the cells were
maintained at 37°C under 5% CO2 with 95% relative
humidity for 14 days, with medium changes performed every 48 h
until each cellular clone contained >50 cells. Thereafter, cells
were fixed with 4% paraformaldehyde at room temperature (20–25°C)
for 20 min and stained with 0.1% crystal violet at room temperature
for 30 min. Images were then captured and analyzed using lmageJ
software (National Institutes of Health).
Wound healing assay (WHA)
The WHA was initiated by seeding 8988 and PANC-1
cell lines in 6-well plates to achieve ~90% confluence. Following
24-h of serum starvation, a sterile 200 µl pipette tip was used to
scratch the cells in each well. Wound closure was observed under a
microscope (Nikon Eclipse Ts2; Nikon Corporation) and images were
captured at 0, 24 and 48 h post-scratch. The wound area was
analyzed using ImageJ software (National Institutes of Health) and
the migration rate was calculated using the following equation:
Migration Rate=1-(Wound Area at tn/Wound Area at
t0), where t0 is the initial wound area,
tn is the wound area after n hours of the initial
scratch.
Statistical analysis
The DESeq2 program was used to identify DEGs, with a
cutoff of |log2FC| >1.5 and an adjusted P-value of <0.05. To
evaluate OS among different patient groupings, log-rank tests and
Kaplan-Meier survival curves were utilized. Spearman's rank
correlation analysis was performed to assess the correlation
between immune cell infiltration levels and the expression of
prognostic genes. To identify the independent prognostic
significance of risk factors, univariate and multivariate Cox
regression models were used. Furthermore, genes that were revealed
to have predictive value for PDAC were identified using a LASSO
regression model. Using the Mann-Whitney U test, the high- and
low-risk groups were utilized to assess differences in immune cell
infiltration and activation of immunological pathways. For
expression analysis, RT-qPCR data were analyzed using two-tailed
unpaired Student's t-tests (each sample was analyzed in triplicate
independent experiments), and results are presented as
mean±standard error of the mean. Furthermore, for functional
validation assays, comparisons between two groups were performed
using two-tailed unpaired Student's t-tests (each experiment was
repeated three times independently). R (version 4.0.2; The R
Foundation) was used to perform all statistical analyses. P<0.05
was considered to indicate a statistically significant difference.
The analytical framework of the present study is presented in
Fig. 1.
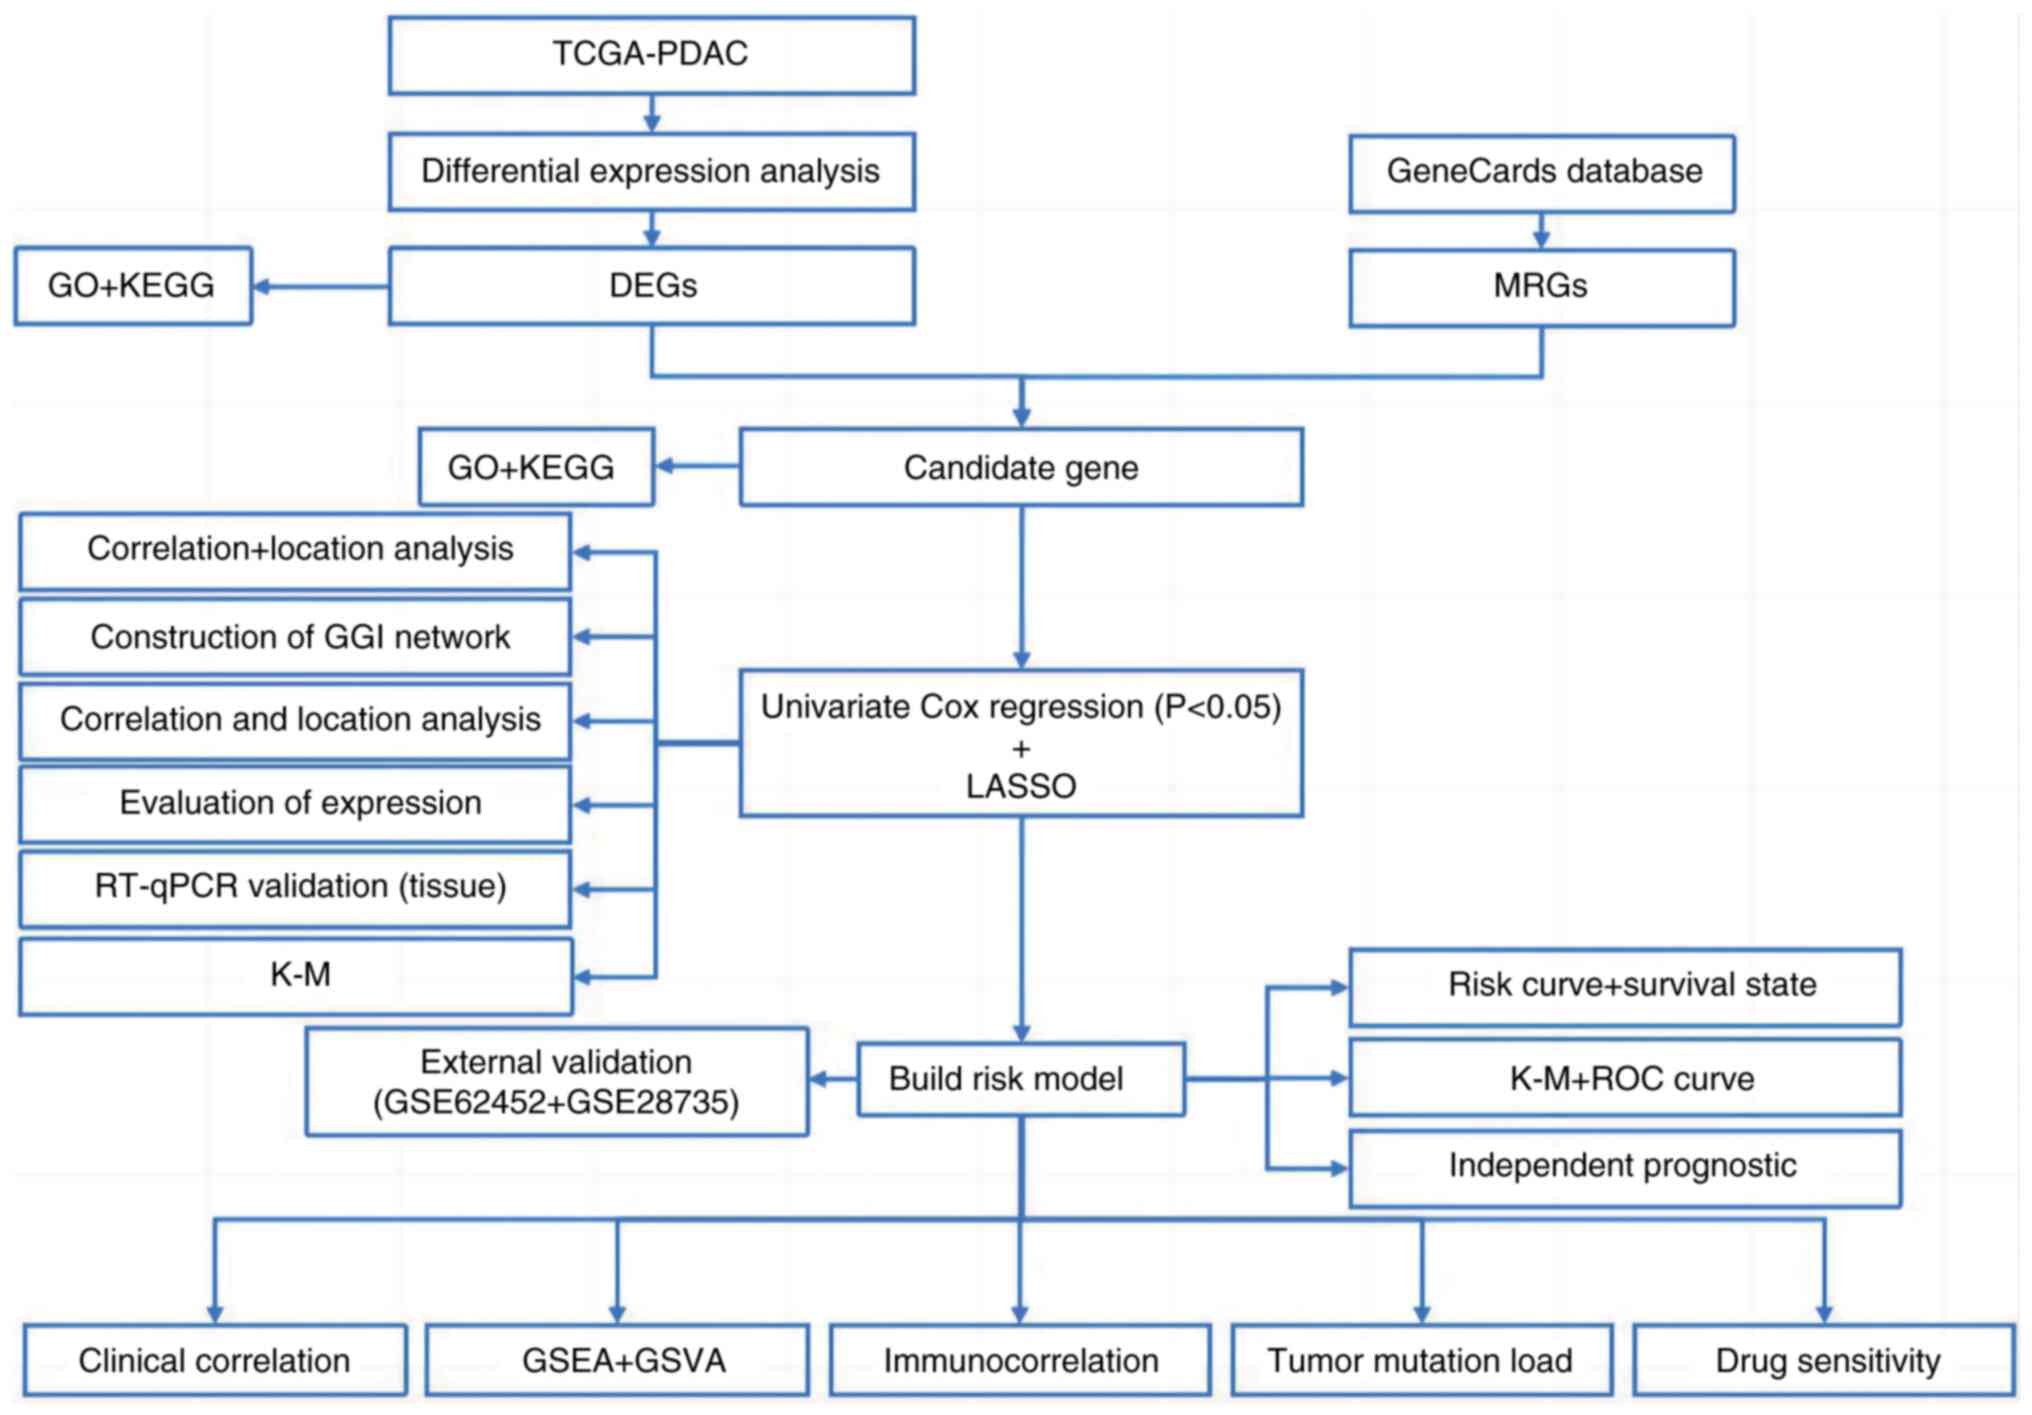 | Figure 1.Workflow diagram. TCGA, The Cancer
Genome Atlas; PDAC, pancreatic ductal adenocarcinoma; GO, Gene
Ontology; KEGG, Kyoto Encyclopedia of Genes and Genomes; DEGs,
differentially expressed genes; MRGs, metabolism-related genes;
GGI, gene-gene interaction; RT-qPCR, reverse
transcription-quantitative PCR; K-M, Kaplan-Meier; LASSO, Least
Absolute Shrinkage and Selection Operator; ROC, Receiver Operating
Characteristic; GSEA, Gene Set Enrichment Analysis; GSVA, Gene Set
Variation Analysis. |
Results
DEGs between normal and tumor
tissues
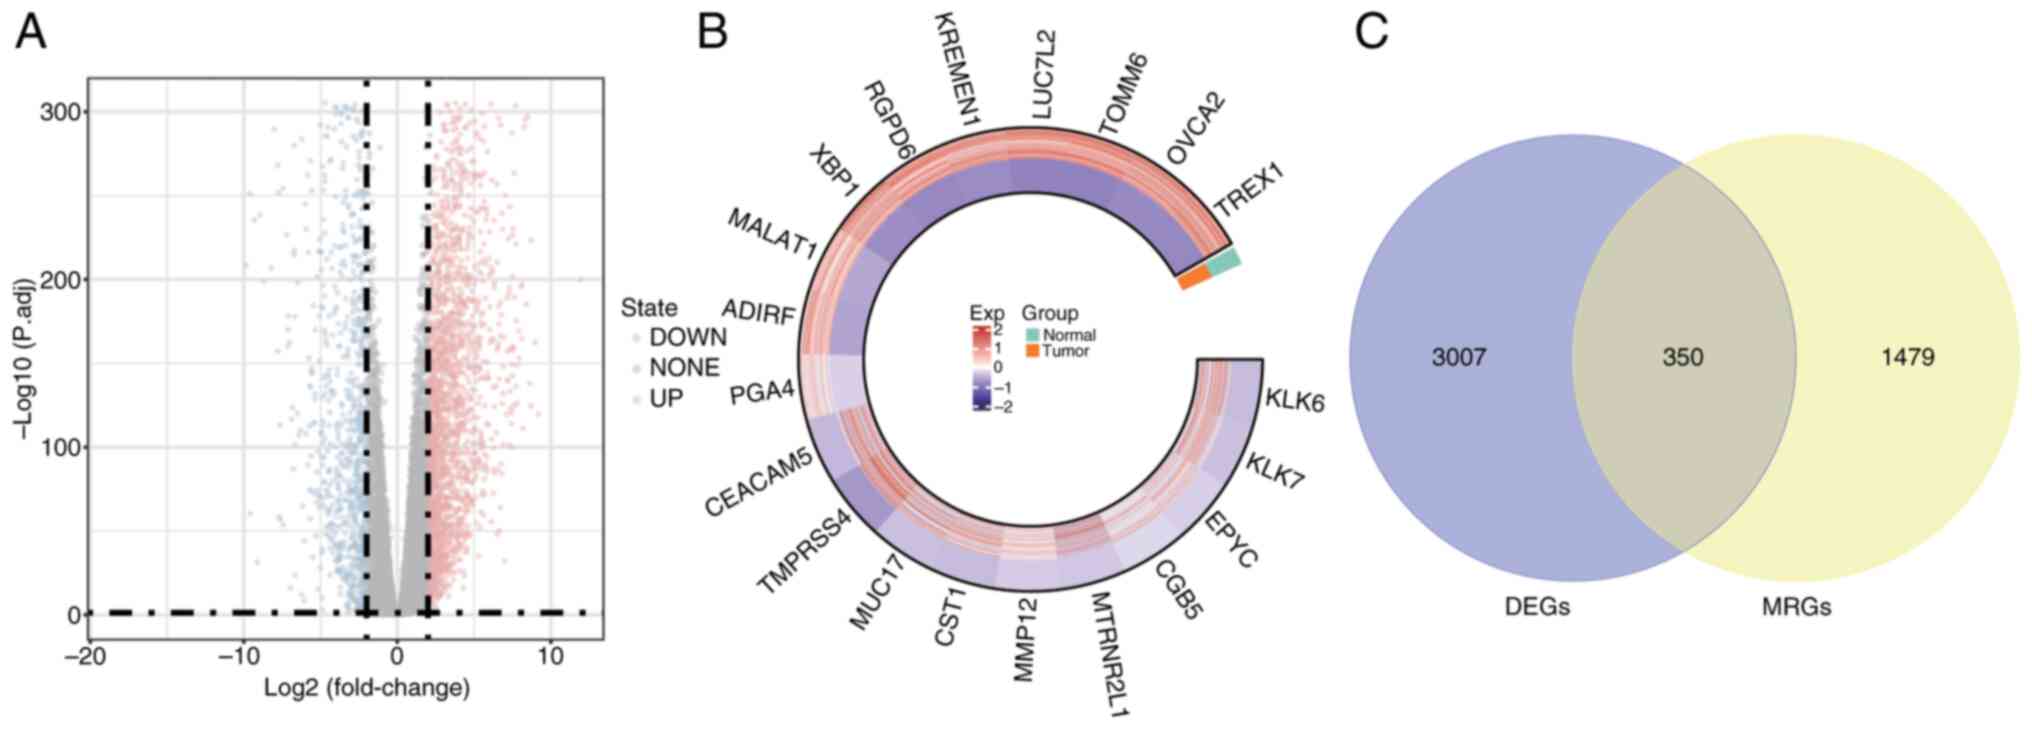
The DESeq2 package was utilized for the differential
expression analysis of PDAC tumor samples compared with normal
control tissues. The following criteria were used: |log2FC| >1.5
and adj.P<0.05. Table SIII
presents the 3,357 DEGs identified in PDAC samples relative to
normal controls: 2,264 of these genes were upregulated and 1,093
were downregulated. To visualize the distribution of these DEGs, a
volcano plot was generated using the ‘ggplot2’ R package,
highlighting the top 10 genes that were upregulated and
downregulated (Fig. 2A).
Additionally, the expression of 20 DEGs was visualized in a circos
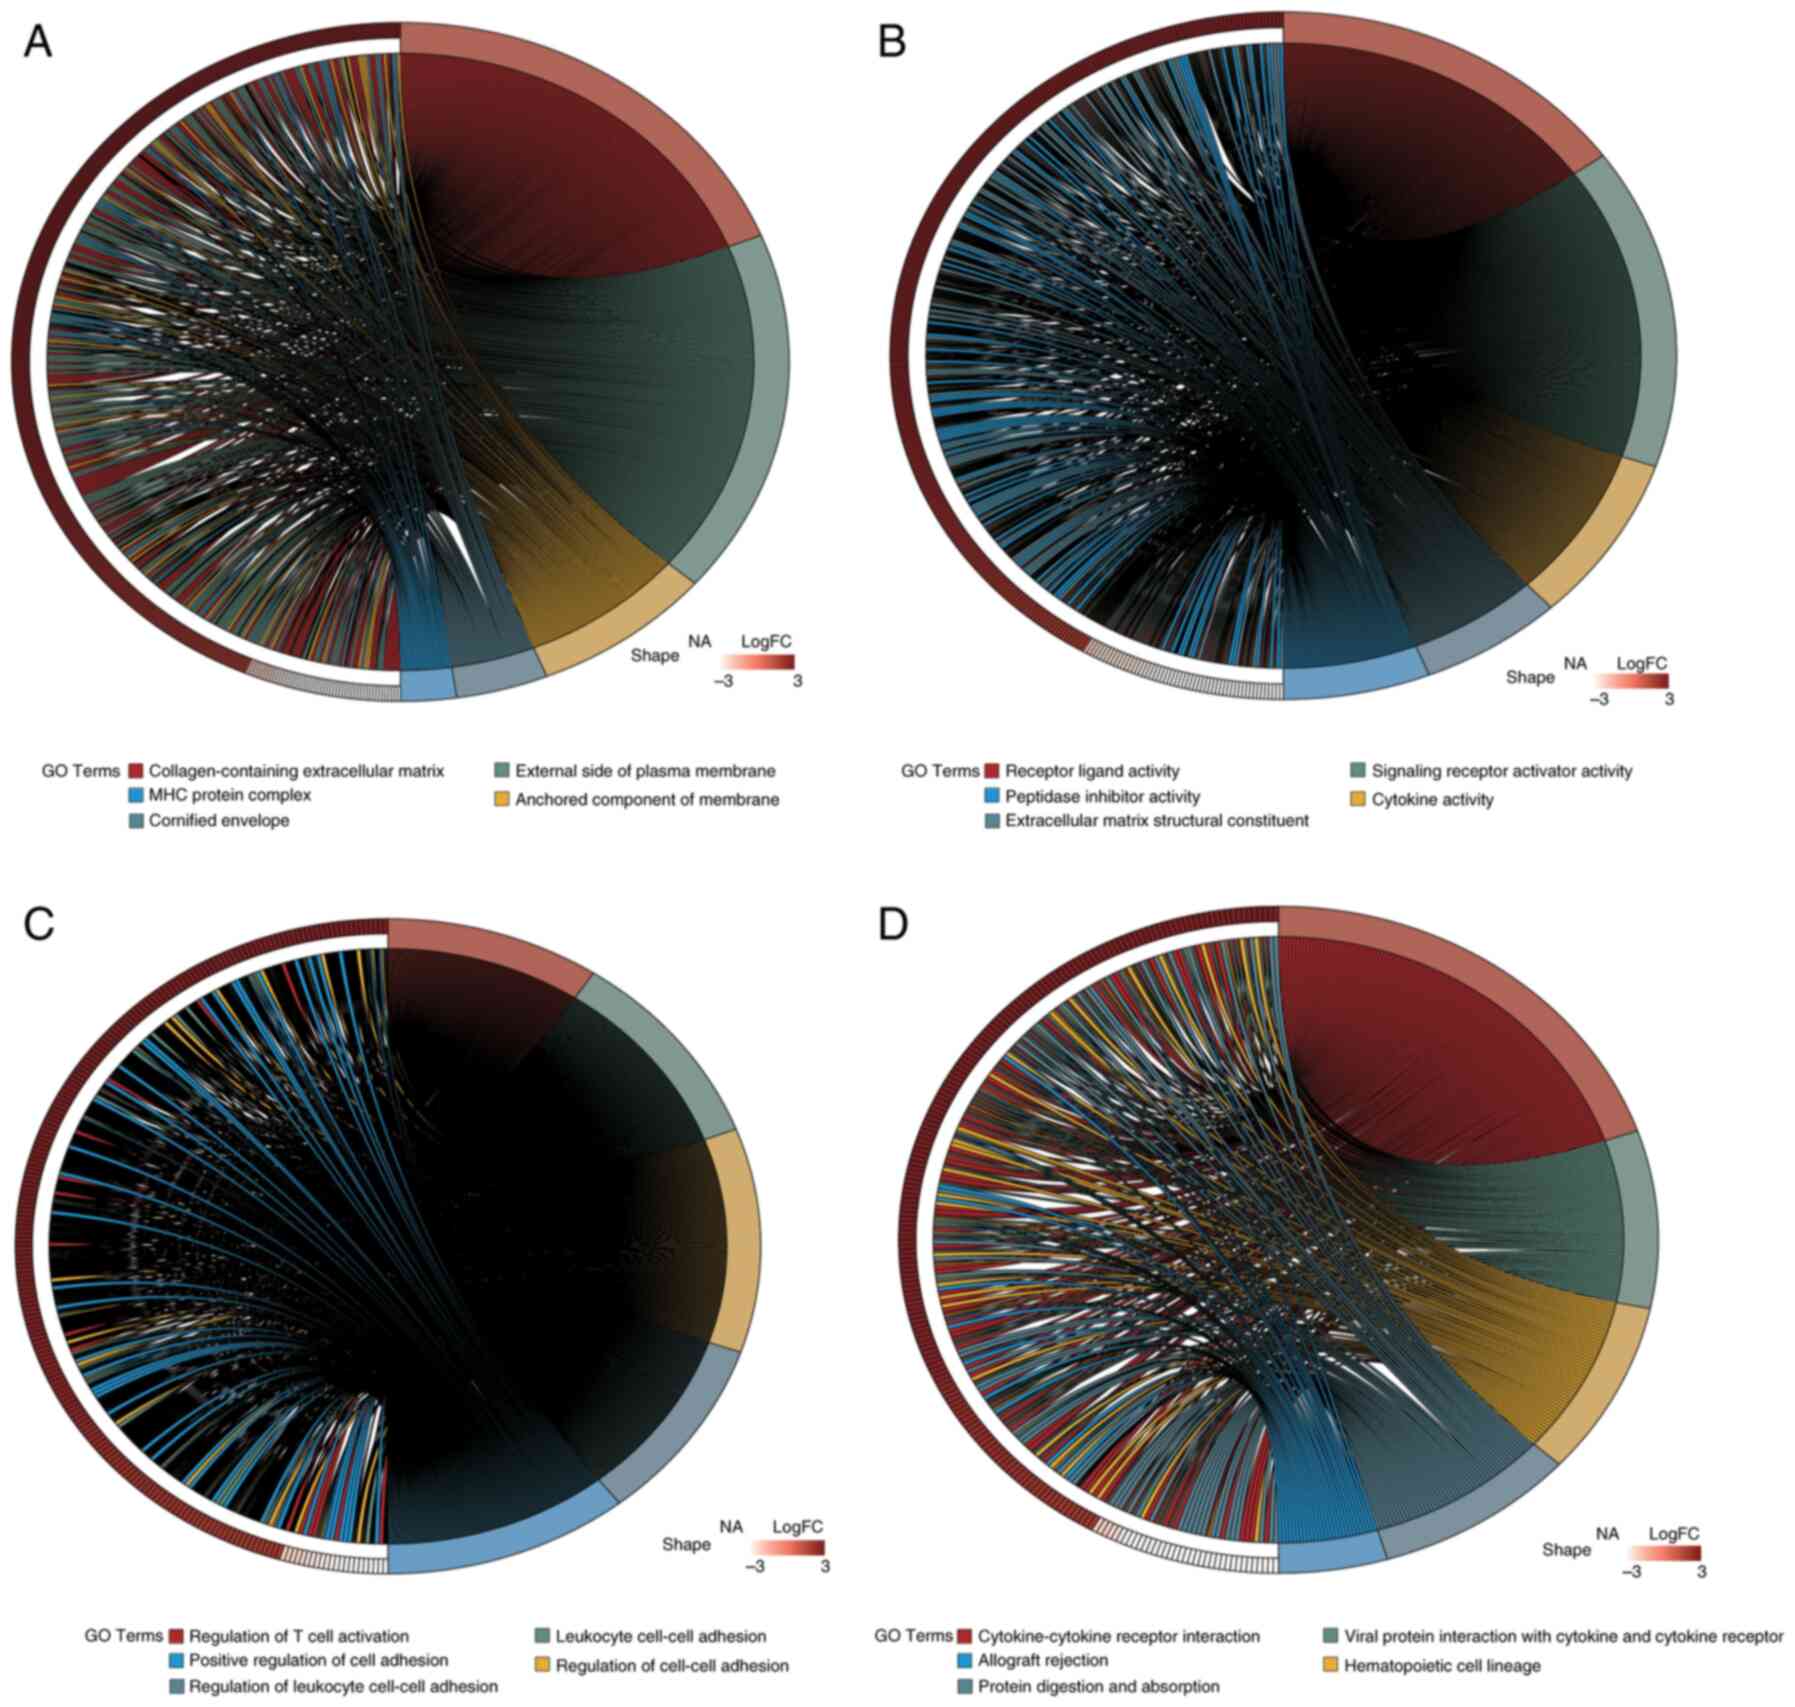
plot generated using the ‘circlize’ R package (Fig. 2B). GO analysis (Fig. 3A-C) and KEGG pathway enrichment
analysis (Fig. 3D) were performed
using the clusterProfiler package. The DEGs were categorized into
Biological Process (BP), Cellular Component (CC) and Molecular
Function (MF) groups. Utilizing the ‘GOplot’ R package, the top
five enriched pathways were represented. BP pathways encompassed
the regulation of T cell activation, leukocyte cell-cell adhesion
and positive regulation of cell adhesion; MF pathways included
receptor-ligand activity and cytokine activity; and CC pathways
were associated with collagen-containing extracellular matrix and
major histocompatibility complex protein complexes. Significantly
enriched KEGG pathways (adj.P<0.05) included interactions
between cytokines and their receptors, the lineage of hematopoietic
cells and the digestion and absorption of proteins were all KEGG
pathways.
Functional enrichment analysis
To assess the relevance of 1,829 MRGs, GO and KEGG
analyses were performed. The GO analysis (Table SIV) identified significant
enrichment in processes such as Mn ion binding, metal ion transport
and oxidation-reduction. Additionally, the KEGG analysis (Table SV) demonstrated significant
associations with pathways related to metal ion metabolism,
underscoring the functional categorization of the gene set in the
present study in relation to Mn metabolism.
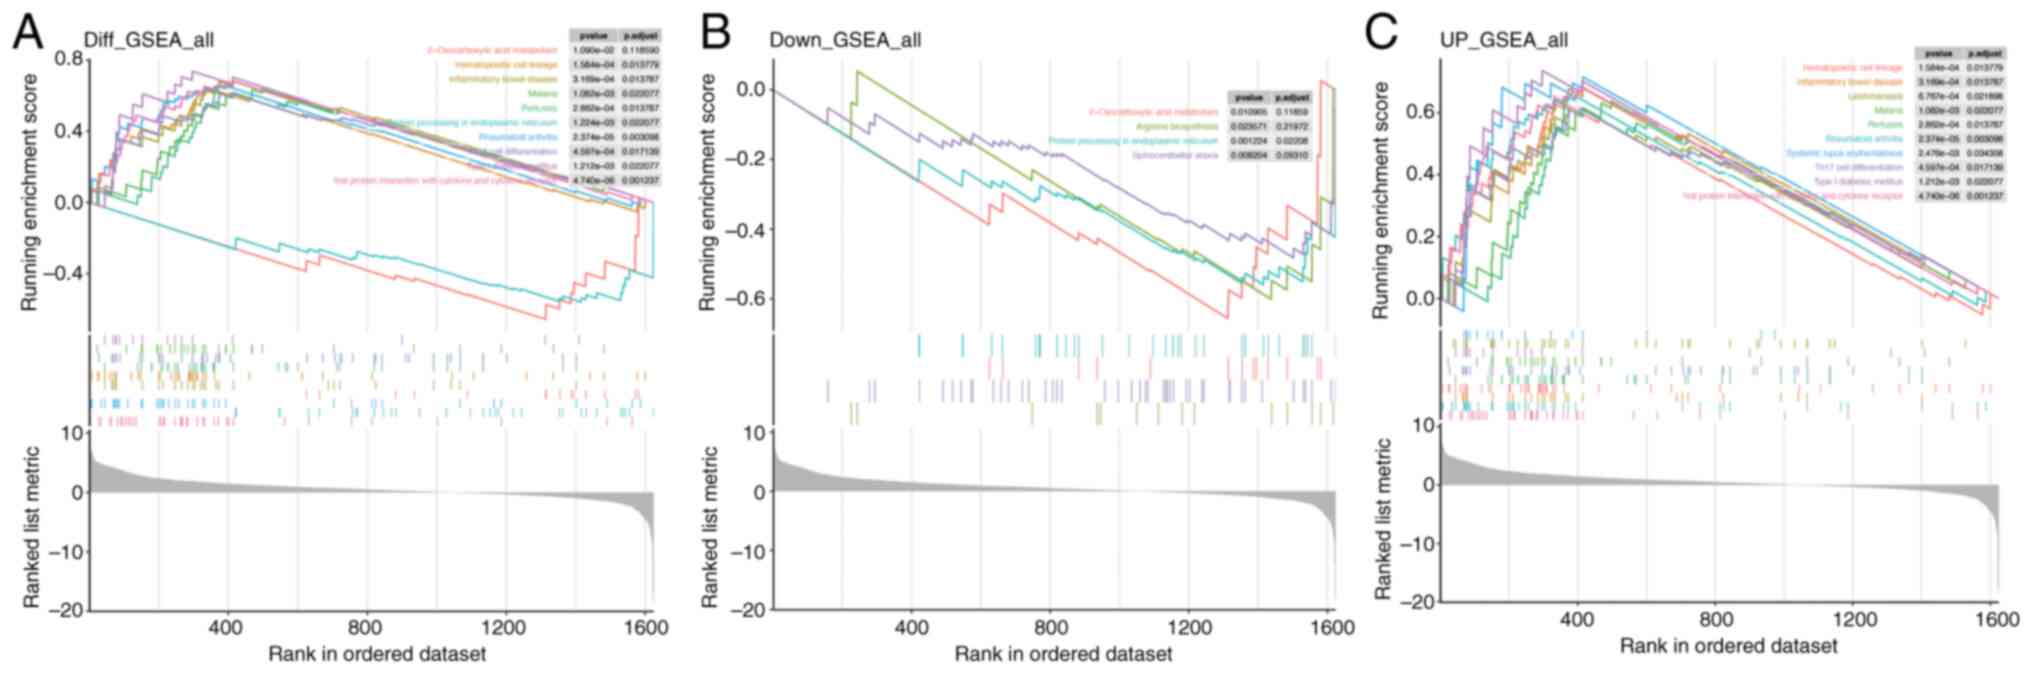
GSEA for Mn metabolism pathways in
PDAC
In the overall GSEA results for Mn metabolism
pathways in PDAC (Fig. 4A),
pathways such as ‘2-Oxocarboxylic acid metabolism’ and
‘Hematopoietic cell lineage’ were significantly enriched. For the
downregulated genes (Fig. 4B),
enrichment was noted in ‘2-Oxocarboxylic acid metabolism’,
‘Arginine biosynthesis’, ‘Protein processing in endoplasmic
reticulum’ and ‘Spinocerebellar ataxia.’ Conversely, the
upregulated gene set (Fig. 4C)
showed enrichment in ‘Hematopoietic cell lineage’. These results
indicate that Mn metabolism-related genes in PDAC are implicated in
a wide range of BPs, spanning metabolic and immune/inflammatory
pathways.
Identification and enrichment analysis
of candidate genes
To identify potential candidate genes, the
‘VennDiagram’ package in R was utilized to intersect DEGs with
MRGs, resulting in a Venn diagram. A total of 350 genes (accounting
for 7.24% of the total) were identified and selected for further
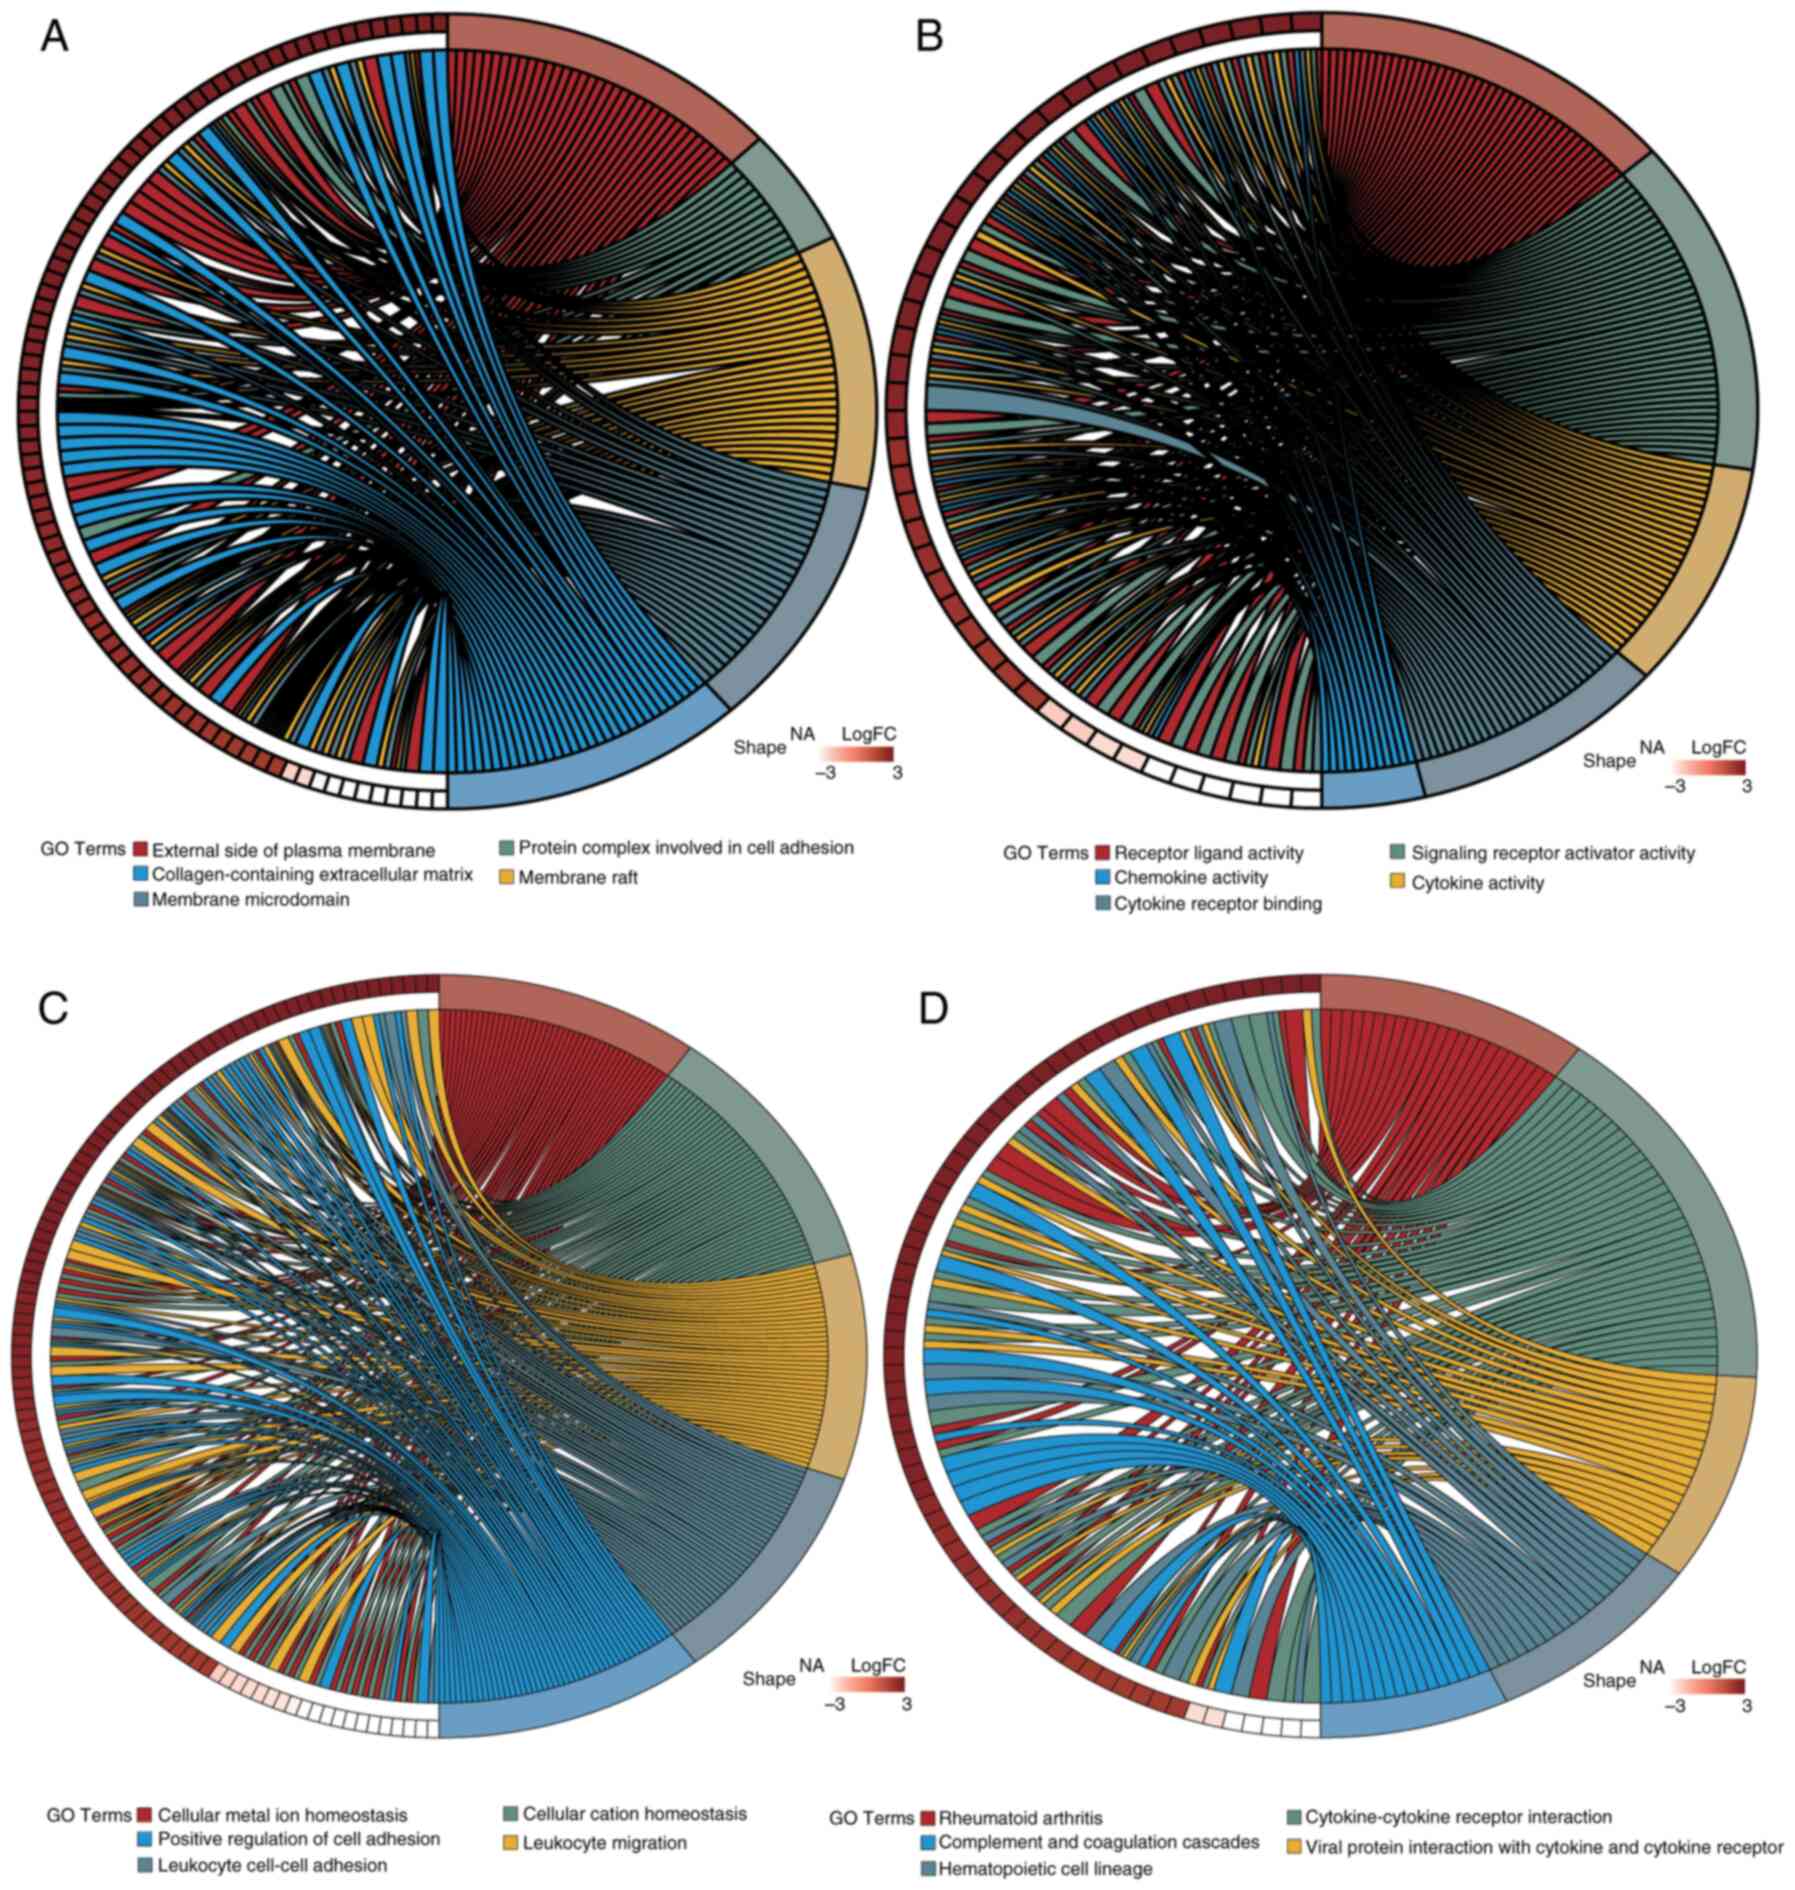
examination (Fig. 2C). Furthermore,
to evaluate the functional roles of these candidate genes and their
involvement in several biological processes, enrichment analyses
for GO and KEGG were performed using the ‘clusterProfiler’ R
package. A total of 1,721 GO terms and 80 KEGG pathways met the
significance threshold of adj.P<0.05. Of these, 1,529 related to
BP, 61 to CC and 131 to MF. The most enriched GO and KEGG pathways
were visualized using the ‘GOplot’ R package (Fig. 5). Enriched BP terms included
‘cellular metal ion homeostasis’, ‘leukocyte migration’ and
‘positive regulation of cell adhesion’. MF terms included
‘receptor-ligand activity’, ‘cytokine activity’ and ‘chemokine
activity’. CC terms included ‘protein complexes in cell adhesion’
and ‘collagen-containing extracellular matrix’. Key KEGG pathways
included ‘Rheumatoid arthritis’, ‘Cytokine-cytokine receptor
interaction’ and ‘Complement and coagulation cascades’.
Development of a prognostic gene model
in TCGA cohort
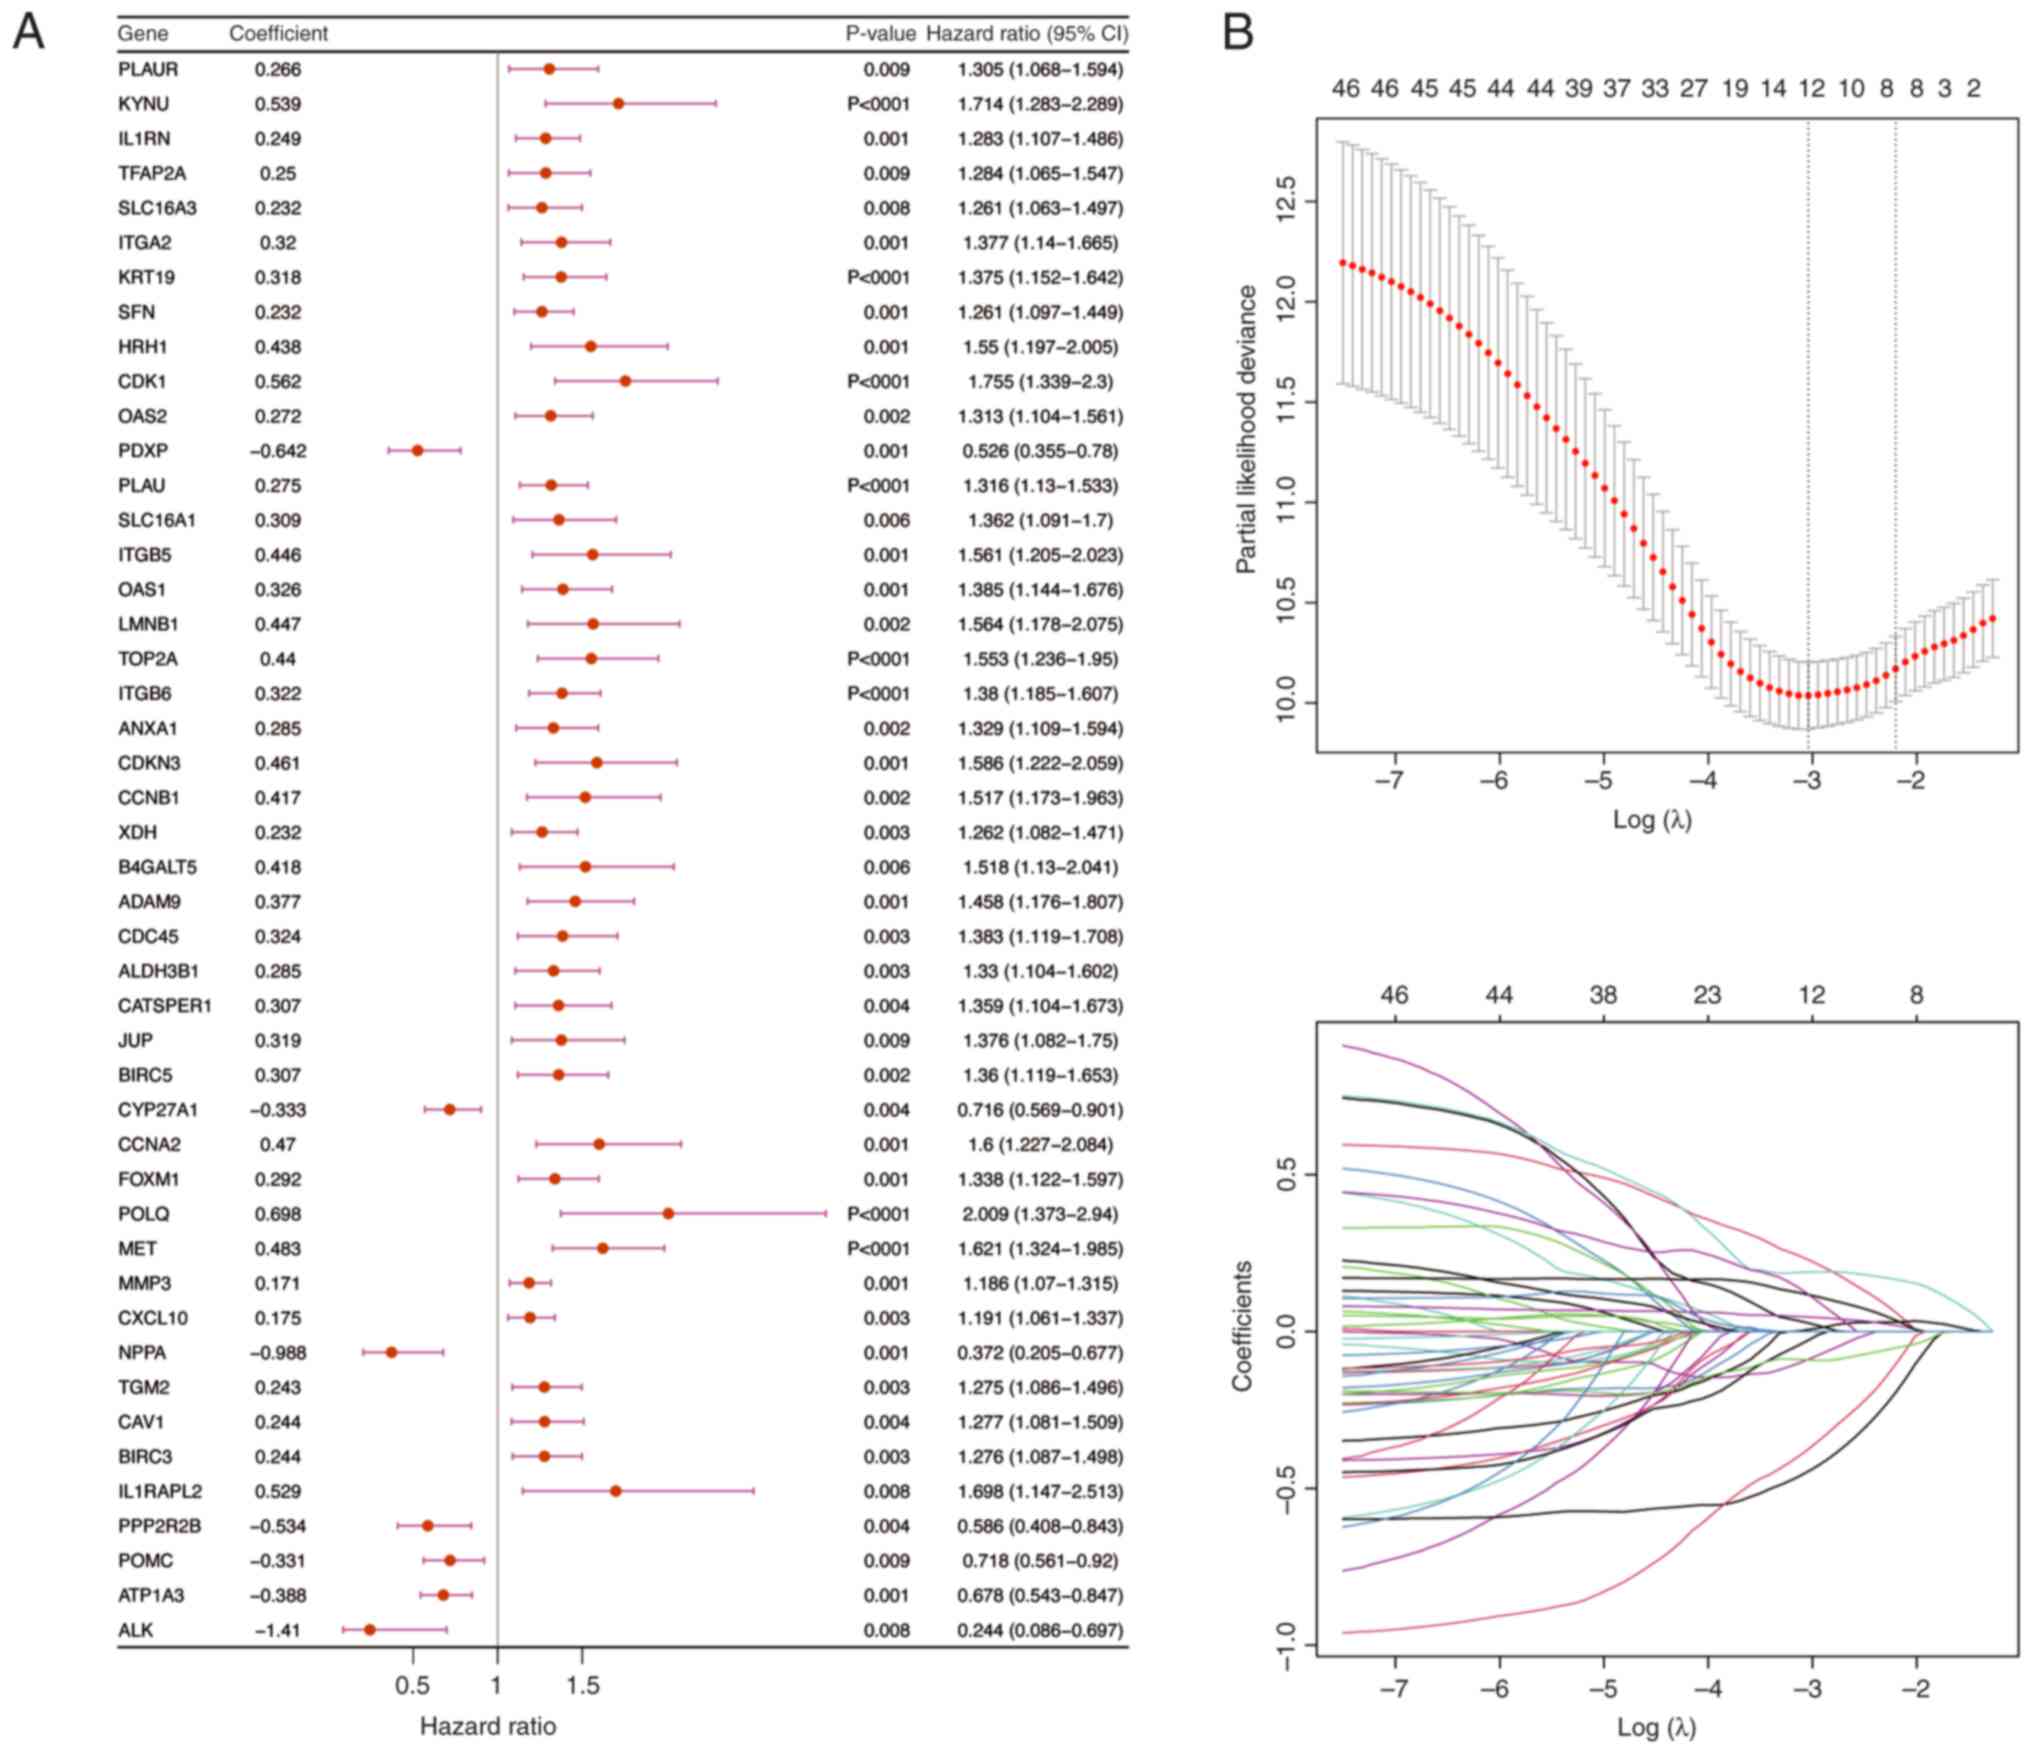
Univariate Cox regression analysis was performed
using PDAC samples that included full survival data from the
training cohort (Fig. 5A). The
results identified 46 genes that were associated with survival.
Subsequently, the PH assumption test was used to assess these genes
(P>0.05) and then a 10-fold cross-validation procedure was used
to select genes for LASSO regression analysis if P<0.01 in the
univariate Cox analysis. The final set of 12 prognostic genes was
identified (Fig. 6B) and then a
risk score was computed for every PDAC sample in the validation and
training cohorts using these genes.
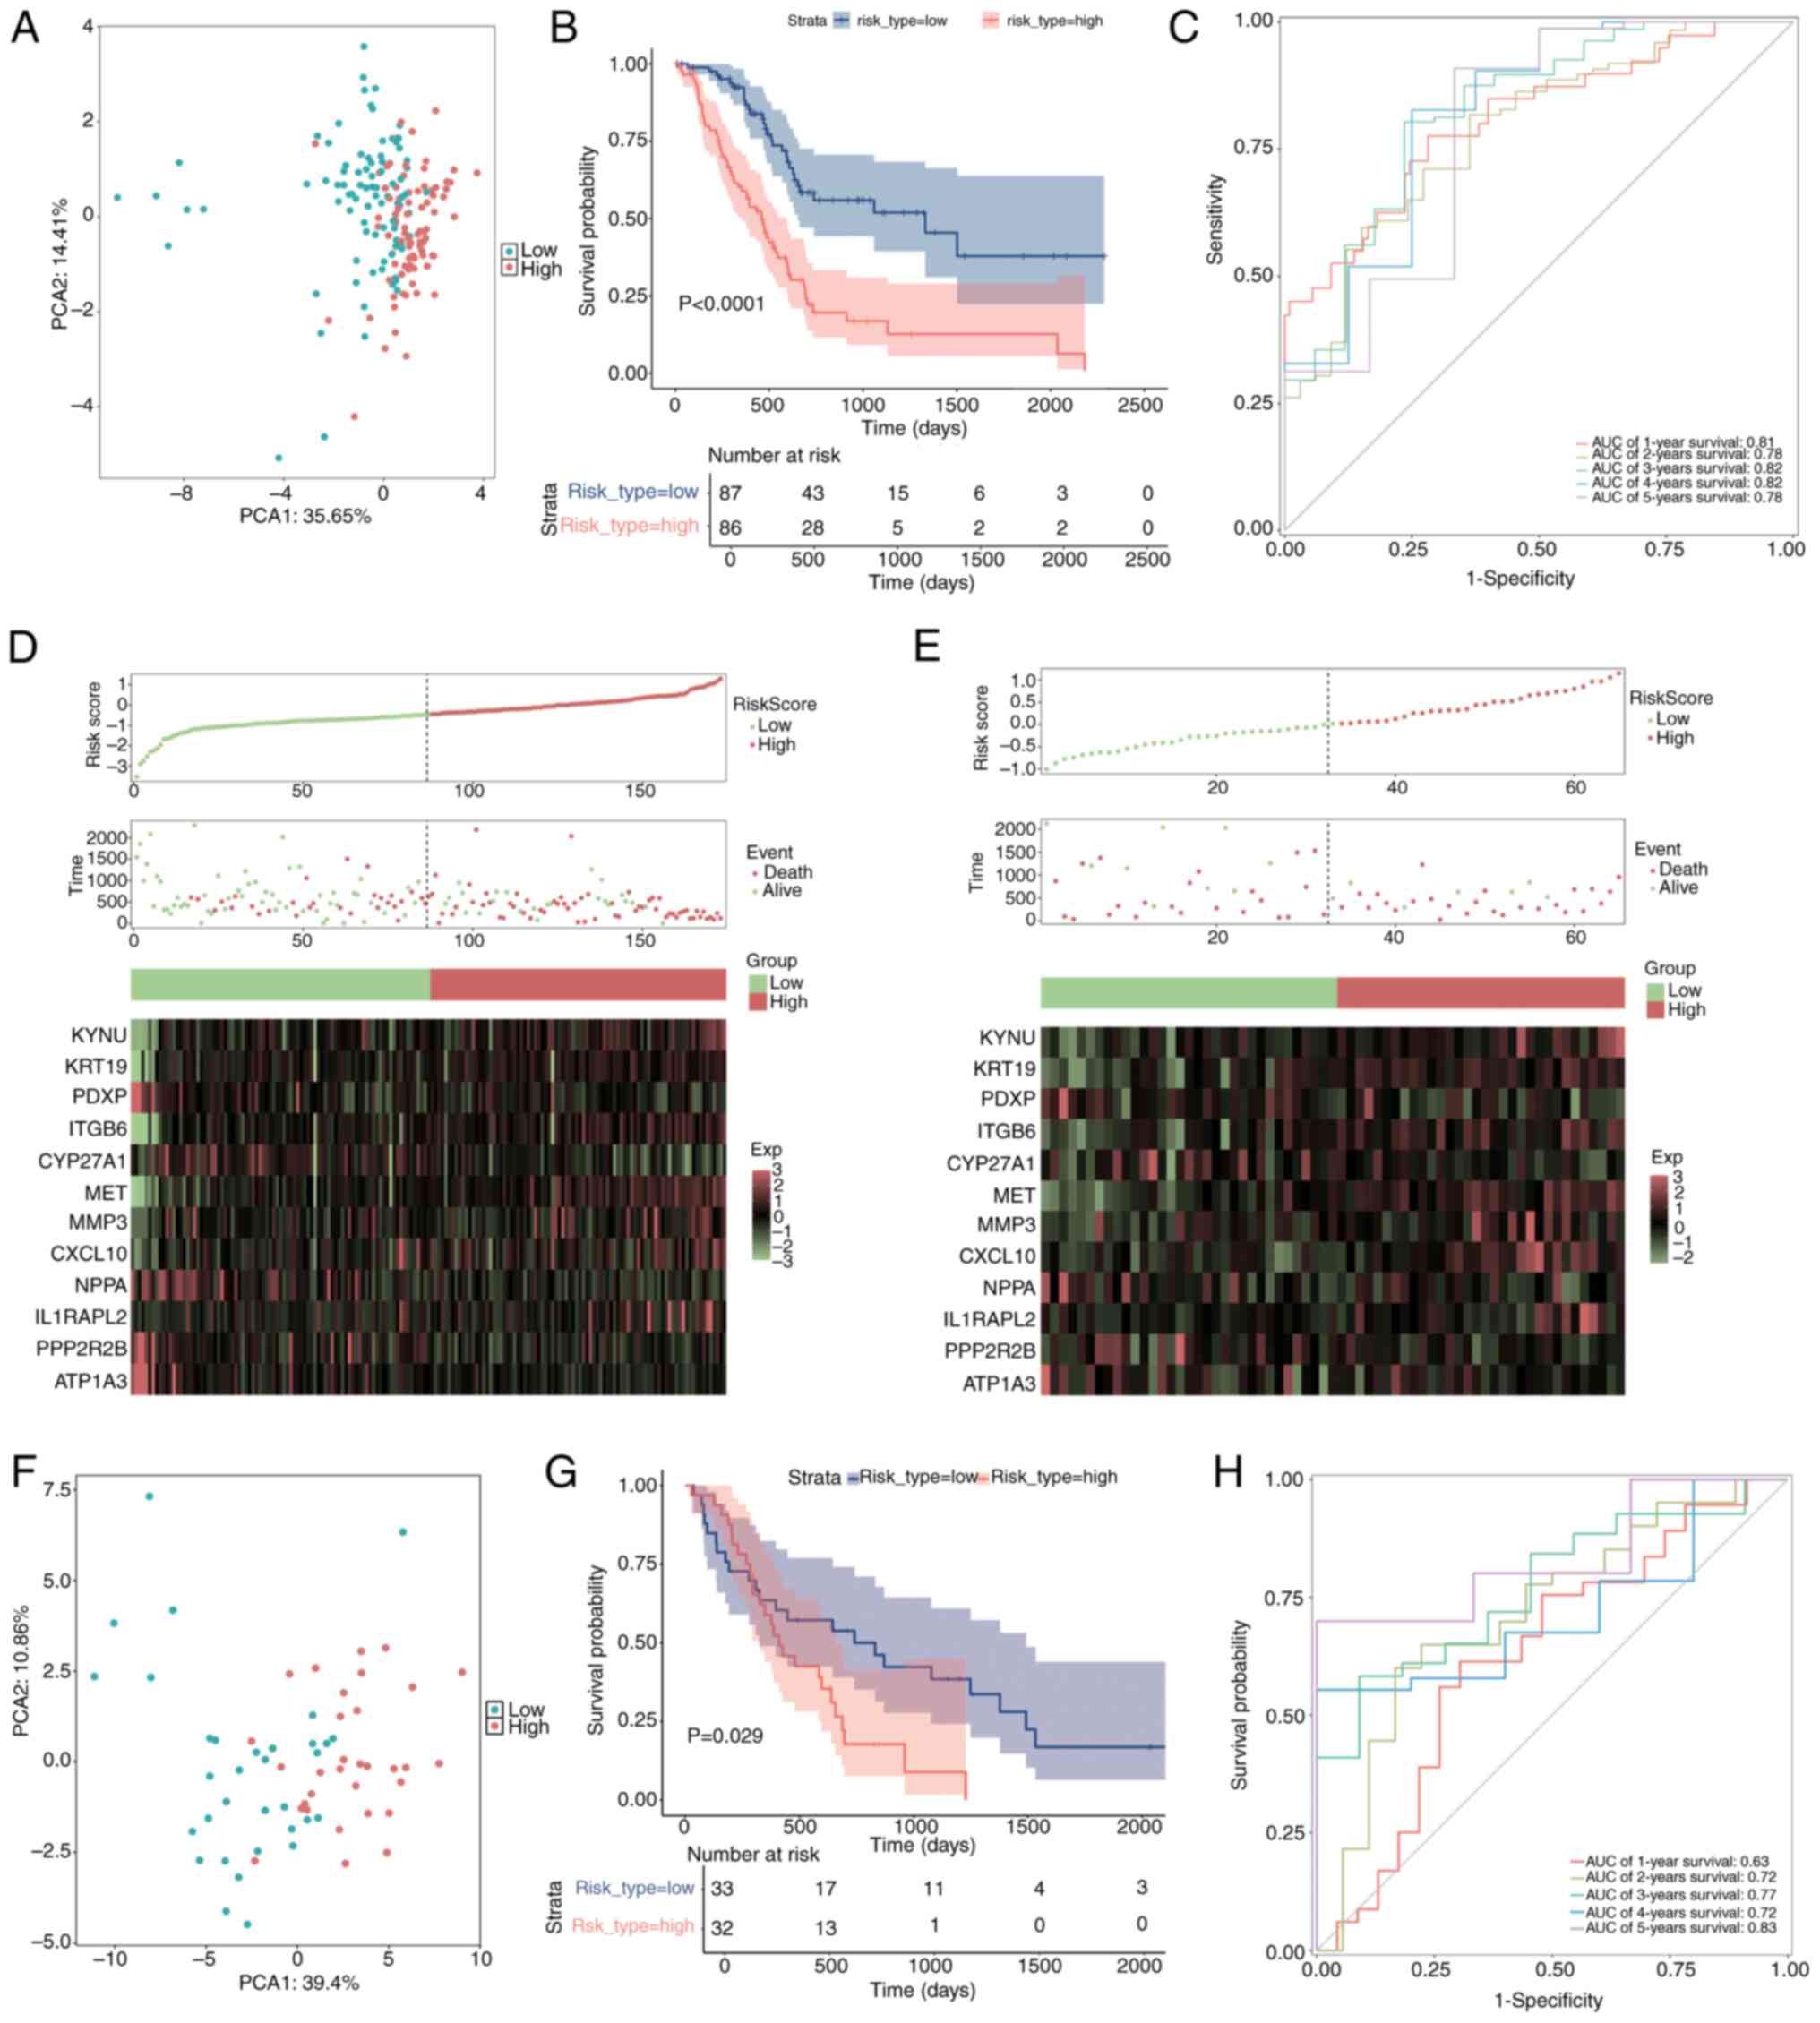
The samples were divided into two categories,
high-risk and low-risk, according to their median risk scores. To
compare the distribution of the high-risk and low-risk groups, PCA
was used (Fig. 7A). The survival
package was used to perform a Kaplan-Meier survival analysis, which
demonstrated that the high-risk group had significantly worse
survival outcomes compared with the low-risk group (Fig. 7B; P<0.05).
Using ggplot2-generated ROC curves, survival rates
were then assessed from 1–5 years. AUC was computed using the
timeROC package to evaluate the prediction ability of the model
(Fig. 7C). For every time point,
the AUC values were >0.7, demonstrating that the model was
relatively accurate. Moreover, to further elucidate the
distributions of survival in both risk groups, Survminer software
was used to construct survival curves and status plots.
Additionally, a heatmap illustrating the expression levels of the
prognostic genes in these groups was created using the ggheat
function from the tinyarray package (Fig. 7D).
External validation of the risk
signature
To assess the broader applicability of the risk
model, external validation was performed utilizing a merged dataset
from GSE62452 and GSE28735 (Fig.
7E-H). The aggregation of the testing cohort as determined by
PCA is illustrated in Fig. 7F.
Kaplan-Meier survival analysis was performed utilizing the survival
package, alongside log-rank tests, to assess and compare the
survival outcomes of the high- and low-risk groups (Fig. 7G; P<0.05). The findings indicated
a notable disparity, as the high-risk cohort exhibited a less
favorable outcome compared with the low-risk cohort. To evaluate
the precision of the predictions of the model within the validation
cohort, a ROC curve analysis was performed (Fig. 7H). The AUC values across all time
points were >0.6, suggesting a satisfactory level of predictive
accuracy for the model. Additionally, survival status plots and
risk curves were created to illustrate the survival distributions
within the two risk categories in the validation cohort. A heatmap
was generated to illustrate the expression patterns of prognostic
genes concerning the two risk groups (Fig. 7E).
Independent prognostic significance of
the risk model
To assess the association between
clinicopathological factors and the prognostic risk model, both
univariate and multivariate Cox regression analyses were performed
on PDAC samples that had comprehensive survival data. Clinical
variables including age, sex and the pathological stages M, N and
T, as well as tumor stage, were methodically integrated into the
analysis utilizing the survival package. Variables that
demonstrated significance in the univariate analysis (P<0.05)
underwent additional scrutiny using the PH assumption test
(P>0.05) prior to their incorporation into the multivariate
model. The evaluation revealed that an age of >65 years, T stage
and risk score served as independent prognostic indicators for PDAC
(Fig. 8A and B). Subsequently, a
nomogram was developed utilizing these independent prognostic
factors to estimate the survival probabilities at 1, 3 and 5 years
for patients with PDAC, employing the rms package (Fig. 8C). The performance of the nomogram
was evaluated using ROC curves for survival predictions at 1-, 3-
and 5-year intervals, comparing the accuracy of the model with
other independent prognostic factors using the riskRegression
package (Fig. 8D). The AUC was
calculated to determine the sensitivity and specificity of the
model in predicting survival outcomes. AUC values of ~1 indicate
excellent predictive accuracy, whilst values of >0.6 denote
robust model performance. Moreover, calibration curves for 1–5 year
survival were constructed to evaluate the predictive accuracy of
the nomogram by juxtaposing the predicted values with the ideal
theoretical curve (Fig. 8E). A
slope of ~1 signifies an ideal performance of the model.
Furthermore, a DCA was performed utilizing the rmda package
(Fig. 8F) to assess the clinical
utility of the nomogram, quantifying the net benefit in comparison
with other independent prognostic factors. A net benefit of >0
indicates the considerable importance of the model in the realm of
clinical decision-making.
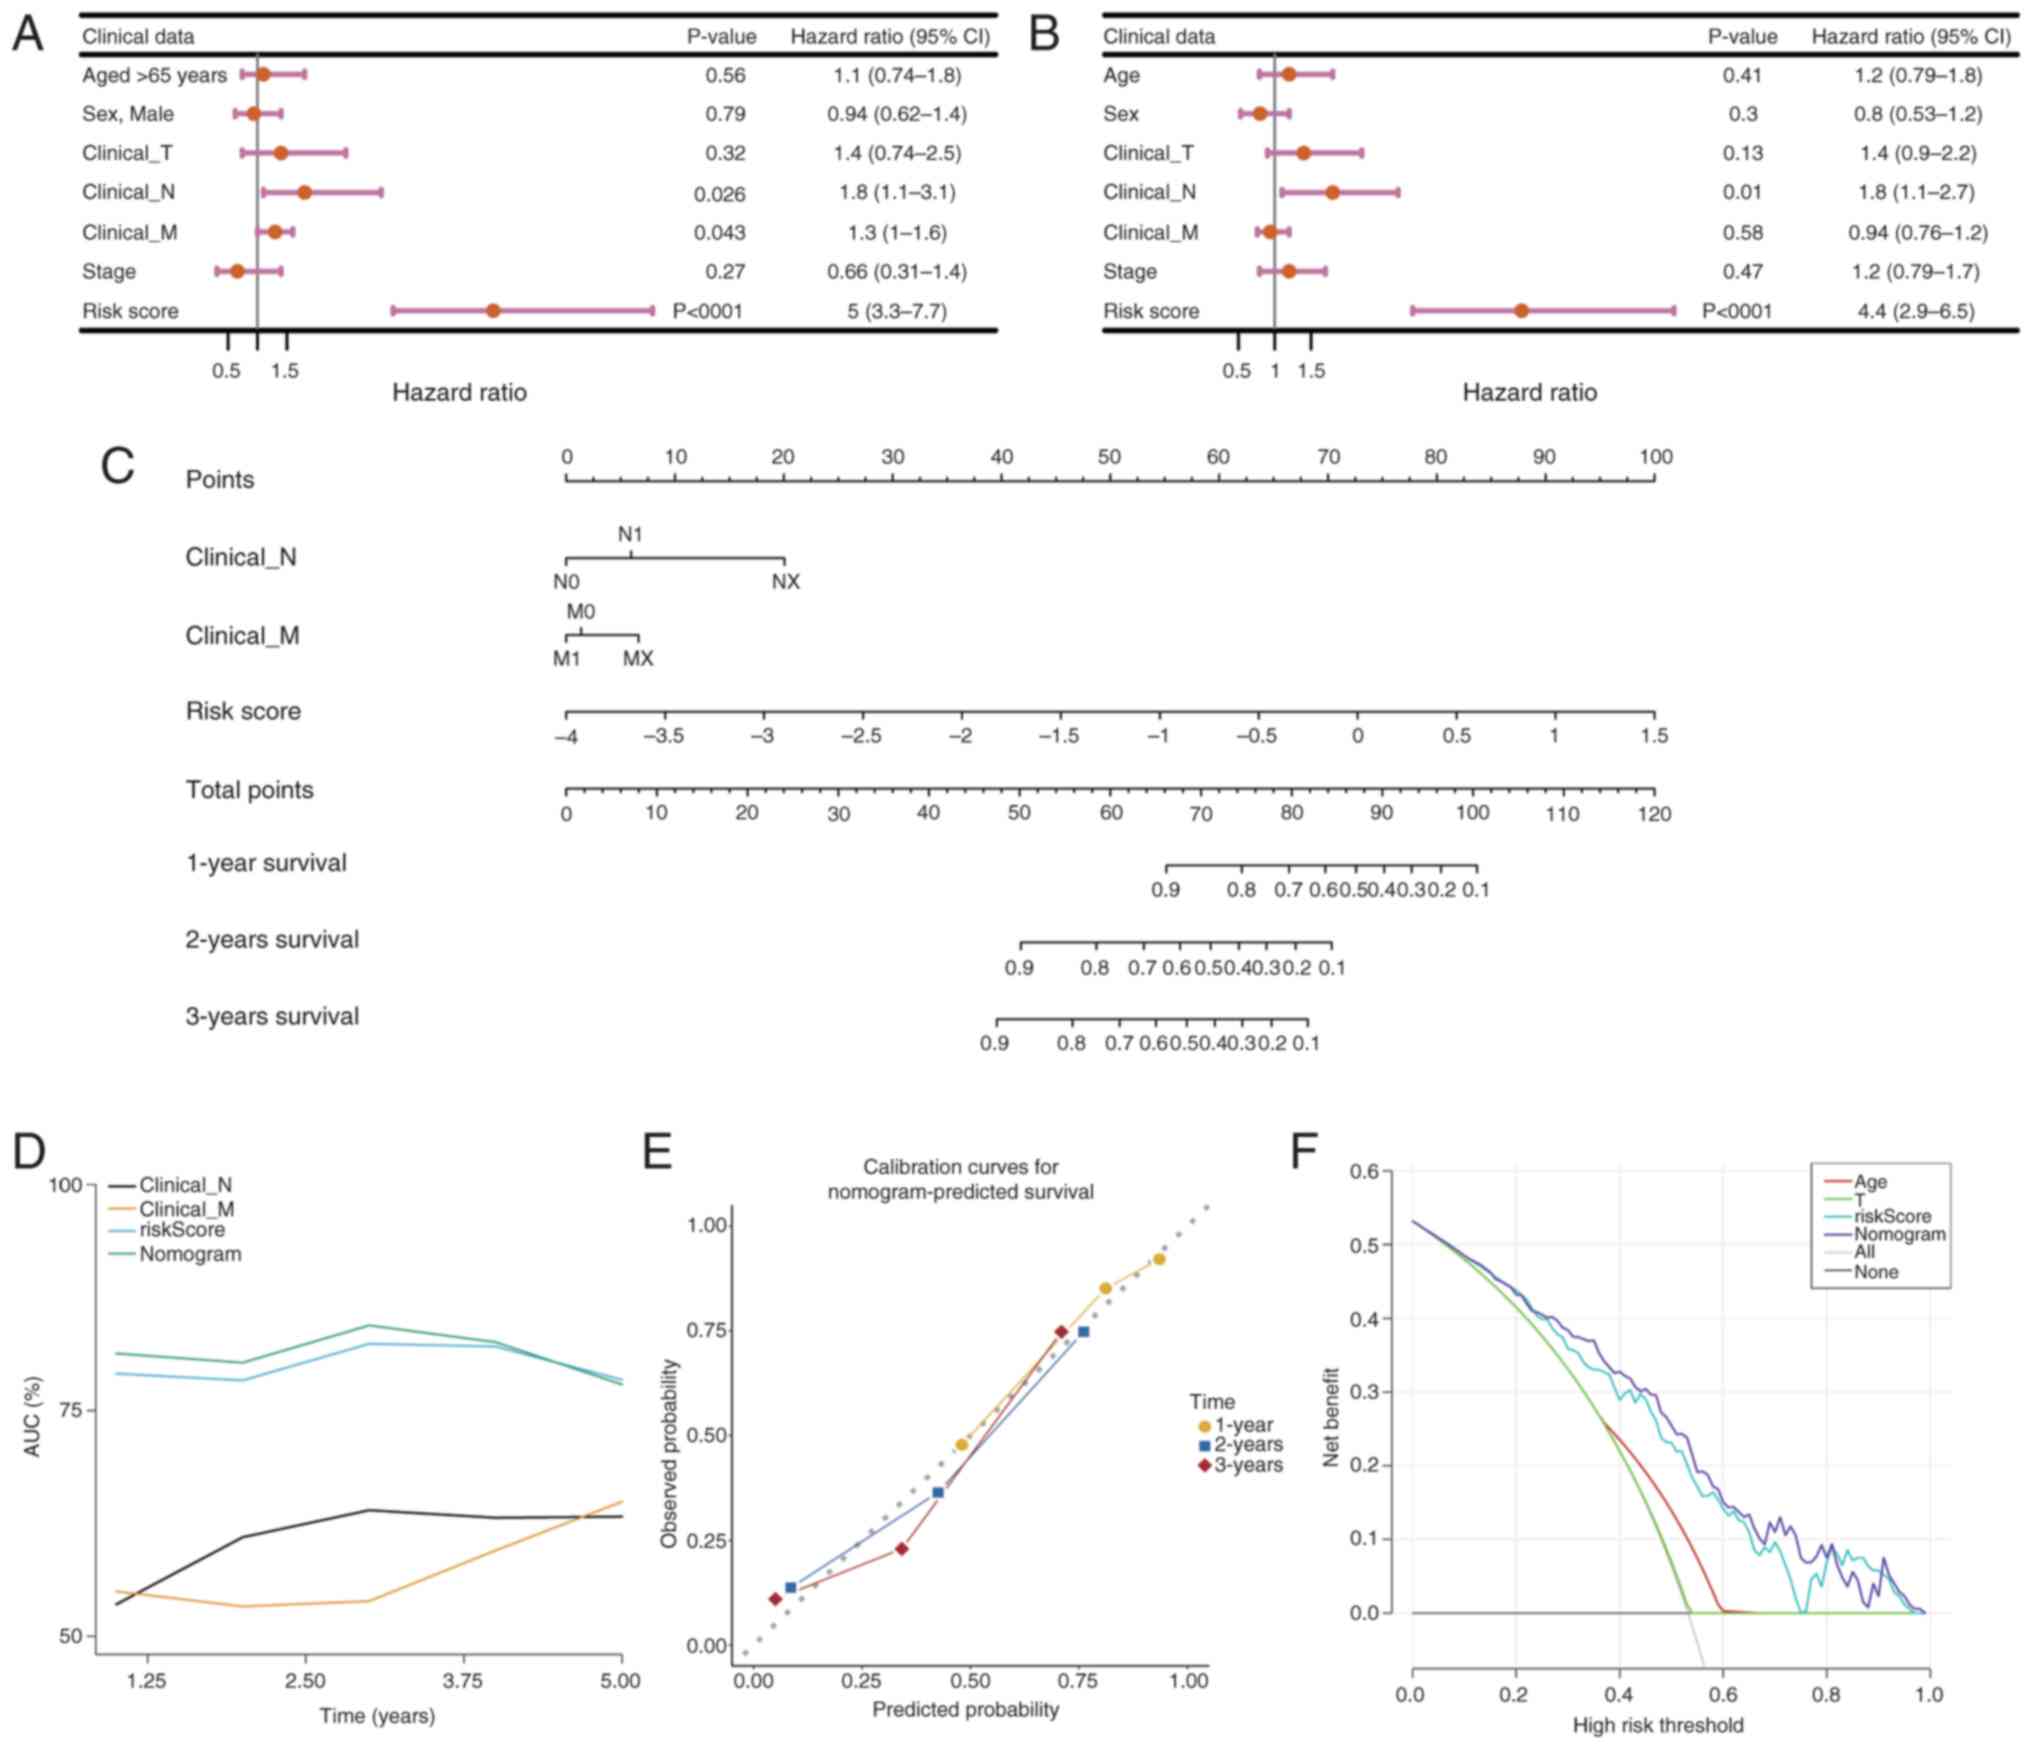 | Figure 8.Development and evaluation of the
nomogram model. (A) Univariate and (B) multivariate Cox regression
analysis. The hazard ratio reflects the relative risk for a
one-unit change in a variable. A hazard ration of =1 indicates no
effect on survival time, >1 indicates an increased risk (adverse
factor) and <1 indicates a decreased risk (protective factor).
(C) Construction of the nomogram. Total Points represents the sum
of all factors, which can be used to estimate the 1-, 3- and 5-year
survival rates. Points represent the score corresponding to each
factor. (D) Receiver Operating Characteristic curve analysis of the
nomogram model. (E) Calibration curve analysis of the nomogram
model. The closer the slope of the curve is to the ideal gray line,
the greater the predictive performance of the nomogram. (F)
Decision curve analysis of the nomogram model. Each curve
represents the performance of a prediction model, with the higher
the curve, the greater the net benefit. CI, confidence interval; T,
tumor; N, lymph node; M, metastasis. |
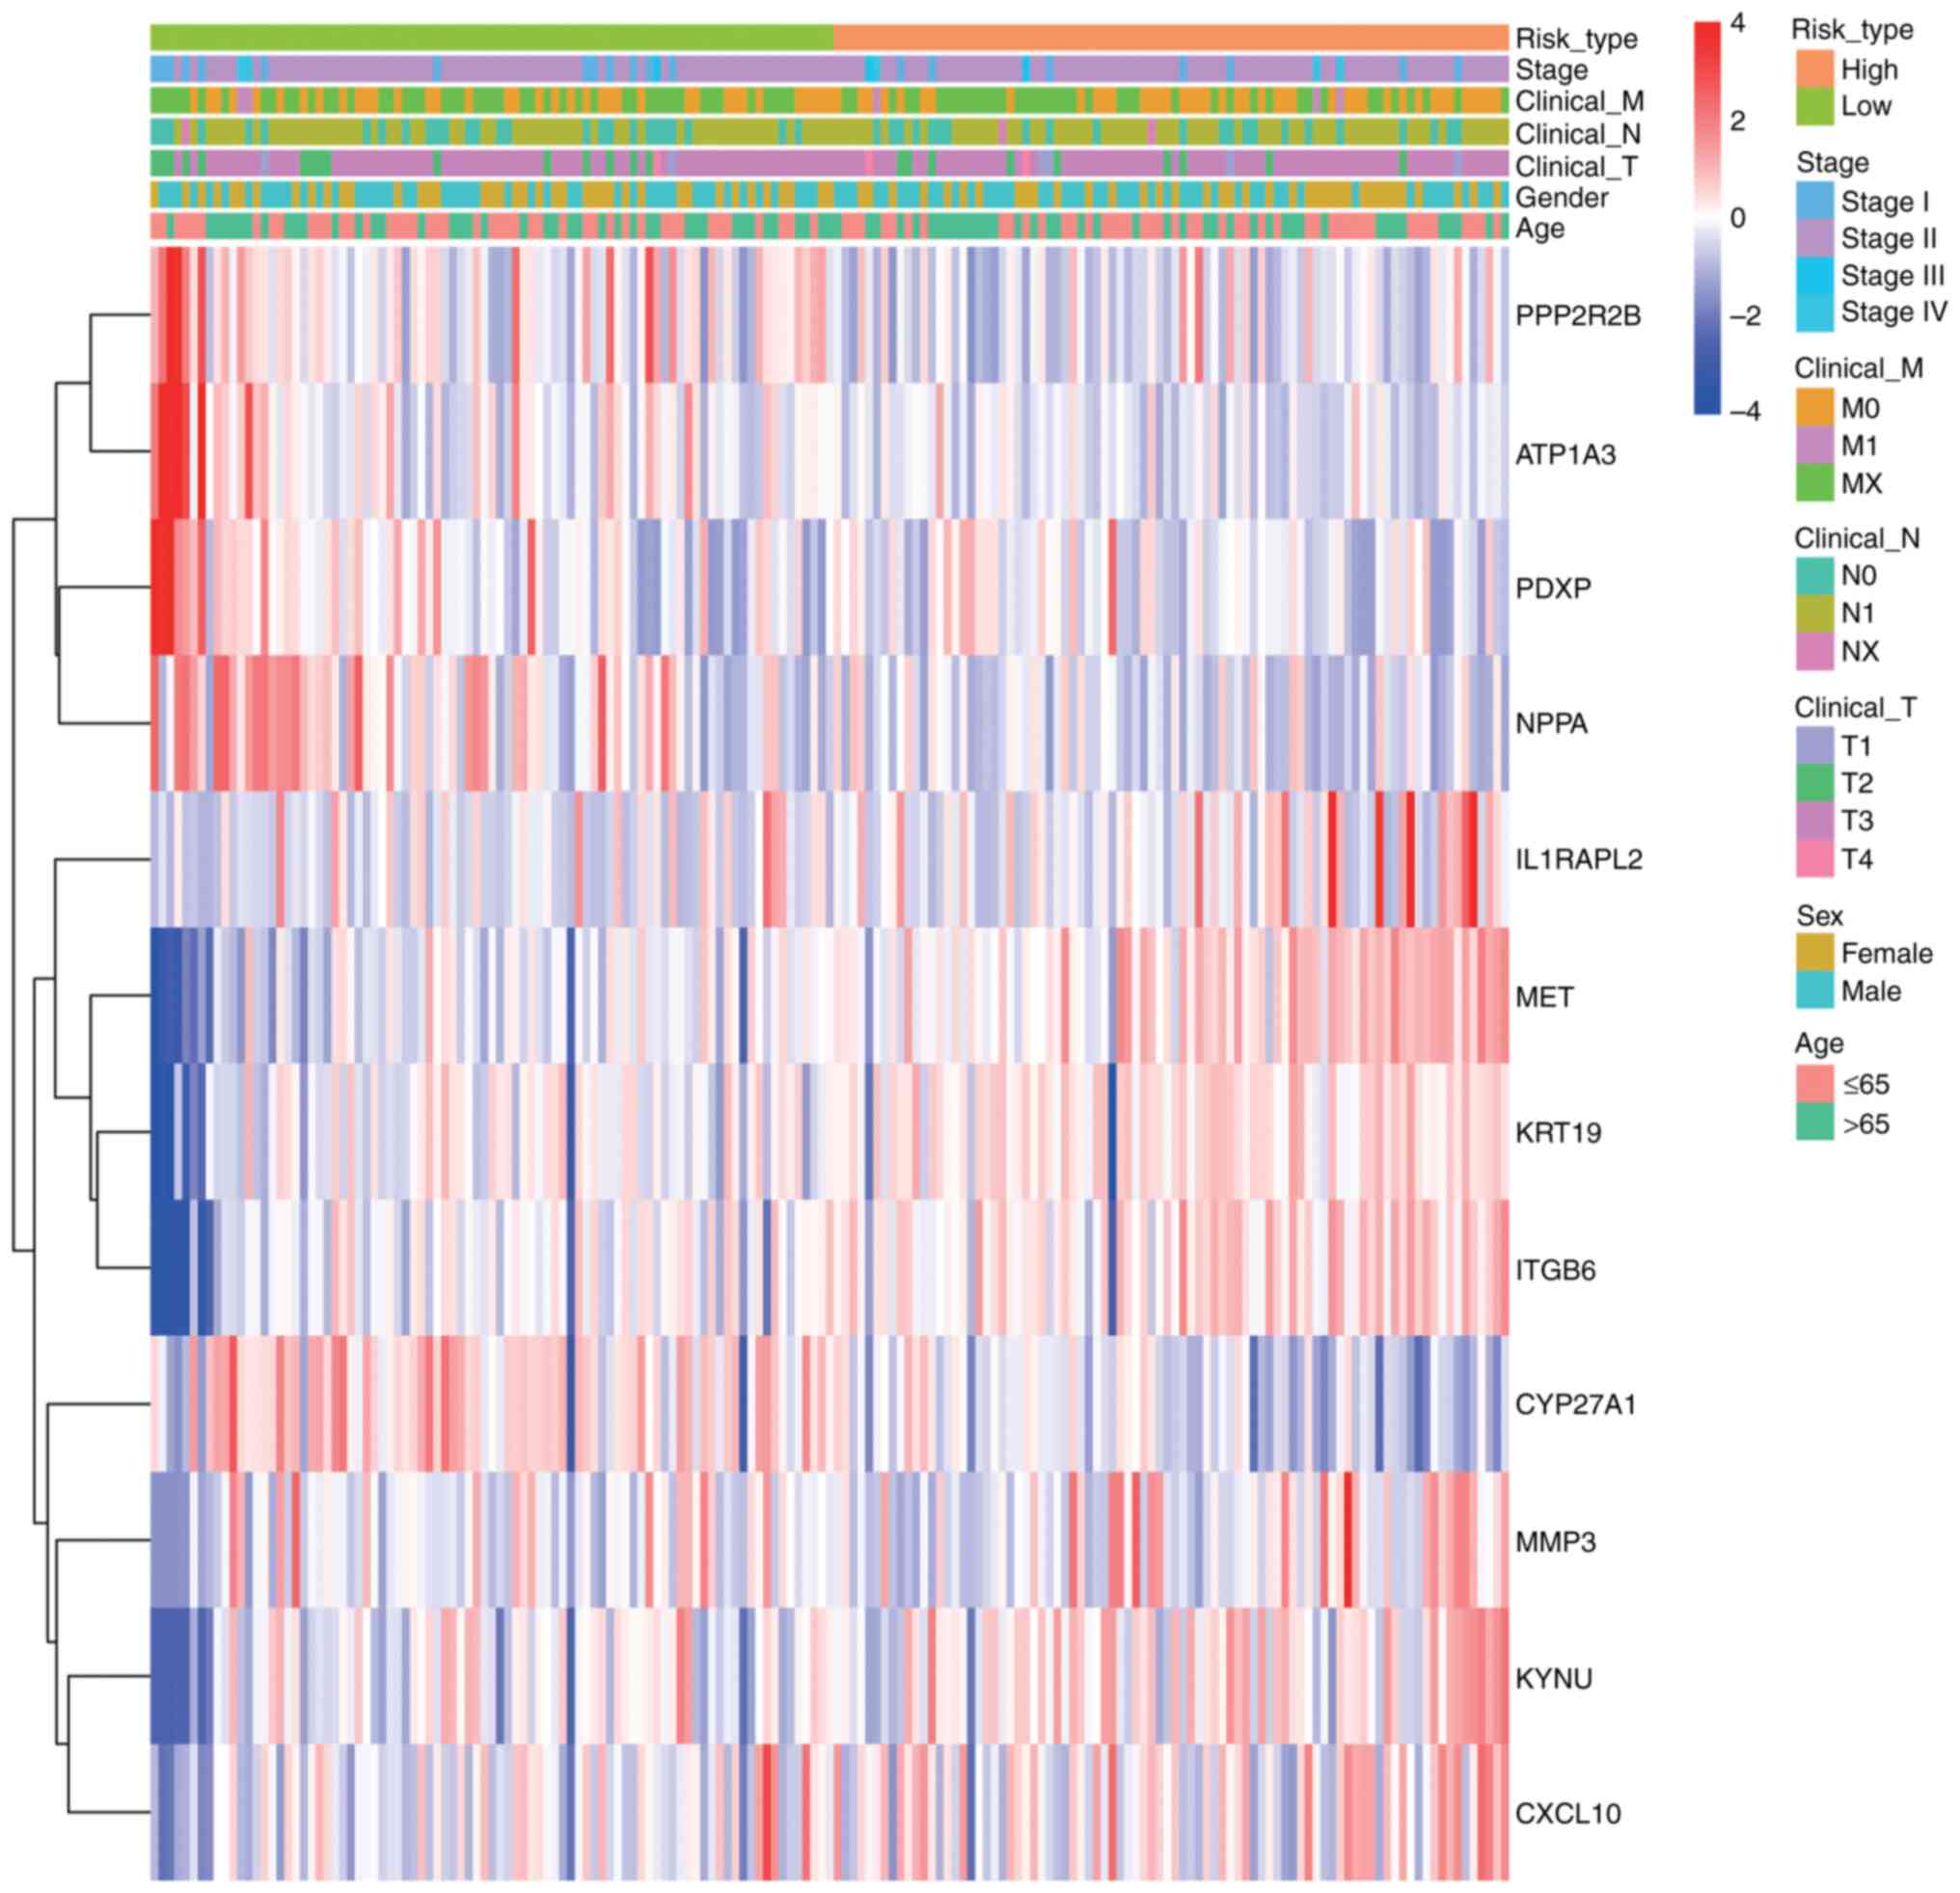
Clinical feature correlation
analysis
To evaluate the associations among risk scores,
prognostic genes and clinical characteristics in PDAC samples, a
heatmap was constructed utilizing the pheatmap package. This
illustrates the expression patterns of prognostic genes in
conjunction with clinical features and associated risk scores, with
the variations in clinical variables between the two groups
statistically evaluated (P<0.05; Fig. 9). The heatmap revealed distinct
clustering patterns between high- and low-risk groups. Key clinical
features, including advanced tumor stage (T3-T4), lymph node
metastasis (N1) and distant metastasis (M1), were significantly
enriched in the high-risk group (Wilcoxon test, P<0.05).
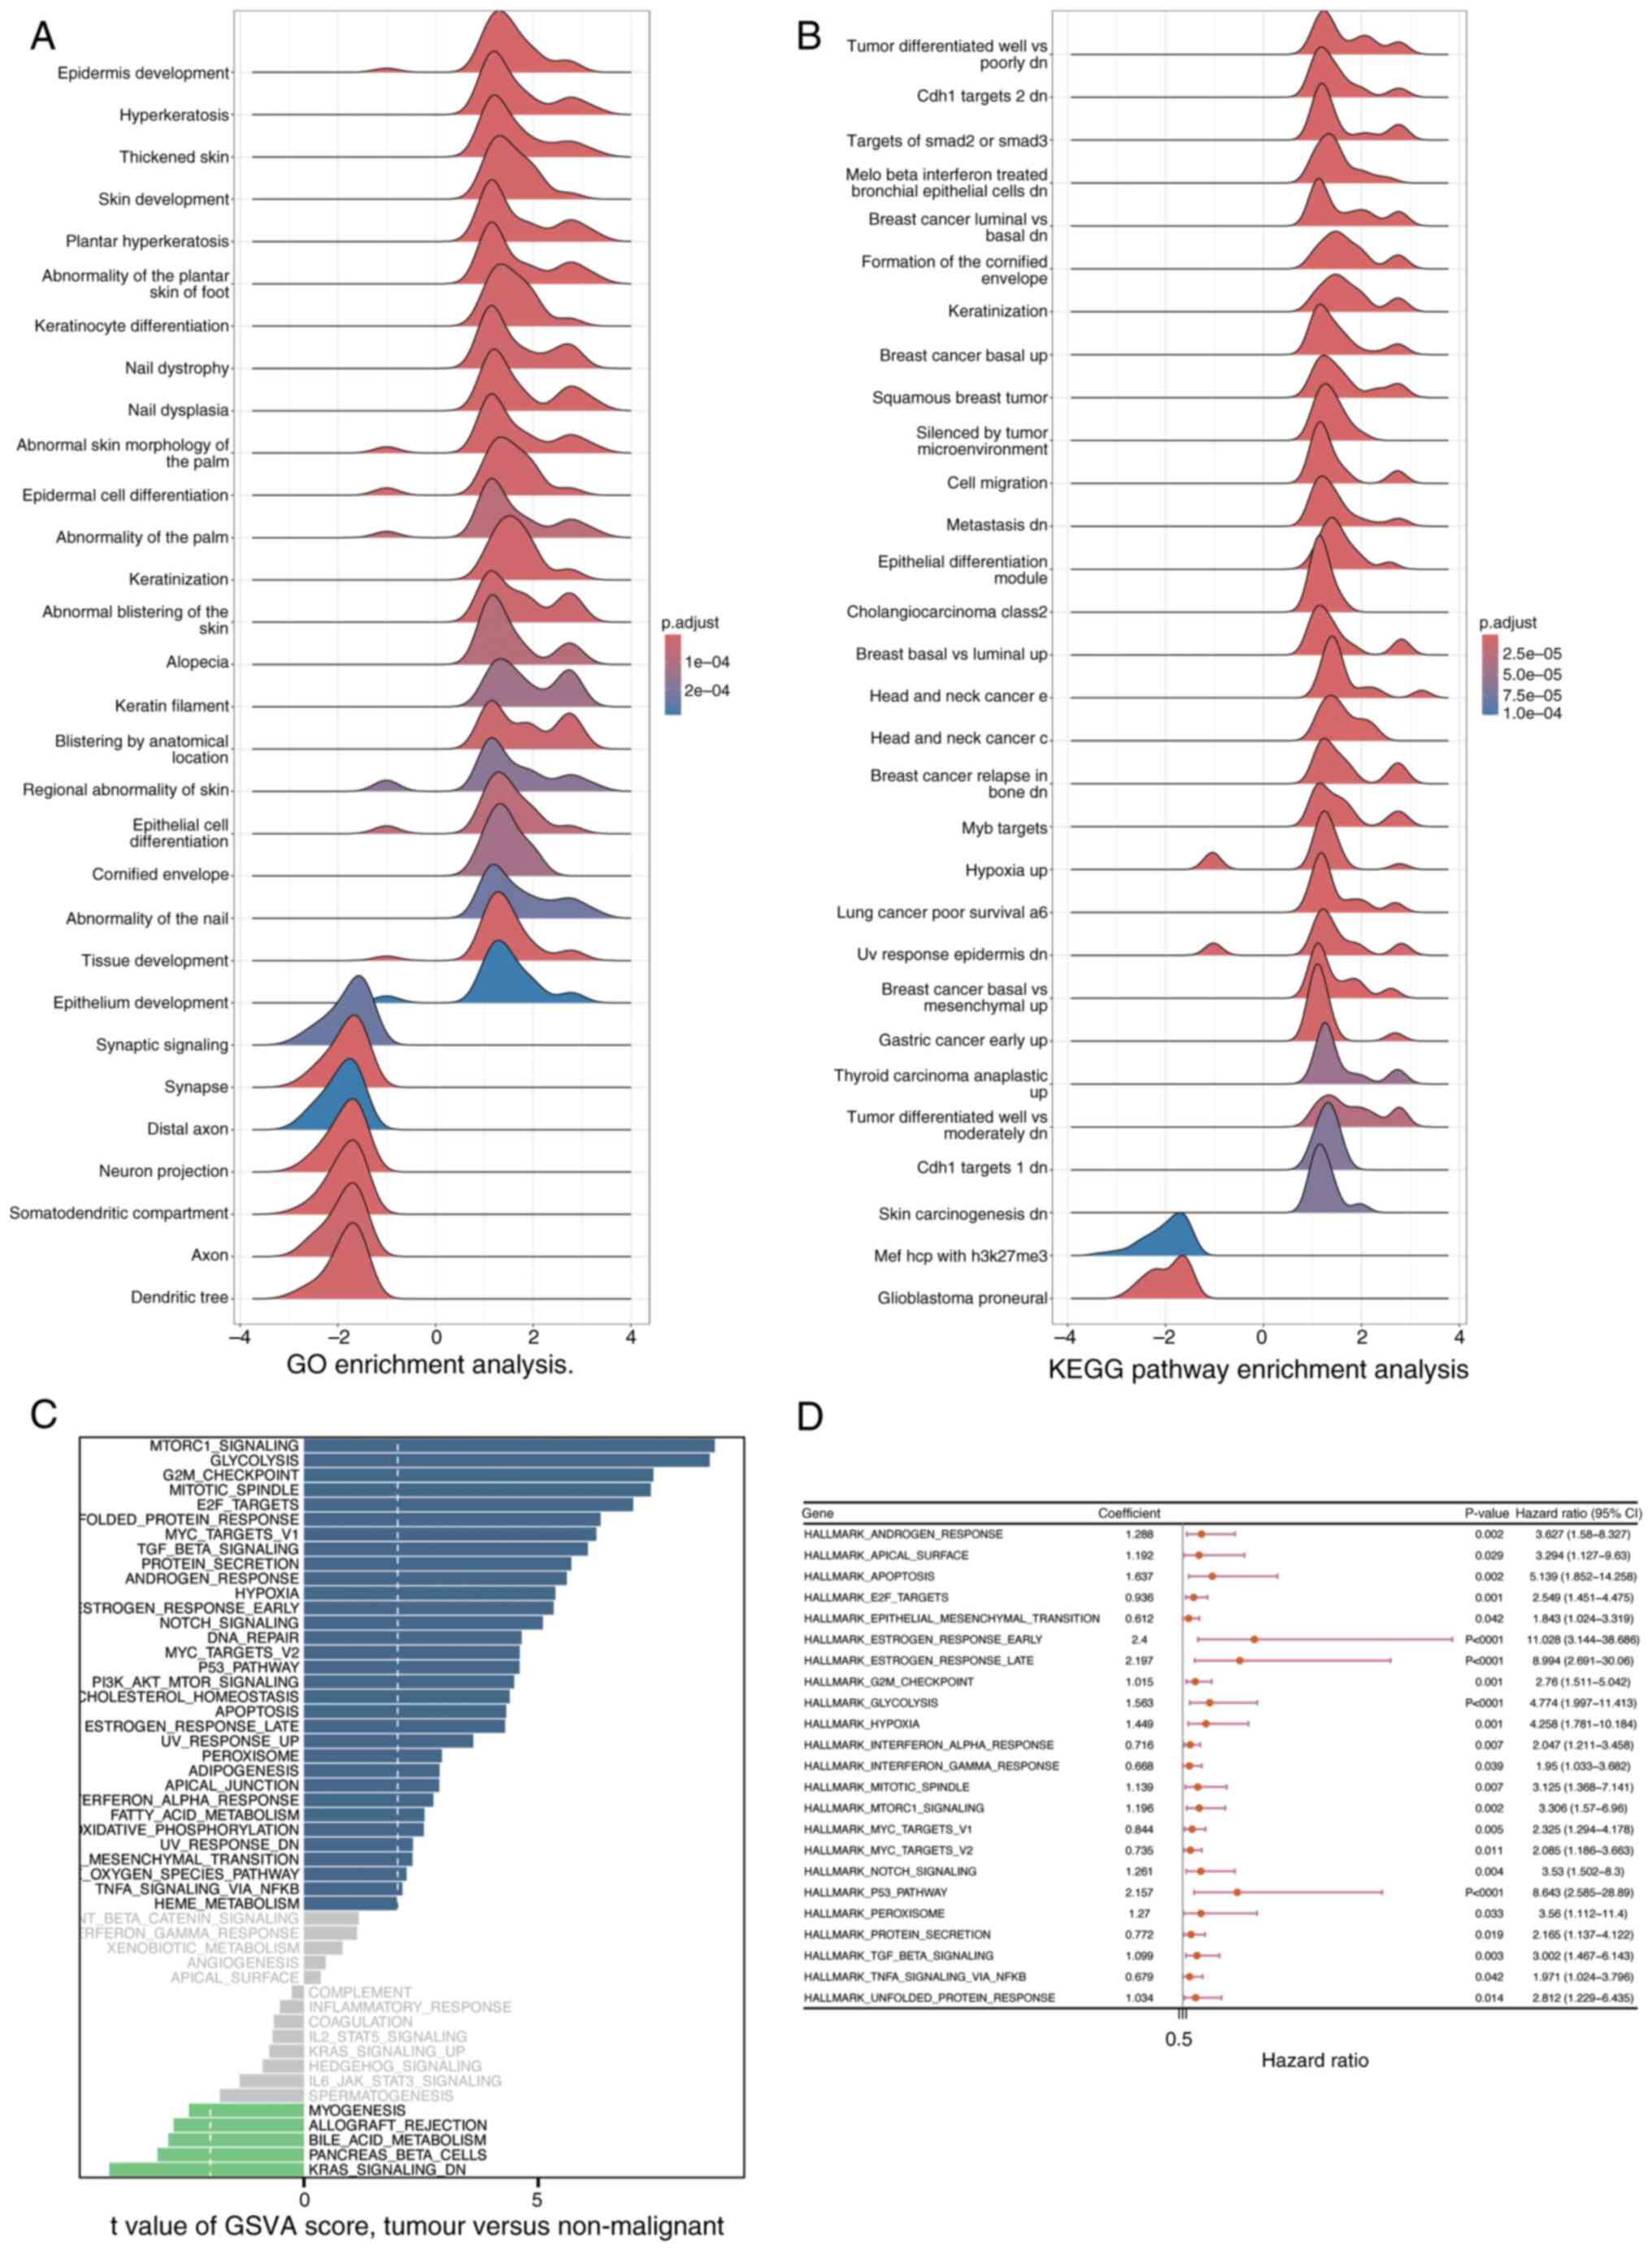
GSEA and Gene Set Variation Analysis
(GSVA)
The clusterProfiler package was utilized to perform
GSEA, aiming to identify signaling pathways that are significantly
enriched between the high- and low-risk groups, as determined by
DEGs. Pathways exhibiting a |Normalized Enrichment Score (NES)| of
>1 and an adjusted P-value of <0.05 were deemed significantly
enriched (Fig. 10A and B) In
Fig. 10A, the GO enrichment
analysis results are displayed. The horizontal axis represents the
enrichment score ranging from −4 to 4, reflecting the degree of
gene enrichment or depletion in specific biological processes. The
vertical axis lists various biological processes related to skin
development, keratinization and epithelial cell differentiation,
among others. The color of the curves indicates the adjusted
p-value, with red signifying higher significance
(1×10⁻⁴) and blue indicating lower significance
(2×10⁻⁴). Notably, processes such as ‘Epidermis
development’ and ‘Keratinization’ show prominent peaks, suggesting
their significant enrichment in the DEGs. Similarly, Fig. 10B presents the KEGG pathway
enrichment analysis. It follows the same format as Fig. 10A, with the vertical axis showing
different KEGG pathways associated with tumors, cellular responses
and carcinogenesis. Prominent peaks in pathways like ‘Tumor
differentiated well vs. poorly dn’ and ‘Breast cancer basal up’
highlight their significant enrichment in the DEGs. These findings
indicate that the enriched biological processes and pathways may
play crucial roles in distinguishing the high- and low-risk groups,
providing insights into the molecular mechanisms underlying the
observed differences. Furthermore, GSVA was performed utilizing the
GSVA package to assess variations in signaling pathways among the
groups, employing a significance threshold defined by an adjusted
P-value of <0.05 (Fig. 10C).
The results of GSVA are displayed in Fig. 10C. The horizontal axis denotes the
enrichment score, and the vertical axis lists various signaling
pathways. The color of the curves indicates the degree of pathway
variation among the groups.
Subsequently, Univariate Cox regression analysis was
performed using the survival package to assess the association
between the pathways identified by GSVA and survival outcomes in
patients with PDAC from the training cohort (Fig. 10D; P<0.05). Fig. 10D presents the results of the
univariate Cox regression analysis. The horizontal axis represents
the hazard ratio (HR) of the pathways, and the vertical axis lists
the pathways identified by GSVA. The blue squares indicate the HR
values, and the lines represent the 95% confidence intervals.
Pathways with P<0.05 are considered significantly associated
with survival outcomes.
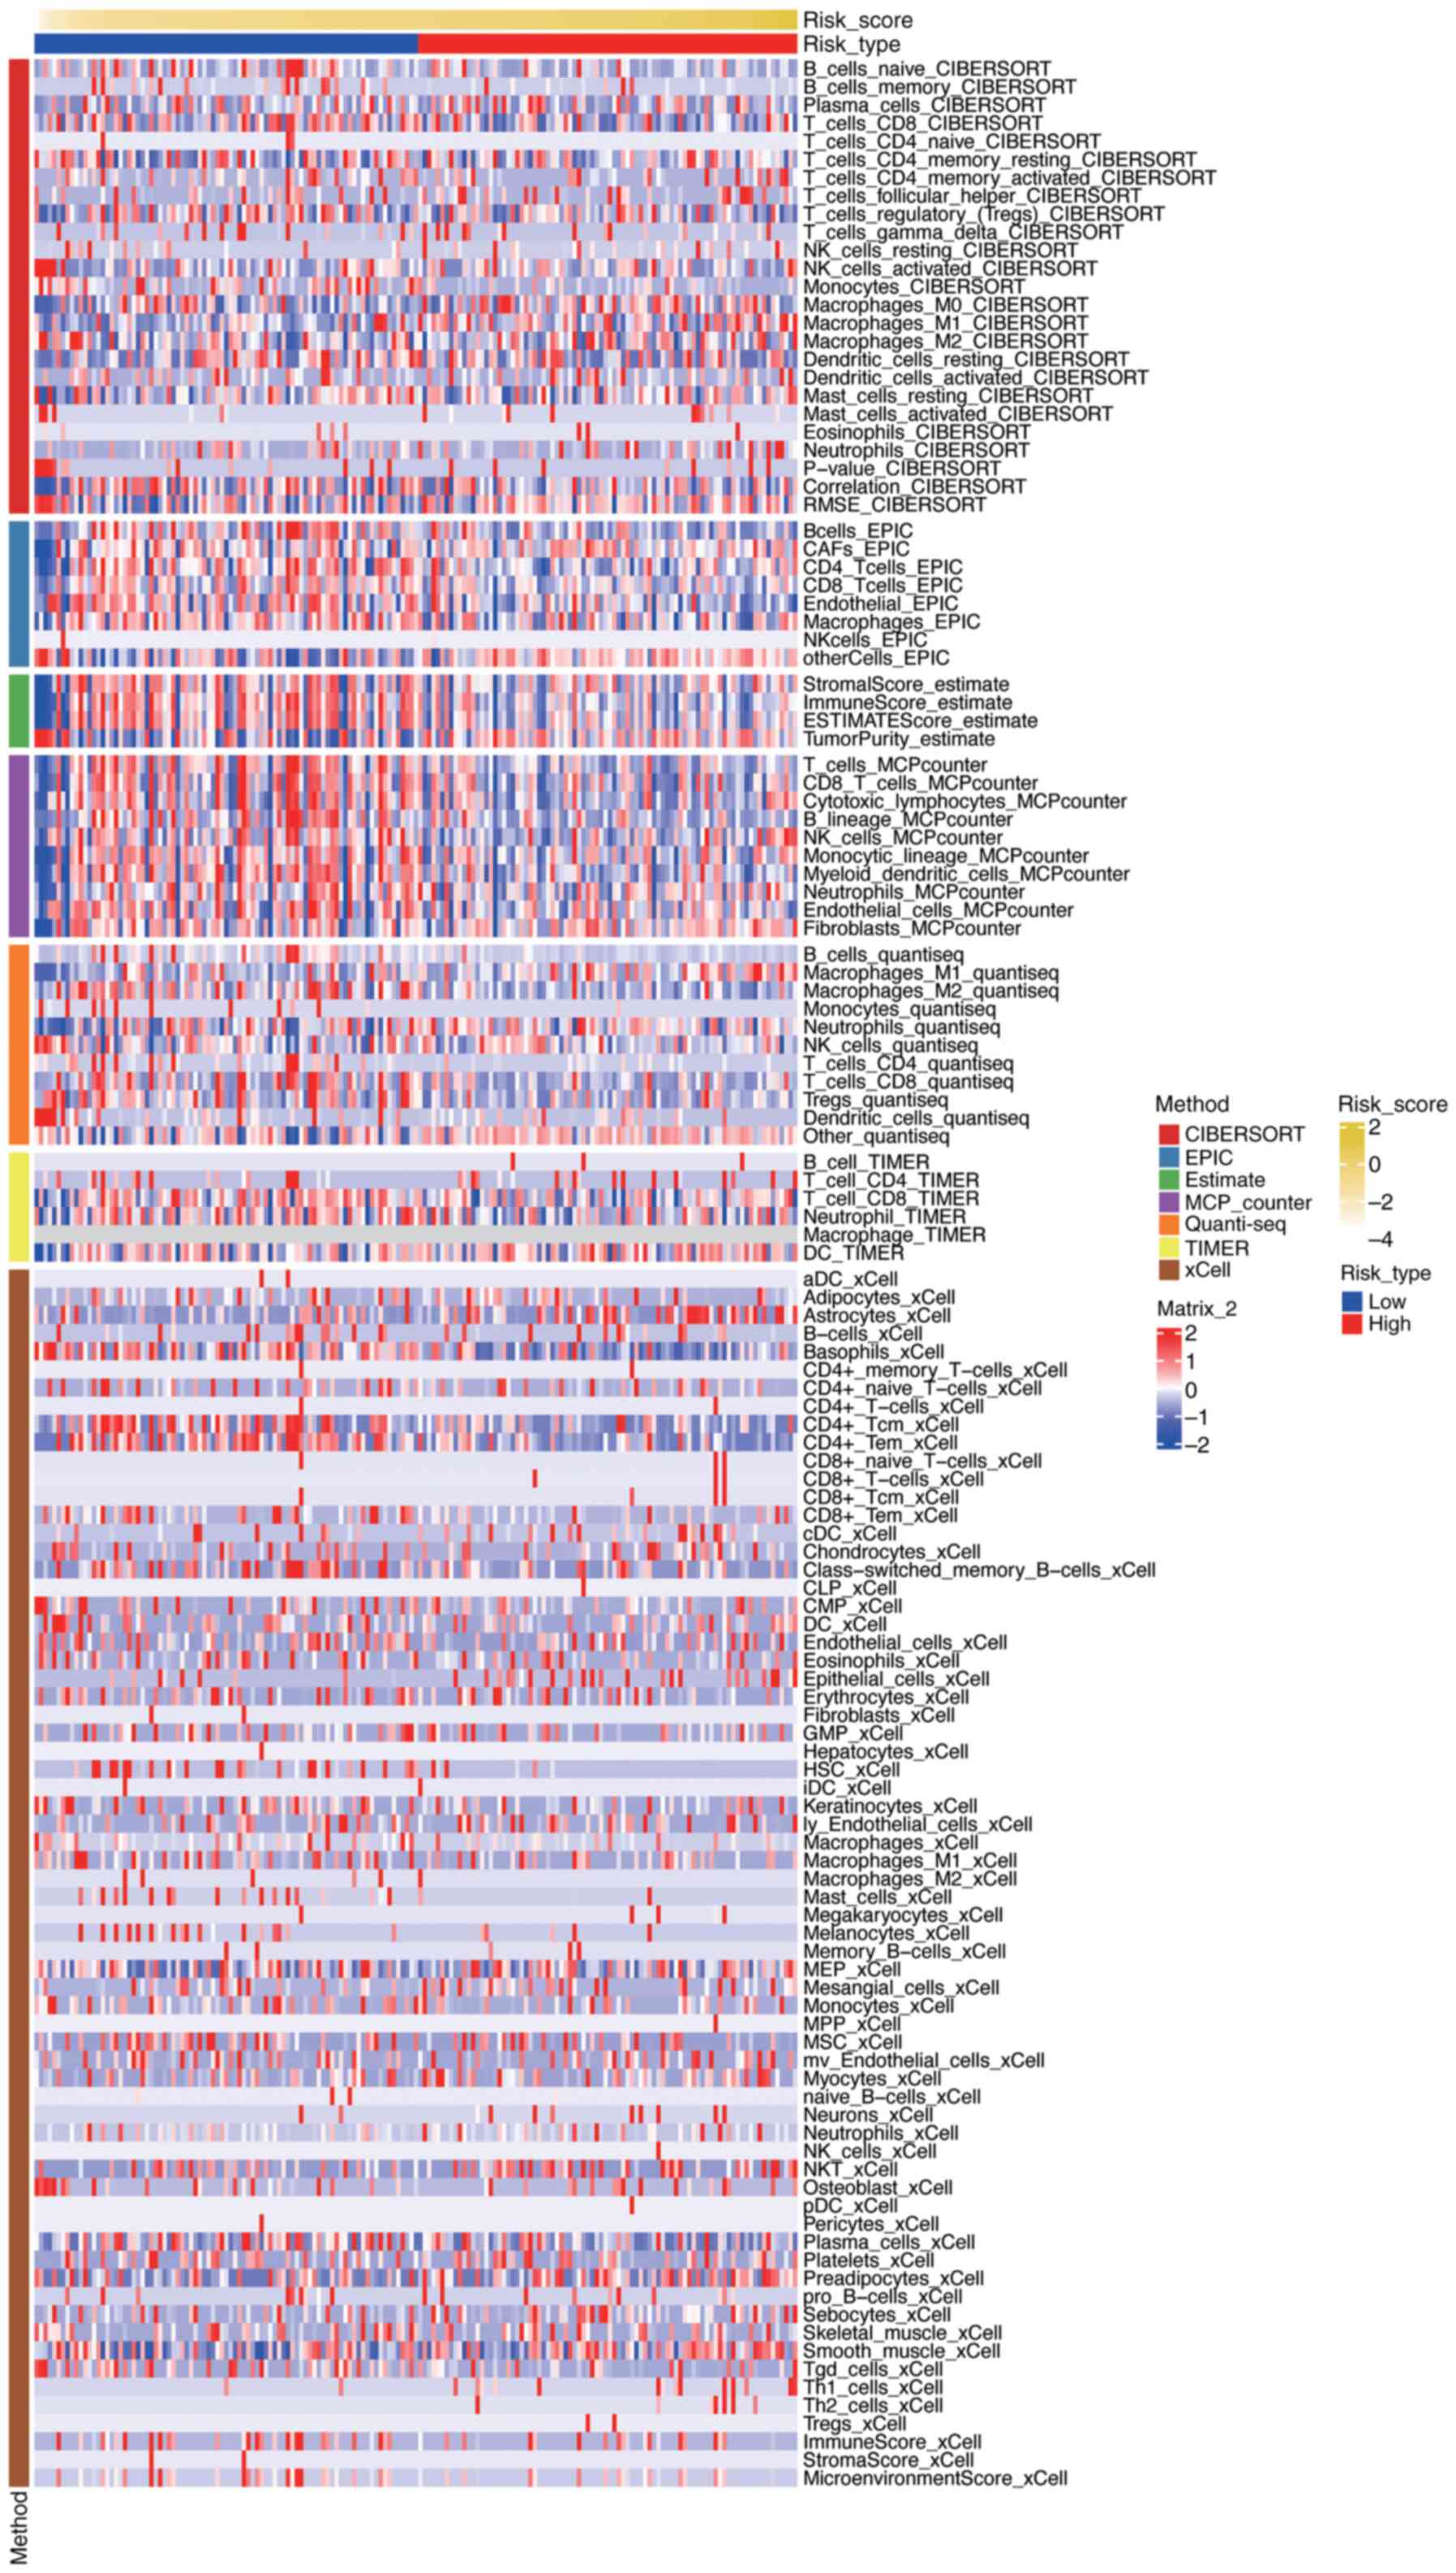
Immune-related analysis
To evaluate the relationship between risk scores and
the immune microenvironment in PDAC, immune cell infiltration
levels were assessed using seven different algorithms: the
‘CIBERSORTx’ web portal (Legacy CIBERSORT August 2024 build;
http://cibersort.stanford.edu/), the
‘MCPcounter’ R package (version 1.2.0; GitHub, http://github.com/ebecht/MCPcounter),
the ‘EPIC’ R package (version 1.1.5; GitHub, http://github.com/GfellerLab/EPIC/releases/tag/v1.1),
the ‘estimate’ R package (version 1.0.13; R-Forge, http://r-forge.r-project.org/projects/estimate/),
the ‘TIMER’ web server (April 2025 build; http://timer.comp-genomics.org/), the ‘quanTIseq’ R
script (commit 2024-10-15; GitHub, http://github.com/icbi-lab/quanTIseq), and the ‘xCell’
R package (version 1.1.0; CRAN, http://cran.r-project.org/package=xCell). The results
were visualized using a heatmap, which was generated using the
ComplexHeatmap package (version 2.13.1; Bioconductor, http://bioconductor.org/packages/ComplexHeatmap)
(Fig. 11) Fig. 11 presents a comprehensive
visualization of immune cell infiltration levels across different
risk groups in PDAC, as assessed by seven distinct algorithms. The
heatmap displays the relative abundance of various immune cell
types, with rows representing specific immune cell populations and
columns representing individual samples or risk groups. Each cell
in the heatmap is color-coded to indicate the level of
infiltration, ranging from low (blue) to high (red). The figure
also includes annotations for risk scores and tumor types, allowing
for the identification of patterns and correlations between immune
cell infiltration and risk stratification. The clustering of
samples based on immune infiltration profiles highlights potential
differences in the immune microenvironment between high-risk and
low-risk groups, providing insights into the immunological
mechanisms underlying PDAC progression and prognosis.
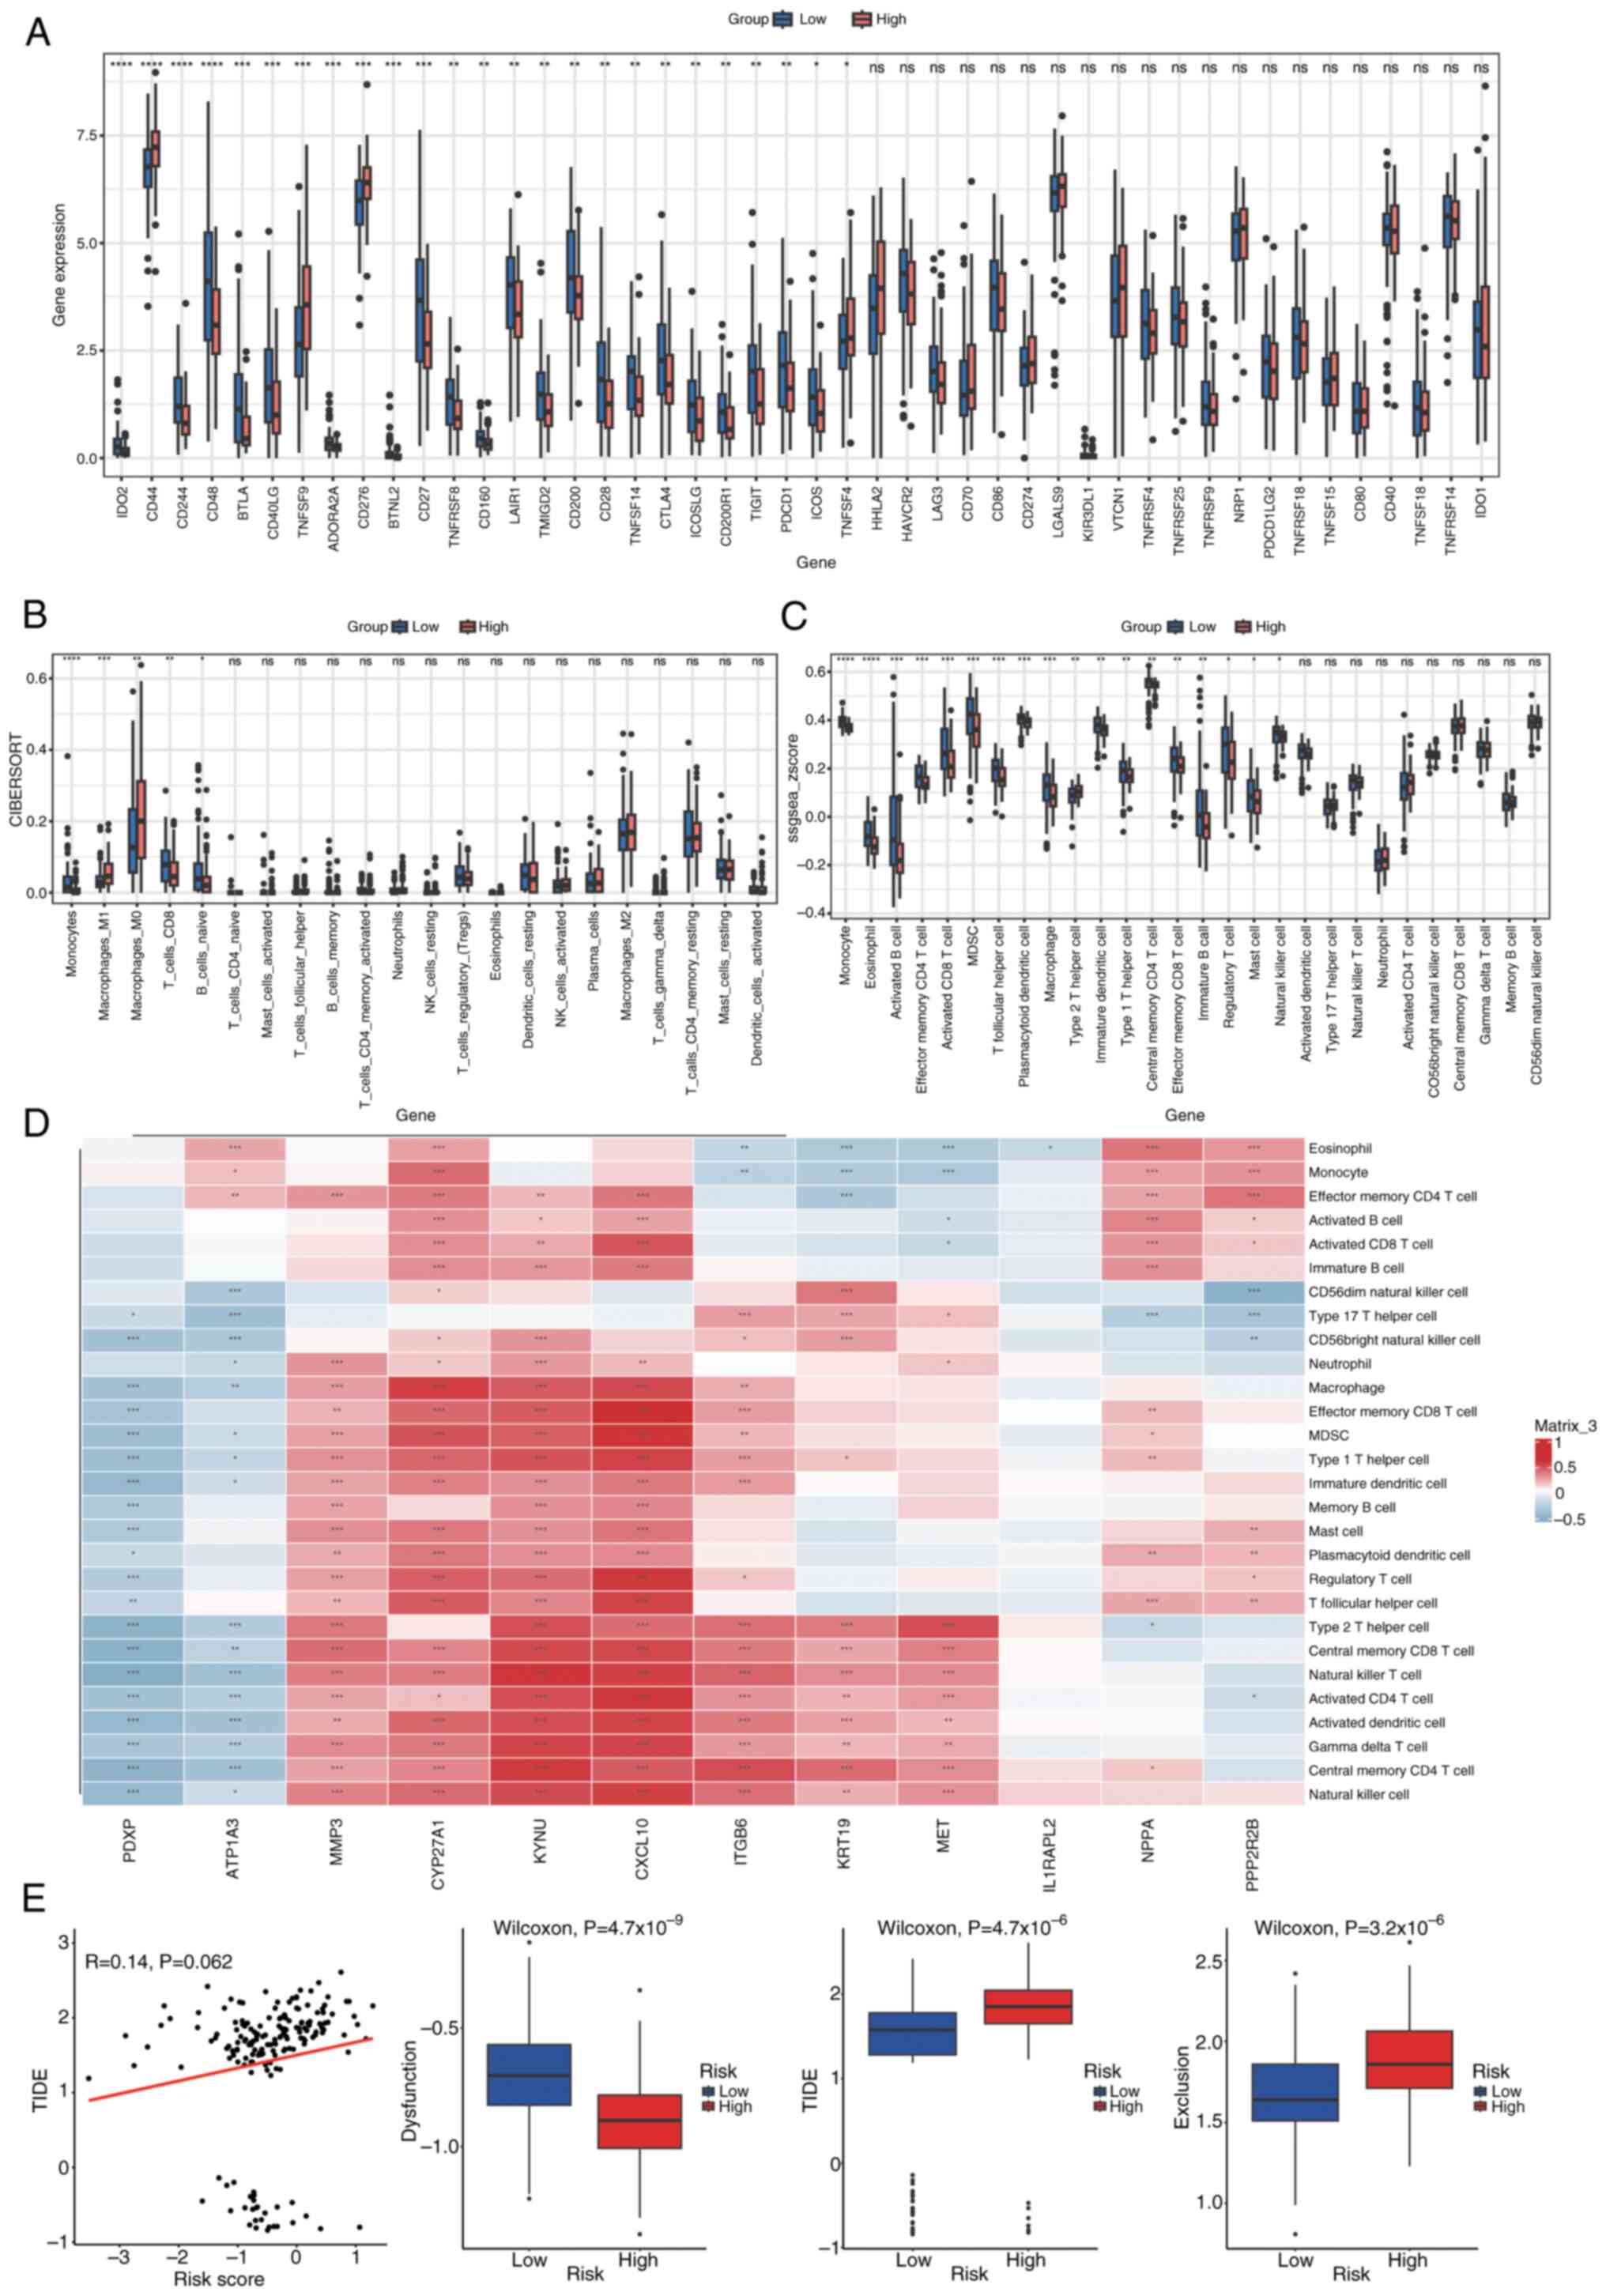
Immune checkpoint and immune cell
infiltration analysis
The expression of 46 immune checkpoints was analyzed
in both groups, with statistical significance set at P<0.05
(Fig. 12A). Infiltration scores
for 22 and 28 immune cell types were calculated using CIBERSORT and
single sample GSEA, respectively, to estimate a diverse array of
immune cell populations (Fig. 12B and
C). Wilcoxon rank-sum tests were then applied to assess
differences in immune cell infiltration between the groups
(P<0.05). Furthermore, to assess the relationship between immune
cell infiltration and prognostic genes, Spearman's correlation
analysis was performed utilizing the Hmisc package. Immune cells
exhibiting a correlation coefficient (|cor|) of >0.3 and
P<0.05 were deemed to have a significant correlation. The
relationships were illustrated in a correlation heatmap produced
with the pheatmap package (Fig.
12D). Fig. 12D presents a
correlation heatmap depicting the relationships between immune
cells and Least Absolute Shrinkage and Selection Operator
(LASSO)-selected genes. Each row represents a specific immune cell
type, while each column corresponds to a LASSO-selected gene. The
heatmap uses a color gradient to indicate the strength and
direction of the correlations, with blue representing negative
correlations and red representing positive correlations. Several
immune cell types exhibit significant correlations with the
prognostic genes, as indicated by the color intensity and the
corresponding correlation coefficients. For example, certain immune
cells show strong positive correlations (red blocks) with specific
genes, suggesting potential synergistic roles in the immune
response, while others display notable negative correlations (blue
blocks), indicating possible antagonistic relationships. These
findings highlight the complex interplay between immune cell
infiltration and gene expression patterns in the context of PDAC,
providing insights into the immune mechanisms that may influence
disease progression and patient outcomes.
Assessment of treatment response in
the high- vs. low-risk groups
The evaluation of treatment response differences
involved the calculation of T cell dysfunction, T cell exclusion
and the overall Tumor Immune Dysfunction and Exclusion (TIDE)
score, employing the TIDE algorithm. The comparison of score
distributions between the high- and low-risk groups was performed
using Wilcoxon rank-sum tests (P<0.05; Fig. 12E). Fig. 12E illustrates the differences in
dysfunction, exclusion and TIDE scores between high-risk and
low-risk groups. A scatter plot shows the relationship between risk
scores and TIDE scores, with each dot representing an individual
sample. The red line indicates the trend of this relationship,
suggesting a weak positive correlation between risk scores and TIDE
scores (R=0.14, P=0.062), although the correlation is not
statistically significant at the conventional threshold of
P<0.05. Below the scatter plot, three box plots compare the
distribution of dysfunction, TIDE and exclusion scores between the
two risk groups. Each box plot displays the median, interquartile
range (IQR) and potential outliers of the respective scores. The
high-risk group shows significantly higher dysfunction scores
(Wilcoxon test, P=4.7×10⁻⁹), TIDE scores (Wilcoxon test,
P=4.4×10⁻⁶), and exclusion scores (Wilcoxon test,
P=3.2×10⁻⁶) compared to the low-risk group. These
results imply that the high-risk group may have more pronounced
immune dysfunction and exclusion, which could contribute to adverse
outcomes in patients with PDAC.
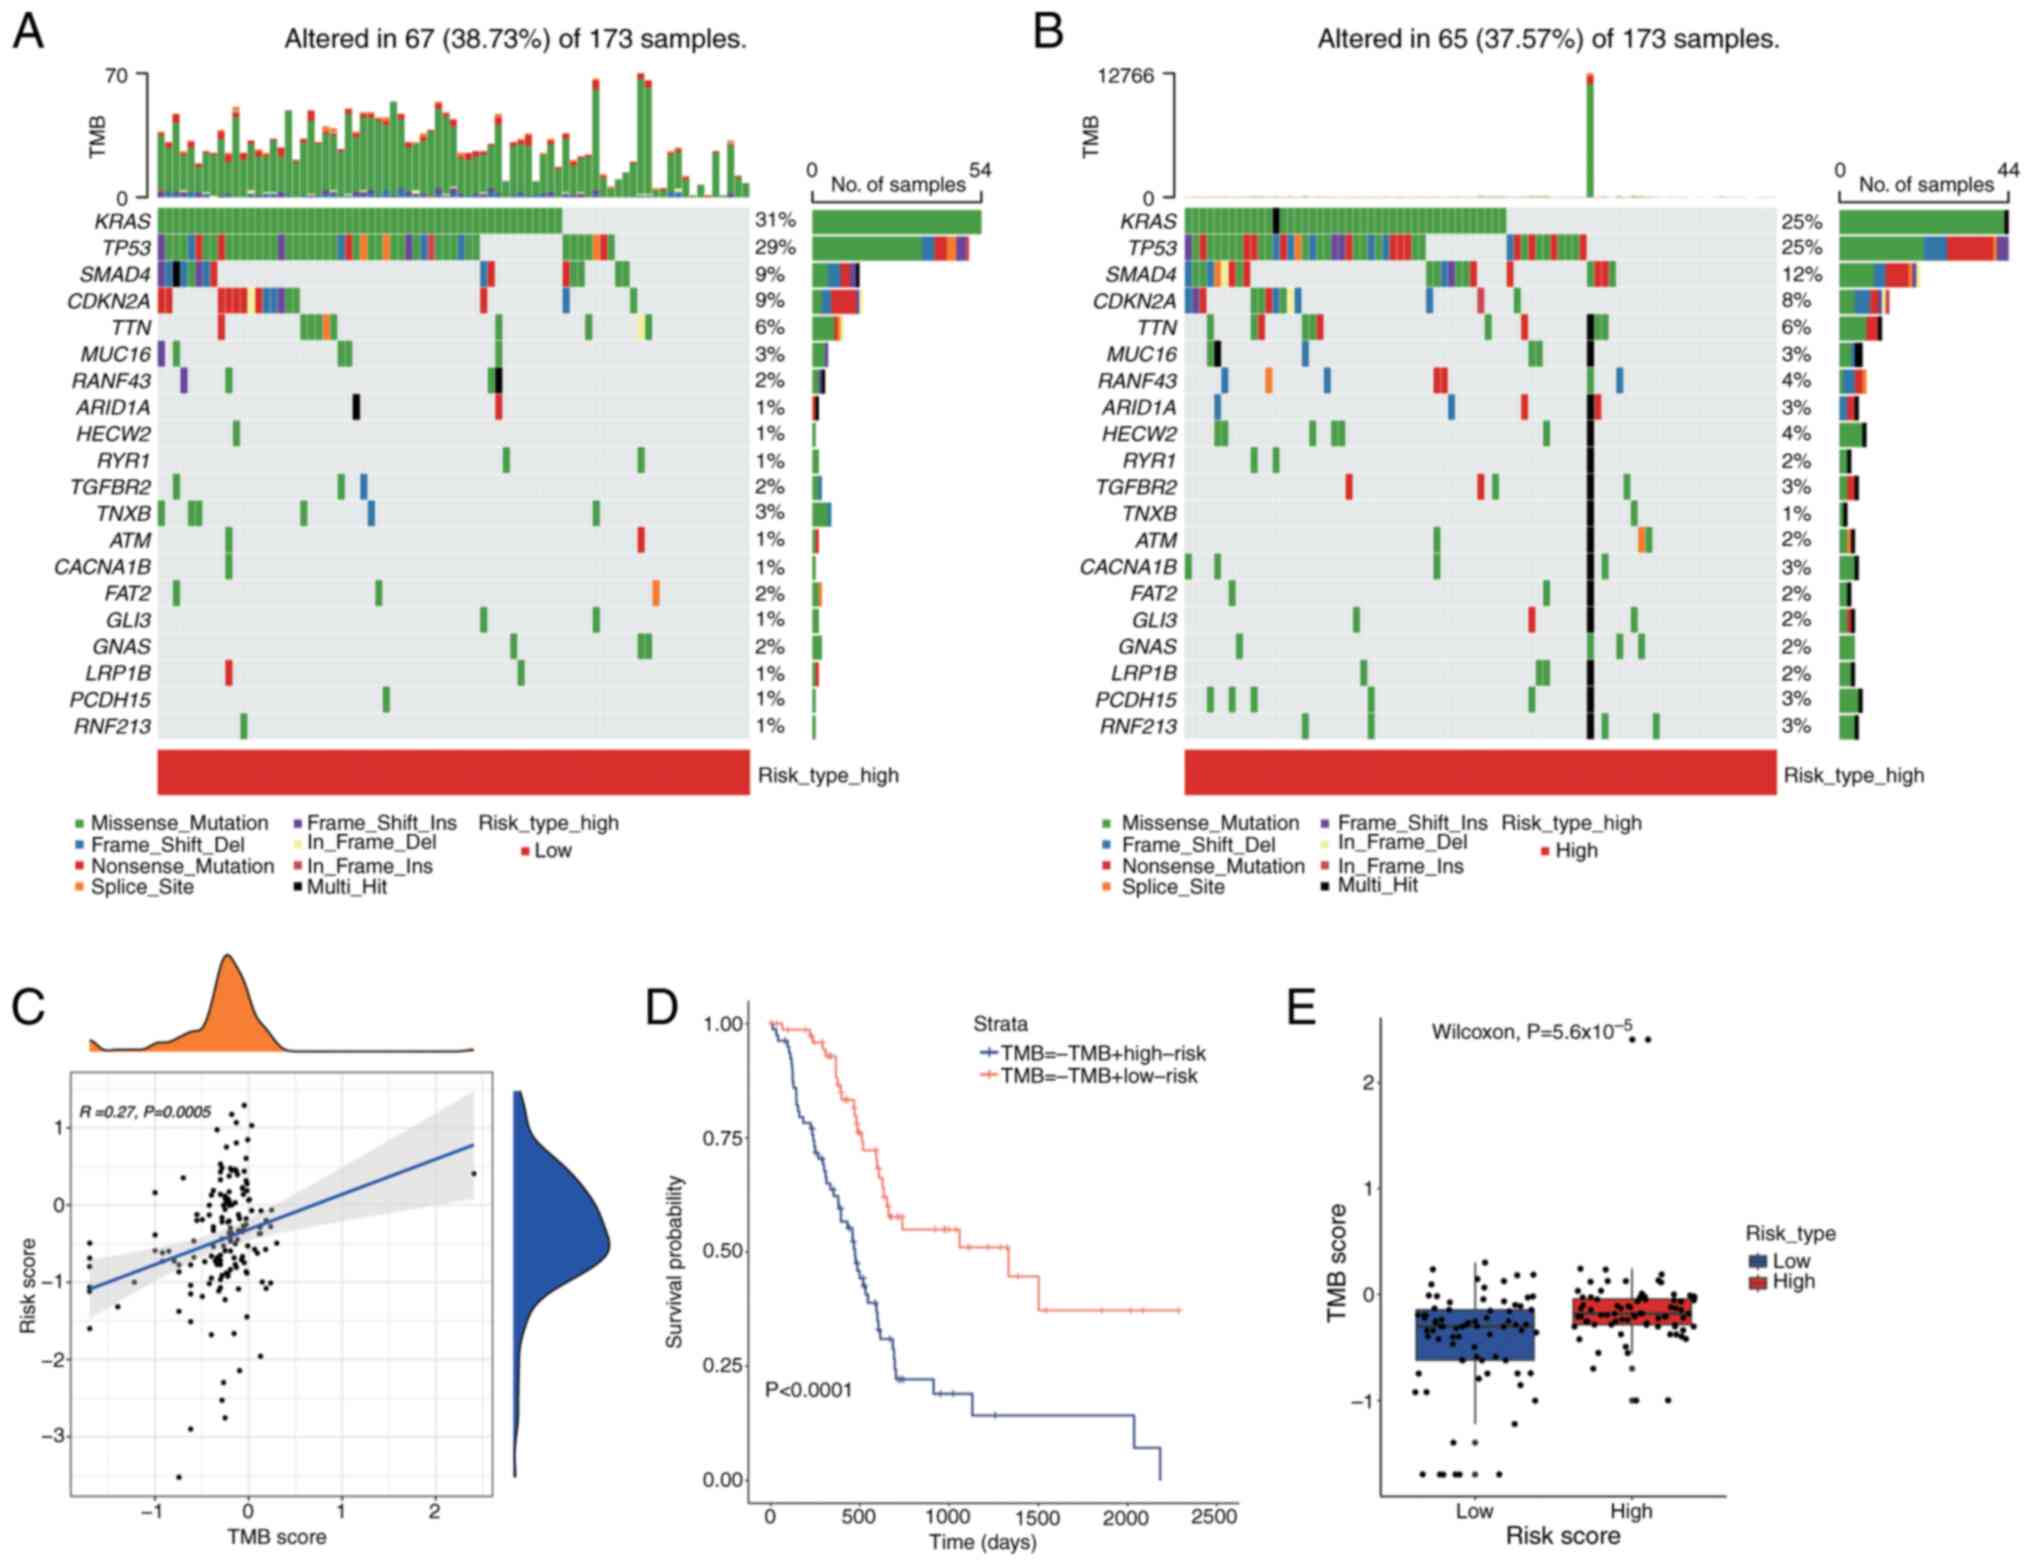
Tumor Mutational Burden (TMB)
analysis
To assess the impact of TMB on PDAC prognosis, a
waterfall plot was used to display the top 20 most frequently
mutated genes across different risk categories (Fig. 13A and B). In the low-risk group,
the APC gene demonstrated the highest mutation frequency at 25%,
which increased to 31% in the high-risk group. The relationship
between TMB and risk scores was illustrated using the tinyarray
package (Fig. 13C). Fig. 13C illustrates the relationship
between TMB scores and risk scores using a scatter plot and density
plots. Each dot in the scatter plot represents an individual
sample, with the x-axis indicating the TMB score and the y-axis
indicating the risk score. A blue trend line shows a weak positive
correlation between TMB scores and risk scores (R=0.27, P=0.0005),
indicating that higher TMB scores tend to be associated with higher
risk scores. The density plots on the top and right side of the
scatter plot display the distribution of TMB scores and risk
scores, respectively, showing the density of samples with different
TMB and risk scores. Survival outcomes were assessed using
Kaplan-Meier survival analysis utilizing the survival package to
determine any differences across TMB levels (Fig. 13D). Fig. 13D presents a Kaplan-Meier survival
analysis comparing the survival outcomes of different groups based
on TMB and risk scores. The x-axis represents time in days, and the
y-axis represents the survival probability. Two survival curves are
shown: One for the TMB-high risk group (blue line) and one for the
TMB-low risk group (red line). The results indicate a significant
difference in survival between the groups, with the TMB-high risk
group showing lower survival probabilities over time (P<0.0001).
This suggests that patients with higher TMB and risk scores may
have poorer prognoses. A Wilcoxon rank-sum test (P<0.05) was
employed to analyze the differences in TMB scores across the groups
(Fig. 13E). Fig. 13E displays a box plot comparing TMB
scores between high-risk and low-risk groups. Each box plot shows
the distribution of TMB scores within each group, with the box
representing the IQR and the line inside the box indicating the
median. The high-risk group exhibits significantly higher TMB
scores compared to the low-risk group (Wilcoxon test,
P=5.6×10⁻⁵), as evidenced by the higher median and
overall distribution of TMB scores in the high-risk group.
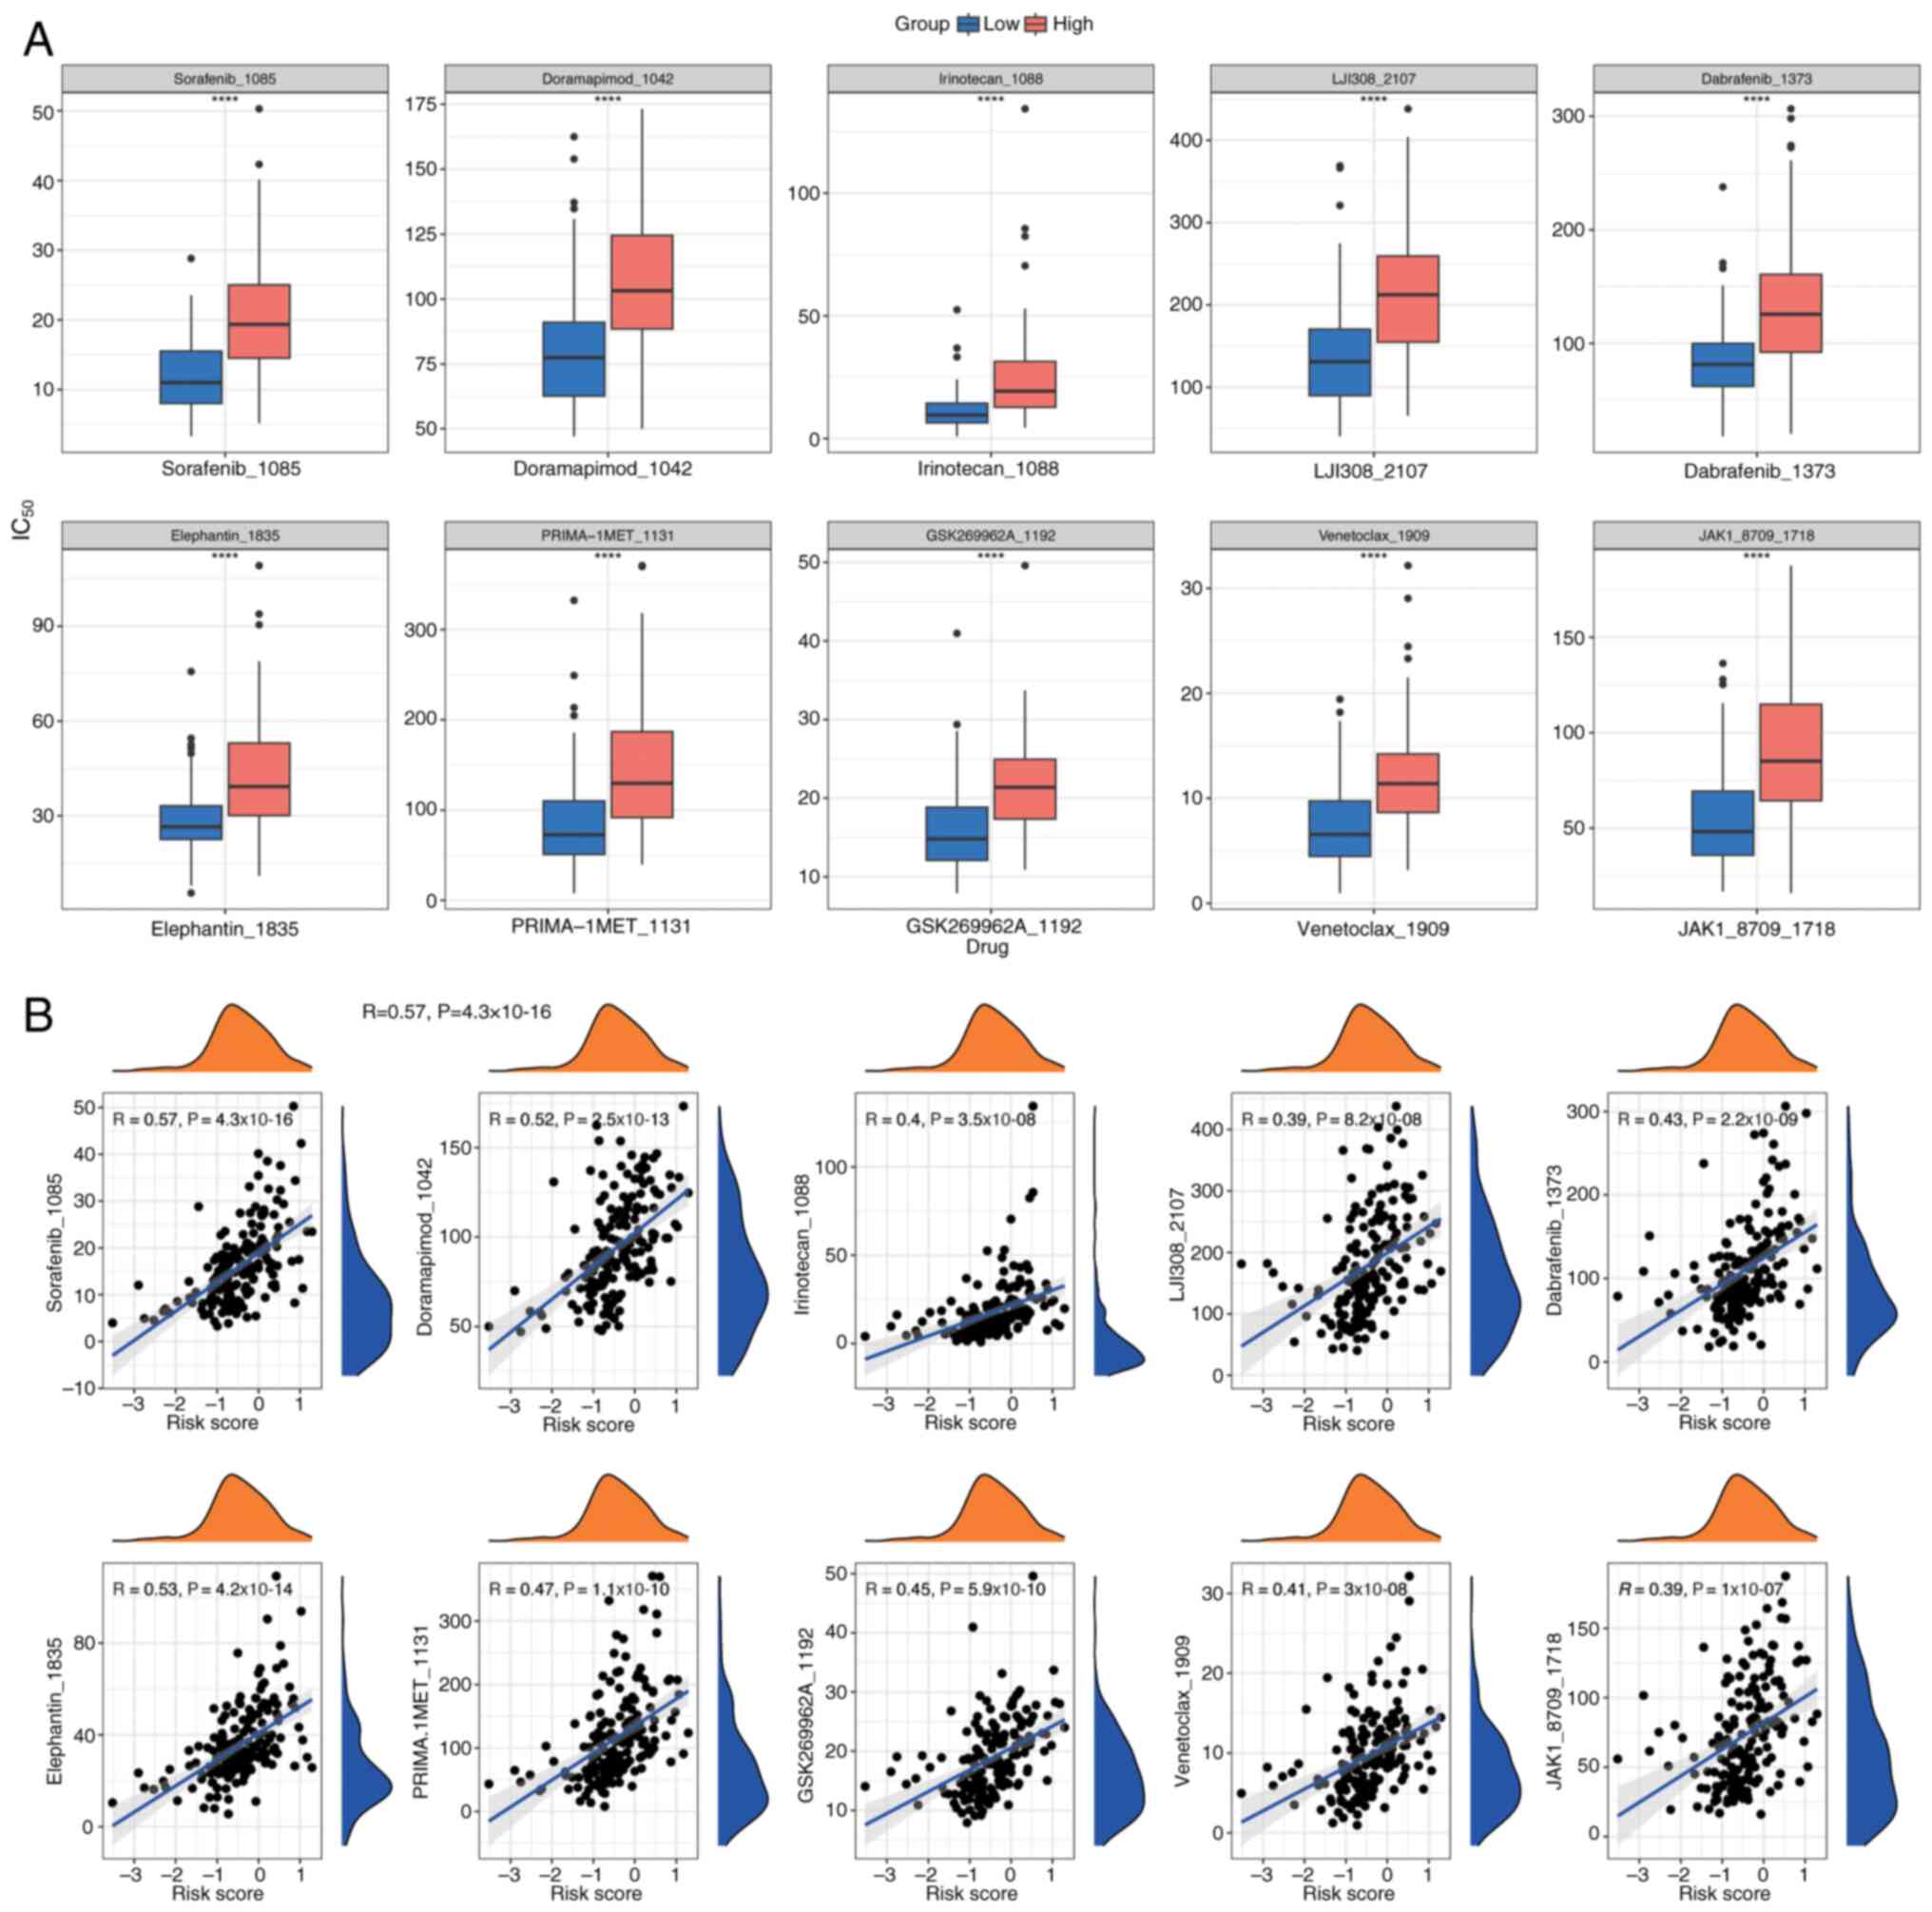
Drug sensitivity analysis
To tailor individualized treatment strategies for
PDAC, IC50 values for 198 drugs were calculated from the
Genomics of Drug Sensitivity in Cancer database using the
OncoPredict package. This analysis was performed on PDAC samples
with comprehensive survival data from the training cohort.
IC50 values, indicating drug sensitivity, were compared
between the two groups using Wilcoxon rank-sum tests (P<0.05),
and the top 10 most significant drugs were displayed in box plots
(Fig. 14A). Additionally, Spearman
correlation analysis, performed using the psych package, assessed
the correlation between these drugs and risk scores (Fig. 14B), indicating a positive
correlation for all drugs.
Prognostic gene correlation,
localization, gene-gene interaction (GGI) network and regulatory
network analysis
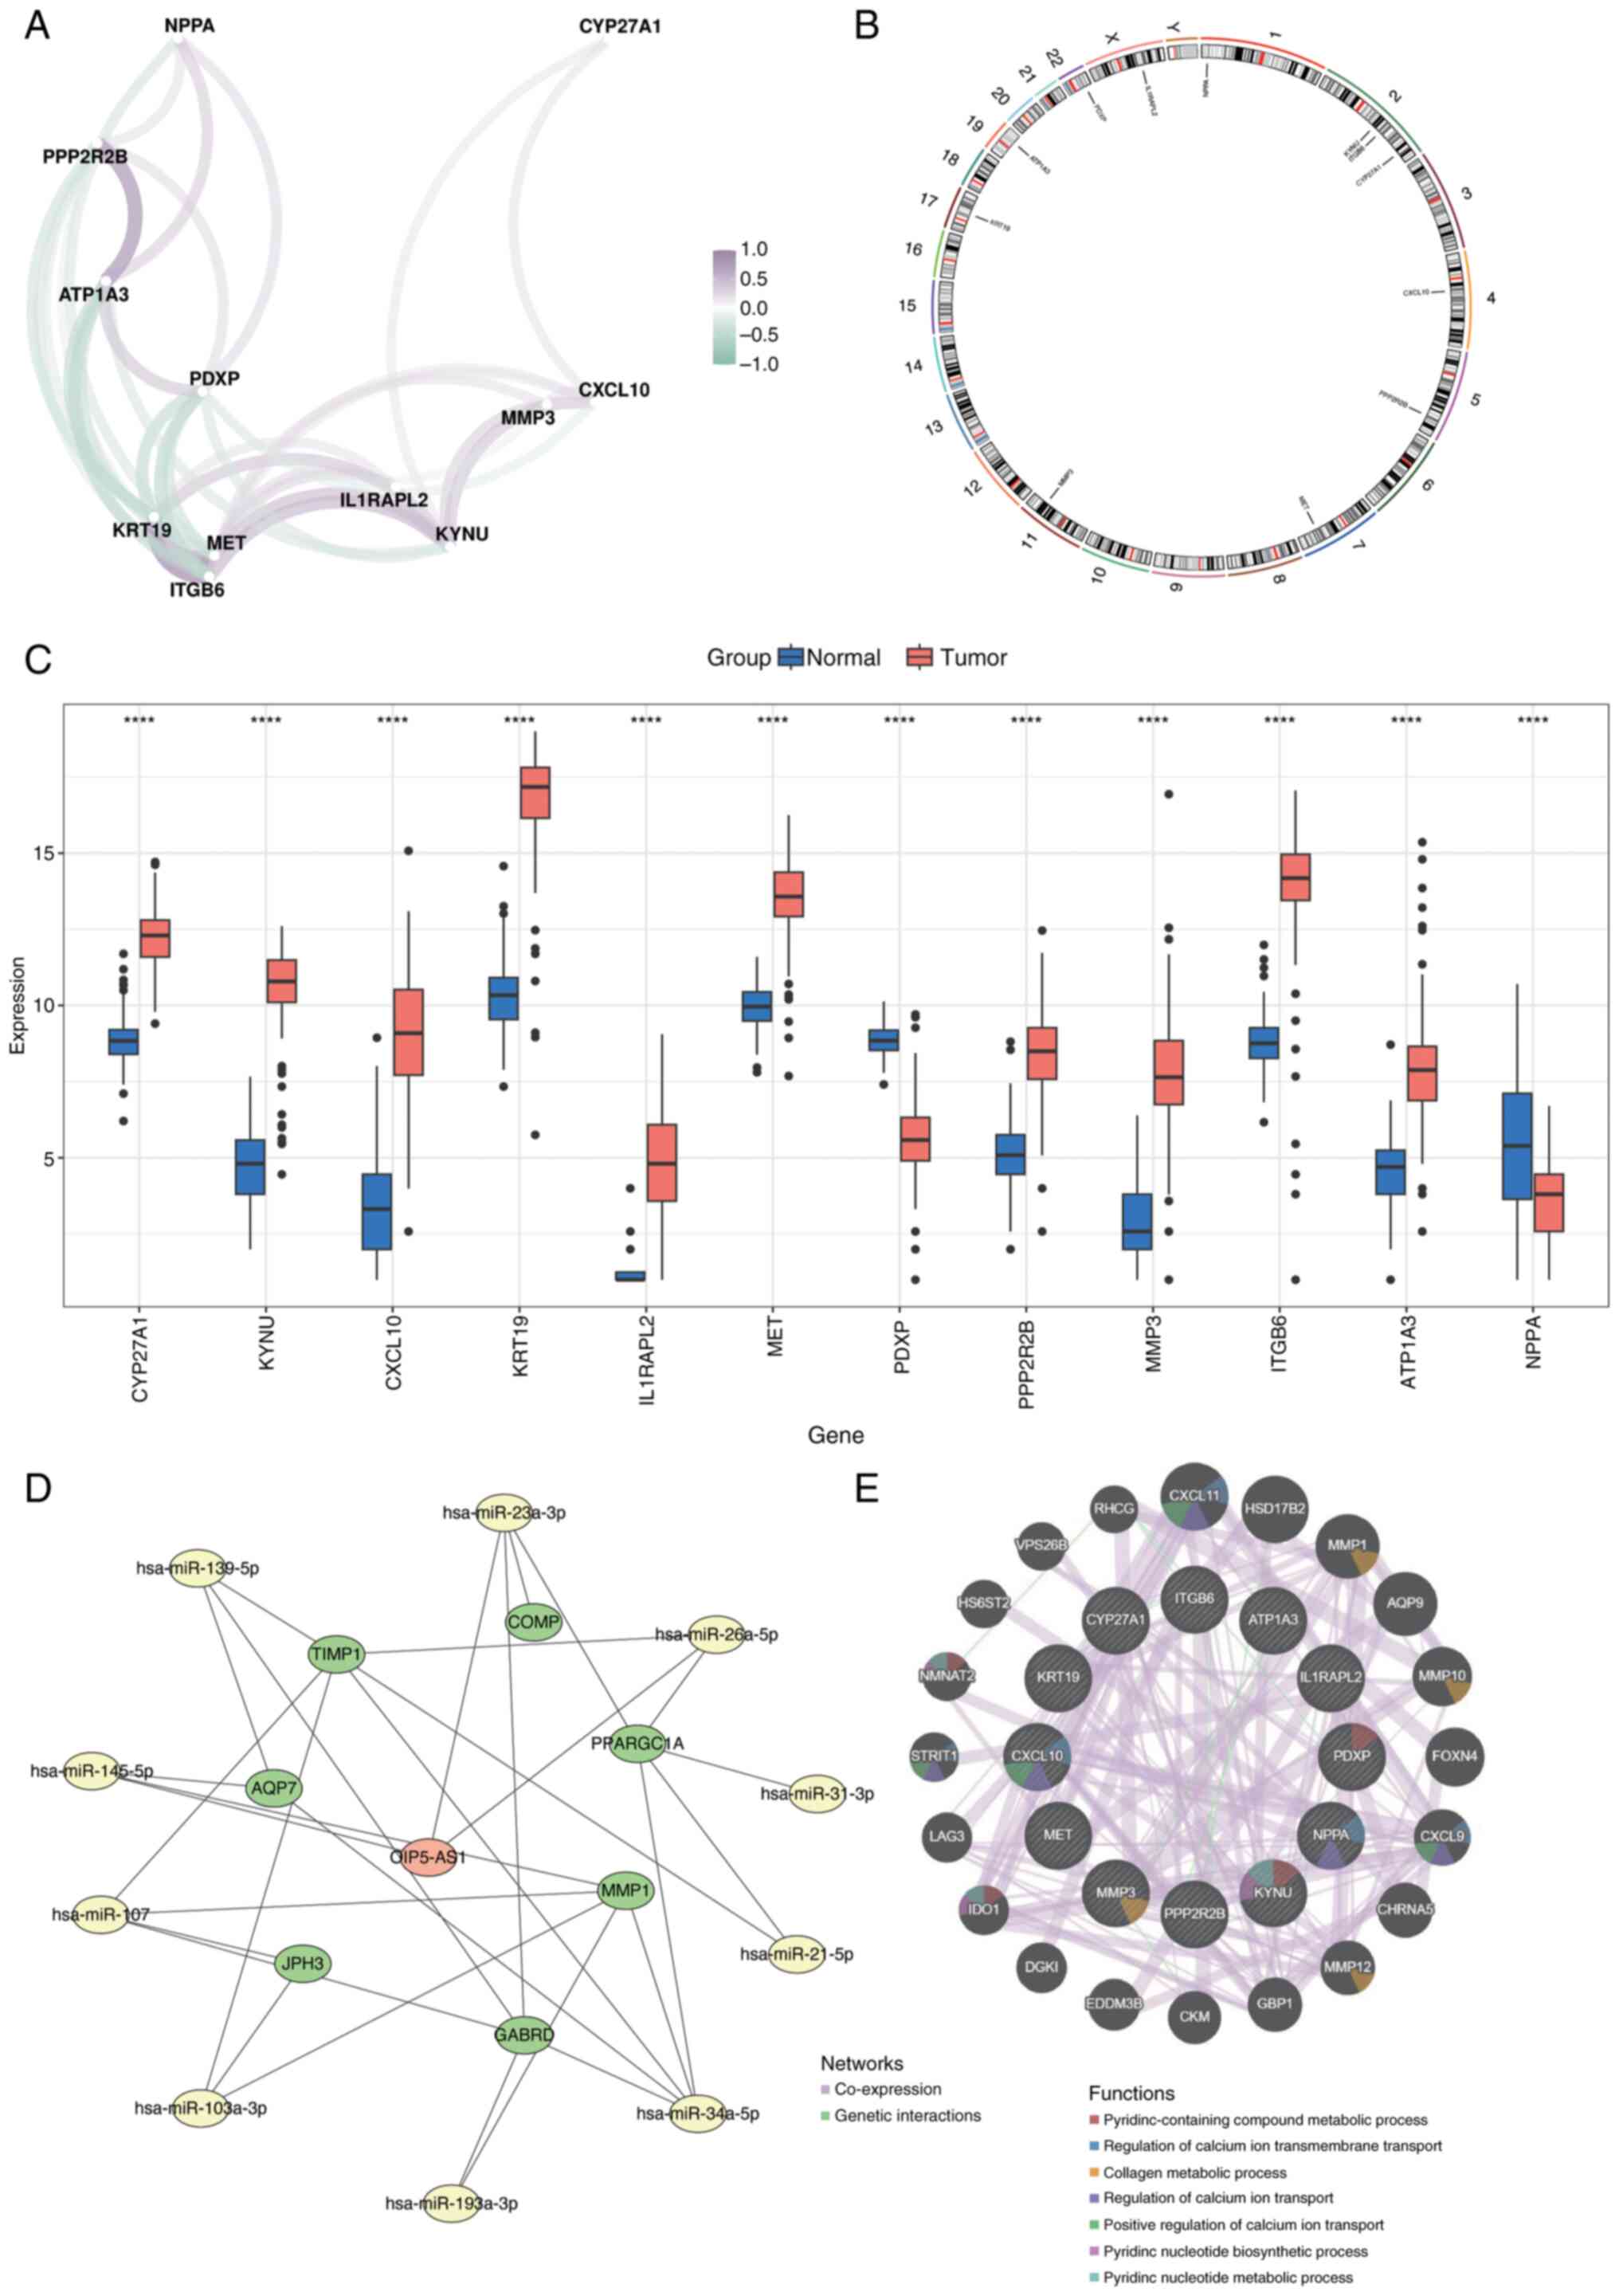
Spearman's correlation analysis was performed to
evaluate the relationships among prognostic genes using the corrr
package (Fig. 15A). Chromosomal
localization of the biomarkers was analyzed using the RCircos
package, which mapped their distribution across chromosomes:
Natriuretic Peptide A (NPPA) on chromosome 1; KYNU, Integrin
Subunit β6 (ITGB6) and CYP27A1 on chromosome 2; C-X-C Motif
Chemokine Ligand 10 (CXCL10) on chromosome 4; Protein Phosphatase 2
Regulatory Subunit Bβ (PPP2R2B) on chromosome 5; MET on chromosome
7; Matrix Metalloproteinase 3 (MMP3) on chromosome 11; Keratin 19
on chromosome 17; ATPase Na+/K+ Transporting
Subunit α3 on chromosome 19; Pyridoxal Phosphatase on chromosome
22; and Interleukin 1 Receptor Accessory Protein Like 2 on the X
chromosome (Fig. 15B).
Expression levels of the 12 prognostic genes were
compared between normal and cancerous tissues, revealing
significant differences (P<0.05; Fig. 15C). To assess the molecular
regulatory mechanisms underlying the prognostic genes, micro
(mi)RNAs associated with these genes were predicted using the
miRWalk and miRNet databases. miRNAs identified by both databases
were selected as key candidates. Potential long noncoding (lnc)RNAs
interacting with these miRNAs were then predicted using StarBase
and miRNet. The intersecting lncRNAs identified by both databases
were chosen as key lncRNAs. An lncRNA-miRNA-mRNA regulatory network
was constructed with these key elements using Cytoscape (Fig. 15D). Additionally, the GeneMANIA
database was utilized to identify genes functionally related to the
prognostic genes and their associated biological functions. A
co-expression network for these genes was created (Fig. 15E).
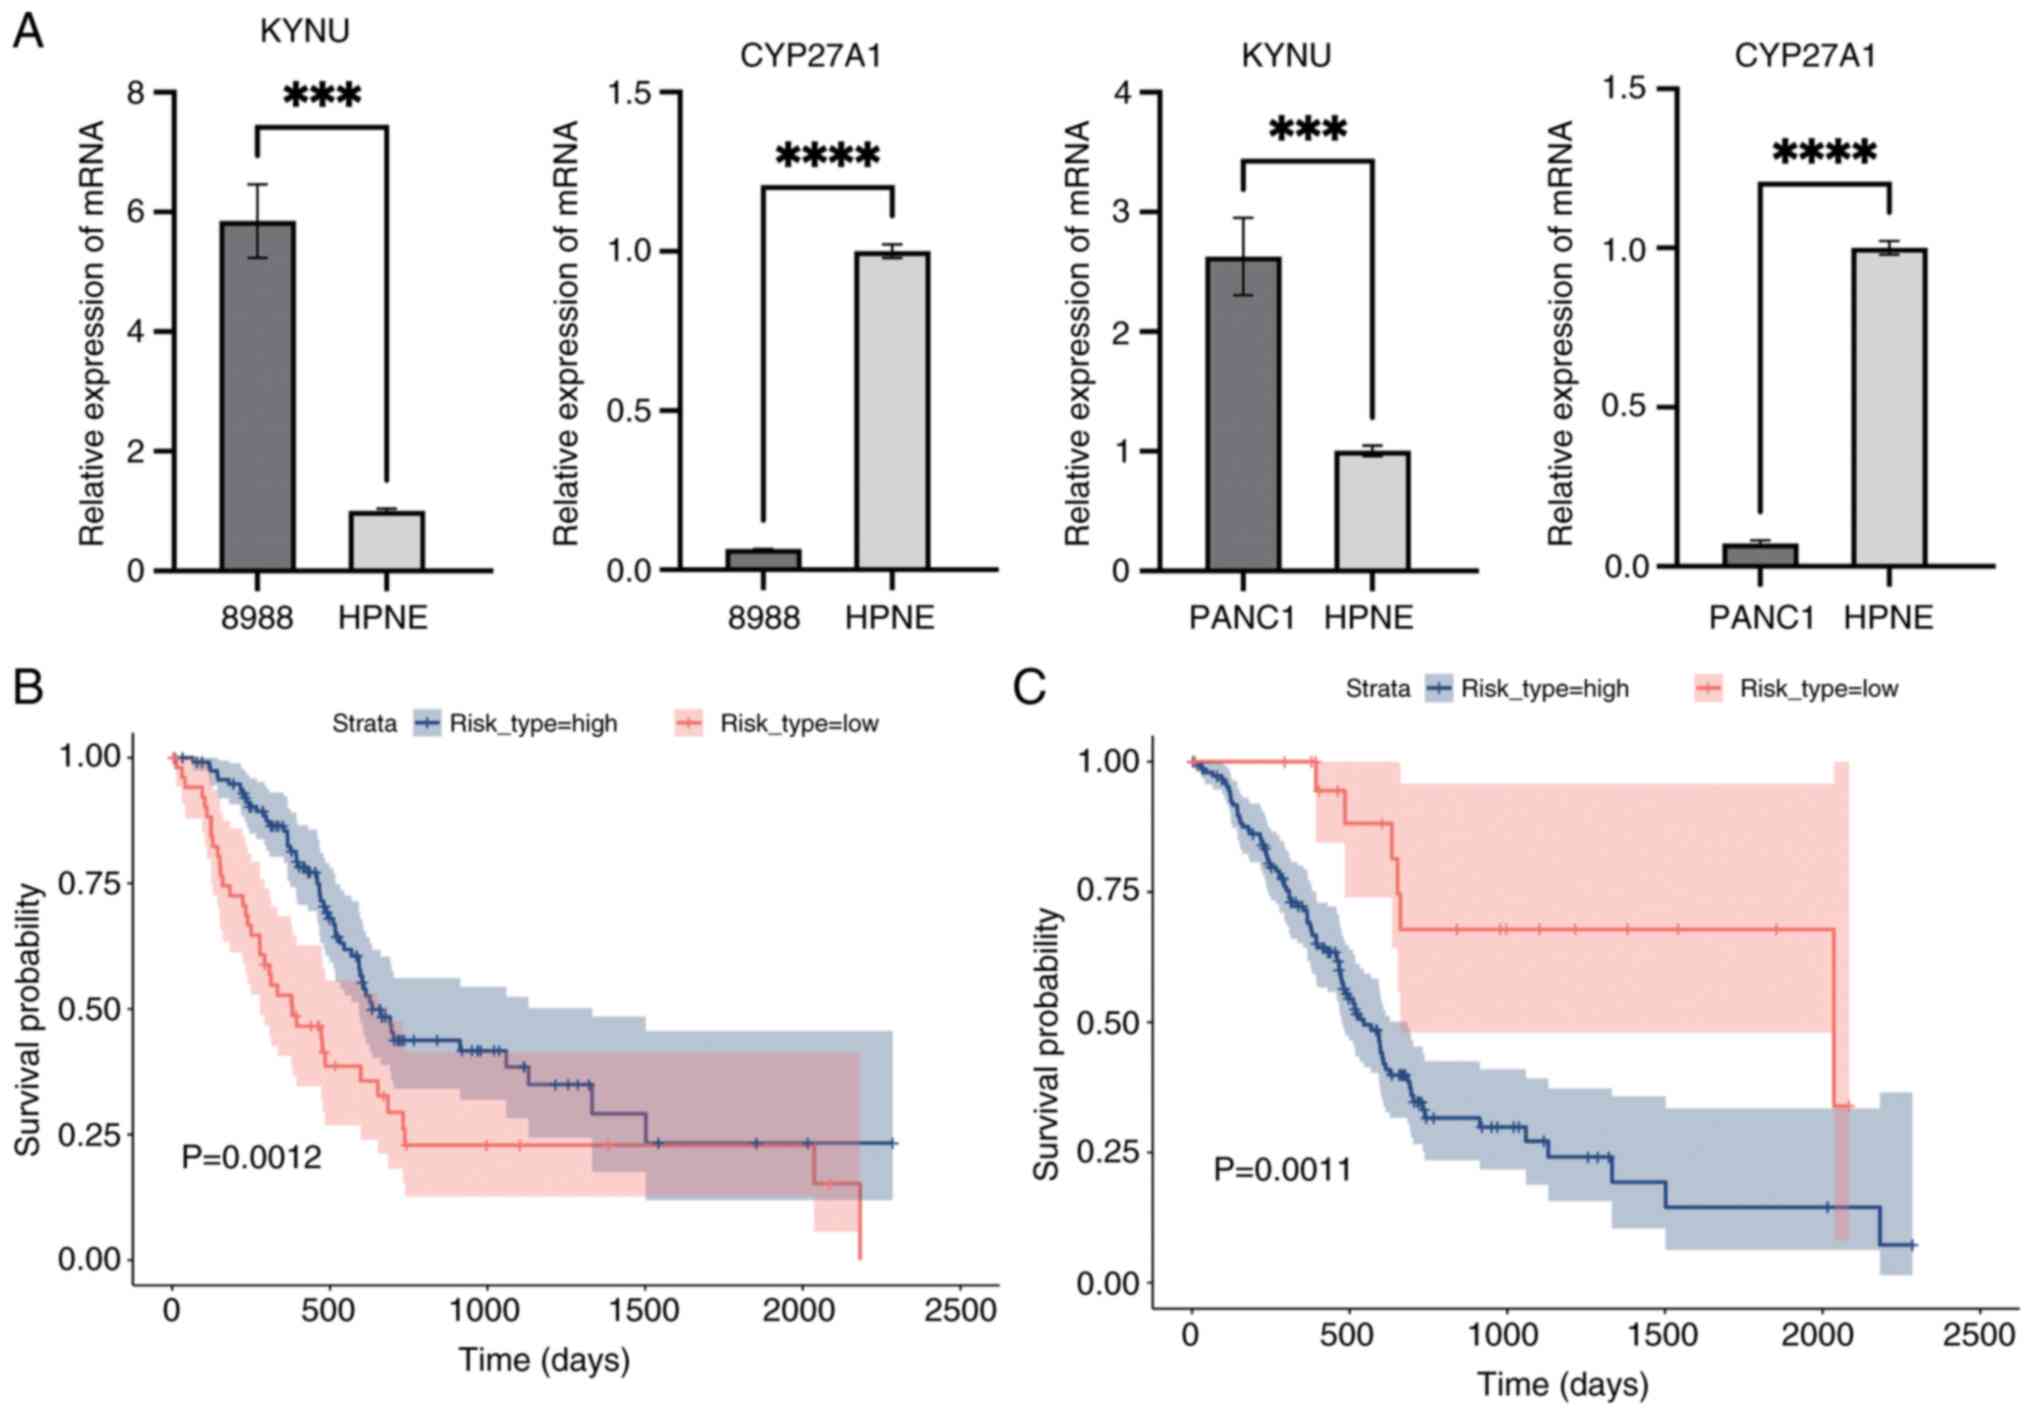
RT-qPCR and Kaplan-Meier
validation
Median expression levels of CYP27A1, identified as a
protective gene, and KYNU, recognized as a risk gene, were used to
categorize the training cohort into high- and low-risk groups
(Fig. 16A). Kaplan-Meier survival
analysis then was performed to evaluate survival differences
between these groups using the survival package, followed by
log-rank tests to compare their survival outcomes (P<0.05;
Fig. 16B and C). Fig. 16B and C present Kaplan-Meier
survival curves comparing the survival outcomes of high-risk and
low-risk groups based on the expression levels of CYP27A1 and KYNU.
In both figures, the x-axis represents time in days, and the y-axis
represents the survival probability. The blue line indicates the
survival curve for the high-risk group, while the red line
indicates the survival curve for the low-risk group. The shaded
areas around the curves represent the 95% confidence intervals.
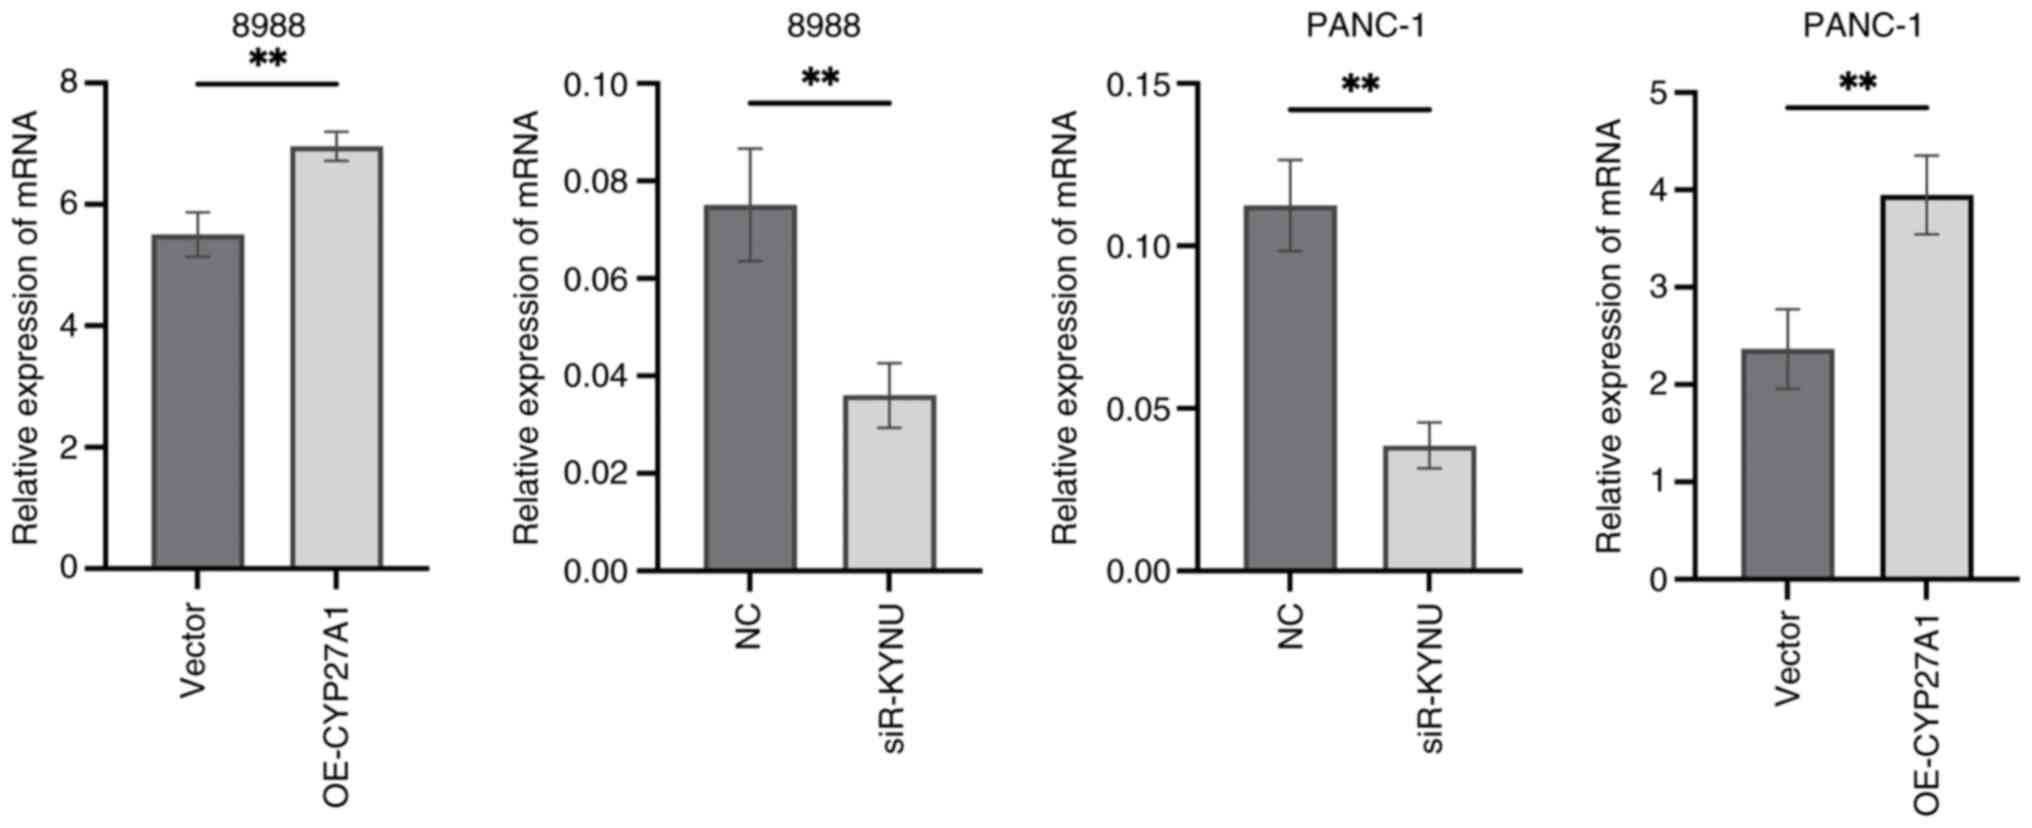
Validation of transfection
efficiency
To assess the effectiveness of transfection, RT-qPCR
results demonstrated that KYNU expression was significantly reduced
in si-KYNU-transfected cells, whilst CYP27A1 expression was
markedly increased following plasmid overexpression, compared with
their respective controls (Fig.
17).
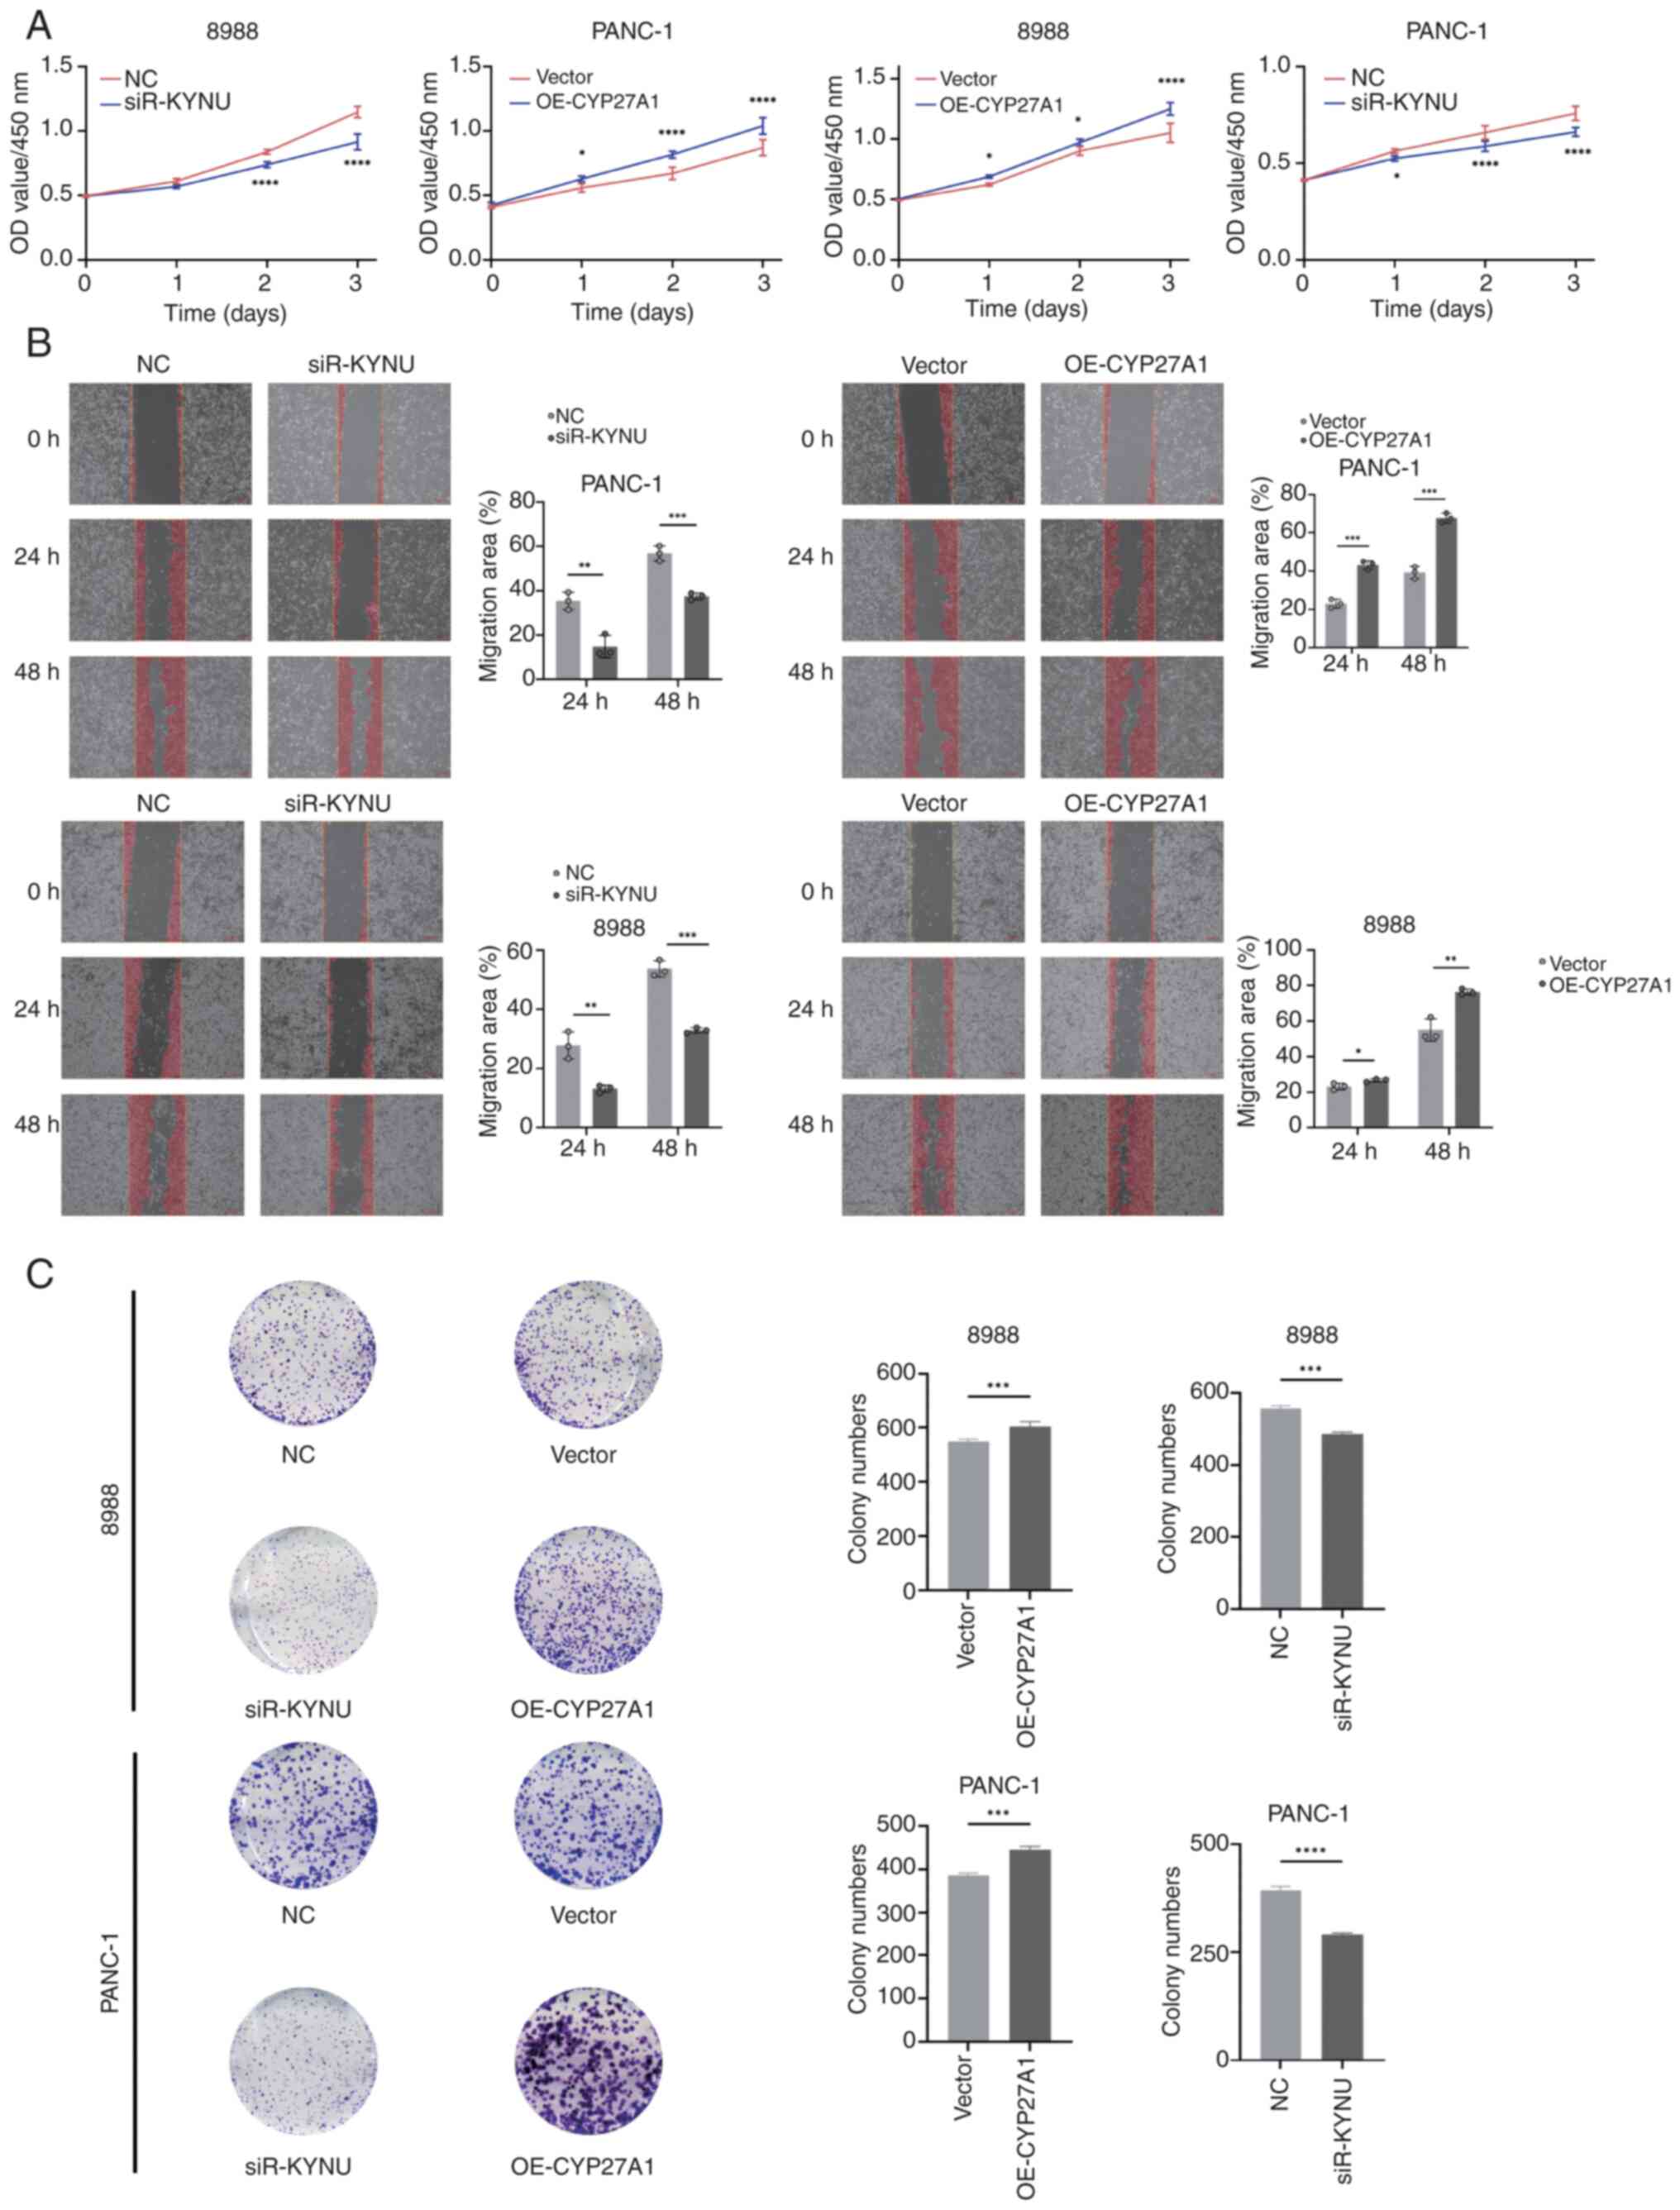
KYNU knockdown inhibits and CYP27A1
overexpression promotes PDAC proliferation and migration
CCK-8 assays were performed to assess the effects of
KYNU knockdown and CYP27A1 overexpression on PDAC cell
proliferation in 8988 and PANC-1 cells, revealing significant
inhibition of proliferation with KYNU knockdown and enhanced
proliferation with CYP27A1 overexpression compared with controls
(Fig. 18A). WHAs indicated that
KYNU knockdown in both cell lines significantly reduced migration
rates at 24 and 48 h compared with the NC group, whilst CYP27A1
overexpression significantly increased the rate of migration in
PANC-1 cells (Fig. 18B).
Additional experiments in the two cell lines most affected by KYNU
knockdown or CYP27A1 overexpression demonstrated that siR-KYNU
significantly suppressed clonogenic capacity, whereas OE-CYP27A1
significantly increased proliferation compared with controls
(Fig. 18C).
Discussion
The results of the GSEA analysis in the present
study highlight the potential roles of Mn metabolism-related genes
in PDAC pathogenesis. The enrichment of metabolic pathways such as
‘2-Oxocarboxylic acid metabolism’ in both the overall and
downregulated gene sets suggests a disruption in core metabolic
functions. Meanwhile, the enrichment of immune-related pathways in
the upregulated gene set indicates that altered Mn metabolism may
also influence immune responses and inflammation in PDAC. The
interplay of these dual aspects highlights the intricate nature of
Mn metabolism within tumor biology, laying the groundwork for
subsequent investigations aimed at developing targeted therapeutic
approaches. The present study employed bioinformatics techniques
alongside transcriptomic data sourced from the GEO and TCGA
databases to identify biomarkers associated with Mn metabolism that
may serve as prognostic indicators for PDAC. Through the
application of differential expression analysis, LASSO regression
and multifactorial Cox regression models, 12 significant genes were
identified that exhibit a strong correlation with the prognosis of
PDAC. The validation of these prognostic genes, performed with both
the training cohort and external datasets (GSE62452 and GSE28735),
reinforced the robustness and clinical relevance of the model in
the present study, which demonstrated AUCs of 0.82 and 0.83 for the
training and external validation sets, respectively. The results
provide valuable understanding of the molecular mechanisms at play
in PDAC and underscore the possible role of Mn metabolism in the
advancement of this aggressive cancer type.
Mn, a vital trace element, is recognized for its
critical involvement in numerous biological functions, such as
regulating OS, mediating cellular signaling and supporting
metabolic pathways. Serving as a cofactor for enzymes like MnSOD,
Mn is crucial for maintaining cellular integrity by counteracting
ROS and minimizing OS (31).
Imbalances in Mn metabolism, whether caused by deficiency or
excess, can disrupt vital biological pathways, resulting in
cellular stress and potentially contributing to the onset of cancer
(32,33).
The present study contributes to the growing body of
evidence suggesting that Mn metabolism is disrupted in several
cancers, including PDAC. For example, studies have indicated that
Mn deficiency can activate the tumor suppressor protein p53,
leading to mitochondrial-induced apoptosis and genomic instability
(34–36). Similarly, excess Mn has been
associated with neurodegenerative diseases, but its role in cancer
progression is becoming a topic of increasing interest. Previous
work has highlighted Mn as a critical player in modulating immune
responses and TME composition, which are critical factors in PDAC
progression (37).
The genes identified in the present study are
involved in several BPs crucial to PDAC pathogenesis, including
cell adhesion, extracellular matrix remodeling, immune modulation
and inflammation. For example, CXCL10, a chemokine that mediates
immune cell recruitment, has been reported to regulate the PDAC
microenvironment. It can facilitate tumor progression by attracting
immune cells like T-cells and natural killer cells, which serve a
dual role in either controlling or exacerbating tumor growth
depending on the context (38). The
analysis in the present study identified CXCL10 as a crucial
biomarker, underscoring its potential role as both a prognostic
marker and a possible therapeutic target for PDAC.
MMP3 is another significant gene recognized in the
present analysis. MMP3 serves a crucial role in the degradation of
the extracellular matrix (ECM) and is associated with notable
processes in cancer development, such as tumor invasion, metastasis
and epithelial-to-mesenchymal transition, which is vital for the
metastatic dissemination of PDAC (39,40).
The upregulation of MMP3 expression has been associated with
adverse prognoses in multiple cancer types, notably PDAC (40). Its involvement in the remodeling of
the ECM further validates its role as a significant feature gene in
the predictive model in the present study.
MET, a receptor tyrosine kinase, serves a critical
role in regulating cellular processes such as proliferation,
survival and migration by interacting with its ligand, hepatocyte
growth factor. Alterations in MET signaling pathways have been
frequently reported in numerous cancer types, including PDAC, where
it contributes to tumor progression, invasiveness and metastatic
spread (41,42). In the present study, MET was
identified as a crucial biomarker, reflecting its established
involvement in PDAC. This finding highlights the potential of
targeting MET with inhibitors, which are currently being evaluated
in clinical trials (42).
The immune microenvironment is fundamental in the
development of PDAC, a type of cancer well-known for its capacity
to escape immune detection. The immune-related analyses in the
present study emphasize the importance of the immune system in PDAC
prognosis, particularly through the influence of the identified
biomarkers on immune cell infiltration and tumor immune escape.
Recent studies indicate that the PDAC immune microenvironment is
characterized by T-cell dysfunction and expansion of
myeloid-derived suppressor cells, both of which substantially
contribute to therapeutic resistance (43). The genes identified in the present
study may serve as important mediators in these processes and
provide valuable insights into how Mn metabolism influences immune
modulation in PDAC.
Moreover, the gene CYP27A1, which encodes a
cytochrome P450 enzyme involved in sterol metabolism, was
demonstrated to be differentially expressed in PDAC tissues.
Although its precise function in cancer remains unclear, earlier
research emphasized its possible role in regulating immune
responses via cholesterol metabolism processes (44). This indicates that disruptions in
lipid metabolism, common in cancer cells, may also affect immune
cell function and contribute to PDAC progression (45).
In addition to gene expression analysis, a GGI
network was constructed to predict functional relationships between
the identified biomarkers and their potential regulatory
mechanisms. This analysis identified several key interactions that
may clarify how these genes collectively contribute to PDAC
pathogenesis. For example, NPPA has been associated with the
regulation of blood pressure and vascular function, and recent
studies have reported its involvement in the regulation of tumor
angiogenesis (46–50). PPP2R2B, a regulatory component of
protein phosphatase 2A, is involved in several signaling cascades,
particularly those pertaining to cell cycle regulation and
programmed cell death. This suggests its potential contribution to
sustaining the survival of tumor cells in PDAC (51). These findings underscore the
complexity of the regulatory networks that govern PDAC progression
and highlight the need for further investigation into how these
pathways intersect.
Although the present research provides new
perspectives on the prognostic significance of genes related to Mn
metabolism in PDAC, certain limitations must be acknowledged.
Whilst the risk model in the present study demonstrated a robust
performance in independent validation, its applicability to
non-Western populations requires further study due to potential
genetic and environmental heterogeneity. One of the key limitations
is that the findings are primarily based on transcriptomic data,
meaning the predictive model developed may not entirely capture the
intricate biological characteristics of PDAC. The expression of RNA
does not consistently align with the levels of protein or its
functional activity. Additionally, post-translational
modifications, including processes like phosphorylation and
glycosylation, can alter the functional roles of the genes
identified (52,53). Therefore, experimental validation
using techniques such as western blotting, immunohistochemistry and
mass spectrometry is essential to confirm the expression and
functional relevance of these biomarkers in PDAC tissues.
Furthermore, although external validation datasets (GSE62452 and
GSE28735) were used to evaluate the accuracy of the predictive
model, the diversity present in public datasets may introduce
variability in the outcomes. This variability may stem from
differences in sample collection methods, patient populations and
technical platforms used, which can introduce biases that affect
the generalizability of the findings. Future studies should aim to
validate the identified biomarkers in large, independent cohorts
and in clinical settings. Finally, the molecular mechanisms
underlying Mn metabolism in PDAC remain incompletely understood.
Although the present study provides valuable information about gene
expression patterns and potential pathways, the interaction between
Mn metabolism, OS and immune modulation requires further
exploration. By incorporating multi-omics strategies, including
proteomics, metabolomics and single-cell RNA sequencing, a deeper
and more holistic insight can be gained into the role of Mn
metabolism in shaping PDAC biology across several layers (54,55).
Prospective collaborations with multi-institutional cohorts across
diverse geographical regions will be essential to validate and
refine the biomarker panel in the present study.
In summary, the results of the present research
offers insights into the involvement of Mn metabolism-associated
genes in the prognosis of PDAC. The 12 biomarkers identified
through bioinformatics analysis provide a promising foundation for
developing a prognostic risk model for PDAC, which could assist in
patient stratification and guide treatment decisions. Furthermore,
the biological functions and potential regulatory mechanisms of
these biomarkers illuminate the complex processes involved in PDAC
progression, highlighting the need for further experimental
validation. By exploring the interplay between Mn metabolism,
immune modulation and cancer progression, the present research
opens new avenues for targeted therapies and precision medicine in
PDAC.
Supplementary Material
Supporting Data
Supporting Data
Supporting Data
Supporting Data
Supporting Data
Acknowledgements
Not applicable.
Funding
The present study was supported by the Science and Technology
Commission of Shanghai Municipality (grant nos. 19401935000 and
20Y21901600) and the Shanghai ‘14th Five-Year Plan’ Chinese
Medicine Specialty Construction Project (grant no. ZYTSZK2-2)
Availability of data and materials
The datasets analyzed during the current study are
available in the following repositories. TCGA-PDAC dataset: TCGA.
Validation datasets: GEO under accession numbers GSE62452 and
GSE28735. Drug sensitivity data (IC50 values) were
obtained from the GDSC database (https://www.cancerRxgene.org/), which requires
registration for access. The custom data generated in the present
study may be requested from the corresponding author.
Authors' contributions
SC and SL contributed to the conceptualization and
design of the study and revised the manuscript. ZX performed data
analysis and drafted the manuscript. ZZ performed data analysis,
interpreted the results and assisted in manuscript writing. All
authors read and approved the final manuscript. ZX and ZZ confirm
the authenticity of all the raw data.
Ethics approval and consent to
participate
Not applicable.
Patient consent for publication
Not applicable.
Competing interests
The authors declare that they have no competing
interests.
References
|
1
|
Siegel RL, Miller KD, Fuchs HE and Jemal
A: Cancer statistics, 2021. CA Cancer J Clin. 71:7–33. 2021.
View Article : Google Scholar : PubMed/NCBI
|
|
2
|
Rahib L, Smith BD, Aizenberg R, Rosenzweig
AB, Fleshman JM and Matrisian LM: Projecting cancer incidence and
deaths to 2030: The unexpected burden of thyroid, liver, and
pancreas cancers in the United States. Cancer Res. 74:2913–2921.
2014. View Article : Google Scholar : PubMed/NCBI
|
|
3
|
Chintamani Singhal V: Temporary closure of
open abdominal wounds by the modified sandwich-vacuum pack
technique (Br J Surg 2003; 90: 718–722). Br J Surg. 90:1452–1453.
2003. View Article : Google Scholar : PubMed/NCBI
|
|
4
|
Conroy T, Desseigne F, Ychou M, Bouché O,
Guimbaud R, Bécouarn Y, Adenis A, Raoul JL, Gourgou-Bourgade S, de
la Fouchardière C, et al: FOLFIRINOX versus gemcitabine for
metastatic pancreatic cancer. N Engl J Med. 364:1817–1825. 2011.
View Article : Google Scholar : PubMed/NCBI
|
|
5
|
Golan T, Hammel P, Reni M, Van Cutsem E,
Macarulla T, Hall MJ, Park JO, Hochhauser D, Arnold D, Oh DY, et
al: Maintenance olaparib for germline BRCA-mutated metastatic
pancreatic cancer. N Engl J Med. 381:317–327. 2019. View Article : Google Scholar : PubMed/NCBI
|
|
6
|
Raghavan D: Introduction: Bladder cancer.
Semin Oncol. 39:5232012. View Article : Google Scholar : PubMed/NCBI
|
|
7
|
Li D, Xie K, Wolff R and Abbruzzese JL:
Pancreatic cancer. Lancet. 363:1049–1057. 2004. View Article : Google Scholar : PubMed/NCBI
|
|
8
|
Von Hoff DD, Ervin T, Arena FP, Chiorean
EG, Infante J, Moore M, Seay T, Tjulandin SA, Ma WW, Saleh MN, et
al: Increased survival in pancreatic cancer with nab-paclitaxel
plus gemcitabine. N Engl J Med. 369:1691–1703. 2013. View Article : Google Scholar : PubMed/NCBI
|
|
9
|
Kanji ZS, Edwards AM, Mandelson MT, Sahar
N, Lin BS, Badiozamani K, Song G, Alseidi A, Biehl TR, Kozarek RA,
et al: Gemcitabine and taxane adjuvant therapy with chemoradiation
in resected pancreatic cancer: A novel strategy for improved
survival? Ann Surg Oncol. 25:1052–1060. 2018. View Article : Google Scholar : PubMed/NCBI
|
|
10
|
Olive KP, Jacobetz MA, Davidson CJ,
Gopinathan A, McIntyre D, Honess D, Madhu B, Goldgraben MA,
Caldwell ME, Allard D, et al: Inhibition of hedgehog signaling
enhances delivery of chemotherapy in a mouse model of pancreatic
cancer. Science. 324:1457–1461. 2009. View Article : Google Scholar : PubMed/NCBI
|
|
11
|
Grant TJ, Hua K and Singh A: Molecular
pathogenesis of pancreatic cancer. Prog Mol Biol Transl Sci.
144:241–275. 2016. View Article : Google Scholar : PubMed/NCBI
|
|
12
|
Duan H, Li L and He S: Advances and
prospects in the treatment of pancreatic cancer. Int J
Nanomedicine. 18:3973–3988. 2023. View Article : Google Scholar : PubMed/NCBI
|
|
13
|
Liu J, Ji S, Liang C, Qin Y, Jin K, Liang
D, Xu W, Shi S, Zhang B, Liu L, et al: Critical role of oncogenic
KRAS in pancreatic cancer (review). Mol Med Rep. 13:4943–4949.
2016. View Article : Google Scholar : PubMed/NCBI
|
|
14
|
Sun H, Zhang B and Li H: The roles of
frequently mutated genes of pancreatic cancer in regulation of
tumor microenvironment. Technol Cancer Res Treat.
19:15330338209209692020. View Article : Google Scholar : PubMed/NCBI
|
|
15
|
Hafezi S, Saber-Ayad M and Abdel-Rahman
WM: Highlights on the role of KRAS mutations in reshaping the
microenvironment of pancreatic adenocarcinoma. Int J Mol Sci.
22:102192021. View Article : Google Scholar : PubMed/NCBI
|
|
16
|
George B, Kudryashova O, Kravets A, Thalji
S, Malarkannan S, Kurzrock R, Chernyavskaya E, Gusakova M,
Kravchenko D, Tychinin D, et al: Transcriptomic-based
microenvironment classification reveals precision medicine
strategies for pancreatic ductal adenocarcinoma. Gastroenterology.
166:859–871.e3. 2024. View Article : Google Scholar : PubMed/NCBI
|
|
17
|
Bear AS, Vonderheide RH and O'Hara MH:
Challenges and opportunities for pancreatic cancer immunotherapy.
Cancer Cell. 38:788–802. 2020. View Article : Google Scholar : PubMed/NCBI
|
|
18
|
Le DT, Uram JN, Wang H, Bartlett BR,
Kemberling H, Eyring AD, Skora AD, Luber BS, Azad NS, Laheru D, et
al: PD-1 blockade in tumors with mismatch-repair deficiency. N Engl
J Med. 372:2509–2520. 2015. View Article : Google Scholar : PubMed/NCBI
|
|
19
|
Baj J, Flieger W, Barbachowska A, Kowalska
B, Flieger M, Forma A, Teresiński G, Portincasa P, Buszewicz G,
Radzikowska-Büchner E and Flieger J: Consequences of disturbing
manganese homeostasis. Int J Mol Sci. 24:149592023. View Article : Google Scholar : PubMed/NCBI
|
|
20
|
Lin M, Colon-Perez LM, Sambo DO, Miller
DR, Lebowitz JJ, Jimenez-Rondan F, Cousins RJ, Horenstein N,
Aydemir TB, Febo M and Khoshbouei H: Mechanism of manganese
dysregulation of dopamine neuronal activity. J Neurosci.
40:5871–5891. 2020. View Article : Google Scholar : PubMed/NCBI
|
|
21
|
Yanjun Y, Jing Z, Yifei S, Gangzhao G,
Chenxin Y, Qiang W, Qiang Y and Shuwen H: Trace elements in
pancreatic cancer. Cancer Med. 13:e74542024. View Article : Google Scholar : PubMed/NCBI
|
|
22
|
Zhao N, Zhang AS, Wortham AM, Jue S,
Knutson MD and Enns CA: The tumor suppressor, P53, decreases the
metal transporter, ZIP14. Nutrients. 9:13352017. View Article : Google Scholar : PubMed/NCBI
|
|
23
|
Konzack A, Jakupovic M, Kubaichuk K,
Görlach A, Dombrowski F, Miinalainen I, Sormunen R and Kietzmann T:
Mitochondrial dysfunction due to lack of manganese superoxide
dismutase promotes hepatocarcinogenesis. Antioxid Redox Signal.
23:1059–1075. 2015. View Article : Google Scholar : PubMed/NCBI
|
|
24
|
Wu J, Minikes AM, Gao M, Bian H, Li Y,
Stockwell BR, Chen ZN and Jiang X: Intercellular interaction
dictates cancer cell ferroptosis via NF2-YAP signalling. Nature.
572:402–406. 2019. View Article : Google Scholar : PubMed/NCBI
|
|
25
|
Saleh SAK, Adly HM, Abdelkhaliq AA and
Nassir AM: Serum levels of selenium, zinc, copper, manganese, and
iron in prostate cancer patients. Curr Urol. 14:44–49. 2020.
View Article : Google Scholar : PubMed/NCBI
|
|
26
|
Wang W, Chen G, Zhang W, Zhang X, Huang M,
Li C, Wang L, Lu Z and Xia J: The crucial prognostic signaling
pathways of pancreatic ductal adenocarcinoma were identified by
single-cell and bulk RNA sequencing data. Hum Genet. 143:1109–1129.
2024. View Article : Google Scholar : PubMed/NCBI
|
|
27
|
Xu X, Peng Q, Jiang X, Tan S, Yang Y, Yang
W, Han Y, Chen Y, Oyang L, Lin J, et al: Metabolic reprogramming
and epigenetic modifications in cancer: From the impacts and
mechanisms to the treatment potential. Exp Mol Med. 55:1357–1370.
2023. View Article : Google Scholar : PubMed/NCBI
|
|
28
|
Zhou Z, Cheng Y, Jiang Y, Liu S, Zhang M,
Liu J and Zhao Q: Ten hub genes associated with progression and
prognosis of pancreatic carcinoma identified by co-expression
analysis. Int J Biol Sci. 14:124–36. 2018. View Article : Google Scholar : PubMed/NCBI
|
|
29
|
Xiang XH, Mao J and Li H: Expression and
clinical significance of centromere protein A in pancreatic cancer
based on GEO and TCGA database analysis. Chin J Pancreatol.
20:184–189. 2020.(In Chinese).
|
|
30
|
Livak KJ and Schmittgen TD: Analysis of
relative gene expression data using real-time quantitative PCR and
the 2(−delta delta C(T)) method. Methods. 25:402–408. 2001.
View Article : Google Scholar : PubMed/NCBI
|
|
31
|
Sahoo K and Sharma A: Understanding the
mechanistic roles of environmental heavy metal stressors in
regulating ferroptosis: Adding new paradigms to the links with
diseases. Apoptosis. 28:277–292. 2023. View Article : Google Scholar : PubMed/NCBI
|
|
32
|
Rozenberg JM, Kamynina M, Sorokin M,
Zolotovskaia M, Koroleva E, Kremenchutckaya K, Gudkov A, Buzdin A
and Borisov N: The role of the metabolism of zinc and manganese
ions in human cancerogenesis. Biomedicines. 10:10722022. View Article : Google Scholar : PubMed/NCBI
|
|
33
|
Diessl J, Berndtsson J, Broeskamp F,
Habernig L, Kohler V, Vazquez-Calvo C, Nandy A, Peselj C,
Drobysheva S, Pelosi L, et al: Manganese-driven CoQ deficiency. Nat
Commun. 13:60612022. View Article : Google Scholar : PubMed/NCBI
|
|
34
|
Zhang J and Chen X: p53 tumor suppressor
and iron homeostasis. FEBS J. 286:620–629. 2019. View Article : Google Scholar : PubMed/NCBI
|
|
35
|
Ichim G, Lopez J, Ahmed SU, Muthalagu N,
Giampazolias E, Delgado ME, Haller M, Riley JS, Mason SM, Athineos
D, et al: Limited mitochondrial permeabilization causes DNA damage
and genomic instability in the absence of cell death. Mol Cell.
57:860–872. 2015. View Article : Google Scholar : PubMed/NCBI
|
|
36
|
Alaimo A, Gorojod RM, Miglietta EA,
Villarreal A, Ramos AJ and Kotler ML: Manganese induces
mitochondrial dynamics impairment and apoptotic cell death: A study
in human Gli36 cells. Neurosci Lett. 554:76–81. 2013. View Article : Google Scholar : PubMed/NCBI
|
|
37
|
Stelling MP, Soares MA, Cardoso SC, Motta
JM, de Abreu JC, Antunes MJM, de Freitas VG, Moraes JA,
Castelo-Branco MTL, Pérez CA and Pavão MSG: Manganese systemic
distribution is modulated in vivo during tumor progression and
affects tumor cell migration and invasion in vitro. Sci Rep.
11:158332021. View Article : Google Scholar : PubMed/NCBI
|
|
38
|
Pandey V, Fleming-Martinez A, Bastea L,
Doeppler HR, Eisenhauer J, Le T, Edenfield B and Storz P:
CXCL10/CXCR3 signaling contributes to an inflammatory
microenvironment and its blockade enhances progression of murine
pancreatic precancerous lesions. Elife. 10:e606462021. View Article : Google Scholar : PubMed/NCBI
|
|
39
|
Gobin E, Bagwell K, Wagner J, Mysona D,
Sandirasegarane S, Smith N, Bai S, Sharma A, Schleifer R and She
JX: A pan-cancer perspective of matrix metalloproteases (MMP) gene
expression profile and their diagnostic/prognostic potential. BMC
Cancer. 19:5812019. View Article : Google Scholar : PubMed/NCBI
|
|
40
|
Luan H, Jian L, Huang Y, Guo Y and Zhou L:
Identification of novel therapeutic target and prognostic biomarker
in matrix metalloproteinase gene family in pancreatic cancer. Sci
Rep. 13:172112023. View Article : Google Scholar : PubMed/NCBI
|
|
41
|
Fu J, Su X, Li Z, Deng L, Liu X, Feng X
and Peng J: HGF/c-MET pathway in cancer: From molecular
characterization to clinical evidence. Oncogene. 40:4625–4651.
2021. View Article : Google Scholar : PubMed/NCBI
|
|
42
|
Guo R, Luo J, Chang J, Rekhtman N, Arcila
M and Drilon A: MET-dependent solid tumours-molecular diagnosis and
targeted therapy. Nat Rev Clin Oncol. 17:569–587. 2020. View Article : Google Scholar : PubMed/NCBI
|
|
43
|
Nie Y, Liu C, Liu Q and Zhu X: CXCL10 is a
prognostic marker for pancreatic adenocarcinoma and tumor
microenvironment remodeling. BMC Cancer. 23:1502023. View Article : Google Scholar : PubMed/NCBI
|
|
44
|
He S, Ma L, Baek AE, Vardanyan A, Vembar
V, Chen JJ, Nelson AT, Burdette JE and Nelson ER: Host CYP27A1
expression is essential for ovarian cancer progression. Endocr
Relat Cancer. 26:659–675. 2019. View Article : Google Scholar : PubMed/NCBI
|
|
45
|
Niu N, Shen X, Wang Z, Chen Y, Weng Y, Yu
F, Tang Y, Lu P, Liu M, Wang L, et al: Tumor cell-intrinsic
epigenetic dysregulation shapes cancer-associated fibroblasts
heterogeneity to metabolically support pancreatic cancer. Cancer
Cell. 42:869–884.e9. 2024. View Article : Google Scholar : PubMed/NCBI
|
|
46
|
Newton-Cheh C, Larson MG, Vasan RS, Levy
D, Bloch KD, Surti A, Guiducci C, Kathiresan S, Benjamin EJ, Struck
J, et al: Association of common variants in NPPA and NPPB with
circulating natriuretic peptides and blood pressure. Nat Genet.
41:348–353. 2009. View
Article : Google Scholar : PubMed/NCBI
|
|
47
|
Forte M, Marchitti S, Di Nonno F,
Stanzione R, Schirone L, Cotugno M, Bianchi F, Schiavon S, Raffa S,
Ranieri D, et al: NPPA/atrial natriuretic peptide is an
extracellular modulator of autophagy in the heart. Autophagy.
19:1087–1099. 2023. View Article : Google Scholar : PubMed/NCBI
|
|
48
|
Song P, Yao X, Zhong T, Zhang S, Guo Y,
Ren W, Huang D, Duan XC, Yin YF, Zhang SS and Zhang X: The
anti-tumor efficacy of 3-(2-nitrophenyl) propionic acid-paclitaxel
(NPPA-PTX): A novel paclitaxel bioreductive prodrug. Oncotarget.
7:48467–48480. 2016. View Article : Google Scholar : PubMed/NCBI
|
|
49
|
Song W, Wang H and Wu Q: Atrial
natriuretic peptide in cardiovascular biology and disease (NPPA).
Gene. 569:1–6. 2015. View Article : Google Scholar : PubMed/NCBI
|
|
50
|
Luan Y, Xie B and Wei W: REST-repressed
lncRNA NPPA-AS1 regulates cervical cancer progression by modulating
miR-302e/DKK1/wnt/β-catenin signaling pathway. J Cell Biochem.
122:16–28. 2021. View Article : Google Scholar : PubMed/NCBI
|
|
51
|
Malvi P, Chava S, Cai G, Hu K, Zhu LJ,
Edwards YJK, Green MR, Gupta R and Wajapeyee N: HOXC6 drives a
therapeutically targetable pancreatic cancer growth and metastasis
pathway by regulating MSK1 and PPP2R2B. Cell Rep Med. 4:1012852023.
View Article : Google Scholar : PubMed/NCBI
|
|
52
|
Li J, Zhang Y, Yang C and Rong R:
Discrepant mRNA and protein expression in immune cells. Curr
Genomics. 21:560–563. 2020. View Article : Google Scholar : PubMed/NCBI
|
|
53
|
Ramazi S and Zahiri J: Posttranslational
modifications in proteins: Resources, tools and prediction methods.
Database (Oxford). 2021:baab0122021. View Article : Google Scholar : PubMed/NCBI
|
|
54
|
Nalbantoglu S and Karadag A: Metabolomics
bridging proteomics along metabolites/oncometabolites and protein
modifications: Paving the way toward integrative multiomics. J
Pharm Biomed Anal. 199:1140312021. View Article : Google Scholar : PubMed/NCBI
|
|
55
|
Gautam SK, Batra SK and Jain M: Molecular
and metabolic regulation of immunosuppression in metastatic
pancreatic ductal adenocarcinoma. Mol Cancer. 22:1182023.
View Article : Google Scholar : PubMed/NCBI
|