Introduction
Non-small cell lung cancer (NSCLC) is primarily
divided into two major subtypes: Lung adenocarcinoma (LUAD) and
lung squamous cell carcinoma (LUSC). Among these, LUAD is the more
common form, representing 40–50% of NSCLC cases. The incidence of
LUAD has increased significantly, with prevalence rates reaching
39% in males and 57% in females in 2020, according to a global
population-based study (1),
particularly among non-smokers (2).
By contrast, LUSC, which is associated with smoking, accounts for
25–30% of NSCLC cases (3), and its
occurrence has decreased in line with lower smoking rates (4). For early-stage LUAD (stages I and II),
surgery remains the primary treatment modality, whereas patients
with EGFR mutations may benefit from targeted therapies (5). However, for more advanced stages (III
and IV), LUAD typically requires a combination of chemotherapy,
targeted therapy and immunotherapy (6,7).
Furthermore, the 5-year survival rate for patients with advanced
LUAD is generally <30%, with certain cases at <5% (8). This highlights the need for the
development of genetic signatures that can guide treatment
decisions and predict patient outcomes.
Mitochondrial genes associated with cuproptosis are
key factors in the progression of LUAD, making them potential
prognostic biomarkers (9).
Cuproptosis is a form of programmed cell death (PCD) induced by the
accumulation of copper ions (Cu2+), and there is an
increased demand for Cu2+ during tumor development and
metastasis (10). Excessive copper
accumulation leads to oxidative stress, lipid peroxidation and
damage to essential cellular components, ultimately resulting in
cell death. However, tumor cells require metal ions for metabolic
processes, and targeting metal ions presents notable potential for
future therapeutic research (11).
A total of three primary mechanisms underlie cuproptosis: i)
Oxidative stress, where copper ions catalyze the Fenton reaction,
generating reactive oxygen species (ROS) that damage cell
membranes, proteins and DNA; ii) mitochondrial dysfunction, where
excess copper ions impair mitochondrial function, reduce ATP
production and release cytokines, triggering cell death; and iii)
lipid peroxidation, where copper ions induce lipid peroxidation,
disrupting the cell membrane and leading to cell death (12). Mitochondria and their associated
genes serve pivotal roles in cellular energy metabolism and
apoptosis, impacting tumor cell proliferation, migration and
invasion (13). Moreover,
mitochondria are crucial for LUAD progression, particularly under
hypoxic conditions where they support rapid tumor growth through
mitochondrial glycolysis, a phenomenon known as the Warburg effect
(14). In LUAD cells, mitochondrial
dysfunction enhances resistance to oxidative stress and disrupts
mitochondrial membrane integrity, which in turn affects the balance
of Bcl-2 family proteins and facilitates evasion of apoptosis,
ultimately contributing to an uncontrolled cell cycle (15). Cuproptosis influences mitochondrial
membrane permeability and electron transport chain activity,
altering oxidative stress tolerance. Additionally, copper-induced
cell death leads to mitochondrial dysfunction by binding copper
ions to specific mitochondrial proteins, such as fatty acid
synthase and proteins involved in the tricarboxylic acid cycle
(16). Therefore, both cuproptosis
and mitochondrial function serve central roles in the invasion,
metastasis and immune evasion of LUAD cells, markedly influencing
patient prognosis.
Despite the aforementioned findings, no studies to
date have explored the prognostic impact of cuproptosis-related
mitochondrial genes in LUAD, to the best of our knowledge.
Therefore, the present study aimed to identify such genes to
construct a prognostic model, and to further assess the prognostic
value of these genes in patients with LUAD by analyzing immune cell
infiltration, tumor gene mutations and drug sensitivity.
Materials and methods
Data acquisition
LUAD sample data were obtained from The Cancer
Genome Atlas (TCGA) database (https://portal.gdc.cancer.gov), which provides gene
expression profiles and clinical data for 489 patients with LUAD
and 59 adjacent normal tissue samples (17). To retrieve TCGA-LUAD dataset, the
official TCGA website was accessed and the data repository page was
entered by selecting the ‘Repository’ tab and clicking on ‘Explore
Our Cancer Datasets’. Using the ‘Cohort Builder’, the ‘Program’
field was expanded, and TCGA and LUAD were selected. Further
filtering was then performed by re-entering the ‘Repository’
section and selecting ‘RNA-Seq’, ‘STAR Counts’ and ‘Open access’
under the ‘Experimental Strategy’ filter. All relevant files were
subsequently added to the cart and downloaded using the ‘Download’
option. After acquisition, data cleaning and preprocessing were
performed, including gene symbol conversion. For duplicate genes,
the average expression value was calculated, and the data were
transformed from Fragments Per Kilobase of exon Model per Million
Mapped Fragments (FPKM) to transcripts per kilobase million
followed by log2 transformation. The final dataset
included gene expression profiles for >50,000 genes and
comprehensive clinical information for 489 patients with LUAD,
which included sex, age, survival time, survival status, clinical
stage and tumor (T)-node (N)-metastasis (M) stage. The GSE26939,
GSE31210 and GSE72094 datasets were also retrieved from the Gene
Expression Omnibus (GEO; http://www.ncbi.nih.gov/geo), which provide gene
expression profiles and clinical survival data for 115, 226 and 398
patients, respectively. TCGA-LUAD dataset was used as the primary
training set, whilst the three GEO datasets were used for external
validation. The GSE26939, GSE31210, and GSE72094 datasets were
selected as they provide sufficient gene expression profiles and
comprehensive clinical information, especially survival time and
survival status: GSE26939 consists of gene expression data measured
using Agilent 44K microarrays and DNA copy number measurements
using Affymetrix 250K Sty and SNP6 microarrays from samples from
115 patients with LUAD (18);
GSE31210 involves the detection of EGFR, KRAS and ALK mutation
statuses in 226 patients with pathological stages I–II (19); and GSE72094 provides expression
sequencing of mutation-associated genes from tumor samples of 398
patients with LUAD, as well as data for tumor proliferation and
immune surveillance (20). Data
processing and visualization were performed using R software
(version 4.3.2; The R Foundation).
Acquisition of cuproptosis-related
mitochondrial and differential gene analysis
Based on previous studies, 13 cuproptosis-related
genes and 1,136 mitochondrial-related genes were identified
(21,22). Pearson correlation analysis was
performed using the ‘limma’ R package (version 3.54.1), which is
available from bioconductor.org/packages/limma (23,24).
To explore more potential cuproptosis-related mitochondrial genes,
genes with a correlation (cor) of >0.3 were selected as
cuproptosis-related mitochondrial genes (cor >0.3 was considered
to be strongly correlated) (25,26).
Differentially expressed genes (DEGs) were filtered based on the
criteria of |logFoldChange|≥1 and P<0.05. A Venn diagram was
created using the online tool jvenn (version 1.2.0,
jvenn.toulouse.inrae.fr/app/index.html) to show the overlap between
DEGs and mitochondrial genes in TCGA dataset.
Machine learning and risk score model
construction
A univariate Cox analysis was performed, and the
results were visualized using a forest plot. TCGA, GSE26939,
GSE31210 and GSE72094 datasets were combined for machine learning
analysis. A total of 10 machine learning algorithms and 117
algorithm combinations were used, and the best algorithm
combination was determined based on 10-fold cross-validation. The
best model was selected based on the highest average C-index value.
The 10 machine learning algorithms included the following: Least
Absolute Shrinkage and Selection Operator (LASSO) (26), Random Survival Forest (RSF)
(27), StepCox (28), Elastic Net (Enet) (29), Ridge (30), Generalized Boosted Regression
Modeling (GBM) (31), CoxBoost
(32), Cox Partial Least Squares
Regression (plsRcox) (33),
Supervised Principal Components (SuperPC) (34) and survival-Support Vector Machine
(survival-SVM) (35). Finally, a
risk score model was constructed using the LASSO + survival-SVM
algorithm based on the C-index value, and the optimal cutoff point
was determined (22). The machine
learning algorithms used are listed in Table I. A total of 22 prognostic genes
were identified. The λ.min value was used as the penalty parameter
for the LASSO machine learning model as λ.min ensures that more
prognostic genes are retained without compromising predictive
performance, allowing the exploration of the roles of more relevant
prognostic genes in LUAD prognosis and treatment (36). The code for the 117 machine learning
methods is provided in Data S1. The risk score was calculated by
applying the standardized expression values of the identified genes
and their respective coefficients, with the following formula: Risk
score=∑ (Coef × Expr), where Coef is the coefficient and Expr is
the FPKM for each gene. The code used to calculate the risk
coefficients is provided in Data S2. Survival analysis was
performed using the ‘survival’ R package (version 3.8–3,
CRAN.R-project.org/package=survival) (37), the ‘survminer’ package (version
0.5.0, available at http://CRAN.R–project.org/package=survminer)
(38), and the ‘ggplot2’ package
(version 3.5.2, available at http://CRAN.R–project.org/package=ggplot2)
(39). Kaplan-Meier analysis was
performed based on risk grouping to evaluate patient prognosis.
Patients were categorized into high- and low-risk groups based on
the median risk score.
 | Table I.Types of machine learning. |
Table I.
Types of machine learning.
| Algorithm | R package | (Refs.) |
|---|
| LASSO | glmnet | (26) |
| RSF |
RandomForestSRC | (27) |
| StepCox | survival | (28) |
| Enet | glmnet | (29) |
| Ridge | glmnet | (30) |
| GBM | gbm | (31) |
| CoxBoost | CoxBoost | (32) |
| plsRcox | plsRcox | (33) |
| SuperPC | superpc | (34) |
| survival-SVM | survivalsvm | (35) |
Nomogram construction based on risk
score model
A forest plot was used to present the impact of each
variable on the model, including P-values, hazard ratios (HRs) and
95% confidence intervals (CIs). A nomogram was constructed using
both univariate and multivariate Cox regression analyses of
clinical features and risk scores, using the ‘rms’ R package
(version 6.7-0, CRAN.R-project.org/package=rms) (40). Calibration curves were used to
assess the clinical applicability of the model. Receiver operating
characteristic (ROC) curves were employed to evaluate the
predictive accuracy of the model (22).
Tumor microenvironment (TME) and tumor
mutational burden (TMB) estimation based on risk score
Single-sample gene set enrichment analysis (ssGSEA)
normalized the gene expression profile within each sample and then
calculated the ssGSEA score for each gene set. ssGSEA analysis of
the gene expression profile from TCGA-LUAD dataset was performed to
quantitatively analyze the levels of immune cells and
immune-related pathways. The ssGSEA analysis code is provided in
Data S3. In this way, ssGSEA transforms the gene expression profile
of an individual sample into a gene set enrichment score matrix.
The gene sets used for immune infiltration analysis mainly came
from previously published studies and were downloaded from the
supplementary file of He et al (25). Additionally, these gene sets were
obtained by searching for the target pathway genes in the ‘Quick
Search’ section on the homepage of the TISIDB database (http://cis.hku.hk/TISIDB/index.php). These gene
sets are provided in Table SI. The
expression of interleukin (IL) and tumor necrosis factor (TNF) gene
families were compared between the high- and low-risk groups
(26). Additionally, a correlation
heatmap analysis of 22 model genes with immune cells and pathways
was generated. Moreover, the Tumor Immune Dysfunction and Exclusion
(TIDE) analysis was performed using the TIDE web platform (version
1.0, tide.dfci.harvard.edu) to predict the response of patients
with LUAD to immune checkpoint therapy by calculating immune
dysfunction, with a higher TIDE score indicating greater resistance
to immunotherapy (41). The
ESTIMATE algorithm (available at:
bioinformatics.mdanderson.org/estimate/) and the ‘estimate’ R
package (version 1.0.13) were used to evaluate stromal, immune, and
estimate scores to infer TME in each LUAD patient (42). The CIBERSORT algorithm (http://cibersort.stanford.edu/) and the ‘xCell’ R
package (version 1.1.0, xcell.ucsf.edu/) were used to analyze
immune cell infiltration and estimate the expression of 67 immune
cell subtypes in each patient (43,44).
In addition, tumor mutational burden (TMB), an important biomarker
for predicting tumor immune response, was calculated using the
‘maftools’ R package (version 2.24.0, available at http://bioconductor.org/packages/maftools) (36,45).
Drug sensitivity analysis
(IC50)
The association between prognostic genes and 198
drugs was assessed. Drugs were selected for analysis based on their
correlation with risk scores and prognostic genes, and a heatmap
was created. Drug sensitivity was assessed using the ‘oncoPredict’
R package (version 1.2, available at http://github.com/HuangLabUMN/oncoPredict) (46), whilst the ‘ggpubr’ package (version
0.6.1, rpkgs.datanovia.com/ggpubr/) was used for correlation
analysis (47). Subsequently, the
‘pheatmap’ (version 1.0.13, available at http://github.com/raivokolde/pheatmap) and ‘psych’
(version 2.5.6, available at personality-project.org/r/psych/)
packages were used to generate heatmaps (48,49).
Cell culture
A549 and PC9 human lung cancer cell lines, were
purchased from the Cell Bank of the Chinese Academy of Sciences
(Shanghai, China). The catalog numbers are as follows: A549 (Cat.
No. TCHu150) and PC9 (Cat. No. TCHu142). The cells were cultured in
RPMI 1640 medium (Gibco; Thermo Fisher Scientific, Inc.)
supplemented with 10% FBS (NEWZERUM; FBS-UE500, Uruguay) and 1%
penicillin/streptomycin solution. They were maintained in a
humidified incubator at 37°C with 5% CO2, and the
culture medium was replaced every 2–3 days. When cells reached 90%
confluence, they were digested with 0.25% trypsin-EDTA solution for
subsequent experiments.
Small interfering (si)RNA
transfection
siRNA was used to knockdown gene expression, with a
negative control (siNC). Superoxide dismutase 2 (SOD2) siRNA and
siNC were purchased from IBSBIO. The sequences used were as
follows: si-SOD2, 5′-GGUUCCUUUGACAAGUUUAAG-3′ and si-NC,
5′-UUCUCCGAACGUGUCACGUTT-3′. According to the manufacturer's
instructions, si-SOD2 was transfected into A549 and PC9 cells using
Lipofectamine™ 3000 Transfection Reagent (Invitrogen™; Thermo
Fisher Scientific, Inc.). Transfection was performed using 50 nM
siRNA/well. Cells were incubated at 37°C in a humidified incubator
with 5% CO2 for 6 h, after which the transfection medium
was replaced with fresh complete medium.
Subsequent experiments, including RT-qPCR, Western
blotting, and migration/proliferation assays, were carried out 24
to 48 h post-transfection. RT-qPCR analysis confirmed that SOD2
expression was significantly reduced after siRNA transfection in
both A549 and PC9 cells.
RT-qPCR
After transfection, A549 and PC9 cell lines were
digested with trypsin according to the manufacturer's instructions.
Total RNA was extracted using TRIzol™ reagent (Invitrogen; Thermo
Fisher Scientific, Inc.), and its concentration was measured using
a NanoDrop instrument (Thermo Fisher Scientific, Inc.). Total RNA
was reverse transcribed into complementary DNA using the
PrimeScript™ RT Reagent Kit (Takara Biotechnology Co., Ltd.)
following the manufacturer's protocol. qPCR was performed using the
SYBR Green Master Mix (Vazyme Biotech Co., Ltd.) to assess the
expression of the SOD2 gene. The thermocycling conditions were as
follows: initial denaturation at 95°C for 30 sec, followed by 40
cycles of 95°C for 10 sec and 60°C for 30 sec. β-actin was used as
the internal control, and relative mRNA expression was calculated
using the 2−ΔΔCq method (50). The primer sequences used were as
follows: β-actin (forward), 5′-ATAGCACAGCCTGGATAGCAACGTAC-3′ and
(reverse), 5′-CACCTTCTACAATGAGCTGCGTGTG-3′; and SOD2 (forward),
5′-GCTCCGGTTTTGGGGTATCTG-3′ and (reverse),
5′-GCGTTGATGTGAGGTTCCAG-3′.
Cell proliferation assay
For the Cell Counting Kit-8 (CCK-8) assay (51), A549 and PC9 cell lines were
transfected with siRNA for 48–72 h. Subsequently, 5,000 cells/well
were seeded into 96-well plates. Cells were incubated at 37°C with
5% CO2, and CCK-8 solution (80 µl complete medium and 20
µl CCK-8 reagent; Beyotime Biotechnology, Shanghai, China) was
added at 2, 24, 48 and 72 h after incubation. After 2 h of
incubation, absorbance was measured at 450 nm. Each sample was
analyzed in triplicate.
Transwell migration and invasion
assays
For the Transwell migration and invasion assays,
A549 and PC9 cells were cultured in 6-well plates and transfected
with siRNA for 24 h. Migration was assessed using 24-well Transwell
chambers (BD Biosciences). A total of 5×10⁴ cells were
seeded into the upper chamber containing 150 µl serum-free medium,
whilst the lower chamber contained 500 µl medium supplemented with
20% FBS. For the invasion assay, Matrigel was thawed from −20°C to
liquid state at 4°C and diluted at a ratio of 1:8 with serum-free
medium. Subsequently, 50 µl diluted Matrigel was added to the upper
chamber and incubated at 37°C for 3 h to allow gelation before
seeding the cells, to evaluate cell invasion. Following 24 h of
incubation, the cells that had migrated or invaded to the lower
surface of the membrane were fixed with 4% paraformaldehyde for 30
min and stained with 0.1% crystal violet for 30 min, both at room
temperature. Images were captured under a light microscope (Olympus
Corporation, Tokyo, Japan) for analysis.
Colony formation assay
A total of 500 A549 or PC9 cells 500 cells were
seeded into 6-well plates and incubated at 37°C in a humidified
atmosphere with 5% CO2 for 10 days (52). Once visible colonies (≥50 cells)
formed, the cells were washed with PBS, stained with 0.1% crystal
violet for 20 min at room temperature and washed with PBS. Images
of the cells were then captured by light microscope(Olympus,
Olympus Corporation, Tokyo, Japan). Colony counts were analyzed
using GraphPad software (version 9.5.1; Dotmatics).
Mitochondrial immunofluorescence
assay
The A549 and PC9 cell lines were cultured on sterile
coverslips in 6-well plates and treated with siNC and si-SOD2. When
the cells reached 60% confluence, they were stained with
MitoTracker Deep Red mitochondrial probe (Invitrogen; Thermo Fisher
Scientific, Inc.) for 30 min at 37°C. After staining, the cells
were fixed with 4% paraformaldehyde for 15 min at room temperature,
followed by permeabilization with 0.5% Triton X-100. The coverslips
were then mounted with a fluorescence quenching mounting medium
containing DAPI (1.5 µg/ml). Fluorescence imaging was performed
using a laser confocal microscope to compare the mitochondrial
density after treatment with siNC and si-SOD2.
Statistical analysis
All experiments were performed ≥3 times. For
comparisons between two groups, the Wilcoxon rank-sum test or
unpaired t-test was used. All data are presented as the mean ±
standard deviation (SD) with n=3. Pearson correlation analysis was
performed to assess related genes, and univariate and multivariate
Cox analyses were performed to identify prognostic-related genes.
Data were analyzed using GraphPad Prism (version 9.5.1). All
analyses were performed using R software version 4.3.5 (The R
Foundation). P<0.05 was considered to indicate a statistically
signification difference.
Results
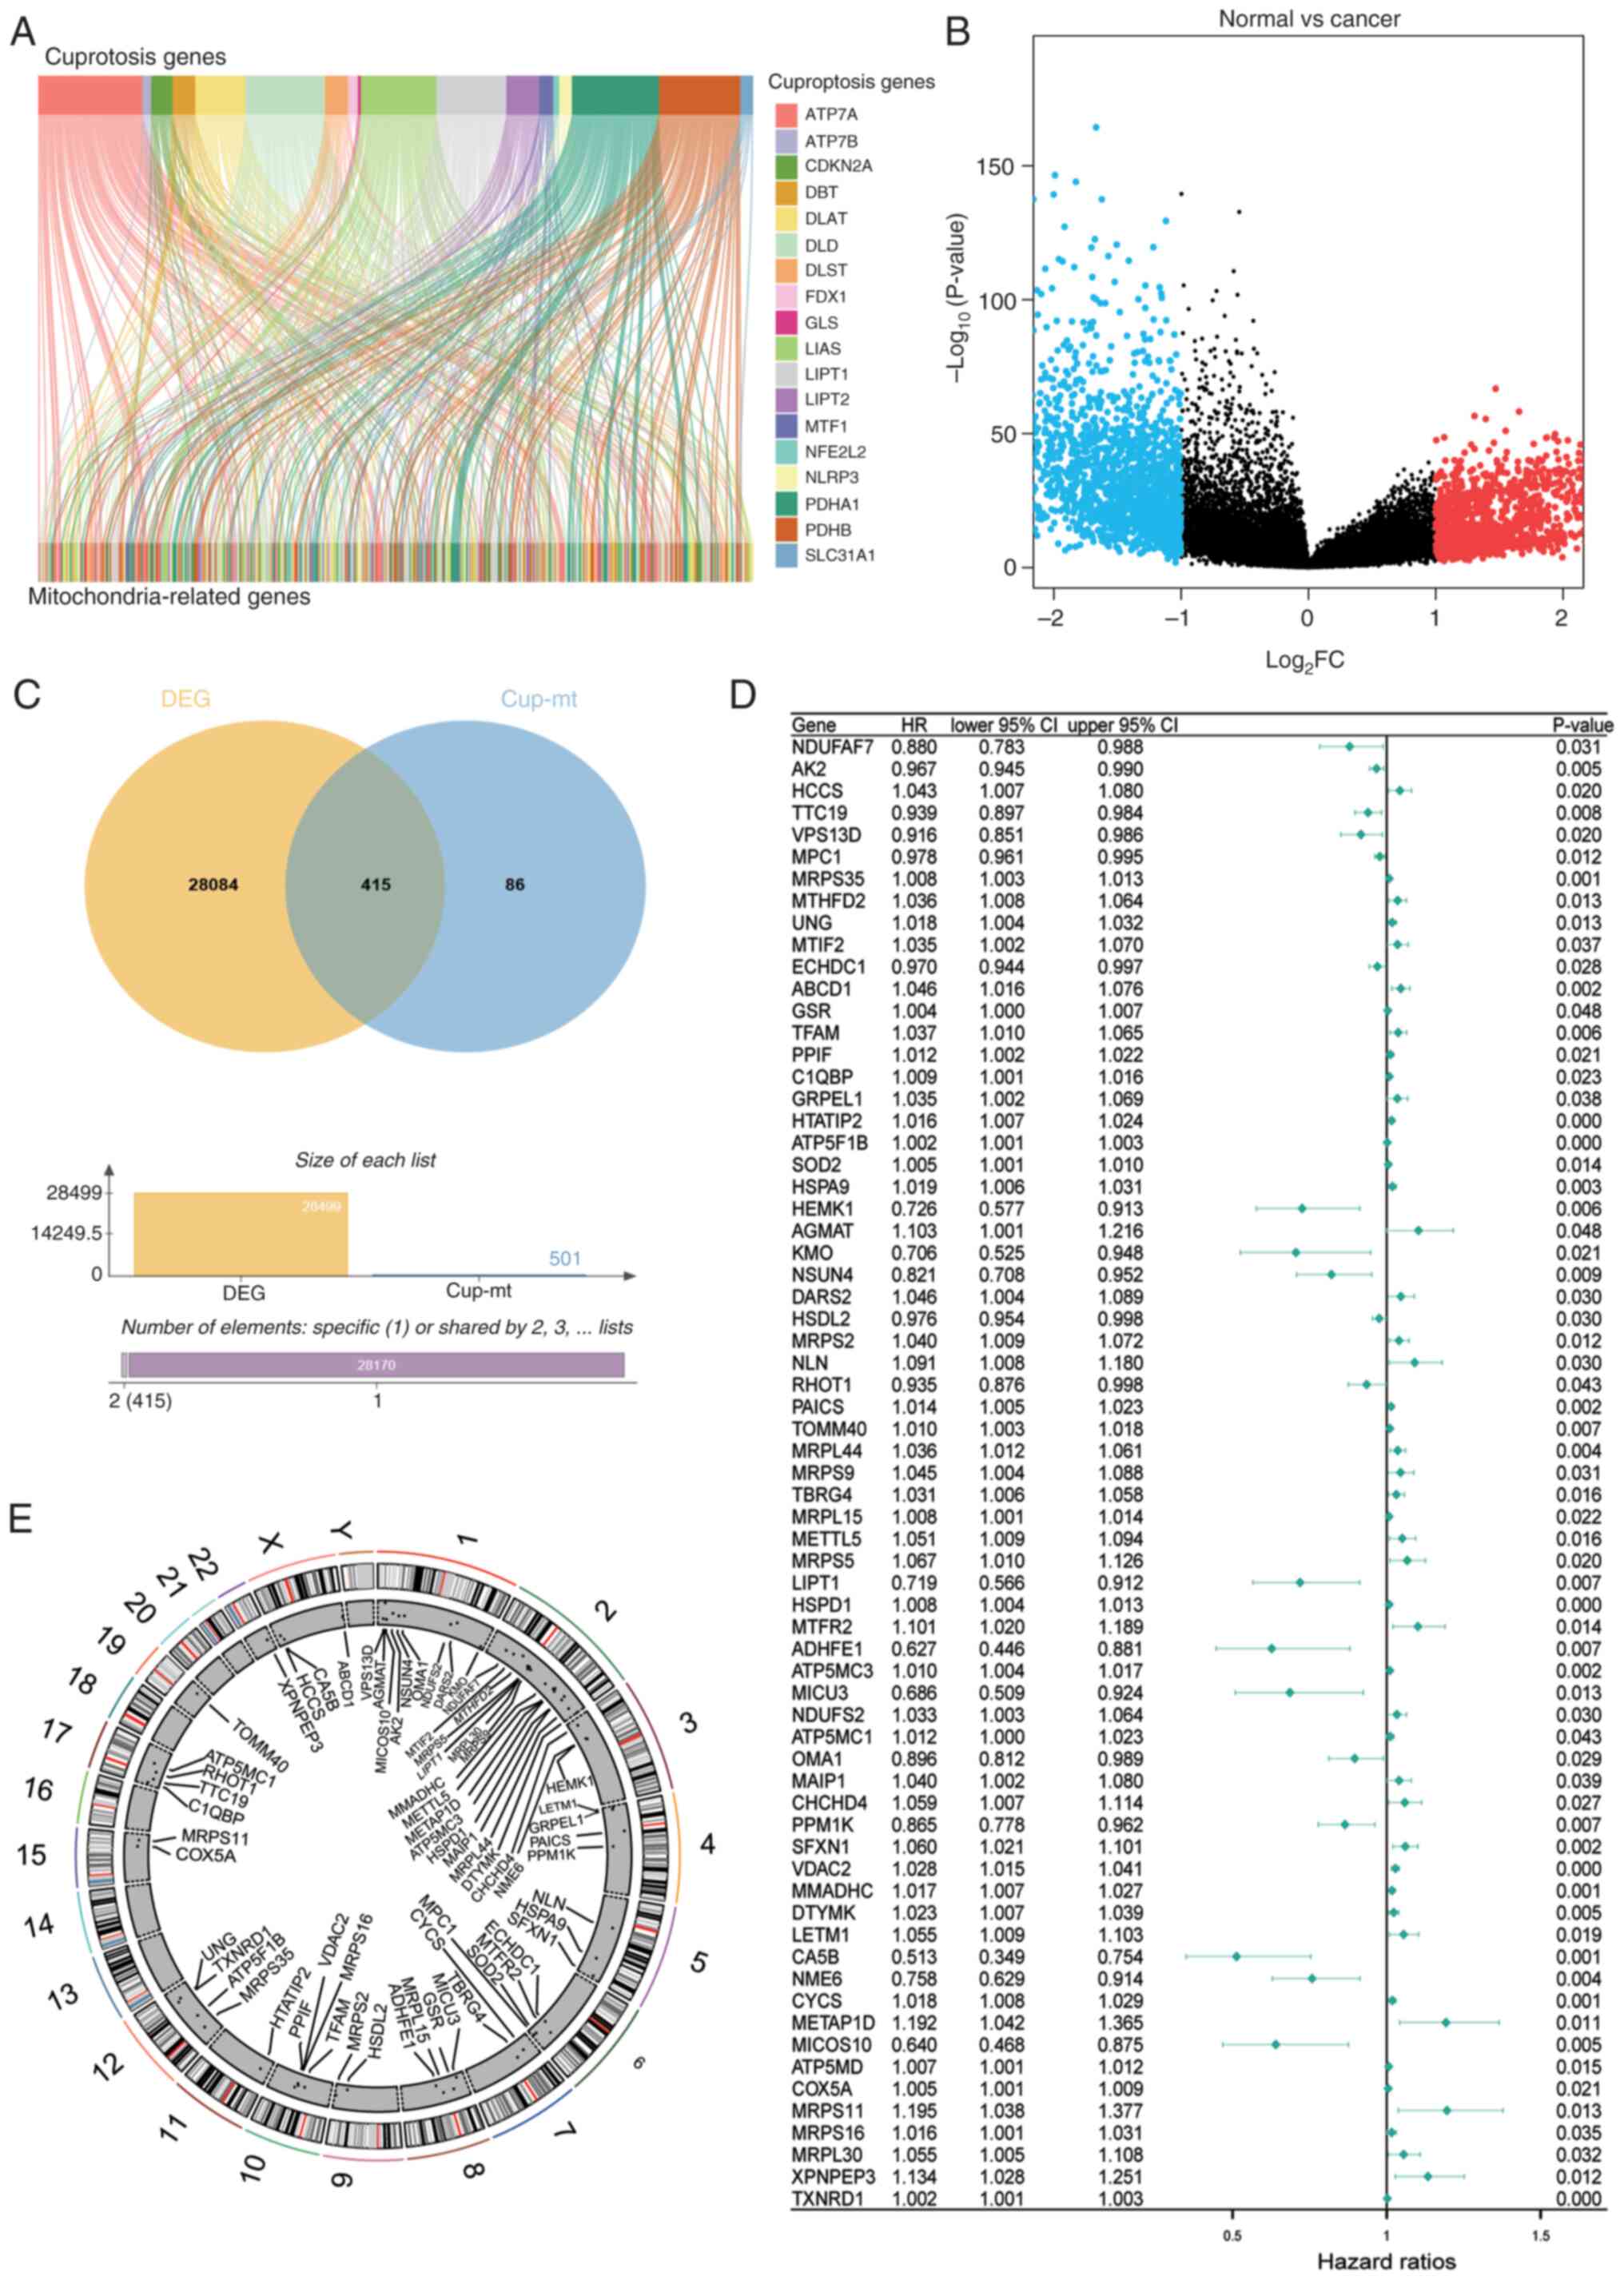
Screening and identification of
cuproptosis-related mitochondrial genes
A total of 501 cuproptosis-related mitochondrial
genes were identified using Pearson correlation analysis (cor
>0.3; Fig. 1A). In the screening
of cuproptosis and mitochondria-related genes, Pearson's linear
correlation analysis was used. A general threshold of 0.5 was set
as a strong correlation. However, the 1-, 3- and 5-year ROC values
of the prognostic genes selected from this analysis were 0.653,
0.639 and 0.602, respectively, all of which were <0.7 (Fig. S1). Moreover, the correlation
between genes is not necessarily linear and could involve indirect
regulation. Therefore, to include more potential genes, a threshold
of 0.3 was set according to the study by Jiang et al
(26).
Differential gene expression analysis using TCGA
dataset revealed 415 cuproptosis-related mitochondrial genes
(Fig. 1B and C). Moreover,
univariate Cox regression analysis identified 67 prognostic-related
genes (Fig. 1D), with their
chromosomal distribution mapped (Fig.
1E).
Construction of a risk scoring model
based on machine learning
A total of >100 predictive models were tested
using 10 distinct algorithms across multiple datasets, including
TCGA LUAD and GEO datasets. The LASSO + survival-SVM algorithm
achieved the highest C-index (0.676) and was selected as the
optimal model (Fig. 2A-C). This
model identified 22 key prognostic genes, including metabolism of
cobalamin associated D (MMADHC), SOD2, human immunodeficiency
virus-1 Tat interactive protein 2 (HTATIP2), cytochrome C somatic
(CYCS), mitochondrial pyruvate carrier 1 (MPC1), adenylate kinase 2
(AK2). The distribution of patient risk scores in the training and
testing sets is shown in Fig. 2D, G, J
and M. Moreover, scatter plots were generated for the survival
times of patients in the high- and low-risk groups (Fig. 2E, H, K and N). Kaplan-Meier analysis
revealed that the high-risk group had significantly worse overall
survival (OS) than the low-risk group (Fig. 2F, I, L and O). To develop a
risk-score model, the following formula was applied: Risk
score=(0.04223596 × MMADHC) + (0.0910999 × SOD2) + (0.08776809 ×
HTATIP2) + (0.04116991 × CYCS) + (−0.05948219 × MPC1) +
(−0.09171416 × AK2) + (0.05753366 × MRPL44) + [0.01824556 ×
transforming growth factor β regulator 4 (TBRG4)] + [0.09307276 ×
mitochondrial transcription factor A (TFAM)] + (−0.03425415 ×
tetratricopeptide repeat domain 19) + (0.13106342 ×
coiled-coil-helix-coiled-coil-helix domain containing 4) +
(0.09911277 × sideroflexin 1) + (0.06724052 × ATP binding cassette
subfamily D member 1) + (−0.08541973 × NADH: ubiquinone
oxidoreductase complex assembly factor 7) + (−0.11770888 × NOP2/Sun
RNA methyltransferase 4) + (−0.19223805 × NME/NM23 nucleoside
diphosphate kinase 6) + (0.18218013 × X-Prolyl aminopeptidase 3) +
(−0.09327797 × lipoyltransferase 1) + (0.11149579 × mitochondrial
methionyl aminopeptidase type 1D) + (−0.11764198 × carbonic
anhydrase 5B) + (−0.19248092 × kynurenine 3-monooxygenase) +
(−0.13196013 × alcohol dehydrogenase iron containing 1).
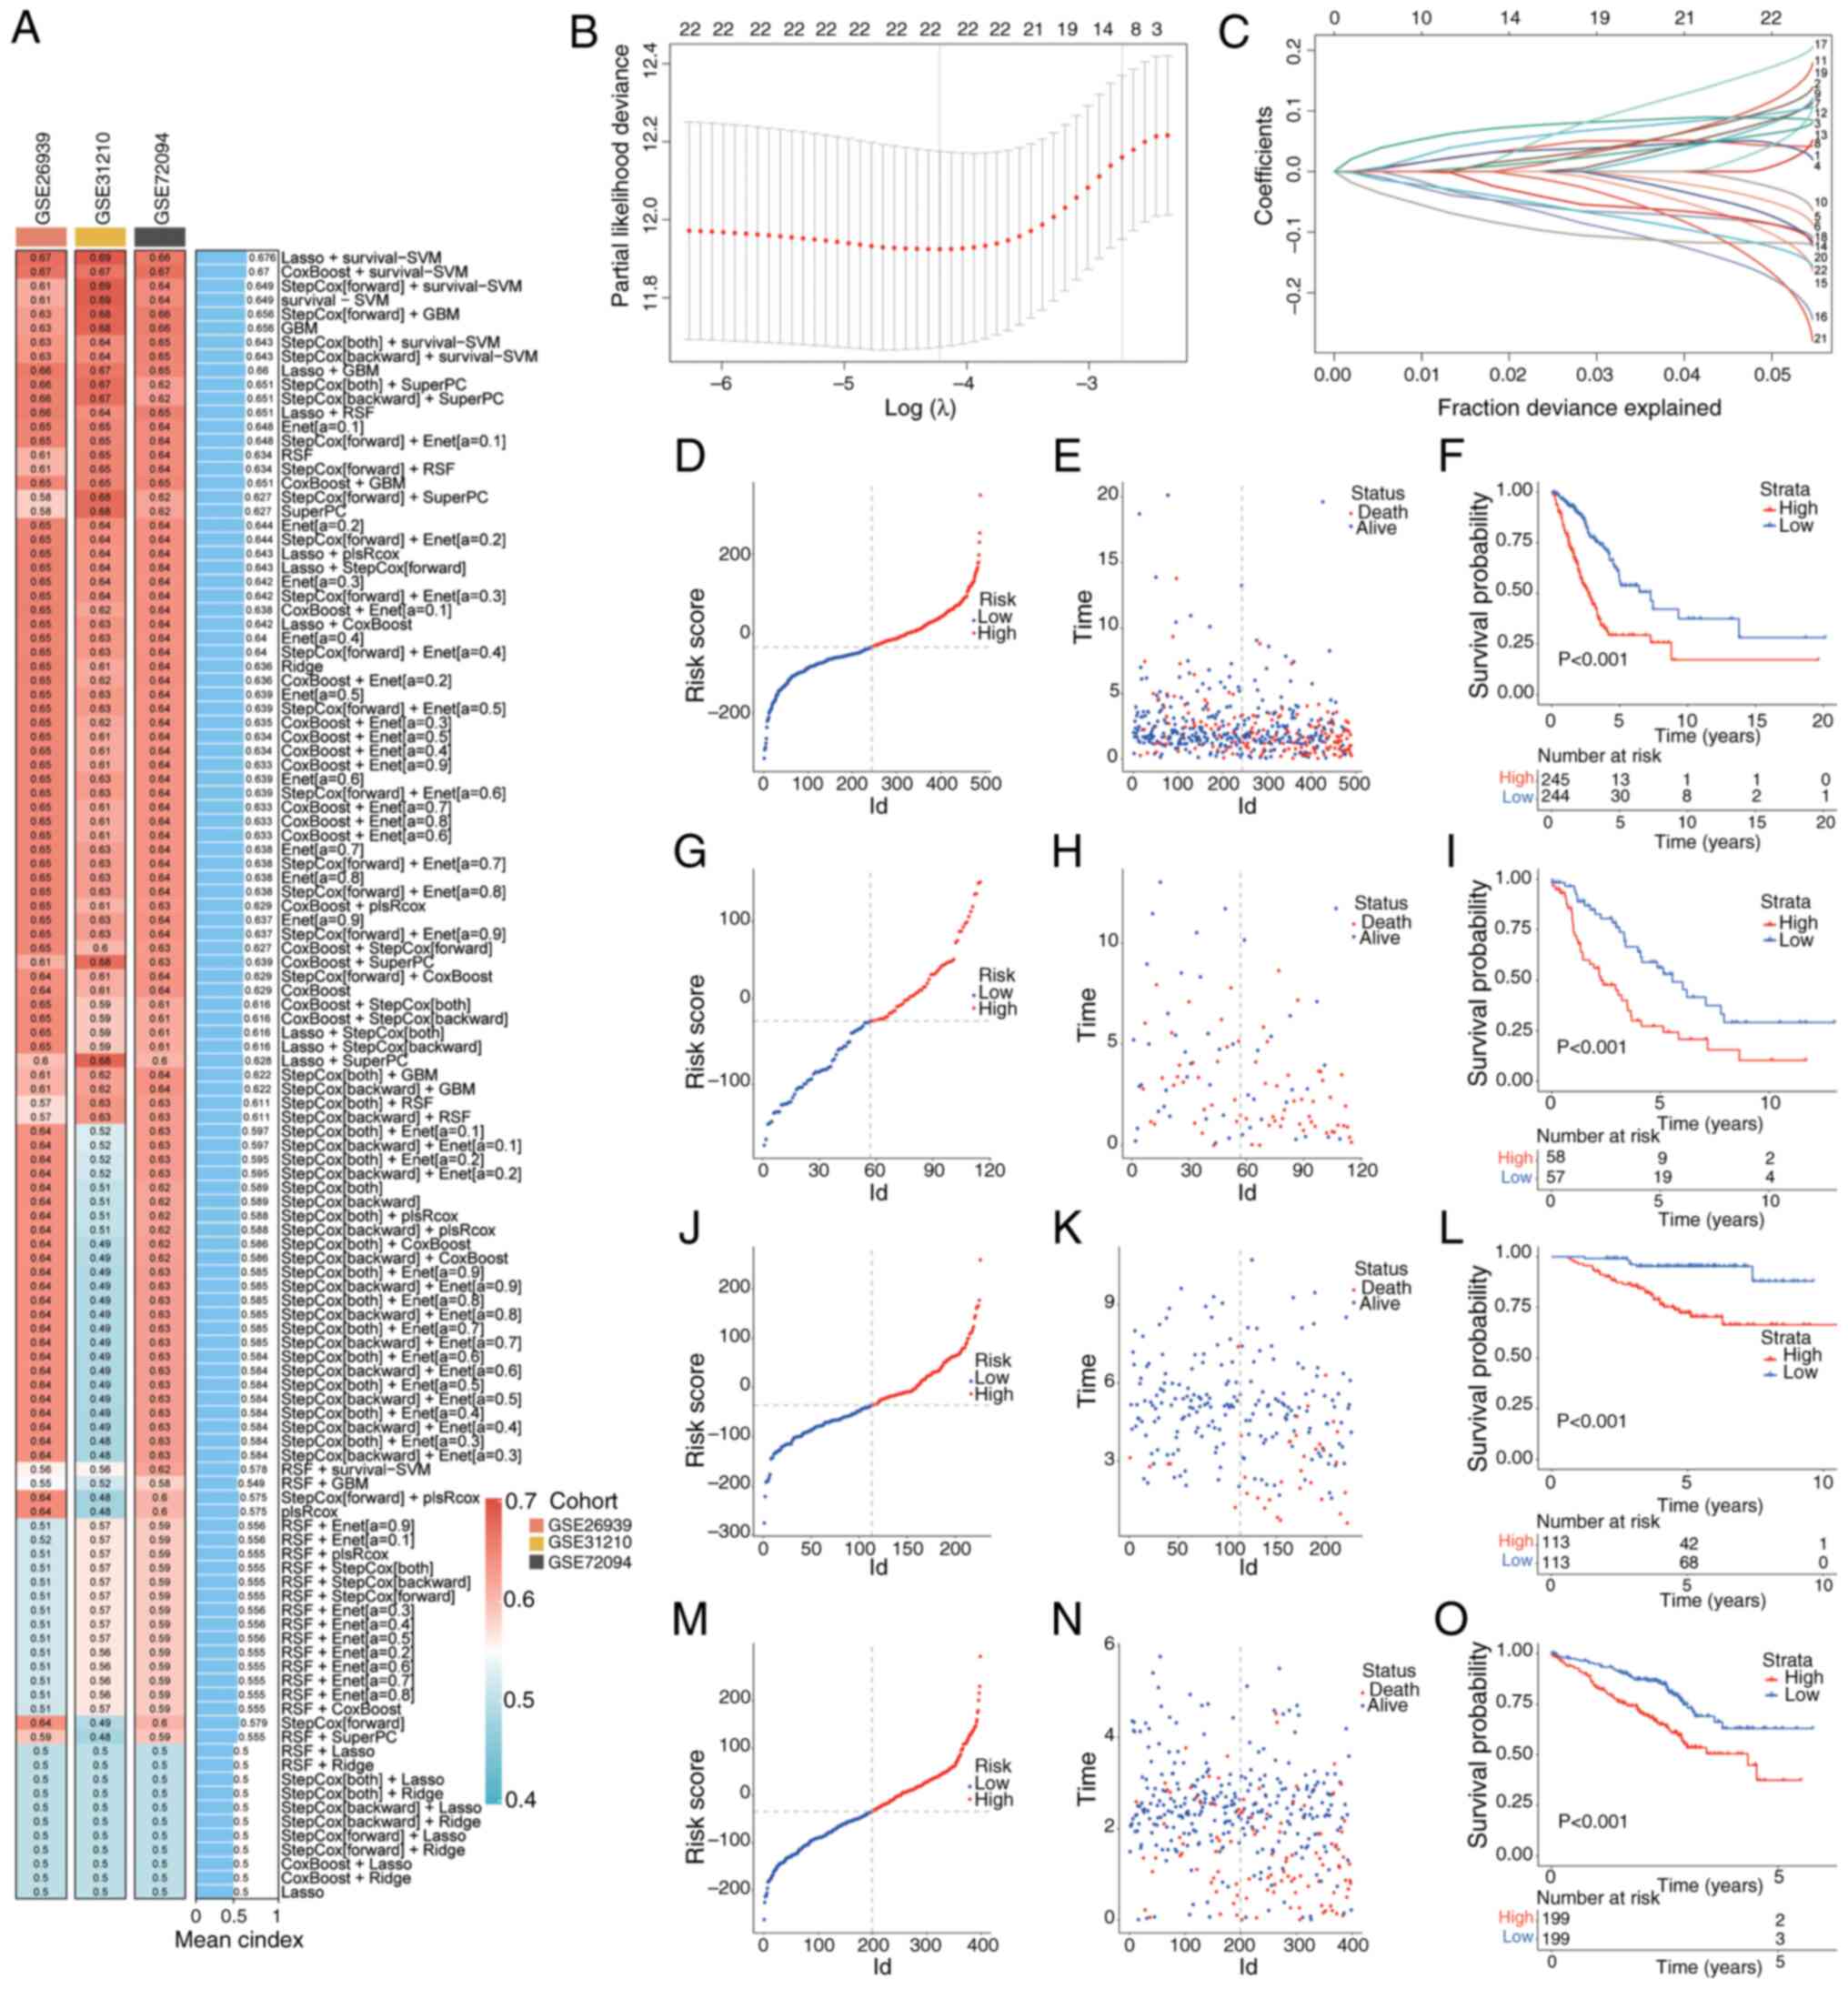 | Figure 2.Machine learning-based prognostic
risk score model construction. (A) C-index for each machine
learning prediction model calculated for the training and test
sets, with >100 models included. (B) LASSO regression analysis
established a model containing cuproptosis-related mitochondrial
genes associated with prognosis. (C) Coefficients of the LASSO
analysis. (D) Distribution of risk scores, (E) survival status and
time distribution in high- and low-risk groups. (F) Kaplan-Meier
curves showing the OS of patients in high- and low-risk groups in
TCGA training set. (G) Distribution of risk scores, (H) survival
status and time distribution in high- and low-risk groups, and (I)
Kaplan-Meier curves showing the OS of patients in high- and
low-risk groups in the GSE26939 test set. (J) Distribution of risk
scores, (K) survival status and time distribution in high- and
low-risk groups, and (L) Kaplan-Meier curves showing the overall OS
of patients in high- and low-risk groups in the GSE31210 test set.
(M) Distribution of risk scores, (N) survival status and time
distribution in high- and low-risk groups, and (O) Kaplan-Meier
curves showing the overall OS of patients in high- and low-risk
groups in the GSE72094 test set. LASSO, least absolute shrinkage
and selection operator; TCGA, The Cancer Genome Atlas; OS, overall
survival. |
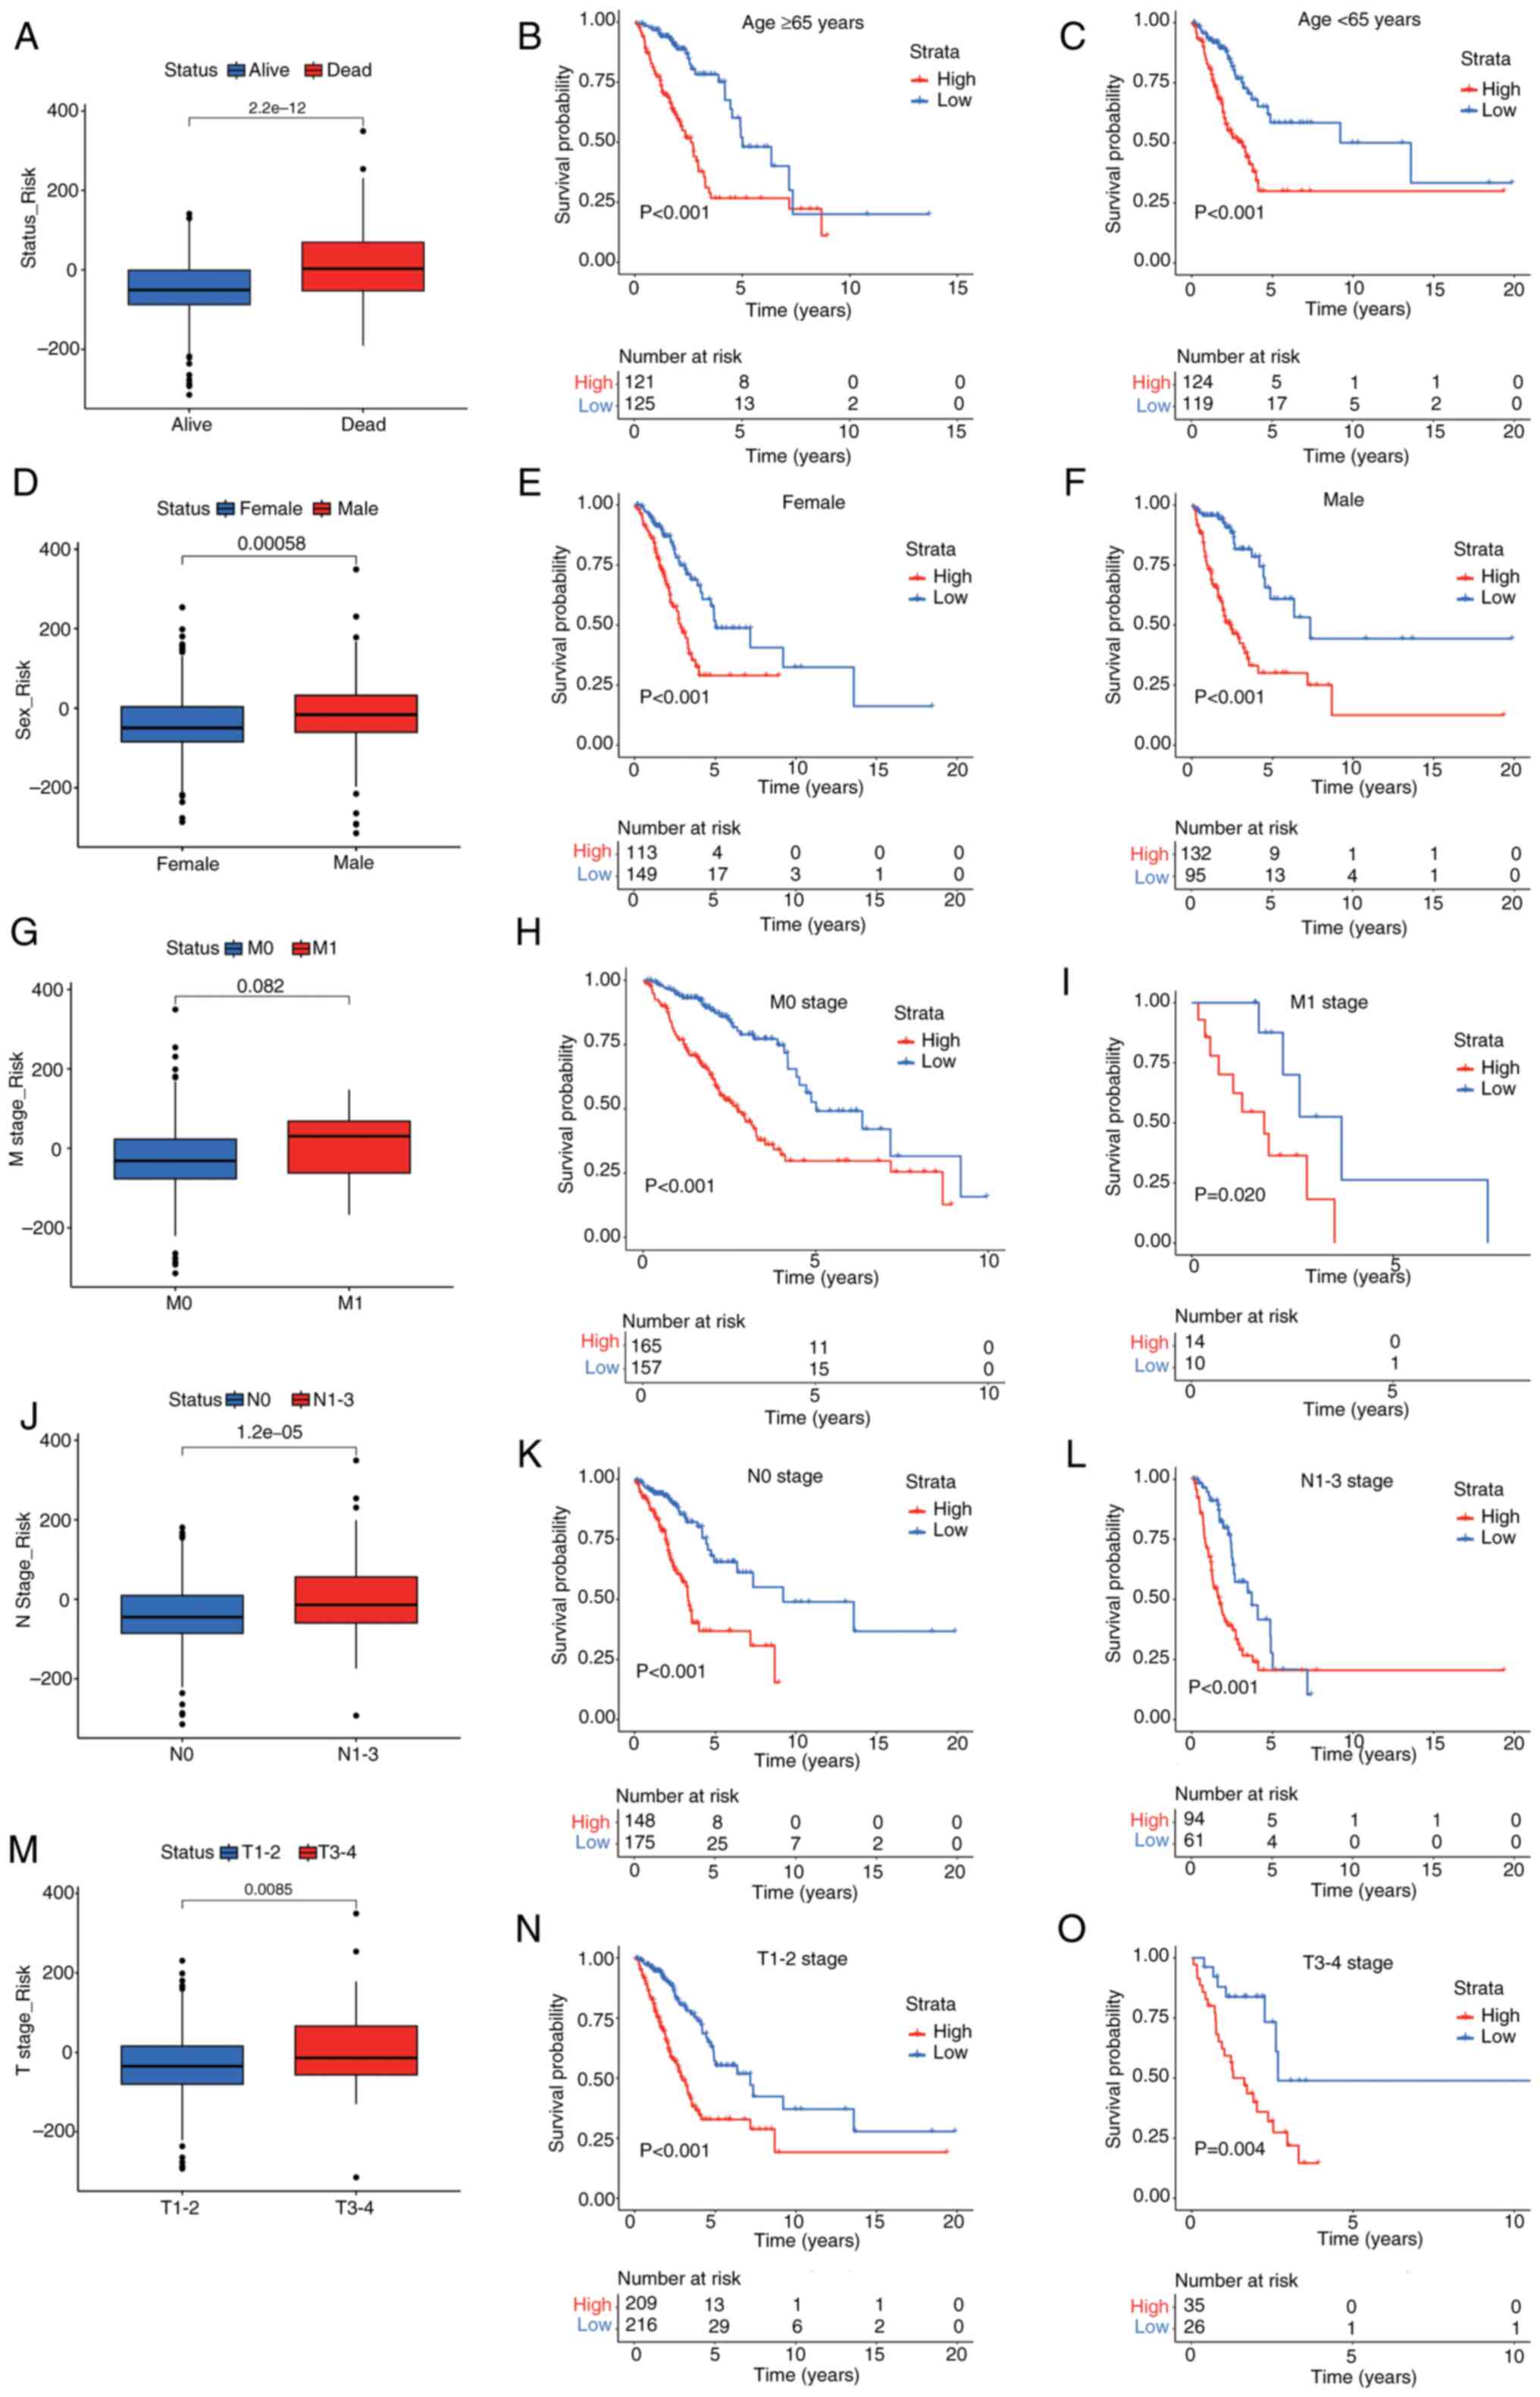
Prognostic curves for high and low
risk scores in subgroups
To further assess the clinical relevance of the risk
scoring model, it was applied it to survival prediction. The
results revealed that the cuproptosis-related mitochondrial gene
risk scoring system had strong predictive power and stability
across several subgroups. Deceased patients had significantly
higher risk scores compared with survivors (Fig. 3A). After age stratification, it was
demonstrated that patients aged ≥65 years in the high-risk group
had a significantly reduced OS compared with those in the low-risk
group (Fig. 3B), and significant
differences were also observed in patients aged <65 years
(Fig. 3C). Sex stratification
analysis revealed that male patients had significantly higher risk
scores than female patients (Fig.
3D), and survival analysis (Fig. 3E
and F) demonstrated worse OS for both male and female high-risk
groups compared with low-risk groups. Regarding the M stage, the
results revealed a statistically significant trend in risk scores
between M0 and M1 patients (Fig.
3G); however, survival analysis demonstrated that high-risk M0
patients had significantly lower OS than low-risk patients
(Fig. 3H), with similar differences
observed in M1 patients (Fig. 3I).
For the N stage, the risk scores in N1-3 stages were significantly
higher than in the N0 stage (Fig.
3J). Moreover, survival analysis (Fig. 3K and L) indicated significantly
worse OS in the high-risk group for both N0 and N1-3 stages
compared with in the low-risk group. In the T stage analysis,
patients with T3-4 stages had significantly higher risk scores
compared with those with T1-2 stages (Fig. 3M). Survival analysis (Fig. 3N and O) further indicated
significantly shorter OS in the high-risk group compared with in
the low-risk group for T1-2 stages and T3-4 stages. In summary, the
cuproptosis-related mitochondrial gene-based risk scoring system
exhibited stable differentiation and clinical predictive value
across diverse subgroups, offering robust support for patient
stratification and risk management. Furthermore, this risk scoring
system has the potential to identify high-risk patients.
Construction of a prognostic
nomogram
A univariate Cox regression analysis was performed,
which evaluated the influence of several clinical variables and
risk scores on the survival prognosis of patients with LUAD
(Fig. 4A). The analysis revealed
that age and sex were not significantly associated with survival
prognosis. However, clinical stage (HR=1.652;), T stage (HR=1.580)
and N stage (HR=1.679) were all significantly associated with a
worse prognosis, with higher stages indicating an increased risk of
death. Moreover, the risk score (HR=1.009) was confirmed as an
independent prognostic factor for survival, with higher scores
associated with a higher risk of death. Following the
identification of these four significant factors, a multivariate
Cox analysis was performed (Fig.
4B). Clinical stage and the cuproptosis-related mitochondrial
gene risk score were independent prognostic factors for survival in
patients with LUAD. A nomogram was then developed which combined
clinical stage and risk score to predict 1-, 3- and 5-year survival
(Fig. 4C). The nomogram enabled
precise survival predictions at several time points by summing the
total score based on the contributions from each parameter. To
evaluate the nomogram, TCGA-LUAD training set and three independent
validation datasets, GSE26939, GSE31210 and GSE72094, were used.
The calibration curves demonstrated that the predictions of the
nomogram for 1-, 3- and 5-year survival were highly consistent with
actual observations, showing accuracy similar to that of an ideal
model (Fig. 4D-G). Additionally,
ROC curves were utilized to assess the predictive performance of
the model (Fig. 4H-K). The results
indicated that in TCGA training set, the area under the curve (AUC)
values for 1-, 3- and 5-year survival were 0.731, 0.679 and 0.654,
respectively. In the GSE26939 dataset, the AUC values for 1-, 3-
and 5-year survival were 0.819, 0.787 and 0.753, respectively. The
GSE31210 dataset demonstrated a more improved performance, with AUC
values of 0.836, 0.806 and 0.779 for 1-, 3- and 5-year survival,
respectively. Moreover, for the GSE72094 dataset, the AUC values
for 1-, 3- and 5-year survival were 0.714, 0.678 and 0.670,
respectively. These results highlight the high predictive accuracy
and stability of the model across multiple datasets, with a
particularly notable performance in the GSE31210 and GSE26939
datasets.
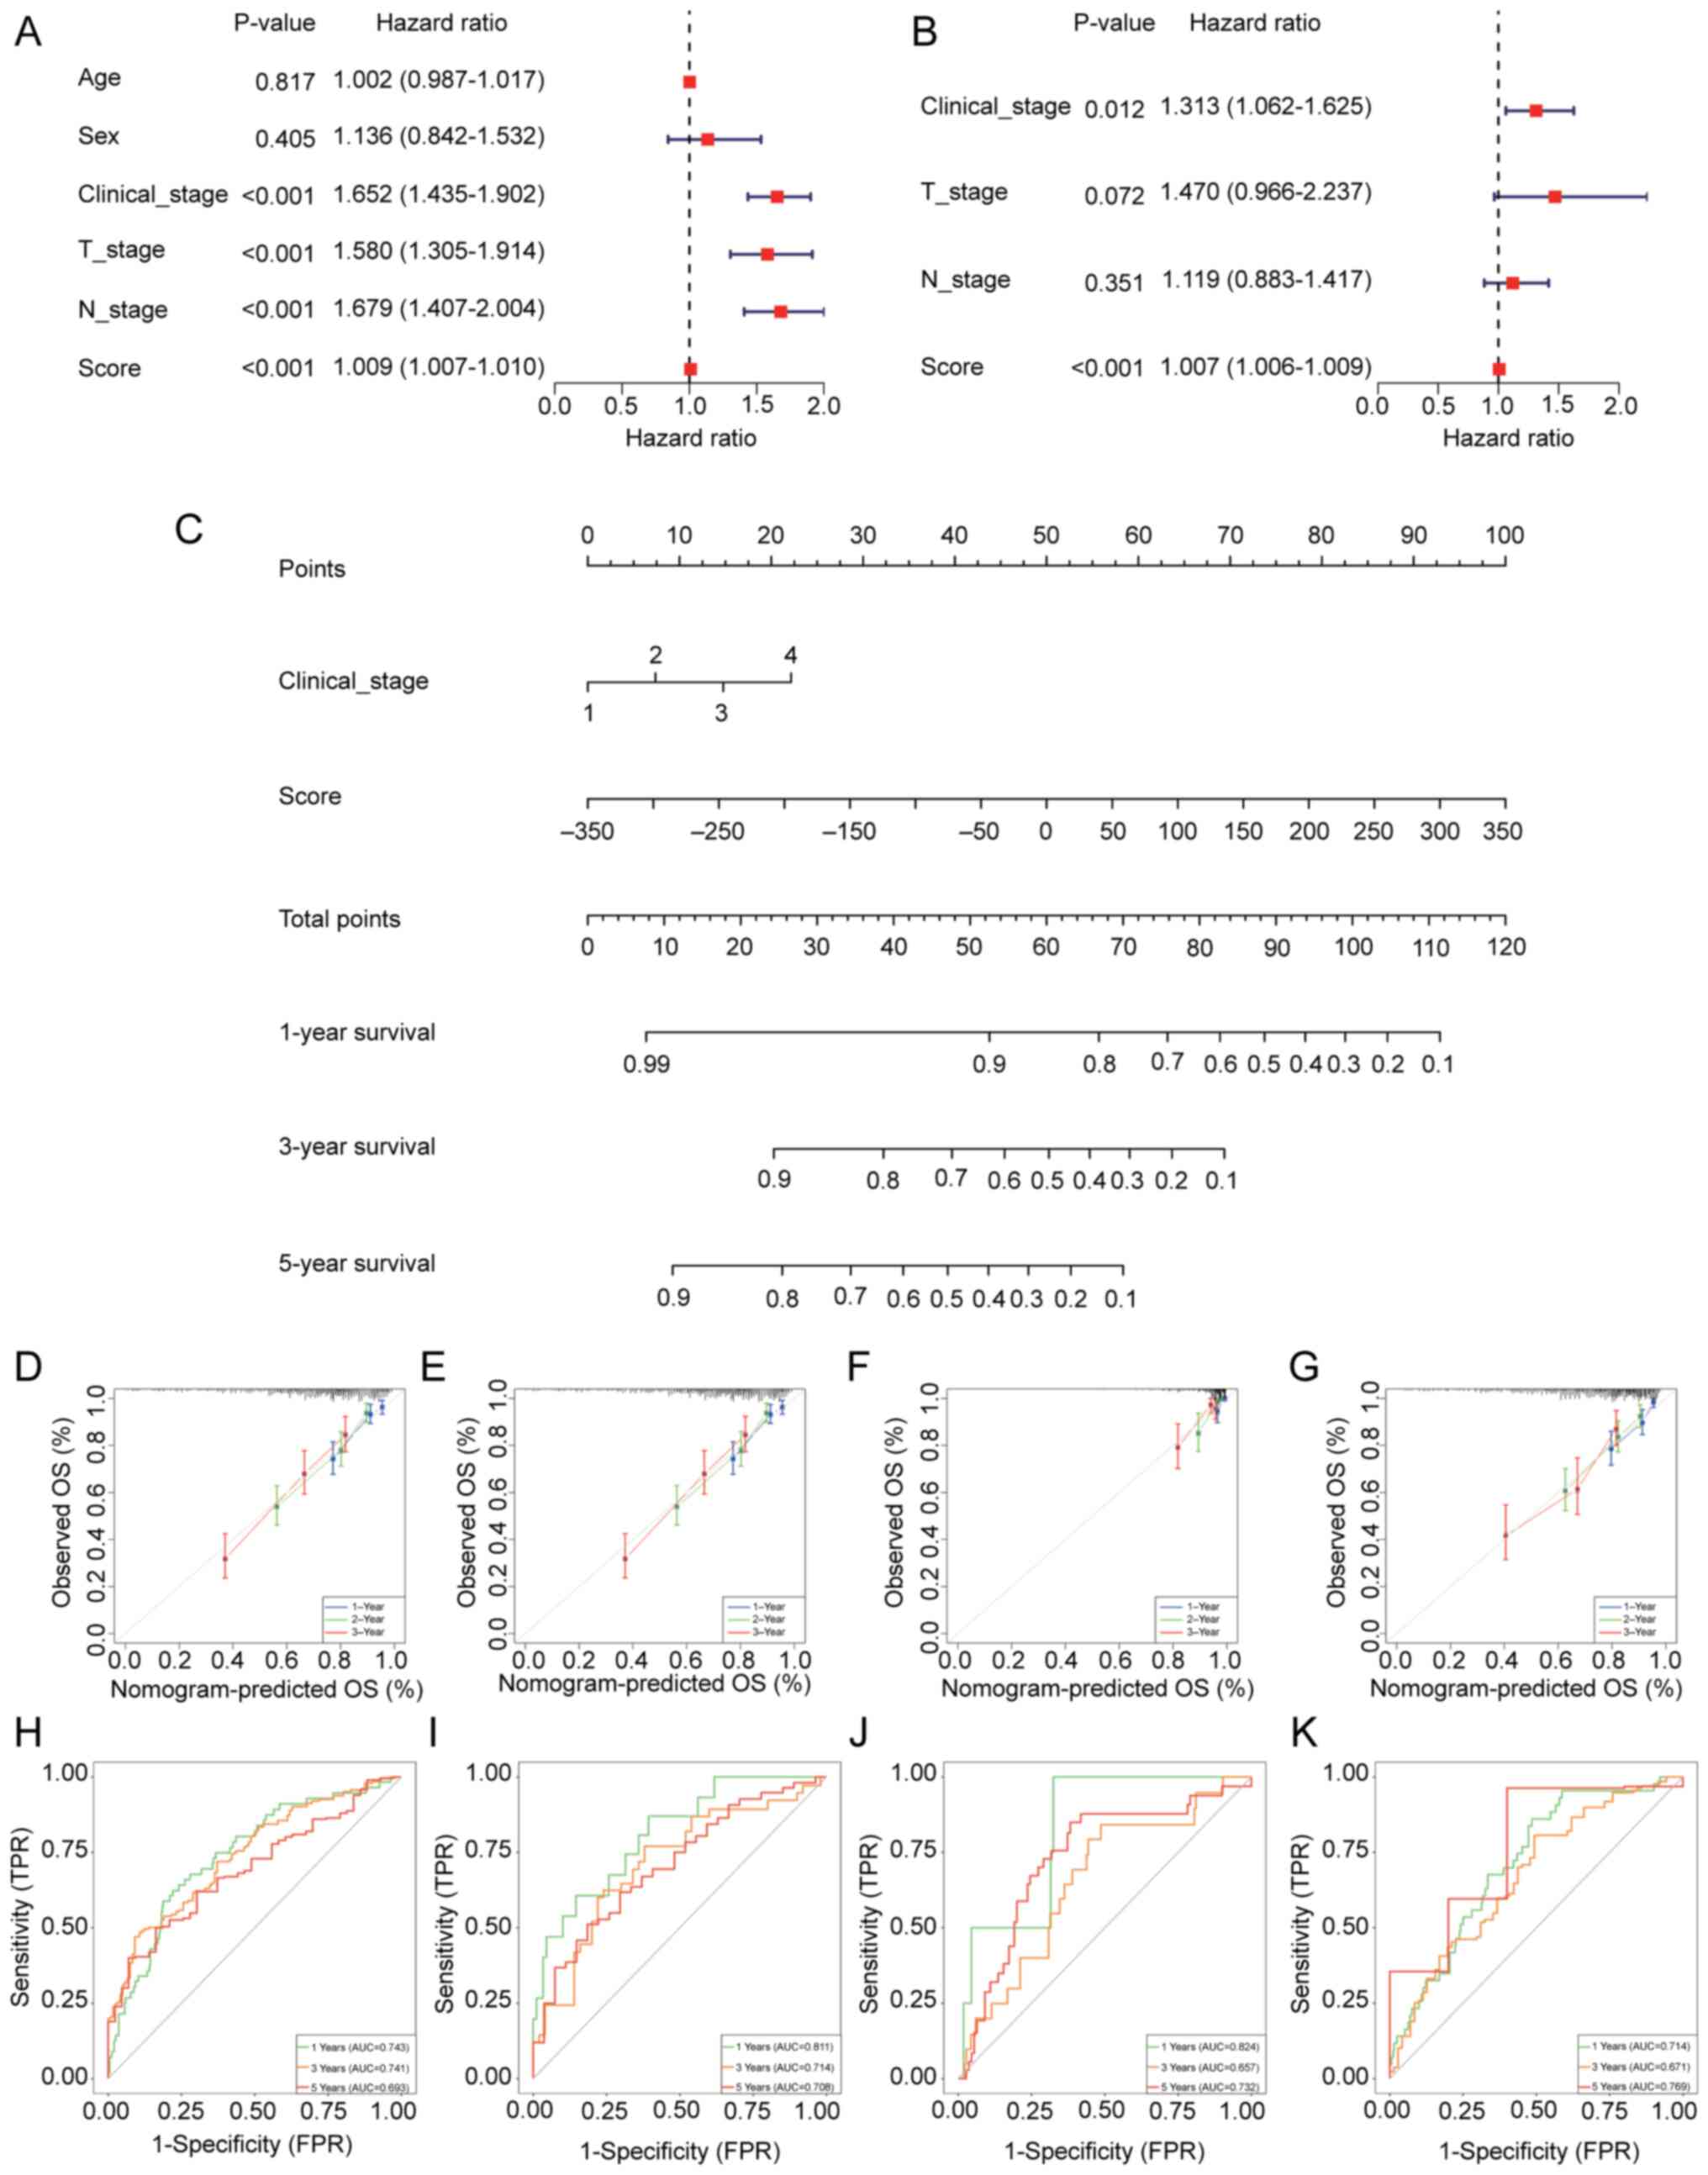 | Figure 4.Nomogram construction to elucidate
lung adenocarcinoma prognosis. (A) Univariate and (B) multivariate
Cox regression analyses for clinical features and risk scores. (C)
Nomogram based on clinical features and risk scores. Calibration
curves showing the accuracy of predicted and actual values in (D)
TCGA training set, (E) the GSE26939 test set, (F) the GSE31210 test
set and (G) the GSE72094 test set. Receiver operating
characteristic curves evaluating the performance of the nomogram in
(H) TCGA training set, (I) the GSE26939 test sets, (J) the GSE31210
test set and (K) the GSE72094 test set. TCGA, The Cancer Genome
Atlas; T, tumor; N, node; OS, overall survival; FPR, false-positive
rate; TPR, true-positive rate; AUC, area under the curve. |
TME, immune checkpoints and
immune-related gene family analysis
Significant differences were observed in the levels
of activated CD4 T cells, CD56dim natural killer cells,
eosinophils, γδ T cells, immature dendritic cells, mast cells,
natural killer T cells, neutrophils and type 2 T helper cells
between the high- and low-risk groups (Fig. 5A). The high-risk group displayed
higher levels of immunosuppressive cells, whilst the low-risk group
had a higher proportion of immune-activating cells. Further
analysis highlighted the presence of more immunosuppressive
pathways in the high-risk group, with the low-risk group showing
stronger immune activation (Fig.
5B). The expression levels of immune checkpoint genes [such as
programmed cell death protein 1, programmed death-ligand 1 (PD-L1)
and cytotoxic T-lymphocyte-associated protein 4] were significantly
higher in the high-risk group than in the low-risk group (Fig. 5C), suggesting a more prominent
immunosuppressive environment. Furthermore, the correlations
between the 22 model genes, immune cell pathways and immune cells
were identified (Fig. 5D).
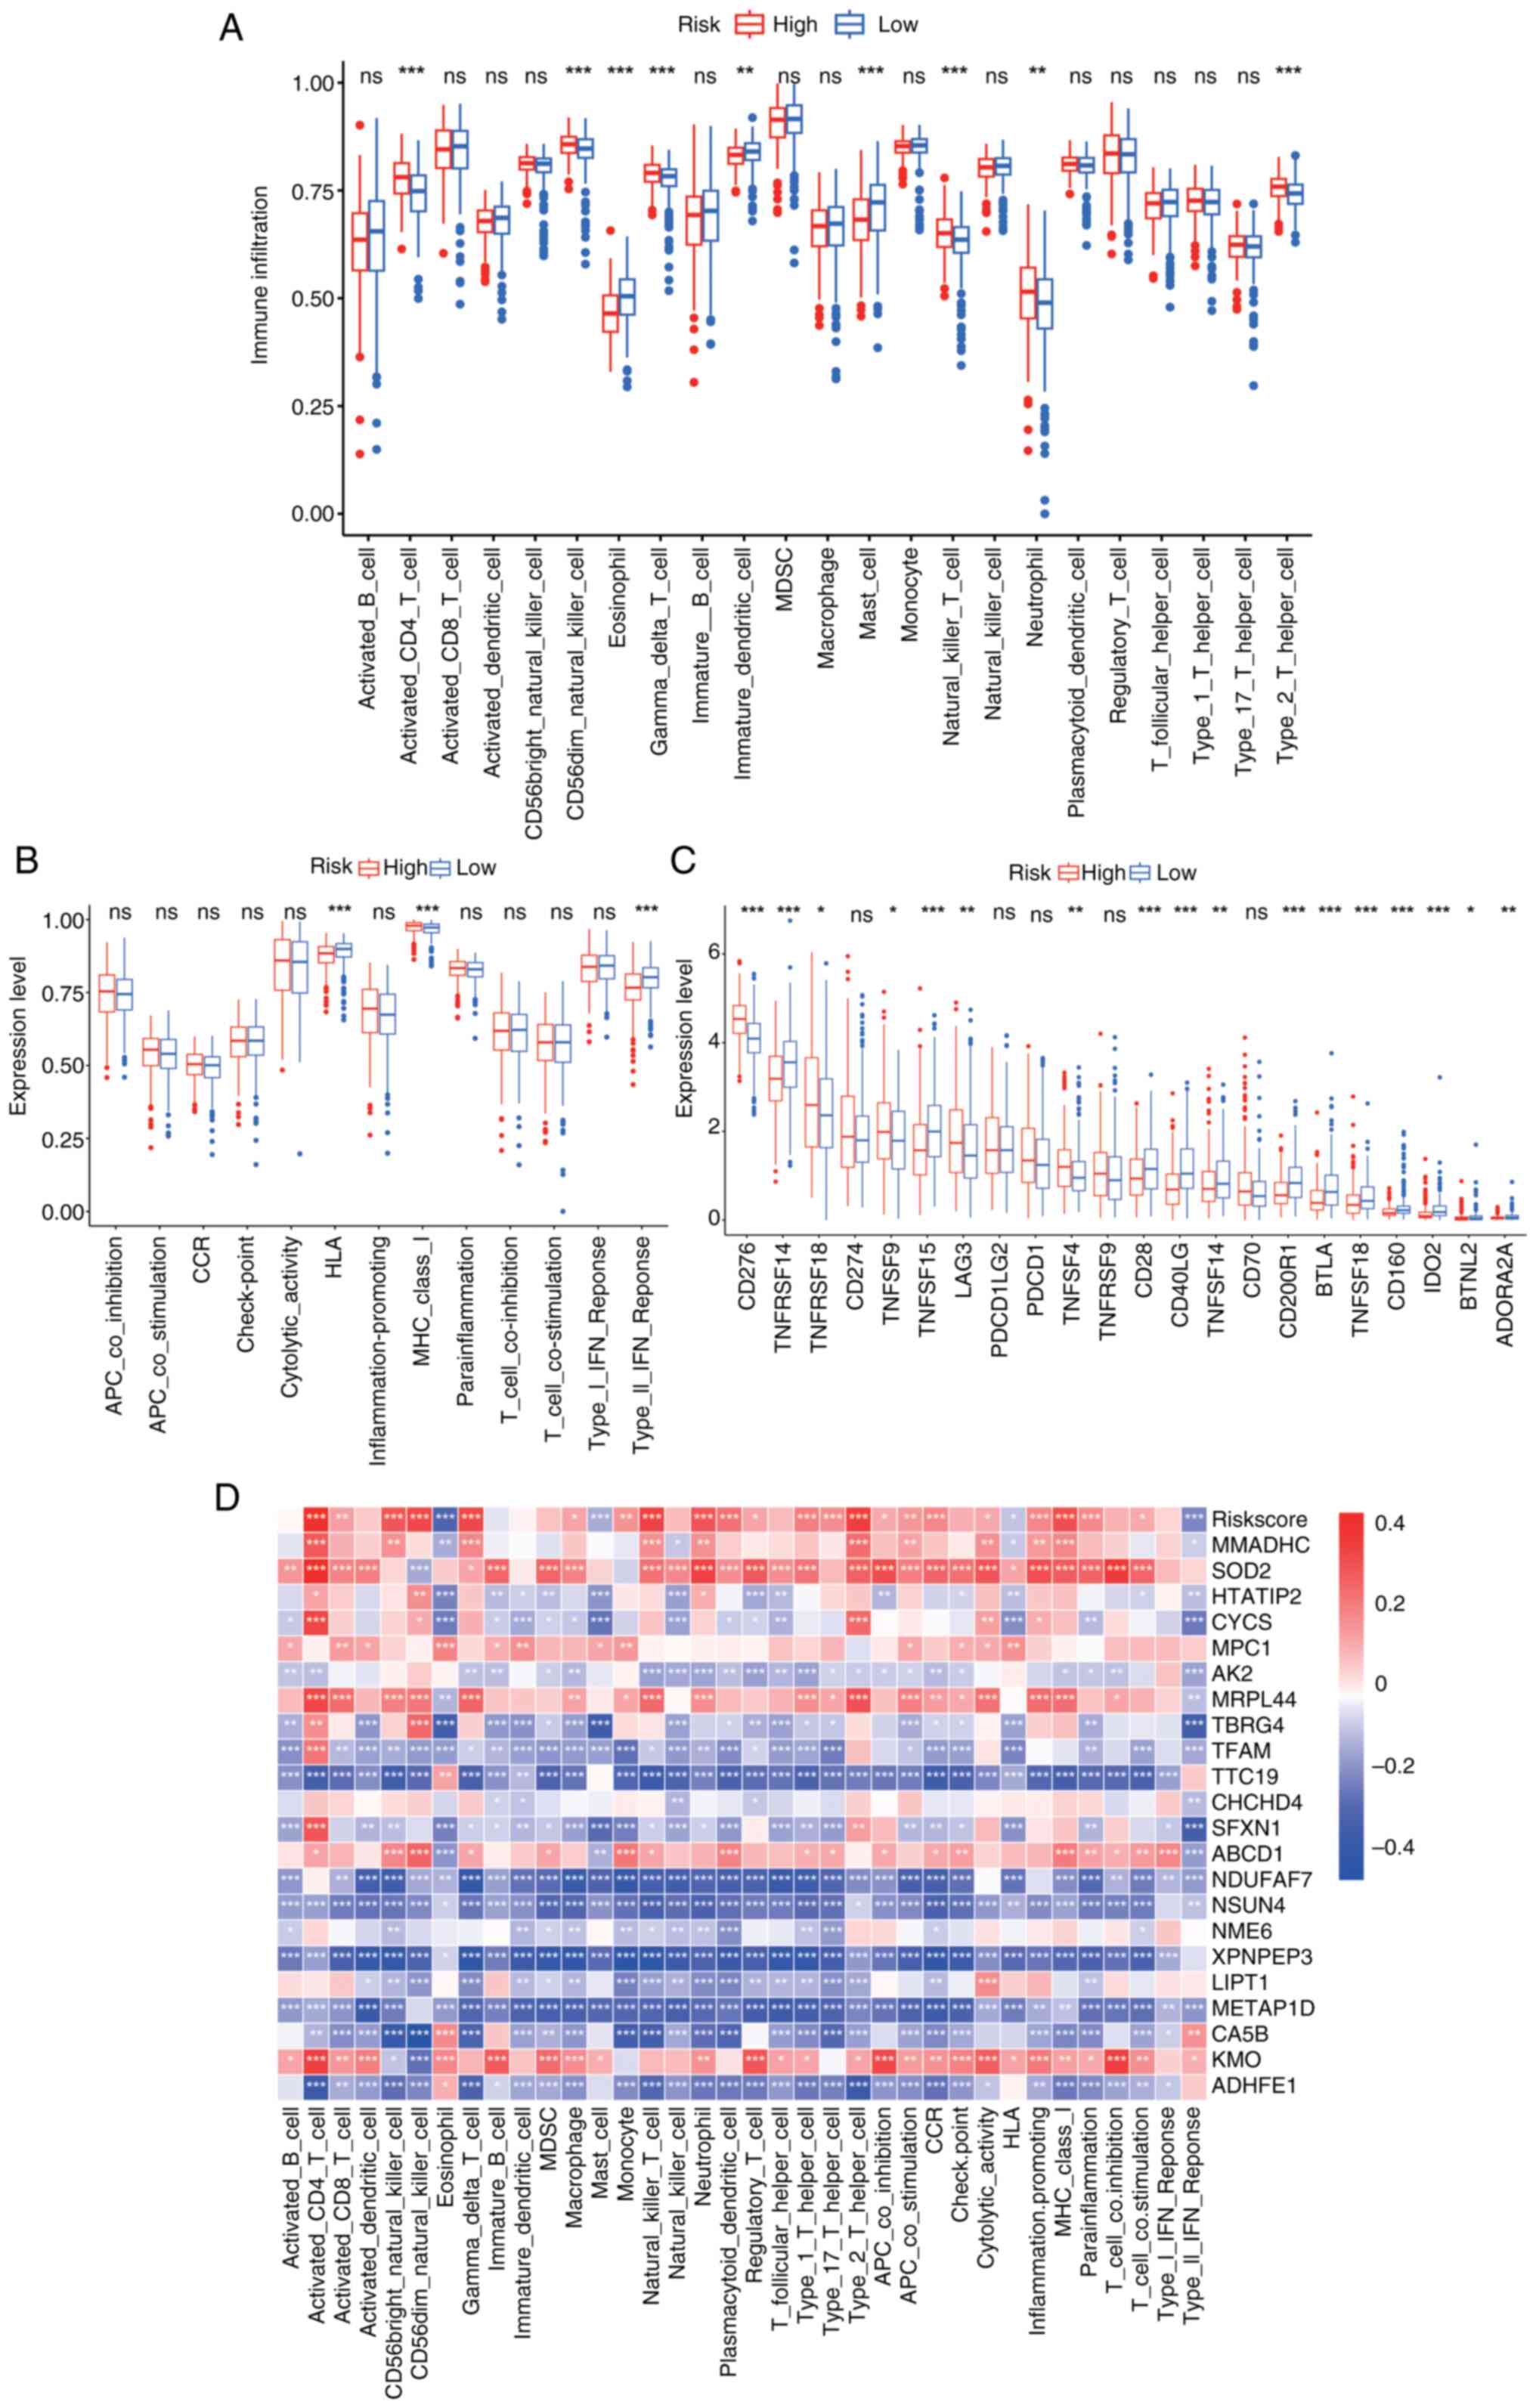 | Figure 5.Immune cell infiltration in high- and
low-risk groups. (A) Expression of 23 immune cell subtypes between
high- and low-risk groups. (B) Distribution and expression of
immune-related pathways in high- and low-risk groups. (C)
Expression of checkpoint-related genes in high- and low-risk
groups. (D) Correlation heatmap of risk scores and model genes with
immune cells and pathways. *P<0.05; **P<0.01; ***P<0.001.
ns, not significant. TNFRSF, tumor necrosis factor receptor
superfamily; LAG3, Lymphocyte activation gene 3; PDCD1LG2,
Programmed cell death 1 ligand 2; CD200R1, CD200 receptor 1; BTLA,
B and T lymphocyte attenuator; IDO2, indoleamine 2,3-dioxygenase 2;
BTNL2, Butyrophilin like 2; ADORA2A, Adenosine a2a receptor. |
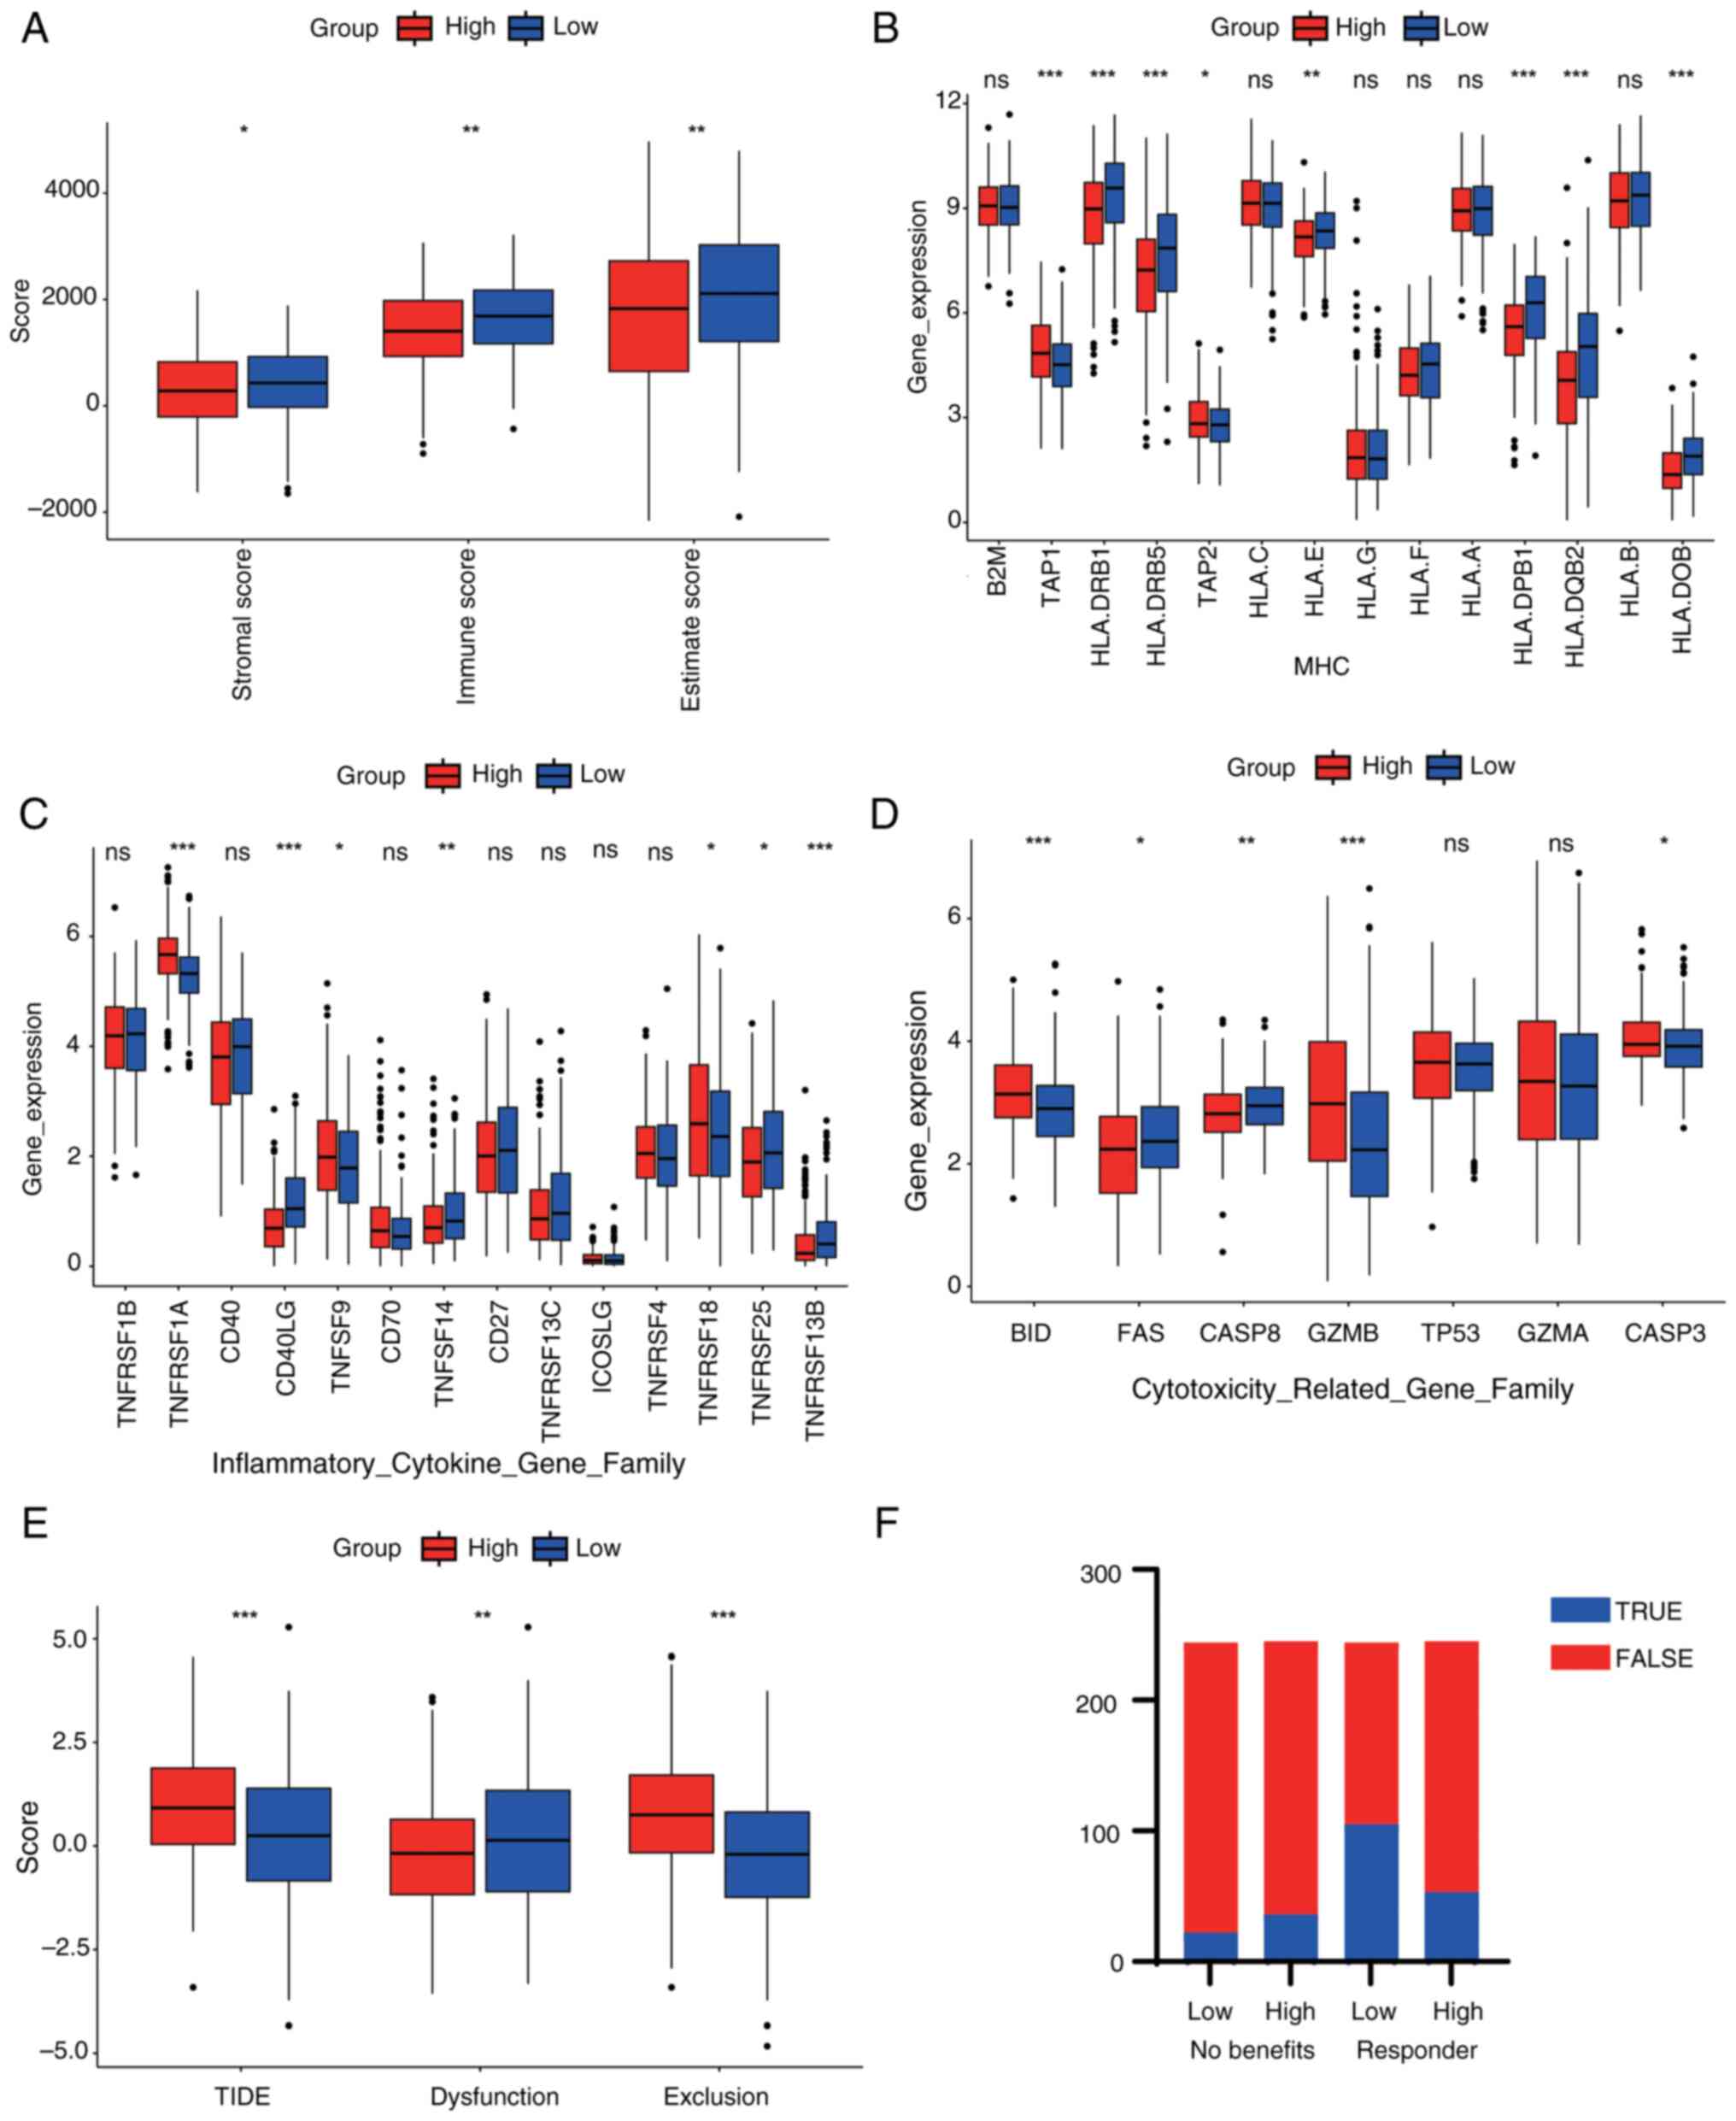
The stromal score was significantly higher in the
low-risk group, indicating a greater stromal component in these
tumors. The immune score was also markedly higher in the low-risk
group, suggesting enhanced immune cell infiltration. Similarly, the
estimate score, which integrates both stromal and immune scores,
was significantly elevated in the low-risk group. These findings
suggested that low-risk patients possess a tumor microenvironment
that is richer in stroma and more immunologically active,
potentially contributing to better prognosis (Fig. 6A). Moreover, significant variations
in the expression of major histocompatibility complex (MHC) gene
family members [such as human leukocyte antigen (HLA)-B, HLA-C and
HLA-DPB1] were revealed, with certain MHC genes downregulated in
the high-risk group, potentially suppressing their antigen
presentation function and promoting tumor immune evasion (Fig. 6B). Changes in the expression of
inflammatory factor gene families (such as TNFSF10, TNFRSF1A and
CD40) were also demonstrated (Fig.
6C), with certain inflammatory factors upregulated in the
high-risk group, which may indicate a chronic inflammatory state
that accelerates tumor progression. It was further revealed that
the expression levels of cytotoxic molecule-related gene families
(such as granzyme A, perforin 1, FAS and caspase 8) were generally
lower in the high-risk group than in the low-risk group, suggesting
a suppression of immune cytotoxicity, thus weakening immune killing
ability (Fig. 6D). Patients in the
high-risk group exhibited significantly higher TIDE and exclusion
scores compared with those in the low-risk group, suggesting a
greater likelihood of immune escape and decreased responsiveness to
immunotherapy. Additionally, the dysfunction score was also higher
in the high-risk group, indicating impaired T cell function
(Fig. 6E). Finally, patients in the
high-risk group exhibited a lower proportion of predicted
responders and fewer potential benefits from immunotherapy compared
to those in the low-risk group (Fig.
6F). In summary, the high-risk group demonstrated reduced
antigen presentation, increased chronic inflammation and diminished
immune killing capability, which may collectively contribute to
tumor immune evasion and progression.
In further analyses, immune cells with significant
expression differences (Fig. 5A)
were selected for survival prognosis analysis. In the high and low
expression groups of eosinophils, immature dendritic cells and type
2 T helper cells, the survival differences were demonstrated to be
significant (Fig. S2A-C). The
relative proportions of 22 immune cell types estimated by the
CIBERSORT algorithm showed distinct patterns between the high- and
low-risk groups, with the low-risk group exhibiting a higher
abundance of immune-active cells such as CD8+ T cells and activated
NK cells, suggesting a more favorable immune microenvironment
(Fig. S2D). In addition,
single-sample GSEA (ssGSEA) analysis revealed significant
differences in the infiltration scores of 67 immune cell subtypes
between the two risk groups, with the low-risk group demonstrating
stronger enrichment in immune-related signatures, such as
antigen-presenting cells and cytotoxic lymphocytes (Fig. S2E).
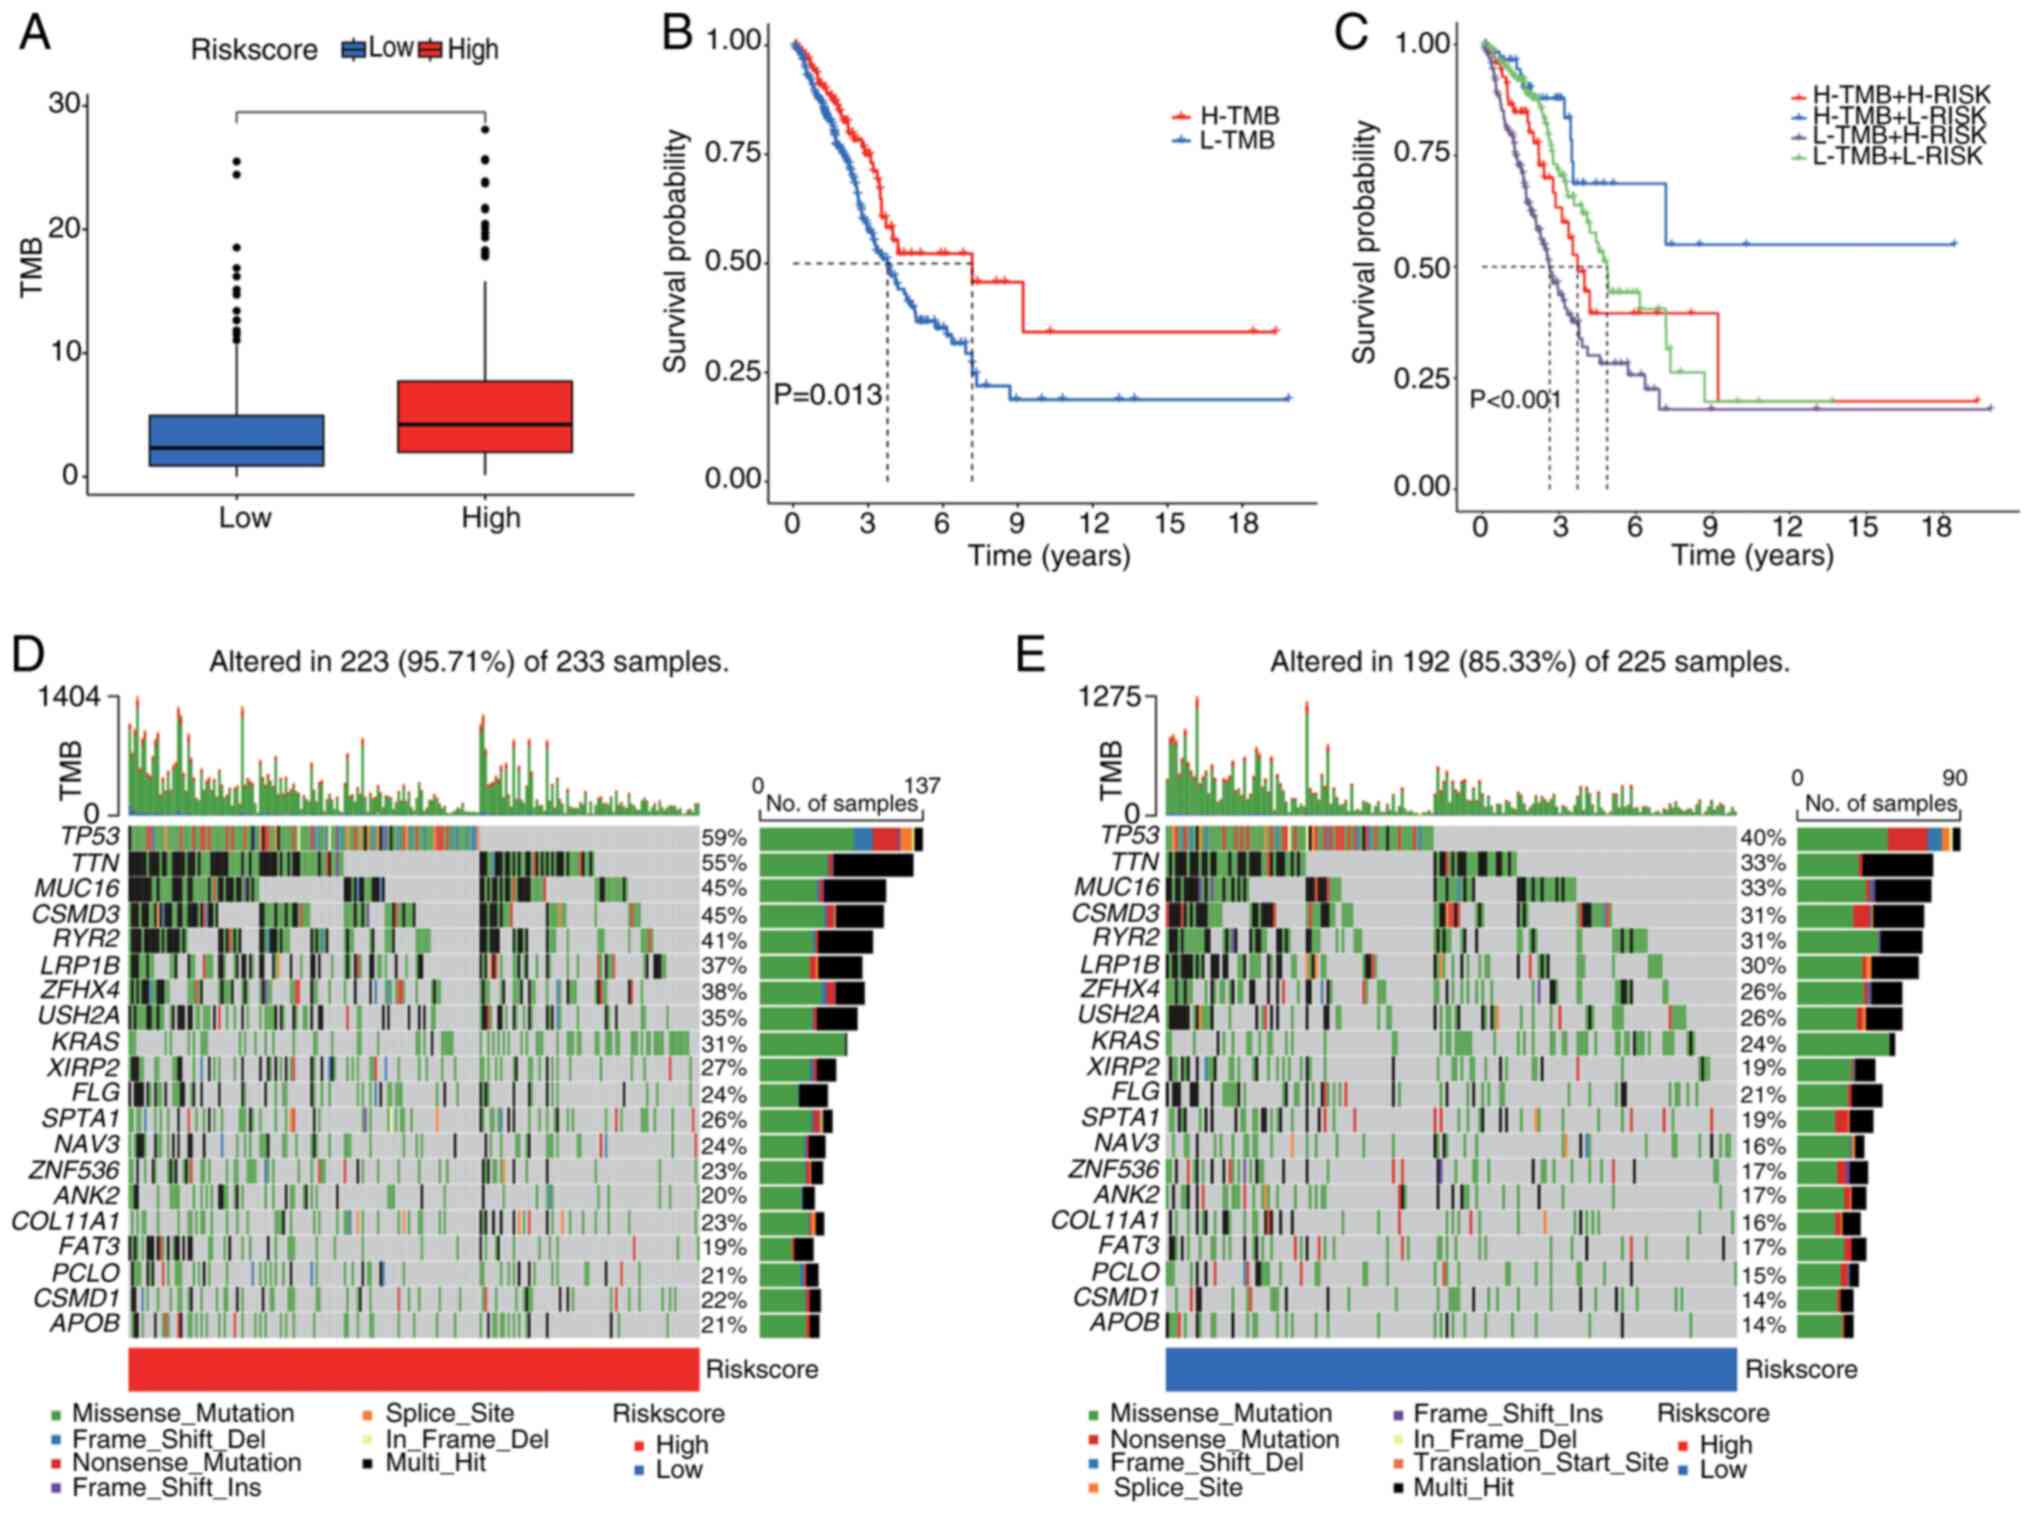
Genetic variation and functional
analysis
TMB was compared between the high- and low-risk
groups (Fig. 7A). The analysis
demonstrated that the high-risk group exhibited significantly
higher TMB levels than the low-risk group. Survival analysis
revealed that patients with elevated TMB had significantly improved
survival outcomes than those with lower TMB (Fig. 7B and C), suggesting an association
between TMB and prognosis. Moreover, when TMB was combined with the
risk score, patients in the low-TMB and high-risk group (L-TMB +
H-RISK) displayed the worst survival outcomes, whilst those in the
high-TMB and low-risk group (H-TMB + L-RISK) showed the best
survival results.
Additionally, in the high-risk cohort, 95.71% of the
223 samples had gene mutations (Fig.
7D). The most commonly mutated genes were tumor protein P53
(TP53; 59%), titin (TTN; 55%) and mucin 16 (MUC16; 45%), followed
by other frequently mutated genes such as CUB and sushi multiple
domains 3 (CSMD3), ryanodine receptor 2 (RYR2) and LDL receptor
related protein 1B (LRP1B). The predominant mutation types included
missense mutations and frameshift deletions. By contrast, in the
low-risk group, 85.33% of the 225 samples had gene mutations, with
TP53 (40%), TTN (33%) and MUC16 (33%) being the most frequently
mutated genes, followed by CSMD3, RYR2 and LRP1B (Fig. 7E). Whilst both groups shared common
mutated genes, the mutation frequency and TMB were markedly higher
in the high-risk group than in the low-risk group.
Role of risk score in immunotherapy
and drug sensitivity analysis
To assess the association between drug sensitivity,
cuproptosis-related mitochondrial genes and the risk score,
correlation analysis was performed. The results revealed
significant correlations between these genes, the risk score and
the sensitivity to several drugs (Fig.
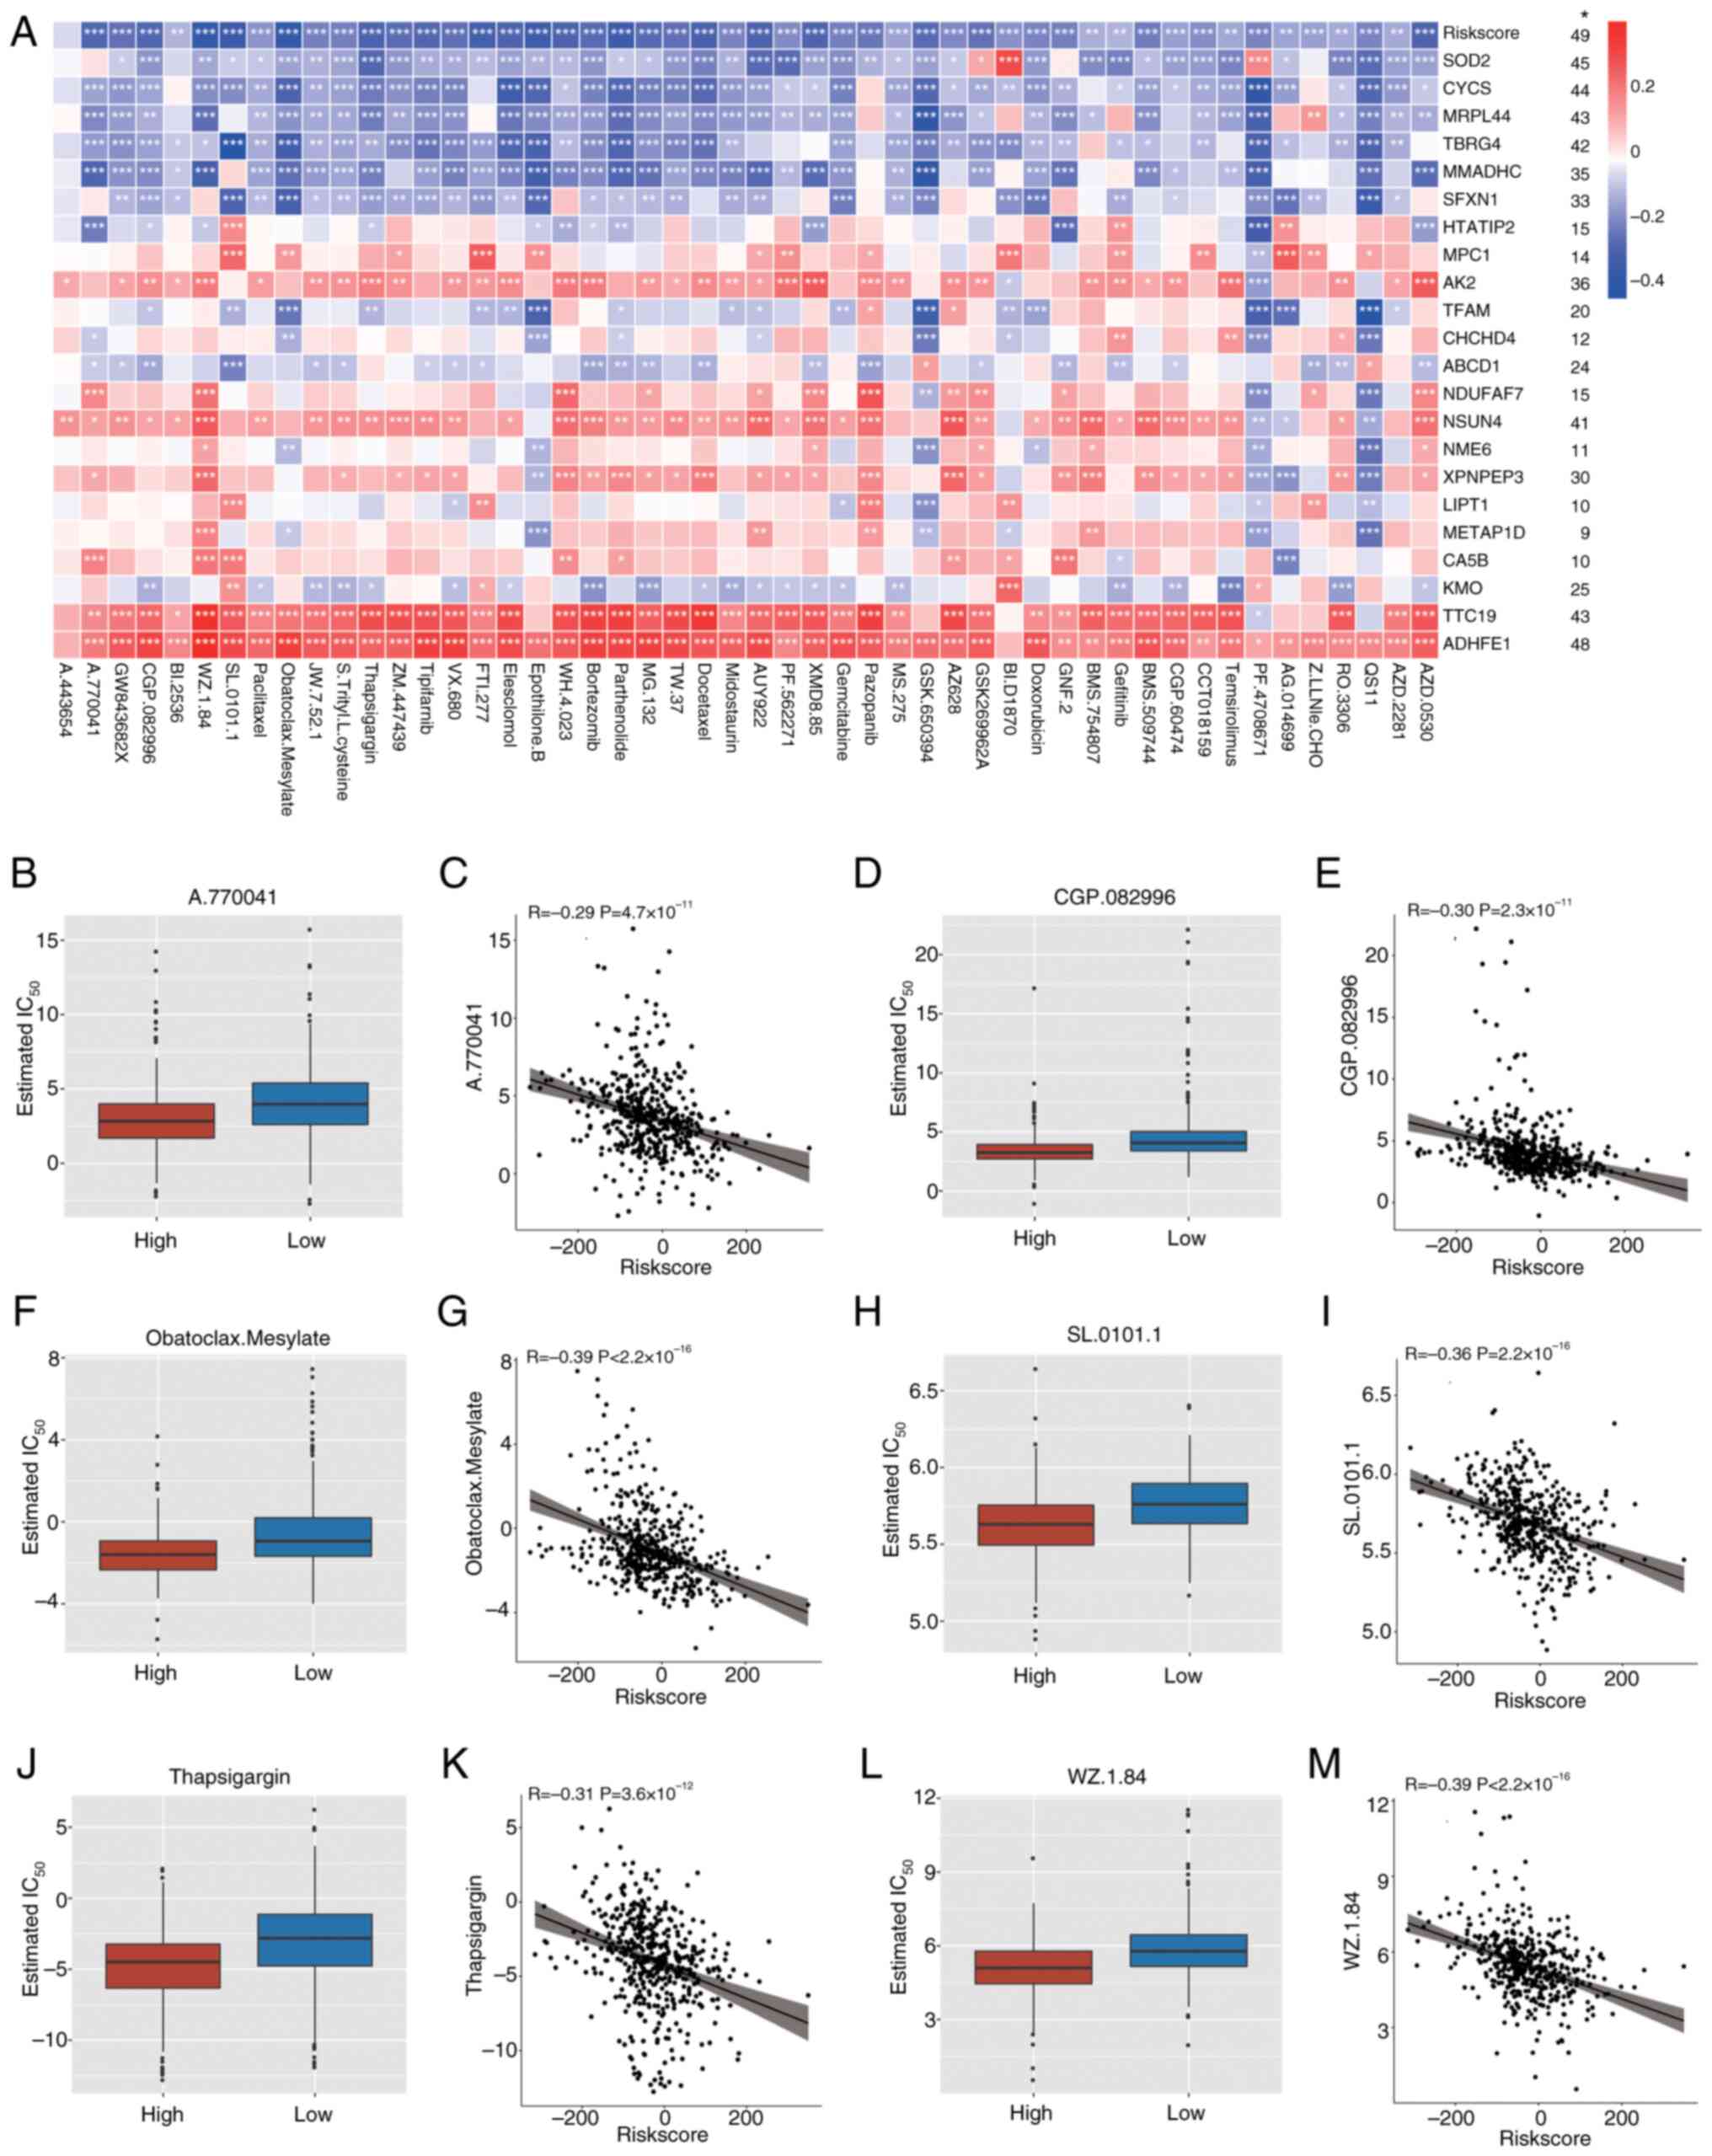
8A). Several drugs demonstrated a significant negative
correlation with the risk score, suggesting that patients in the
high-risk group are more responsive to these treatments. The
IC50 values for A770041, CGP.082996, Obatoclax.Mesylate,
SL.0101.1, Thapsigargin and WZ.1.84 were notably lower in the
high-risk group than in the low-risk group, indicating stronger
inhibitory effects (Fig. 8B, D, F, H, J
and L). Furthermore, significant negative correlations were
demonstrated between risk scores and IC50 values for
these drugs (Fig. 8C, E, G, I, K and
M), suggesting that as the risk score increases, drug
sensitivity significantly improves. Specifically, for high-risk
patients, drugs such as A770041, CGP.082996, and Obatoclax Mesylate
may offer more effective therapeutic outcomes, indicating that the
risk score may serve as a crucial prognostic marker and a predictor
of drug response.
Knockdown of SOD2 inhibits malignant
behavior in LUAD
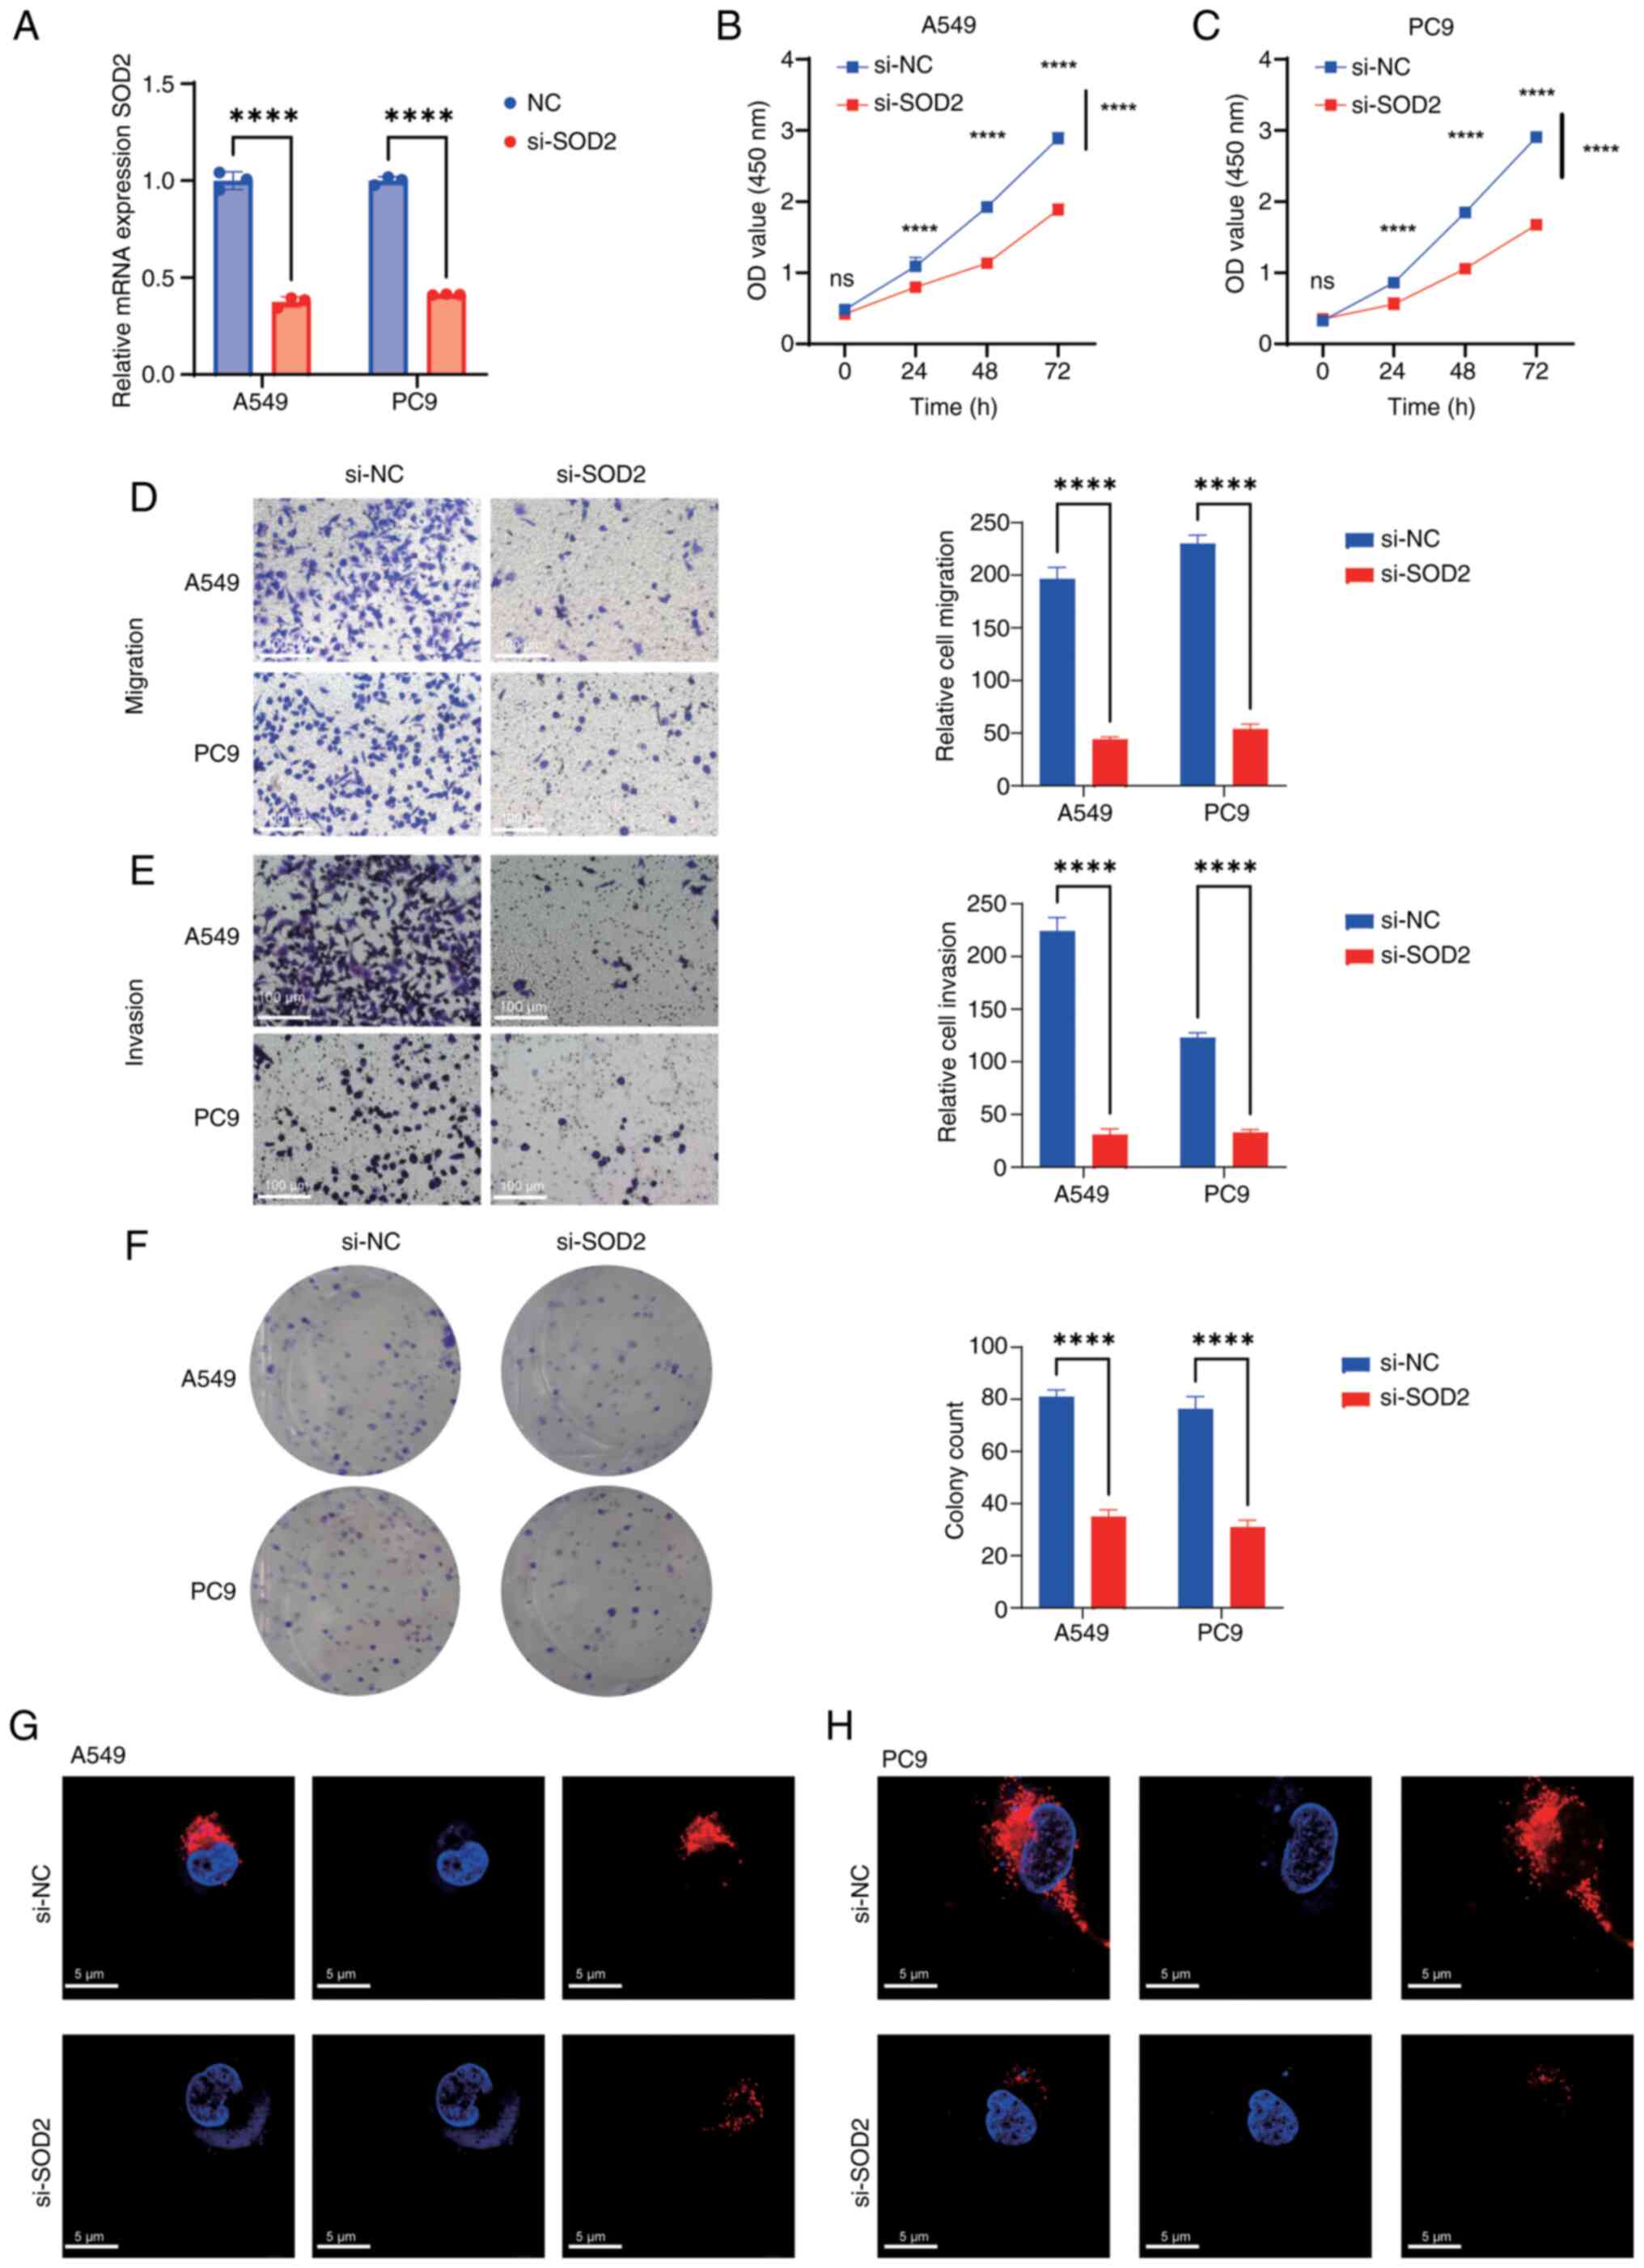
Among the aforementioned prognostic genes, SOD2,
CYCS, MRPL44, TBRG4, and MMADHC exhibited stronger drug
sensitivity, as indicated by a greater number of significantly
associated compounds (Fig. 8A). The
top 10 genes with high IC50 sensitivity and a
significant correlation with several drugs were screened, and SOD2
demonstrated a significant correlation with the highest number of
drugs. Therefore, we hypothesized that SOD2 has favorable
prognostic and therapeutic significance in LUAD, and the role of
SOD2 was further evaluated in vitro. First, SOD2 was
significantly knocked down in A549 and PC9 cells (Fig. 9A). Subsequently, CCK-8 assays
demonstrated a significant reduction in cell proliferation after
SOD2 knockdown in both cell lines compared with controls (Fig. 9B and C). Furthermore, it was
revealed that, compared with controls, there was a significant
decrease in cell migration and invasion (Fig. 9D and E), and a significant reduction
in cell proliferation (Fig. 9F)
post-SOD2 knockdown. Mitochondrial immunofluorescence assay
demonstrated that SOD2 knockdown markedly reduced mitochondrial
expression compared with controls (Fig.
9G and H).
Discussion
The primary aim of the present study was to develop
a prognostic model using cuproptosis-related mitochondrial genes
for risk stratification and prognosis prediction in patients with
LUAD, which may offer valuable insights for guiding the treatment
of LUAD.
Cuproptosis is a newly identified form of PCD that
is triggered by excessive intracellular accumulation of copper ions
(53). The buildup of copper
induces mitochondrial dysfunction, oxidative stress and damage to
critical intracellular biomolecules, leading to cell death. Unlike
other forms of PCD, such as apoptosis and necroptosis,
copper-induced cell death does not involve the activation of
caspases, particularly caspase-3, which is a hallmark of classical
apoptosis. Instead, cuproptosis is characterized by copper
accumulation that disrupts mitochondrial lipid metabolism and
destabilizes iron-sulfur (Fe/S) cluster-containing proteins,
resulting in mitochondrial membrane instability, oxidative damage
and subsequent cell death (10).
In LUAD, a highly invasive and metastatic subtype of
NSCLC, copper toxicity has been reported to promote mitochondrial
dysfunction (54), a hallmark of
cancer cell metabolic reprogramming. Tumor cells often exhibit the
‘Warburg effect’, favoring glycolysis over oxidative
phosphorylation for energy production even in the presence of
oxygen (55). This metabolic shift
not only supports rapid tumor cell proliferation but also renders
LUAD cells more susceptible to mitochondrial damage caused by
excess copper accumulation (56).
Elevated serum copper levels have been observed in patients with
lung cancer, with significantly increased levels in individuals
with advanced-stage disease compared with those diagnosed at
earlier stages (57). Copper ions
can promote tumor angiogenesis by activating hypoxia-inducible
factor-1 (HIF-1) and upregulating VEGF expression, thereby
facilitating the development and metastasis of lung cancer cells.
Additionally, copper ions may activate the AKT signaling pathway,
leading to anti-apoptotic effects in lung cancer cells. They also
enhance glycolysis and alter amino acid metabolism, further
reshaping the TME (58).
Elesclomol, an antitumor agent that targets
mitochondrial metabolism, exerts part of its anticancer activity by
inducing cuproptosis (59).
Disruption of intracellular copper homeostasis can lead to
metabolic imbalance and cell death. Disulfiram (DSF) has also been
reported to elevate intracellular copper levels, thereby inducing
death in lung cancer cells (60).
Moreover, the interplay between cuproptosis and mitochondrial
dysfunction provides critical insights into the progression and
therapeutic resistance of LUAD. Therefore, targeting
cuproptosis-related mechanisms, particularly by restoring and
regulating mitochondrial function during treatment, may offer novel
strategies for LUAD therapy. Therefore, the present study aimed to
identify a distinct cuproptosis-related mitochondrial gene
signature with significant prognostic value for LUAD, providing
potential molecular targets for precision oncology (61).
Through the analysis of TCGA dataset, 501 genes
related to cuproptosis and mitochondrial function were identified.
Using univariate Cox regression, LASSO regression and multiple
machine learning algorithms, 22 key genes significantly associated
with the prognosis of LUAD were screened. These genes (for example,
SOD2, MMADHC, CYCS, MPC1 and TFAM) are involved in mitochondrial
energy metabolism, oxidative stress response and the regulation of
apoptosis (62). The model was
constructed using TCGA-LUAD dataset and assessed in three
independent GEO datasets (GSE26939, GSE31210 and GSE72094). The
results demonstrated that the risk score based on these 22
cuproptosis-related mitochondrial genes effectively distinguished
between high- and low-risk patients. High-risk patients exhibited
worse survival outcomes across several clinical subgroups (age,
sex, clinical stage and TNM stage). Furthermore, both univariate
and multivariate Cox regression analyses revealed the risk score as
an independent prognostic factor for LUAD. A nomogram integrating
the risk score and clinical variables (clinical stage, T stage and
N stage) was constructed to predict 1-, 3- and 5-year survival
probabilities, thereby validating the clinical utility of the
model.
Research by Liu et al (63) employed LASSO regression to screen
for cuproptosis-related genes and included only two external
validation cohorts, without reporting ROC AUC values or performing
phenotype-related experiments such as CCK-8 or Transwell assays. By
contrast, the present study adopted a more comprehensive approach
by utilizing 117 machine learning algorithms to select prognostic
genes, incorporating three external GEO validation datasets, and
calculating the corresponding ROC AUC values. Furthermore,
extensive external validations were performed, including RT-qPCR,
CCK-8, Transwell and colony formation assays, and
immunofluorescence experiments. Similarly, the study by Yang et
al (64) also relied on LASSO
modeling to identify cuproptosis-related stemness genes, yet
validation was limited to a single GEO dataset (GSE141569) with AUC
values of <0.7, thus lacking persuasive power. The present
study, however, included three external GEO cohorts (GSE26939:
0.811, 0.714 and 0.708; GSE31210: 0.824, 0.657 and 0.732; and
GSE72094, 0.714, 0.671 and 0.769), most of which achieved AUC
values of >0.7, highlighting the robustness of the prognostic
model. Furthermore, research by You et al (65) only utilized LASSO for gene selection
and performed RT-qPCR as the sole validation method, whereas the
present work provided more comprehensive external validation
encompassing RNA expression, phenotypical assays in two cell lines
and immunofluorescence analysis. The study by Liang et al
(66), which compared Deep Neural
Network and Cox models, was limited by a single external validation
dataset (GSE68465). The time-dependent ROC analysis for 1-, 3-, and
5-year survival prediction yielded AUC values of 0.606, 0.621, and
0.603, respectively, all of which were <0.7, indicating
suboptimal prognostic performance. By contrast, the multi-model
screening using 117 machine learning algorithms in the present
study enabled the identification of optimal models with stronger
validation performance across multiple GEO datasets. Finally, the
study by Zhang et al (67)
used GSE68465 as the training set and TCGA, GSE72094 and GSE37745
as validation cohorts. As TCGA is the largest and most widely used
LUAD cohort, the authors believe it should serve as the training
dataset, with the GEO cohorts more suited for external validation.
Additionally, whilst the model by Zhang et al (67) yielded unsatisfactory time-dependent
AUC values in the GSE37745 dataset (0.658, 0.646 and 0.630 for
predicting 1-, 3-, and 5-year overall survival, respectively), the
prognostic model in the present study demonstrated notably greater
generalizability and predictive accuracy across multiple GEO
datasets. Collectively, the present study integrated a more
advanced machine learning framework, comprehensive external
validations and robust ROC performance, thus offering a marked
advancement over existing research in this field.
Zhao et al (21) established a prognostic model based
on hypoxia- and mitochondria-related genes, which were selected
using weighted gene co-expression network analysis. The model
incorporated 16 genes [pyruvate kinase M1/2 (PKM), S100 calcium
binding protein A16, related RAS viral (r-ras) oncogene homolog,
tubulin α4a, plakophilin 3, potassium channel tetramerization
domain containing 12, lysophosphatidylglycerol acyltransferase 1,
ITPR interacting domain containing 2, mitotic spindle organizing
protein 2A, leukemia inhibitory factor receptor alpha, protein
tyrosine phosphatase receptor type M, large tumor suppressor kinase
2, PDLIM1 interacting kinase 1 like, golgin RAB6-interacting,
protocadherin 7, and cadherin-like and PC-esterase domain
containing 1). The prognostic performance was evaluated using ROC
analysis, with AUC values of 0.721, 0.711 and 0.671 for 1-, 3- and
5-year survival in TCGA cohort, respectively. External validation
was performed using GSE31210 (AUC, 0.756, 0.641 and 0.669,
respectively) and GSE72094 (AUC, 0.672, 0.670 and 0.673,
respectively). Although the study also assessed the TME and drug
sensitivity, the model construction was based solely on a single
LASSO analysis, and external validation was limited to two datasets
without in vitro experimental validation. Moreover, Jiang
et al (26) developed a
prognostic model derived from cuproptosis- and anoikis-related
genes [eukaryotic translation initiation factor 2 α kinase 3
(EIF2AK3), IKAROS family zinc finger 3 (IKZF3), integrin subunit
alpha V (ITGAV), O-linked N-acetylglucosamine transferase (OGT),
polo-like kinase 1 (PLK1), TNF receptor associated factor 2
(TRAF2), and X-ray repair cross complementing 5 (XRCC5)], which
were selected using Pearson correlation analysis (threshold of
>0.3). The model was constructed using the LASSO algorithm and
further evaluated using immunohistochemistry data from the Human
Protein Atlas database, comparing gene expression between LUAD and
adjacent normal tissues. The ROC values for survival prediction in
TCGA cohort were 0.732, 0.743 and 0.712 for 1-, 3- and 5-year
survival, respectively. External validation in GSE26939 achieved
AUCs of 0.663, 0.614 and 0.599, respectively. In comparison with
the aforementioned models, the prognostic model in the present
study was constructed using a more robust and systematic pipeline.
First, prognostic genes were screened using Pearson correlation
analysis (threshold of >0.3), followed by evaluation across 117
machine learning algorithms to select the optimal model, thereby
ensuring optimum predictive performance. In terms of biological
insight, the present study comprehensively analyzed the TME using
ssGSEA for immune checkpoint and immune pathway enrichment
analysis, combined with immune scoring, TIDE prediction and
CIBERSORT for immune cell infiltration quantification. Furthermore,
TMB analysis was performed, not only comparing mutation counts
between high- and low-risk groups but also integrating survival
analysis to reveal the prognostic impact of TMB. A detailed
comparison between previous research and the present study is
provided in Table SII.
The present study explored a mitochondrial gene
signature related to cuproptosis, with a particular focus on SOD2.
This gene signature shares a common foundation with two recently
published signatures: Zhao et al (21), which focused on hypoxia and
mitochondrial-related genes, especially PKM2, and Jiang et
al (26), which identified a
cuproptosis-anoikis-related gene signature, including EIF2AK3,
IKZF3, ITGAV, OGT, TRAF2, XRCC5 and PLK1. The present study, along
with the gene signatures proposed by Zhao et al (21) and Jiang et al (26), aimed to identify and evaluate
mitochondria-related gene signatures with the potential to serve as
diagnostic and therapeutic targeting biomarkers in LUAD. The study
by Zhao et al (21) mainly
linked mitochondrial dysfunction with hypoxia. PKM2 is a
rate-limiting enzyme in glycolysis, catalyzing the conversion of
phosphoenolpyruvate to pyruvate. In tumor cells, it predominantly
exists in a low-activity dimeric form. PKM2 directly binds to
integrin β1, activating the FAK/SRC/ERK axis to promote tumor
metastasis and support angiogenesis. Furthermore, using integrin β1
inhibitors has been reported to markedly reduce tumor migration and
invasion, indicating that PKM2 could serve as a potential
diagnostic marker (68,69). Furthermore, in the signature by
Jiang et al (26), genes
such as EIF2AK3, IKZF3, ITGAV and OGT serve key roles in cell
survival, adhesion and oxidative stress responses. EIF2AK3, also
known as EIF2α kinase, is an important regulator of cellular stress
responses. It modulates the cell cycle and helps cancer cells
sustain growth, supporting the malignant phenotype of tumors
(70). ITGAV, a cell adhesion
molecule, promotes the interaction between cells and the
extracellular matrix, helping cells resist anoikis (death induced
by detachment), thereby assisting cancer cells in surviving and
circulating in the bloodstream (71). OGT, by modulating the glycosylation
of cell adhesion proteins, enhances the interaction between cells
and the matrix, potentially serving a role in resisting anoikis,
allowing cancer cells to survive after detaching from their primary
site and migrate to new locations (72).
The present study investigated the
cuproptosis-related mitochondrial gene signature. SOD2, identified
through drug sensitivity-related screening, is a mitochondrial
antioxidant enzyme that emphasizes the core role of oxidative
stress and mitochondrial damage in cuproptosis and cancer
progression. SOD2 protects cells from oxidative damage by clearing
ROS in the mitochondria, which is particularly important in cancer
cells, as they typically produce large amounts of ROS during
metabolic processes. Overexpression of SOD2 may help tumor cells
resist oxidative damage, promoting their survival in harsh
microenvironments (73). Therefore,
the development of SOD2 inhibitors or ROS modulators may increase
ROS levels, promoting cancer cell death, which has clinical
therapeutic implications. As such, SOD2 could serve as a potential
therapeutic marker in clinical treatments.
The innovations of the present study were as
follows: First, 117 machine learning algorithms (comprising 10
types of freely combinable machine learning methods) were applied
to identify prognostic genes, and the optimal model was selected
based on the highest concordance index (C-index). Second, three GEO
datasets were used for external validation, whereas most existing
studies used only one or two, thereby providing a more
comprehensive validation of model reliability and generalizability.
Third, the model in the present study achieved relatively high ROC
values in both TCGA validation and all three GEO test sets, with
several values reaching ≤0.8. The calibration curve closely aligned
with the ideal diagonal, indicating notable predictive performance
and strong clinical applicability (62). Moreover, the TME and TMB were
analyzed, and the results demonstrated that patients in the
high-risk group exhibited a greater number of gene mutations. This
provides important insights for guiding targeted therapy and
assessing prognosis. Finally, drug sensitivity analysis was
performed for 198 molecular drugs and the top 40 statistically
significant drugs were identified, offering clinical guidance for
chemotherapy and targeted therapy selection. Using the
‘oncoPredict’ R package, the IC50 values of these 198
drugs were evaluated, providing a valuable reference for future
personalized treatment strategies. Moreover, as the central theme
of the present study was the cuproptosis-related mitochondrial gene
signature, in vitro experiments were performed using
immunofluorescence techniques to visualize mitochondrial changes
after SOD2 gene knockdown, thereby validating the functional
relevance of mitochondria in this context.
The TME serves a key role in tumor progression,
immune evasion and treatment response. A study by Isomoto et
al (74) reported that the
immune landscape surrounding EGFR-mutant tumors in NSCLC exhibited
a lack of T cell infiltration, along with a reduced PD-L1+/CD8+
tumor-infiltrating lymphocytes ratio, underscoring the critical
role of the TME in immune therapy (75). The present study identified
significant differences in immune cell infiltration between high-
and low-risk patients with LUAD. Specifically, the high-risk group
had a higher proportion of immunosuppressive cells, including
regulatory T cells and myeloid-derived suppressor cells, which
suppress antitumor immune responses. By contrast, the low-risk
group exhibited a higher proportion of immune-activated cells, such
as CD4+ T cells and natural killer cells, suggesting a
more favorable immune microenvironment.
The present study also assessed the association
between the cuproptosis-related mitochondrial gene signature and
drug sensitivity. The correlation between risk scores and the
sensitivity of 198 different drugs was evaluated. The findings
indicated that high-risk patients had increased sensitivity to
specific chemotherapeutic and targeted therapeutic agents,
suggesting that these patients may benefit from certain drug
treatments. Additionally, the results revealed that drugs such as
A770041 and Obatoclax Mesylate were significantly associated with
risk scores, implying that these drugs might be more effective in
high-risk patients with LUAD compared with low-risk patients. In
the study by Chen et al (75), Obatoclax Mesylate, a Bcl-2 family
antagonist, was used in the treatment of hematologic malignancies
and solid tumors. The nanoparticle-targeted delivery system of this
drug improved its circulation time and accelerated delivery to
tumor sites, increasing tumor-targeting specificity.
Furthermore, Fig.
8A illustrates the strong correlation between MMADHC gene
expression and the IC50 values of several drugs.
However, the role of MMADHC in lung cancer or other malignancies
remains unexplored. Bhat et al (76) identified a homozygous pathogenic
mutation in MMADHC, which is associated with homocystinuria. By
contrast, the SOD2 gene, strongly correlated with the
IC50 values of several drugs, has been associated with
tumor development and progression. SOD2 is a crucial antioxidant
enzyme in humans and is part of the superoxide dismutase family
(77). Located on chromosome 6, the
SOD2 gene encodes the SOD2 protein found in mitochondria,
responsible for neutralizing superoxide anions
(O2−) and converting them into hydrogen
peroxide (H2O2), thus mitigating oxidative
stress and cellular damage. SOD2 can eliminate excessive
mitochondrial ROS. Deficiency in the sirtuin 3/SOD2 signaling
pathway leads to increased mitochondrial ROS and mitochondrial
damage. The underlying mechanisms include loss of mitochondrial
membrane potential, abnormal mitochondrial ultrastructure and
oxidative damage to mitochondrial DNA (78). Hernandez-Saavedra and McCord
(79) suggested that genetic
variations in SOD2 may increase the risk of cancer by creating
potential glucocorticoid response elements. Additionally, Zhao
et al (80) reported that
overexpression of microRNA-512-5p increased SOD2 levels, promoting
tumorigenesis and progression in NSCLC. At present, the specific
regulatory role of SOD2 in the cuproptosis pathway has not been
fully elucidated. However, recent findings by Li et al
(81) indirect supported a
potential association. In the present study, PX478, a HIF-1α
inhibitor, was reported to enhance oxidative stress in A549 cells
treated with DSF, as indicated by increased levels of ROS and
malondialdehyde, accompanied by a reduction in SOD levels. This
elevated oxidative stress subsequently upregulated ATPase copper
transporting β (ATP7B) expression, thereby promoting cuproptosis
and ultimately inhibiting the progression and metastasis of NSCLC
cells. Moreover, DSF treatment markedly decreased the viability of
A549 cells, and was associated with simultaneous upregulation of
ATP7B and PD-L1. Notably, when the dosage of DSF was insufficient
to induce robust cuproptosis, the increased PD-L1 expression
potentially contributed to enhanced immune suppression and immune
evasion, which may increase the risk of tumor cell proliferation
and metastasis. Notably, combination therapy with anti-PD-L1 agents
further augmented the antitumor effects of DSF, highlighting the
potential synergistic benefits of integrating immune checkpoint
blockade with cuproptosis-based therapeutic strategies in
NSCLC.
Copper ions can catalyze the formation of ROS,
leading to cellular damage, including mitochondrial dysfunction.
This is particularly evident in LUAD cells, as these cells are
often already in a high-oxidative state due to their rapid
metabolic activity. Cuproptosis, a form of cell death induced by
copper, takes advantage of this vulnerability (82). By increasing copper ion levels in
tumor cells, it can push them beyond their capacity to handle ROS,
ultimately leading to cell death. This mechanism may selectively
target cancer cells that are already primed to handle oxidative
stress while sparing normal cells (83). Although copper homeostasis is
critical for tumor progression, copper overload disrupts cellular
processes and induces cell death. Inducing cuproptosis in LUAD is a
potential strategy to exploit the inherent oxidative stress and
metabolic dysregulation of cancer cells, thereby selectively
killing them. By targeting copper transport mechanisms (such as
ATP7B) or using copper ionophores (such as DSF), it is possible to
selectively accumulate copper in cancer cells to induce
cuproptosis, thereby reducing tumor proliferation, migration and
metastasis (84). Copper ions also
serve a role in angiogenesis by activating VEGF. However, in cancer
cells, the regulation of copper uptake, distribution and efflux is
often impaired, leading to excessive intracellular copper
accumulation that drives the cells into a programmed death state
(cuproptosis). There is growing interest in exploiting this
imbalance in copper homeostasis to achieve therapeutic effects
(85–87). Therefore, increasing copper levels
beyond physiological thresholds could be a way to ‘push’ cancer
cells into an irreversible cell death state. In summary, whilst
copper can promote tumor growth by supporting cellular functions,
targeting copper overload via cuproptosis is an emerging strategy
to selectively induce cancer cell death in LUAD. This approach aims
to exploit the vulnerability of cancer cells to excess copper,
making cuproptosis a promising mechanism to consider in LUAD
treatment.
The study by Tsvetkov et al (88) reported that excessive Cu ions led to
ROS generation via the Fenton reaction. When intracellular copper
ion levels increase tenfold, it triggers cuproptosis, causing lipid
peroxidation and mitochondrial dysfunction. DSF can induce
apoptosis in tumor cells through copper ions, as reported in
vitro by Li et al (81),
where DSF promoted overexpression of ATP7B and PD-L1, inhibiting
the cell viability of A549 cells and enhancing oxidative stress,
which led to tumor cell apoptosis. The cuproptosis inducer DSF
combined with sulfasalazine (SAS) has been proposed as a new
antitumor drug. DSF regulates intracellular copper ion levels,
promoting cuproptosis in NSCLC tumor cells, and enhances
mitochondrial reactive oxygen species-mediated oxidative
stress-induced cytotoxicity. In a mouse model, SAS combined with
DSF-Cu markedly reduced both tumor size and number. In a mouse
model, SAS combined with DSF-Cu markedly reduced both tumor size
and number (89). Moreover, in
vitro research by Liu et al (90) demonstrated that DSF-Cu exhibited
anti-angiogenic activity by inhibiting EGFR, fibroblast growth
factor receptor 1 and IGF-1Rβ. It also notably suppressed stem cell
transcription factors such as SRY-box 2, thereby inhibiting tumor
stem cell proliferation and invasion. Additionally, it enhanced
cuproptosis in tumor cells. DSF-Cu can synergize with the WEE1
inhibitor Adavosertib to induce G2/M phase arrest and promote
cuproptosis in NSCLC tumor cells (91). Furthermore, in in vitro mouse
models, the combination of DSF-Cu and Adavosertib markedly reduced
tumor size and weight, especially in a p53-deficient xenograft
model (91).
While the present study offers valuable insights
into the prognostic significance of the cuproptosis-mitochondrial
gene signature in LUAD, several limitations exist. First, despite
the high predictive accuracy of the model across multiple datasets,
its clinical applicability requires further validation in
prospective clinical trials. Second, although based on extensive
RNA sequencing data, future studies could include single-cell RNA
sequencing and spatial transcriptomics to explore cellular
heterogeneity and expression patterns in different tissue areas.
Third, although the machine learning model predicts survival
outcomes effectively, its predictive power could be improved by
incorporating additional clinical variables (such as treatment
history and molecular subtypes).
In conclusion, the present study established a
comprehensive prognostic model based on the copper
death-mitochondrial-related gene signature, which not only provides
new insights into the molecular mechanisms of LUAD but also offers
valuable guidance for clinical decision-making. Future research
should further validate the findings of the present study, explore
novel therapies targeting the copper death pathway, and improve
treatment outcomes for patients with LUAD through personalized
therapeutic strategies.
Supplementary Material
Supporting Data
Supporting Data
Supporting Data
Acknowledgements
Not applicable.
Funding
The present study was funded by the Tianjin Municipal Health
Commission, the Tianjin Key Medical Discipline Sub-project (grant
no. TJLCMS2021-06), the Tianjin Municipal Education Commission
through the General Project of the Natural Science Foundation
(grant no. 2020KJ162), the Wu Jieping Medical Foundation (grant no.
320.6750.2022-11-43), the National Natural Science Foundation of
China (grant no. 82172569), the Natural Science Foundation of
Tianjin (grant no. 23JCYBJC01010) and the Tianjin Key Medical
Discipline (Specialty) Construction Project (grant no.
TJYXZDXK-061B).
Availability of data and materials
The data generated in the present study may be
requested from the corresponding author.
Authors' contributions
YHL, WHZ, ZXZ and ZXD conceived and designed the
study, analyzed and interpreted data, drafted and critically
revised the manuscript, approved the final version, and agree to be
accountable for all aspects of the work. HH, CD, YWL, MHL, HBZ and
MW analyzed and interpreted data; assisted with figure preparation,
visualization, reference organization, and manuscript drafting or
revision; reviewed and approved the final version. JC supervised
the entire project, contributed to study design and data
interpretation, critically reviewed the manuscript, approved the
final version. HLZ performed the experiments, supervised laboratory
work, obtained funding and resources, critically reviewed the
manuscript. All authors have read and approved the final
manuscript. YHL and WHZ confirm the authenticity of all the raw
data.
Ethics approval and consent to
participate
Not applicable.
Patient consent for publication
Not applicable.
Competing interests
The authors declare that they have no competing
interests.
References
|
1
|
Zhang Y, Vaccarella S, Morgan E, Li M,
Etxeberria J, Chokunonga E, Manraj SS, Kamate B, Omonisi A and Bray
F: Global variations in lung cancer incidence by histological
subtype in 2020: A population-based study. Lancet Oncol.
24:1206–1218. 2023. View Article : Google Scholar : PubMed/NCBI
|
|
2
|
Florez N, Kiel L, Riano I, Patel S,
DeCarli K, Dhawan N, Franco I, Odai-Afotey A, Meza K, Swami N, et
al: Lung cancer in women: The past, present, and future. Clin Lung
Cancer. 25:1–8. 2024. View Article : Google Scholar : PubMed/NCBI
|
|
3
|
Carter-Harris L: Lung cancer stigma as a
barrier to medical help-seeking behavior: Practice implications. J
Am Assoc Nurse Pract. 27:240–245. 2015. View Article : Google Scholar : PubMed/NCBI
|
|
4
|
Liu HI, Chiang CJ, Su SY, Jhuang JR, Tsai
DR, Yang YW, Lin LJ, Wang YC and Lee WC: Incidence trends and
spatial distributions of lung adenocarcinoma and squamous cell
carcinoma in Taiwan. Sci Rep. 13:16552023. View Article : Google Scholar : PubMed/NCBI
|
|
5
|
Nakagawa K, Yoshida Y, Yotsukura M and
Watanabe SI: Minimally invasive open surgery (MIOS) for clinical
stage I lung cancer: Diversity in minimally invasive procedures.
Jpn J Clin Oncol. 51:1649–1655. 2021. View Article : Google Scholar : PubMed/NCBI
|
|
6
|
Duma N, Santana-Davila R and Molina JR:
Non-small cell lung cancer: Epidemiology, screening, diagnosis, and
treatment. Mayo Clin Proc. 94:1623–1640. 2019. View Article : Google Scholar : PubMed/NCBI
|
|
7
|
Doval DC, Desai CJ and Sahoo TP:
Molecularly targeted therapies in non-small cell lung cancer: The
evolving role of tyrosine kinase inhibitors. Indian J Cancer. 56
(Suppl 1):S23–S30. 2019. View Article : Google Scholar : PubMed/NCBI
|
|
8
|
Laerum D, Strand TE, Brustugun OT,
Gallefoss F, Falk R, Durheim MT and Fjellbirkeland L: Evaluation of
sex inequity in lung-cancer-specific survival. Acta Oncol.
63:343–350. 2024. View Article : Google Scholar : PubMed/NCBI
|
|
9
|
Lyu G, Dai L, Deng X, Liu X, Guo Y, Zhang
Y, Wang X, Huang Y, Wu S, Guo JC and Liu Y: Integrative analysis of
cuproptosis-related mitochondrial depolarisation genes for
prognostic prediction in non-small cell lung cancer. J Cell Mol
Med. 29:e704382025. View Article : Google Scholar : PubMed/NCBI
|
|
10
|
Tong X, Tang R, Xiao M, Xu J, Wang W,
Zhang B, Liu J, Yu X and Shi S: Targeting cell death pathways for
cancer therapy: Recent developments in necroptosis, pyroptosis,
ferroptosis, and cuproptosis research. J Hematol Oncol. 15:1742022.
View Article : Google Scholar : PubMed/NCBI
|
|
11
|
Wang W, Lu K, Jiang X, Wei Q, Zhu L, Wang
X, Jin H and Feng L: Ferroptosis inducers enhanced cuproptosis
induced by copper ionophores in primary liver cancer. J Exp Clin
Cancer Res. 42:1422023. View Article : Google Scholar : PubMed/NCBI
|
|
12
|
Chen L, Min J and Wang F: Copper
homeostasis and cuproptosis in health and disease. Signal Transduct
Target Ther. 7:3782022. View Article : Google Scholar : PubMed/NCBI
|
|
13
|
Faubert B, Li KY, Cai L, Hensley CT, Kim
J, Zacharias LG, Yang C, Do QN, Doucette S, Burguete D, et al:
Lactate metabolism in human lung tumors. Cell. 171:358–371. 2017.
View Article : Google Scholar : PubMed/NCBI
|
|
14
|
He Y, Ji Z, Gong Y, Fan L, Xu P, Chen X,
Miao J, Zhang K, Zhang W, Ma P, et al: Numb/Parkin-directed
mitochondrial fitness governs cancer cell fate via metabolic
regulation of histone lactylation. Cell Rep. 42:1120332023.
View Article : Google Scholar : PubMed/NCBI
|
|
15
|
Elnaggar GN, El-Hifnawi NM, Ismail A,
Yahia M and Elshimy RAA: Micro RNA-148a targets Bcl-2 in patients
with non-small cell lung cancer. Asian Pac J Cancer Prev.
22:1949–1955. 2021. View Article : Google Scholar : PubMed/NCBI
|
|
16
|
Ran XM, Xiao H, Tang YX, Jin X, Tang X,
Zhang J, Li H, Li YK and Tang ZZ: The effect of
cuproptosis-relevant genes on the immune infiltration and
metabolism of gynecological oncology by multiply analysis and
experiments validation. Sci Rep. 13:194742023. View Article : Google Scholar : PubMed/NCBI
|
|
17
|
Huang H, Shi Z, Li Y, Zhu G, Chen C, Zhang
Z, Shi R, Su L, Cao P, Pan Z, et al: Pyroptosis-related LncRNA
signatures correlate with lung adenocarcinoma prognosis. Front
Oncol. 12:8509432022. View Article : Google Scholar : PubMed/NCBI
|
|
18
|
Wilkerson MD, Yin X, Walter V, Zhao N,
Cabanski CR, Hayward MC, Miller CR, Socinski MA, Parsons AM, Thorne
LB, et al: Differential pathogenesis of lung adenocarcinoma
subtypes involving sequence mutations, copy number, chromosomal
instability, and methylation. PLoS One. 7:e365302012. View Article : Google Scholar : PubMed/NCBI
|
|
19
|
Okayama H, Kohno T, Ishii Y, Shimada Y,
Shiraishi K, Iwakawa R, Furuta K, Tsuta K, Shibata T, Yamamoto S,
et al: Identification of genes upregulated in ALK-positive and
EGFR/KRAS/ALK-negative lung adenocarcinomas. Cancer Res.
72:100–111. 2012. View Article : Google Scholar : PubMed/NCBI
|
|
20
|
Schabath MB, Welsh EA, Fulp WJ, Chen L,
Teer JK, Thompson ZJ, Engel BE, Xie M, Berglund AE, Creelan BC, et
al: Differential association of STK11 and TP53 with KRAS
mutation-associated gene expression, proliferation and immune
surveillance in lung adenocarcinoma. Oncogene. 35:3209–3216. 2016.
View Article : Google Scholar : PubMed/NCBI
|
|
21
|
Zhao W, Huang H, Zhao Z, Ding C, Jia C,
Wang Y, Wang G, Li Y, Liu H and Chen J: Identification of hypoxia
and mitochondrial-related gene signature and prediction of
prognostic model in lung adenocarcinoma. J Cancer. 15:4513–4526.
2024. View Article : Google Scholar : PubMed/NCBI
|
|
22
|
Zhang Z, Zhang P, Xie J, Cui Y, Shuo W and
Yue D: Five-gene prognostic model based on autophagy-dependent cell
death for predicting prognosis in lung adenocarcinoma. Sci Rep.
14:264492024. View Article : Google Scholar : PubMed/NCBI
|
|
23
|
Huang J, Zhang J, Zhang F, Lu S, Guo S,
Shi R, Zhai Y, Gao Y, Tao X, Jin Z, et al: Identification of a
disulfidptosis-related genes signature for prognostic implication
in lung adenocarcinoma. Comput Biol Med. 165:1074022023. View Article : Google Scholar : PubMed/NCBI
|
|
24
|
Ritchie ME: limma: Linear models for
microarray and RNA-Seq data. The R Foundation for Statistical
Computing. 2024.
|
|
25
|
He Y, Jiang Z, Chen C and Wang X:
Classification of triple-negative breast cancers based on
Immunogenomic profiling. J Exp Clin Cancer Res. 37:3272018.
View Article : Google Scholar : PubMed/NCBI
|
|
26
|
Jiang G, Song C, Wang X, Xu Y, Li H, He Z,
Cai Y, Zheng M and Mao W: The multi-omics analysis identifies a
novel cuproptosis-anoikis-related gene signature in prognosis and
immune infiltration characterization of lung adenocarcinoma.
Heliyon. 9:e140912023. View Article : Google Scholar : PubMed/NCBI
|
|
27
|
Wang B, Yin Y, Wang A, Liu W, Chen J and
Li T: SMR-guided molecular subtyping and machine learning model
reveals novel prognostic biomarkers and therapeutic targets in
non-small cell lung adenocarcinoma. Sci Rep. 15:16402025.
View Article : Google Scholar : PubMed/NCBI
|
|
28
|
Ma Y, Li J, Xiong C, Sun X and Shen T:
Development of a prognostic model for NSCLC based on differential
genes in tumour stem cells. Sci Rep. 14:209382024. View Article : Google Scholar : PubMed/NCBI
|
|
29
|
Wang Z, Zhang J, Zhang H, Dai Z, Liang X,
Li S, Peng R, Zhang X, Liu F, Liu Z, et al: CMTM family genes
affect prognosis and modulate immunocytes infiltration in grade
II/III glioma patients by influencing the tumor immune landscape
and activating associated immunosuppressing pathways. Front Cell
Dev Biol. 10:7408222022. View Article : Google Scholar : PubMed/NCBI
|
|
30
|
Chen Z and Zhang Y: Development of an
immune-related gene signature applying ridge method for improving
immunotherapy responses and clinical outcomes in lung
adenocarcinoma. PeerJ. 13:e191212025. View Article : Google Scholar : PubMed/NCBI
|
|
31
|
Ghisai SA, Barin N, van Hijfte L, Verhagen
K, de Wit M, van den Bent MJ, Hoogstrate Y and French PJ:
Transcriptomic analysis of EGFR co-expression and activation in
glioblastoma reveals associations with its ligands. Neurooncol Adv.
7:vdae2292025.PubMed/NCBI
|
|
32
|
Han AX, Long BY, Li CY, Huang DD, Xiong
EQ, Li FJ, Wu GL, Liu Q, Yang GB and Hu HY: Machine learning
framework develops neutrophil extracellular traps model for
clinical outcome and immunotherapy response in lung adenocarcinoma.
Apoptosis. 29:1090–1108. 2024. View Article : Google Scholar : PubMed/NCBI
|
|
33
|
Chen T, Yang Y, Huang Z, Pan F, Xiao Z,
Gong K, Huang W, Xu L, Liu X and Fang C: Prognostic risk modeling
of endometrial cancer using programmed cell death-related genes: A
comprehensive machine learning approach. Discov Oncol. 16:2802025.
View Article : Google Scholar : PubMed/NCBI
|
|
34
|
Feng Q, Lu H and Wu L: Identification of
M2-like macrophage-related signature for predicting the prognosis,
ecosystem and immunotherapy response in hepatocellular carcinoma.
PLoS One. 18:e02916452023. View Article : Google Scholar : PubMed/NCBI
|
|
35
|
Xu L, Wu J, Tian J, Zhang B, Zhao Y, Zhao
Z, Luo Y and Li Y: Machine Learning unveils sphingolipid
Metabolism's role in tumour microenvironment and immunotherapy in
lung cancer. J Cell Mol Med. 29:e704352025. View Article : Google Scholar : PubMed/NCBI
|
|
36
|
Meng WJ, Guo JM, Huang L, Zhang YY, Zhu
YT, Tang LS, Wang JL, Li HS and Liu JY: Anoikis-related long
non-coding RNA signatures to predict prognosis and immune
infiltration of gastric cancer. Bioengineering (Basel). 11:8932024.
View Article : Google Scholar : PubMed/NCBI
|
|
37
|
Therneau TM: Survival: Survival analysis.
The R Foundation for Statistical Computing. 2024.
|
|
38
|
Kassambara A: Survminer: Drawing survival
curves using ‘ggplot2’. The R Foundation for Statistical Computing.
2024.
|
|
39
|
Wickham H: ggplot2: Create elegant data
visualisations using the grammar of graphics. The R Foundation for
Statistical Computing. 2025.
|
|
40
|
Harrell FE Jr: rms: Regression modeling
strategies. The R Foundation for Statistical Computing. 2024.
|
|
41
|
Jiang P, Gu S, Pan D, Fu J, Sahu A, Hu X,
Li Z, Traugh N, Bu X, Li B, et al: Signatures of T cell dysfunction
and exclusion predict cancer immunotherapy response. Nat Med.
24:1550–1558. 2018. View Article : Google Scholar : PubMed/NCBI
|
|
42
|
Yoshihara K, Shahmoradgoli M, Martinez E,
Vegesna R, Kim H, Torres-Garcia W, Treviño V, Shen H, Laird PW,
Levine DA, et al: Inferring tumour purity and stromal and immune
cell admixture from expression data. Nat Commun. 4:26122013.
View Article : Google Scholar : PubMed/NCBI
|
|
43
|
Newman AM, Liu CL, Green MR, Gentles AJ,
Feng W, Xu Y, Hoang CD, Diehn M and Alizadeh AA: Robust enumeration
of cell subsets from tissue expression profiles. Nat Methods.
12:453–457. 2015. View Article : Google Scholar : PubMed/NCBI
|
|
44
|
Aran D, Hu Z and Butte AJ: xCell:
Digitally portraying the tissue cellular heterogeneity landscape.
Genome Biol. 18:2202017. View Article : Google Scholar : PubMed/NCBI
|
|
45
|
Mayakonda A: maftools: Summarize, analyze
and visualize MAF files. The R Foundation for Statistical
Computing. 2025.
|
|
46
|
Maeser D: oncoPredict: Drug response
modeling and biomarker discovery. The R Foundation for Statistical
Computing. 2024.
|
|
47
|
Kassambara A: ggpubr: ‘ggplot2’-Based
Publication Ready Plots. The R Foundation for Statistical
Computing. 2025.
|
|
48
|
Kolde R: pheatmap: Pretty Heatmaps. The R
Foundation for Statistical Computing. 2025.
|
|
49
|
Revelle W: Psych: Procedures for
psychological, psychometric, and personality research. The R
Foundation for Statistical Computing. 2025.
|
|
50
|
Livak KJ and Schmittgen TD: Analysis of
relative gene expression data using real-time quantitative PCR and
the 2(−Delta Delta C(T)) method. Methods. 25:402–408. 2001.
View Article : Google Scholar : PubMed/NCBI
|
|
51
|
Pan J, Liu F, Xiao X, Xu R, Dai L, Zhu M,
Xu H, Xu Y, Zhao A, Zhou W, et al: METTL3 promotes colorectal
carcinoma progression by regulating the m6A-CRB3-Hippo axis. J Exp
Clin Cancer Res. 41:192022. View Article : Google Scholar : PubMed/NCBI
|
|
52
|
Li J, Xie H, Ying Y, Chen H, Yan H, He L,
Xu M, Xu X, Liang Z, Liu B, et al: YTHDF2 mediates the mRNA
degradation of the tumor suppressors to induce AKT phosphorylation
in N6-methyladenosine-dependent way in prostate cancer. Mol Cancer.
19:1522020. View Article : Google Scholar : PubMed/NCBI
|
|
53
|
Wen H, Qu C, Wang Z, Gao H, Liu W, Wang H,
Sun H, Gu J, Yang Z and Wang X: Cuproptosis enhances docetaxel
chemosensitivity by inhibiting autophagy via the DLAT/mTOR pathway
in prostate cancer. FASEB J. 37:e231452023. View Article : Google Scholar : PubMed/NCBI
|
|
54
|
Zhu S, Wu H, Cui H, Guo H, Ouyang Y, Ren
Z, Deng Y, Geng Y, Ouyang P, Wu A, et al: Induction of mitophagy
via ROS-dependent pathway protects copper-induced hypothalamic
nerve cell injury. Food Chem Toxicol. 181:1140972023. View Article : Google Scholar : PubMed/NCBI
|
|
55
|
Vander Heiden MG, Cantley LC and Thompson
CB: Understanding the Warburg effect: The metabolic requirements of
cell proliferation. Science. 324:1029–1033. 2009. View Article : Google Scholar : PubMed/NCBI
|
|
56
|
Tsvetkov P, Detappe A, Cai K, Keys HR,
Brune Z, Ying W, Thiru P, Reidy M, Kugener G, Rossen J, et al:
Mitochondrial metabolism promotes adaptation to proteotoxic stress.
Nat Chem Biol. 15:681–689. 2019. View Article : Google Scholar : PubMed/NCBI
|
|
57
|
Su Y, Zhang X, Li S, Xie W and Guo J:
Emerging roles of the copper-CTR1 axis in tumorigenesis. Mol Cancer
Res. 20:1339–1353. 2022. View Article : Google Scholar : PubMed/NCBI
|
|
58
|
Wu Z, Zhang W and Kang YJ: Copper affects
the binding of HIF-1α to the critical motifs of its target genes.
Metallomics. 11:429–438. 2019. View Article : Google Scholar : PubMed/NCBI
|
|
59
|
Zheng P, Zhou C, Lu L, Liu B and Ding Y:
Elesclomol: A copper ionophore targeting mitochondrial metabolism
for cancer therapy. J Exp Clin Cancer Res. 41:2712022. View Article : Google Scholar : PubMed/NCBI
|
|
60
|
Li Q, Wang T, Zhou Y and Shi J:
Cuproptosis in lung cancer: Mechanisms and therapeutic potential.
Mol Cell Biochem. 479:1487–1499. 2024. View Article : Google Scholar : PubMed/NCBI
|
|
61
|
Li H, Fu Y, Xu Y, Miao H, Wang H, Zhang T,
Mei X, He Y, Zhang A and Ge X: Cuproptosis associated cytoskeletal
destruction contributes to podocyte injury in chronic kidney
disease. Am J Physiol Cell Physiol. 327:C254–C269. 2024. View Article : Google Scholar : PubMed/NCBI
|
|
62
|
Zhao W, Ding C, Zhao M, Li Y, Huang H, Li
X, Cheng Q, Shi Z, Gao W, Liu H and Chen J: Identification and
validation of a hypoxia and glycolysis prognostic signatures in
lung adenocarcinoma. J Cancer. 15:1568–1582. 2024. View Article : Google Scholar : PubMed/NCBI
|
|
63
|
Liu Y, Lin W, Yang Y, Shao J, Zhao H, Wang
G and Shen A: Role of cuproptosis-related gene in lung
adenocarcinoma. Front Oncol. 12:10809852022. View Article : Google Scholar : PubMed/NCBI
|
|
64
|
Yang J, Liu K, Yang L, Ji J, Qin J, Deng H
and Wang Z: Identification and validation of a novel
cuproptosis-related stemness signature to predict prognosis and
immune landscape in lung adenocarcinoma by integrating single-cell
and bulk RNA-sequencing. Front Immunol. 14:11747622023. View Article : Google Scholar : PubMed/NCBI
|
|
65
|
You J, Yu Q, Chen R, Li J, Zhao T and Lu
Z: A prognostic model for lung adenocarcinoma based on cuproptosis
and disulfidptosis related genes revealing the key prognostic role
of FURIN. Sci Rep. 15:60572025. View Article : Google Scholar : PubMed/NCBI
|
|
66
|
Liang P, Chen J, Yao L, Hao Z and Chang Q:
A deep learning approach for prognostic evaluation of lung
adenocarcinoma based on cuproptosis-related genes. Biomedicines.
11:14792023. View Article : Google Scholar : PubMed/NCBI
|
|
67
|
Zhang W, Qu H, Ma X, Li L, Wei Y, Wang Y,
Zeng R, Nie Y, Zhang C, Yin K, et al: Identification of cuproptosis
and immune-related gene prognostic signature in lung
adenocarcinoma. Front Immunol. 14:11797422023. View Article : Google Scholar : PubMed/NCBI
|
|
68
|
Wang C, Zhang S, Liu J, Tian Y, Ma B, Xu
S, Fu Y and Luo Y: Secreted pyruvate kinase M2 promotes lung cancer
metastasis through activating the integrin Beta1/FAK signaling
pathway. Cell Rep. 30:1780–1797. 2020. View Article : Google Scholar : PubMed/NCBI
|
|
69
|
Yin L, Shi J, Zhang J, Lin X, Jiang W, Zhu
Y, Song Y, Lu Y and Ma Y: PKM2 is a potential prognostic biomarker
and related to immune infiltration in lung cancer. Sci Rep.
13:222432023. View Article : Google Scholar : PubMed/NCBI
|
|
70
|
Liu Y, Liang X, Zhang H, Dong J, Zhang Y,
Wang J, Li C, Xin X and Li Y: ER stress-related genes EIF2AK3,
HSPA5, and DDIT3 polymorphisms are associated with risk of lung
cancer. Front Genet. 13:9387872022. View Article : Google Scholar : PubMed/NCBI
|
|
71
|
Cheuk IW, Siu MT, Ho JC, Chen J, Shin VY
and Kwong A: ITGAV targeting as a therapeutic approach for
treatment of metastatic breast cancer. Am J Cancer Res. 10:211–223.
2020.PubMed/NCBI
|
|
72
|
Wu D, Jin J, Qiu Z, Liu D and Luo H:
Functional analysis of O-GlcNAcylation in cancer metastasis. Front
Oncol. 10:5852882020. View Article : Google Scholar : PubMed/NCBI
|
|
73
|
Crawford A, Fassett RG, Geraghty DP, Kunde
DA, Ball MJ, Robertson IK and Coombes JS: Relationships between
single nucleotide polymorphisms of antioxidant enzymes and disease.
Gene. 501:89–103. 2012. View Article : Google Scholar : PubMed/NCBI
|
|
74
|
Isomoto K, Haratani K, Hayashi H, Shimizu
S, Tomida S, Niwa T, Yokoyama T, Fukuda Y, Chiba Y, Kato R, et al:
Impact of EGFR-TKI treatment on the tumor immune microenvironment
in EGFR mutation-positive non-small cell lung cancer. Clin Cancer
Res. 26:2037–2046. 2020. View Article : Google Scholar : PubMed/NCBI
|
|
75
|
Chen S, Ren Y and Duan P: Biomimetic
nanoparticle loading obatoclax mesylate for the treatment of
non-small-cell lung cancer (NSCLC) through suppressing bcl-2
signaling. Biomed Pharmacother. 129:1103712020. View Article : Google Scholar : PubMed/NCBI
|
|
76
|
Bhat V, Narayanan DL and Shukla A: Report
of rapid diagnosis and precise management of MMADHC-related
intracellular cobalamin defect. BMJ Case Rep. 14:e2397552021.
View Article : Google Scholar : PubMed/NCBI
|
|
77
|
Wu D and Casey PJ: GPCR-Gα13 involvement
in mitochondrial function, oxidative stress, and prostate cancer.
Int J Mol Sci. 25:71622024. View Article : Google Scholar : PubMed/NCBI
|
|
78
|
Mukherjee S, Forde R, Belton A and
Duttaroy A: SOD2, the principal scavenger of mitochondrial
superoxide, is dispensable for embryogenesis and imaginal tissue
development but essential for adult survival. Fly (Austin).
5:39–46. 2011. View Article : Google Scholar : PubMed/NCBI
|
|
79
|
Hernandez-Saavedra D and McCord JM:
Association of a new intronic polymorphism of the SOD2 gene
(G1677T) with cancer. Cell Biochem Funct. 27:223–227. 2009.
View Article : Google Scholar : PubMed/NCBI
|
|
80
|
Zhao C, Zhang Z, Wang Z and Liu X:
Circular RNA circRANGAP1/miR-512-5p/SOD2 axis regulates cell
proliferation and migration in non-small cell lung cancer (NSCLC).
Mol Biotechnol. 66:3608–3617. 2024. View Article : Google Scholar : PubMed/NCBI
|
|
81
|
Li P, Sun Q, Bai S, Wang H and Zhao L:
Combination of the cuproptosis inducer disulfiram and anti-PD-L1
abolishes NSCLC resistance by ATP7B to regulate the HIF-1 signaling
pathway. Int J Mol Med. 53:192024. View Article : Google Scholar : PubMed/NCBI
|
|
82
|
Wang X, Liu Z and Lin C: Metal
ions-induced programmed cell death: How does oxidative stress
regulate cell death? Life Sci. 374:1236882025. View Article : Google Scholar : PubMed/NCBI
|
|
83
|
Guo Z, Chen D, Yao L, Sun Y, Li D, Le J,
Dian Y, Zeng F, Chen X and Deng G: The molecular mechanism and
therapeutic landscape of copper and cuproptosis in cancer. Signal
Transduct Target Ther. 10:1492025. View Article : Google Scholar : PubMed/NCBI
|
|
84
|
Ning X, Chen X, Li R, Li Y, Lin Z and Yin
Y: Identification of a novel cuproptosis inducer that induces ER
stress and oxidative stress to trigger immunogenic cell death in
tumors. Free Radic Biol Med. 229:276–288. 2025. View Article : Google Scholar : PubMed/NCBI
|
|
85
|
Sun W, Lu H, Zhang P, Zeng L, Ye B, Xu Y,
Chen J, Xue P, Yu J, Chen K, et al: Localized propranolol delivery
from a copper-loaded hydrogel for enhancing infected burn wound
healing via adrenergic β-receptor blockade. Mater Today Bio.
30:1014172025. View Article : Google Scholar : PubMed/NCBI
|
|
86
|
Ge EJ, Bush AI, Casini A, Cobine PA, Cross
JR, DeNicola GM, Dou QP, Franz KJ, Gohil VM, Gupta S, et al:
Connecting copper and cancer: From transition metal signalling to
metalloplasia. Nat Rev Cancer. 22:102–113. 2022. View Article : Google Scholar : PubMed/NCBI
|
|
87
|
Oliveri V: Selective targeting of cancer
cells by copper ionophores: An overview. Front Mol Biosci.
9:8418142022. View Article : Google Scholar : PubMed/NCBI
|
|
88
|
Tsvetkov P, Coy S, Petrova B, Dreishpoon
M, Verma A, Abdusamad M, Rossen J, Joesch-Cohen L, Humeidi R,
Spangler RD, et al: Copper induces cell death by targeting
lipoylated TCA cycle proteins. Science. 375:1254–1261. 2022.
View Article : Google Scholar : PubMed/NCBI
|
|
89
|
Bagherpoor AJ, Shameem M, Luo X, Seelig D
and Kassie F: Inhibition of lung adenocarcinoma by combinations of
sulfasalazine (SAS) and disulfiram-copper (DSF-Cu) in cell line
models and mice. Carcinogenesis. 44:291–303. 2023. View Article : Google Scholar : PubMed/NCBI
|
|
90
|
Liu X, Wang L, Cui W, Yuan X, Lin L, Cao
Q, Wang N, Li Y, Guo W, Zhang X, et al: Targeting ALDH1A1 by
disulfiram/copper complex inhibits non-small cell lung cancer
recurrence driven by ALDH-positive cancer stem cells. Oncotarget.
7:58516–58530. 2016. View Article : Google Scholar : PubMed/NCBI
|
|
91
|
Liu D, Cao J, Ding X, Xu W, Yao X, Dai M,
Tai Q, Shi M, Fei K, Xu Y and Su B: Disulfiram/copper complex
improves the effectiveness of the WEE1 inhibitor Adavosertib in p53
deficient non-small cell lung cancer via ferroptosis. Biochim
Biophys Acta Mol Basis Dis. 1870:1674552024. View Article : Google Scholar : PubMed/NCBI
|