Introduction
Meibomian gland carcinoma (MGC) is a malignant tumor
arising from the meibomian glands of the eyelid, characterized by
pronounced local invasiveness and a high propensity for metastasis
to regional lymph nodes and distant organs (1,2). The
overall incidence of SGC is ~2 cases per 100,000 person-years. The
mortality rate of this disease has decreased from 50% to 2–10%
(3,4). The early clinical manifestations of
MGC are often subtle and non-specific, frequently leading to
misdiagnosis or confusion with benign inflammatory conditions such
as meibomian gland cysts. This diagnostic challenge often results
in delayed treatment, thereby increasing the likelihood of tumor
invasion and metastasis (5,6). Despite surgical resection being the
current mainstay of treatment, the postoperative recurrence rate
remains high, reaching up to 40% (5). To date, the molecular mechanisms
underlying the pathogenesis and progression of MGC remain largely
unclear, both domestically and internationally.
Our previous study successfully established and
characterized cell models of MGC and normal meibomian gland cells
through primary culture of freshly excised surgical tissue,
followed by differential gene expression analysis (7). Using microRNA (miRNA or miR)
microarray technology, miR-3907 was identified as notably
upregulated in MGC tissues compared with in adjacent non-tumorous
tissues. Bioinformatic analyses, along with dual-luciferase
reporter assays, confirmed that thrombospondin 1 (THBS1) is a
direct target of miR-3907. Functional experiments further
demonstrated that miR-3907 promotes the proliferation and migration
of MGC cells by downregulating THBS1 expression (8). THBS1, a well-established tumor
suppressor, is notably downregulated in MGC, where it normally
functions to inhibit tumor growth and metastasis. As an
extracellular matrix protein, THBS1 serves a critical role in tumor
progression and dissemination across multiple cancer types
(9,10). For instance, its expression has been
associated with clinical parameters such as tumor-node-metastasis
staging and lymph node metastasis in laryngeal squamous cell
carcinoma, and it has been reported to influence the
trans-epithelial migration of breast cancer cells (11,12).
Building upon the identification of the miR-3907-THBS1 regulatory
axis, the present study aimed to further elucidate the role of
chitobiosyldiphosphodolichol β-mannosyltransferase 1 (ALG1), a
downstream effector protein. Due to the inherent limitations in
delivering miR-3907 and the challenges posed by THBS1 as a large
extracellular matrix protein for clinical drug administration
(13), targeting ALG1 may offer a
more practical therapeutic approach. ALG1, being amenable to
inhibition by small-molecule compounds (14), represents a feasible downstream
target for rapid clinical translation. Moreover, a comprehensive
investigation of the entire ‘miRNA-target gene-effector protein’
pathway not only enhances mechanistic specificity but also
facilitates the development of tiered therapeutic strategies.
Proteomics, as a cutting-edge tool for systematically profiling
protein expression and function in biological systems, provides
powerful means to elucidate disease pathogenesis and progression,
and to uncover novel therapeutic targets (15,16).
Our research group performed a preliminary proteomic analysis of
MGC after overexpressing THBS1 and identified certain
differentially expressed proteins. However, in-depth functional
validation of these proteins has not been performed (17).
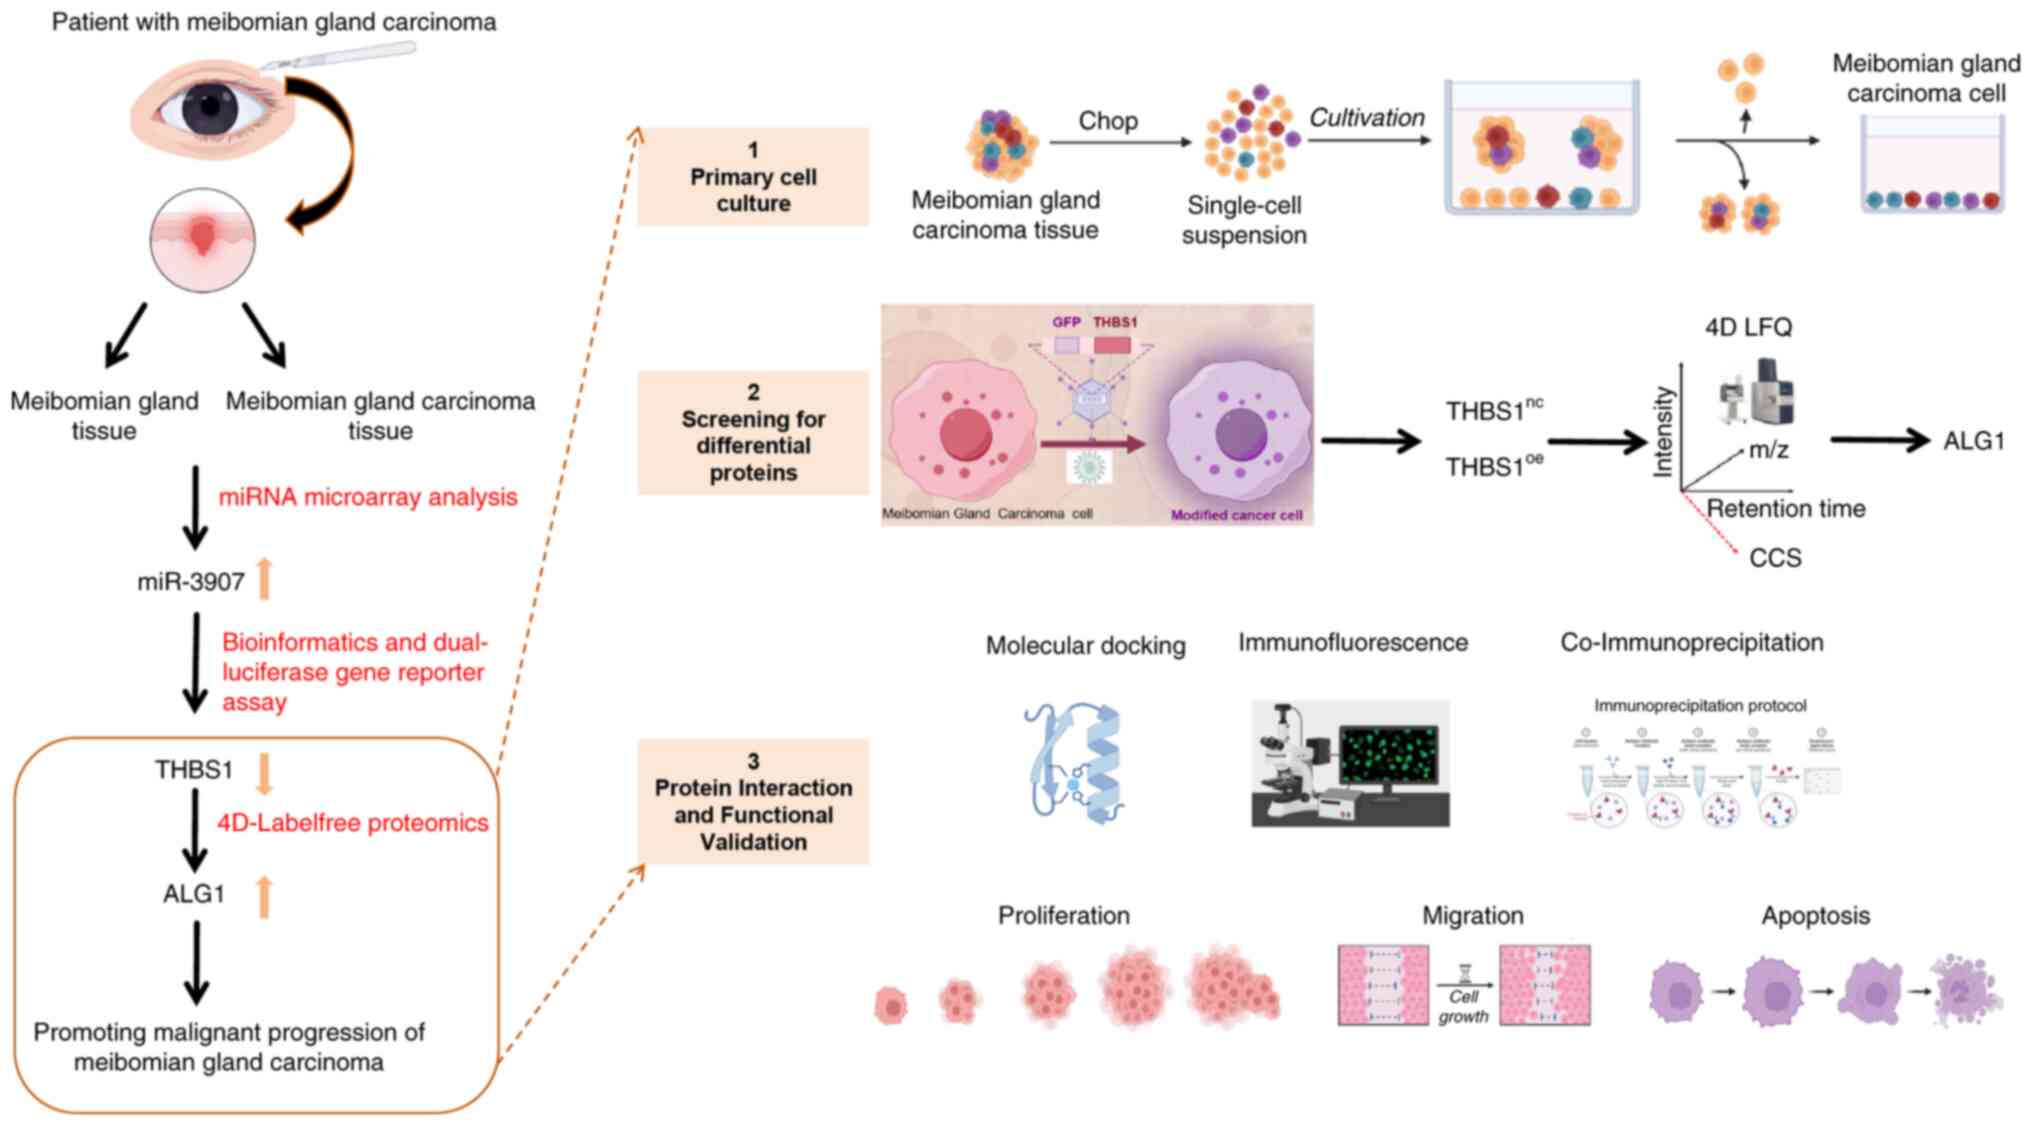
The present study aimed to comprehensively assess
the downstream regulatory mechanisms of THBS1 in MGC. Utilizing 4D
label-free quantitative proteomics, differentially expressed
proteins (DEPs) were identified between THBS1-overexpressing and
control groups. Among these, ALG1 exhibited the most significant
fold change and was selected as the primary focus of the present
research. Furthermore, the functional role and molecular mechanisms
of ALG1 within the miR-3907/THBS1/ALG1 regulatory axis were
evaluated, with particular emphasis on its influence on MGC cell
behavior and epithelial-mesenchymal transition (EMT). The findings
of the present study provide new insights into the
post-transcriptional regulatory network of MGC and offer promising
avenues for the development of novel diagnostic biomarkers and
targeted therapeutic strategies. The experimental workflow of the
present study is presented in Fig.
1.
Materials and methods
Materials
The following materials were used in the present
study: RPMI-1640 medium (Gibco; Thermo Fisher Scientific, Inc.),
phosphate-buffered saline (PBS; Gibco; Thermo Fisher Scientific,
Inc.), trypsin (Gibco; Thermo Fisher Scientific, Inc.), dimethyl
sulfoxide (Beijing Solarbio Science & Technology Co., Ltd.),
Cell Counting Kit-8 (CCK-8) assay kit (Beijing Solarbio Science
& Technology Co., Ltd.), RNA extraction kit (EZBioscience),
first-strand cDNA synthesis kit (EZBioscience), quantitative
real-time PCR kit (EZBioscience), total protein extraction kit
(Beijing Solarbio Science & Technology Co., Ltd.), BCA protein
concentration assay kit (Beijing Solarbio Science & Technology
Co., Ltd.), apoptosis detection kit (Nanjing KeyGen Biotech Co.,
Ltd.).
Primary cell culture
In our previous research, fresh MGC tissues and
adjacent paracancerous tissues were obtained from patients
undergoing Mohs micrographic surgery (8). The primary cells used in the present
study were derived from these tissue samples. Informed consent in
writing from patients for all samples was obtained prior to the
aforementioned published study. Moreover, the primary MGC cells
were previously isolated, identified and characterized using Oil
Red O staining and immunofluorescence, leading to the successful
establishment of three primary MGC cell lines (7). Cells in the logarithmic growth phase
between passages 4 and 10 were selected for all experiments. They
were cultured in complete medium supplemented with 10% fetal bovine
serum (FBS; Gibco; Thermo Fisher Scientific, Inc.) and 1%
penicillin-streptomycin (HyClone; Cytiva), and maintained at 37°C
in a humidified incubator with 5% CO2 (Thermo Fisher
Scientific, Inc.). The culture medium was replaced every 2–3 days.
Once cell confluence reached ~90%, the cells were harvested and
used for subsequent assays. The study protocol was approved by the
Ethics Committee of Tianjin Medical University Eye Hospital
[Tianjin, China; approval no. 2020KY(L)-20].
Cell transfection and lentiviral
overexpression
For small interfering (si)RNA-mediated gene
knockdown experiments, siRNAs targeting ALG1 and negative control
siRNAs were synthesized by OBiO Technology (Shanghai) Co., Ltd. The
ALG1-specific siRNA sequences included a sense strand
(5′-GAUCCUGCGGGCAAGCUAATT-3′) and an antisense strand
(5′-UUAGCUUGCCCGCAGGAUCTT-3′), and the negative control siRNA
sequences included a sense strand (5′-UUCUCCGAACGUGUCACGUTT-3′) and
an antisense strand (5′-ACGUGACACGUUCGGAGAATT-3′). The siRNA was
used at a final concentration of 50 nM for cell transfection. When
preparing the transfection reagent, 50 µl Opti-MEM (BasalMedia) was
used to dilute the siRNA, which was gently pipetted up and down to
mix. Separately, 1.0 µl Lipofectamine™ 3000 (Invitrogen;
Thermo Fisher Scientific, Inc.) was diluted with 50 µl Opti-MEM,
gently pipetted to mix and incubated at room temperature for 5 min.
The diluted transfection reagent and siRNA solution were then
combined and incubated at room temperature for 20 min. After siRNA
transfection, mRNA levels were detected 24–48 h later, whilst
protein levels were analyzed after 48–96 h.
Lentiviral overexpression was performed using a
second-generation packaging system [OBiO Technology (Shanghai) Co.,
Ltd.] consisting of pSLenti-SFH-EGFP-P2A-Puro-CMV-THBS1-3×FLAG-WPRE
(THBS1OE) or
pcSLenti-EF1-EGFP-P2A-Puro-CMV-ALG1-3×FLAG-WPRE (ALG1OE)
as transfer plasmids, with corresponding empty vectors serving as
negative controls. The mass of lentiviral vector plasmid was 2 µg,
and the ratio of vector plasmid: packaging plasmid: envelope
plasmid was 2:1.5:0.5. The packaging plasmid mixture (backbone:
Shuttle=1:1; total=32 µg) was transfected into 293T cells (American
Type Culture Collection) using Trans-fect Lentiviral Packaging
Transfection Reagent [OBiO Technology (Shanghai) Co., Ltd.]
following the manufacturer's protocol. Briefly, cells were seeded
in a 100-mm dish to achieve a confluency of 70–80% at the time of
transfection. Plasmids and reagents were separately diluted in 500
µl Opti-MEM, incubated at room temperature for 5 min, combined and
further incubated at room temperature for 20 min to form complexes.
After the medium was replaced with 10 ml Opti-MEM, the complexes
were added to the cells. A total of 6–8 h post-transfection, the
medium was replaced with fresh complete medium. Viral supernatants
were harvested at 48 and 72 h post-transfection, pooled,
centrifuged at 2,000 × g for 10 min at room temperature to remove
debris, filtered through 0.22-µm membranes, and ultracentrifuged at
100,000 × g for 2 h at 4°C. The pellets were resuspended in
pre-cooled DPBS, incubated overnight at 4°C, filtered again,
aliquoted and stored at −80°C. For transduction, MGC cells were
seeded in a 24-well plate to reach 30–40% confluency and infected
with lentivirus at a multiplicity of infection of 40 (determined by
pre-experiment) in the presence of 5 µg/ml polybrene. A total of
8–12 h post-infection, the medium was replaced and the cells were
cultured at 37°C with 5% CO2. Transduced cells were
selected using 5 µg/ml puromycin for 7–10 days, with medium changes
every 24–48 h. In the maintenance phase, cells were cultured in
medium containing 1 µg/ml puromycin.
Protein extraction
A total of 300 µl 8M urea was added to each primary
cell sample for protein lysis, and a protease inhibitor cocktail
was added at a concentration of 10% (v/v) of the total lysis
volume. The lysates were centrifuged at 14,100 × g for 20 min at
4°C and the supernatants were carefully collected. Protein
concentrations were determined using the Bradford assay. The
remaining lysates were stored at −80°C for subsequent analyses.
Liquid chromatography-tandem mass
spectrometry (LC-MS/MS) analysis
Protein digestion was performed using a commercial
micro-protease digestion kit. Briefly, 20 µl protein lysate was
mixed with MMB magnetic beads in an eight-tube strip and incubated
at 37°C for 30 min. Subsequently, 45 µl binding buffer was added,
followed by a 15-min incubation at room temperature. After
discarding the supernatant, the beads were washed three times with
wash buffer. Proteins were then resuspended in 20 µl digestion
solution and incubated at 37°C for 5 h. The reaction was terminated
by adding 5 µl quenching buffer, and the resulting peptides were
freeze-dried. For LC-MS/MS analysis, two mobile phases were
prepared: Mobile phases A (100% water with 0.1% formic acid) and B
(80% acetonitrile with 0.1% formic acid). The freeze-dried peptide
samples were reconstituted in 10 µl mobile phase A and centrifuged
at 14,000 × g for 20 min at 4°C. The supernatant was then subjected
to LC-MS/MS analysis. Chromatographic separation was performed
under the conditions specified in Table
I. Mass spectrometry analysis was performed on a timsTOF_HT
instrument (Bruker Corporation) equipped with a Captive Spray ion
source, operating in data-dependent acquisition mode. The
ionization was conducted in positive ion mode. The nitrogen gas
temperature was 200°C, the nebulizer pressure at 17.4 psi, and the
nitrogen flow rate at 10 l/min. The mass scan range was set to m/z
100–1,700. The resolution for MS1 spectra was set to 60,000 at m/z
1,222. Within the TIMS tunnel, the ion accumulation time was 100
msec, and the ion mobility range was 0.6–1.6 cm2/V. A
total cycle time of 1.1 sec was used, incorporating 10 parallel
accumulation-serial fragmentation scans. Raw mass spectrometry data
were acquired for further analysis.
 | Table I.Elution conditions for liquid
chromatography, with a separation flow rate of 500 nl/min, and the
separation gradients. |
Table I.
Elution conditions for liquid
chromatography, with a separation flow rate of 500 nl/min, and the
separation gradients.
| Time, min | Proportion of
mobile phase B, % |
|---|
| 00:00 | 3.5 |
| 17:00 | 32.0 |
| 18:00 | 95.0 |
| 20:00 | 95.0 |
| 21:00 | 1.0 |
| 22:00 | 1.0 |
Protein identification and
quantification
All RAW files generated from mass spectrometry were
analyzed using the Proteome Discoverer software suite (version 2.4;
Thermo Fisher Scientific, Inc.). MS/MS spectra were searched
against the Homo sapiens UniProt Swiss-Prot proteome database
(uniprot.org/)(20,407 target sequences; downloaded on March 7,
2023). Furthermore, the Sequest HT search engine(used in Proteome
Discoverer software) was employed with the following parameters:
Fully tryptic enzyme specificity, allowing up to two missed
cleavages, and a minimum peptide length of six amino acids.
Carbamidomethylation of cysteine residues (+57.02146 Da) was set as
a fixed modification, whilst oxidation of methionine residues
(+15.99492 Da) was considered a variable modification. The
precursor mass tolerance was set to 15 ppm, and the fragment mass
tolerance was 0.02 Da for MS/MS spectra acquired in the Orbitrap.
Peptide spectral matches and peptides were filtered using the
Percolator algorithm (percolator.ms/) to achieve a false discovery
rate (FDR) <1%. Following spectral assignment, peptides were
assembled into proteins and further filtered based on the combined
probability scores of constituent peptides, maintaining a final
protein-level FDR of 1%. By default, the top-ranked or ‘master’
protein was defined as the one with the highest number of unique
peptides and the lowest percent peptide coverage value (namely, the
longest matching protein). Only unique and razor (parsimonious)
peptides were considered for quantification.
Functional analysis of proteins and
DEPs
Gene Ontology (GO) enrichment analysis was performed
using the InterProScan 5 tool (ebi.ac.uk/interpro), based on
annotations from the non-redundant protein database. Pathway
analysis was performed using the Kyoto Encyclopedia of Genes and
Genomes (KEGG) database (genome.jp/kegg/) to identify functionally
relevant signaling pathways. Protein-protein interaction networks
were predicted using the STRING database (https://string-db.org/), which integrates both known
and predicted interactions based on orthologous relationships
across species (18). GO and KEGG
enrichment analyses were performed using a dedicated enrichment
pipeline to further interpret the biological significance of
DEPs.
Global analysis, differential protein
screening and functional annotation
Differential expression analysis was performed using
the Significance A algorithm within the MaxQuant software suite
(version 2.6.4.0, available at http://www.biochem.mpg.de/6304115/maxquant). A
paired-sample t-test was employed to compare protein expression
levels between the experimental and control groups. Proteins
exhibiting an absolute log2 fold change (FC) of >1.5
and a P-value of <0.05 were considered significantly
differentially expressed. Among these, ALG1 was identified as the
protein with the highest fold change based on the proteomics
sequencing data. To further assess the functional and biological
relevance of the DEPs, bioinformatic analyses were performed using
the GO and the KEGG pathway databases, enabling a systematic
understanding of the molecular functions, biological processes and
pathways in which the DEPs are involved.
RNA extraction and quantitation
RNA was extracted from the collected primary cells
using a commercial RNA extraction kit(Cat.No.:B0004DP,
EZBioscience), followed by reverse transcription into cDNA using a
specific reverse transcription kit(Cat.No.:A0010CGQ,EZBioscience),
according to the manufacturer's protocol. Reverse
transcription-quantitative PCR (RT-qPCR) was performed using the 2×
Color SYBR Green qPCR Master Mix(Cat.No.:A0012-R1,EZBioscience).
The amplification protocol consisted of an initial denaturation
step at 95°C for 5 min, followed by 40 cycles of denaturation at
95°C for 10 sec, and annealing/extension at 60°C for 30 sec.
Relative gene expression levels were calculated using the
2−ΔΔCq method (19),
with GAPDH employed as the internal control for normalization.
Primer sequences used in the present study are listed in Table II.
| Table II.Primer sequences. |
Table II.
Primer sequences.
|
| Sequence
(5′-3′) |
|---|
|
|
|
|---|
| Gene | Forward | Reverse |
|---|
| ALG1 |
CCCCGAGTTTTCCAGTACGG |
CAGCAATGCTAGGCAGACCT |
| THBS1 |
AGACTCCGCATCGCAAAGG |
TCACCACGTTGTTGTCAAGGG |
| BAX |
CCCGAGAGGTCTTTTTCCGAG |
CCAGCCCATGATGGTTCTGAT |
| BCL-2 |
GGTGGGGTCATGTGTGTGG |
CGGTTCAGGTACTCAGTCATCC |
| E-CADHERIN |
TGGACCGAGAGAGTTTCCCT |
CAAAATCCAAGCCCGTGGTG |
| N-CADHERIN |
TCAGGCGTCTGTAGAGGCTT |
ATGCACATCCTTCGATAAGACTG |
| VIMENTIN |
AATGACCGCTTCGCCAACT |
ATCTTATTCTGCTGCTCCAGGAA |
| GAPDH |
GATGCTGGCGCTGAGTACG |
GCTAAGCAGTTGGTGGTGC |
Western blot
Cell lysates were prepared by resuspending cells in
a lysis buffer (cat. no. #BC3710,Solarbio) and incubating them on
ice for 30 min. The lysates were then centrifuged at 12,000 × g for
30 min at 4°C, and the supernatants were collected for protein
concentration determination using a BCA assay. A total of 25
µg/lane protein was separated using 10% SDS-PAGE and transferred
onto PVDF membranes. To block nonspecific binding, membranes were
blocked with 5% bovine serum albumin (Beijing Zhongshan Jinqiao
Biotechnology Co., Ltd.) at room temperature for 2 h. The membranes
were then incubated overnight at 4°C with primary antibodies
against THBS1 (1:1,000, Affinity, DF6848), β-actin (1:8,000,
Affinity, AF7018), ALG1 (1:1,000, Proteintech, 12872-1-AP), GAPDH
(1:1,000, Affinity, cat. no. AF7021), Bax (1:1,000, Affinity,
AF0120), and BCL-2 (1:1,000, Affinity, AF6139). After three washes
with TBST (Beijing Solarbio Science & Technology Co., Ltd.)
containing 0.1% Tween-20, membranes were incubated with goat
anti-rabbit IgG(H+L)-HRP(1:7,000, Affinity, S0001) for 2 h at room
temperature. Following an additional three washes, protein bands
were visualized using an ECL detection kit(CAT:SQ201,EpiZyme), and
images were captured using a chemiluminescence imaging
system(Catalog number: Tanon 4600, Shanghai Tianneng Technology
Co., Ltd.). Semi-quantification of protein expression was performed
using ImageJ software (Version 1.8.0, National Institutes of
Health) by measuring the band intensities. The relative expression
level of each target protein was calculated as the ratio of its
band intensity to that of the internal loading control.
Bioinformatics analysis
To assess the expression patterns of the target gene
ALG1 across several tumor types, data were retrieved from
the publicly available Tumor Immune Estimation Resource, version 2
(TIMER2.0) database (http://timer.cistrome.org/) using the ‘Gene DE’
module. Additionally, expression levels of ALG1 in tumor compared
with in adjacent normal tissues were analyzed based on datasets
from The Cancer Genome Atlas (TCGA; portal.gdc.cancer.gov/1) to
evaluate its differential expression profile.
Protein-protein docking
The three-dimensional structures of THBS1 and ALG1
proteins were retrieved from the UniProt database (www.uniprot.org), the Protein Data Bank (rcsb.org/),
and the AlphaFold Protein Structure Database
(alphafold.ebi.ac.uk/). Rigid protein-protein docking was performed
using GRAMM-X software (http://vakser.bioinformatics.ku.edu/resources/gramm/grammx)
to predict the potential interaction interface between THBS1 and
ALG1. The resulting docking models were analyzed and visualized
using PyMOL software (version 2.4, http://pymol.org/) to further interpret the nature of
the molecular interactions.
Immunofluorescence
co-localization
Cells were cultured on sterilized glass coverslips
until reaching ~80% confluency. Following three washes with PBS for
5 min each, cells were fixed with pre-chilled methanol at −20°C for
5 min. After fixation, non-specific binding sites were blocked
using 5% BSA for 30 min at room temperature, followed by PBS
washing. Primary antibodies against THBS1 (cat. no. AB1823, Abcam)
and ALG1 (cat. no. 12872-1-AP, Proteintech) (1:100) were
co-incubated with the cells overnight at 4°C. After washing with
PBS, cells were incubated with the following fluorescently labeled
secondary antibodies for 1 h at room temperature: Goat anti-rabbit
DyLight 488 (A23220, Abbkine) and goat anti-mouse DyLight 594
(A23410, Abbkine). Nuclei were stained with DAPI for 5 min at room
temperature, followed by further PBS washes. Coverslips were then
mounted using the antifade mounting medium, and samples were
observed using a confocal fluorescence microscope (LSM 800; Carl
Zeiss AG).
Co-immunoprecipitation (Co-Ip)
A total of ~50 µl each MGC cell protein lysate,
prepared using NP-40 lysis buffer (N8032,Solarbio), was reserved as
an input control. The remaining sample was adjusted to a total
volume of 300 µl, containing ~900 µg protein. To each sample, 30 µl
50% Protein A agarose beads were added, followed by incubation on
ice for 45 min to pre-clear the lysates. Samples were then
centrifuged at 700 × g for 5 min at 4°C, and the supernatants were
collected whilst the pellets were discarded. For
immunoprecipitation, 200 µl pre-cleared supernatant (~600 µg
protein) was incubated with 7 µl of the primary antibody against
THBS1 (cat. no. AB263905, Abcam) or ALG1 (12872-1-AP, Proteintech),
whilst 100 µl (equivalent to ~300 µg protein) was incubated with
3.5 µl control IgG. Both mixtures were rotated overnight at 4°C.
The following day, 30 µl of 50% agarose beads were added to the
antibody sample, and 10 µl beads were added to the IgG control.
Samples were then incubated for an additional 4 h at 4°C under
constant rotation. After centrifugation under the aforementioned
conditions, the supernatants were collected as negative controls.
The beads were washed five times with 0.5 ml ice-cold PBS, and the
first wash supernatant was retained for analysis. Subsequently, the
beads were resuspended in 30 µl of 1X SDS loading buffer and boiled
at 95°C for 5 min. The resulting immunoprecipitates were analyzed
using western blotting as aforementioned to assess protein-protein
interactions.
CCK-8 assay
Cell viability was assessed using the CCK-8 assay.
Cells were seeded into 96-well plates at a density of
5×10³ cells per well. Cell proliferation was evaluated
at 0, 24, 48 and 72 h. At each time point, 10 µl CCK-8 reagent was
added to each well. Plates were then incubated for 2 h at 37°C, and
the absorbance was measured at 450 nm using a microplate reader
(Tecan Group, Ltd.).
Wound-healing assay
When cells reached ~90% confluence, a linear scratch
was made across the cell monolayer using a sterile 100 µl pipette
tip. Detached cells were removed by washing with PBS, and the
medium was replaced with a complete medium containing 1% FBS.
Images of the wound area were captured at 0 and 24 h using an
inverted microscope (Olympus Corporation). The cell migration rate
was calculated using the following formula: Cell migration rate
(%)=[(Width at 0 h-width at 24 h)/width at 0 h]-x100.
Transwell assay
Cell migration and invasion were evaluated using
Transwell chambers. Migration assays were performed without
Matrigel (cat. no. CLS3422, Corning, Inc.), whilst invasion assays
used chambers pre-coated with Matrigel (CLS354480; Corning, Inc.).
Cells were harvested, counted and resuspended in a serum-free
medium at a density of 1×10⁶ cells/ml. A total of 200 µl
cell suspension was added to the upper chamber, whilst 500 µl
complete medium containing 20% FBS (ExCell Bio) was added to the
lower chamber as a chemoattractant. After 48 h of incubation at
37°C, the contents of both chambers were removed. Non-migratory or
non-invasive cells on the upper surface of the membrane were
carefully wiped off with a cotton swab. The chambers were washed
with PBS, and cells on the lower membrane surface were fixed with
4% paraformaldehyde at room temperature for 20 min. Following
air-drying, the membranes were stained with 0.1% crystal violet at
room temperature for 20 min. After washing twice with PBS, stained
cells were visualized and counted under an inverted microscope.
Apoptosis assay
Apoptosis was assessed using flow cytometry with
Annexin V-FITC/APC and Propidium Iodide (PI)/7-AAD staining.
Briefly, 5×10⁵ cells were harvested following digestion
with EDTA-free trypsin and resuspended in 500 µl binding buffer.
The cell suspension was gently pipetted to ensure a single-cell
distribution. Subsequently, 5 µl Annexin V-FITC (or APC) and 5 µl
PI (or 7-AAD) were added to the suspension. Samples were incubated
in the dark at room temperature for 5–10 min and analyzed within 1
h using a flow cytometer (BD FACSCelesta™; BD Biosciences) and
FlowJo 10.6.2 software (FlowJo, LLC). The apoptosis rate was
calculated by summing the proportions of early apoptotic cells (Q3
quadrant) and late apoptotic cells (Q2 quadrant).
Statistical analysis
All data are presented as the mean ± standard
deviation of three independent experiments. All statistical
analyses were performed using GraphPad Prism software (version
10.1.2; Dotmatics). For comparisons between two groups, independent
sample t-tests were employed. Two-way analysis of variance (ANOVA)
was applied for comparisons among multiple groups, as appropriate.
When ANOVA results were significant, Tukey's HSD post hoc test was
used to identify pairwise differences. P<0.05 was considered to
indicate a statistically significant difference
Results
Proteomic analysis after THBS1
overexpression
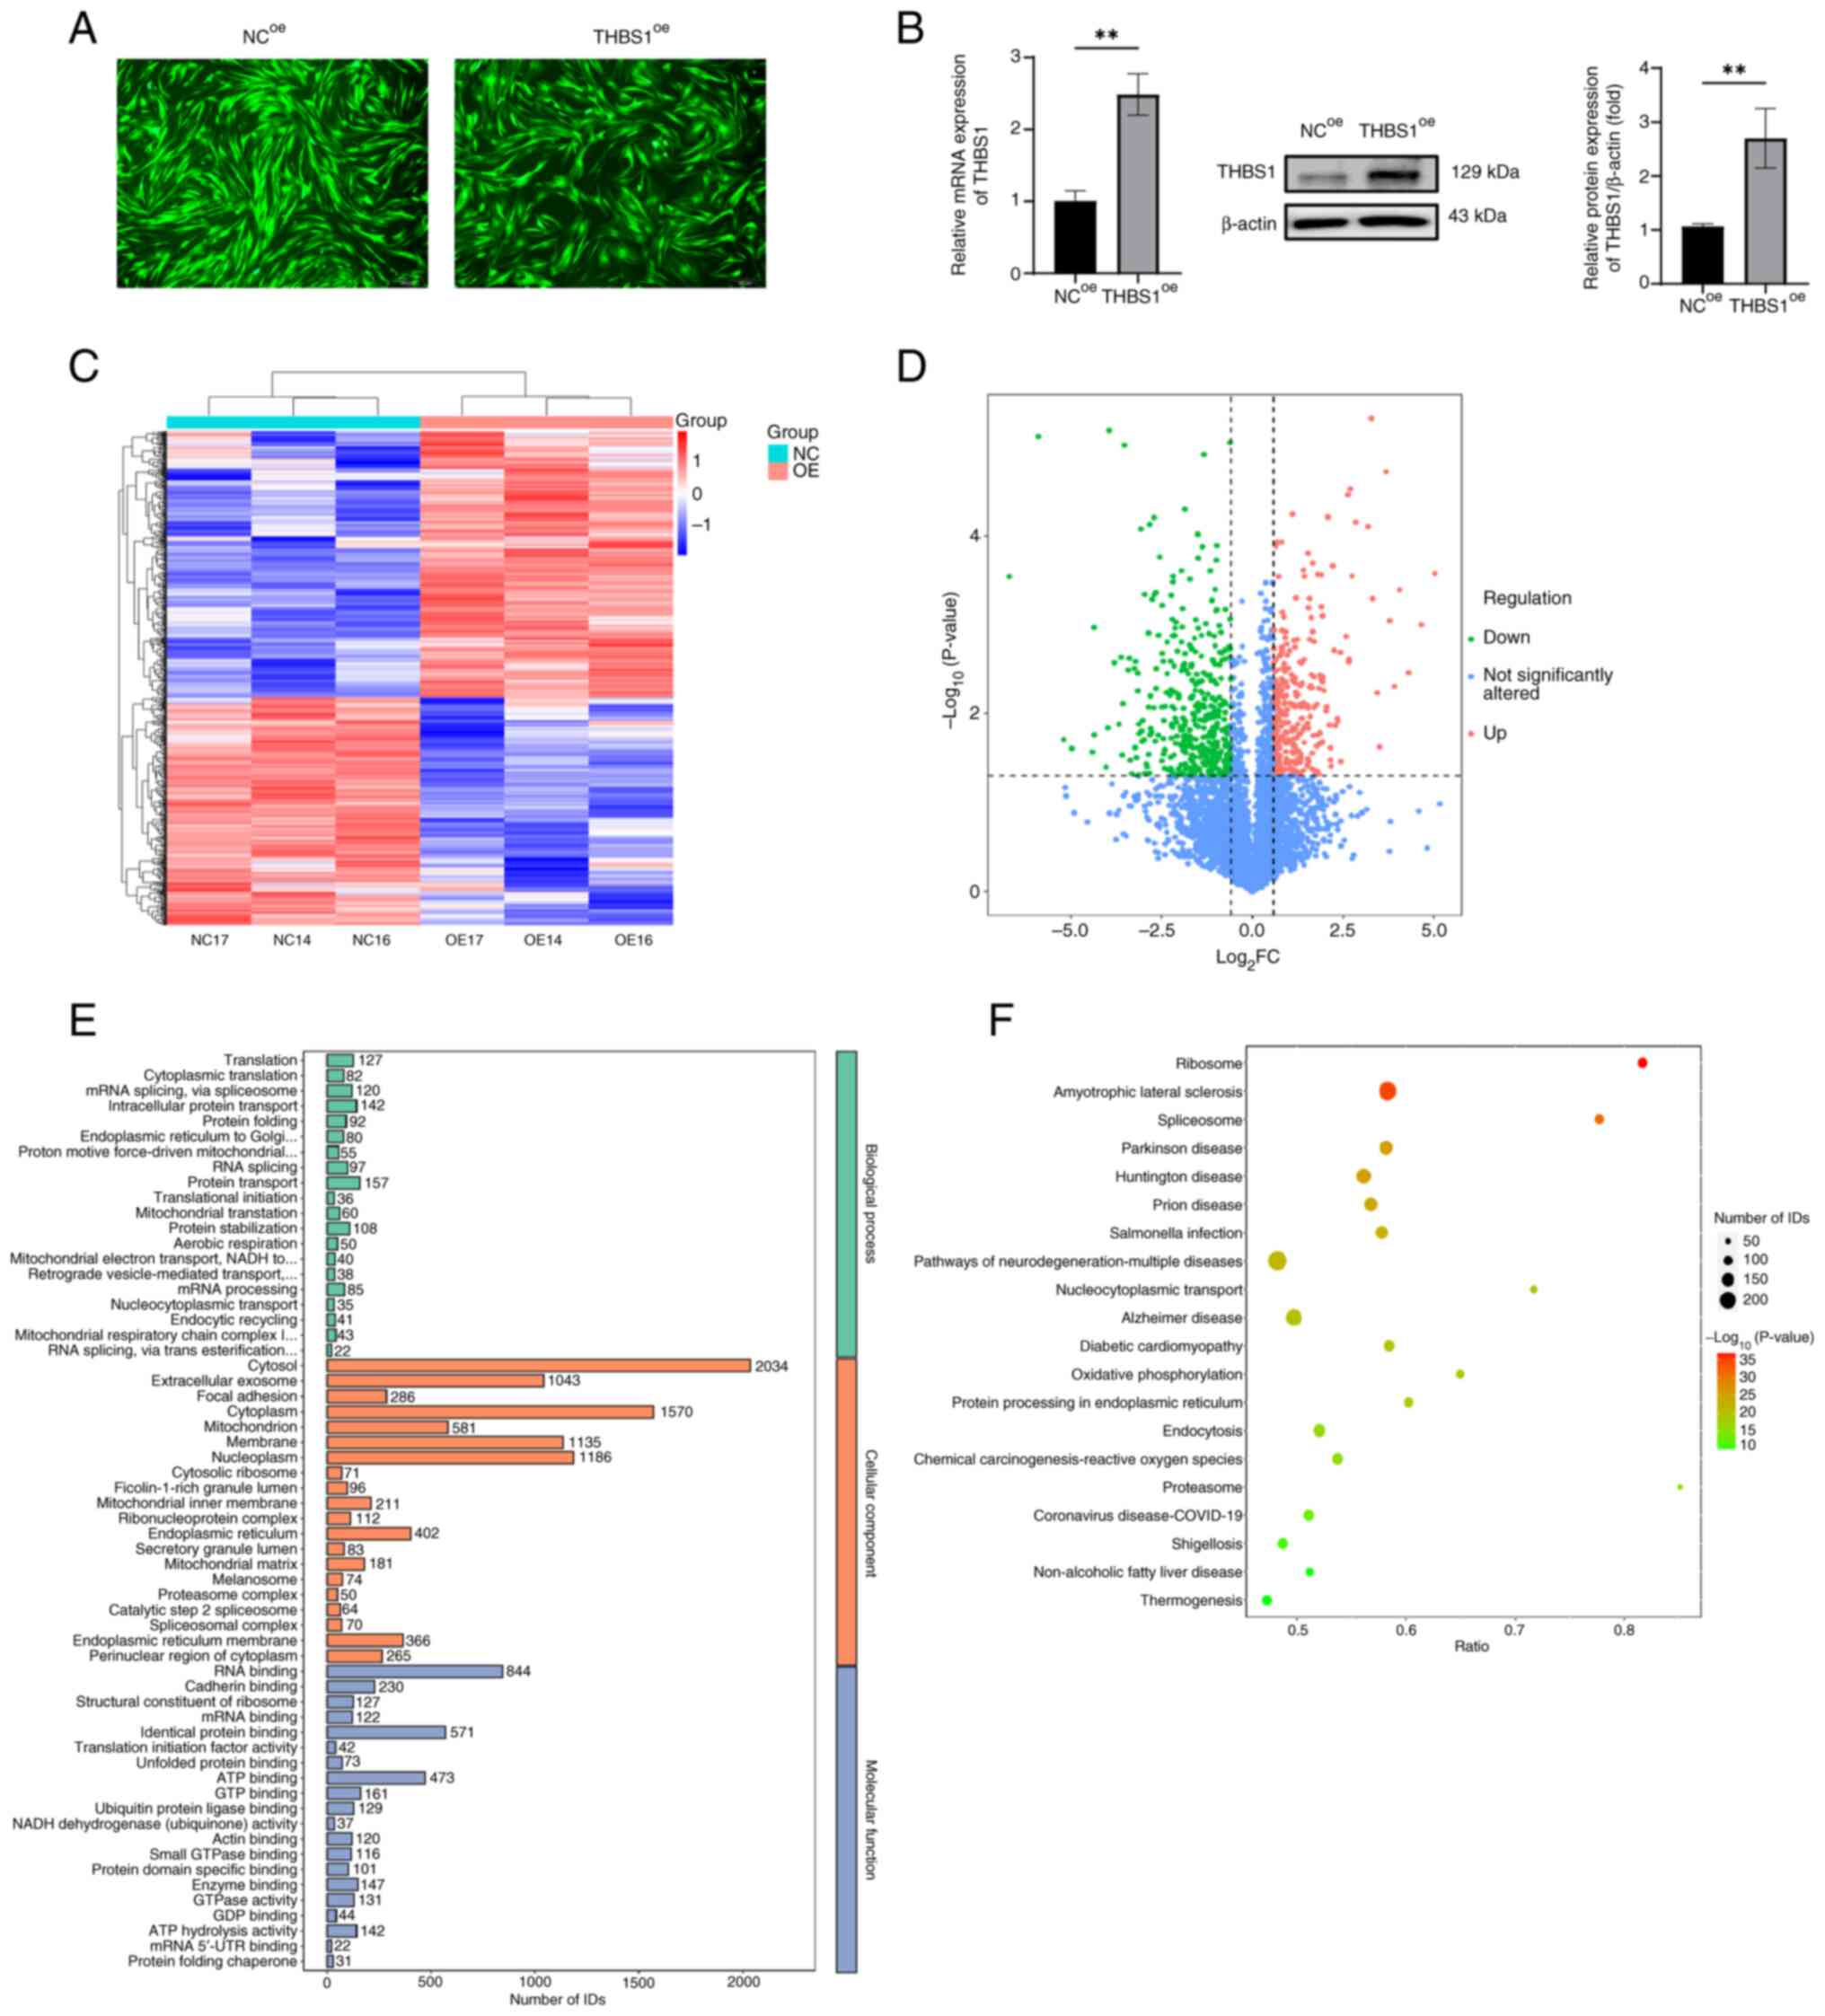
Fluorescence microscopy demonstrated successful
lentiviral infection of MGC cells, with strong fluorescence signals
observed in both negative control overexpression (NCoe)
and THBS1 overexpression (THBS1oe) groups at 72 h
post-infection (Fig. 2A).
Quantitative analysis further assessed the overexpression,
demonstrating significantly elevated mRNA and protein levels of
THBS1 in the THBS1oe group compared with in the
NCoe group (Fig. 2B;
P<0.05). Subsequent proteomic analysis identified a total of
35,894 peptides and 4,949 proteins. Quality control procedures,
including hierarchical clustering of DEPs, confirmed high data
reproducibility. The clustering dendrogram displayed in the heatmap
(Fig. 2C) revealed consistent
expression profiles among biological replicates. A volcano plot
visually represented 685 DEPs between the THBS1oe and
NCoe groups, of which 369 were upregulated and 316 were
downregulated (Fig. 2D). Based on
the criteria |log2(FC)|>1.5 and P<0.05, ALG1 was
identified as the most significantly altered protein. GO enrichment
analysis was performed across three domains: Biological process
(BP), cellular component (CC) and molecular function (MF). In the
BP category, DEPs were significantly enriched in processes such as
translation, cytoplasmic translation, mRNA splicing via the
spliceosome, intracellular protein transport and protein folding.
In the CC category, DEPs were predominantly localized to the
cytosol, mitochondria, endoplasmic reticulum and cellular
membranes. For MF, enrichment was observed in RNA binding,
identical protein binding, ATP binding and cadherin binding
(Fig. 2E). KEGG pathway analysis
revealed that DEPs were enriched in several disease-related
pathways, including Ribosome, Amyotrophic Lateral Sclerosis,
Spliceosome and Parkinson's disease (Fig. 2F). Additionally, DEPs were involved
in core signaling pathways associated with cell cycle regulation,
DNA replication and transcriptional dysregulation in cancer. These
results indicate that THBS1 overexpression exerts widespread
effects on the cellular proteome, providing new insights into its
downstream molecular mechanisms.
Interaction between THBS1 and
ALG1
Proteomic analysis identified ALG1 as the most
significantly altered protein following THBS1 overexpression.
Quantitative expression analysis revealed that both mRNA and
protein levels of ALG1 were significantly reduced in the
THBS1oe group compared with in the NCoe
group, consistent with the proteomic sequencing data (Fig. 3A). To further assess the potential
interaction between THBS1 and ALG1, a protein-protein docking
analysis was performed. The docking model demonstrated that THBS1
(depicted in pink) forms a stable complex with ALG1 (depicted in
yellow), with hydrogen bonds formed between amino acid residues
ASN-991 of THBS1 and MET-58 of ALG1 (indicated by yellow dashed
lines), and a calculated binding energy of −4.9 kcal/mol (Fig. 3B). These findings suggest a strong
and stable interaction between the two proteins with high binding
affinity. To visualize their subcellular distribution,
immunofluorescence co-localization experiments were performed.
THBS1 (red fluorescence) and ALG1 (green fluorescence) were
demonstrated to co-localize predominantly in the cytoplasm, whereas
DAPI staining (blue fluorescence) clearly delineated the nuclear
region (Fig. 3C). Finally, Co-IP
assays revealed the direct physical interaction between THBS1 and
ALG1. This interaction was demonstrated to be specific and
unaffected by the presence of other proteins, further supporting
the docking results (Fig. 3D).
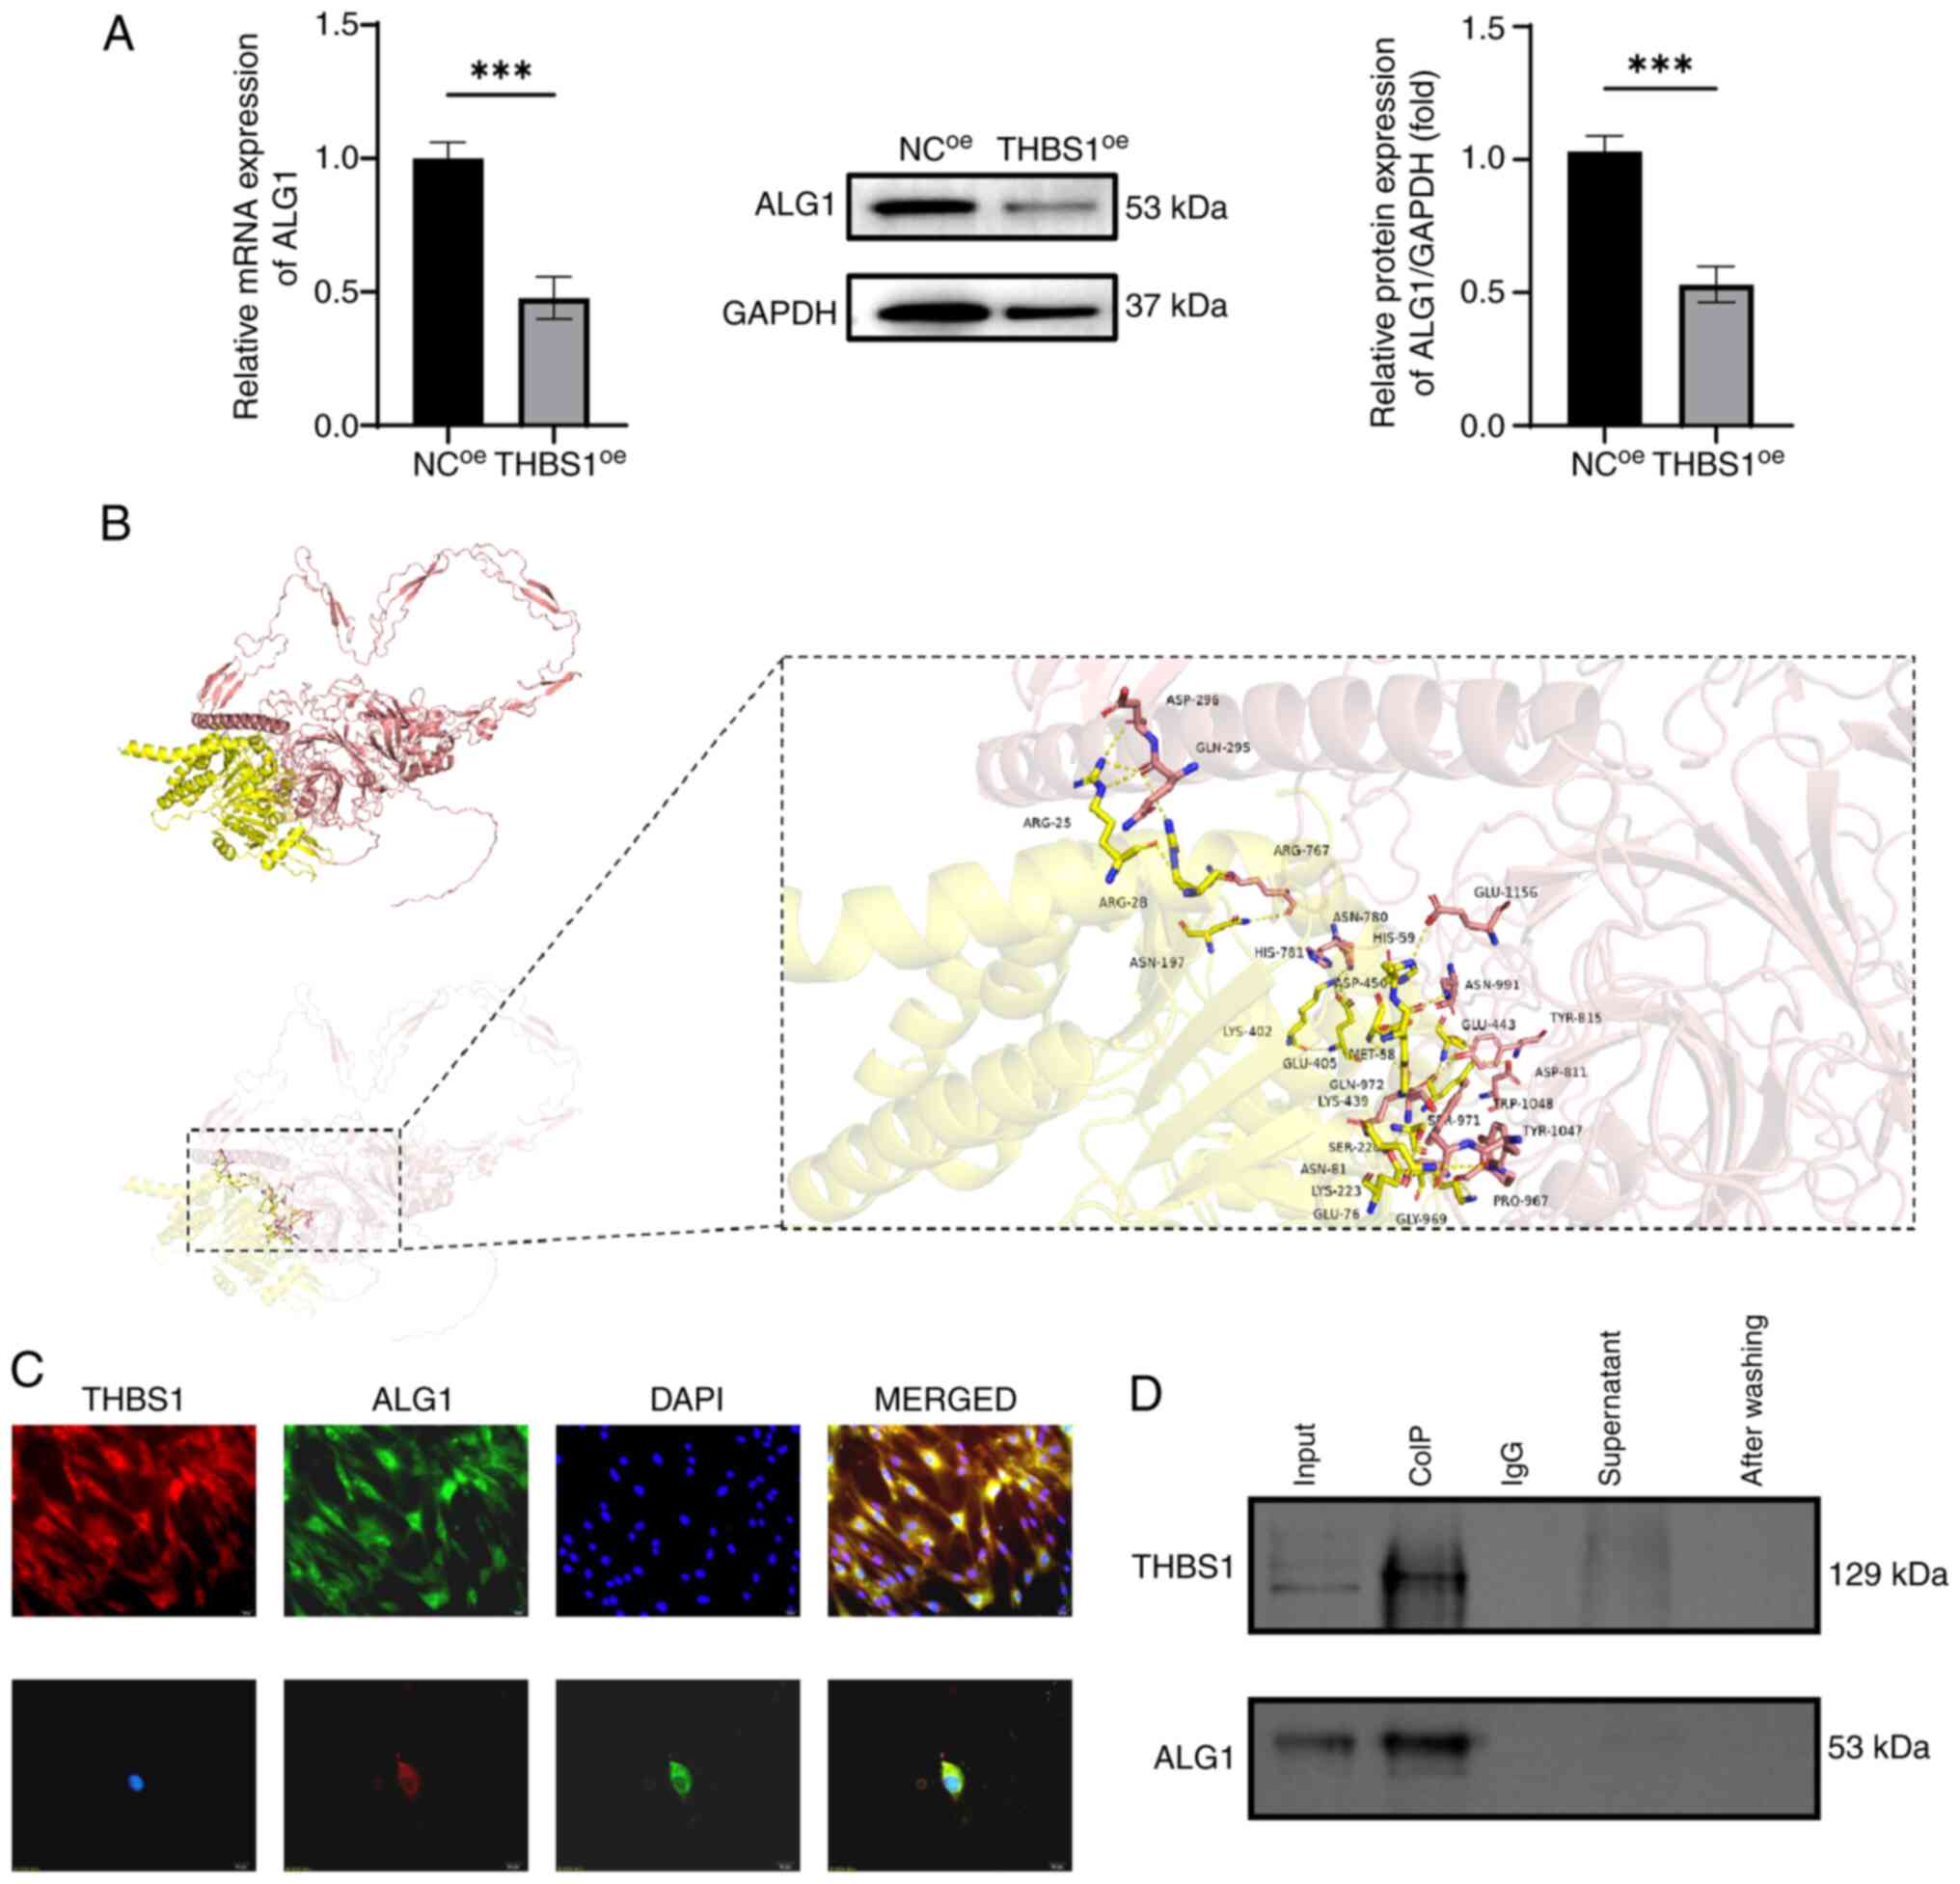 | Figure 3.Validation of the interaction between
THBS1 and ALG1. (A) Validation of ALG1 downregulation following
THBS1 overexpression via reverse transcription-quantitative PCR and
western blot analyses. (B) Protein docking model of THBS1 and ALG1
showing their interface residues (THBS1, pink; ALG1, yellow; and
hydrogen bonds, yellow dashed lines). (C) Immunofluorescence
co-localization analysis of THBS1 and ALG1 (magnification, ×400;
scale bar, 20 µm). (D) Immunoprecipitation analysis demonstrating
the specific interaction between THBS1 and ALG1. ***P<0.001.
ALG1, chitobiosyldiphosphodolichol β-mannosyltransferase 1; THBS1,
thrombospondin 1; NC, negative control; oe, overexpression; CoIP,
co-immunoprecipitation. |
Expression profile of ALG1 and its
effects on MGC cell proliferation, migration and invasion
Using bioinformatics analysis via the TIMER 2.0
platform, the expression pattern of ALG1 across several tumor types
and their corresponding adjacent normal tissues were assessed in
the TCGA database (Fig. 4A). ALG1
expression was significantly elevated in multiple malignancies,
including bladder urothelial carcinoma, breast invasive carcinoma,
cholangiocarcinoma, colon adenocarcinoma, esophageal carcinoma,
glioblastoma multiforme, head and neck squamous cell carcinoma,
kidney renal papillary cell carcinoma, liver hepatocellular
carcinoma, lung adenocarcinoma, prostate adenocarcinoma, rectum
adenocarcinoma, stomach adenocarcinoma and uterine corpus
endometrial carcinoma, compared with in adjacent non-tumor tissues.
These findings suggest that ALG1 is frequently overexpressed in
diverse cancers, implying its potential oncogenic role and
relevance in tumor progression, thus providing a rationale for
further investigation into its functional significance in MGC
cells. To experimentally evaluate ALG1 expression in MGC cells,
RT-qPCR was performed to quantify ALG1 mRNA levels. The results
indicated that ALG1 mRNA expression was significantly upregulated
in MGC cells compared with in adjacent normal tissues (Fig. 4B). Fluorescence microscopy further
demonstrated detectable ALG1-associated fluorescence signals across
the NCsi, NCoe and ALG1 overexpression
(ALG1oe) groups (Fig.
4C). Moreover, RT-qPCR and western blot analyses demonstrated
successful knockdown of ALG1 in the ALG1si group and
overexpression in the ALG1oe group, relative to their
respective controls (Fig. 4D and
E). Subsequently, the functional impact of ALG1 on MGC cell
behavior was assessed. CCK-8 assays revealed that ALG1 knockdown
significantly suppressed MGC cell proliferation, whereas ALG1
overexpression promoted cell proliferation compared with the NC
group (Fig. 4F). In addition,
scratch wound healing and Transwell invasion assays demonstrated
that ALG1 knockdown significantly reduced the migration and
invasion of MGC cells, whilst ALG1 overexpression significantly
enhanced these phenotypes compared with the NC group (Fig. 4G and H).
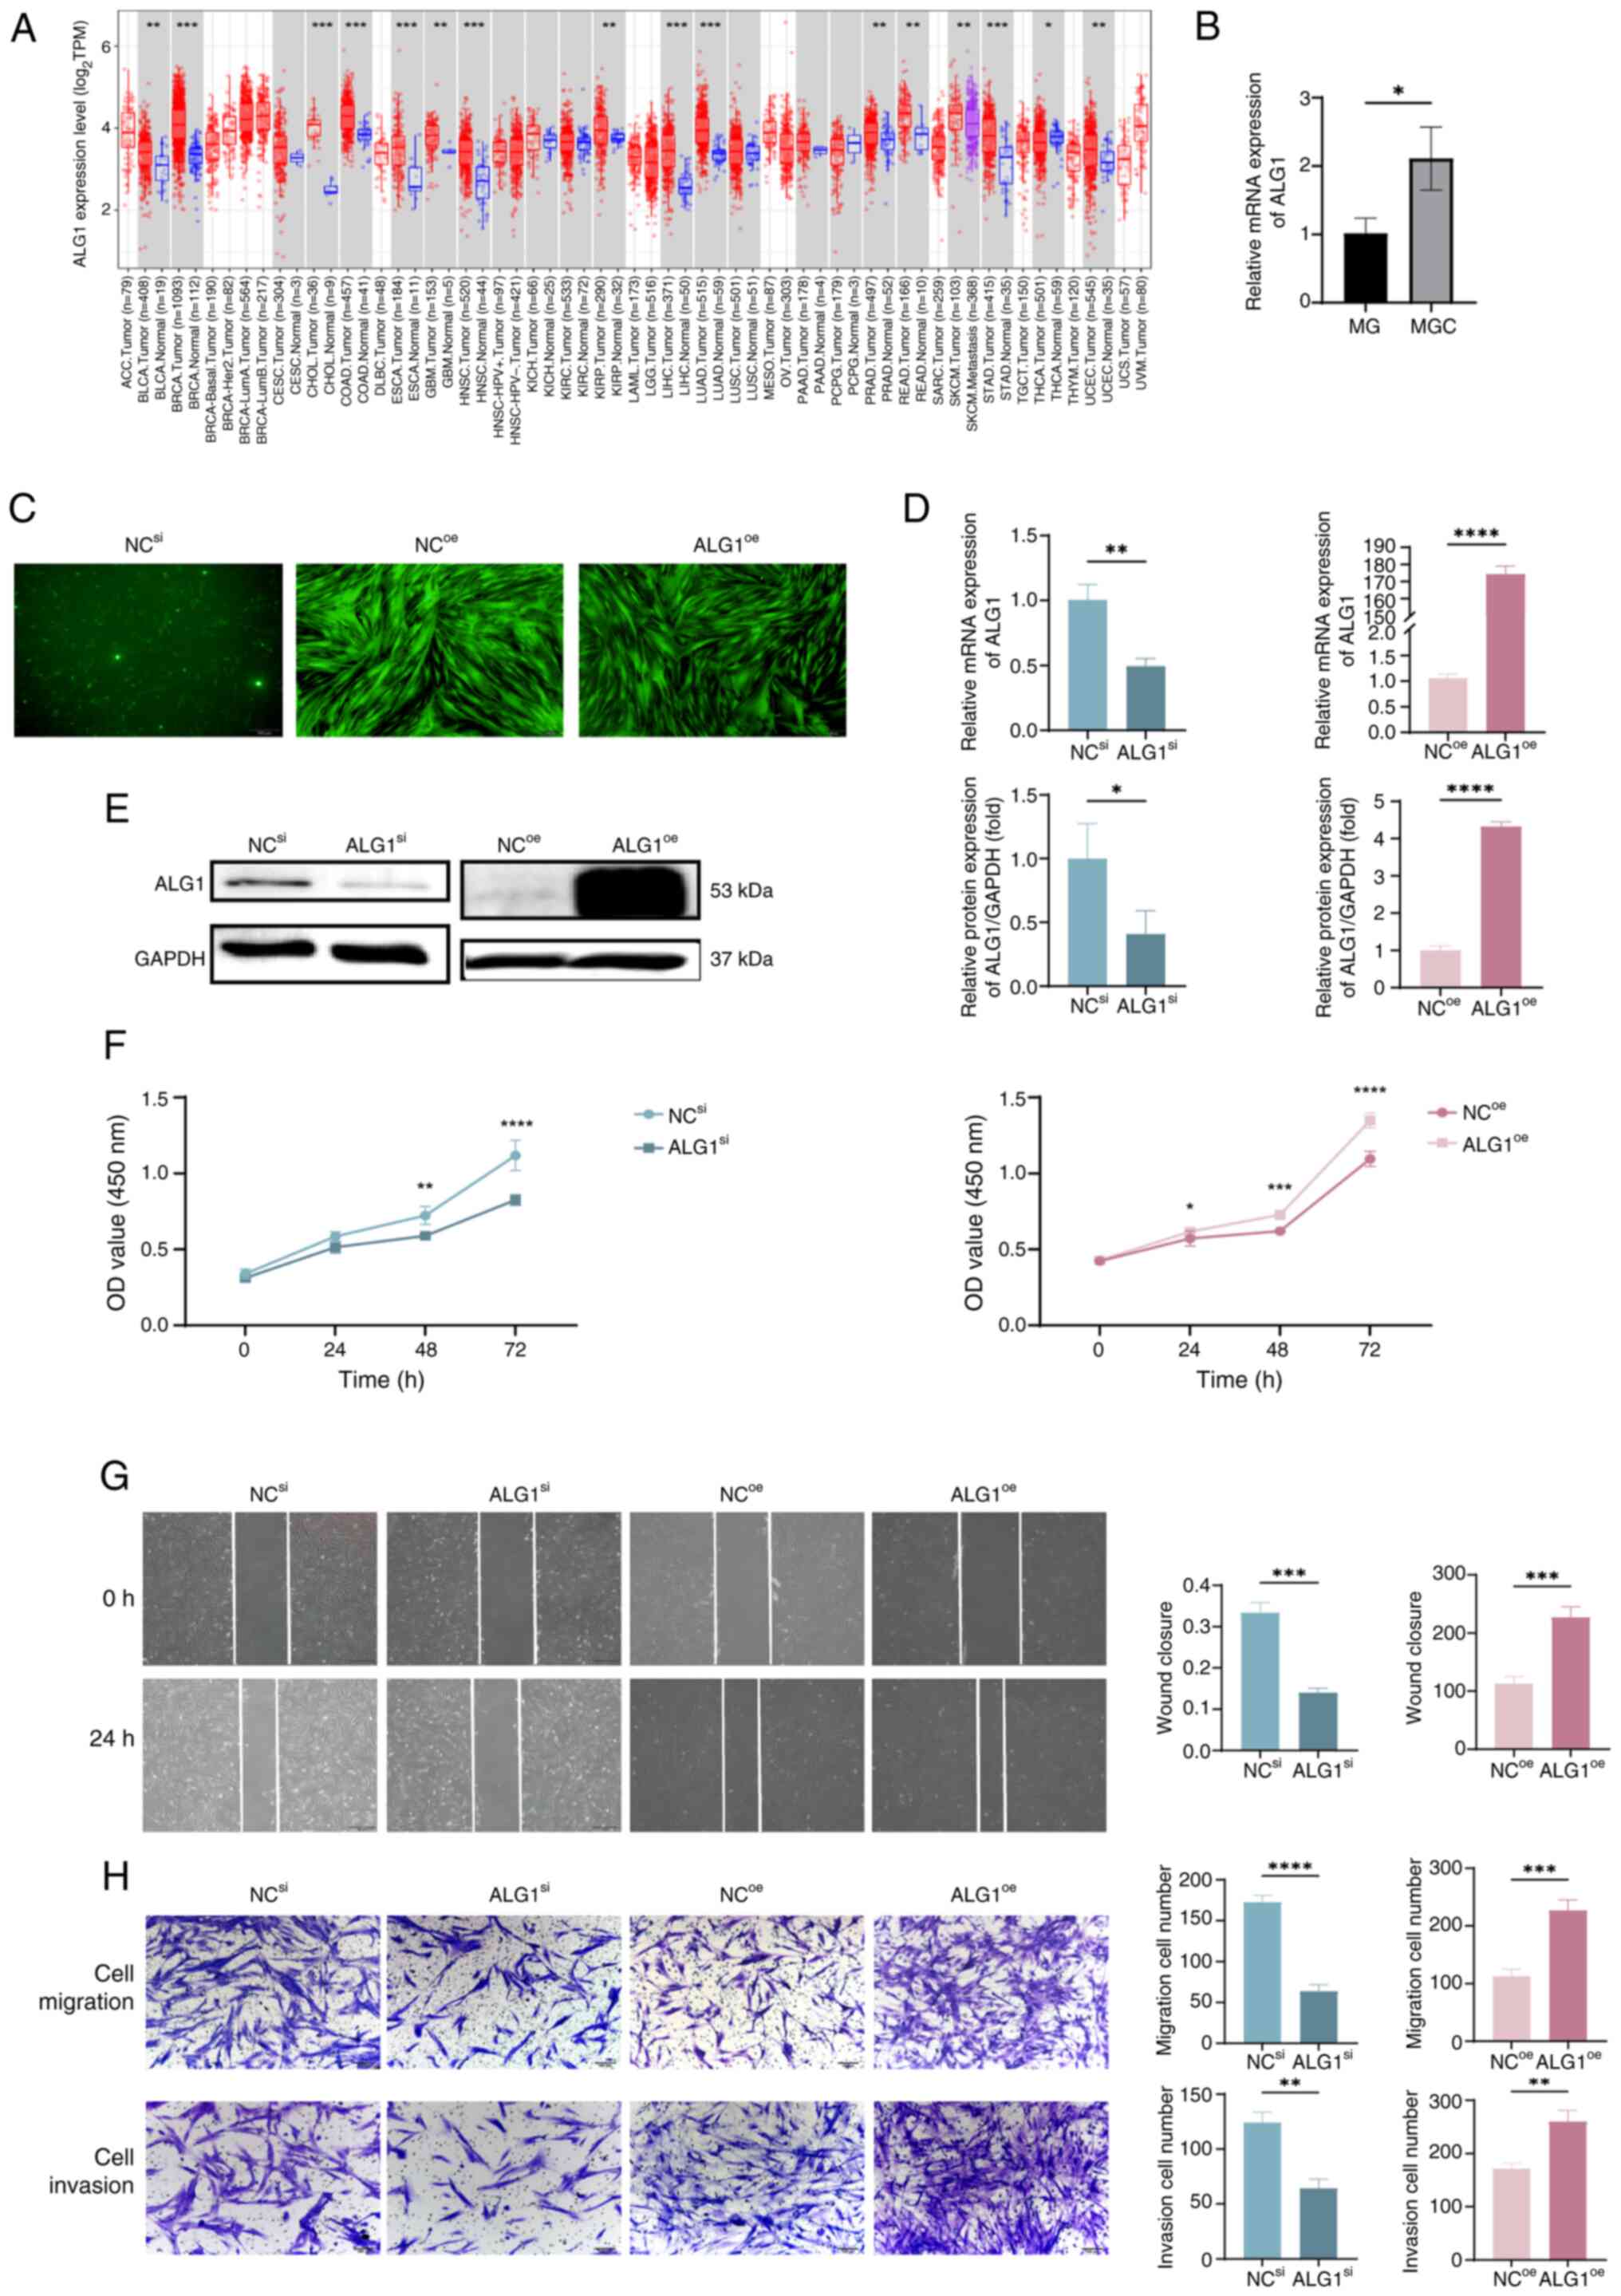 | Figure 4.Regulatory role of ALG1 in the
Biological Behaviors of MGC Cells. (A) Differential expression
analysis of ALG1 in tumors and adjacent normal tissues across
several cancer types and subtypes using the Tumor Immune Estimation
Resource 2.0. (B) Comparison of ALG1 mRNA expression levels in
primary MG and MGC cells. (C) Fluorescence microscopy images (×40;
scale bar, 200 µm) of MGC cells following ALG1 knockdown
(ALG1si) and overexpression (ALG1oe) in
NCsi, NCoe and ALG1oe groups. (D)
Reverse transcription-quantitative PCR and (E) western blot
analyses of successful knockdown and overexpression of ALG1 in MGC
cells using siRNA and lentivirus, respectively. (F) Cell Counting
Kit-8 assay evaluating the effects of ALG1 regulation on MGC cell
proliferation. (G) Scratch wound-healing assay assessing the impact
of ALG1 modulation on cell migration (×40; scale bar, 200 µm). (H)
Transwell assay measuring the effects of ALG1 on MGC cell migration
and invasion (×100; scale bar, 100 µm). *P<0.05; **P<0.01;
***P<0.001; ****P<0.0001. ALG1, chitobiosyldiphosphodolichol
β-mannosyltransferase 1; MG, meibomian gland; MGC, MG carcinoma;
si, small interfering; oe, overexpression; NC, negative control;
TPM, transcripts per million; OD, optical density. |
Regulatory effects of ALG1 on
apoptosis and EMT
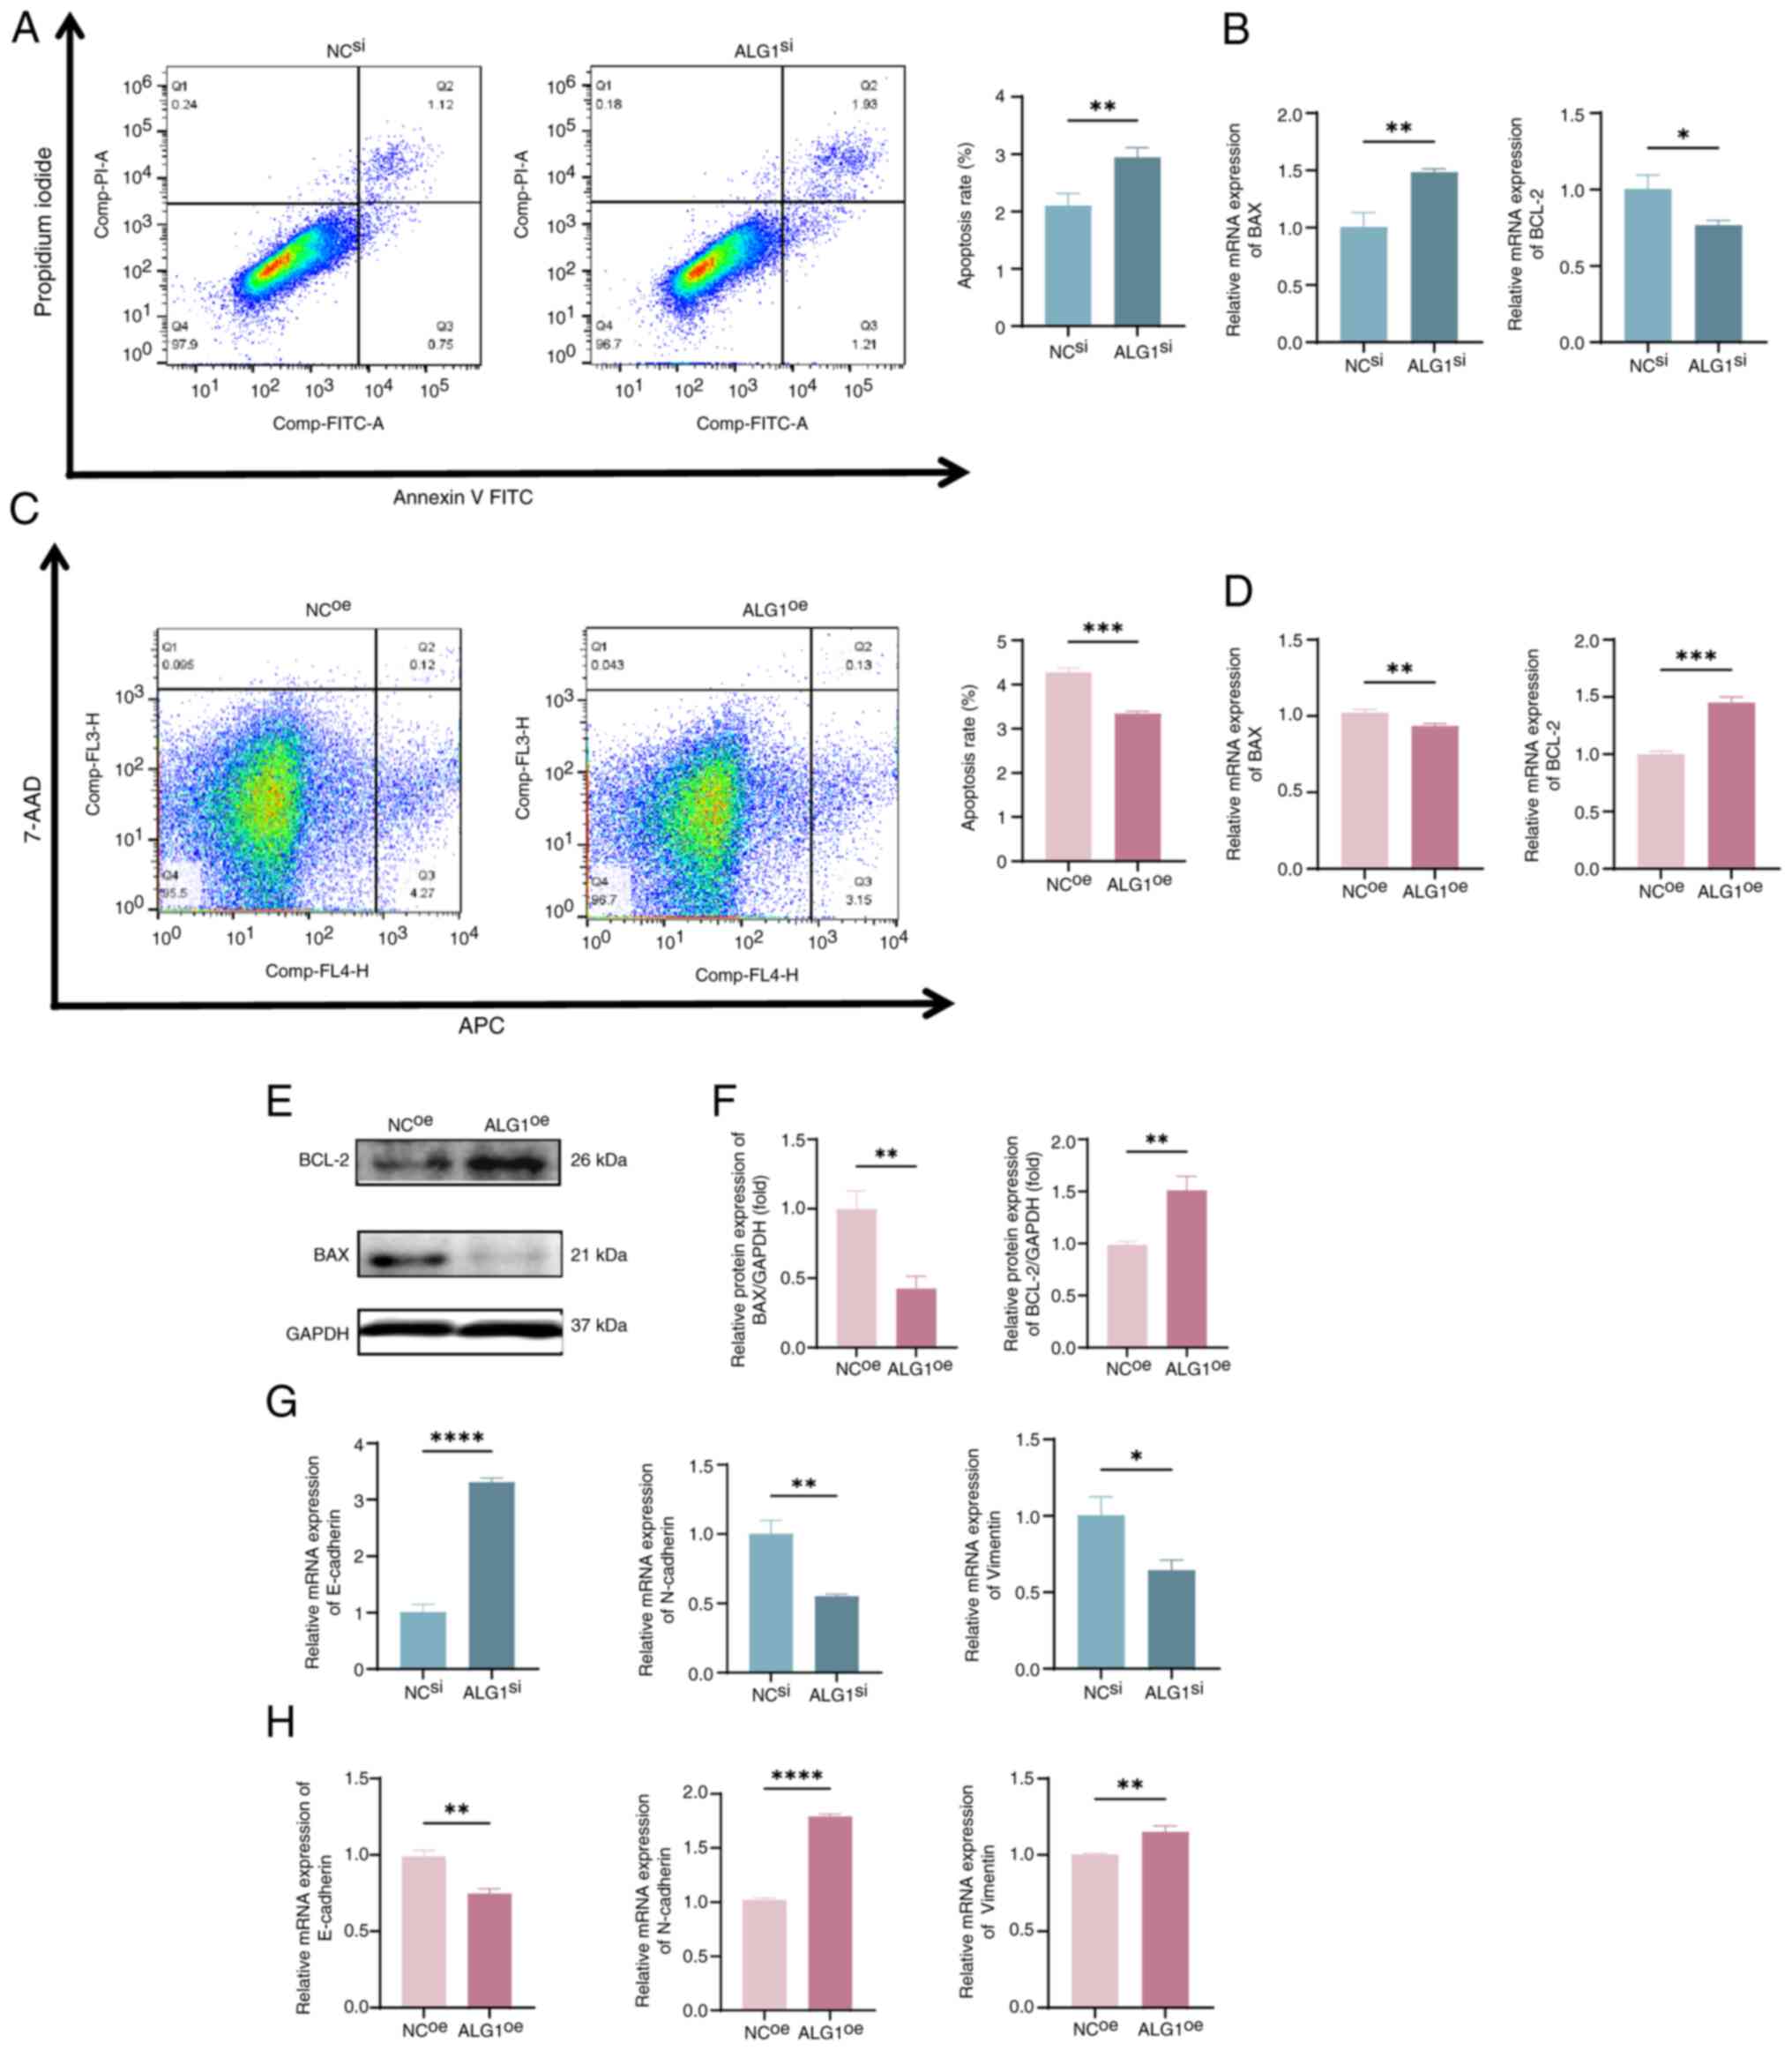
Flow cytometry analysis revealed that ALG1 knockdown
(ALG1si group) significantly increased the apoptosis
rate of MGC cells compared with that of the NC group (Fig. 5A). This finding was supported by the
significant upregulation of the mRNA expression of the
pro-apoptotic gene Bax and downregulated expression of the
anti-apoptotic gene Bcl-2 in the ALG1si group compared
with in the NCsi group (Fig.
5B). These findings suggest that ALG1 silencing induces
apoptosis in MGC cells, which may contribute to the suppression of
tumor growth and metastatic potential. Conversely, overexpression
of ALG1 (ALG1oe group) produced the opposite effects
(Fig. 5C and D). Meanwhile, the
downregulation of Bax and upregulation of Bcl-2 following ALG1
overexpression were further demonstrated using western blot
analysis (Fig. 5E and F).
Moreover, EMT is a key biological process involved
in tumor invasion and metastasis. EMT is characterized by the loss
of epithelial markers, such as E-cadherin, and the gain of
mesenchymal markers, including N-cadherin and vimentin, along with
cytoskeletal remodeling and acquisition of mesenchymal phenotypes
(20). To elucidate the role of
ALG1 in EMT regulation, the expression levels of canonical EMT
markers were assessed. In comparison with the NC group, knockdown
of ALG1 was associated with a significant decrease in vimentin and
N-cadherin expression, accompanied by a significant increase in
E-cadherin expression. This indicates a reversal of the EMT process
(Fig. 5G). Conversely,
overexpression of ALG1 (ALG1oe group) produced the
opposite effects, with significantly increased expression of
mesenchymal markers and suppressed expression of E-cadherin
compared with the NC group (Fig.
5H). Collectively, these results suggest that ALG1 promotes
EMT, and its downregulation facilitates a mesenchymal-to-epithelial
transition, thereby inhibiting the invasive and metastatic
potential of MGC cells.
Discussion
Globally, MGC is the third most common malignant
tumor of the eyelid. It predominantly affects elderly women and
most frequently involves the upper eyelid (21,22).
Early diagnosis and prompt surgical excision are essential to
prevent recurrence; however, due to its nonspecific clinical
presentation, MGC is frequently misdiagnosed or diagnosed at an
advanced stage, often leading to regional lymph node involvement
and distant metastasis, which severely compromise patient prognosis
(23,24). Although radiotherapy and
chemotherapy are commonly employed as adjunctive treatments for
advanced MGC, their clinical efficacy remains unsatisfactory.
Consequently, there is growing interest in molecular-targeted
therapies as a promising alternative for managing this malignancy.
Proteomic technologies offer a powerful approach to directly
analyze global and dynamic changes in the proteome, enabling the
discovery of novel diagnostic biomarkers and therapeutic targets
(25,26). In this context, the identification
of effective molecular markers capable of inhibiting MGC
progression is urgently needed to improve therapeutic outcomes and
patient survival.
Proteomics research in cancer primarily aims to
identify and characterize key proteins involved in malignant
transformation, discover biomarkers for early detection, predict
prognosis, assess therapeutic efficacy, uncover novel drug targets,
and ultimately advance the development of personalized medicine
(27,28). Despite substantial progress in the
field, proteomic investigations into the molecular mechanisms of
MGC remain relatively limited. Previous studies have reported that
miR-3907 is markedly upregulated in MGC and promotes cancer cell
proliferation and migration by negatively regulating THBS1
expression (7). Building upon these
findings, the present study employed 4D-label-free quantitative
proteomics to systematically analyze downstream DEPs following
THBS1 overexpression. GO enrichment analysis revealed that these
DEPs were predominantly involved in critical biological processes
such as translation, intracellular protein transport and protein
folding. Furthermore, KEGG pathway analysis indicated significant
enrichment in ribosome metabolism, as well as pathways associated
with cell cycle regulation, DNA replication and transcriptional
dysregulation in cancer. These results offer valuable insights into
the functional landscape of THBS1-regulated proteins and provide a
robust foundation for future research aimed at the identification
of novel biomarkers and therapeutic targets. Follow-up validation
experiments confirmed that THBS1 overexpression markedly
downregulated the mRNA and protein expression levels of ALG1.
Functional studies further demonstrated a direct interaction
between THBS1 and ALG1 and revealed that ALG1 exerts a potential
oncogenic role in MGC progression. Collectively, these findings
deliver important theoretical evidence for elucidating the
molecular mechanisms underlying MGC and contribute to the
identification of promising therapeutic targets for improving
clinical management of this malignancy.
ALG1, which encodes the enzyme responsible for
catalyzing the first mannosylation step in the biosynthesis of
lipid-linked oligosaccharides, serves a key role in
glycometabolism. Notably, metabolic differences between normal and
tumor cells are profound, with a well-documented shift from
oxidative phosphorylation to aerobic glycolysis (the Warburg
effect) recognized as a hallmark of cancer development (29). This metabolic reprogramming enhances
tumor cell proliferation, invasion and chemoresistance, and is
closely associated with the tumor microenvironment (TME) and immune
evasion. Previous studies have revealed that ALG1 is markedly
associated with immune cell infiltration, TME modulation and
therapeutic responsiveness in gastric adenocarcinoma, highlighting
its potential as a target in cancer treatment (30,31).
Furthermore, ALG1 has been implicated in the early stages of
N-glycosylation, a process intricately linked to the progression of
hepatocellular carcinoma (31). In
colorectal cancer, prognostic models based on glycolysis-related
genes, including ALG1, have demonstrated positive associations with
poor patient outcomes, EMT activation and immune modulation within
the TME (32). However, the
functional role and clinical significance of ALG1 in MGC have not
yet been elucidated.
In the present study, through analysis of publicly
available databases, the results demonstrated that ALG1 expression
is elevated in multiple tumor types, underscoring its potential as
a broadly applicable therapeutic target. It was further revealed
that ALG1 is markedly upregulated in MGC cells, thereby expanding
the spectrum of cancers characterized by high ALG1 expression.
Moreover, through a combination of protein-protein docking,
immunofluorescence co-localization, and Co-IP assays, the present
study identified a direct physical interaction between THBS1 and
ALG1, for the first time, to the best of our knowledge. Functional
studies revealed that ALG1 knockdown significantly inhibited MGC
cell proliferation, migration and invasion, whilst simultaneously
promoting apoptosis. By contrast, ALG1 overexpression exerted the
opposite effects. These findings suggest that ALG1 functions as a
putative oncogene in MGC and raise the possibility that
small-molecule inhibitors targeting ALG1 may serve as a novel
therapeutic strategy, particularly in cancers with elevated ALG1
expression.
EMT is a fundamental biological process that
facilitates cancer cell migration and invasion, and it is
intimately associated with cellular stemness in both tissue
homeostasis and cancer progression (33,34).
This process is orchestrated by a set of core EMT-associated
transcription factors, which suppress the expression of epithelial
markers (such as E-cadherin) and simultaneously induce mesenchymal
markers, including vimentin and N-cadherin (35). The present study demonstrated that
ALG1 modulated EMT marker expression in MGC cells. Specifically,
ALG1 knockdown resulted in increased E-cadherin expression,
indicating enhanced epithelial characteristics and cell-cell
adhesion. Conversely, overexpression of ALG1 suppressed E-cadherin
expression, consistent with a shift toward a mesenchymal phenotype.
In parallel, the expression levels of vimentin and N-cadherin were
positively associated with ALG1 expression, further reinforcing the
role of ALG1 in promoting EMT. These findings support the
hypothesis that ALG1 contributes to MGC cell metastasis and
invasiveness by regulating EMT-associated genes. However, the
present study only explored the role of ALG1 in MGC cells via cell
function experiments and detection of EMT-related markers.
Subsequent research should focus on the signaling pathways closely
associated with EMT in KEGG. By detecting the phosphorylation
levels of key proteins and analyzing upstream-downstream regulatory
relationships, further studies should aim to thoroughly dissect the
regulatory mechanisms of these pathways and comprehensively uncover
the exact molecular mechanisms by which ALG1 regulates EMT. Such
insights will provide a foundation for precision medicine
approaches and may lead to the development of personalized
therapeutic strategies targeting EMT and metastatic progression.
Moreover, to address the limitation of focusing solely on ALG1,
future research should utilize proteomics data to study other
proteins among the identified differentially expressed proteins.
Bioinformatics and functional analyses should employ to explore
their roles in cell phenotypes and analyze their expression in
larger patient cohorts to uncover new mechanisms, biomarkers and
therapeutic approaches.
In conclusion, the present study demonstrated that
THBS1 overexpression suppresses MGC progression via the
downregulation of ALG1, and revealed a direct molecular interaction
between THBS1 and ALG1. Functionally, silencing ALG1 significantly
inhibited MGC cell proliferation, migration and invasion, whilst
promoting apoptosis. Mechanistically, these effects were associated
to ALG1-mediated modulation of EMT, characterized by downregulation
of E-cadherin and upregulation of mesenchymal markers such as
N-cadherin and vimentin. Collectively, these findings highlight
ALG1 as a critical oncogenic mediator in MGC and suggest its
positioning within the miR-3907/THBS1/ALG1 regulatory axis. This
axis represents a promising theranostic biomarker for the
diagnosis, prognosis and treatment of MGC.
Acknowledgements
Not applicable.
Funding
The present work was supported by the Open Project of Tianjin
Key Laboratory of Retinal Functions and Diseases (grant no.
2021tjswmm001), Tianjin Health Science and Technology Project
(grant no. TJWJ2022MS012) and Tianjin Key Medical Discipline
(Specialty) Construction Project (grant no. TJYXZDXK-037A).
Availability of data and materials
The mass spectrometry proteomics data generated in
the present study may be found in the ProteomeXchange Consortium
via the PRIDE (36) partner
repository under accession number PXD059655 or at the following
URL: http://www.ebi.ac.uk/pride.
Authors' contributions
WW, HTW, GJW, XL, LMZ, FT and TTL conceived and
designed the study. WW, HTW, GJW, XL, LMZ, FT, and TTL acquired,
analyzed and interpreted the data. WW drafted the manuscript. WW,
HTW, GJW, XL, LMZ, FT and TTL revised the manuscript. WW, HTW and
GJW performed the statistical analyses. LMZ and TTL obtained
funding for the present study. WW and HW confirm the authenticity
of all the raw data. All authors have read and approved the final
manuscript.
Ethics approval and consent to
participate
The present study was performed in accordance with
the Declaration of Helsinki, and approved by the Ethics Committee
of Tianjin Medical University Eye Hospital [approval no.
2020KY(L)-20]. Informed written consent was obtained from all
subjects involved in the study.
Patient consent for publication
Not applicable.
Competing interests
The authors declare that they have no competing
interests.
References
|
1
|
Seago M, Hosking AM, Greenway HT and
Kelley B: Extraocular sebaceous carcinoma treated with Mohs
micrographic surgery-A 24-year retrospective review of tumor
characteristics and treatment outcomes. Dermatol Surg.
47:1195–1199. 2021. View Article : Google Scholar : PubMed/NCBI
|
|
2
|
Sa HS, Rubin ML, Xu S, Ning J, Tetzlaff M,
Sagiv O, Kandl TJ and Esmaeli B: Prognostic factors for local
recurrence, metastasis and survival for sebaceous carcinoma of the
eyelid: Observations in 100 patients. Br J Ophthalmol. 103:980–984.
2019. View Article : Google Scholar : PubMed/NCBI
|
|
3
|
Tripathi R, Chen Z, Li L and Bordeaux JS:
Incidence and survival of sebaceous carcinoma in the United States.
J Am Acad Dermatol. 75:1210–1215. 2016. View Article : Google Scholar : PubMed/NCBI
|
|
4
|
Muqit MM, Foot B, Walters SJ, Mudhar HS,
Roberts F and Rennie IG: Observational prospective cohort study of
patients with newly-diagnosed ocular sebaceous carcinoma. Br J
Ophthalmol. 97:47–51. 2013. View Article : Google Scholar : PubMed/NCBI
|
|
5
|
Xu M, Chen Q, Luo Y, Chai P, He X, Huang
H, Tan J, Ye J and Zhou C: Recurrence in eyelid sebaceous
carcinoma: A multicentric study of 418 patients. Invest Ophthalmol
Vis Sci. 65:42024. View Article : Google Scholar : PubMed/NCBI
|
|
6
|
Timtim E, Barahimi B, Mawn LA and Sobel
RK: Sebaceous carcinoma masquerading as ocular mucous membrane
pemphigoid. Orbit. 43:531–534. 2024. View Article : Google Scholar : PubMed/NCBI
|
|
7
|
Lu L, Zhang Y, Ge S, Wen H, Tang X, Zeng
JC, Wang L, Zeng Z, Rada G, Ávila C, et al: Evidence mapping and
overview of systematic reviews of the effects of acupuncture
therapies. BMJ Open. 12:e0568032022. View Article : Google Scholar : PubMed/NCBI
|
|
8
|
Zhang C, Zhu L, Liu X, Jiang M, Tang Q, Xu
F, Lin T, Dong L and He Y: MicroRNA-3907 promotes the proliferation
and migration of sebaceous gland carcinoma of the eyelid by
targeting thrombospondin 1. Oncol Lett. 22:8332021. View Article : Google Scholar : PubMed/NCBI
|
|
9
|
Corbella E, Fara C, Covarelli F, Porreca
V, Palmisano B, Mignogna G, Corsi A, Riminucci M, Maras B and
Mancone C: THBS1 and THBS2 enhance the in vitro proliferation,
adhesion, migration and invasion of intrahepatic cholangiocarcinoma
cells. Int J Mol Sci. 25:17822024. View Article : Google Scholar : PubMed/NCBI
|
|
10
|
Kaur S, Bronson SM, Pal-Nath D, Miller TW,
Soto-Pantoja DR and Roberts DD: Functions of thrombospondin-1 in
the tumor microenvironment. Int J Mol Sci. 22:45702021. View Article : Google Scholar : PubMed/NCBI
|
|
11
|
Cen J, Feng L, Ke H, Bao L, Li LZ, Tanaka
Y, Weng J and Su L: Exosomal thrombospondin-1 disrupts the
integrity of endothelial intercellular junctions to facilitate
breast cancer cell metastasis. Cancers (Basel). 11:19462019.
View Article : Google Scholar : PubMed/NCBI
|
|
12
|
Huang C, Zhou X, Li Z, Liu H, He Y, Ye G
and Huang K: Downregulation of thrombospondin-1 by DNA
hypermethylation is associated with tumor progression in laryngeal
squamous cell carcinoma. Mol Med Rep. 14:2489–2496. 2016.
View Article : Google Scholar : PubMed/NCBI
|
|
13
|
Momin MY, Gaddam RR, Kravitz M, Gupta A
and Vikram A: The challenges and opportunities in the development
of microRNA therapeutics: A multidisciplinary viewpoint. Cells.
10:30972021. View Article : Google Scholar : PubMed/NCBI
|
|
14
|
Vergani-Junior CA, Moro RP, Pinto S,
De-Souza EA, Camara H, Braga DL, Tonon-da-Silva G, Knittel TL, Ruiz
GP, Ludwig RG, et al: An intricate network involving the argonaute
ALG-1 modulates organismal resistance to oxidative stress. Nat
Commun. 15:30702024. View Article : Google Scholar : PubMed/NCBI
|
|
15
|
Meier F, Brunner AD, Koch S, Koch H,
Lubeck M, Krause M, Goedecke N, Decker J, Kosinski T, Park MA, et
al: Online parallel accumulation-serial fragmentation (PASEF) with
a novel trapped ion mobility mass spectrometer. Mol Cell
Proteomics. 17:2534–2545. 2018. View Article : Google Scholar : PubMed/NCBI
|
|
16
|
Haymond A, Davis JB and Espina V:
Proteomics for cancer drug design. Expert Rev Proteomics.
16:647–664. 2019. View Article : Google Scholar : PubMed/NCBI
|
|
17
|
Wang W, Wang HT, Liu X, Zhu LM and Lin TT:
Proteomic analysis of meibomian gland carcinoma cells after
overexpression of thrombospondin 1. Zhonghua Yan Ke Za Zhi J
Ophthalmol (Chinese). 61:376–383. 2025.PubMed/NCBI
|
|
18
|
Szklarczyk D, Kirsch R, Koutrouli M,
Nastou K, Mehryary F, Hachilif R, Gable AL, Fang T, Doncheva NT,
Pyysalo S, et al: The STRING database in 2023: Protein-protein
association networks and functional enrichment analyses for any
sequenced genome of interest. Nucleic Acids Res. 51:D638–D646.
2023. View Article : Google Scholar : PubMed/NCBI
|
|
19
|
Livak KJ and Schmittgen TD: Analysis of
relative gene expression data using real-time quantitative PCR and
the 2(−Delta Delta C(T)) method. Methods. 25:402–408. 2001.
View Article : Google Scholar : PubMed/NCBI
|
|
20
|
Brabletz T, Kalluri R, Nieto MA and
Weinberg RA: EMT in cancer. Nat Rev Cancer. 18:128–134. 2018.
View Article : Google Scholar : PubMed/NCBI
|
|
21
|
Jayaraj P, Ray D, Goel K, Singh A, Kant N
and Sen S: Molecular landscape of eyelid sebaceous gland carcinoma:
A comprehensive review. Indian J Ophthalmol. 72:1393–1403. 2024.
View Article : Google Scholar : PubMed/NCBI
|
|
22
|
Cicinelli MV and Kaliki S: Ocular
sebaceous gland carcinoma: an update of the literature. Int
Ophthalmol. 39:1187–1197. 2019. View Article : Google Scholar : PubMed/NCBI
|
|
23
|
Vempuluru VS, Tanna V, Luthra A and Kaliki
S: Eyelid/periocular sebaceous gland carcinoma in 500 eyes:
Analysis based on 8th edition American joint cancer committee
classification. Am J Ophthalmol. 269:49–59. 2024. View Article : Google Scholar : PubMed/NCBI
|
|
24
|
Dini F, Susini P, Nisi G, Cuomo R,
Grimaldi L, Massi D, Innocenti A, Doni L, Mazzini C, Santoro N and
De Giorgi V: Periocular sebaceous carcinoma: Updates in the
diagnosis, treatment, staging, and management. Int J Dermatol.
63:726–736. 2024. View Article : Google Scholar : PubMed/NCBI
|
|
25
|
Lee YT, Tan YJ and Oon CE: Molecular
targeted therapy: Treating cancer with specificity. Eur J
Pharmacol. 834:188–196. 2018. View Article : Google Scholar : PubMed/NCBI
|
|
26
|
Lin F, Li Z, Hua Y and Lim YP: Proteomic
profiling predicts drug response to novel targeted anticancer
therapeutics. Expert Rev Proteomics. 13:411–420. 2016. View Article : Google Scholar : PubMed/NCBI
|
|
27
|
Tan HT, Lee YH and Chung MC: Cancer
proteomics. Mass Spectrom Rev. 31:583–605. 2012. View Article : Google Scholar : PubMed/NCBI
|
|
28
|
Haga Y, Minegishi Y and Ueda K: Frontiers
in mass spectrometry-based clinical proteomics for cancer diagnosis
and treatment. Cancer Sci. 114:1783–1791. 2023. View Article : Google Scholar : PubMed/NCBI
|
|
29
|
Abbaszadeh Z, Cesmeli S and Biray Avci C:
Crucial players in glycolysis: Cancer progress. Gene.
726:1441582020. View Article : Google Scholar : PubMed/NCBI
|
|
30
|
Liao Z and Xie Z: Construction of a
disulfidptosis-related glycolysis gene risk model to predict the
prognosis and immune infiltration analysis of gastric
adenocarcinoma. Clin Transl Oncol. 26:2309–2322. 2024. View Article : Google Scholar : PubMed/NCBI
|
|
31
|
Cao X, Shao Y, Meng P, Cao Z, Yan G, Yao
J, Zhou X, Liu C, Zhang L, Shu H and Lu H: Nascent proteome and
glycoproteome reveal the inhibition role of ALG1 in hepatocellular
carcinoma cell migration. Phenomics. 2:230–241. 2022. View Article : Google Scholar : PubMed/NCBI
|
|
32
|
Liu G, Wu X and Chen J: Identification and
validation of a glycolysis-related gene signature for depicting
clinical characteristics and its relationship with tumor immunity
in patients with colon cancer. Aging. 14:8700–8718. 2022.
View Article : Google Scholar : PubMed/NCBI
|
|
33
|
Verstappe J and Berx G: A role for partial
epithelial-to-mesenchymal transition in enabling stemness in
homeostasis and cancer. Semin Cancer Boil. 90:15–28. 2023.
View Article : Google Scholar : PubMed/NCBI
|
|
34
|
Ramesh V, Brabletz T and Ceppi P:
Targeting EMT in cancer with Repurposed Metabolic Inhibitors.
Trends in cancer. 6:942–950. 2020. View Article : Google Scholar : PubMed/NCBI
|
|
35
|
Fontana R, Mestre-Farrera A and Yang J:
Update on epithelial-mesenchymal plasticity in cancer progression.
Annu Rev Pathol. 19:133–156. 2024. View Article : Google Scholar : PubMed/NCBI
|
|
36
|
Perez-Riverol Y, Bai J, Bandla C,
García-Seisdedos D, Hewapathirana S, Kamatchinathan S, Kundu DJ,
Prakash A, Frericks-Zipper A, Eisenacher M, et al: The PRIDE
database resources in 2022: A hub for mass spectrometry-based
proteomics evidences. Nucleic Acids Res. 50:D543–D552. 2022.
View Article : Google Scholar : PubMed/NCBI
|