Introduction
Lung cancer is the most common malignant tumor and
the leading cause of cancer-related mortality worldwide (1). It is estimated that there are 2.2
million novel diagnoses of lung cancer each year, as well as 1.79
million mortalities (2). Lung
cancer poses a severe threat to human health, and its diagnosis and
treatment have become a key focus in oncological research. However,
due to the insidious early symptoms of lung cancer, ~75% patient
are diagnosed at advanced stages of the disease, missing the
optimal treatment window, which results in a continuous increase in
the mortality rates associated with lung cancer (3,4).
Therefore, early diagnosis of lung cancer is key to ensuring timely
treatment and improving survival rates.
Early lung cancer often presents as pulmonary
nodules on imaging (5). Therefore,
recognizing malignant pulmonary nodules is key to the early
diagnosis and treatment of lung cancer, as well as to reduce lung
cancer-related mortality. Low-dose CT is an effective method for
the detection of malignant pulmonary nodules (6), but it suffers from a high
false-positive rate (7). Positron
emission tomography has a certain accuracy in differentiating
between benign and malignant lung nodules, but it carries a high
risk of false-negatives or false-positives (8,9). Lung
tissue biopsy is the standard for lung cancer diagnosis; however,
it is an invasive procedure that can lead to complications and has
high costs (10). Non-invasive
testing methods, such as circulating tumor cells and DNA, have
demonstrated certain potential in identifying malignant pulmonary
nodules, but they suffer from low capture rates and sensitivity
(4,11). Tumor markers such as neuron-specific
enolase, squamous cell carcinoma antigen and carcinoembryonic
antigen can provide real-time assessments of tumor status and serve
as an adjunct in the diagnosis of lung cancer, but they lack
sensitivity and specificity (3,12).
Therefore, there is an urgent need to identify a simple,
non-invasive or minimally invasive, reproducible and highly
sensitive method to identify diagnostic biomarkers with high
sensitivity and specificity, thereby enabling the early
identification of malignant pulmonary nodules.
Metabolomics is an emerging high-throughput
technology used to detect, identify and quantify metabolites in
biological samples. It can directly exhibit changes within seconds
or minutes from an event, demonstrating high sensitivity and
proving its unique value in disease diagnosis and disease
mechanisms (13–15). Non-targeted metabolomics is one of
the techniques in metabolomics that focuses on the comprehensive
analysis of all low molecular weight metabolites. It reveals
metabolic changes associated with diseases and reflects their
metabolic characteristics, thus being utilized to identify
potential biomarkers that provide effective assistance for disease
screening and early diagnosis (15,16).
Furthermore, the biological samples required for metabolomics often
originate from the bodily fluids of the patients, such as blood,
plasma, serum and urine (17),
making sample collection convenient and repeatable, which is
beneficial for routine monitoring.
Metabolic dysregulation is a hallmark of cancer
occurrence and progression (18).
Utilizing non-targeted metabolomics to analyze the metabolic
changes from precancer to cancer helps identify potential
diagnostic biomarkers. For instance, a non-targeted metabolomics
study on hepatocellular carcinoma reported that PG(i-12:0/a-17:0)
and phytosphingosine are potential biomarkers for early
hepatocellular carcinoma diagnosis in patients with liver
cirrhosis. Furthermore, norvaline, L-histidinol, N-docosahexaenoyl
γ-aminobutyric acid, inosine and 3-hydroxyoctanoly carnitine
revealed a high potential to distinguish patients with
hepatocellular carcinoma and liver cirrhosis from normal controls
(14). Currently, the main
techniques in metabolomics are nuclear magnetic resonance (NMR),
gas chromatography-mass spectrometry (GC-MS) and liquid
chromatography-mass spectrometry (LC-MS) (19). NMR is a rapid, non-destructive and
reproducible technique, but has relatively low sensitivity
(19,20). GC-MS is suitable for the analysis of
samples that are stable and easy to gasify but needs derivatization
and a longer sample preparation time (19,20).
By contrast, LC-MS has a higher sensitivity and wider testing
scope, while avoiding the complex sample pretreatment in GC-MS,
which makes it an increasingly predominant platform in metabolomics
(19–21).
Based on the aforementioned points, in the present
study, plasma samples were collected from three different stages:
Patients with lung cancer, those with pulmonary nodules and healthy
individuals. By analyzing the metabolic changes using LC-MS, the
present study aimed to identify differential metabolites, identify
potential diagnostic biomarkers for lung cancer and reveal abnormal
metabolic pathways, with the intention of providing novel insights
and approaches for the early diagnosis of lung cancer, as well as
its pathological mechanisms in the future.
Patients and methods
Study participants
A total of 68 participants from Dongzhimen Hospital
of Beijing University of Chinese Medicine (Beijing, China) were
enrolled between April 2023 and May 2024, including 20 patients
with lung cancer (lung cancer group), 28 patients with pulmonary
nodules (pulmonary nodule group) and 20 healthy individuals
(healthy group). Patients with lung cancer and pulmonary nodules
were recruited using a simple random sampling method based on
disease type, while healthy individuals were recruited using a
matching method based on age and sex. The present study was
reviewed and approved by the Ethics Committee of Dongzhimen
Hospital of Beijing University of Chinese Medicine (approval no.
2022DZMEC-312-02). All methods were conducted in accordance with
relevant guidelines and regulations. All participants signed
informed consent forms. The inclusion criteria for lung cancer were
as follows: i) The patients were confirmed to have lung
adenocarcinoma through histopathological examination; ii) there
were no restrictions on the sex of the patients and the age range
was 18–90 years; iii) the patients had not received any treatments
such as surgery, chemotherapy or radiotherapy prior to enrollment
in the present study. The inclusion criteria for pulmonary nodules
were as follows: i) The patient had imaging findings of round or
irregularly shaped pulmonary nodules with a maximum diameter of ≤30
mm, which was either solid or subsolid in nature and exhibited
increased radiological density; ii) either a) pathology results
were negative or b) imaging features were benign, Lung Imaging
Reporting and Data System category 2 (22) and they were classified as low-risk
by the chest CT image-assisted system at Dongzhimen Hospital of
Beijing University of Chinese Medicine; iii) there were no
restrictions on the sex of the patients and the age range was 18–90
years; and iv) the patients did not receive any treatment prior to
enrollment in the present study. The healthy individuals were
diagnosed as healthy by physical examination and medical diagnosis.
The exclusion criteria for the present study were as follows: i)
Patients who were in the acute phase of a disease, such as acute
respiratory infection, myocardial infarction, renal insufficiency
or other conditions that could interfere with diagnosis; ii)
patients who had severe primary disease affecting major organs,
such as the heart, lungs, brain, liver, kidney or blood or any
severe conditions impacting their overall survival; iii) patients
who were suffering from psychiatric disorders; and iv) patients who
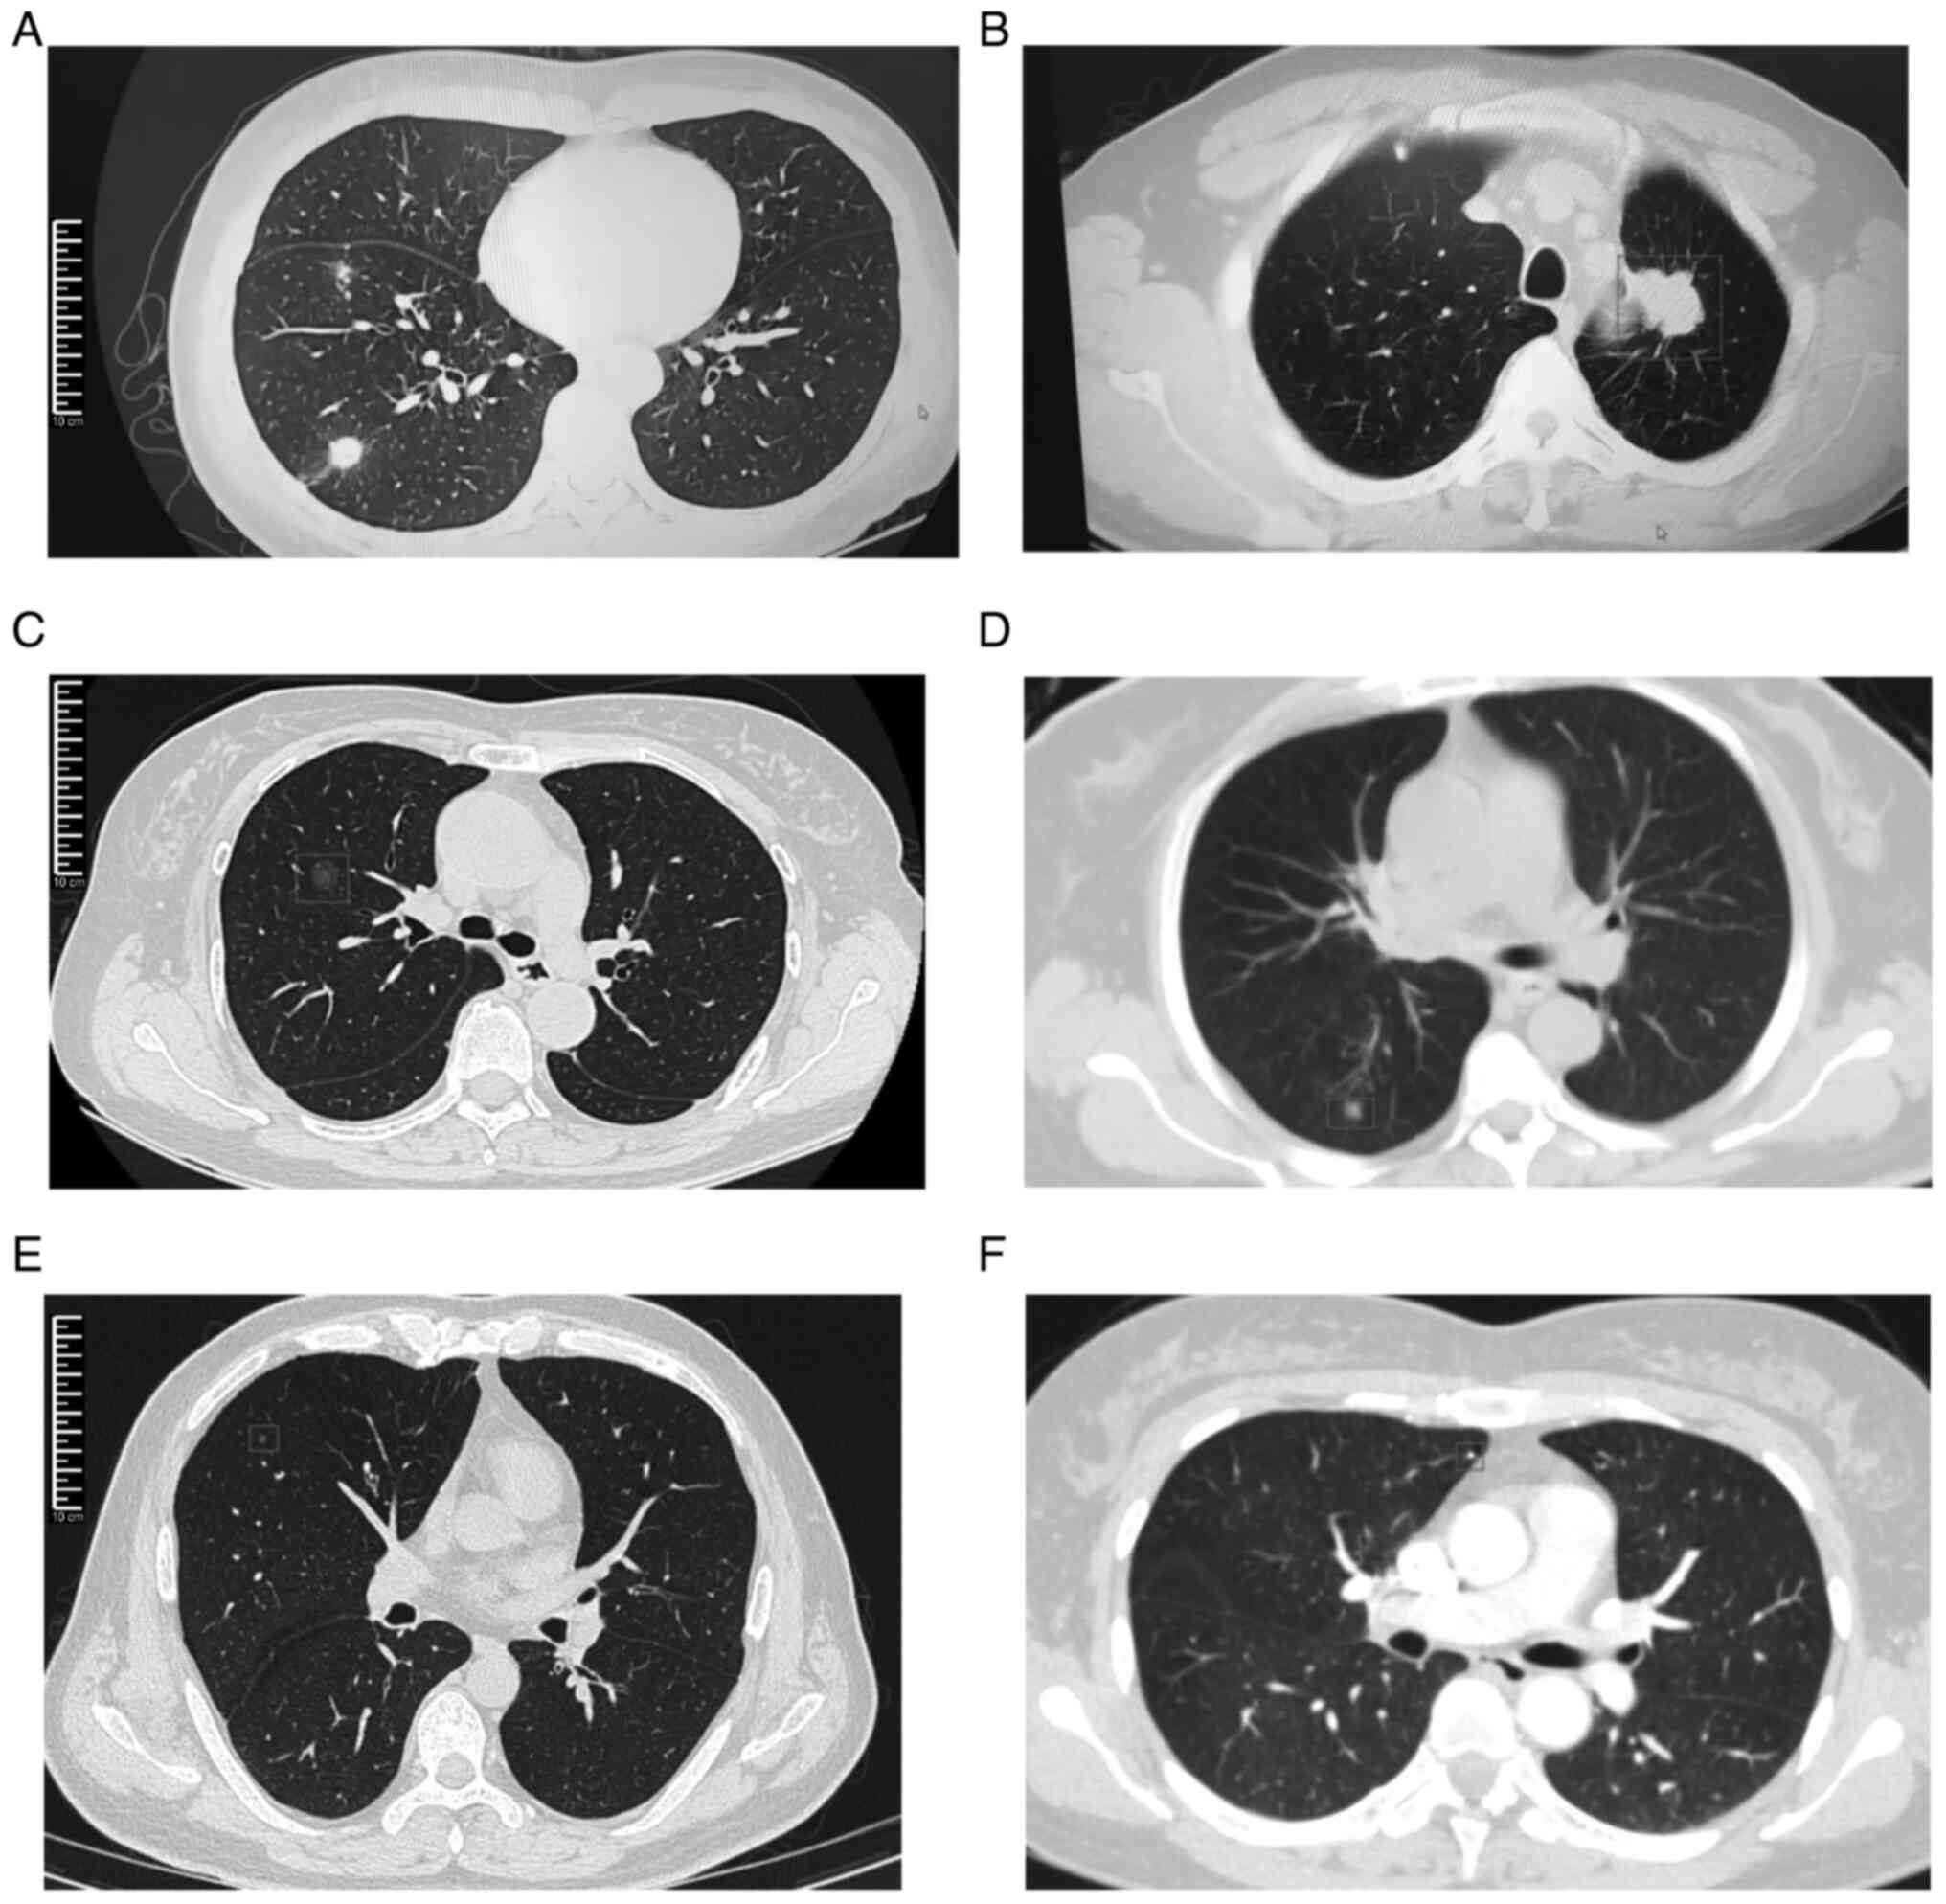
were diagnosed with other malignant tumors. The baseline
information for all participants is shown in Table I. Examples of chest CT images for
lung cancer and pulmonary nodule groups can be seen in Fig. 1.
 | Table I.Baseline information of all
participants. |
Table I.
Baseline information of all
participants.
| Clinical
characteristics | Pulmonary nodules
group (n=28) | Lung cancer group
(n=20) | Healthy group
(n=20) | P-value |
|---|
| Age, years |
|
|
|
|
| Median
(range) | 65.5 (44–87) | 70.5 (35–82) | 60.5 (48–71) | - |
| Mean ±
SD | 65.68±12.99 | 67.35±12.20 | 60.80±7.24 | 0.062 |
| Sex |
|
|
| 0.277 |
|
Male | 8 (28.6) | 10 (50.0) | 9 (45.0) |
|
|
Female | 20 (71.4) | 10 (50.0) | 11 (55.0) |
|
| Smoking
history |
|
|
| 0.569 |
|
Yes | 6 (21.4) | 7 (35.0) | 6 (30.0) |
|
| No | 22 (78.6) | 13 (65.0) | 14 (70.0) |
|
| Dust exposure
history |
|
|
| >0.999 |
|
Yes | 1 (3.6) | 0 (0.0) | 0 (0.0) |
|
| No | 27 (96.4) | 20 (100.0) | 20 (100.0) |
|
| Family history of
tumors |
|
|
| 0.057 |
|
Yes | 1 (3.6) | 4 (20.0) | 0 (0.0) |
|
| No | 27 (96.4) | 16 (80.0) | 20 (100.0) |
|
| Hypertension |
|
|
| 0.055 |
|
Yes | 5 (17.9) | 5 (25.0) | 0 (0.0) |
|
| No | 23 (82.1) | 15 (75.0) | 20 (100.0) |
|
| Type 2
diabetes |
|
|
| 0.061 |
|
Yes | 6 (21.4) | 2 (10.0) | 0 (0.0) |
|
| No | 22 (78.6) | 18 (90.0) | 20 (100.0) |
|
| Hyperuricemia |
|
|
| >0.999 |
|
Yes | 1 (3.6) | 0 (0.0) | 0 (0.0) |
|
| No | 27 (96.4) | 20 (100.0) | 20 (100.0) |
|
| Hyperlipidemia |
|
|
| 0.059 |
|
Yes | 6 (21.4) | 5 (25.0) | 0 (0.0) |
|
| No | 22 (78.6) | 15 (75.0) | 20 (100.0) |
|
| Fatty liver |
|
|
| 0.553 |
|
Yes | 2 (7.1) | 2 (10.0) | 0 (0.0) |
|
| No | 26 (92.9) | 18 (90.0) | 20 (100.0) |
|
| Coronary
atherosclerotic heart disease |
|
|
| 0.110 |
|
Yes | 4 (14.3) | 4 (20.0) | 0 (0.0) |
|
| No | 24 (85.7) | 16 (80.0) | 20 (100.0) |
|
| Heart failure |
|
|
| >0.999 |
|
Yes | 1 (3.6) | 0 (0.0) | 0 (0.0) |
|
| No | 27 (96.4) | 20 (100.0) | 20 (100.0) |
|
| Atrial
fibrillation |
|
|
| >0.999 |
|
Yes | 1 (3.6) | 1 (5.0) | 0 (0.0) |
|
| No | 27 (96.4) | 19 (95.0) | 20 (100.0) |
|
| Cerebral
infarction |
|
|
| >0.999 |
|
Yes | 1 (3.6) | 1 (5.0) | 0 (0.0) |
|
| No | 27 (96.4) | 19 (95.0) | 20 (100.0) |
|
| Pathological type
(adenocarcinoma) | - | 20 (100.0) | - | - |
Reagents and equipment
The reagents used in the present study mainly
included methanol, formic acid and ammonium acetate (supplementary
material). The instruments used included ultra-high-performance
liquid chromatograph (UHPLC), quadrupole Orbitrap ion trap mass
spectrometer, ultra-pure water system, multi-tube vortex
oscillator, benchtop high-speed refrigerated centrifuge, vacuum
centrifugal concentrator, chromatography columns, 200- and 1,000-µl
pipettes, and pipette tips (Table
SI, Table SII, Table SIII).
Plasma sample collection and
preparation
A 4-ml blood sample was obtained from all of the
participants in the early morning fasting state. The samples were
immediately centrifuged at 1,610 × g for 10 min at 4°C and the
plasma was transferred to a 1.5-ml clean centrifuge tube and stored
at −80°C until analysis. Once all samples were collected,
metabolomics analysis was conducted. The plasma samples were
pretreated as follows: i) The frozen plasma samples were thawed at
4°C for 30–60 min; ii) 100 µl of the plasma sample was precisely
pipetted into a 1.5-ml centrifuge tube and three times the volume
of pre-chilled methanol was added; iii) the mixture was vortexed
for 5 min, allowed to sit on ice for 10 min and then centrifuged at
15,000 × g for 15 min at 4°C; iv) 300 µl of the supernatant was
collected in a centrifuge tube and vacuum-concentrated for 4 h; and
v) the supernatant was re-dissolved in 50 µl of methanol/water
(1:1) and vortexed for 5 min, centrifuged at 15,000 × g for 15 min
at 4°C and the supernatant was then used for analysis.
LC-MS analysis conditions
LC-MS analysis was performed on plasma samples using
a Thermo Scientific Vanquish UHPLC system (Thermo Fisher
Scientific, Inc.) interfaced with a heated electrospray
ionization-equipped quadrupole-Orbitrap™ hybrid mass spectrometer.
Chromatographic separation was performed using a Waters™ UPLC high
strength silica T3 column (2.1×100 mm, 1.8 µm) under the following
conditions: i) The mobile phase comprised component a) 0.1% formic
acid and 0.1% aqueous formic acid solution, and component b)
methanol; and ii) the flow rate was maintained at 0.3 ml/min, with
the column temperature set to 40°C and an injection volume of 1 µl
was used (supplementary material).
Mass spectrometry was conducted in both positive and
negative ion modes with the following specific parameters: The ion
source voltage for positive and negative ions were set at 3.8 and
3.2 kV, respectively. The capillary heating temperature was 320°C,
with an auxiliary gas pressure of 10 psi and sheath gas pressure of
30 psi and the collision gas pressure was 1.5 mTorr. All gases
(auxiliary, sheath and collision gas) were nitrogen. The parameters
for the full scan in the first stage were set as follows: A
resolution of 60,000, an automatic gain control (AGC) target of
3×10⁶, a maximum isolation time of 200 msec and a
mass-to-charge ratio (m/z) scan range of 70–1,050. For metabolite
identification, the dd-MS2 scan mode (a data-dependent acquisition
method) was employed using the following parameters: Scanning was
conducted in four segments for m/z ranges of 70–160, 150–400,
390–1,050 and 70–1,050, with a resolution of 60,000, an AGC target
of 3×10⁶, a maximum isolation time of 100 msec and a
maximum of 8 ion fragments to be scanned (dynamic exclusion). The
mass isolation window was set to 1.5 and the collision energies
were 20, 30 and 40 V. The Xcalibur software (version 4.2; Thermo
Fisher Scientific, Inc.) was used to control the LC-MS system and
to perform data acquisition.
Quality control (QC)
QC samples were prepared for QC purposes. The QC
samples were obtained by taking a fixed volume from all samples,
mixing them uniformly and preparing them in the same manner as
other samples. In the present study, three blank samples were used
to equilibrate the chromatography column, followed by three QC
samples to equilibrate the columns under the same conditions. A QC
sample was inserted after every 8–10 samples to monitor the
stability and reproducibility of the entire LC-MS system, ensuring
the reliability of the data obtained in the present study.
Data analysis
Non-targeted metabolomics data processing
The Compound Discoverer software (version 3.3;
Thermo Fisher Scientific, Inc.) was used to preprocess data in both
positive and negative ion modes. The steps included importing the
raw data, peak extraction, deconvolution, peak alignment and
filtering or filling in missing values, resulting in an aligned
peak table containing retention times, m/z and peak areas. The
aligned peak table was then imported into open-source software
MetaboAnalyst (version 5.0; http://www.metaboanalyst.ca/), where data filtering
was performed by removing variables with a relative SD >20% in
QC samples. Subsequently, normalization was carried out using the
sum normalization method, followed by log data transformation and
auto-scaling, ultimately producing a normalized table of retention
times, m/z and peak areas. The normalized peak table was then
imported into Simca (version 14.1; Umetrics, Inc.) and GraphPad
Prism statistical analysis software (version 6.02; Dotmatics) for
preliminary statistical analysis.
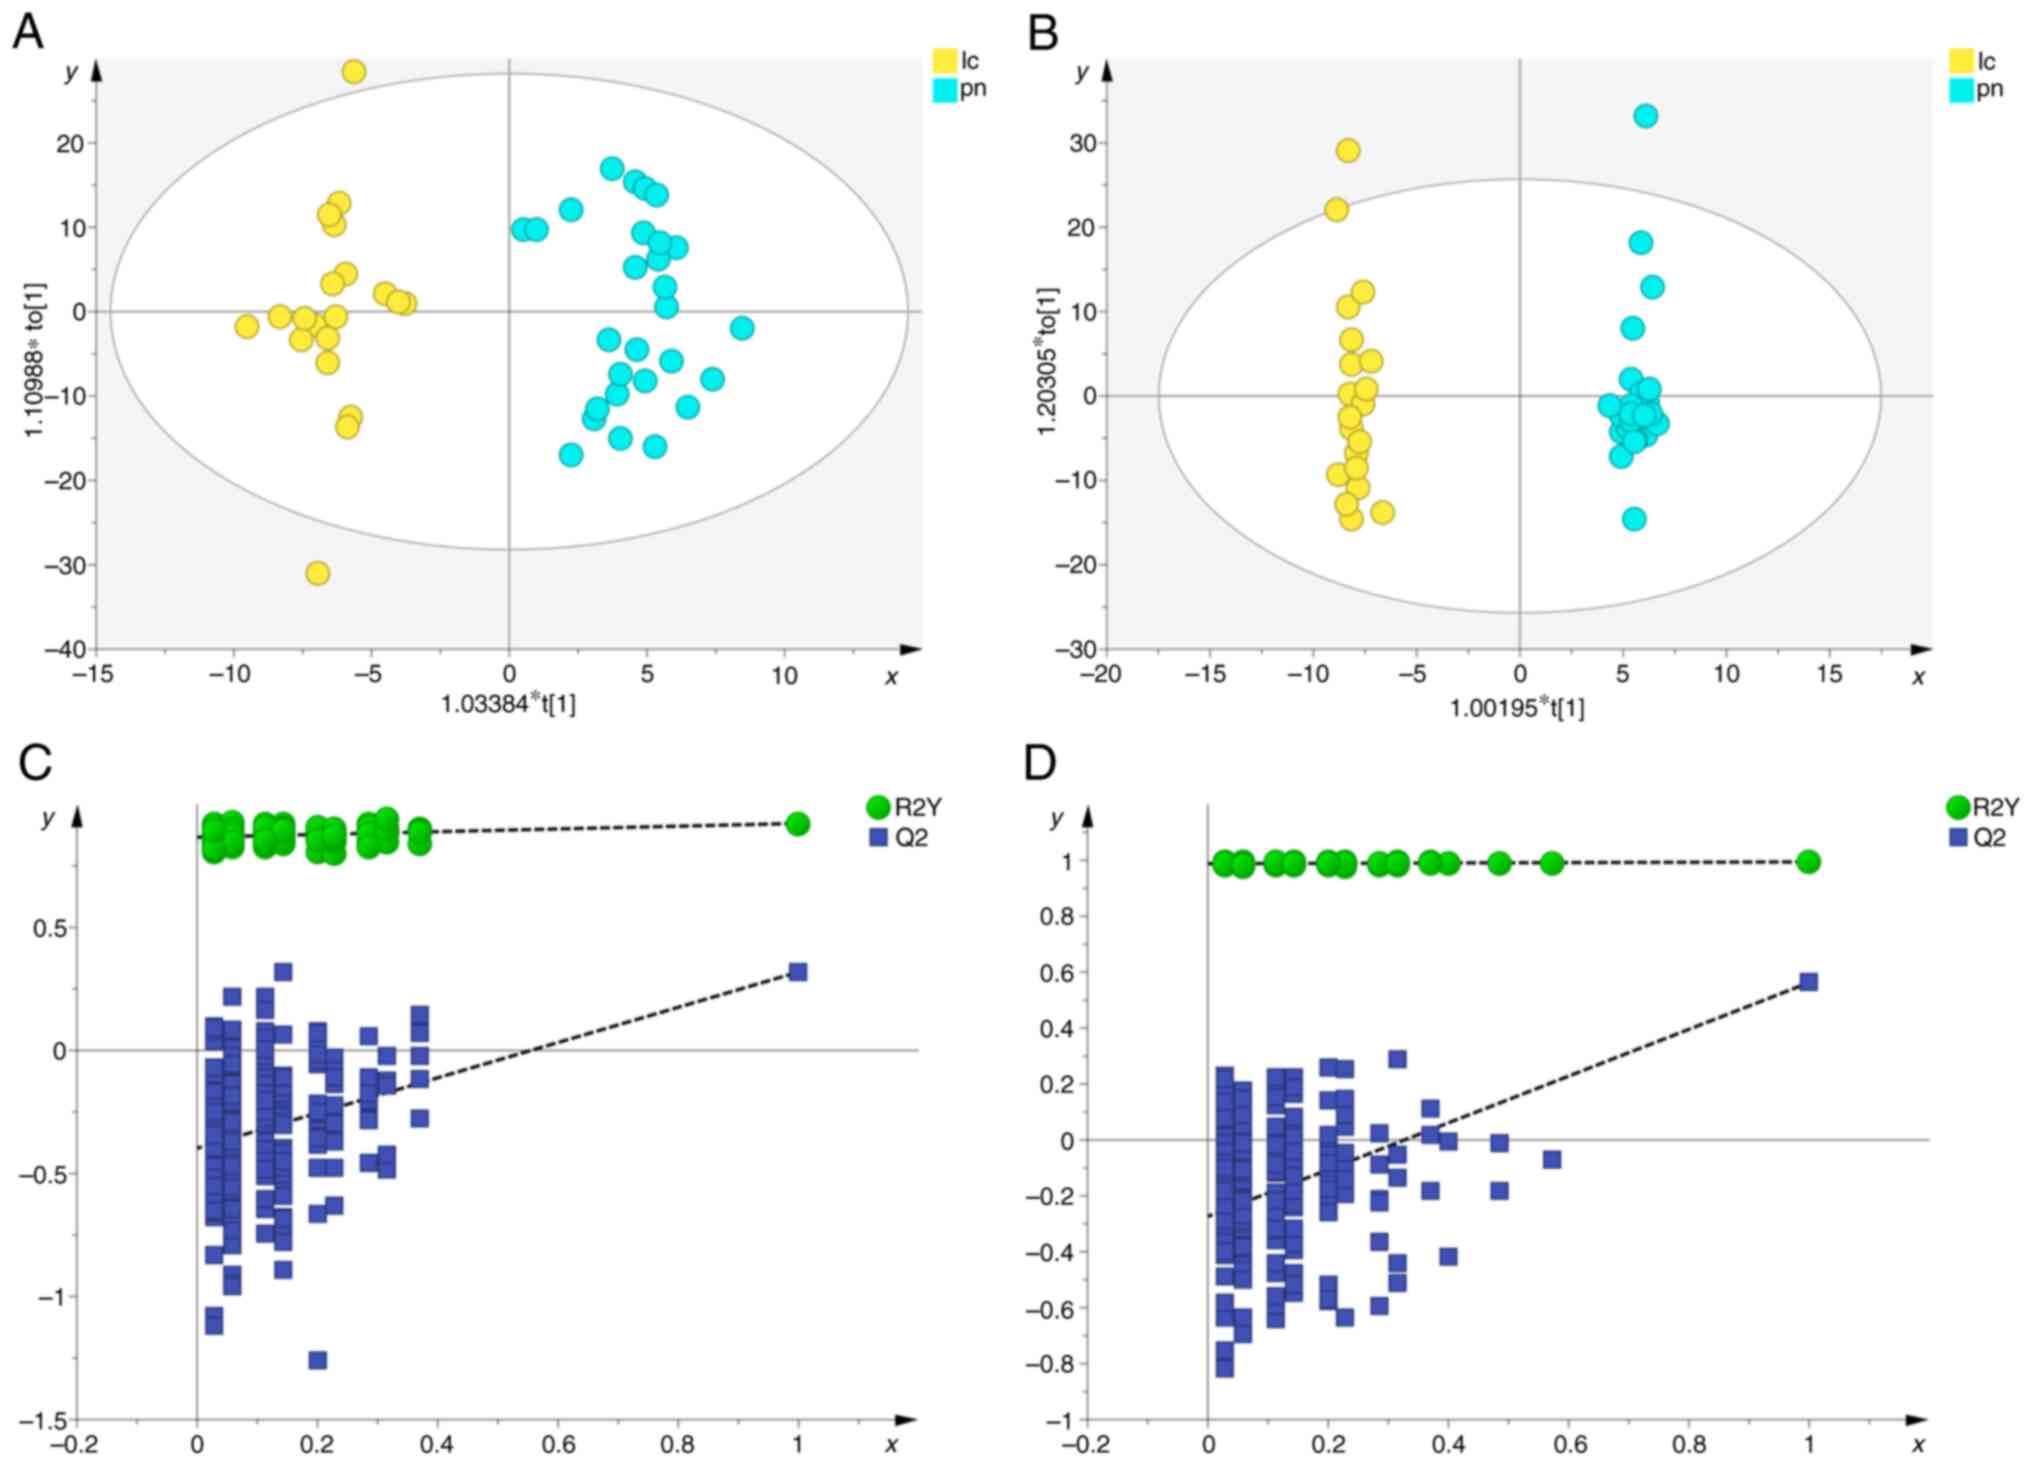
Principal component analysis (PCA) and orthogonal
partial least squares-discriminant analysis (OPLS-DA) were employed
to reflect overall metabolic differences and intergroup
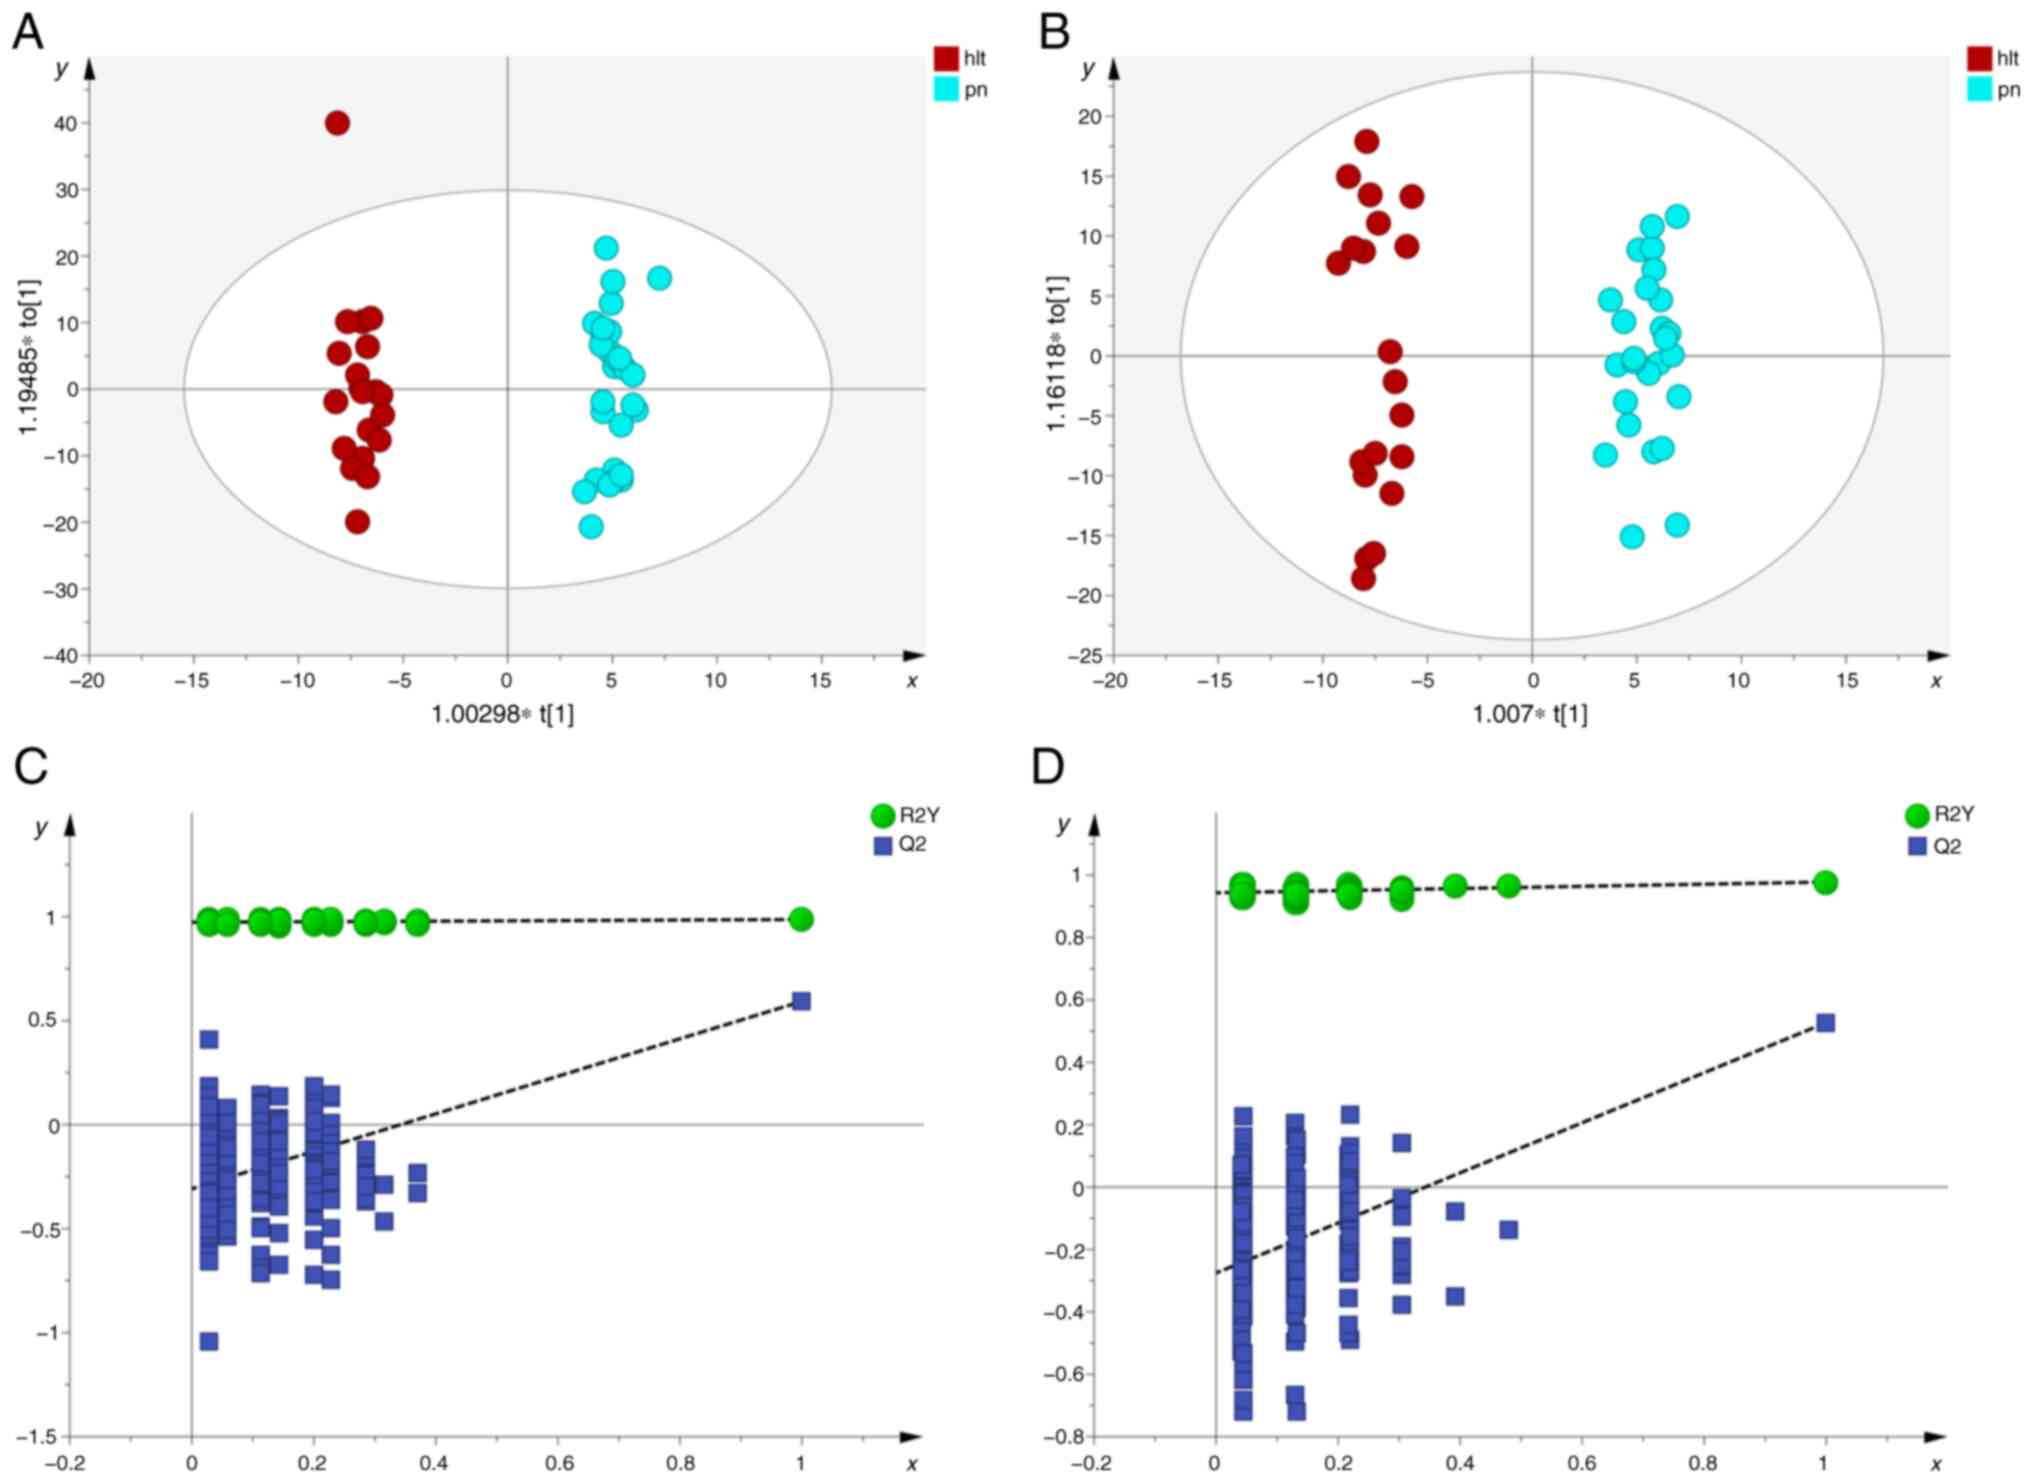
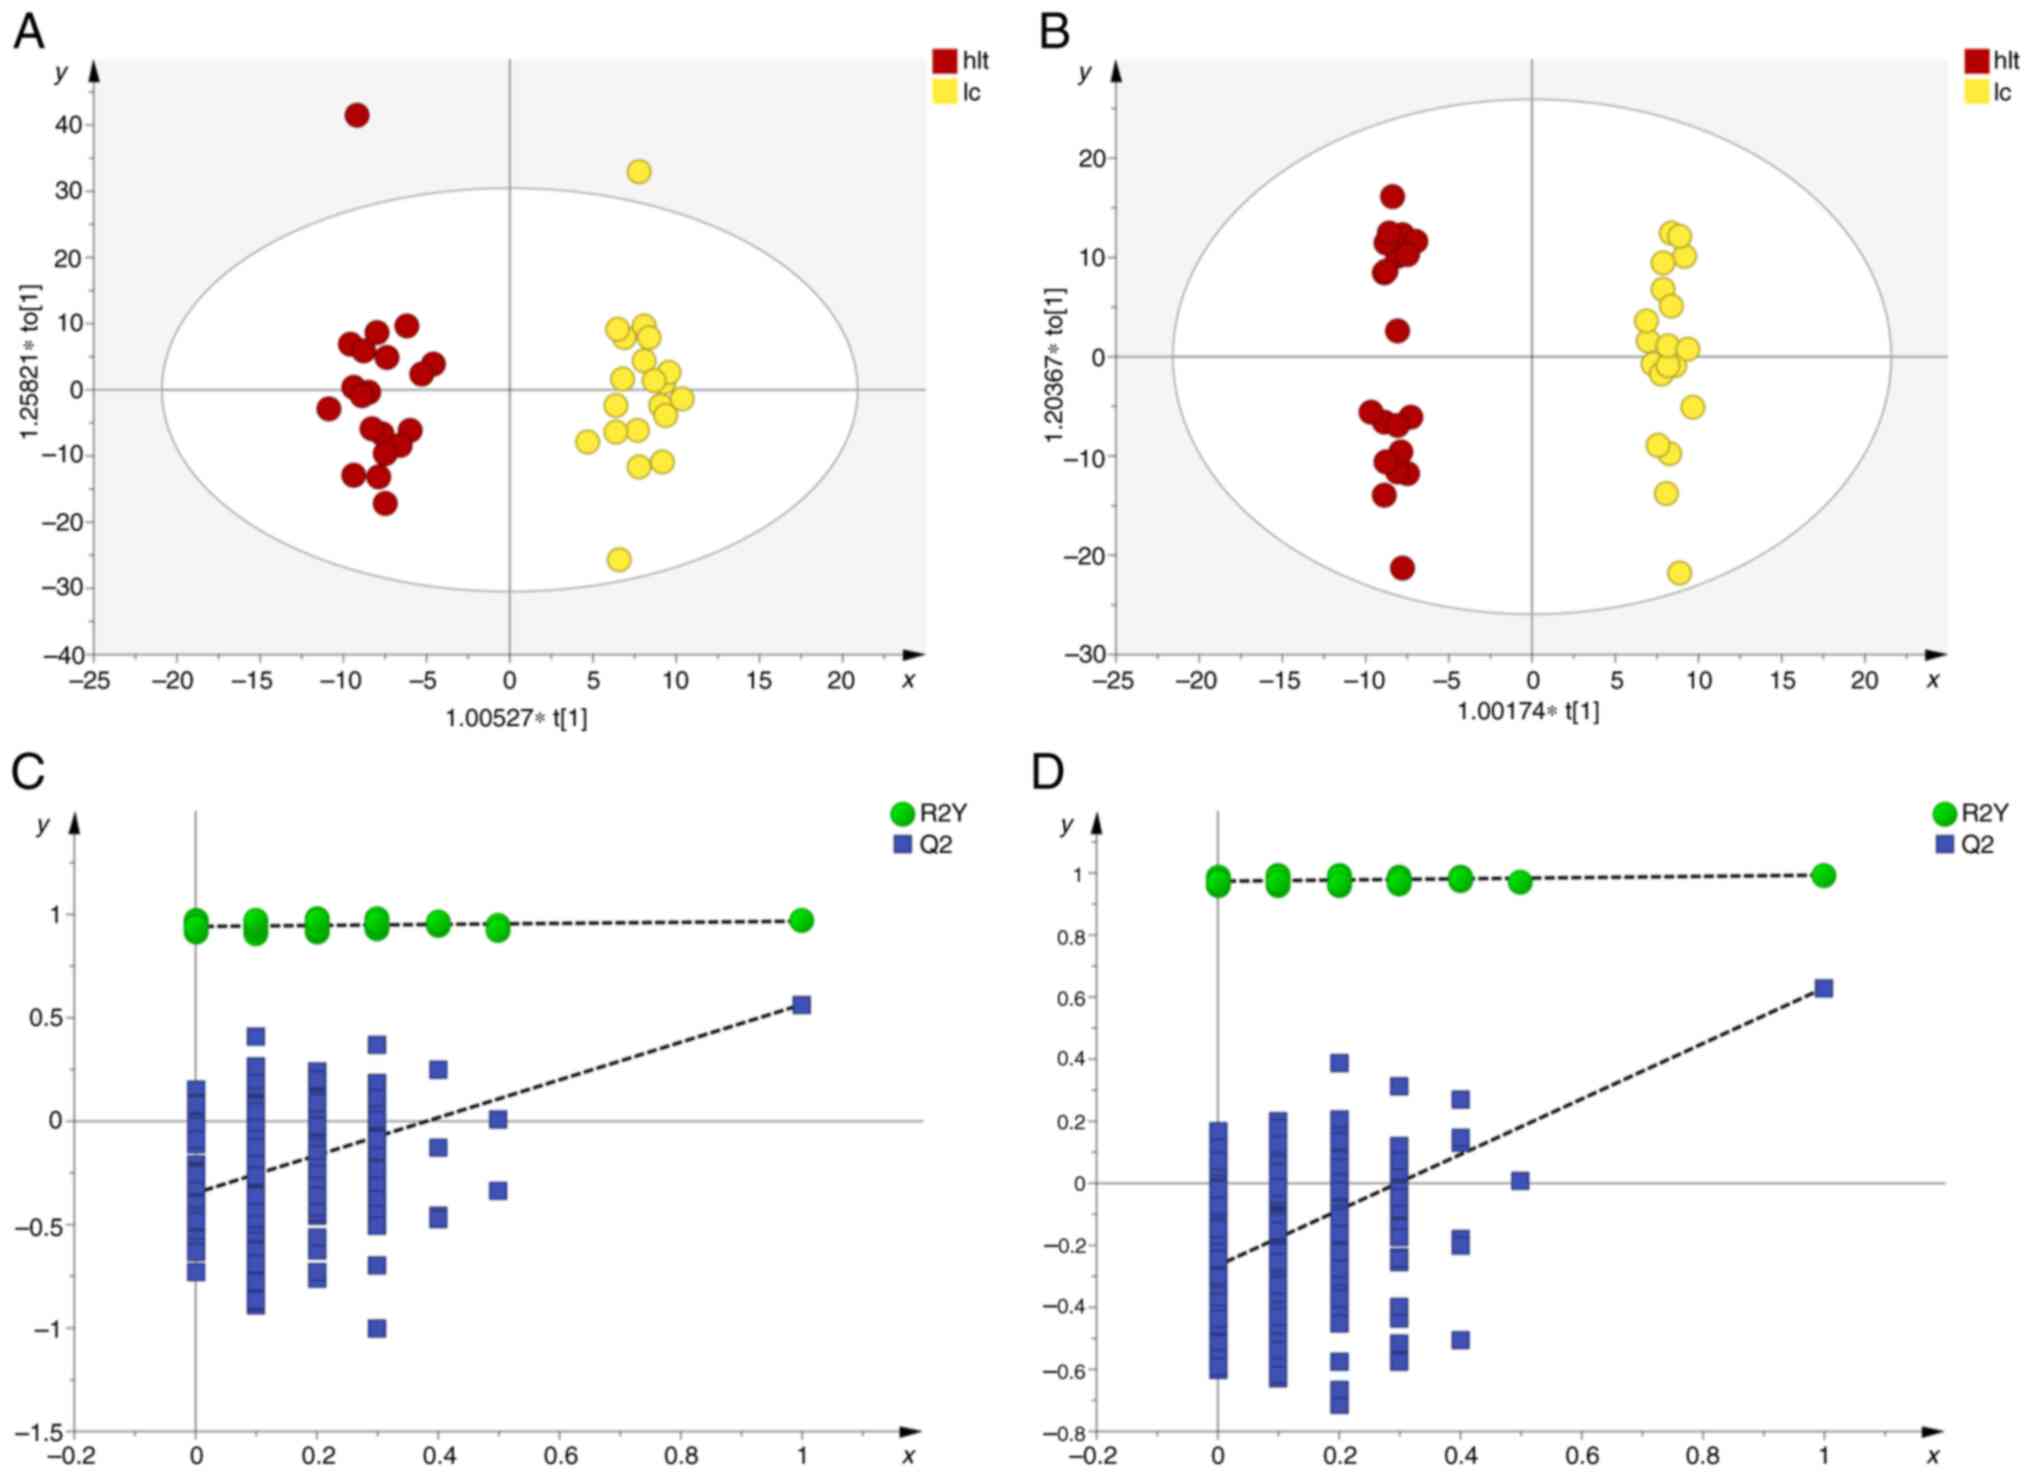
differences. To validate the accuracy of the OPLS-DA model, a
permutation analysis was conducted with 200 iterations to eliminate
the randomness associated with the supervised learning method. The
quality of the OPLS-DA mode can be explained by R2Y and Q2 values.
The R2Y estimates the goodness of fit of the model that represents
the fraction of explained Y-variation and Q2 estimates the ability
of prediction. Differential metabolites were identified using a
combination of quantitative and qualitative methods. For the
quantitative method, variable importance in the projection (VIP)
values from the OPLS-DA model were used in conjunction with
P-values from unpaired t-tests to identify differential
metabolites, with the criteria set as VIP >1.5 and P<0.05.
For the qualitative method, searches were conducted in the mzCloud
(https://www.mzcloud.org), Human Metabolome
Database (HMDB; http://www.hmdb.ca), ChemSpider
(https://www.chemspider.com), BioCyc
(https://www.biocyc.org) and Kyoto Encyclopedia of
Genes and Genomes (KEGG; http://www.genome.jp/kegg) databases. The identified
differential metabolites were then subjected to metabolic pathway
enrichment analysis using the KEGG database, considering pathways
with an impact value of ≥0.01 as significantly altered
pathways.
Statistical analysis
Statistical analysis was performed using SPSS
(version 25.0; IBM Corp.) and R software (version 4.4.1; Posit
Software, PBC). Categorical data were described by frequency (n)
and percentages (%), while continuous data were expressed as the
mean ± SD. Intergroup comparisons were conducted using SPSS 25.0.
The categorical data analyzed by the χ2 test included
sex and smoking history, while Fisher's exact test was applied to
other categorical data. For continuous data, the age of the
participants deviated from the normal distribution (tested with the
Shapiro-Wilk test); therefore, the non-parametric Kruskal-Wallis
test with Dunn's multiple post-hoc comparisons test was used to
compare the groups. R version 4.4.1 was used for binary logistic
regression analysis and receiver operating characteristic (ROC)
curve analyses, with the area under the curve (AUC) used to
evaluate their diagnostic effectiveness. The standard for AUC
values were as follows: 0.5<AUC<0.7 indicated low diagnostic
accuracy, 0.7<AUC<0.9 represented a moderate diagnostic
accuracy and AUC >0.9 indicated high diagnostic accuracy.
P<0.05 was considered to indicate a statistically significant
difference.
Results
General characteristics of the study
participants
In the present study, the lung cancer group included
10 males and 10 females, aged 35–82 years, with an average age of
67.35±12.20 years. The pulmonary nodule group consisted of 8 males
and 20 females, aged 44–87 years, with an average age of
65.68±12.99 years. The healthy group included 9 males and 11
females, aged 48–71 years, with an average age of 60.80±7.24 years.
After comparison, there were no significant differences among the
three groups in terms of age, sex, smoking history, dust exposure
history, family history of tumors, hypertension, type 2 diabetes,
hyperuricemia, hyperlipidemia, fatty liver, coronary
atherosclerotic heart disease, heart failure, atrial fibrillation
and cerebral infarction (P<0.05; Table I).
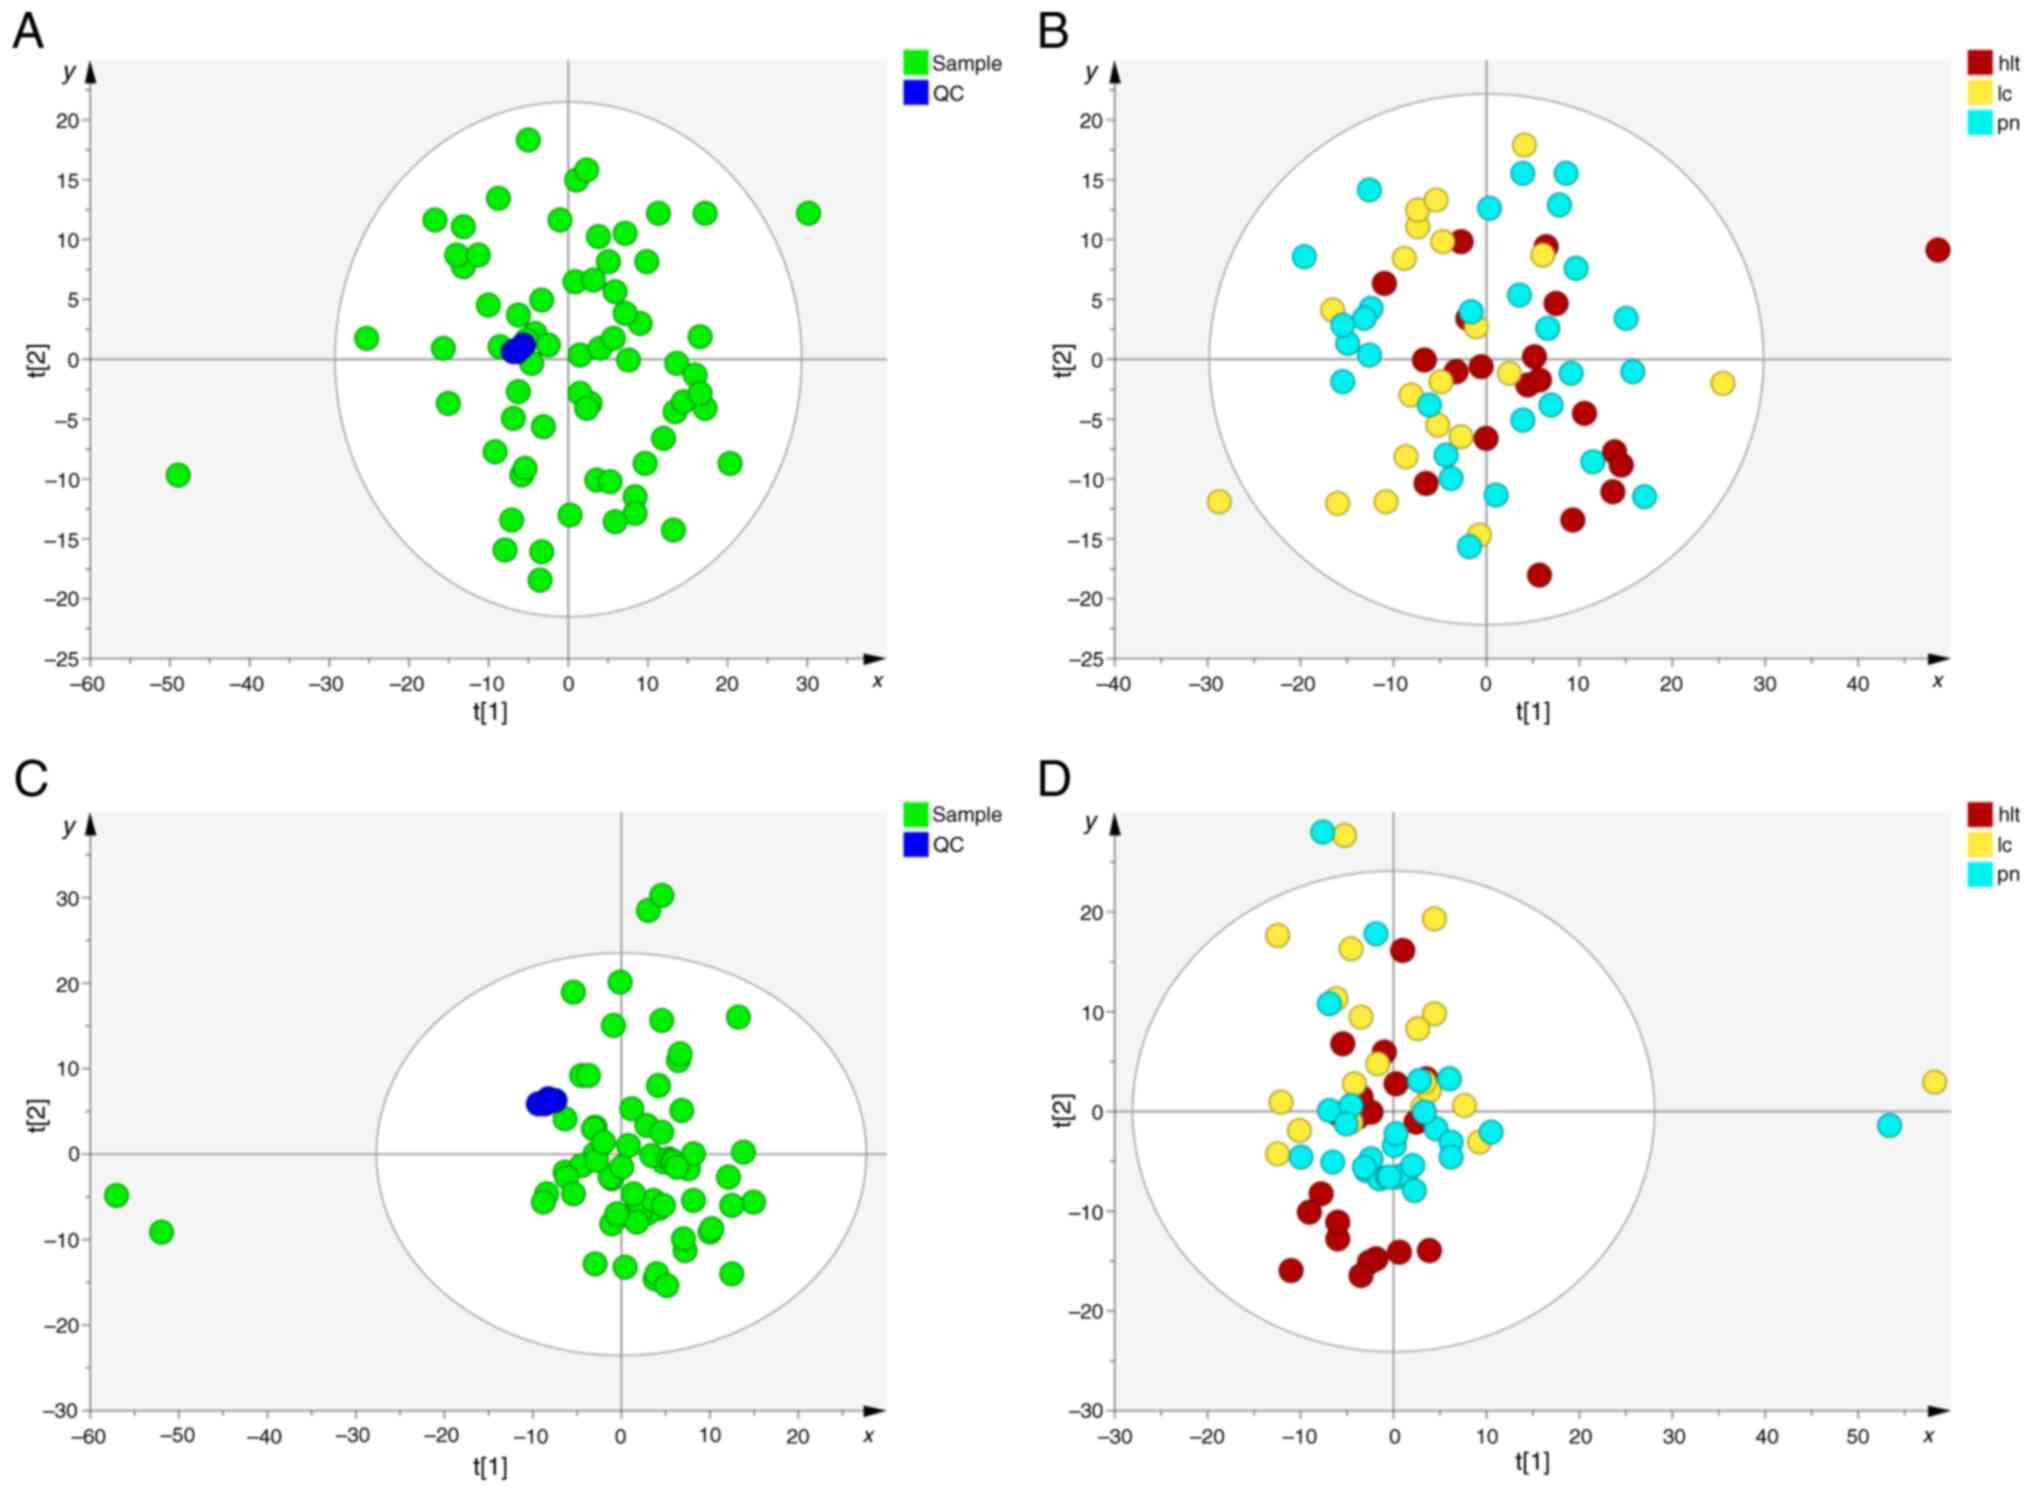
QC assessment and overall metabolomic
characteristics among the three groups of samples
First, PCA analysis was performed to assess the
quality of the QC samples and other clinical samples (Fig. 2). The results demonstrated that all
QC samples clustered together under both positive and negative ion
modes, indicating good system stability and reproducibility
(Fig. 2A and C). Subsequently, PCA
analysis was conducted on samples from the lung cancer, pulmonary
nodule and healthy groups. The PCA score plots indicated a slight
separation trend among the three groups (Fig. 2B and D). Lastly, to further
elucidate this distinction, OPLS-DA analysis was conducted. The
results demonstrated a notable separation between the pulmonary
nodule and healthy groups, lung cancer and healthy groups, as well
as between the pulmonary nodule and lung cancer groups, across both
positive and negative ion modes, indicating notable metabolic
differences among the groups (Fig.
3, Fig. 4, Fig. 5).
Differential metabolite selection
among the lung cancer, pulmonary nodule and healthy groups
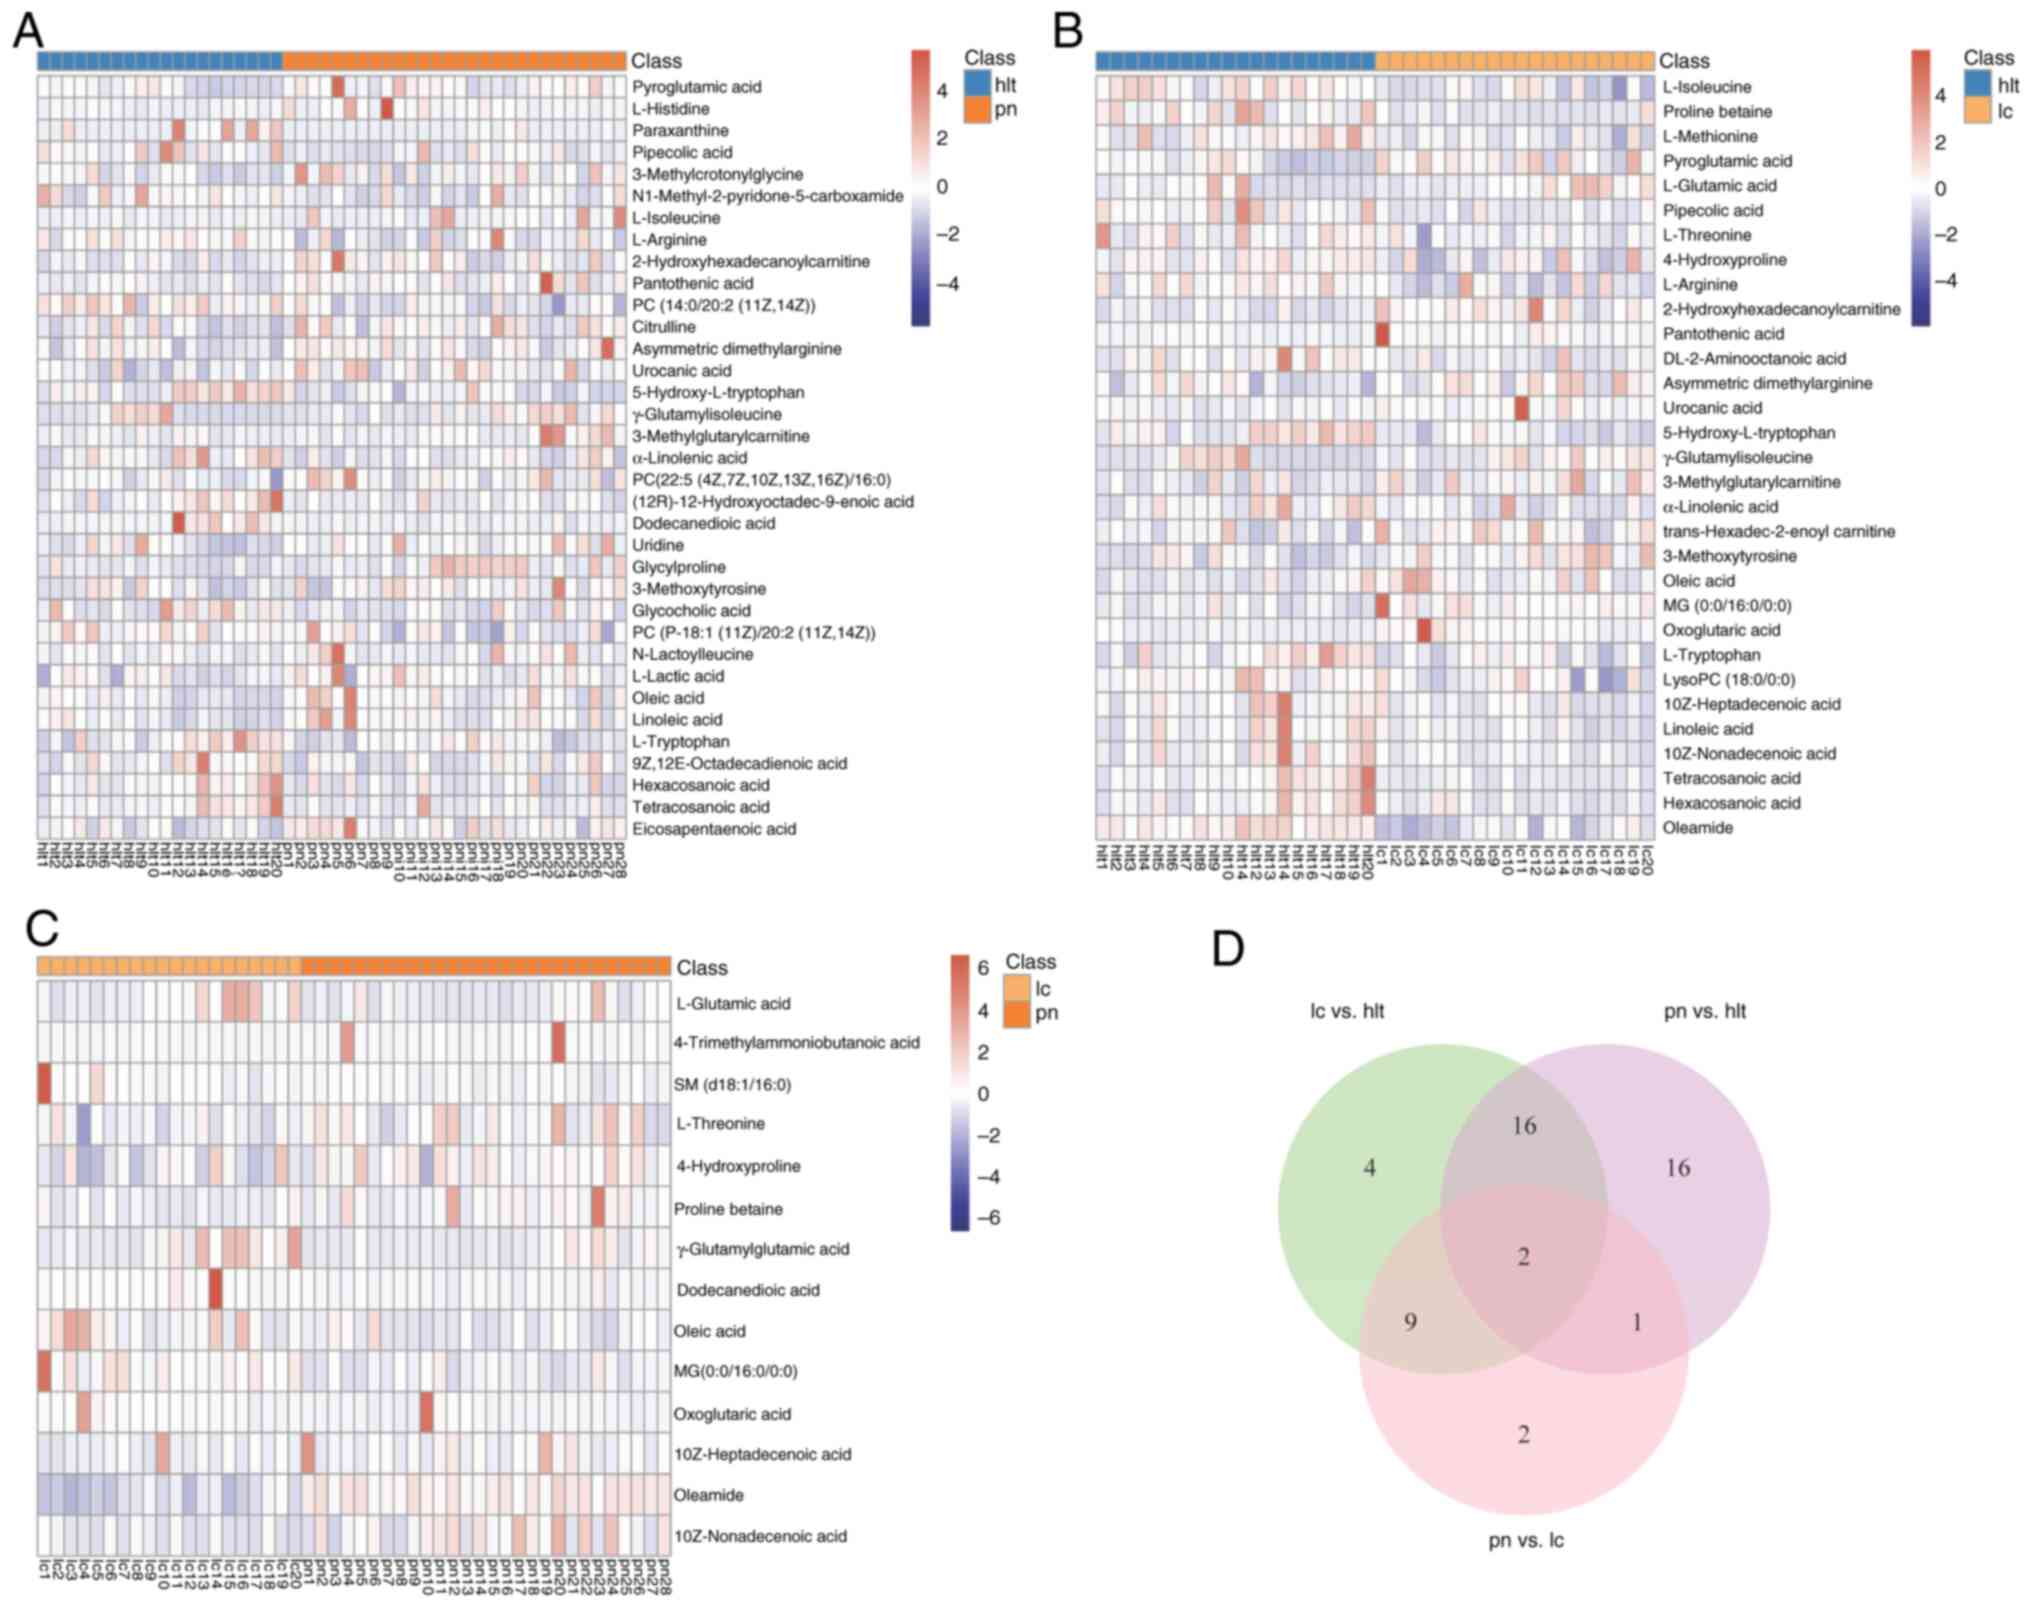
Differential metabolites were selected based on the
VIP values and P-values from the OPLS-DA analysis. The results
indicated that under both positive and negative ion modes, a total
of 50 differential metabolites were identified among the lung
cancer, lung nodule and healthy control groups. Among them, 35
differential metabolites were identified between the pulmonary
nodule and healthy groups (Fig.
6A), 31 differential metabolites were identified between the
lung cancer and healthy groups (Fig.
6B) and 14 differential metabolites were identified between the
pulmonary nodule and lung cancer groups (Fig. 6C).
By comparing the differential metabolites among the
groups, 18 overlapping differential metabolites were identified
between the pulmonary nodule and healthy groups, as well as between
the lung cancer and healthy groups, with 16 of these demonstrating
the same trend of change in both comparisons. This reflected the
clinical similarities between patients with pulmonary nodules and
those with lung cancer. In addition, there were 11 overlapping
differential metabolites between the pulmonary nodule and healthy
groups, as well as between the pulmonary nodule and lung cancer
groups. Furthermore, there were three overlapping differential
metabolites between the lung cancer and healthy groups, as well as
between the pulmonary nodule and lung cancer group. The Venn
diagram indicates the overlap of the differential metabolites in
the three comparisons (Fig. 6D).
Detailed information on the overlapping metabolites is provided in
Table II.
| Table II.Differential metabolites with common
metabolic characteristics across groups. |
Table II.
Differential metabolites with common
metabolic characteristics across groups.
| Pulmonary nodules
and healthy groups vs. lung cancer and healthy groups (n=18) | Lung cancer and
healthy groups vs. pulmonary nodules and lung cancer groups
(n=11) | Pulmonary nodules
and healthy groups vs. pulmonary nodules and lung cancer groups
(n=3) |
|---|
| Pyroglutamic
acid | Oxoglutaric
acid | Oleic acid |
|
2-Hydroxyhexadecanoylcarnitine |
MG(0:0/16:0/0:0) |
γ-Glutamylisoleucine |
| Pantothenic
acid | L-glutamic
acid | Dodecanedioic
acid |
| Asymmetric
dimethylarginine | L-threonine | - |
| Urocanic acid |
4-Hydroxyproline | - |
|
γ-Glutamylisoleucine | Proline
betaine | - |
|
3-Methylglutarylcarnitine | 10z-Heptadecenoic
acid | - |
|
3-Methoxytyrosines | Oleamide | - |
| Oleic acid | 10z-Nonadecenoic
acid | - |
| L-isoleucine | Oleic acid | - |
| Linoleic acid |
γ-Glutamylisoleucine | - |
|
5-Hydroxy-L-tryptophan | - | - |
| α-Linolenic
acid | - | - |
| L-Tryptophan | - | - |
| Hexacosanoic
acid | - | - |
| Tetracosanoic
acid | - | - |
| L-arginine | - | - |
| Pipecolic acid | - | - |
Potential diagnostic biomarker
selection
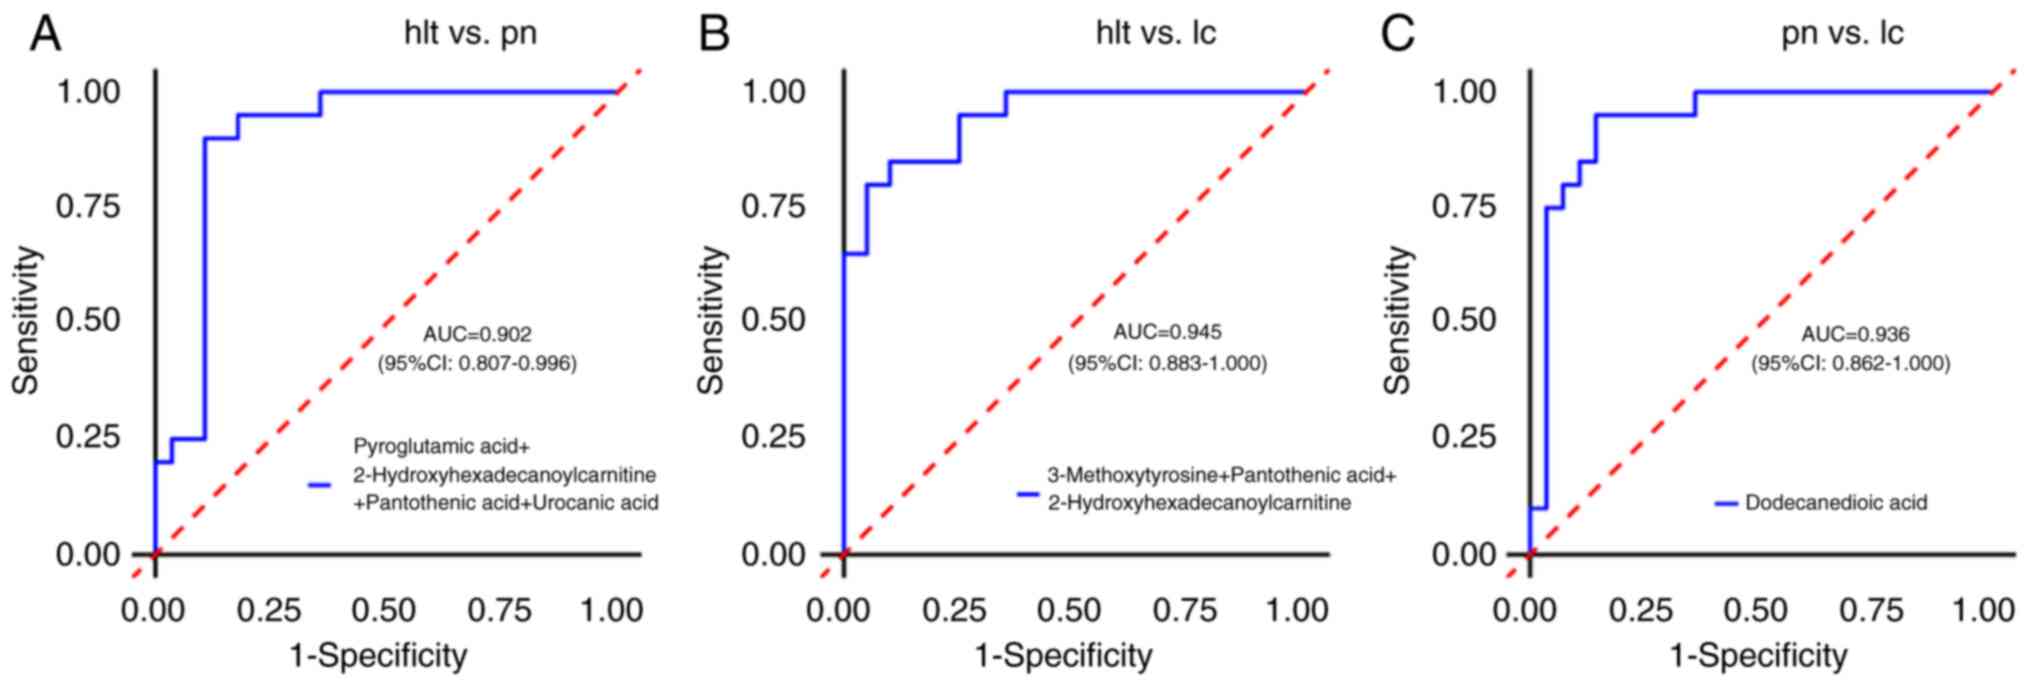
ROC curve analysis was conducted to assess the
diagnostic value of plasma metabolites among patients with lung
cancer, pulmonary nodules and healthy individuals, in order to
identify potential diagnostic biomarkers. The results indicated
that the AUC values for all differential metabolites between the
pulmonary nodule and healthy groups, as well as between the lung
cancer and healthy groups, were <0.9, suggesting that the
diagnostic value of single differential metabolites was low.
Further combination analysis of differential metabolites revealed
that in the pulmonary nodule and healthy groups, the joint
detection of pyroglutamic acid, 2-hydroxyhexadecanoylcarnitine,
pantothenic acid and urocanic acid achieved an AUC value of 0.902
(95% CI, 0.807–0.996), indicating a high diagnostic value, with
sensitivity and specificity of 89.3 and 90.0%, respectively
(Fig. 7A). In the lung cancer and
healthy groups, the combined detection of 3-methoxytyrosine,
pantothenic acid and 2-hydroxyhexadecanoylcarnitine resulted in an
AUC value of 0.945 (95% CI, 0.883–1.000), also indicating a high
diagnostic value, with sensitivity and specificity of 90.0 and
80.0%, respectively (Fig. 7B). Of
note, urocanic acid, pyroglutamic acid, pantothenic acid,
3-methoxytyrosine and 2-hydroxyhexadecanoylcarnitine were
overlapping differential metabolites between the pulmonary nodule
and the healthy groups, as well as between the lung cancer and the
healthy groups, displaying the same trend of change. This suggested
that these differential metabolites may serve as biomarkers to
distinguish patients with lung cancer and pulmonary nodules from
healthy individuals.
Furthermore, ROC curve analysis was conducted
between the lung cancer and the pulmonary nodule groups to identify
potential diagnostic biomarkers that can differentiate between
patients with lung cancer and those with pulmonary nodules. The
results demonstrated that the AUC value for dodecanedioic acid was
0.936 (95% CI, 0.862–1.000), indicating a high diagnostic value,
with a sensitivity of 95.0% and specificity of 85.7% (Fig. 7C). This suggested that dodecanedioic
acid has potential clinical application value in screening for lung
cancer and pulmonary nodules and can serve as an effective
biomarker to distinguish between the two.
Metabolic pathway analysis
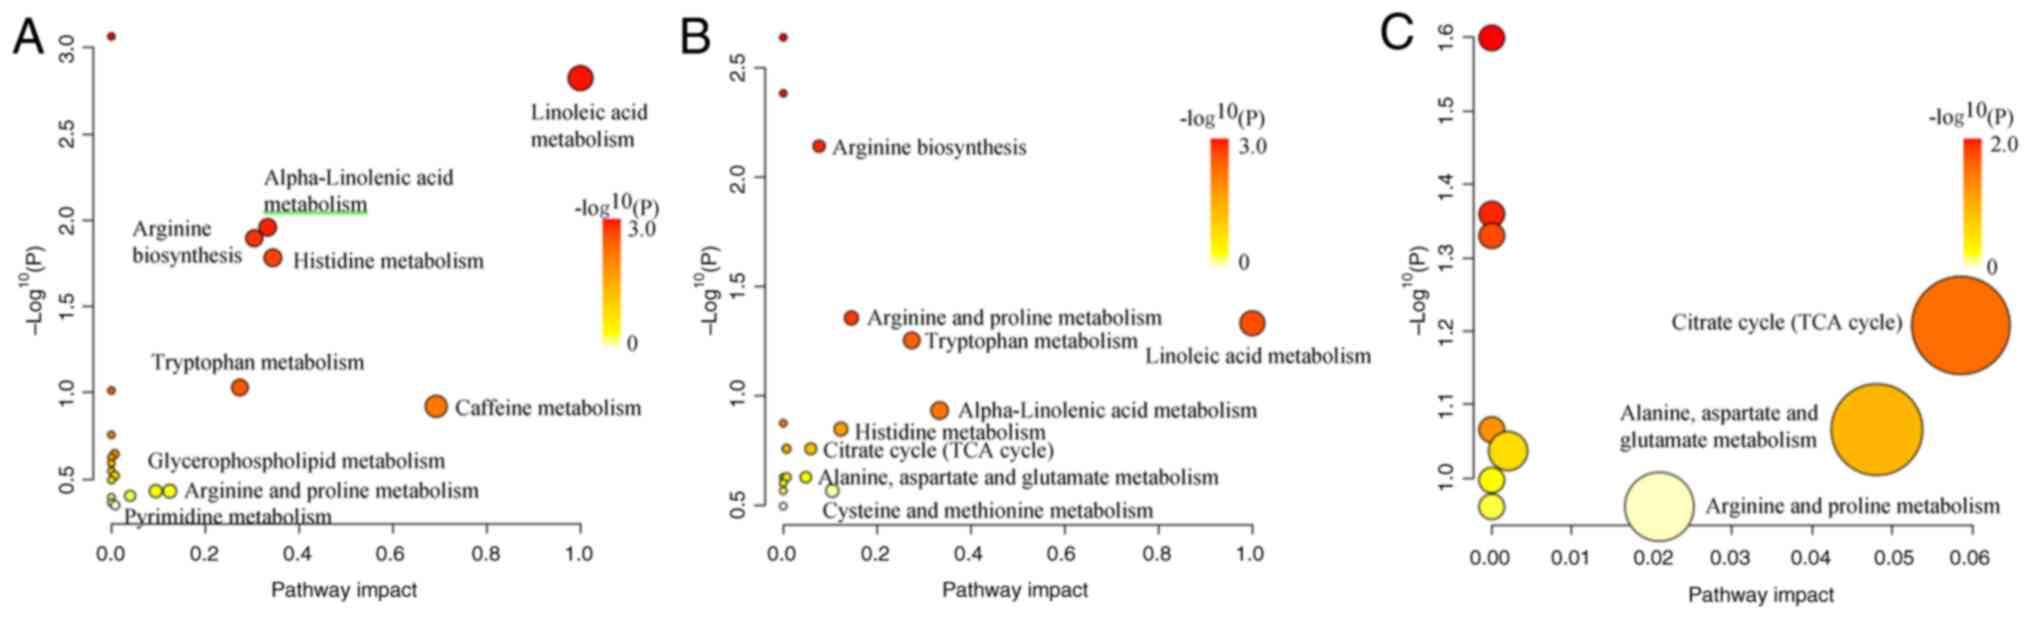
Pathway enrichment analysis was performed on the
selected differential metabolites. The results demonstrated that a
total of 21 metabolic pathways were enriched in both the pulmonary
nodules and healthy groups, among which 9 pathways exhibited
significant changes, including ‘linoleic acid metabolism’,
‘caffeine metabolism’, ‘histidine metabolism’, ’α-linolenic acid
metabolism’, ‘arginine biosynthesis’, ‘tryptophan metabolism’,
‘arginine and proline metabolism’, ‘glycerophospholipid metabolism’
and ‘pyrimidine metabolism’ (Fig.
8A). As compared with the healthy group, a total of 18
metabolic pathways were enriched in the lung cancer group, with 9
pathways demonstrating significant changes: ‘Linoleic acid’,
‘α-linolenic acid metabolism’, ‘tryptophan metabolism’, ‘arginine
and proline metabolism’, ‘histidine metabolism’, ‘cysteine and
methionine metabolism’, ‘arginine biosynthesis’, ‘citrate cycle
[tricarboxylic acid (TCA) cycle]’ and ‘alanine, aspartate and
glutamate metabolism’ (Fig. 8B). In
the comparison between the pulmonary nodule and lung cancer groups,
a total of 10 metabolic pathways were enriched, with 3 pathways
demonstrating notable changes: ‘Citrate cycle (TCA cycle)’,
‘alanine, aspartate and glutamate metabolism’ and ‘arginine and
proline metabolism’ (Fig. 8C).
By comparing the metabolic pathways among the
groups, it was identified that between the pulmonary nodule and
healthy groups, as well as between the lung cancer and healthy
groups, six metabolic pathways were shared: ‘Linoleic acid
metabolism’, ‘α-linolenic acid metabolism’, ‘tryptophan
metabolism’, ‘arginine and proline metabolism’, ‘histidine
metabolism’ and ‘arginine biosynthesis’. Between the pulmonary
nodule and healthy groups, as well as between the pulmonary nodule
and lung cancer groups, arginine and proline metabolism was a
shared and significantly altered pathway. In addition, between the
lung cancer and healthy groups, as well as between the pulmonary
nodule and lung cancer groups, three metabolic pathways were
shared: ‘Citrate cycle (TCA cycle)’, ‘alanine, aspartate and
glutamate metabolism’ and ‘arginine and proline metabolism’.
Furthermore, the present study revealed that ‘arginine and proline
metabolism’ is a pathway that indicated significant changes across
all three groups.
Discussion
Lung cancer staging is a key determinant of
prognosis (7). Several countries,
such as the USA and the UK, have implemented lung cancer screening
programs aimed at improving outcomes through early diagnosis
(23–25). CT, as the primary screening tool,
offers rich morphological information, high sensitivity and
technical maturity (10,26). However, its specificity is
relatively low, as certain benign lesions share imaging
characteristics with lung cancer, leading to overdiagnosis
(27). To address this limitation,
current research focuses on multimodal strategies and the
development of novel methods. For example, using artificial
intelligence to mine radiomic features and integrate multimodal
data to enhance CT specificity (5,27).
Metabolomics is an emerging technology and analyzes metabolites
(15). As the products of
interactions among genes, RNA and proteins, metabolites can reflect
the current physiological and pathological states of the body in
real time (28) and have the
potential for high specificity, offering a novel avenue to improve
the diagnostic specificity of lung cancer in the future. In the
present study, LC-MS was used to identify specific metabolic
biomarkers that distinguish lung cancer, pulmonary nodules and
healthy individuals, providing a novel strategy for early
diagnosis.
The differential metabolites and ROC curves from the
present study demonstrated that urocanic acid, pyroglutamic acid,
pantothenic acid, 3-methoxytyrosine and
2-hydroxyhexadecanoylcarnitine display the same trend of changes in
lung cancer, pulmonary nodules and healthy individuals. In
addition, dodecanedioic acid can distinguish between pulmonary
nodule and lung cancer, suggesting that the aforementioned
metabolites are involved in the occurrence and development of lung
cancer. This is consistent with previous literature. Filaggrin is
degraded into histidine, which is then converted into urocanic acid
by histidinase. Urocanic acid undergoes a series of enzymatic
reactions to form glutamic acid (29–31).
The glutamic acid is subsequently metabolized into pyroglutamic
acid, which influences glutamine and glutathione metabolism,
thereby participating in tumorigenesis (32,33).
Pantothenic acid is a precursor of coenzyme A, which is acetylated
to form acetyl-coenzyme A (acetyl-CoA), participating in processes
such as the TCA cycle and lipid metabolism, thereby affecting the
growth and proliferation of cancer (34–36).
The HMDB indicates that 3-methoxytyrosine is a tyrosine-derived
metabolite, while 2-hydroxyhexadecanoylcarnitine is classified as a
member of fatty acid esters. Dysregulation of tyrosine metabolism
can not only lead to lung cancer but also interplay with the tumor
immune microenvironment, which serves a key role in cancer
development (37–39). In addition, it has been reported
that 3-methoxytyrosine may regulate immune responses by modulating
enzyme activity (40) and these
immune responses are closely associated with tumorigenesis and
progression (41,42). Fatty acid esters are derivatives of
fatty acids, and fatty acids can then feed into various metabolic
pathways, such as the synthesis of complex lipids like
triacylglycerides, and participation in β-oxidation processes,
providing energy for tumor proliferation and producing intermediate
products that connect different metabolic activities (43). This is a key factor in the
occurrence of cancer (44).
Dodecanedioic acid, a 12C/medium-chain water-soluble
dicarboxylic acid, undergoes oxidative metabolism in mitochondria
to generate acetyl-CoA (45).
Acetyl-CoA provides substrates and raw materials for fatty acid
synthesis and histone acetylation modification, which are key
pathways in the occurrence and progression of cancer (46,47).
Therefore, the present study suggested that urocanic acid,
pyroglutamic acid, pantothenic acid, 3-methoxytyrosine and
2-hydroxyhexadecanoylcarnitine can serve as biomarkers to
distinguish patients with lung cancer from those with pulmonary
nodules and healthy individuals. Dodecanedioic acid is a potential
biomarker for early lung cancer diagnosis of patients with
pulmonary nodule. To the best of our knowledge, the results of the
present study are novel and have not been covered in previous
studies. Compared with the high-abundance metabolites detected by
NMR, such as lipoproteins and glucose and the volatile metabolites
identified by GC-MS, such as naphthalene and propene, the LC-MS
employed in the present study detected certain different
metabolites, including small molecular organic acids,
acylcarnitines and modified amino acids, expanding the metabolic
profile of lung cancer (48–50).
The findings from the metabolic pathway enrichment
analysis demonstrated that there are notable abnormalities in
pathways associated with amino acids and lipids among lung cancer,
pulmonary nodules and healthy individuals. This suggested that the
mechanisms underlying the development of lung cancer may be
associated with these two metabolic alterations. Research has
revealed that metabolic reprogramming of amino acids and lipids
represents a hallmark of tumorigenesis (51,52).
Amino acids, as components of proteins and signaling molecules,
serve a role in various biological processes, including the
biosynthesis of proteins and nucleic acids, energy production,
oxidative stress homeostasis and epigenetic modifications (51,53).
These biological processes established favorable conditions for the
occurrence of tumors. For instance, amino acids, such as glycine
and aspartate, provide carbon and nitrogen for purine synthesis in
cancer cells (54); glutamine
metabolism can drive the TCA cycle to maintain mitochondrial ATP
production, supplying energy to cancer cells (55); and tryptophan metabolism through the
kynurenine pathway mediates tumor immune evasion (56). Lipids primarily support cancer cell
energy supply and participate in cancer cell signal transduction
and membrane structure formation through metabolic processes, such
as re-regulated uptake and synthesis, as well as fatty acid
oxidation (52,57), thereby promoting tumorigenesis. For
instance, fatty acid oxidation can generate a notable amount of
ATP, providing energy for the rapid proliferation of cancer cells
(58,59). Increased fatty acid synthesis can
meet the material requirements for cancer cell membrane generation,
sustaining cancer cell proliferation (59,60).
Oleic acid can promote cancer cell proliferation by inducing the
activation of relevant enzymes and pathways, as well as promote the
expression level of cyclin D1, facilitating the G1-to-S
phase transition in the cell cycle and accelerating cell
proliferation (61). The results of
the present study support and supplement previous research: A
previous study on lung cancer has identified that the principal
changes in metabolic pathways among healthy individuals, pulmonary
nodules and lung cancer involve the amino acid metabolism (62). However, the present study identified
that, in addition to changes in amino acid metabolism, lipid
metabolism also underwent alterations.
Furthermore, the results of the metabolic pathway
enrichment analysis emphasized the significant role of arginine and
proline metabolism in the development of lung cancer. A previous
study reported that arginine and proline metabolism are closely
associated with glutamine metabolism, which can be utilized by
cancer cells to accelerate tumor growth (63), serving as a hallmark of tumor
progression. Glutamine is metabolically converted into glutamate.
Glutamate can be converted to proline under the action of
pyrroline-5-carboxylic acid (P5C) synthase. Proline can be
converted to arginine through the intermediate P5C and arginine,
under the hydrolysis of arginase, generates urea and ornithine
(63,64). On one hand, ornithine can be
transformed into citrulline by ornithine transcarbamylase and
citrulline can be converted back into arginine through the urea
cycle; on the other hand, it can serve as a precursor for the
synthesis of proline or glutamate (63,65,66).
This metabolic process forms the glutamine-arginine-proline
metabolic axis, which has been shown to serve a notable role in
cancer progression.
The present study, as an exploratory investigation,
had two main limitations: Firstly, the sample size was relatively
small, which may not fully capture the metabolic heterogeneity of
the study population, leading to the potential missed detection of
certain differential metabolites. Secondly, although ROC analysis
indicated that the metabolic biomarkers in the present study have
good diagnostic efficacy, the current results have not yet been
validated in independent cohorts and their clinical applicability
requires further investigation. In the future, our group plans to
conduct multi-center, large-sample studies to systematically
validate the clinical applicability and generalizability of the
present findings.
In conclusion, the present study employed LC-MS to
analyze and compare the plasma metabolic profiles of patients with
lung cancer, pulmonary nodules and healthy individuals. Strict
filtration criteria were applied to select differential metabolites
and potential biomarkers. A total of 50 differential metabolites
were identified, which were enriched in pathways associated with
amino acid and lipid metabolism, including ‘linoleic acid
metabolism’, ‘α-linolenic acid metabolism’, ‘arginine and proline
metabolism’ and others. The ROC curve analysis identified six
potential biomarkers with good sensitivity and specificity to
distinguish lung cancer, pulmonary nodules and healthy individuals,
including urocanic acid, pyroglutamic acid, pantothenic acid,
3-methoxytyrosine, 2-hydroxyhexadecanoylcarnitine and dodecanedioic
acid. Furthermore, the findings from the present study on metabolic
changes in lung cancer may provide novel insights into
understanding the pathophysiological mechanisms of the disease. In
the future, a systematic and in-depth investigation of lung cancer
by integrating proteomics, genomics and other approaches may be
conducted to facilitate the practical application of potential
biomarkers.
Supplementary Material
Supporting Data
Acknowledgements
Not applicable.
Funding
The Clinical Scientific Research Fund for Central High-Level
Traditional Chinese Medicine Hospitals [grant no. DZMG-TZZX-24005
and the present study was supported by the Special Fund for
Fundamental Research of Central Universities (grant no.
2022-JYB-JBZR-029)].
Availability of data and materials
The data generated in the present study may be found
in the Metabolights database under accession no. MTBLS12985 or
using the following URL: http://ftp.ebi.ac.uk/pub/databases/metabolights/studies/public/MTBLS12985/).
Authors' contributions
YLiu acquired the data, conceived and designed the
present study and revised the final version of the manuscript.
YangL analyzed the data, conceived and designed the present study,
and wrote the manuscript. HH acquired the data. YD, HT, YZ and JZ
collected plasma from enrolled volunteers. KL read the chest CT of
enrolled volunteers and collected data. YLi and FS designed the
present study and confirm the authenticity of all the raw data. FS
acquired the data and conceived the study. All authors have read
and approved the final manuscript.
Ethics approval and consent to
participate
The present study was reviewed and approved by the
Ethical Committee of Dongzhimen Hospital of Beijing University of
Chinese Medicine (approval no. 2022DZMEC-312-02; Beijing, China).
All participants were fully informed of the study and gave their
written informed consent before participation in the present study.
The present study was conducted in accordance with the Declaration
of Helsinki.
Patient consent for publication
Not applicable.
Competing interests
The authors declare that they have no competing
interests.
Use of artificial intelligence tools
During the preparation of this work, artificial
intelligence tools (OpenAI and their language model, chatGPt 4.0)
were used to improve the readability and language of the manuscript
or to generate images, and subsequently, the authors revised and
edited the content produced by the artificial intelligence tools as
necessary, taking full responsibility for the ultimate content of
the present manuscript.
References
|
1
|
Sung H, Ferlay J, Siegel RL, Laversanne M,
Soerjomataram I, Jemal A and Bray F: Global Cancer Statistics 2020:
GLOBOCAN Estimates of Incidence and Mortality Worldwide for 36
Cancers in 185 countries. CA Cancer J Clin. 71:209–249.
2021.PubMed/NCBI
|
|
2
|
Thai AA, Solomon BJ, Sequist LV, Gainor JF
and Heist RS: Lung cancer. Lancet. 398:535–554. 2021. View Article : Google Scholar : PubMed/NCBI
|
|
3
|
Bi H, Yin L, Fang W, Song S, Wu S and Shen
J: Association of CEA, NSE, CYFRA 21-1, SCC-Ag, and ProGRP with
Clinicopathological characteristics and chemotherapeutic outcomes
of lung cancer. Lab Med. 54:372–379. 2023. View Article : Google Scholar : PubMed/NCBI
|
|
4
|
Wang Y, Guo Q, Huang Z, Song L, Zhao F, Gu
T, Feng Z, Wang H, Li B, Wang D, et al: Cell-free epigenomes
enhanced fragmentomics-based model for early detection of lung
cancer. Clin Transl Med. 15:e702252025. View Article : Google Scholar : PubMed/NCBI
|
|
5
|
Zhang C, Li J, Huang J and Wu S: Computed
tomography image under convolutional neural network deep learning
algorithm in pulmonary nodule detection and lung function
examination. J Healthc Eng. 2021:34172852021.PubMed/NCBI
|
|
6
|
Liang J, Ye G, Guo J, Huang Q and Zhang S:
Reducing False-positives in lung nodules detection using balanced
datasets. Front Public Health. 9:6710702021. View Article : Google Scholar : PubMed/NCBI
|
|
7
|
Wu Z, Wang F, Cao W, Qin C, Dong X, Yang
Z, Zheng Y, Luo Z, Zhao L, Yu Y, et al: Lung cancer risk prediction
models based on pulmonary nodules: A systematic review. Thorac
Cancer. 13:664–677. 2022. View Article : Google Scholar : PubMed/NCBI
|
|
8
|
Zheng J, Hao Y, Guo Y, Du M, Wang P and
Xin J: An 18F-FDG-PET/CT-based radiomics signature for estimating
malignance probability of solitary pulmonary nodule. Clin Respir J.
18:e137512024. View Article : Google Scholar : PubMed/NCBI
|
|
9
|
Zhu K, Tang S, Pan D, Wang X, Xu Y, Yan J,
Wang L, Chen C and Yang M: Development and biological evaluation of
a novel CEACAM6-targeted PET tracer for distinguishing malignant
nodules in early-stage lung adenocarcinoma. Eur J Nucl Med Mol
Imaging. 52:2414–2430. 2025. View Article : Google Scholar : PubMed/NCBI
|
|
10
|
Nooreldeen R and Bach H: Current and
future development in lung cancer diagnosis. Int J Mol Sci.
22:86612021. View Article : Google Scholar : PubMed/NCBI
|
|
11
|
Wang X, Chen Y, Ma C, Bi L, Su Z, Li W and
Wang Z: Current advances and future prospects of blood-based
techniques for identifying benign and malignant pulmonary nodules.
Crit Rev Oncol Hematol. 207:1046082025. View Article : Google Scholar : PubMed/NCBI
|
|
12
|
Wang CF, Peng SJ, Liu RQ, Yu YJ, Ge QM,
Liang RB, Li QY, Li B and Shao Y: The combination of CA125 and NSE
is useful for predicting liver metastasis of lung cancer. Dis
Markers. 2020:88508732020. View Article : Google Scholar : PubMed/NCBI
|
|
13
|
Anwardeen NR, Diboun I, Mokrab Y, Althani
AA and Elrayess MA: Statistical methods and resources for biomarker
discovery using metabolomics. BMC Bioinformatics. 24:2502023.
View Article : Google Scholar : PubMed/NCBI
|
|
14
|
Wang S, He T and Wang H: Non-targeted
metabolomics study for discovery of hepatocellular carcinoma serum
diagnostic biomarker. J Pharm Biomed Anal. 239:1158692024.
View Article : Google Scholar : PubMed/NCBI
|
|
15
|
Huang X, Chen L, Liu L, Chen H, Gong Z,
Lyu J, Li Y, Jiang Q, Zeng X, Zhang P and Zhou H: Untargeted
metabolomics analysis reveals the potential mechanism of
imatinib-induced skin rash in patients with gastrointestinal
stromal tumor. Int Immunopharmacol. 140:1127282024. View Article : Google Scholar : PubMed/NCBI
|
|
16
|
Johnson CH, Ivanisevic J and Siuzdak G:
Metabolomics: Beyond biomarkers and towards mechanisms. Nat Rev Mol
Cell Biol. 17:451–459. 2016. View Article : Google Scholar : PubMed/NCBI
|
|
17
|
Xu K, Berthiller F, Metzler-Zebeli BU and
Schwartz-Zimmermann HE: Development and validation of targeted
metabolomics methods using liquid Chromatography-tandem mass
spectrometry (LC-MS/MS) for the quantification of 235 plasma
metabolites. Molecules. 30:7062025. View Article : Google Scholar : PubMed/NCBI
|
|
18
|
Wang R, Hu Q, Wu Y, Guan N, Han X and Guan
X: Intratumoral lipid metabolic reprogramming as a pro-tumoral
regulator in the tumor milieu. Biochim Biophys Acta Rev Cancer.
1878:1889622023. View Article : Google Scholar : PubMed/NCBI
|
|
19
|
Rispoli MG, Valentinuzzi S, De Luca G, Del
Boccio P, Federici L, Di Ioia M, Digiovanni A, Grasso EA, Pozzilli
V, Villani A, et al: Contribution of metabolomics to multiple
sclerosis diagnosis, prognosis and treatment. Int J Mol Sci.
22:111122021. View Article : Google Scholar : PubMed/NCBI
|
|
20
|
Liang S, Cao X, Wang Y, Leng P, Wen X, Xie
G, Luo H and Yu R: Metabolomics analysis and diagnosis of lung
cancer: Insights from diverse sample types. Int J Med Sci.
21:234–252. 2024. View Article : Google Scholar : PubMed/NCBI
|
|
21
|
Tang Y, Li Z, Lazar L, Fang Z, Tang C and
Zhao J: Metabolomics workflow for lung cancer: Discovery of
biomarkers. Clin Chim Acta. 495:436–445. 2019. View Article : Google Scholar : PubMed/NCBI
|
|
22
|
Chelala L, Hossain R, Kazerooni EA,
Christensen JD, Dyer DS and White CS: Lung-RADS version 1.1:
Challenges and a look ahead, from the AJR special series on
radiology reporting and data systems. AJR Am J Roentgenol.
216:1411–1422. 2021. View Article : Google Scholar : PubMed/NCBI
|
|
23
|
Aunger J, Yip KP, Dosanjh K, Scandrett K,
Ungureanu B, Newnham M and Turner AM: Interventions to improve
adherence to clinical guidelines for the management and Follow-Up
of pulmonary nodules: A systematic review. Chest. 168:248–268.
2025. View Article : Google Scholar : PubMed/NCBI
|
|
24
|
Kramer BS, Berg CD, Aberle DR and Prorok
PC: Lung cancer screening with Low-dose helical CT: Results from
the national lung screening Trial (NLST). J Med Screen. 18:109–111.
2011. View Article : Google Scholar : PubMed/NCBI
|
|
25
|
O Reilly D, Roche S, Noonan C, O'Shea J,
Toomey S, Hennessy BT, Fitzmaurice GJ, Egan K, Dunne J, Dowling CM,
et al: Lung health check pilot: Ireland's flagship lung cancer
screening trial. BMJ Open Respir Res. 12:e0030352025. View Article : Google Scholar : PubMed/NCBI
|
|
26
|
Zhao Y and Wang Z, Liu X, Chen Q, Li C,
Zhao H and Wang Z: Pulmonary nodule detection based on multiscale
feature fusion. Comput Math Methods Med. 2022:89030372022.
View Article : Google Scholar : PubMed/NCBI
|
|
27
|
Zhu J, Tao J, Zhu M, Liu J, Ma C, Chen K,
Wang Y, Lu X, Saito Y and Ni B: Development and validation of CT
radiomics diagnostic models: Differentiating benign from malignant
pulmonary nodules and evaluating malignancy degree. J Thorac Dis.
17:1645–1672. 2025. View Article : Google Scholar : PubMed/NCBI
|
|
28
|
Xu L, Chang C, Jiang P, Wei K, Zhang R,
Jin Y, Zhao J, Xu L, Shi Y, Guo S, et al: Metabolomics in
rheumatoid arthritis: Advances and review. Front Immunol.
13:9617082022. View Article : Google Scholar : PubMed/NCBI
|
|
29
|
Pham DL, Lim KM, Joo KM, Park HS, Leung
DYM and Ye YM: Increased cis-to-trans urocanic acid ratio in the
skin of chronic spontaneous urticaria patients. Sci Rep.
7:13182017. View Article : Google Scholar : PubMed/NCBI
|
|
30
|
Wang L, Tan Y, Wang H, Yu XD, Mo Y, Reilly
J, He Z and Shu X: Urocanic acid facilitates acquisition of object
recognition memory in mice. Physiol Behav. 266:1142012023.
View Article : Google Scholar : PubMed/NCBI
|
|
31
|
Hart PH and Norval M: The multiple roles
of urocanic acid in health and disease. J Invest Dermatol.
141:496–502. 2021. View Article : Google Scholar : PubMed/NCBI
|
|
32
|
Mi M, Liu Z, Zheng X, Wen Q, Zhu F, Li J,
Mungur ID and Zhang L: Serum metabolomic profiling based on GC/MS
helped to discriminate diffuse large B-cell lymphoma patients with
different prognosis. Leuk Res. 111:1066932021. View Article : Google Scholar : PubMed/NCBI
|
|
33
|
Vidman L, Zheng R, Bodén S, Ribbenstedt A,
Gunter MJ, Palmqvist R, Harlid S, Brunius C and Van Guelpen B:
Untargeted plasma metabolomics and risk of colorectal cancer-an
analysis nested within a large-scale prospective cohort. Cancer
Metab. 11:172023. View Article : Google Scholar : PubMed/NCBI
|
|
34
|
Peterson CT, Rodionov DA, Osterman AL and
Peterson SN: B vitamins and their role in immune regulation and
cancer. Nutrients. 12:33802020. View Article : Google Scholar : PubMed/NCBI
|
|
35
|
Hrubša M, Siatka T, Nejmanová I,
Vopršalová M, Kujovská Krčmová L, Matoušová K, Javorská L, Macáková
K, Mercolini L, Remião F, et al: Biological properties of vitamins
of the B-Complex, part 1: Vitamins B1, B2, B3, and B5. Nutrients.
14:4842022. View Article : Google Scholar : PubMed/NCBI
|
|
36
|
Chen G, Bao B, Cheng Y, Tian M, Song J,
Zheng L and Tong Q: Acetyl-CoA metabolism as a therapeutic target
for cancer. Biomed Pharmacother. 168:1157412023. View Article : Google Scholar : PubMed/NCBI
|
|
37
|
Zhou Y, Li X, Long G, Tao Y, Zhou L and
Tang J: Identification and validation of a tyrosine
metabolism-related prognostic prediction model and characterization
of the tumor microenvironment infiltration in hepatocellular
carcinoma. Front Immunol. 13:9942592022. View Article : Google Scholar : PubMed/NCBI
|
|
38
|
Wang X, Chen Y, Lan B, Wang Y, Lin W,
Jiang X, Ye J, Shang B, Feng C, Liu J, et al: Heterogeneity of
tyrosine-based melanin anabolism regulates pulmonary and cerebral
organotropic colonization microenvironment of melanoma cells.
Theranostics. 12:2063–2079. 2022. View Article : Google Scholar : PubMed/NCBI
|
|
39
|
Wu T and Dai Y: Tumor microenvironment and
therapeutic response. Cancer Lett. 387:61–68. 2017. View Article : Google Scholar : PubMed/NCBI
|
|
40
|
Zou X, Huang H and Tan Y: Genetically
determined metabolites in allergic conjunctivitis: A Mendelian
randomization study. World Allergy Organ J. 17:1008942024.
View Article : Google Scholar : PubMed/NCBI
|
|
41
|
Yang L, Chu Z, Liu M, Zou Q, Li J, Liu Q,
Wang Y, Wang T, Xiang J and Wang B: Amino acid metabolism in immune
cells: Essential regulators of the effector functions, and
promising opportunities to enhance cancer immunotherapy. J Hematol
Oncol. 16:592023. View Article : Google Scholar : PubMed/NCBI
|
|
42
|
Zhang Z, Hu Y, Chen Y, Chen Z, Zhu Y, Chen
M, Xia J, Sun Y and Xu W: Immunometabolism in the tumor
microenvironment and its related research progress. Front Oncol.
12:10247892022. View Article : Google Scholar : PubMed/NCBI
|
|
43
|
Koundouros N and Poulogiannis G:
Reprogramming of fatty acid metabolism in cancer. Br J Cancer.
122:4–22. 2020. View Article : Google Scholar : PubMed/NCBI
|
|
44
|
Broadfield LA, Pane AA, Talebi A, Swinnen
JV and Fendt SM: Lipid metabolism in cancer: New perspectives and
emerging mechanisms. Dev Cell. 56:1363–1393. 2021. View Article : Google Scholar : PubMed/NCBI
|
|
45
|
Radzikh I, Fatica E, Kodger J, Shah R,
Pearce R and Sandlers YI: Metabolic outcomes of anaplerotic
dodecanedioic acid supplementation in very long Chain Acyl-CoA
dehydrogenase (VLCAD) deficient fibroblasts. Metabolites.
11:5382021. View Article : Google Scholar : PubMed/NCBI
|
|
46
|
He W, Li Q and Li X: Acetyl-CoA regulates
lipid metabolism and histone acetylation modification in cancer.
Biochim Biophys Acta Rev Cancer. 1878:1888372023. View Article : Google Scholar : PubMed/NCBI
|
|
47
|
Feron O: The many metabolic sources of
acetyl-CoA to support histone acetylation and influence cancer
progression. Ann Transl Med. 7 (Suppl 8):S2772019. View Article : Google Scholar : PubMed/NCBI
|
|
48
|
Noreldeen HAA: Recent advances in lung
cancer lipidomics: Analytical techniques and their applications.
Clin Chim Acta. 577:1204702025. View Article : Google Scholar : PubMed/NCBI
|
|
49
|
Rocha CM, Carrola J, Barros AS, Gil AM,
Goodfellow BJ, Carreira IM, Bernardo J, Gomes A, Sousa V, Carvalho
L, et al: Metabolic signatures of lung cancer in biofluids:
NMR-based metabonomics of blood plasma. J Proteome Res.
10:4314–4324. 2011. View Article : Google Scholar : PubMed/NCBI
|
|
50
|
Musharraf SG, Mazhar S, Choudhary MI, Rizi
N and Atta-ur-Rahman: Plasma metabolite profiling and chemometric
analyses of lung cancer along with three controls through gas
chromatography-mass spectrometry. Sci Rep. 5:86072015. View Article : Google Scholar : PubMed/NCBI
|
|
51
|
Li X and Zhang HS: Amino acid metabolism,
redox balance and epigenetic regulation in cancer. FEBS J.
291:412–429. 2024. View Article : Google Scholar : PubMed/NCBI
|
|
52
|
Jin HR, Wang J, Wang ZJ, Xi MJ, Xia BH,
Deng K and Yang JL: Lipid metabolic reprogramming in tumor
microenvironment: From mechanisms to therapeutics. J Hematol Oncol.
16:1032023. View Article : Google Scholar : PubMed/NCBI
|
|
53
|
Liu X, Ren B, Ren J, Gu M, You L and Zhao
Y: The significant role of amino acid metabolic reprogramming in
cancer. Cell Commun Signal. 22:3802024. View Article : Google Scholar : PubMed/NCBI
|
|
54
|
Xu X, Peng Q, Jiang X, Tan S, Yang Y, Yang
W, Han Y, Chen Y, Oyang L, Lin J, et al: Metabolic reprogramming
and epigenetic modifications in cancer: From the impacts and
mechanisms to the treatment potential. Exp Mol Med. 55:1357–1370.
2023. View Article : Google Scholar : PubMed/NCBI
|
|
55
|
Lieu EL, Nguyen T, Rhyne S and Kim J:
Amino acids in cancer. Exp Mol Med. 52:15–30. 2020. View Article : Google Scholar : PubMed/NCBI
|
|
56
|
Greene LI, Bruno TC, Christenson JL,
D'Alessandro A, Culp-Hill R, Torkko K, Borges VF, Slansky JE and
Richer JK: A Role for Tryptophan-2,3-dioxygenase in CD8 T-cell
suppression and evidence of tryptophan catabolism in breast cancer
patient plasma. Mol Cancer Res. 17:131–139. 2019. View Article : Google Scholar : PubMed/NCBI
|
|
57
|
Yang K, Wang X, Song C, He Z, Wang R, Xu
Y, Jiang G, Wan Y, Mei J and Mao W: The role of lipid metabolic
reprogramming in tumor microenvironment. Theranostics.
13:1774–1808. 2023. View Article : Google Scholar : PubMed/NCBI
|
|
58
|
Snaebjornsson MT, Janaki-Raman S and
Schulze A: Greasing the wheels of the cancer machine: The role of
lipid metabolism in cancer. Cell Metab. 31:62–76. 2020. View Article : Google Scholar : PubMed/NCBI
|
|
59
|
An Q, Lin R, Wang D and Wang C: Emerging
roles of fatty acid metabolism in cancer and their targeted drug
development. Eur J Med Chem. 240:1146132022. View Article : Google Scholar : PubMed/NCBI
|
|
60
|
Acharya R, Shetty SS and Kumari NS: Fatty
acid transport proteins (FATPs) in cancer. Chem Phys Lipids.
250:1052692023. View Article : Google Scholar : PubMed/NCBI
|
|
61
|
Zhang Y, Wang D, Lv B, Hou X, Liu Q, Liao
C, Xu R, Zhang Y, Xu F and Zhang P: Oleic acid and insulin as key
characteristics of T2D promote colorectal cancer deterioration in
xenograft mice revealed by functional metabolomics. Front Oncol.
11:6850592021. View Article : Google Scholar : PubMed/NCBI
|
|
62
|
Yu M, Wen W, Wang Y, Shan X, Yi X, Zhu W,
Aa J and Wang G: Plasma metabolomics reveals risk factors for lung
adenocarcinoma. Front Oncol. 14:12772062024. View Article : Google Scholar : PubMed/NCBI
|
|
63
|
Wang D, Duan JJ, Guo YF, Chen JJ, Chen TQ,
Wang J and Yu SC: Targeting the glutamine-arginine-proline
metabolism axis in cancer. J Enzyme Inhib Med Chem. 39:23671292024.
View Article : Google Scholar : PubMed/NCBI
|
|
64
|
Matos A, Carvalho M, Bicho M and Ribeiro
R: Arginine and arginases modulate metabolism, tumor
microenvironment and prostate cancer progression. Nutrients.
13:45032021. View Article : Google Scholar : PubMed/NCBI
|
|
65
|
Du T and Han J: Arginine metabolism and
its potential in treatment of colorectal cancer. Front Cell Dev
Biol. 9:6588612021. View Article : Google Scholar : PubMed/NCBI
|
|
66
|
Niu F, Yu Y, Li Z, Ren Y, Li Z, Ye Q, Liu
P, Ji C, Qian L and Xiong Y: Arginase: An emerging and promising
therapeutic target for cancer treatment. Biomed Pharmacother.
149:1128402022. View Article : Google Scholar : PubMed/NCBI
|