Introduction
Neuroblastoma (NB) is the most common extracranial
solid tumor in children and accounts for 3–10% of cases of
childhood cancer mortality (1–3). The
prognosis markedly varies, with overall survival ranging from
>95% for low-risk patients to <40% for high-risk patients
(4). The treatment plan for NB is
mainly based on the degree of risk expected at the time of
diagnosis, with risk assessment including various factors, such as
age, International Neuroblastoma Staging System (INSS)
stage/International Neuroblastoma Risk Group stage (5,6), MYCN
amplification status, International Neuroblastoma Pathology
Classification (7), histological
category, grade of tumor differentiation, DNA ploidy and 11q
deletion (8). Among them, MYCN
amplification status (9) and
metastasis (10) are the key
reasons for treatment failure.
MYCN is a highly conserved human oncogene and
numerous studies have confirmed that MYCN gene status is associated
with various types of cancer, particularly NB (11,12),
and is key for the prediction of patient prognosis and guiding
treatment. Compared with in patients with NB without MYCN
amplification (MYCN−), those with MYCN amplification
(MYCN+) have been reported to have an increased
probability of metastasis (13).
Long non-coding RNAs (lncRNAs) serve key roles in
the proliferation, differentiation and migration of malignant tumor
cells by competitively binding to microRNAs (miRNAs/miRs) as
competitive endogenous RNAs and then regulating the expression of
target genes, and the differentiation and migration of malignant
tumor cells (14). Previous studies
have reported an association between MYCN and lncRNAs. For example,
the lncRNA AC142119.1 has been reported to be markedly upregulated
in MYCN+, advanced INSS and high-risk NB tissues, and is
associated with poor survival in patients with NB. Furthermore,
increased expression levels of AC142119.1 can enhance NB cell
proliferation in vitro and in vivo (15). High expression levels of the lncRNA
small nucleolar RNA host gene 1 (SNHG1) are associated with a poor
prognosis and MYCN status in NB. Downregulation of SNHG1 levels in
the MYCN+ NB cell line SK-N-BE2 have been shown to
result in the inhibition of cell proliferation and colony-forming
ability (16). In addition,
elevated levels of nuclear paraspeckle assembly transcript 1
(NEAT1) expression in NB cells and tissues are associated with
advanced pathological stages and poor prognosis, whereas NEAT1
silencing inhibits NB proliferation in vivo.
Mechanistically, NEAT1 acts as a competitive sponge for miR-873-5p
and regulates MYCN and polypeptide
N-acetylgalactosaminyltransferase I level (17). These studies suggest that lncRNAs
serve key roles in the progression of MYCN+ NB.
In the present study, bioinformatics analyses were
performed on different NB samples to identify the differentially
expressed lncRNAs (DElncRNAs) that were associated with MYCN and
their functions were analyzed. CIBERSORT was used to identify
MYCN-regulated regulatory T cells (Tregs) and T follicular helper
cells (Tfhs). To identify the DElncRNAs associated with Tregs and
Tfhs, Spearman's rank correlation coefficient was further computed
using the DElncRNA expression levels, and the proportions of Tregs
and Tfhs. On this basis, the lncRNA RP11-196G11.6 was selected. The
effects of miR-376a-3p and its downstream target genes mediated by
RP11-196G11.6 on the viability, migration and invasion of NB cells
were further verified. The aim of the present study was to
elucidate the specific mechanisms by which RP11-196G11.6 acts as a
tumor suppressor in NB, and to establish a potential novel target
for the diagnosis and treatment of NB.
Materials and methods
Clinical specimens and public
data
Public transcriptome-sequence data files from
patients with NB, comprising tumor samples (n=16) and disseminated
tumor cells (DTC) (n=42) [Gene Expression Omnibus (GEO); accession
no. GSE94035; https://www.ncbi.nlm.nih.gov/geo/query/acc.cgi?acc=GSE94035]
-were downloaded from the Sequence Read Archive (SRA; http://www.ncbi.nlm.nih.gov/sra?term=SRP097735). The
National Center for Biotechnology Information SRA Tool FASTQ-dump
(https://github.com/ncbi/sra-tools/wiki/02.-Installing-SRA-Toolkit)
was used to convert the SRA Run files to FASTQ format.
FASTX-Toolkit (version 0.0.13; http://hannonlab.cshl.edu/fastx_toolkit/) was used to
trim the raw reads of low-quality bases. The clean reads were
subsequently evaluated using FastQC (Version 0.12.0) (http://www.bioinformatics.babraham.ac.uk/projects/fastqc/).
Reads alignment and differentially
expressed gene (DEG) analysis
The clean reads were aligned with the human GRch38
genome via ‘tophat2’ (Version 2.1.1), allowing four mismatches
(18). Several core bioinformatics
analyses, including DEG analysis, immune cell-type quantification
and principal component analysis (PCA), were implemented using the
R programming environment (Version 4.3.2; http://cran.r-project.org/). The unique mapped reads
were ultimately used to calculate the read number and the reads/kb
of exon per million fragments mapped (RPKM) for each gene. The RPKM
values were used to assess gene expression levels. ‘edgeR’ (Version
4.6.3) (19), a software tool
specifically designed to analyze the differential expression of
genes, was applied to screen the RNA-sequencing data for DEGs
(including lncRNA and mRNA). The results were analyzed according to
the following criteria: Fold change ≥2 or ≤0.5, and false discovery
rate (FDR) ≤0.05, to determine whether genes were differentially
expressed.
lncRNA prediction and direction
identification
A pipeline for lncRNA identification similar to that
described in a previous study was used to systematically understand
the lncRNA expression of NB tumor samples and DTC samples (20), which was constructed via Cufflinks
software (Version 2.2.1) (21). All
the steps of the pipeline are shown in Fig. 1A. Based on the NB GSE94035 dataset,
samples from the DTC group (MYCNamplified n=13,
MYCNnon-amplified n=23) and the tumor group
(MYCNamplified n=10, MYCNnon-amplified n=6)
were included. The edgeR software (Version 4.6.3) was used to
analyze the differential expression of mRNAs and lncRNAs between
DTCs and tumors. Then, using the immunedeconv package (Version
2.0.3) (22), a lncRNA
immunoregulatory network was constructed. Furthermore, the
infiltration levels of 22 immune cell subtypes were quantified
using CIBERSORT (Version 2020; http://cibersortx.stanford.edu/) and intergroup
differences were compared. Through integrated analysis, key lncRNAs
were identified among the DElncRNAs that not only participate in
immunoregulatory networks but also demonstrate significant
associations with specific immune cell infiltration levels.
Potential miRNAs interacting with the target lncRNA were predicted
using miRanda (https://cloud.oebiotech.cn/task/detail/array_miranda_plot/),
while the potential target genes binding to these miRNAs were
identified via miRDB (https://mirdb.org/).
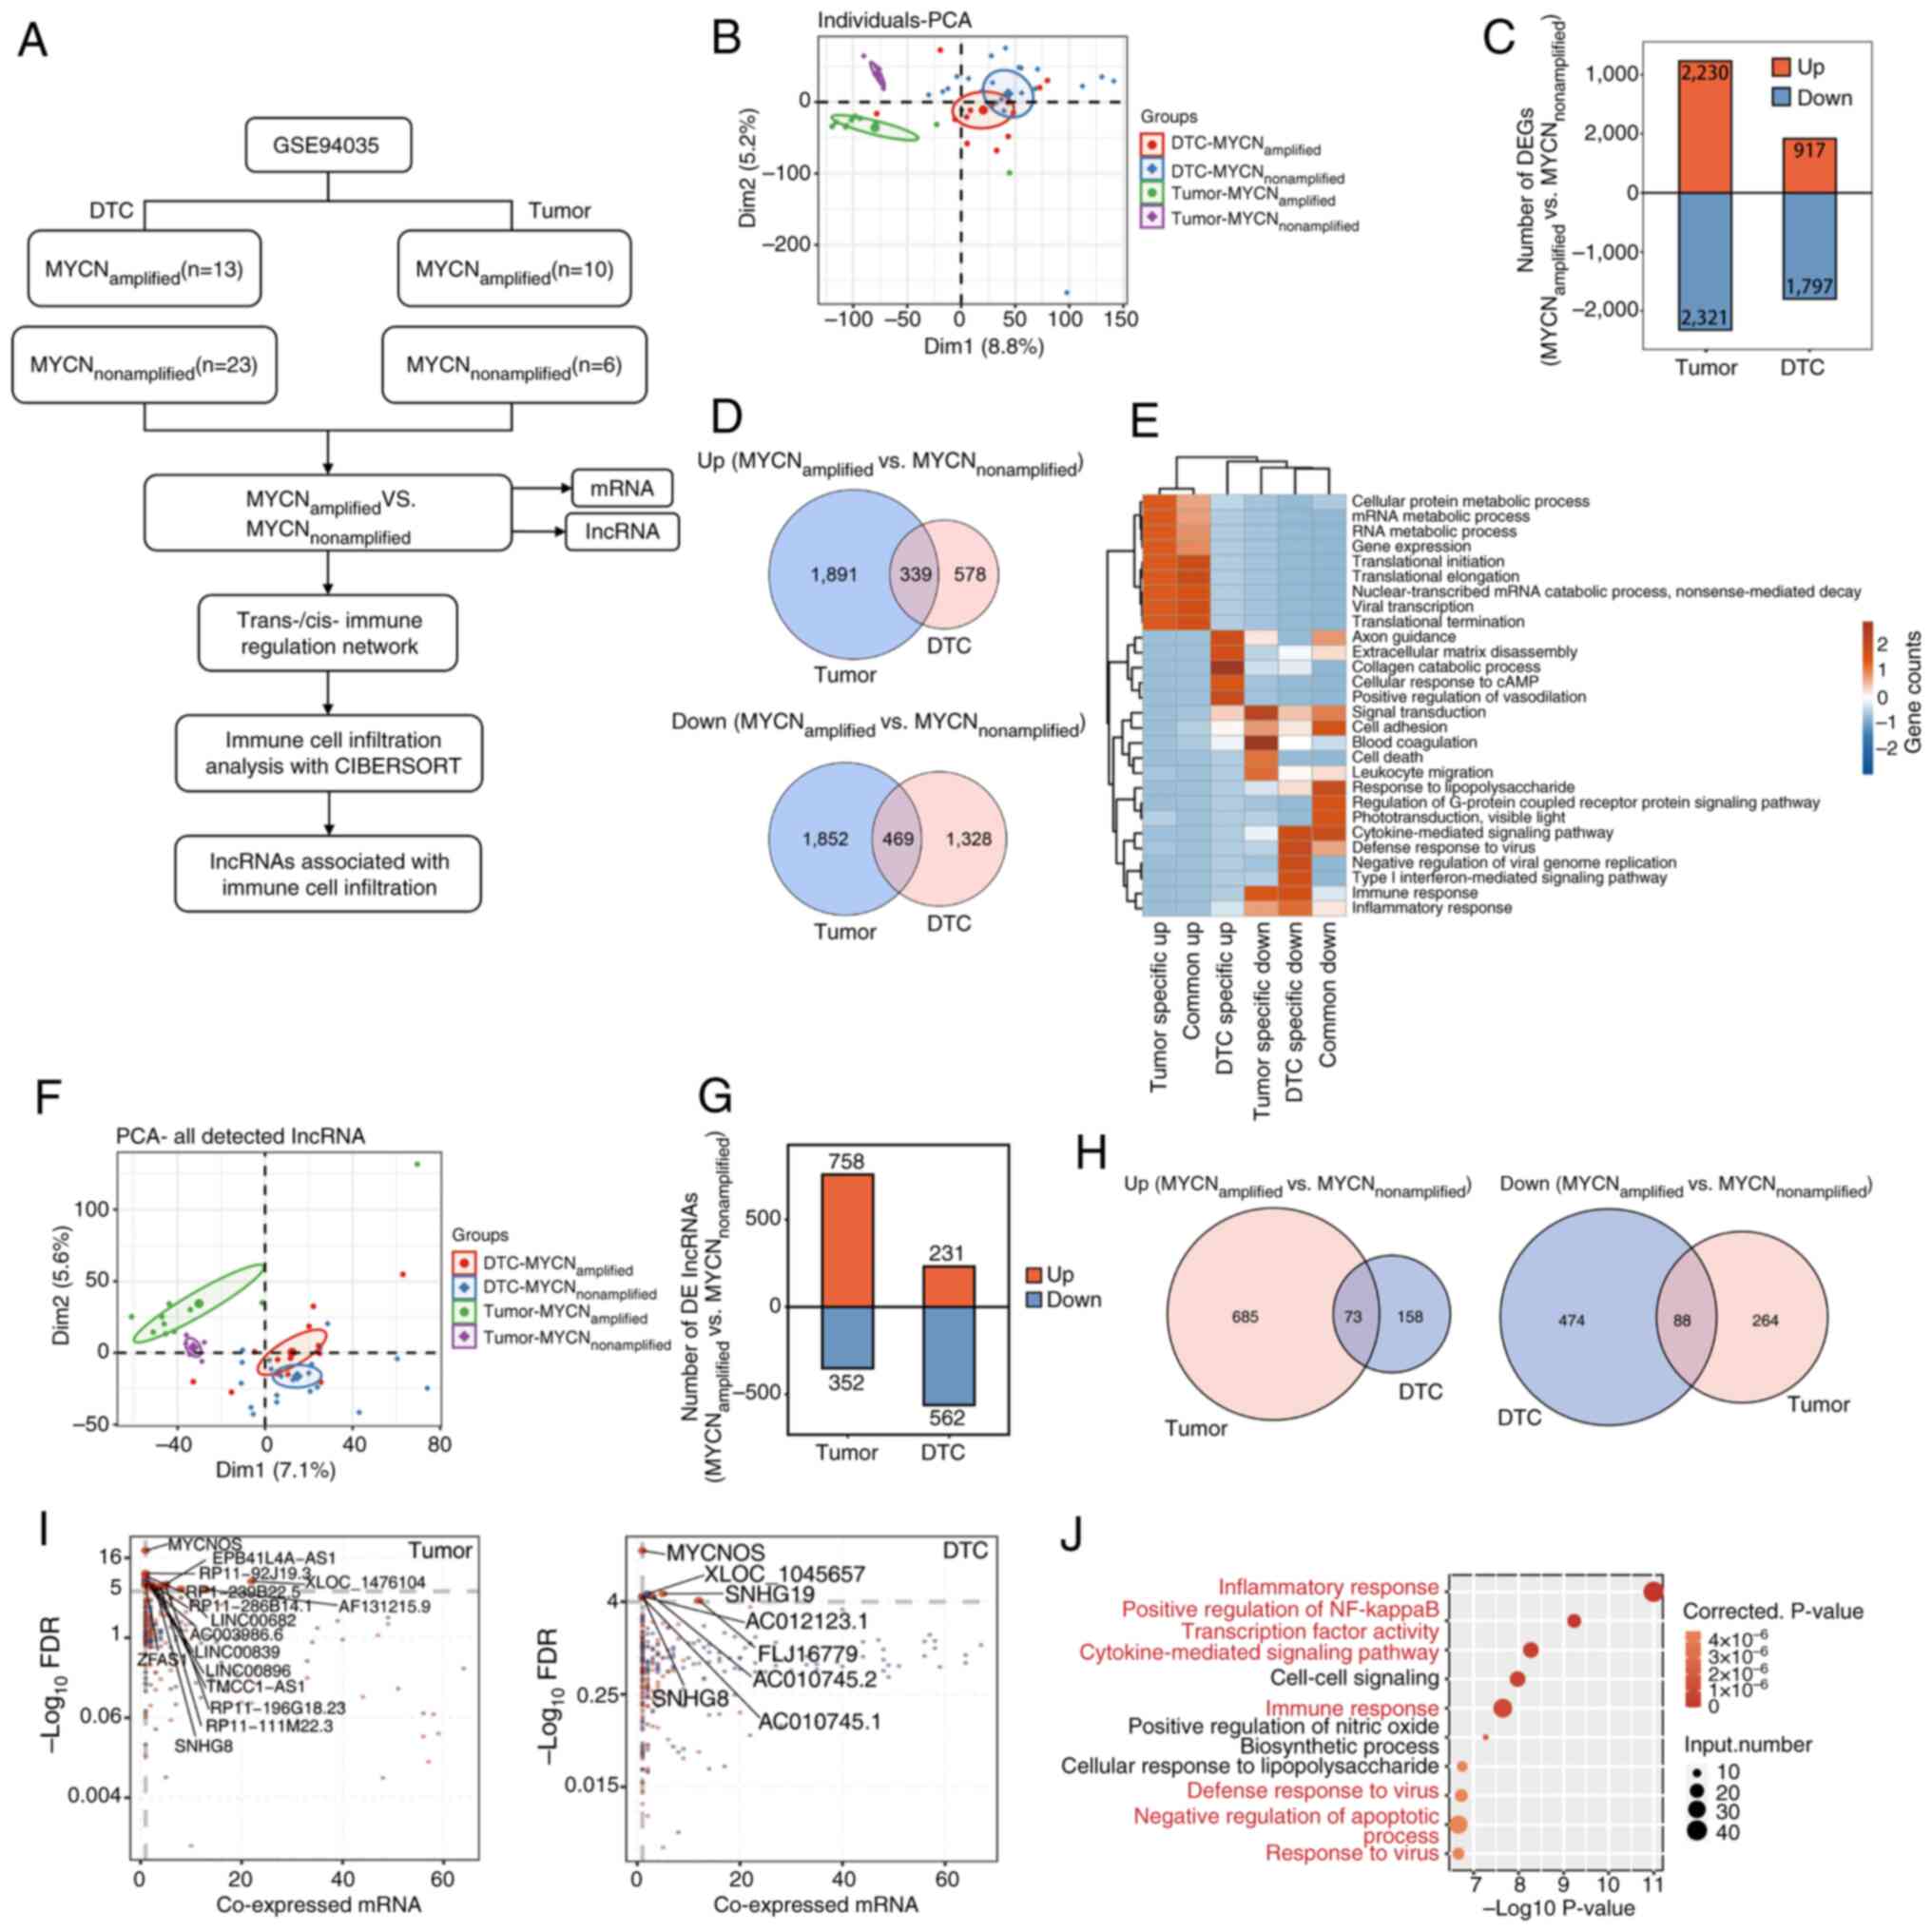 | Figure 1.Analysis of DElncRNAs in tumor and
bone marrow metastatic tissues. (A) Schematic diagram of the
bioinformatics analysis process. (B) PCA between tumor and DTC
samples, and between MYCN amplification statuses. (C) Analysis of
DEGs between MYCN+ and MYCN− samples in tumor
and DTC samples. (D) Venn diagrams depicting commonly upregulated
and downregulated DEGs in the four groups of samples. (E) GO
enrichment analysis showing the GO terms that were most
significantly enriched in 808 DEGs. The color scale represents the
enrichment intensity of gene sets across different groups, based on
the number of genes enriched in each pathway and normalized to a
range of −2 to 2. (F) PCA of the lncRNAs among the DEGs. (G)
DElncRNA analysis between MYCN+ and MYCN−
samples in tumor and DTC samples. (H) Venn diagrams indicating
commonly upregulated and downregulated DElncRNAs in the four groups
of samples. (I) Weighted gene co-expression network analysis and
co-expression analysis. Scatter plots of DElncRNAs and their
co-expressed DEmRNAs in MYCN+ vs. MYCN−
samples across tumor and DTC cohorts. Red points denote upregulated
lncRNAs involved in co-expression pairs and blue points denote
downregulated lncRNAs. The straight lines represent correlations
between the two variables. Cutoffs of P≤0.01 and Pearson
coefficient >0.8 were applied to identify the co-expression
pairs. (J) Top 10 most enriched GO terms (biological processes) in
DEmRNAs co-expressed with the DElncRNAs; the highlighted terms in
red are associated with immune and inflammatory responses. lncRNA,
long non-coding RNA; PCA, principal component analysis; DTC,
disseminated tumor cell; DEG, differentially expressed gene; GO,
Gene Ontology; DElncRNA, differentially expressed lncRNA; DEmRNA,
differentially expressed mRNA; FDR, false discovery rate. |
Weighted gene co-expression network
analysis (WGCNA) and co-expression analysis
To fully understand gene expression patterns, WGCNA
(23) was used to cluster genes
with similar expression patterns and the default parameters were
used. All expressed genes were used as input data. The eigengenes
of each clustering module were regarded as the representative
expression pattern of the gene in each module. To explore the
regulatory mode between lncRNAs and their host mRNAs, Pearson's
rank correlation coefficients were computed, which were used to
divide their relationships into the following three categories: i)
Positively correlated; ii) negatively correlated; and iii)
non-correlated. Cutoffs of P≤0.01 and Pearson coefficient >0.8
were applied to identify the co-expression pairs.
Functional enrichment analysis
To determine the functional categories of the DEGs,
the KOBAS 2.0 server was used to identify the enriched Gene
Ontology (GO) terms (24). The
enrichment of each term was defined via a hypergeometric test and
the Benjamini-Hochberg FDR controlling procedure.
Cell-type quantification
The R (Version 4.3.2; http://cran.r-project.org/) package ‘immunedeconv
(Version 2.0.3)’ provides a unified interface for seven
deconvolution methods to estimate immune cell fractions, with the
EPIC and CIBERSORT methods applied in the present study.
MYCN-associated lncRNA-immune cell
infiltration network
The Spearman correlation coefficient was used to
assess the correlation between the expression levels of DElncRNAs
and the ratio of Tregs to Tfhs. lncRNA-cell pairs with Spearman
correlation coefficients of >0.6 (or <-0.6) and a
corresponding P-value (Benjamini-Hochberg corrected) of <0.01
were considered significantly correlated. A lncRNA-immune cell
infiltration network was constructed with Cytoscape (Version
3.10.4; http://cytoscape.org/).
PCA and Venn diagram
PCA was performed using the R package ‘factoextra’
(Version 1.0.7; http://cloud.r-project.org/package=factoextra) to
display the clusters of samples with the first two components.
After the reads of each gene in the samples were standardized by
tags/million, the internal script was used for the visualization of
next-generation sequencing data and genome annotations. The Venn
diagram was generated using Venny (Version 2.1; http://bioinfogp.cnb.csic.es/tools/venny/;) with gene
lists from MYCN+ and MYCN− tumor and DTC
samples inputted for comparative analysis.
Fluorescence in situ hybridization
(FISH)
Between March and May 2025, MYCN+ and
MYCN− tumor samples (n=5/group) were collected
retrospectively from the Department of Pathology, Guizhou
Provincial People's Hospital (Guiyang, China). The cohort comprised
10 children (7 male and 3 female patients) aged between 5 months
and 12 years old, with an mean age of 4.58 years. The inclusion
criteria were as follows: i) Pathological confirmation of NB
following surgery; ii) availability of adequate resected tissue
specimens; iii) genetic testing to determine MYCN amplification
status. Patients failing to meet any of these criteria were
excluded. Following resection, all tumor tissues were fixed in 4%
paraformaldehyde at room temperature for 24 h, followed by paraffin
embedding. Then, tissue sections (6 µm) were mounted on positively
charged slides and stored at 4°C until use. The expression levels
of RP11-196G11.6 and U6 in tumor samples were detected using a
customized RP11-196G11.6 FISH detection kit [cat. no. Mk1257-H
(CY3); Wuhan Boster Biological Technology, Ltd.]; all reagents
including antibodies used prior to DAPI staining were sourced from
this kit. Briefly, after deparaffinization and rehydration of the
slides, target nucleic acids were exposed by digestion with pepsin
(3% citric acid-diluted) for 20 min at 37°C. This was followed by
washes with PBS and distilled water. Post-fixation was carried out
using 1% paraformaldehyde containing 0.1% diethyl pyrocarbonate for
10 min at room temperature. Pre-hybridization was performed at 42°C
for 4 h in a humidified chamber containing 20% glycerol. A 20-µl
hybridization solution containing the RP11-196G11.6 oligonucleotide
probe (primary antibody) was added to the sample under a coverslip
and incubated at 42°C overnight. Post-hybridization washes included
2X SSC (5 min twice), 0.5X SSC (15 min) and 0.2X SSC (15 min) at
37°C. Subsequently, the sections were blocked and incubated with
biotinylated mouse anti-digoxigenin (secondary antibody) at 37°C
for 1 h, washed with PBS and treated with SABC-Cy3 at 37°C for 1 h.
After the final PBS washes, the nuclei were counterstained with
DAPI (cat. no. KGA215-50;Nanjing KGI Biological Technology
Development Co., Ltd.). The images were captured via fluorescence
microscopy (DAPI and CY3 channels; CKX53; Olympus Corporation), and
image analysis was performed using ImageJ (version 1.53q; National
Institutes of Health). Background correction was performed using
five cell-free regions. Nuclei were identified via Otsu's
thresholding and watershed segmentation (excluding
abnormal/incomplete nuclei). CY3 integrated density (IntDen) was
measured within nuclear regions of interest and normalized to
nuclear area, which was defined by nuclear segmentation performed
on DAPI channel images, using the following formula: Normalized
intensity=(CY3 IntDen-Background)/Nuclear Area. Measurements were
verified across three non-overlapping fields. Normalized intensity
values were compared between MYCN+ and MYCN−
groups.
Cell culture and transfection
SH-SY5Y (cat. no. iCell-h187; iCell Bioscience,
Inc.), IMR-32 (cat. no. CL-0124; Procell Life Science &
Technology Co., Ltd.) and 293T (cat. no. CL-0005; Procell Life
Science & Technology Co., Ltd.) cells were confirmed by short
tandem repeat profiling. IMR-32 and SH-SY5Y cells were cultured in
MEM (cat. no. 11090081; Gibco; Thermo Fisher Scientific, Inc.), and
293T cells were cultured in DMEM (cat. no. 11965092; Gibco; Thermo
Fisher Scientific, Inc.) supplemented with 10% FBS (cat. no.
10100147C; Gibco: Thermo Fisher Scientific, Inc.) and 1%
penicillin-streptomycin (cat. no. 15140122;Gibco; Thermo Fisher
Scientific, Inc.). The cells were cultured in a cell incubator at
37°C and 5% CO2.
IMR-32 and SH-SY5Y cells were transfected at 70%
confluence using Lipofectamine® 3000 Transfection Kit
(cat. no. L3000150; Invitrogen; Thermo Fisher Scientific, Inc.)
according to the manufacturer's protocol. Briefly, for each well of
a 6-well plate, 2.5 µg RP11-196G11.6 overexpression vector
[oe-RP11; pcDNA3.1(+) vector utilized as the plasmid backbone], 3.3
µg RP11-196G11.6 small interfering (si)RNA [si-RP11 (125 µl/1OD)]
or 0.4 µg mimics (20 µmol/l) were diluted in 125 µl Opti-MEM with 5
µl P3000 reagent, whereas 5 µl Lipofectamine 3000 was diluted in
125 µl Opti-MEM. After 5 min incubation at 37°C, the two solutions
were combined, incubated for 15 min at 37°C and added to cells in
serum-free medium. Following 6 h transfection, the medium was
supplemented with complete medium containing 20% FBS, and cells
were analyzed after 48 h of incubation at 37°C. The si-RP11,
oe-RP11, miR-376a-3p mimic and corresponding controls were all
provided by Jiangxi Zhonghong Boyuan Biotechnology Co., Ltd.
Transfection was performed according to the instructions of the
Lipofectamine 3000 Transfection Kit. Briefly, si-RP11 and
si-negative control (NC) were transfected into IMR-32 cells; and
oe-RP11 and oe-NC were transfected into SH-SY5Y cells. To assess
whether RP11-196G11.6 mediates its effect on NB cells by regulating
the expression of miR-376a-3p, SH-SY5Y cells were co-transfected
with oe-RP11 or oe-NC, and the miR-376a-3p mimic or mimic NC. The
sense and antisense sequences of the si-RP11 and si-NC, together
with the sequences of the hsa-miR-376a-3p mimic and mimic NC, are
detailed in Table I.
 | Table I.RP11-196G11.6-siRNA and
hsa-miR-376a-3p mimic sequences. |
Table I.
RP11-196G11.6-siRNA and
hsa-miR-376a-3p mimic sequences.
| Name | Sequence
(5′-3′) |
|---|
|
RP11-196G11.6-siRNA | S:
GUCACUAGACAUCCUGAAA |
|
| AS:
UUUCAGGAUGUCUAGUGAC |
| Negative
control-siRNA | S:
UUCUCCGAACGUGUCACGU |
|
| AS:
ACGUGACACGUUCGGAGAA |
| hsa-miR-376a-3p
mimic | S:
AUCAUAGAGGAAAAUCCACGU |
|
| AS:
ACGUGGAUUUUCCUCUAUGAU |
| Negative control
mimic | S:
UCACAACCUCCUAGAAAGAGUAGA |
|
| AS:
UCUACUCUUUCUAGGAGGUUGUGA |
Reverse transcription-quantitative PCR
(RT-qPCR)
Cellular total RNA was extracted using the miRNA
Extraction Kit (cat. no. CWY113S; CWBio) for miRNA, and the
Ultrapure RNA Kit (cat. no. CW0581M; CWBio) for lncRNA and mRNA.
Subsequently, cDNA was synthesized from the respective RNA
fractions using the miRNA Extraction Kit (cat. no. CWY113S; CWBio)
or the HiScript II Q RT SuperMix for qPCR (+gDNA wiper) (cat. no.
R223-01; Vazyme Biotech Co., Ltd.), in accordance with the
manufacturers' protocols. Subsequently, fluorescence qPCR was
performed using a fluorescence PCR instrument with SuperStar
Universal SYBR Master Mix (cat. no. CW3360M; CWBio), as follows:
Pre-denaturation at 95°C for 10 min; followed by 40 cycles of
denaturation at 95°C for 10 sec, annealing at 58°C for 30 sec and
extension at 72°C for 30 sec. β-actin and U6 were employed as
endogenous controls for lncRNA/mRNA and miRNA normalization,
respectively, and the relative expression levels of each gene were
calculated with the 2−ΔΔCq method (25). The specific primer sequences were as
follows: Forward (F), 5′-TGGCACCCAGCACAATGAA-3′ and reverse (R),
5′-CTAAGTCATAGTCCGCCTAGAAGCA-3′ for β-actin NM_001101.5); F,
5′-CCAAGAAGGGCACAGGGAA-3′ and R, 5′-GGAGTGAATGGGTGGGAGTTT-3′ for
RP11-196G11.6 (ENST00000622229.1); F, 5′-CACCTCCATTGTCTTCCC-3′ and
R, 5′-CCACTACTGCCCATTTCC-3′ for U47924.29 (ENST00000606539.1); F,
5′-GACTTGTCTTTCGGGTTC-3′ and R, 5′-CCTGGCAGCAATACTTTA-3′ for
AC000068.10 (ENST00000608816.1); F, 5′-GATCAGCAGTTCGAGACCAGC-3′ and
R, 5′-CACCTCACGTCACCTTCCATAA-3′ for RP3-508I15.9
(ENST00000423346.1); F, 5′-GCGTACTGCAGACGTGGCA-3′ and R,
5′-AGTGCAGGGTCCGAGGTATT-3′ for hsa-miR-509-3-5p (MIMAT0004975); F,
5′-GCGCGATCATAGAGGAAAATC-3′ and R, 5′-AGTGCAGGGTCCGAGGTATT-3′ for
hsa-miR-376b-3p (MIMAT0002172) F, 5′-CGCGCGATCATAGAGGAAAAT-3′ and
R, 5′-AGTGCAGGGTCCGAGGTATT-3′ for hsa-miR-376a-3p (MIMAT0000729);
F, 5′-CTCGCTTCGGCAGCACA-3′ and R, 5′-AACGCTTCACGAATTTGCGT-3′ for U6
(cat. no. NR_004394.1).
Cell Counting Kit-8 (CCK-8) assay
The transfected cells were plated uniformly in
96-well plates at a density of 3,000 cells/well and cultured
overnight. At the specified time, the culture medium was discarded
and the medium was replaced with serum-free medium containing CCK-8
reagent (cat. no. C0041; Beyotime Institute of Biotechnology).
After incubation for 2 h at 37°C, the absorbance values of each
well were determined at a wavelength of 450 nm using a microplate
reader (cat. no. WD-2012B; Beijing Liuyi Biotechnology, Co.,
Ltd.).
Apoptosis detected using flow
cytometry
Apoptosis was measured by flow cytometry using the
Annexin V-FITC/PI Apoptosis Kit [cat. no. AP101-100-kit;
Multisciences (Lianke) Biotech Co., Ltd.]. After digestion of
SH-SY5Y or IMR-32 cells from a 6-well plate, a single-cell
suspension with a concentration of 1×10⁶/well was
prepared. After centrifugation at 450 × g for 3 min at 37°C, the
samples were washed twice with PBS. The cells were then resuspended
in 300 µl precooled 1XBinding Buffer, 5 µl Annexin V-FITC and 10 µl
PI were added to each well and mixed gently, and the cells were
incubated for 10 min at room temperature in the dark. The changes
in apoptosis were observed using a flow cytometer (NovoCyte 2060R;
ACEA Biosciences; Agilent Technologies, Inc.). Data analysis was
performed using FlowJo (version v10.9.0; BD Biosciences). Apoptotic
cells were defined as the cell population positive for Annexin
V-FITC and negative for PI (early apoptosis), or positive for both
Annexin V-FITC and PI (late apoptosis).
Cell scratch assay for cell
migration
The cells (3×10⁵/well) were cultured in
6-well plates until they reached 80–90% confluence with normal
morphology and stable growth kinetics. Subsequently, the cells were
inoculated into 24-well plates and cultured overnight to ensure
cell attachment. Scratches were then made perpendicular to the
bottom of the well using a 200-µl pipette tip. The cells were then
cultured in serum-free medium for 24 h and images were captured
under a light microscope (BX43; Olympus Corporation). The cell
migration rate was calculated using the following formula: Cell
migration rate (%)=[(A0-A24)/A0]
×100. (A0 refers to the initial wound area at 0 h;
A24 indicates the remaining wound area at the measured
24 h).
Transwell assay for cell invasion
The cells were cultured until they reached 80–90%
confluence with normal morphology and stable growth kinetics.
Subsequently, the cells were resuspended in serum-free medium. A
500-µl aliquot of cell-specific medium supplemented with 10% FBS
was added to the lower chamber of a 24-well Transwell invasion
chamber (BioCoat® Matrigel® Invasion Chamber;
8-µm pore size; cat. no. 354480; Corning, Inc.). The upper chamber
was seeded with a 300-µl cell suspension containing
5×10⁴ cells/well. After incubation in a 37°C
CO2 incubator for 24 h, the chambers were removed, the
medium was discarded and the cells were stained with 0.1% crystal
violet for 1 h at 37°. The unmigrated cells in the upper chambers
were removed with a cotton swab and the cells that had invaded the
lower chambers observed under a light microscope (BX43; Olympus
Corporation). After images were captured, the staining solution was
removed, the samples were treated with 33% acetic acid and the
absorbance value of each well was measured at 562 nm with an enzyme
labeling instrument (cat. no. WD-2012B; Beijing Liuyi
Biotechnology, Co., Ltd.).
Western blotting (WB)
The cells were harvested, the culture medium was
discarded and total protein was extracted with RIPA lysis buffer
(cat. no. C1053; Beijing Applygen Technologies, Inc.). After
centrifugation at 14,490 × g for 10 min at 4°C, the supernatant was
collected and total protein was quantified using a BCA protein
quantification kit (cat. no. E-BC-K318-M; Wuhan Elabscience
Biotechnology Co., Ltd.). After denaturation of the protein
samples, the loading volume was calculated based on a protein
amount of 20 µg/lane. SDS gel (10% separating gel and 5% stacking
gel) electrophoresis was performed for 1.5 h, followed by constant
flow of the membrane at 300 mA for 1 h. The PVDF membrane (cat. no.
IPVH00010; MilliporeSigma) was sealed with 3% non-fat dry milk for
1 h at room temperature and incubated with primary antibodies
against RING1 and YY1-binding protein (RYBP; cat. no. 68130-1-Ig;
Proteintech Group, Inc.; 1:2,000), EGFR (cat. no. GB11084-2; Wuhan
Servicebio Technology Co., Ltd.; 1:1,000), phosphorylated (p)-EGFR
(cat. no. YP0086; ImmunoWay Biotechnology Company; 1:1,000),
vimentin (cat. no. GB11192; Wuhan Servicebio Technology Co., Ltd.;
1:1,000), GAPDH (cat. no. HC301; TransGen Biotech Co., Ltd.;
1:2,000) and E-cadherin [cat. no. GB12868; Wuhan Servicebio
Technology Co., Ltd.; 1:1,000] overnight at 4°C. The following day,
the PVDF membrane was incubated with the HRP-conjugated goat
anti-rabbit IgG (H+L) (cat. no. GB23303; Wuhan Servicebio
Technology Co., Ltd.; 1:2,000) or HRP-conjugated Goat Anti-Mouse
IgG (H+L) (cat. no. GB23301; Wuhan Servicebio Technology Co., Ltd.;
1:2,000) secondary antibody for 2 h at room temperature. The
membrane was washed with 1X TBS-0.1% Tween buffer. Subsequently,
the PVDF membrane was incubated with SuperSignal® West
Pico Chemiluminescent Substrate (cat. no. RJ239676; Thermo Fisher
Scientific, Inc.) and imaged using an ultra-high sensitivity
chemiluminescence imaging system (Tanon-5200; Tanon Science and
Technology Co., Ltd.). Semi-quantitative analysis was performed
using Image Lab software (version 6.0; Bio-Rad Laboratories,
Inc.).
Dual-luciferase reporter gene
assay
In the dual-luciferase reporter gene assay, the
wild-type (WT) and mutant (MUT) binding sequences of RP11-196G11.6
or RYBP 3′-UTR were cloned into the pmirGLO vector (Promega
Corporation). The 239T cells were seeded in 24-well plates and were
co- transfected with the following sequences using Lipofectamine
3000: i) To assess the RP11-196G11.6-miR-376a-3p interaction, cells
were co-transfected with WT-RP11 vector + miR-376a-3p mimic,
WT-RP11 vector + NC mimic, MUT-RP11 vector + miR-376a-3p mimic or
MUT-RP11 vector + NC mimic; ii) to assess the miR-376a-3p-RYBP
interaction, cells were co-transfected with WT-RYBP vector +
miR-376a-3p mimic, WT-RYBP vector + NC mimic, MUT-RYBP vector +
miR-376a-3p mimic or MUT-RYBP vector + NC mimic.
WT-RP11-196G11.6-pmirGLO, MUT-RP11-196G11.6-pmirGLO,
WT-RYBP-pmirGLO and MUT-RYBP-pmirGLO were obtained from ZHBY
Biotechnology Co., Ltd. After transfection according to the
experimental protocol of the dual-luciferase reporter gene assay
kit (cat. no. RG027; Beyotime Institute of Biotechnology), the
cells were cultured for 24 h. The medium was discarded and the
remaining medium was washed with PBS. The supernatant was collected
after the cells were lysed with passive lysis buffer (cat. no.
RG027; Beyotime Institute of Biotechnology) Firefly and
Renilla luciferase activities were measured sequentially
using a chemiluminescence device (Glomax® 20/20
Luminometer; Promega Corporation) and the ratio of the two was
calculated as relative luciferase activity.
Statistical analysis
Statistical analysis and the visualization of
experimental data were performed using IBM SPSS software (version
22.0; IBM Corp.). Measurement data that follow a normal
distribution are presented as the mean ± SD. For comparisons among
multiple groups, one-way ANOVA followed by Tukey's post hoc test
was used. For comparisons between two groups, unpaired Student's
t-test was employed. Pearson's correlation coefficient was used
when both variables followed a normal distribution. For variables
that deviated from normality or were ordinal in nature, Spearman's
rank correlation coefficient was applied. P<0.05 was considered
to indicate a statistically significant difference. All experiments
were performed with a minimum of three independent replicates. A
graphical abstract for the present study is available in Fig. S1.
Results
Analysis of DElncRNAs in tumor tissues
and DTC samples
First, an NB transcriptome sequencing dataset was
downloaded from the GEO (accession no. GSE94035). Different NB
samples (tumor samples and DTC samples with and without MYCN
amplification) were analyzed at the molecular level. Using PCA, a
clear distinction between tumor and DTC samples, and between
MYCN+ and MYCN− tumor samples was identified,
but PCA was unable to distinguish between MYCN+ and
MYCN− DTC samples (Fig.
1B). The PCA results suggested that MYCN may serve a key role
in tumor growth. Therefore, the DEGs between MYCN+ and
MYCN− samples were analyzed, and a total of 4,551 DEGs
were detected in tumors (2,230 upregulated and 2,321
downregulated), whereas 2,714 DEGs were detected in DTCs (917
upregulated and 1,797 downregulated) (Fig. 1C). As shown in the Venn diagram, a
total of 808 DEGs were detected, of which 339 were upregulated and
469 were downregulated (Fig. 1D).
GO enrichment analysis revealed the GO terms that were most
enriched in DEGs. As shown in Fig.
1E, specific upregulated DEGs regulated by MYCN in DTCs were
enriched in ‘extracellular matrix disassembly’, ‘collagen catabolic
process’, ‘cellular response to cAMP’, ‘positive regulation of
vasodilation’ and ‘axon guidance’. Downregulated DEGs in DTCs were
enriched in ‘cytokine-mediated signaling pathway’, ‘type I
interferon-mediated signaling pathway’, ‘immune response’ and
‘inflammatory response’. These biological processes were associated
with NB metastasis and invasion.
Next, the lncRNAs among the DEGs were analyzed.
Using PCA, a clear distinction was identified between tumor samples
and DTC samples, and between MYCN+ and MYCN−
tumor samples, whereas MYCN+ and MYCN− DTC
samples could not be distinguished (Fig. 1F). In addition, 1,110 DElncRNAs were
identified in tumors (758 upregulated and 352 downregulated),
whereas 793 DElncRNAs were identified in DTCs (231 upregulated and
562 downregulated) (Fig. 1G). Venn
diagrams of the upregulated and downregulated lncRNAs in
MYCN+ tumor and DTC samples revealed that 73 DElncRNAs
were co-upregulated and that 88 DElncRNAs were co-downregulated
(Fig. 1H). WGCNA and co-expression
analysis were analyzed between DElncRNAs and DEmRNAs in tumor and
DTC samples (Fig. 1I). The results
demonstrated that MYCNOS, XLOC-1045657, SNHG19, AC012123.1 and
SNHG8 were the primary DElncRNAs in DTCs, whereas MYCNOS,
EPB41L4A-AS1, RP11-92J19.3 and ZFAS1 were the primary DElncRNAs in
tumors. The top 10 most enriched GO terms by DEmRNAs co-expressed
with DElncRNAs are shown in Fig.
1J, which include a large number of signaling pathways
associated with inflammation/immunity. These findings indicated
that DElncRNA may serve a role in the progression of NB via
immune-related pathways.
Analysis of DElncRNAs associated with
Tregs and Tfhs
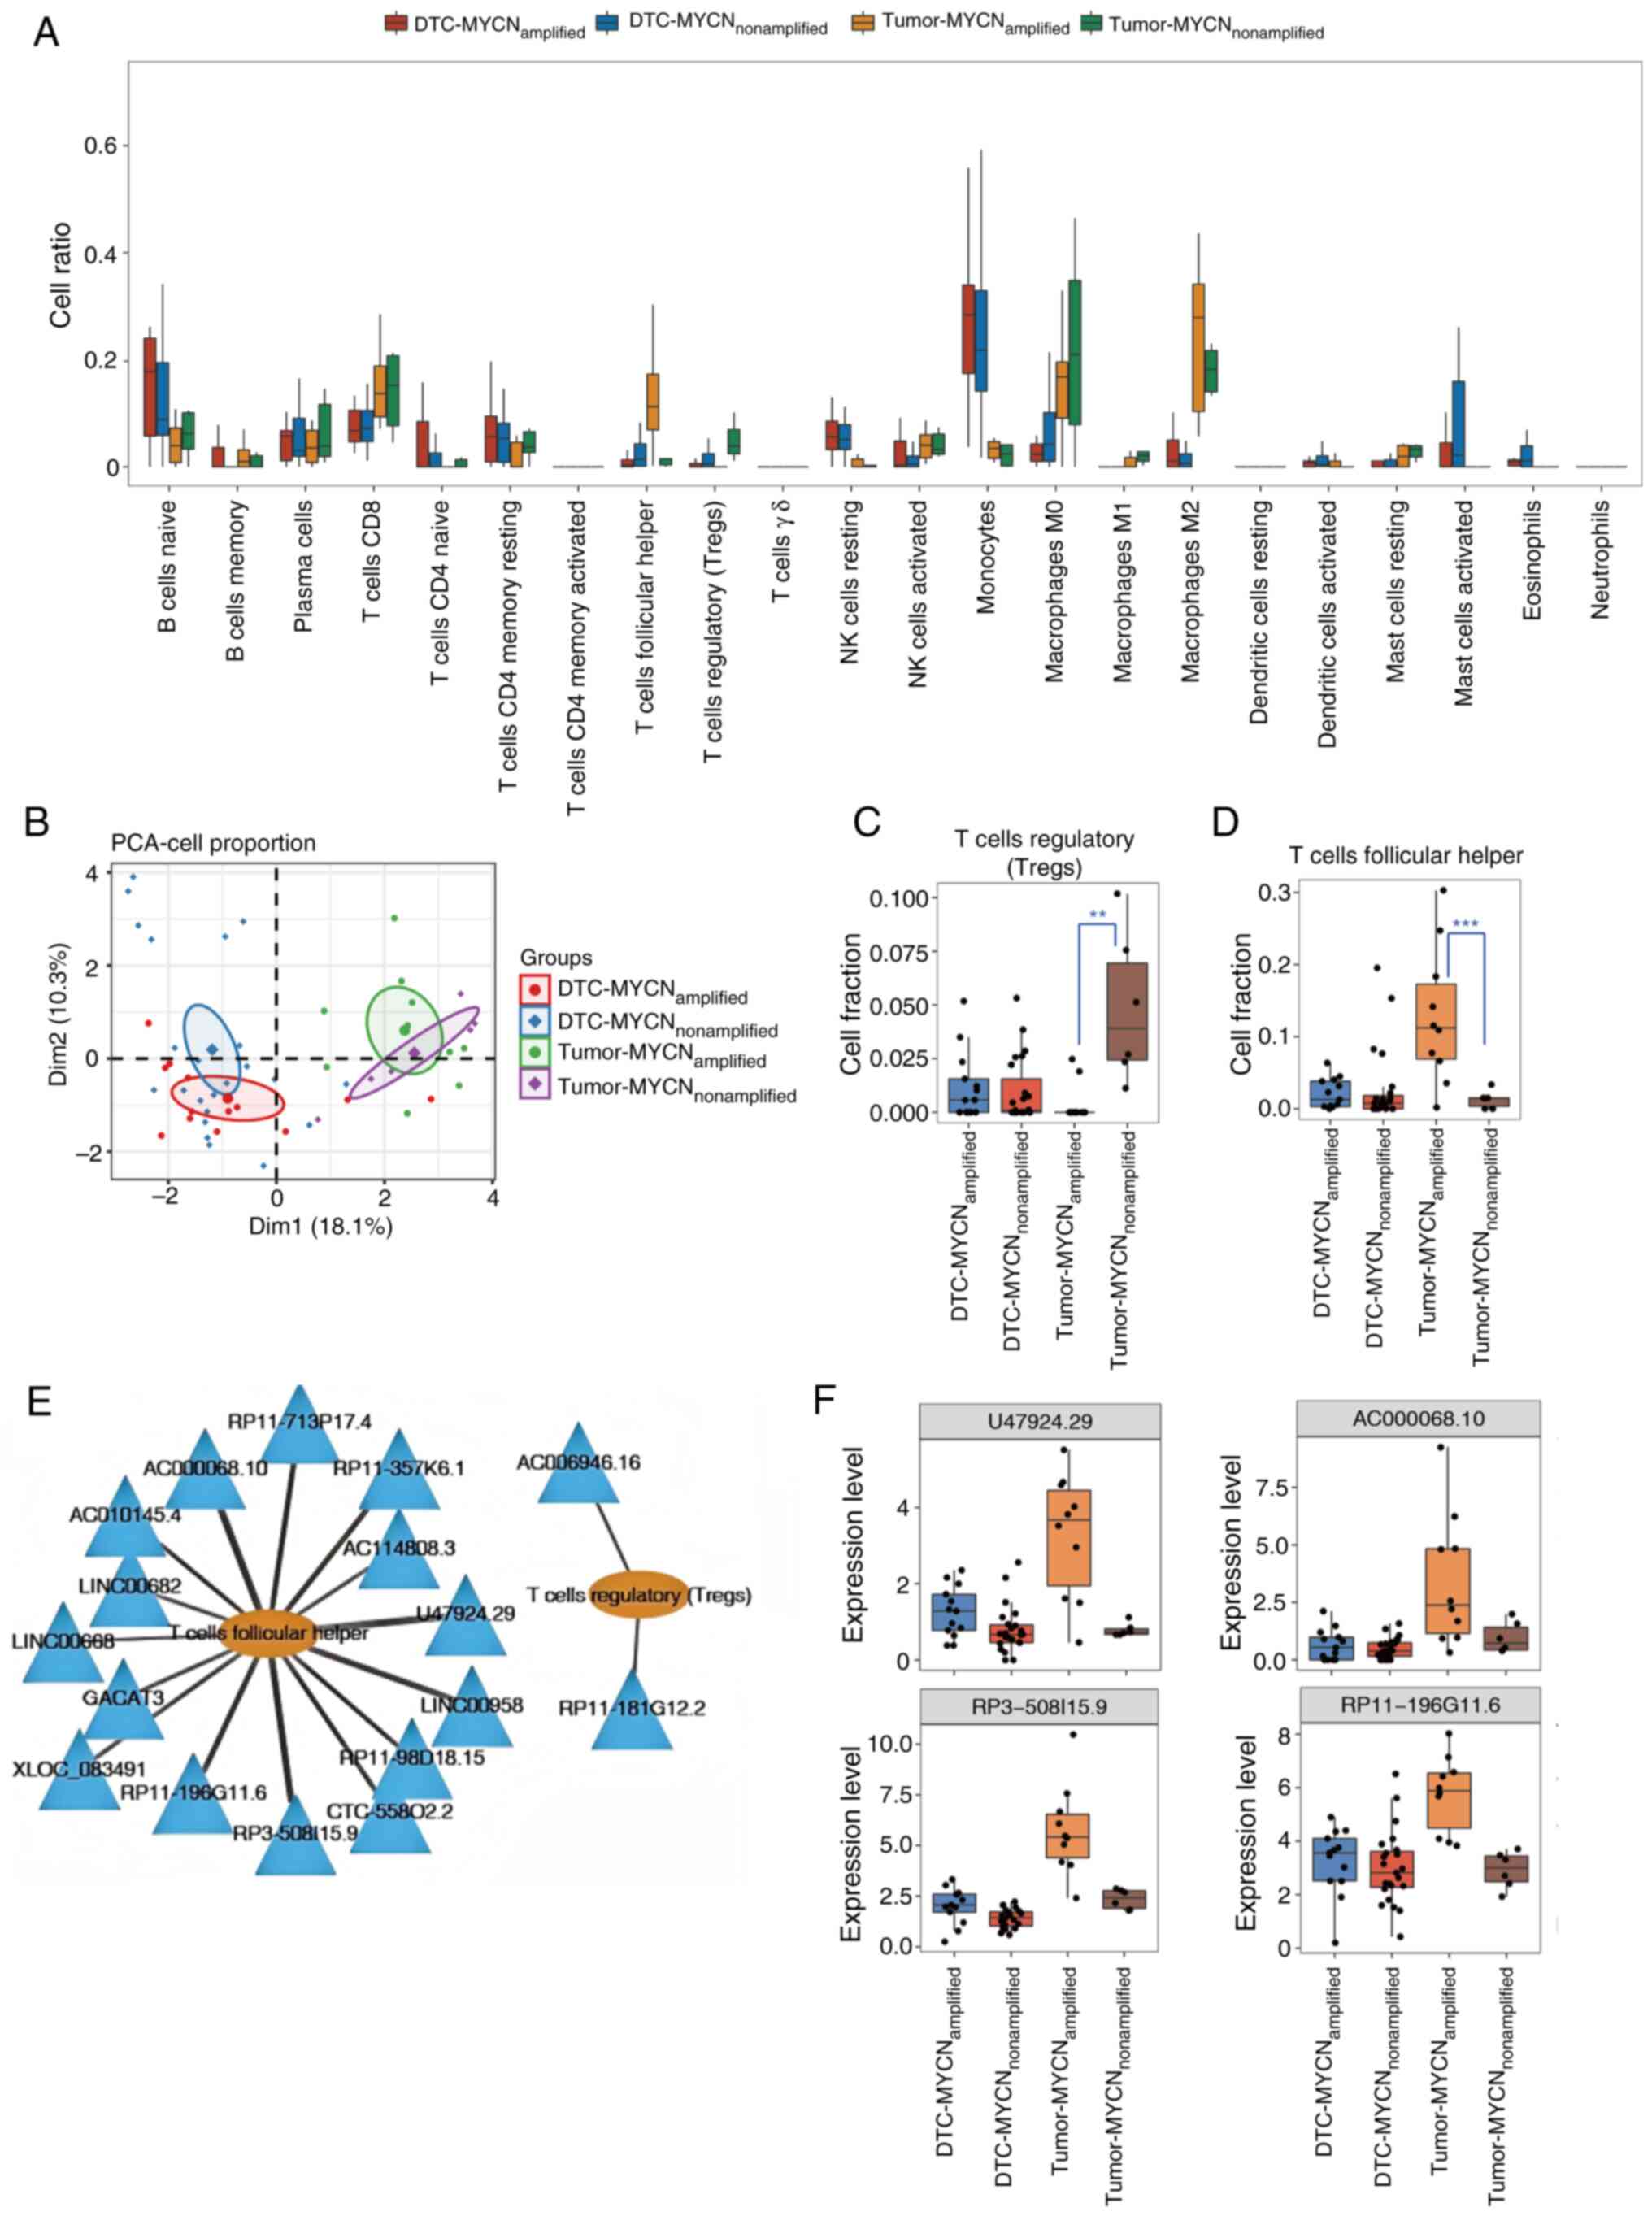
CIBERSORT was used to analyze the proportion of each
immune cell type in MYCN+ and MYCN− tumor and
DTC samples (Fig. 2A). Based on the
magnitude of intergroup differences between MYCN+ and
MYCN− samples in both tumor and DTC samples. Tregs
demonstrated the highest proportion in the tumor-nonamplified
group, whereas Tfhs were most abundant in the tumor-amplified
group. By contrast, other cell types such as monocytes/macrophages
showed minimal differences between groups. PCA revealed that the
different types of cells clearly differentiated between the DTC and
tumor samples, but the MYCN+ samples and
MYCN− samples were indistinguishable (Fig. 2B). Fig.
2C and D display the specific proportions of Tregs and Tfhs in
the four types of samples. In DTC samples, there was no significant
difference in the proportions of Tregs or Tfhs between
MYCN+ and MYCN− samples. However, in tumor
samples, the proportion of Tregs in MYCN+ samples were
markedly lower compared with that in MYCN− samples,
whereas the proportion of Tfhs in MYCN+ samples was
markedly higher compared with that in MYCN− samples.
Spearman's rank correlation coefficient was further
calculated on the basis of the expression level of DElncRNAs and
the ratio of Tregs to Tfhs, and 15 lncRNAs were shown to be
associated with Tfhs, while two lncRNAs were associated with Tregs.
The lncRNA-immune cell infiltration networks were constructed with
Cytoscape (Fig. 2E), which revealed
the lncRNAs associated with Tregs and Tfhs. Fig. 2F displays the expression levels of
the top four DElncRNAs (U47924.29, AC000068.10, RP3-508I15.9 and
RP11-196G11.6) associated with Tfh infiltration as determined by
Spearman's rank correlation analysis. In DTC samples, there was no
notable change in the expression levels of these four lncRNAs
between the MYCN+ and MYCN− samples. However,
in tumor samples, the expression levels of these lncRNAs were
markedly higher in MYCN+ samples compared with those in
MYCN− samples. The present study findings suggested that
these four lncRNAs may be associated with NB tumor growth as well
as immune infiltration. Next, the expression levels of these four
lncRNAs were verified in MYCN+ and MYCN−
cells using RT-qPCR. It was identified that only RP11-196G11.6
exhibited successful amplification and showed high expression in
MYCN+ cells, while the other three lncRNAs failed to
amplify, exhibiting delayed amplification profiles and aberrant
dissociation curves, likely attributable to their inherently low
expression levels in NB cells, which precluded further validation
(Fig. S2). Thus, RP11-196G11.6 was
selected for subsequent experimentation.
RP11-196G11.6 is highly expressed in
MYCN+ NB tumor tissues and MYCN+ cells
First, the expression of RP11-196G11.6 was examined
in MYCN+ and MYCN− NB tumor tissues using
FISH. According to the present study findings (Fig. 3A), RP11-196G11.6 was highly
expressed in MYCN+ NB tumor tissues. Next, the
expression levels of RP11-196G11.6 were examined in
MYCN− (SH-SY5Y) and the MYCN+ (IMR-32) NB
cell lines by RT-qPCR. The results revealed that the expression
levels of RP11-196G11.6 were significantly higher in IMR-32 cells
compared with those in SH-SY5Y cells (Fig. 3B). These results indicated that
RP11-196G11.6 may be highly expressed in MYCN+ NB tumor
tissues and cells.
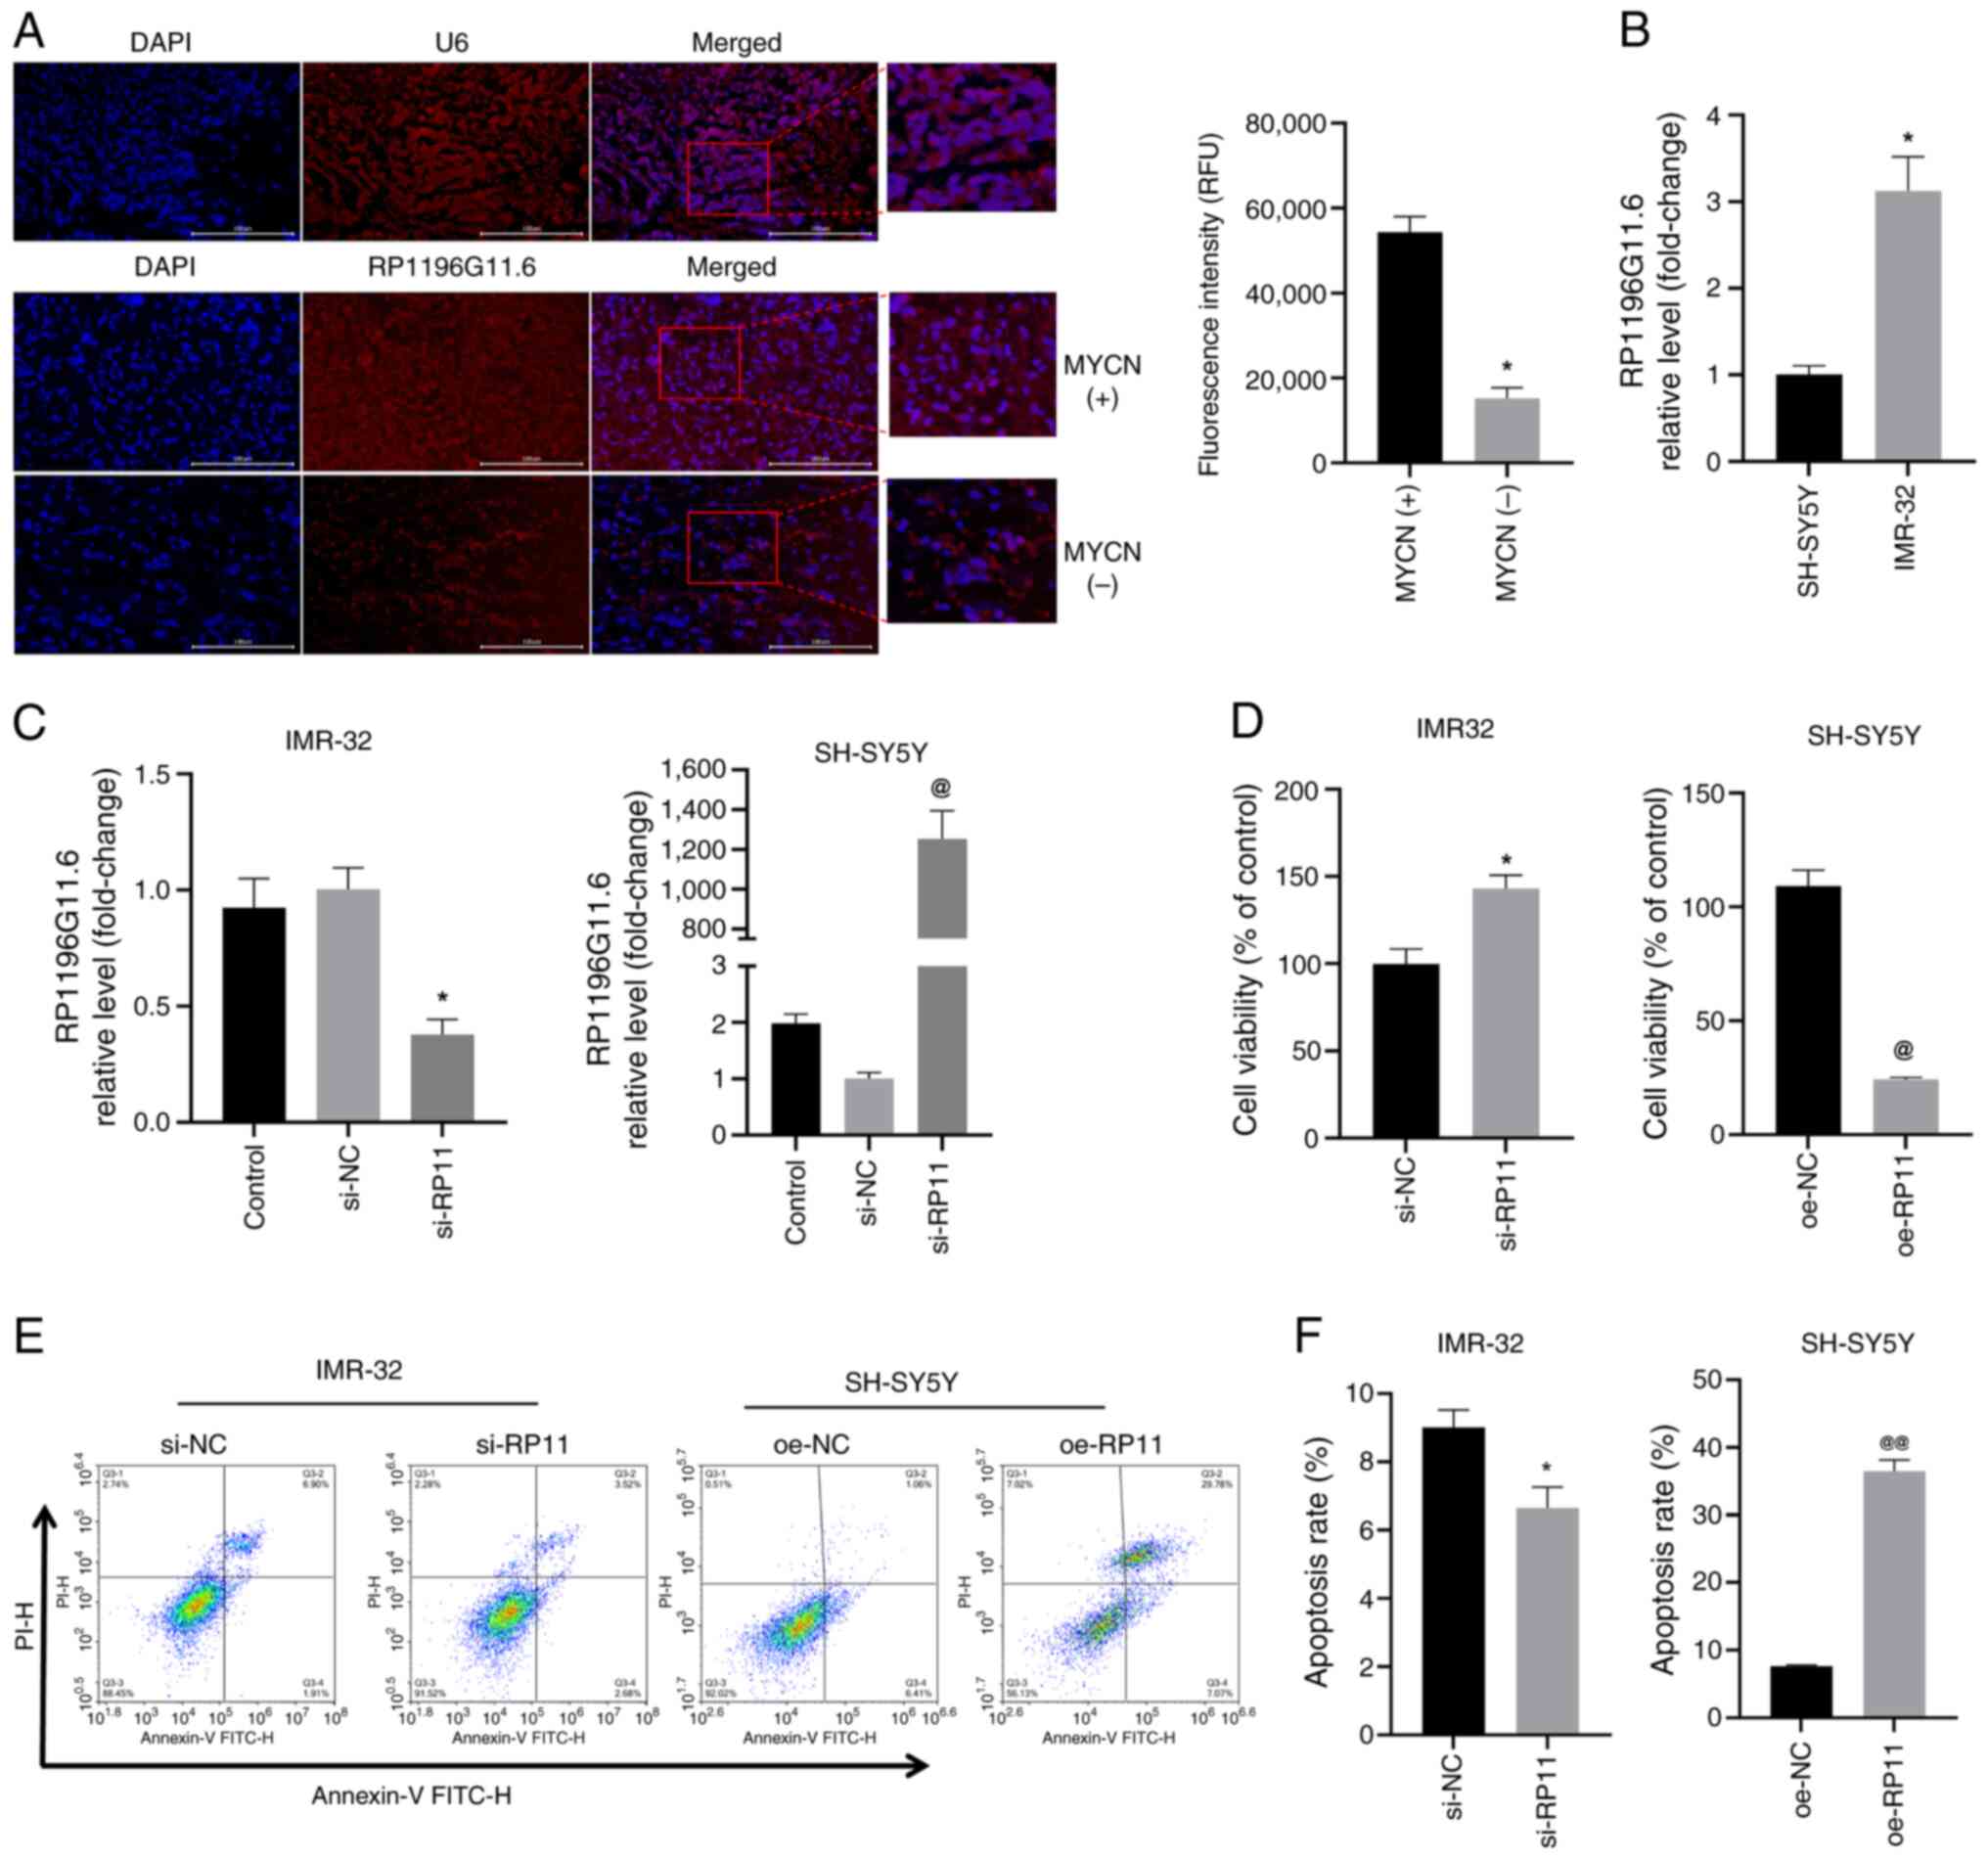 | Figure 3.RP11is highly expressed in
MYCN+ NB tumor tissues and MYCN+ NB cells,
and RP11 upregulation inhibits NB cell viability. (A) FISH analysis
revealed the expression level of RP11 in MYCN+ and
MYCN− NB tumor tissue specimens (scale bar, 100 µm; U6,
control probe). *P<0.05 vs. MYCN+ group. (B)
Quantification of RP11 levels in SH-SY5Y and IMR-32 cells by
reverse transcription-quantitative PCR. *P<0.05 vs. SH-SY5Y. (C)
Quantification of RP11 levels in IMR-32 cells following
transfection with si-RP11 and RP11 levels in SH-SY5Y cells
following transfection with oe-RP11. *P<0.05 vs. si-NC,
@P<0.05 vs. oe-NC. (D) Viability of IMR-32 and
SH-SY5Y cells was assessed using a Cell Counting Kit-8 assay.
*P<0.05 vs. si-NC, @P<0.05 vs. oe-NC. (E) Levels
of apoptosis were assessed using flow cytometry in IMR-32 and
SH-SY5Y cells. (F) Apoptosis rate of IMR-32 and SH-SHY5Y cells
*P<0.05 vs. si-NC or @@P<0.01 vs. oe-NC. RP11,
RP11-196G11.6; si, small interfering; oe, overexpression; NB,
neuroblastoma; FISH, fluorescence in situ hybridization; NC,
negative control. |
RP11-196G11.6 inhibits the viability,
migration and invasion of NB cells
si-RP11 was transfected into IMR-32 cells and
oe-RP11 was transfected into SH-SY5Y cells; subsequently, RT-qPCR
confirmed that siRNA transfection significantly downregulated
RP11-196G11.6 expression in IMR-32 cells, whereas transfection with
oe-RP11 resulted in substantial upregulation of RP11-196G11.6 in
SH-SY5Y cells, thereby validating the successful knockdown and
overexpression of this lncRNA (Fig.
3C). The results of the CCK-8 assay (Fig. 3D) revealed that RP11-196G11.6
knockdown increased IMR-32 cell viability, whereas RP11-196G11.6
overexpression decreased the viability of SH-SY5Y cells. Flow
cytometry (Fig. 3E and F) revealed
that RP11-196G11.6 downregulation significantly inhibited IMR-32
apoptosis, whereas RP11-196G11.6 upregulation significantly
increased SH-SY5Y apoptosis. The results of the cell scratch assay
(Fig. 4A and B) revealed that
RP11-196G11.6 downregulation promoted IMR-32 cell migration,
whereas RP11-196G11.6 upregulation inhibited SH-SY5Y cell
migration. Furthermore, the results of the Transwell assay
(Fig. 4C and D) revealed that
RP11-196G11.6 downregulation promoted IMR-32 cell invasion, whereas
RP11-196G11.6 upregulation inhibited SH-SY5Y cell invasion. These
results indicated that RP11-196G11.6 knockdown could promote NB
cell viability, migration and invasion, whereas RP11-196G11.6
upregulation may inhibit these processes.
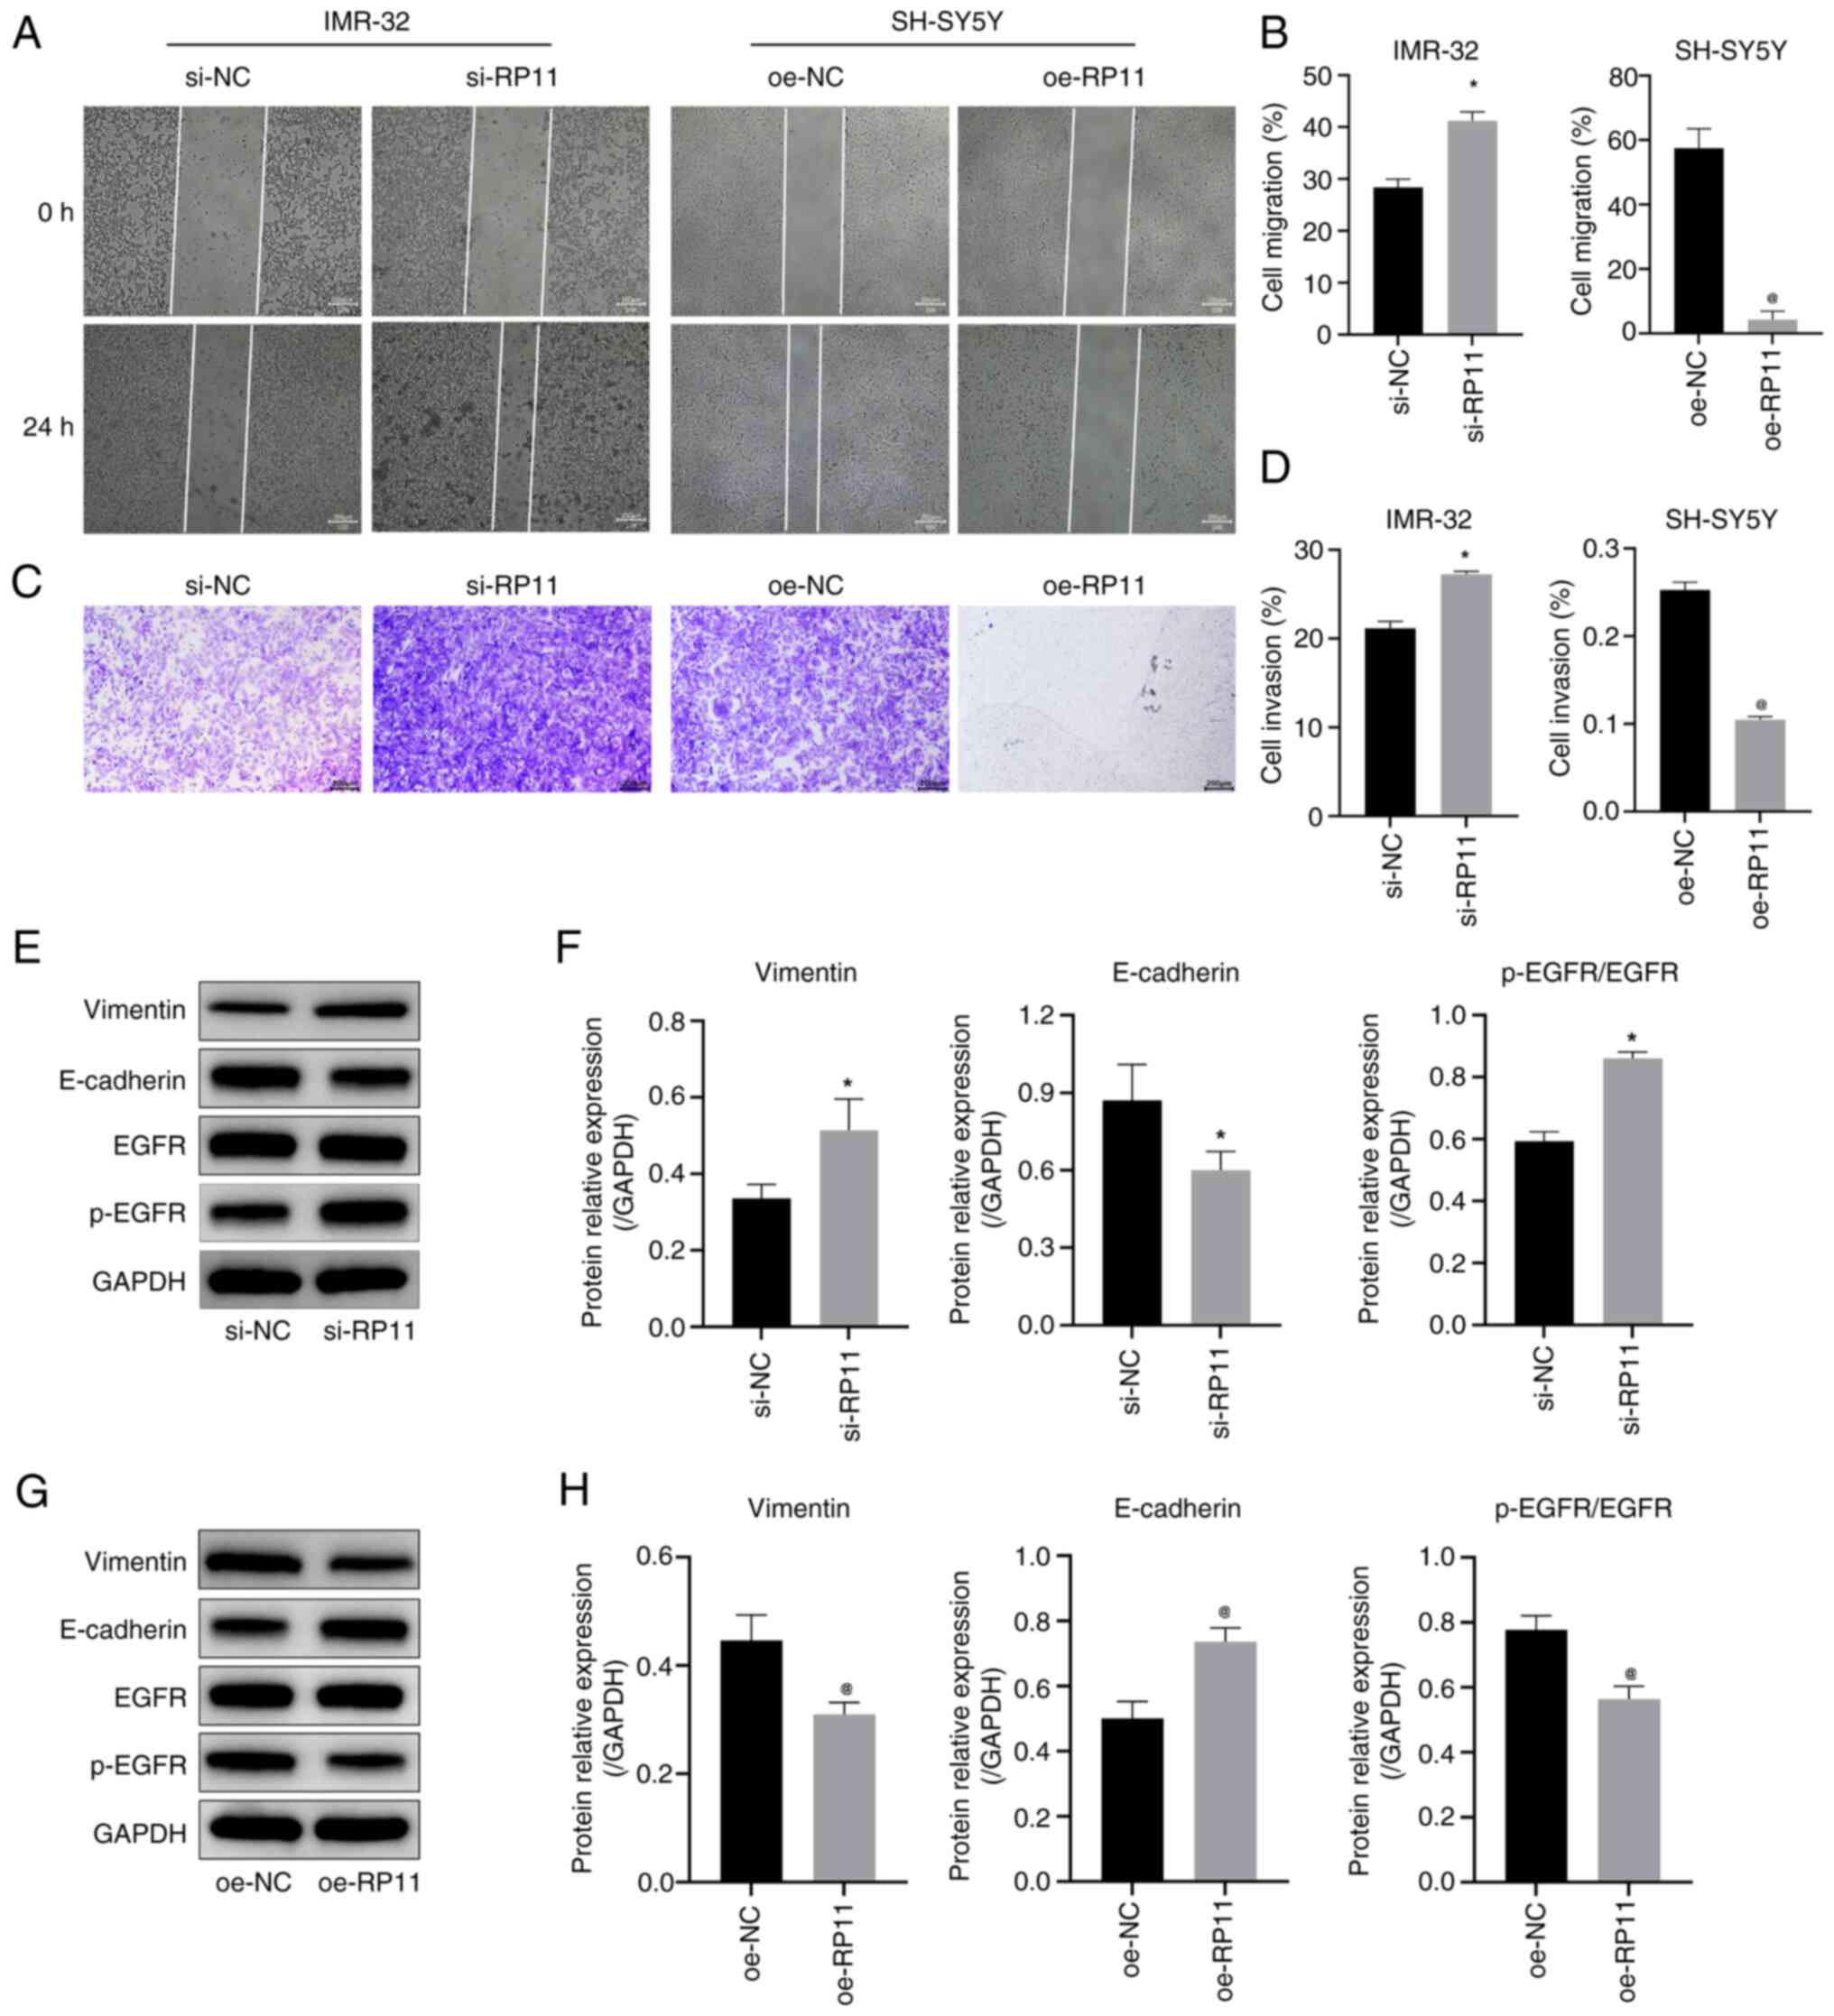 | Figure 4.RP11 upregulation inhibits
neuroblastoma cell migration and invasion. (A) Cell scratch assay
results indicated that knockdown of RP11 expression promoted
migration in IMR-32 cells and oe-RP11 suppressed migration in
SH-SY5Y cells (scale bar, 200 µm). (B) Comparison of cell migration
rates in IMR-32 and SH-SY5Y cells in the cell scratch assay.
*P<0.05 vs. si-NC, @P<0.05 vs. oe-NC. (C)
Transwell assay results indicated that knockdown of RP11 expression
promoted invasion in IMR-32 cells and oe-RP11-196G11.6 suppressed
invasion in SH-SY5Y cells (scale bar, 200 µm). (D) Quantitative
analysis of cell invasion rate in the Transwell assay. *P<0.05
vs. si-NC, @P<0.05 vs. oe-NC. (E) Representative WB
images in IMR-32 cells. (F) Expression levels of vimentin,
E-cadherin and p-EGFR/EGFR in IMR-32 cells *P<0.05 vs. si-NC.
(G) Representative WB images in SH-SY5Y cells. (H) Expression
levels of vimentin, E-cadherin and p-EGFR/EGFR protein in SH-SY5Y
cells. @P<0.05 vs. oe-NC. RP11, RP11-196G11.6; si,
small interfering; oe, overexpression; WB, western blotting; p-,
phosphorylated; NC, negative control. |
Next, the expression levels of the
epithelial-mesenchymal transition (EMT)-related proteins, vimentin,
E-cadherin, EGFR and p-EGFR, were detected in NB cells by WB. The
results in IMR-32 cells (Fig. 4E and
F) revealed that the downregulation of RP11-196G11.6
significantly decreased the protein expression levels of
E-cadherin, and significantly increased the protein expression
levels of vimentin and p-EGFR/EGFR. By contrast, the results in
SH-SY5Y cells (Fig. 4G and H)
revealed that the upregulation of RP11-196G11.6 significantly
increased the protein expression levels of E-cadherin, but
significantly decreased the protein expression levels of vimentin
and p-EGFR/EGFR. These results indicated that the upregulation of
RP11-196G11.6 may inhibit the viability, migration and invasion of
NB cells, and promote their apoptosis.
RP11-196G11.6 targets and inhibits the
expression of miR-376a-3p in NB cells
miRanda predicted that the following three miRNAs
could potentially bind to RP11-196G11.6: i) miR-376b-3p ii)
miR-509-3-5p and iii) miR-376a-3p. These predictions were confirmed
by RT-qPCR, which revealed that miR-376b-3p and miR-509-3-5p failed
to amplify, exhibiting delayed amplification profiles and aberrant
dissociation curves, likely attributable to their inherently low
expression levels in NB cells, which could not be further
validation (Fig. S3). However, it
was revealed that the downregulation of RP11-196G11.6 significantly
increased the expression levels of miR-376a-3p in IMR-32 cells
whereas the upregulation of RP11-196G11.6 significantly decreased
the expression levels of miR-376a-3p in SH-SY5Y cells (Fig. 5A). In addition, a dual-luciferase
reporter gene assay (Fig. 5B)
revealed that luciferase activity was significantly lower in the
WT-RP11 + miR-376a-3p mimic group compared with that in the WT-RP11
+ NC mimic group; however, the luciferase activity was not
evidently different between the MUT-RP11 + NC group and the
MUT-RP11 + mimic group. These results indicated that RP11-196G11.6
could target and inhibit the expression of miR-376a-3p. Using miRDB
prediction, RYBP was identified as a downstream target gene of
miR-376a-3p and RYBP has been confirmed to be associated with tumor
suppression (26–28), including in hepatocellular
carcinoma, colorectal cancer and lung cancer. Therefore, the
protein expression levels of RYBP in cells was assessed by WB. The
results revealed that the downregulation of RP11-196G11.6
significantly decreased the protein levels of RYBP in IMR-32 cells
whereas the upregulation of RP11-196G11.6 significantly increased
the protein levels of RYBP in SH-SY5Y cells (Fig. 5C). The targeting relationship
between miR-376a-3p and RYBP was further verified using the
dual-luciferase reporter gene assay. Compared with that in the
WT-RYBP + NC mimic group, luciferase activity was significantly
lower in the WT-RYBP + miR-376a-3p mimic group; however, the
luciferase activity was not evidently different between the
MUT-RYBP + NC group and the MUT-RYBP + mimic group (Fig. 5D). These results suggested that
miR-376a-3p can bind to RYBP.
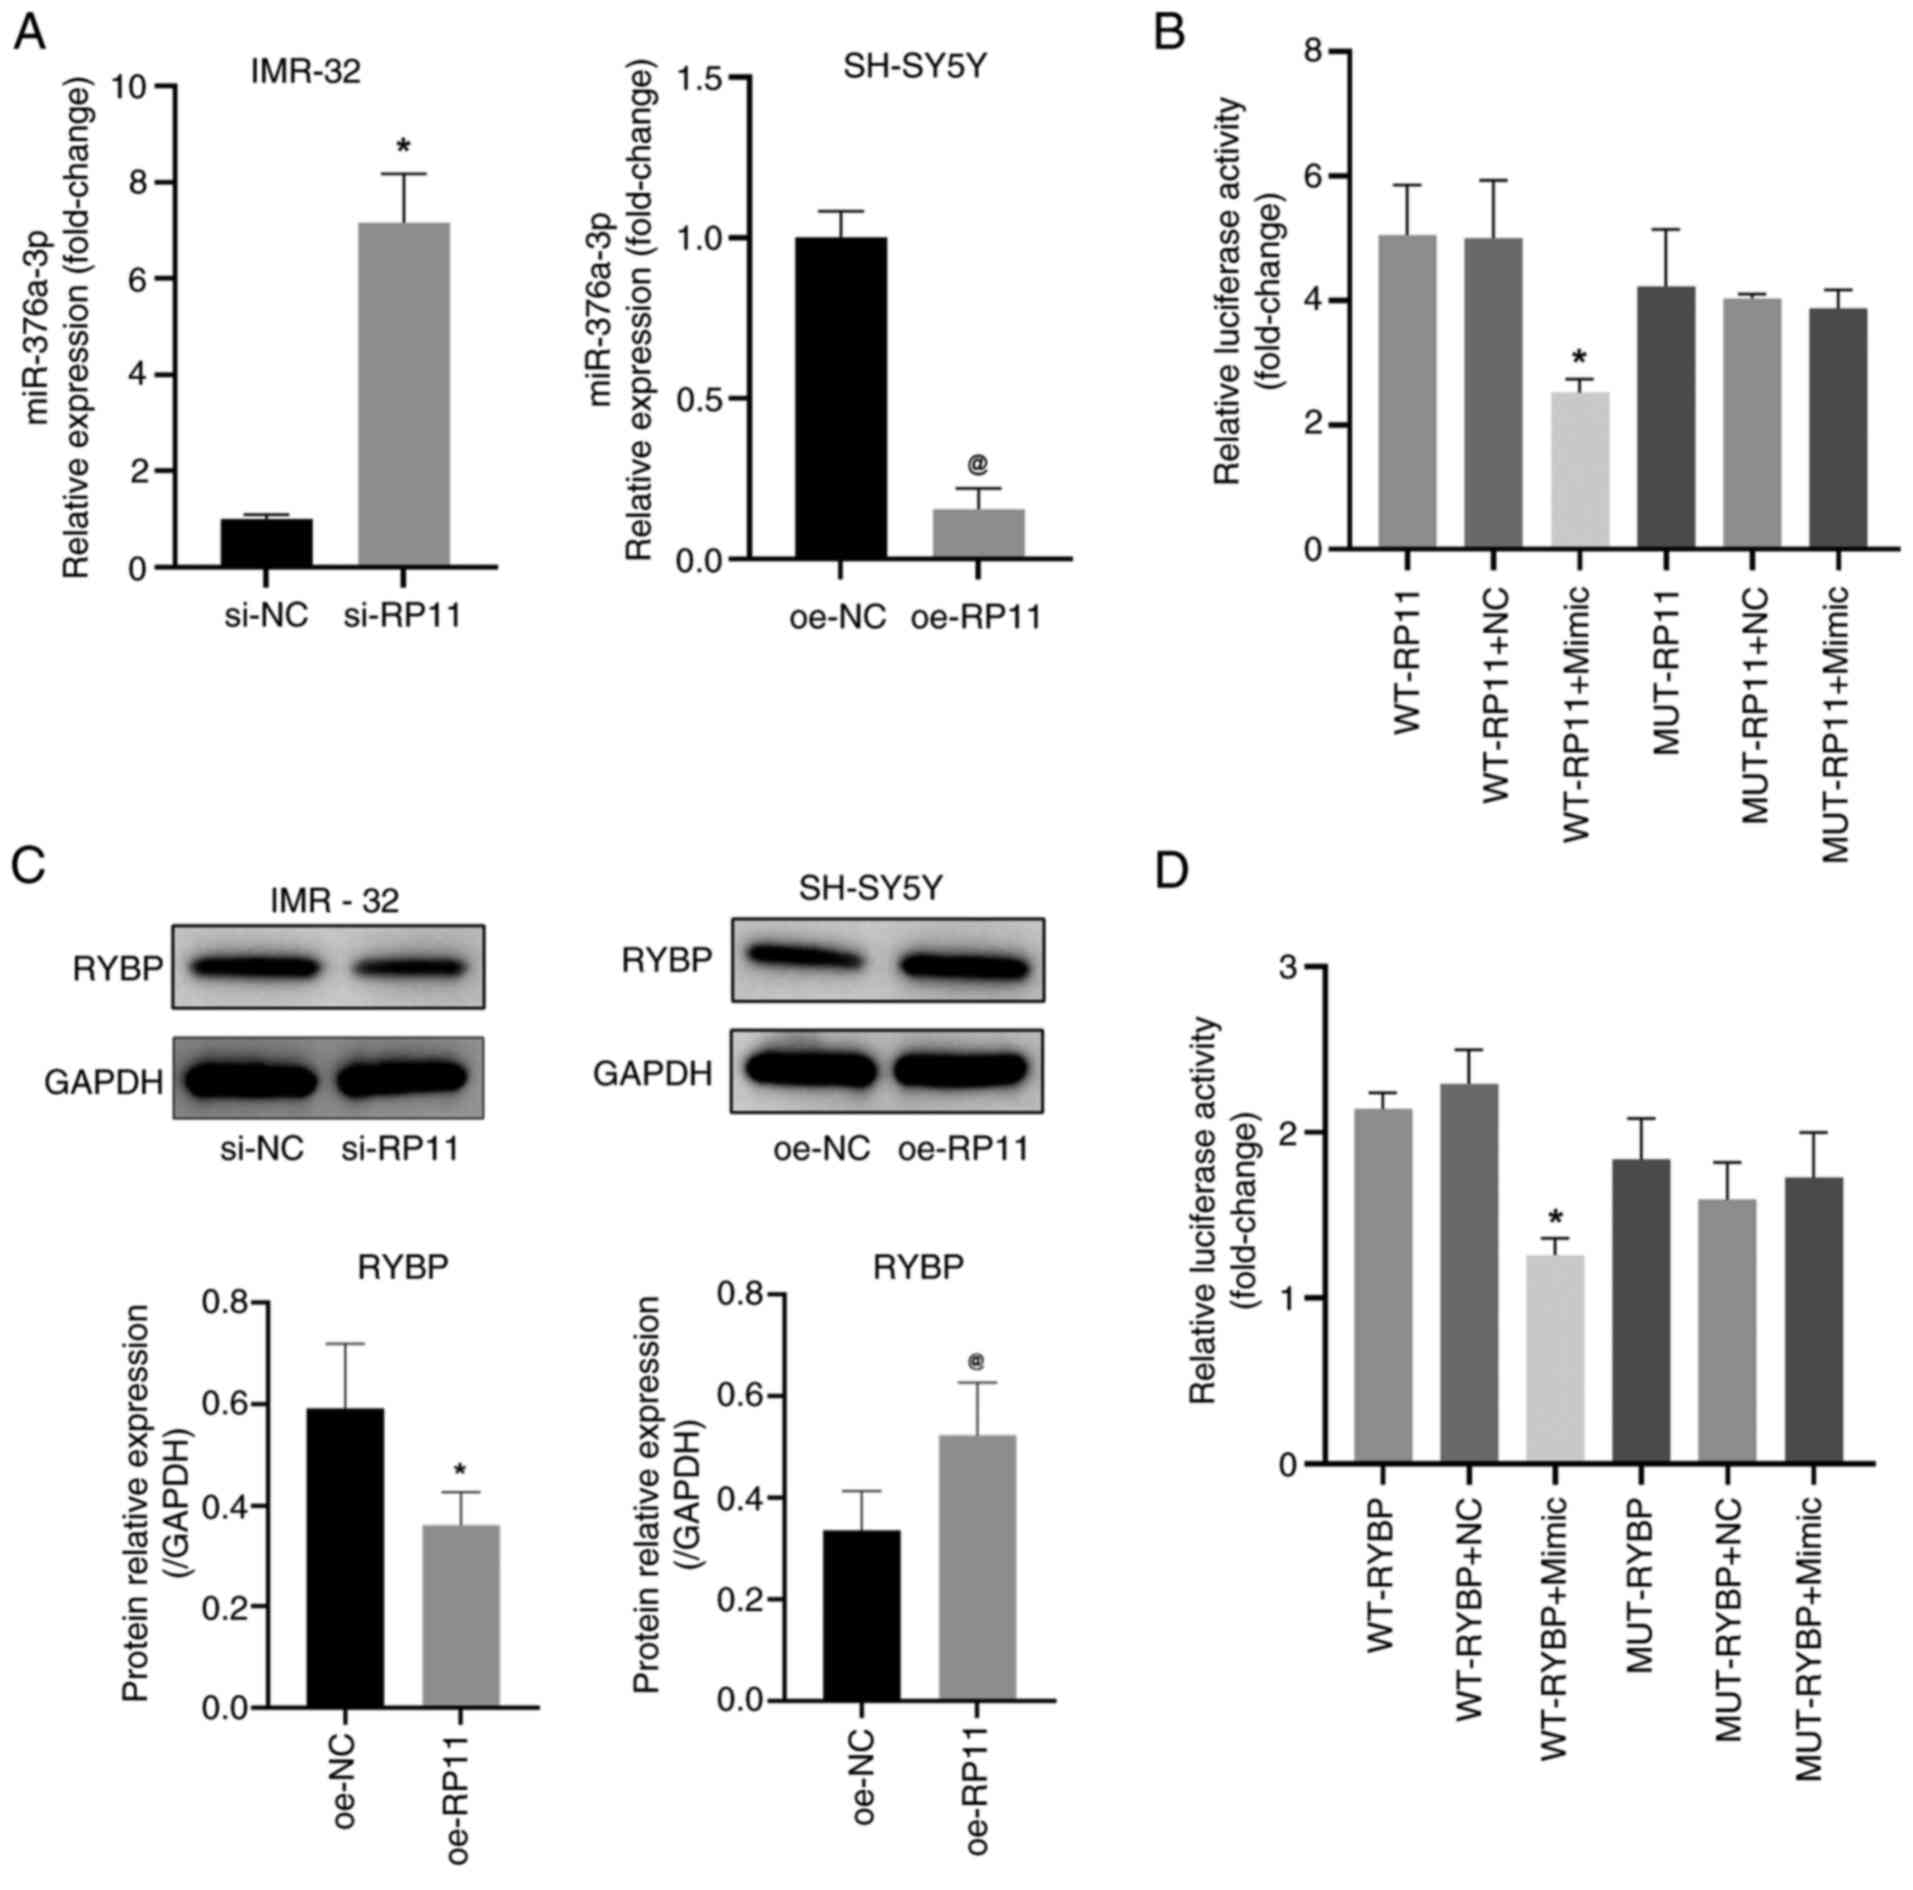 | Figure 5.RP11 inhibits miR-376a-3p expression
in neuroblastoma cells. (A) Quantification of miR-376a-3p levels in
IMR-32 cells following transfection with si-RP11 and in SH-SY5Y
cells following transfection with oe-RP11. *P<0.05 vs. si-NC,
@P<0.05 vs. oe-NC. (B) Luciferase reporter assay was
performed to measure the activity of the WT or MUT RP11 3′UTR
vector in 293T cells that were co-transfected with either
miR-376a-3p or NC mimics. *P<0.05 vs. WT-RP11 + NC. (C) RYBP
protein levels detected by WB in IMR-32 and SH-SY5Y cells.
*P<0.05 vs. si-NC, @P<0.05 vs. oe-NC. (D)
Luciferase reporter assay was performed to measure the activity of
the WT or MUT RYBP 3′UTR vector in 293T cells that were
co-transfected with either miR-376a-3p or NC mimics. *P<0.05 vs.
WT-RYBP + NC. RP11, RP11-196G11.6; si, small interfering; oe,
overexpression; NC, negative control; WB, western blotting; WT,
wild-type; RYBP, RING1 and YY1-binding protein; MUT, mutant;
miR-376a-3p, microRNA-376a-3p. |
RP11-196G11.6 inhibits NB cell
viability, migration and invasion by downregulating miR-376a-3p
expression
To verify whether RP11-196G11.6 inhibits NB cell
viability, migration and invasion via downregulation of
miR-376a-3p, the effects of miR-376a-3p overexpression (Fig. S4) on the viability, migration and
invasion of SH-SY5Y cells overexpressing RP11-196G11.6 was
examined. The findings indicated that overexpression of miR-376a-3p
reduced apoptosis and increased cell viability; the inhibitory
effects of RP11-196G11.6 overexpression on cell viability (Fig. 6A) and the promotion of apoptosis
(Fig. 6B) were partially reversed
by miR-376a-3p overexpression. These results indicated that
RP11-196G11.6 may inhibit NB cell viability and induce apoptosis by
downregulating miR-376a-3p. In addition, miR-376a-3p overexpression
promoted cell migration and invasion; it partially reversed the
inhibitory effects of RP11-196G11.6 overexpression on cell
migration and invasion (Fig. 6C-F).
These findings suggested that RP11-196G11.6 could inhibit NB cell
migration and invasion by downregulating miR-376a-3p.
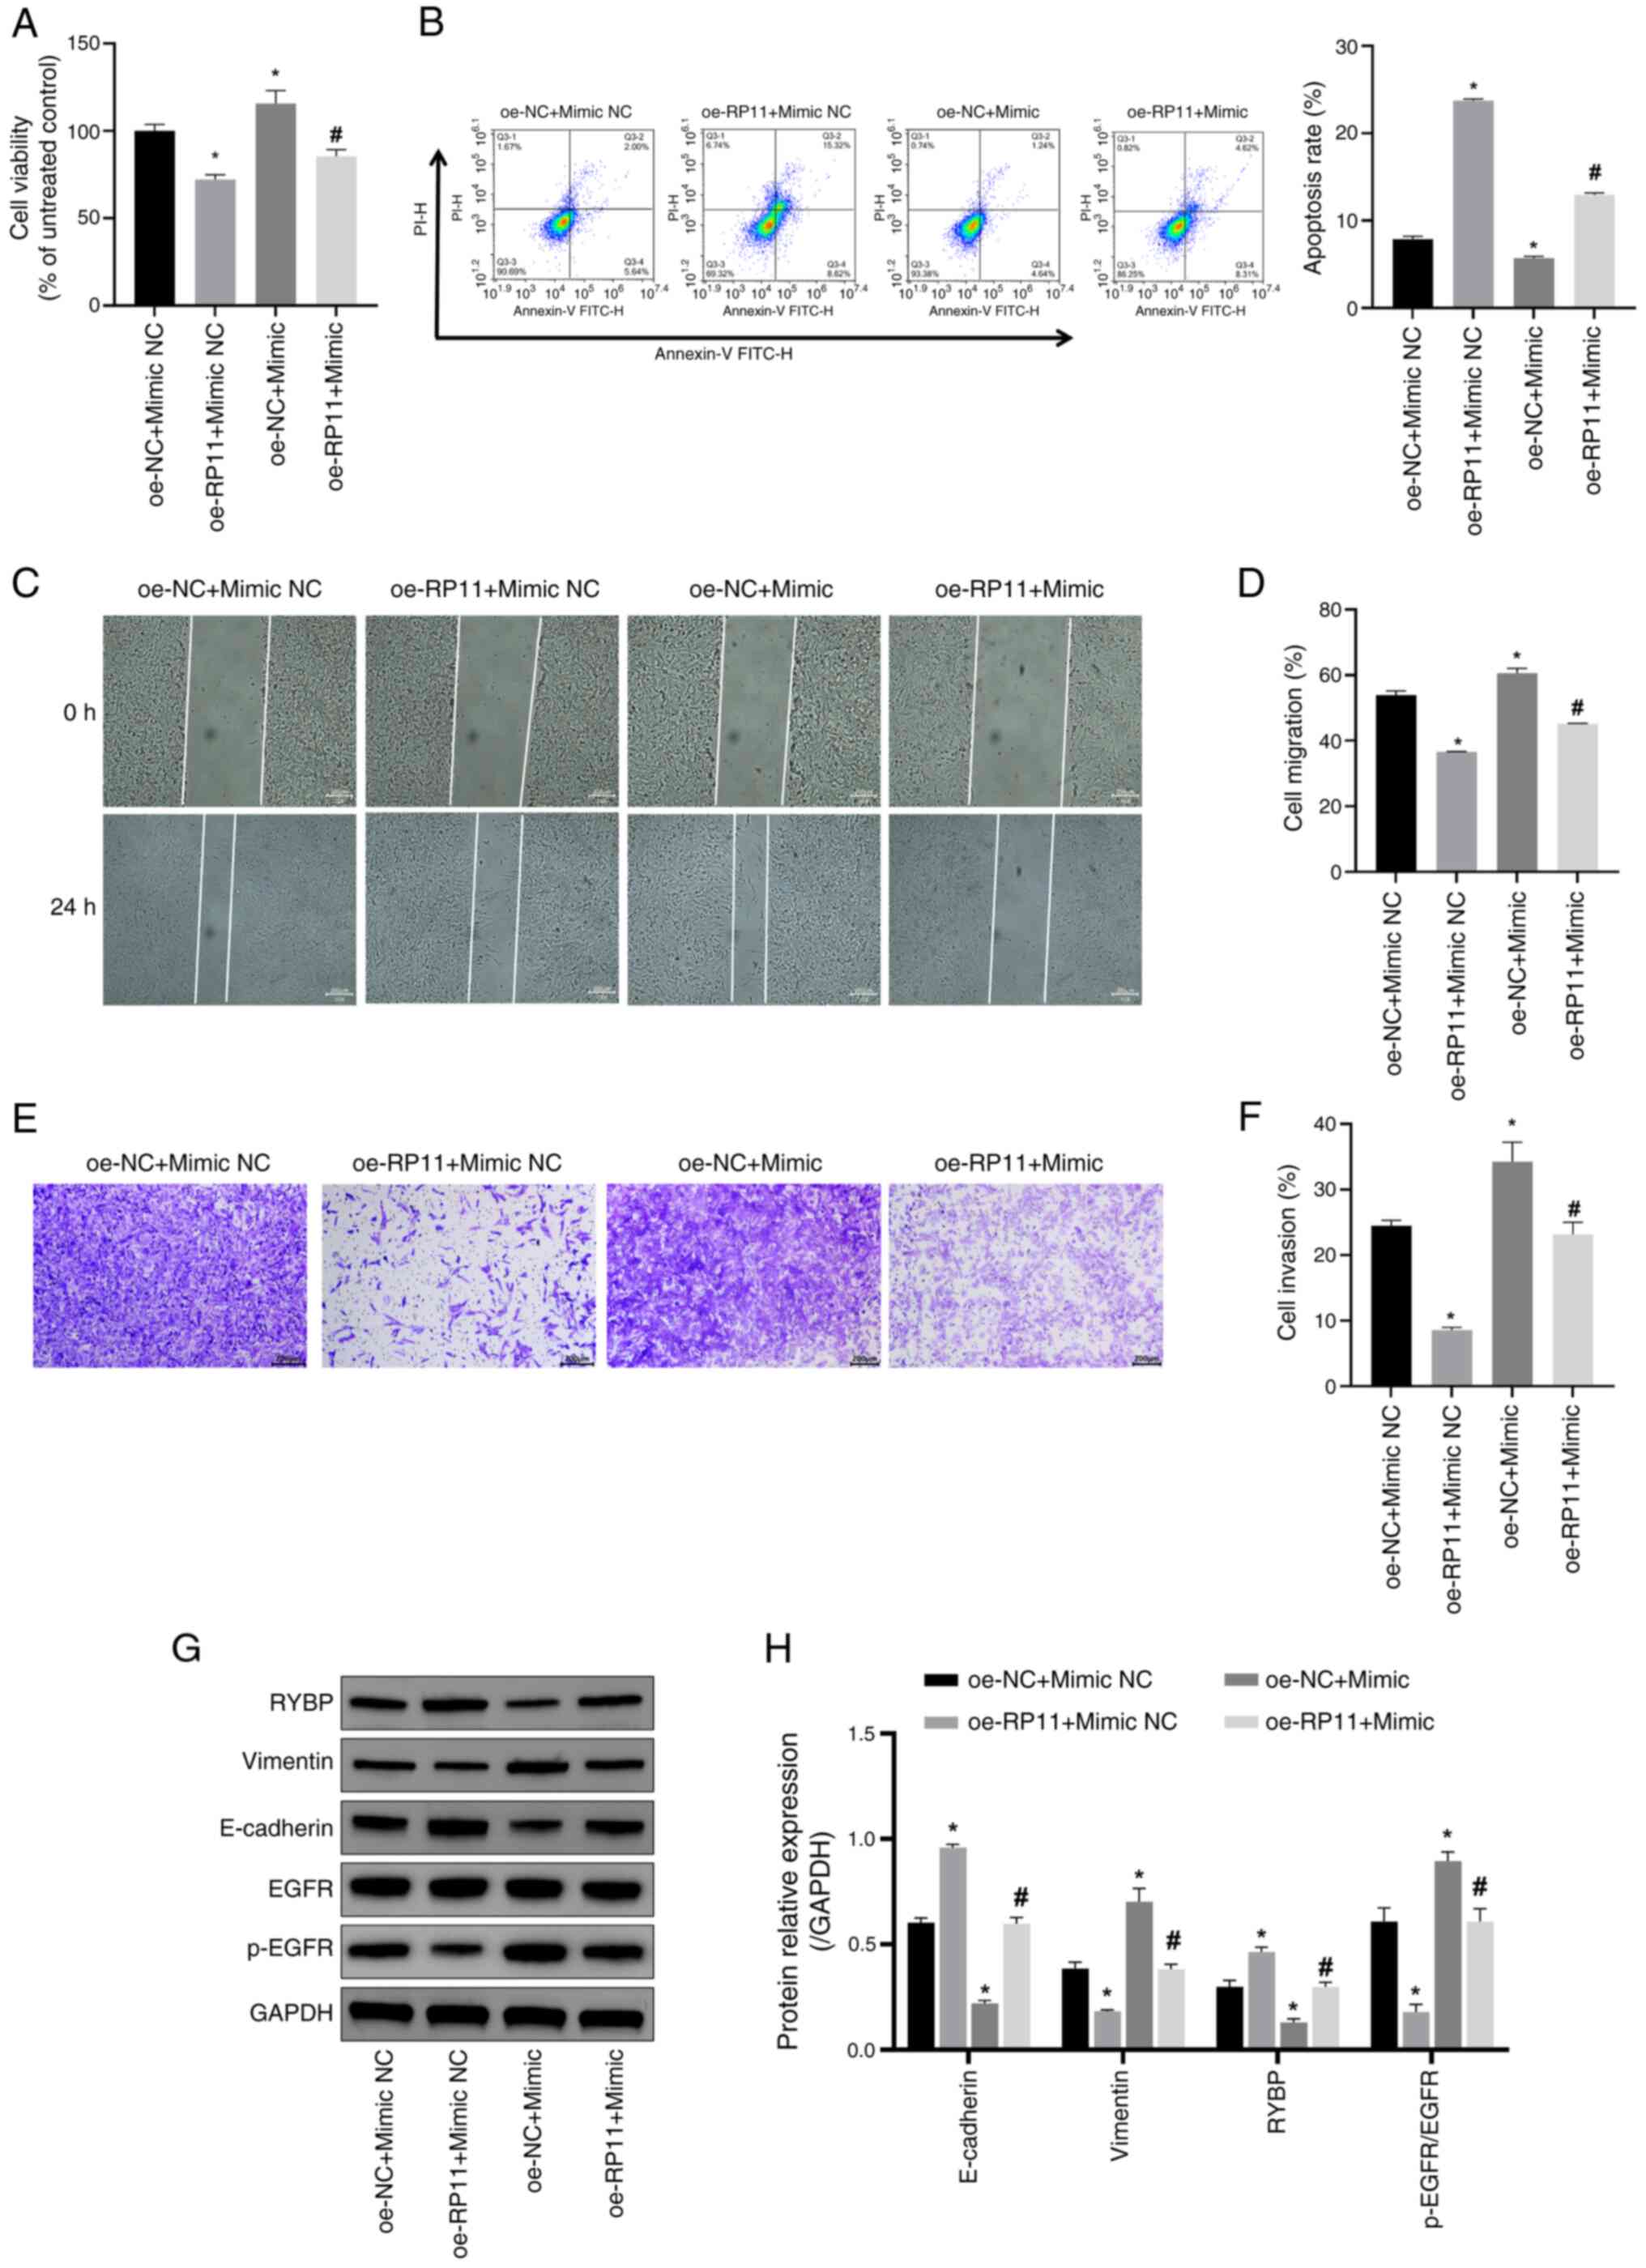 | Figure 6.RP11 inhibits SH-SY5Y cell viability,
migration and invasion by downregulating miR-376a-3p expression.
(A) SH-SY5Y cell viability was assessed using a Cell Counting Kit-8
assay. *P<0.05 vs. oe-NC + mimic NC; #P<0.05 vs.
oe-RP11 + mimic NC. (B) SH-SY5Y apoptosis was assessed using flow
cytometry to assess the levels of SH-SY5Y apoptosis. *P<0.05 vs.
oe-NC + mimic NC; #P<0.05 vs. oe-RP11 + mimic NC. (C)
SH-SY5Y cell migration ability was detected using a cell scratch
assay (scale bar, 200 µm). (D) Comparison of cell migration rates
between the four groups in the cell scratch assay. *P<0.05 vs.
oe-NC + mimic NC; #P<0.05 vs. oe-RP11 + mimic NC. (E)
SH-SY5Y cell invasive ability was detected using a Transwell assay
(scale bar, 200 µm). (F) Quantitative analysis of cell invasion
rate in the four groups. *P<0.05 vs. oe-NC + mimic NC;
#P<0.05 vs. oe-RP11 + mimic NC. (G) Representative
western blotting image. (H) Semi-quantification of RYBP, vimentin,
E-cadherin and p-EGFR/EGFR protein expression levels. *P<0.05
vs. oe-NC + mimic NC; #P<0.05 vs. oe-RP11 + mimic NC.
oe, overexpression; NC, negative control; RP11, RP11-196G11.6;
RYBP, RING1 and YY1-binding protein; miR-376a-3p, microRNA-376a-3p;
p-, phosphorylated. |
Next, the expression levels of the EMT-related
proteins (vimentin, E-cadherin, EGFR, and p-EGFR) and RYBP in
SH-SY5Y cells were detected by WB. The results revealed that,
compared with in the oe-RP11 + Mimic NC group, miR-376a-3p
overexpression in the oe-RP11 + Mimic downregulated the protein
expression levels of RYBP and E-cadherin, but increased the protein
expression levels of vimentin and p-EGFR/EGFR (Fig. 6G and H). Notably, miR-376a-3p
overexpression partially reversed the effects of RP11-196G11.6
overexpression on the expression levels of RYBP, vimentin,
E-cadherin and p-EGFR/EGFR.
Discussion
NB is one of the most common extracranial solid
tumors in children, with notable heterogeneity and prognostic
variability (29,30). MYCN amplification is a key molecular
hallmark of NB, and is closely associated with tumor progression
and poor prognosis (31). As
lncRNAs serve a key role in NB (32), the molecular mechanism of action of
lncRNAs remains to be further explored. In the present study,
different NB samples were explored via bioinformatics analysis to
identify MYCN-related DElncRNAs and analyze their potential roles
in NB development. The results revealed high expression of
RP11-196G11.6 in MYCN-amplified NB cells and further confirmed the
effects of RP11-196G11.6-mediated miR-376a-3p and its downstream
target gene RYBP on NB cell viability, migration and invasion.
First, MYCN-regulated Tregs and Tfhs were identified
via CIBERSORT analysis. Subsequently, using Spearman's rank
correlation analysis of the expression levels of DElncRNAs and the
ratios of Tregs and Tfhs, DElncRNAs that were closely associated
with Tregs and Tfhs were identified, and RP11-196G11.6 was selected
as the focus of the present study. lncRNAs may influence the immune
response by the following two mechanisms: i) lncRNAs regulate the
innate immune response; and ii) lncRNAs regulate T-cell activation,
development and differentiation (33).
Amplification of MYCN was among the earliest genetic
hallmarks identified in NB and remains one of the most robust
predictors of poor prognosis (34).
Functionally, MYCN operates as both a transcription factor and a
key oncogenic driver in this malignancy. As a member of the bHLH-LZ
transcription factor family, MYCN binds canonical E-box motifs to
activate proliferation-related targets, including ID2, ODC1 and
MAD2, while concurrently suppressing neuronal differentiation
pathways (35). MYCN exerts potent
anti-apoptotic effects by upregulating the pro-survival proteins
Bcl-2 and MCL-1, and by downregulating TP73, thereby attenuating
the p53 pathway (36).
Epigenetically, MYCN recruits the histone methyltransferase G9a and
histone deacetylases 1 and 2, resulting in elevated histone H3
lysine 9 dimethylation and histone H3 lysine 27 trimethylation at
both the ARID3B and MYCN promoters, and consequent transcriptional
silencing of these loci (37).
In vivo evidence was provided by the tyrosine
hydroxylase-MYCN transgenic mouse model, in which restricted
overexpression of MYCN within the sympathetic nervous system alone
was sufficient to induce rapidly fatal NB, thereby establishing
MYCN as a key oncogenic driver in this disease (38). In the present study, RP11-196G11.6
was highly expressed in MYCN-amplified cells, implying a functional
association with MYCN. Previous data have indicated that MYCN can
directly activate the transcription of multiple lncRNAs, such as
CCAT1-L, H19 and HOTAIR (39);
therefore, the elevated expression of RP11-196G11.6 may reflect
direct transcriptional activation by MYCN. Nevertheless, it remains
plausible that MYCN does not bind the RP11-196G11.6 locus directly
but instead induces other transcription factors that indirectly
de-repress or activate RP11-196G11.6 transcription.
Functional experiments in the present study
confirmed that the downregulation of RP11-196G11.6 promoted the
malignant phenotype of MYCN-amplified cells, whereas its
overexpression suppressed the viability, migration and invasion of
non-amplified cells. This result is consistent with previous
studies, which demonstrated that MYCN can drive tumor progression
by directly or indirectly regulating lncRNA expression. For
example, the expression levels of LINC00839 in MYCN-amplified NB
have been shown to be positively correlated with MYCN
amplification, advanced INSS staging and worse prognosis. In in
vitro experiments, silencing LINC00839 was demonstrated to
inhibit cell proliferation, migration, invasion and EMT (40). The results of the present study
suggested that RP11-196G11.6 serves a key regulatory role in the
viability, migration and invasion of NB cells under different MYCN
amplification states.
miR-376a-3p serves a key role in the malignant
progression of several tumors. For example, in acute myeloid
leukemia (AML), miR-376a-3p serves an inhibitory role in AML
progression by targeting the metallothionein-1X gene, increasing
apoptosis and inhibiting cell proliferation (41). In addition, miR-376a-3p serves a key
role in colorectal cancer (CRC). Titin-antisense RNA1 (TTN-AS1), a
lncRNA, sponges miR-376a-3p, which upregulates the expression of
Krüppel-like factor 15 and promotes the progression of CRC. By
inhibiting miR-376a-3p, TTN-AS1 can increase the proliferation and
invasion of CRC cells (42).
Similarly, in thyroid cancer, miR-376a-3p has been identified to be
inhibitory. The lncRNA LINC00488 regulates the expression of
paraoxonase 2, and promotes the proliferation and migration of
thyroid cancer cells by binding to miR-376a-3p, whereas the
overexpression of miR-376a-3p can inhibit these processes (43). However, in NB, to the best of our
knowledge, there is no clear information regarding the role of
miR-376a-3p. In the present study, it was identified that
miR-376a-3p overexpression promoted SH-SY5Y cell viability,
migration and invasion. Further molecular mechanism studies
revealed that RP11-196G11.6 regulates the activity of its
downstream target gene RYBP by targeting and inhibiting the
expression of miR-376a-3p. The dual luciferase assay results
confirmed the interaction between RP11-196G11.6 and miR-376a-3p,
and revealed that miR-376a-3p was able to directly target the RYBP
gene. Notably, the subsequent experiments revealed that the
overexpression of miR-376a-3p partially reversed the inhibition of
SH-SY5Y cell viability, migration and invasion induced by
RP11-196G11.6 overexpression. These findings imply that
RP11-196G11.6 may regulate the miR-376a-3p/RYBP pathway to inhibit
NB progression.
Notably, CIBERSORT analysis revealed that
RP11-196G11.6 expression was significantly correlated with the
ratio of Tfhs in the tumor microenvironment. The enrichment of
Tregs is often associated with the immunosuppressive
microenvironment and tumor immune escape (44,45),
while Tfhs may influence the antitumor immune response by
modulating B-cell function, which affects the antitumor immune
response (46). Whether
RP11-196G11.6 indirectly regulates immune cell infiltration through
the miR-376a-3p/RYBP axis remains to be further explored. In
addition, aberrant expression of RYBP may affect tumor
cell-microenvironment interactions through epigenetic
reprogramming, which provides a potential direction for future
studies.
RYBP has been reported to inhibit cell
proliferation, migration and invasion in a variety of tumors, in
particular by regulating the EGFR signaling pathway (47,48).
In lung cancer studies, RYBP suppresses tumor progression and
metastasis by inhibiting EGFR signaling and EMT. As core EMT
markers, vimentin and E-cadherin are key in tumor biology, where
EMT enables cancer cells to acquire migratory, invasive and
metastatic properties (49).
E-cadherin, as a key epithelial cell adhesion molecule, is often
markedly downregulated or absent during the EMT process, leading to
the dissociation of intercellular junction structures, thus making
tumor cells more likely to detach from the primary site and enter a
migratory and invasive state (50).
By contrast, vimentin, a mesenchymal cytoskeletal protein, is
markedly upregulated during the EMT process. This change helps
enhance the motility and morphological plasticity of cells, thereby
promoting their invasive and metastatic potential (51). Particularly, overexpression of RYBP
has been shown to reduce the phosphorylation level of EGFR and its
downstream signaling molecules, thereby inhibiting cell
proliferation and migration (52).
In addition, RYBP expression has been identified to be negatively
associated with tumor invasiveness, and to inhibit tumor cell
proliferation and migration by suppressing the EGFR signaling
pathway. These results implied that by controlling the EGFR
signaling pathway, RYBP may have an inhibitory effect on a range of
malignancies (53). The findings of
the present study demonstrated that RP11-196G11.6 overexpression
blocked the EGFR pathway and increased RYBP expression.
Overexpression of RP11-196G11.6 suppressed vimentin protein
expression and promoted E-cadherin protein expression. These
findings suggest that by influencing the EGFR pathway and mediating
EMT, the RP11-196G11.6/miR-376a-3p/RYBP axis may have an impact on
the invasive metastasis of NB tumors.
Although the present study initially elucidated the
function and mechanism of RP11-196G11.6, certain limitations still
exist. The present study lacked the validation of clinical data and
animal models, and was based on cell line models. Therefore,
further external validation methods should be performed in the
future. Second, it remains unclear as to whether RP11-196G11.6 is
directly regulated by MYCN transcription and this requires further
experimental verification. Lastly, whether RYBP inhibits the
progression of NB by suppressing the EGFR signaling pathway still
requires in-depth analysis. In addition, the role of RP11-196G11.6
in the prognosis of NB with MYCN amplification will be explored in
future studies, with the aim of identifying additional potential
markers for prognostic assessment.
In conclusion, to the best of our knowledge, the
present study was the first to demonstrate the key function of
RP11-196G11.6 in NB. Through the regulation of miR-376a-3p and its
target gene RYBP, RP11-196G11.6 may promote apoptosis, and inhibit
NB cell viability, migration and invasion. Therefore, RP11-196G11.6
could potentially be a novel target for therapeutic intervention in
NB.
Supplementary Material
Supporting Data
Acknowledgements
Not applicable.
Funding
The present study was supported in part by the Key Project of
the National Key R&D Plan ‘Research on Prevention and Control
of Major Chronic Non-Communicable Diseases’, the Ministry of
Science and Technology of the People's Republic of China (grant
nos. 2018YFC1313000 and 2018YFC1313004).
Availability of data and materials
The data generated in the present study may be
requested from the corresponding author.
Authors' contributions
JZha was responsible for the overall conception and
design of the present study and wrote the manuscript. KH and JZho
performed most of the experiments and the data analysis. WL and FL
collected the data. ZZ reviewed and revised the manuscript, and
performed the bioinformatics analyses, including figure generation
and statistical analysis. SW prepared research ideas, obtained
funding and revised the manuscript, and was responsible for
interpretation of the experimental findings and statistical
analysis. JZHa and KH confirm the authenticity of all the raw data.
All authors read and approved the final manuscript.
Ethics approval and consent to
participate
The present study was approved by the Ethical
Committee of Guizhou Provincial People's Hospital (approval no.
2025-104; Guizhou, China) and written informed consent was obtained
from the parents of all participants before enrollment in the
present study.
Patient consent for publication
Not applicable.
Competing interests
The authors declare that they have no competing
interests.
References
|
1
|
Irwin MS and Park JR: Neuroblastoma:
Paradigm for precision medicine. Pediatr Clin North Am. 62:225–256.
2015. View Article : Google Scholar : PubMed/NCBI
|
|
2
|
Suh E, Stratton KL, Leisenring WM, Nathan
PC, Ford JS, Freyer DR, McNeer JL, Stock W, Stovall M, Krull KR, et
al: Late mortality chronic health conditions in long-term survivors
of early-adolescent, young adult cancers: A retrospective cohort
analysis from the childhood cancer survivor study. Lancet Oncol.
21:421–435. 2020. View Article : Google Scholar : PubMed/NCBI
|
|
3
|
Ponzoni M, Bachetti T, Corrias MV,
Brignole C, Pastorino F, Calarco E, Bensa V, Giusto E, Ceccherini I
and Perri P: Recent advances in the developmental origin of
neuroblastoma: An overview. J Exp Clin Cancer Res. 41:922022.
View Article : Google Scholar : PubMed/NCBI
|
|
4
|
Körber V, Stainczyk SA, Kurilov R, Henrich
KO, Hero B, Brors B, Westermann F and Höfer T: Neuroblastoma arises
in early fetal development and its evolutionary duration predicts
outcome. Nat Genet. 55:619–630. 2023. View Article : Google Scholar : PubMed/NCBI
|
|
5
|
Monclair T, Brodeur GM, Ambros PF, Brisse
HJ, Cecchetto G, Holmes K, Kaneko M, London WB, Matthay KK,
Nuchtern JG, et al: The international neuroblastoma risk group
(INRG) staging system: An INRG task force report. J Clin Oncol.
27:298–303. 2009. View Article : Google Scholar : PubMed/NCBI
|
|
6
|
Castel V, García-Miguel P, Cañete A,
Melero C, Navajas A, Ruíz-Jiménez JI, Navarro S and Badal MD:
Prospective evaluation of the international neuroblastoma staging
system (INSS) and the international neuroblastoma response criteria
(INRC) in a multicentre setting. Eur J Cancer. 35:606–611. 1999.
View Article : Google Scholar : PubMed/NCBI
|
|
7
|
Shimada H, Ambros IM, Dehner LP, Hata J,
Joshi VV, Roald B, Stram DO, Gerbing RB, Lukens JN, Matthay KK and
Castleberry RP: The international neuroblastoma pathology
classification (the Shimada system). Cancer. 86:364–372. 1999.
View Article : Google Scholar : PubMed/NCBI
|
|
8
|
Pinto NR, Applebaum MA, Volchenboum SL,
Matthay KK, London WB, Ambros PF, Nakagawara A, Berthold F,
Schleiermacher G, Park JR, et al: Advances in risk classification
and treatment strategies for neuroblastoma. J Clin Oncol.
33:3008–3017. 2015. View Article : Google Scholar : PubMed/NCBI
|
|
9
|
Steliarova-Foucher E, Colombet M, Ries
LAG, Moreno F, Dolya A, Bray F, Hesseling P, Shin HY and Stiller
CA: IICC-3 contributors: International incidence of childhood
cancer, 2001-10: A population-based registry study. Lancet Oncol.
18:719–731. 2017. View Article : Google Scholar : PubMed/NCBI
|
|
10
|
Diede SJ: Spontaneous regression of
metastatic cancer: Learning from neuroblastoma. Nat Rev Cancer.
14:71–72. 2014. View Article : Google Scholar : PubMed/NCBI
|
|
11
|
Brodeur GM, Seeger RC, Schwab M, Varmus HE
and Bishop JM: Amplification of N-myc in untreated human
neuroblastomas correlates with advanced disease stage. Science.
224:1121–1124. 1984. View Article : Google Scholar : PubMed/NCBI
|
|
12
|
Ruiz-Pérez MV, Henley AB and
Arsenian-Henriksson M: The MYCN protein in health and disease.
Genes (Basel). 8:1132017. View Article : Google Scholar : PubMed/NCBI
|
|
13
|
Huang M and Weiss WA: Neuroblastoma and
MYCN. Cold Spring Harb Perspect Med. 3:a0144152013. View Article : Google Scholar : PubMed/NCBI
|
|
14
|
Taniue K and Akimitsu N: The functions and
unique features of LncRNAs in cancer development and tumorigenesis.
Int J Mol Sci. 22:6322021. View Article : Google Scholar : PubMed/NCBI
|
|
15
|
Yang R, Liu N, Li T, Liu F, Zhang J, Zhao
H, Zou L and He X: LncRNA AC142119.1 facilitates the progression of
neuroblastoma by epigenetically initiating the transcription of
MYCN. J Transl Med. 21:6592023. View Article : Google Scholar : PubMed/NCBI
|
|
16
|
Hsu CL, Yin CF, Chang YW, Fan YC, Lin SH,
Wu YC, Huang HC and Juan HF: LncRNA SNHG1 regulates neuroblastoma
cell fate via interactions with HDAC1/2. Cell Death Dis.
13:8092022. View Article : Google Scholar : PubMed/NCBI
|
|
17
|
Hu Z, Xu W, Wang H, Li M, Wang J, Sun C
and Yang X: CARM1-induced lncRNA NEAT1 synchronously activates MYCN
and GalNAcT-I to accelerate the progression of neuroblastoma. Gene.
938:1491642025. View Article : Google Scholar : PubMed/NCBI
|
|
18
|
Kim D, Pertea G, Trapnell C, Pimentel H,
Kelley R and Salzberg SL: TopHat2: Accurate alignment of
transcriptomes in the presence of insertions, deletions and gene
fusions. Genome Biol. 14:R362013. View Article : Google Scholar : PubMed/NCBI
|
|
19
|
Robinson MD, McCarthy DJ and Smyth GK:
edgeR: A bioconductor package for differential expression analysis
of digital gene expression data. Bioinformatics. 26:139–140. 2010.
View Article : Google Scholar : PubMed/NCBI
|
|
20
|
Liu S, Wang Z, Chen D, Zhang B, Tian RR,
Wu J, Zhang Y, Xu K, Yang LM, Cheng C, et al: Annotation and
cluster analysis of spatiotemporal- and sex-related lncRNA
expression in rhesus macaque brain. Genome Res. 27:1608–1620. 2017.
View Article : Google Scholar : PubMed/NCBI
|
|
21
|
Trapnell C, Roberts A, Goff L, Pertea G,
Kim D, Kelley DR, Pimentel H, Salzberg SL, Rinn JL and Pachter L:
Differential gene and transcript expression analysis of RNA-seq
experiments with TopHat and Cufflinks. Nat Protoc. 7:562–578. 2012.
View Article : Google Scholar : PubMed/NCBI
|
|
22
|
Sturm G, Finotello F and List M:
Immunedeconv: An R package for unified access to computational
methods for estimating immune cell fractions from bulk
RNA-sequencing data. Methods Mol Biol. 2120:223–232. 2020.
View Article : Google Scholar : PubMed/NCBI
|
|
23
|
Langfelder P and Horvath S: WGCNA: An R
package for weighted correlation network analysis. BMC
Bioinformatics. 9:5592008. View Article : Google Scholar : PubMed/NCBI
|
|
24
|
Xie C, Mao X, Huang J, Ding Y, Wu J, Dong
S, Kong L, Gao G, Li CY and Wei L: KOBAS 2.0: A web server for
annotation and identification of enriched pathways and diseases.
Nucleic Acids Res. 39((Web Server Issue)): W316–W322. 2011.
View Article : Google Scholar : PubMed/NCBI
|
|
25
|
Livak KJ and Schmittgen TD: Analysis of
relative gene expression data using real-time quantitative PCR and
the 2(−Delta Delta C(T)) method. Methods. 25:402–408. 2001.
View Article : Google Scholar : PubMed/NCBI
|
|
26
|
Tan K, Zhang X, Cong X, Huang B, Chen H
and Chen D: Tumor suppressor RYBP harbors three nuclear
localization signals and its cytoplasm-located mutant exerts more
potent anti-cancer activities than corresponding wild type. Cell
Signal. 29:127–137. 2017. View Article : Google Scholar : PubMed/NCBI
|
|
27
|
Zhu X, Yan M, Luo W, Liu W, Ren Y, Bei C,
Tang G, Chen R and Tan S: Expression and clinical significance of
PcG-associated protein RYBP in hepatocellular carcinoma. Oncol
Lett. 13:141–150. 2017. View Article : Google Scholar : PubMed/NCBI
|
|
28
|
Morinaka T, Sakai N, Takayashiki T, Kuboki
S, Takano S, Ohira G, Matsubara H and Ohtsuka M: RYBP contributes
to improved prognosis in colorectal cancer via regulation of cell
cycle, apoptosis and oxaliplatin sensitivity. Int J Oncol.
63:1202023. View Article : Google Scholar : PubMed/NCBI
|
|
29
|
Zafar A, Wang W, Liu G, Wang X, Xian W,
McKeon F, Foster J, Zhou J and Zhang R: Molecular targeting
therapies for neuroblastoma: Progress and challenges. Med Res Rev.
41:961–1021. 2021. View Article : Google Scholar : PubMed/NCBI
|
|
30
|
Qiu B and Matthay KK: Advancing therapy
for neuroblastoma. Nat Rev Clin Oncol. 19:515–533. 2022. View Article : Google Scholar : PubMed/NCBI
|
|
31
|
Floros KV, Cai J, Jacob S, Kurupi R,
Fairchild CK, Shende M, Coon CM, Powell KM, Belvin BR, Hu B, et al:
MYCN-amplified neuroblastoma is addicted to iron and vulnerable to
inhibition of the system Xc-/glutathione axis. Cancer Res.
81:1896–1908. 2021. View Article : Google Scholar : PubMed/NCBI
|
|
32
|
Vaid R, Thombare K, Mendez A,
Burgos-Panadero R, Djos A, Jachimowicz D, Lundberg KI, Bartenhagen
C, Kumar N, Tümmler C, et al: METTL3 drives telomere targeting of
TERRA lncRNA through m6A-dependent R-loop formation: A therapeutic
target for ALT-positive neuroblastoma. Nucleic Acids Res.
52:2648–2671. 2024. View Article : Google Scholar : PubMed/NCBI
|
|
33
|
Heward JA and Lindsay MA: Long non-coding
RNAs in the regulation of the immune response. Trends Immunol.
35:408–419. 2014. View Article : Google Scholar : PubMed/NCBI
|
|
34
|
Otte J, Dyberg C, Pepich A and Johnsen JI:
MYCN function in neuroblastoma development. Front Oncol.
10:6240792021. View Article : Google Scholar : PubMed/NCBI
|
|
35
|
Braoudaki M, Hatziagapiou K, Zaravinos A
and Lambrou GI: MYCN in neuroblastoma: ‘Old wine into new
wineskins’. Diseases. 78:782021. View Article : Google Scholar
|
|
36
|
Chen L and Tweddle DA: p53, SKP2, and DKK3
as MYCN target genes and their potential therapeutic significance.
Front Oncol. 28:1732012.PubMed/NCBI
|
|
37
|
Kobayashi K, Jakt LM and Nishikawa SI:
Epigenetic regulation of the neuroblastoma genes, Arid3b and Mycn.
Oncogene. 32:2640–2648. 2013. View Article : Google Scholar : PubMed/NCBI
|
|
38
|
Weiss WA, Aldape K, Mohapatra G,
Feuerstein BG and Bishop JM: Targeted expression of MYCN causes
neuroblastoma in transgenic mice. EMBO J. 16:2985–1995. 1997.
View Article : Google Scholar : PubMed/NCBI
|
|
39
|
Winkle M, van den Berg A, Tayari M,
Sietzema J, Terpstra M, Kortman G, de Jong D, Visser L, Diepstra A,
Kok K and Kluiver J: Long noncoding RNAs as a novel component of
the Myc transcriptional network. FASEB J. 29:2338–2346. 2015.
View Article : Google Scholar : PubMed/NCBI
|
|
40
|
Zhang Q, Wei J, Li N and Liu B: LINC00839
promotes neuroblastoma progression by sponging miR-454-3p to
Up-regulate NEUROD1. Neurochem Res. 47:2278–2293. 2022. View Article : Google Scholar : PubMed/NCBI
|
|
41
|
Xin X, Xu Z, Wei J and Zhang Y:
MiR-376a-3p increases cell apoptosis in acute myeloid leukemia by
targeting MT1X. Cancer Biol Ther. 23:234–242. 2022. View Article : Google Scholar : PubMed/NCBI
|
|
42
|
Wang Y, Jiang F, Xiong Y, Cheng X, Qiu Z
and Song R: LncRNA TTN-AS1 sponges miR-376a-3p to promote
colorectal cancer progression via upregulating KLF15. Life Sci.
244:1169362020. View Article : Google Scholar : PubMed/NCBI
|
|
43
|
Xie F, Li L, Luo Y, Chen R and Mei J: Long
non-coding RNA LINC00488 facilitates thyroid cancer cell
progression through miR-376a-3p/PON2. Biosci Rep.
41:BSR202016032021. View Article : Google Scholar : PubMed/NCBI
|
|
44
|
Shan F, Somasundaram A, Bruno TC, Workman
CJ and Vignali DAA: Therapeutic targeting of regulatory T cells in
cancer. Trends Cancer. 8:944–961. 2022. View Article : Google Scholar : PubMed/NCBI
|
|
45
|
Yan S, Zhang Y and Sun B: The function and
potential drug targets of tumour-associated Tregs for cancer
immunotherapy. Sci China Life Sci. 62:179:1862019. View Article : Google Scholar
|
|
46
|
Overacre-Delgoffe AE, Bumgarner HJ, Cillo
AR, Burr AHP, Tometich JT, Bhattacharjee A, Bruno TC, Vignali DAA
and Hand TW: Microbiota-specific T follicular helper cells drive
tertiary lymphoid structures and anti-tumor immunity against
colorectal cancer. Immunity. 54:2812–2824.e4. 2021. View Article : Google Scholar : PubMed/NCBI
|
|
47
|
Zhou H, Li J, Zhang Z, Ye R, Shao N,
Cheang T and Wang S: RING1 and YY1 binding protein suppresses
breast cancer growth and metastasis. Int J Oncol. 49:2442–2452.
2016. View Article : Google Scholar : PubMed/NCBI
|
|
48
|
Xian Y, Wang L, Yao B, Yang W, Mo H, Zhang
L and Tu K: MicroRNA-769-5p contributes to the proliferation,
migration and invasion of hepatocellular carcinoma cells by
attenuating RYBP. Biomed Pharmacother. 118:1093432019. View Article : Google Scholar : PubMed/NCBI
|
|
49
|
Ganesan K, Xu C, Wu S, Sui Y, Du B, Zhang
J, Gao F, Chen J and Tang H: Ononin inhibits tumor bone metastasis
and osteoclastogenesis by targeting mitogen-activated protein
kinase pathway in breast cancer. Research (Wash D C).
7:05532024.PubMed/NCBI
|
|
50
|
Zeng Y, Du W, Huang Z, Wu S, Ou X, Zhang
J, Peng C, Sun X and Tang H: Hsa_circ_0060467 promotes breast
cancer liver metastasis by complexing with eIF4A3 and sponging
miR-1205. Cell Death Discov. 9:1532023. View Article : Google Scholar : PubMed/NCBI
|
|
51
|
Han M, Yang J, Chen P, Li S, Tang H, Fan
H, Wang Y, Li X, Pan W, Koutouratsas V, et al: Isocucurbitacin B
inhibits gliomas through the promotion of anoikis by targeting
caveolin 1. Cancer Lett. 629:2178732025. View Article : Google Scholar : PubMed/NCBI
|
|
52
|
Dinglin X, Ding L, Li Q, Liu Y, Zhang J
and Yao H: RYBP inhibits progression and metastasis of lung cancer
by suppressing EGFR signaling and epithelial-mesenchymal
transition. Transl Oncol. 10:280–287. 2017. View Article : Google Scholar : PubMed/NCBI
|
|
53
|
Tong AH, Tan J, Zhang JH, Xu FJ, Li FY and
Cao CY: Overexpression of RYBP inhibits proliferation, invasion,
and chemoresistance to cisplatin in anaplastic thyroid cancer cells
via the EGFR pathway. J Biochem Mol Toxicol. 33:e222412019.
View Article : Google Scholar : PubMed/NCBI
|