Introduction
Breast cancer, a common type of cancer, is
widespread among women (1).
Globally, breast cancer accounts for approximately one-third of all
malignant tumors in women, with its mortality rate representing
~15% of the total diagnosed cases (2). Breast cancer has surpassed lung cancer
in terms of incidence and has become the leading form of cancer
globally, far exceeding other types of cancer in women; the
incidence rate of breast cancer is approximately 2-fold the
combined incidence rate of cervical, ovarian and endometrial cancer
(2). In China, ~429,105 new cancer
cases and 43,780 mortalities due to breast cancer were reported in
2022, with an earlier onset age than that of Western countries, and
the peak incidence was between 45 and 55 years of age (3). Although early detection and increased
awareness of cancer prevention have led to decreased mortality, the
disease's incidence rates rose by 1% each year from 2012 to 2021
(1). Thus, understanding the
nosogenesis of breast cancer and identifying powerful new
biomarkers are necessary for the treatment and prognosis of breast
cancer.
Human epidermal growth factor receptor 2 (HER2)
belongs to the same family of epidermal growth factor receptors
(4). HER2 activation has been
demonstrated to significantly promote the occurrence of cancer
(5). HER2 is linked to unfavorable
outcomes in human breast cancer, including increased risk of early
recurrence and metastasis (6).
HER2-positive breast cancer is a highly invasive malignant disease
(7). Due to considering HER2 as a
therapeutic target for breast cancer and advances in HER2-targeted
therapy, the prognosis of patients with HER2-positive breast cancer
has been changed, and with improved anti-HER2-targeted therapy,
patient survival time has significantly increased (8,9).
However, an increasing recognition of the frequent occurrence of
tumors with low or heterogeneous HER2 exists (10). Thus, understanding HER2 is of utmost
importance for the treatment of breast cancer.
The present study aimed to screen HER2-related
indicators, build a prognostic risk model to predict breast cancer
prognosis, and identify potential chemotherapeutics for
HER2-positive breast cancer. The current findings provide a
foundation for the treatment and prognosis of HER2-positive breast
cancer.
Materials and methods
Data collection and preprocessing
The Cancer Genome Atlas (TCGA) database (http://gdc.cancer.gov) was used to retrieve
TCGA-breast invasive carcinoma (BRCA) gene expression and clinical
data. After data pre-processing, 741 TCGA breast cancer samples
were obtained for subsequent analysis. In addition, clinical
information from the GSE7390 dataset was acquired from the Gene
Expression Omnibus (GEO) database (https://www.ncbi.nlm.nih.gov/). After excluding
specimens with an overall survival (OS) time of 0 days or missing
survival data (due to data unavailability or inability to obtain),
a total of 198 breast cancer samples were included in the
analysis.
Prognosis and clinical feature
analyses
Kaplan-Meier survival curves were generated using
the R package ‘survival’ (Version 3.2-13; http://bioconductor.org/packages/survivalr/)
(11), with statistical comparisons
performed by log-rank test. The Kaplan-Meier analysis was employed
to evaluate the association between different HER2 sample groups
(negative and positive) and OS. In addition, the association
between HER2 and clinical data of breast cancer cases was evaluated
by χ2 or Fisher's exact tests.
Tumor microenvironment (TME)
The Cell-type Identification By Estimating Relative
Subsets Of RNA Transcripts (CIBERSORT) (https://cibersort.stanford.edu/index.php) (12), Single-sample Gene Set Enrichment
Analysis (ssGSEA) (http://www.bioconductor.org/packages/release/bioc/html/ssGSEA.html)
(13) and xCELL (https://github.com/dviraran/xCell) (14) algorithms were adopted to assess the
score of immune cells according to the mRNA expression matrix of
breast cancer samples. The ‘ESTIMATE’ package (http://127.0.0.1:29606/library/estimate/html/estimateScore.html)
(15) in R was employed to obtain
stromal, immune and ESTIMATE fractions. The expression data of
checkpoint genes, human leukocyte antigen family genes and
chemokine genes were extracted from the breast cancer expression
data, and the differences in expression levels between negative-
and positive-HER2 sample groups were compared using the Wilcoxon
rank-sum test.
Mutation analysis
Based on breast cancer sample mutation information,
the mutation status of each gene in the samples was counted, genes
were sorted in descending order by the number of mutations and then
the TOP 20 genes with the highest mutations were selected for
mutation display. Furthermore, the mutation frequency of the top 20
genes was analyzed using the ‘maftools’ package (Version 2.8.0)
(https://bioconductor.org/packages/release/bioc/html/maftools.html)
(16). In addition, the tumor
mutation burden (TMB) of all cancer samples was determined, and the
discrepancy in TMB values between the HER2-negative and -positive
groups was analyzed.
Drug sensitivity analysis
The sensitivity of all cases to chemotherapy agents
was assessed based on data obtained from the Genomics of Drug
Sensitivity in Cancer database (https://www.cancerrxgene.org/), and the half maximal
inhibitory concentration (IC50) was quantified with the
‘pRRophetic’ package (https://github.com/paulgeeleher/pRRophetic) (17). Differences in the IC50
values of 138 chemotherapeutics between HER2-negative and -positive
groups were analyzed using the Wilcoxon rank-sum test.
Immunotherapy response
The Tumor Immune Dysfunction and Exclusion (TIDE)
database (http://tide.dfci.harvard.edu/) was used to analyze the
response of patients to immune checkpoint treatment, which was
represented as the TIDE score. In addition, the immunophenoscore
(IPS) was used to determine the scores of the four different immune
phenotypes (namely, inhibitory cells, effector cells, antigen
presentation and checkpoints). Furthermore, the Gene Set Variation
Analysis algorithm was employed to evaluate the tertiary lymphoid
structure (TLS) scores of TLS feature genes [such as CC motif
chemokine ligand (CCL)2, CCL3 and CCL4]. Finally, the differences
in TIDE, IPS and TLS scores between HER2-negative and -positive
groups were analyzed using the Wilcoxon rank-sum test.
GSEA
GSEA (http://bioconductor.org/packages/release/bioc/html/GSVA.html)
(18) was used to assess the
significant enrichment pathways of hallmark gene sets (h.all.v7.4.
symbols) between HER2-negative and -positive groups with
P<0.05 and |(Normalized Enrichment Score|>1.
Identification of differentially
expressed genes (DEGs)
To identify HER2-specific genes, differential
expression analysis was performed between HER2-positive and
HER2-negative samples using the ‘limma’ package (Version 3.34.7)
(https://
bioconductor.org/packages/release/bioc/html/limma.html)
(19). This analysis generated
gene-specific P-values, logFC (log2 fold change), and
other relevant metrics. Additionally, the limma package was
employed to perform an empirical Bayes moderated t-test/F-test. The
resulting P-values were sorted and adjusted using the Benjamini and
Hochberg method to obtain false discovery rate (FDR)/q-values,
thereby controlling the overall FDR. DEGs meeting |log2
fold-change|≥0.585 and adj. P<0.05 were used for subsequent
analyses. In addition, enrichment analysis of DEGs was performed
through the ‘clusterProfiler’ package (Version 4.0.5) (http://bioconductor.org/packages/release/bioc/html/clusterProfiler.html)
(20) in R, with a threshold of
count >2 and adj. P<0.05.
Construction of a prognostic risk
model
Univariate Cox regression analysis of DEGs was
performed using the Kaplan-Meier ‘survival’ package (http://bioconductor.org/packages/survivalr/) (11) with a critical value of P<0.05 to
identify genes associated with prognosis. The least absolute
shrinkage and selection operator (LASSO) is a
dimensionality-reduction method that has shown advantages over
regression analysis in evaluating high-dimensional data. LASSO is
an improvement of linear regression that achieves feature selection
and complexity control by adding a penalty term. For parameter
optimization, LASSO provides two criteria: i) ‘min’ selects the
model achieving minimum cross-validation error within allowable
variance; and ii) ‘1se’ (one standard error rule) chooses the most
parsimonious model whose performance is statistically
indistinguishable from the ‘min’ model, effectively balancing
accuracy and simplicity. This algorithm can determine the optimal
penalty coefficient based on the minimum likelihood deviation and
10-fold cross validation (21).
Therefore, LASSO (21) was used to
identify key genes. The risk score was constructed using stepwise
Cox regression analysis with the survminer package in R (Version
0.4.9) (https://cran.rstudio.com/web/packages/survminer/index.html).
The formula is as follows: RiskScore=h (t,X)=h0 (t) ×
exp (β1X1 + β2X2 + ...
+ βnXn), where β indicates the regression
coefficient; h0(t), the benchmark risk function; and h
(t,X) the risk role related to X (covariate) at time t. All
specimens were classified into high- and low-risk groups according
to the median RiskScores. Survival analysis was performed using the
Kaplan-Meier curve method with the log-rank test for statistical
comparison between groups. To evaluate the diagnostic performance
of feature genes, receiver operating characteristic (ROC) curves
and the area under the curve (AUC) were plotted across all
datasets, including both training and validation sets.
Nomogram construction
The association between RiskScores and
clinicopathological data (such as age and stage) was investigated,
and univariate and multivariate Cox regression analyses were
performed to screen for useful prognostic features, with a
threshold of P<0.05. Next, the ‘rms’ package (Version 6.2-0)
(https://cran.r-project.org/web/packages/rms/index.html)
(22) was further utilized to
construct a nomogram.
Association analysis of RiskScore and
immunity
The ‘ssGSEA’ and ‘CIBERSORT’ algorithms were
employed to evaluate the proportional distribution of immune cells
between different risk groups. Spearman correlation analysis was
performed using the ‘ggcor’ package (Version 0.9.8.1) (https://pan.baidu.com/s/1S6w93IjfO6sU8IHGvvCa1w)
(23) to assess the association
between RiskScore and immune cell infiltration.
Characteristics of key genes
The associations between the expression levels of
key genes were determined with the ‘ggplot2’ package (Version
3.3.5) (https://github.com/tidyverse/ggplot2) (24), while the ‘RCircos’ package (Version
1.2.2) (https://github.com/hzhanghenry/RCircos) (25) was employed to draw the mutation gene
plot of key genes. The Kaplan-Meier curve was used to assess the
survival of patients. The log-rank test was employed to determine
the statistical significance of differences between survival curves
with a P-value threshold of <0.05.
Single-cell analysis
Based on a single-cell RNA sequencing database
focused on the TME accessed through the Tumor Immune Single-cell
Hub (TISCH) database (http://tisch.comp-genomics.org), scRNA-seq data from
GSE161529 (26) were analyzed.
Detailed cell type annotation was performed at the single-cell
level for subsequent analysis of specific gene expression across
distinct cell populations (27).
Reverse transcription-quantitative PCR
(RT-qPCR)
Six HER2-negative and six HER2-positive breast
cancer samples were collected from May 1, 2023, to December 31,
2023, at Weifang Hospital of Traditional Chinese Medicine (Weifang,
China). The enrolled patients ranged in age from 32 to 69 years,
and all samples were obtained through surgical resection. The
Ethics Committee of Weifang Hospital of Traditional Chinese
Medicine approved the present study (approval no. WF2023-428). All
the participants provided written informed consent.
For RT-qPCR, total RNA was extracted from tissue
samples using an RNeasy Kit (Qiagen, Inc. cat. no. 74104) according
to the manufacturer's protocol. According to the manufacturer's
instructions, the RNA samples were reverse transcribed into cDNA
using an QuantiTect Reverse Transcription Kit (cat. no. 205311;
Qiagen GmbH), and qPCR was performed using a CFX96 Bio-Rad system
(Bio-Rad Laboratories, Inc.) with SYBR Green I fluorophore (cat.
no. 1708882; Bio-Rad Laboratories, Inc.). The thermocycling
conditions were as follows: Initial denaturation at 95°C for 3 min,
followed by 40 cycles of 95°C for 10 sec and 60°C for 30 sec, with
a final melting curve analysis from 65°C to 95°C in 0.5°C
increments. The primer sequences, which were designed and
synthesized by Sangon Biotech Co., Ltd., are listed in Table I. The internal reference gene for
normalization was GAPDH. Each sample was analyzed in three
technical replicates, and the relative levels of key genes were
analyzed by the 2−ΔΔCq method (28).
 | Table I.Primer sequences. |
Table I.
Primer sequences.
| Gene | Sequence
(5′-3′) |
|---|
| ETFA (F) |
ACAAAGGCACTCTAGCCACC |
| ETFA (R) |
GTCCAAGAGTGTCACCAGGG |
| RAPGEFL1 (F) |
AGGGGCTGCTTCAAGAGGA |
| RAPGEFL1 (R) |
CCCTGGTAAAGGGACTCGT |
| KRT7 (F) |
CGGTGAGGACAAGGAACCTG |
| KRT7 (R) |
CCTTGGAGCAGGAATCAGCA |
| CD24 (F) |
TTCTCCAAGCACCCAGCA |
| CD24 (R) |
TGGAATAAATCTGCGTGGGTA |
| PRR15L (F) |
GACTTTAACACCCGCCTGGA |
| PRR15L (R) |
TGAAGCGTCCTGAGTTGGAG |
| ALOX15B (F) |
CCACCCTCTCTTCAAGTCCAC |
| ALOX15B (R) |
CTTGGAGAAGATCTCTCTGACCC |
| ELOVL2 (F) |
AAGCTGACATCCGGGTAG |
| ELOVL2 (R) |
TGTCCACAAGGTATCCAGTT |
| CXCL9 (F) |
GGCTTTGGAAGCCATGTGAT |
| CXCL9 (R) |
GAAGAGCTGACTTGAATGAAGCAA |
| GAPDH (F) |
GTCTCCTCTGACTTCAACAGCG |
| GAPDH (R) |
ACCACCCTGTTGCTGTAGCCAA |
Cell culture and transfection
The HER2-positive breast cancer cell lines BT474
(cat. no. TCHu143) and SKBR-3 (cat. no. TCHu225) (29), and the HER2-negative breast cancer
cell line MDA-MB-468 (cat. no. TCHu136) (30) were purchased from The Cell Bank of
Type Culture Collection of The Chinese Academy of Sciences. All
cells were cultured in RPMI 1640 medium (cat. no. 11875093; Gibco;
Thermo Fisher Scientific, Inc.) containing 10% fetal bovine serum
(FBS; cat. no. 10099141; Gibco; Thermo Fisher Scientific, Inc.) in
an incubator with 5% CO2 at 37°C. Cells at logarithmic
proliferation stage were transfected. The ELOVL2 overexpression
plasmid (OE-ELOVL2) and its negative control (NC-ELOVL2) were
constructed using the pCMV6-AC-GFP vector backbone (cat. no.
YC-13849RJ) by Shanghai Yaji Biotechnology Co., Ltd., and then
transfected into cells using Lipofectamine™ 2000 (cat.
no. 11668019; Invitrogen; Thermo Fisher Scientific, Inc.) at a
concentration of 2 µg per 1×10⁶ cells. After 6 h of
transfection, the complete medium was replaced and the cells were
further cultured for 48 h. The transfected cells were then
collected for subsequent experiments.
Cell Counting Kit (CCK-8) cytotoxicity
assay
BT474 and SKBR-3 cells were inoculated into 96-well
plates with 1×10⁴ cells per well in a ~100 µl
suspension, and cultured in a 5% CO2 incubator at 37ºC
in triplicate wells. After the cells reached 80–90% confluence (as
observed by phase-contrast microscopy), CCK-8 reagent (cat. no.
CK04; Dojindo Laboratories, Inc.) was added, and incubated at 37°C
for 2 h. Next, the absorption value at 450 nm was measured using a
microplate reader (ELx800; BioTek Instruments; Agilent
Technologies, Inc.), and the cytotoxicity curves of the cells at
different times were plotted. The experiment was repeated three
times independently.
Western blotting
Cells were lysed using RIPA buffer (cat. no. P0013B;
Beyotime Institute of Biotechnology) supplemented with 1 mM PMSF to
extract the total proteins from each group. SDS-PAGE was performed
with 30 µg protein loaded per lane on 10% polyacrylamide gels after
determining the protein concentration in each group using a BCA kit
(cat. no. 23225; Thermo Fisher Scientific, Inc.). After
electrophoresis, the proteins were transferred onto a PVDF
membrane, which was then blocked with 5% bovine serum albumin
(MilliporeSigma) for 1 h at 37°C. Next, primary antibodies against
PI3K (p110 alpha) (1:1,000; cat. no. 4255; Cell Signaling
Technology, Inc.), phosphorylated (p)-PI3K recognizing p85
(Tyr458)/p55 (Tyr199) (E3U1H) (1:1,000; cat. no. 17366; Cell
Signaling Technology, Inc.), AKT (pan) (11E7) (1:1,000; cat. no.
4685; Cell Signaling Technology, Inc.), p-AKT (Ser473) (D9E)
XP® (1:1,000; cat. no. 4060; Cell Signaling Technology,
Inc.) and GAPDH (used as a loading control for normalization)
(1:10,000; cat. no. 2118; Cell Signaling Technology, Inc.) were
added and incubated at 4°C overnight. After that, the membranes
were washed thoroughly to remove unbound primary antibodies,
followed by incubation with the corresponding secondary antibody
[Goat Anti-Rabbit IgG(H+L) (peroxidase/HRP conjugated); 1:10,000,
cat. no. E-AB-1003; Wuhan Elabscience Biotechnology Co., Ltd.; and
Goat Anti-Mouse IgG (H+L) (peroxidase/HRP conjugated); 1:10,000;
cat. no. E-AB-1001; Wuhan Elabscience Biotechnology Co., Ltd.] at
room temperature for 1 h. Next, a laser imager (Typhoon FLA 9500;
GE Healthcare) was used for scanning with ECL Plus Western Blotting
Substrate (Thermo Fisher Scientific, Inc.), and the gray values
were analyzed after normalization to GAPDH as a loading
control.
Statistical analysis
R software (SPSS 22.0) and GraphPad software
(version 7.0; GraphPad; Dotmatics) were used for data processing,
statistical analyses and plotting. Survival curves were constructed
using the Kaplan-Meier method, and the log-rank test was employed
to compare survival differences between groups, provided the
proportional hazards assumption held. For time-to-event data with
intermediate events, the two-stage survival analysis method from
the Two Stage Hazard Rate Comparison package (Version 0.1-6) was
applied when the proportional hazards assumption was violated.
One-way analysis of variance was performed to assess overall
differences, followed by pairwise comparisons between groups using
Tukey's honestly significant difference test. In Table II, continuous variables with normal
distribution are presented as the mean ± standard deviation, with
intergroup comparisons assessed using unpaired Student's t-test;
while skewed data are reported as median (interquartile range) and
were compared via Mann-Whitney U test or Kruskal-Wallis H test
followed by Dunn's multiple comparison post hoc test. Categorical
variables are expressed as counts and percentages, with comparisons
analyzed using χ2 or Fisher's exact tests. Unpaired All
statistical tests were two-sided and P<0.05 was considered to
indicate a statistically significant difference.
| Table II.Association between clinical
characteristics and HER2 expression. |
Table II.
Association between clinical
characteristics and HER2 expression.
|
Characteristics | Negative | Positive | Total | P-value |
|---|
| ER status, n
(%) |
|
|
|
6.00×10⁻³ |
|
Indeterminate | 0 (0.00) | 2 (0.28) | 2 (0.28) |
|
|
Negative | 138 (19.27) | 31 (4.33) | 169 (23.60) |
|
|
Positive | 471 (65.78) | 74 (10.34) | 545 (76.12) |
|
| PR status, n
(%) |
|
|
|
4.00×10⁻³ |
|
Indeterminate | 4 (0.56) | 0 (0.00) | 4 (0.56) |
|
|
Negative | 181 (25.31) | 49 (6.85) | 230 (32.17) |
|
|
Positive | 423 (59.16) | 58 (8.11) | 481 (67.27) |
|
| Age, years |
|
|
| 0.71 |
| Mean ±
SD | 57.83±13.15 | 58.37±13.21 | 57.91±13.15 |
|
| Median
(range) | 58.00
(26.00-90.00) | 58.00
(27.00-90.00) | 58.00
(26.00-90.00) |
|
| M stage, n (%) |
|
|
| 0.62 |
| M0 | 620 (83.78) | 107 (14.46) | 727 (98.24) |
|
| M1 | 12 (1.62) | 1 (0.14) | 13 (1.76) |
|
| N stage, n (%) |
|
|
|
3.00×10⁻³ |
| N0 | 329 (44.16) | 37 (4.97) | 366 (49.13) |
|
| N1 | 195 (26.17) | 50 (6.71) | 245 (32.89) |
|
| N2 | 80 (10.74) | 14 (1.88) | 94 (12.62) |
|
| N3 | 32 (4.30) | 8 (1.07) | 40 (5.37) |
|
| T stage, n (%) |
|
|
| 0.11 |
| T1 | 180 (24.26) | 19 (2.56) | 199 (26.82) |
|
| T2 | 368 (49.60) | 74 (9.97) | 442 (59.57) |
|
| T3 | 63 (8.49) | 10 (1.35) | 73 (9.84) |
|
| T4 | 22 (2.96) | 6 (0.81) | 28 (3.77) |
|
| AJCC stage, n
(%) |
|
|
|
2.00×10⁻³ |
| I | 124 (17.06) | 6 (0.82) | 130 (17.88) |
|
| II | 348 (47.87) | 71 (9.77) | 419 (57.63) |
|
|
III | 135 (18.57) | 29 (3.99) | 164 (22.56) |
|
| IV | 13 (1.79) | 1 (0.14) | 14 (1.93) |
|
| DFS time,
months |
|
|
| 0.40 |
| Mean ±
SD | 41.07±39.64 | 37.74±31.88 | 40.56±38.55 |
|
| Median
(range) | 28.50
(0.16-281.29) | 23.34
(0.03-139.17) | 28.44
(0.03-281.29) |
|
| DFS status, n
(%) |
|
|
| 0.34 |
|
Disease-free | 504 (77.18) | 93 (14.24) | 597 (91.42) |
|
|
Recurred/Progressed | 49 (7.50) | 7 (1.07) | 56 (8.58) |
|
| DSS tim,
months |
|
|
| 0.21 |
| Mean ±
SD | 43.78±41.74 | 39.16±35.24 | 43.10±40.87 |
|
| Median
(range) | 31.36
(0.16-282.90) | 24.79
(0.03-212.25) | 31.00
(0.03-282.90) |
|
| DSS status, n
(%) |
|
|
| 0.44 |
|
Alive | 572 (78.25) | 102 (13.95) | 674 (92.20) |
|
|
Deceased | 52 (7.11) | 5 (0.68) | 57 (7.80) |
|
| MSIsensor
score |
|
|
| 0.75 |
| Mean ±
SD | 0.65±2.01 | 0.44±0.61 | 0.62±1.87 |
|
| Median
(range) | 0.26
(0.00-32.92) | 0.28
(0.00-4.09) | 0.26
(0.00-32.92) |
|
| Mutation count,
n |
|
|
|
3.00×10⁻⁶ |
| Mean ±
SD | 81.15±271.60 | 116.03±413.31 | 86.26±296.53 |
|
| Median
(range) | 37.00
(2.00-5,400.00) | 53.00
(17.00-4,259.00) | 40.00
(2.00-5,400.00) |
|
| OS time,
months |
|
|
| 0.21 |
| Mean ±
SD | 43.77±41.71 | 39.16±35.24 | 43.10±40.84 |
|
| Median
(range) | 31.54
(0.16-282.90) | 24.79
(0.03-212.25) | 31.00
(0.03-282.90) |
|
| OS status, n
(%) |
|
|
| 0.88 |
|
Alive | 547 (73.42) | 95 (12.75) | 642 (86.17) |
|
|
Deceased | 89 (11.95) | 14 (1.88) | 103 (13.83) |
|
| PFS time,
months |
|
|
| 0.20 |
| Mean ±
SD | 40.93±38.60 | 36.66±31.51 | 40.30±37.66 |
|
| Median
(range) | 28.77
(0.16-281.29) | 21.83
(0.03-139.17) | 28.44
(0.03-281.29) |
|
| PFS status n
(%) |
|
|
| 0.45 |
|
Censored | 546 (73.39) | 98 (13.17) | 644 (86.56) |
|
|
Progression | 89 (11.96) | 11 (1.48) | 100 (13.44) |
|
| TMB, n |
|
|
|
3.10×10⁻⁵ |
| Mean ±
SD | 2.75±9.02 | 3.94±13.76 | 2.92±9.86 |
|
| Median
(range) | 1.30
(0.00-180.83) | 1.77
(0.00-142.67) | 1.40
(0.00-180.83) |
|
Results
Prognosis and analysis of clinical
features
As shown in Fig.
1A-D, no statistically significant differences were observed in
prognosis between HER2-negative and -positive groups. Analysis of
the association between clinical traits and HER2 suggested that
HER2 was significantly associated with ER status, PR status, N
stage, American Joint Committee on Cancer (AJCC) stage, mutation
count and TMB (Table II).
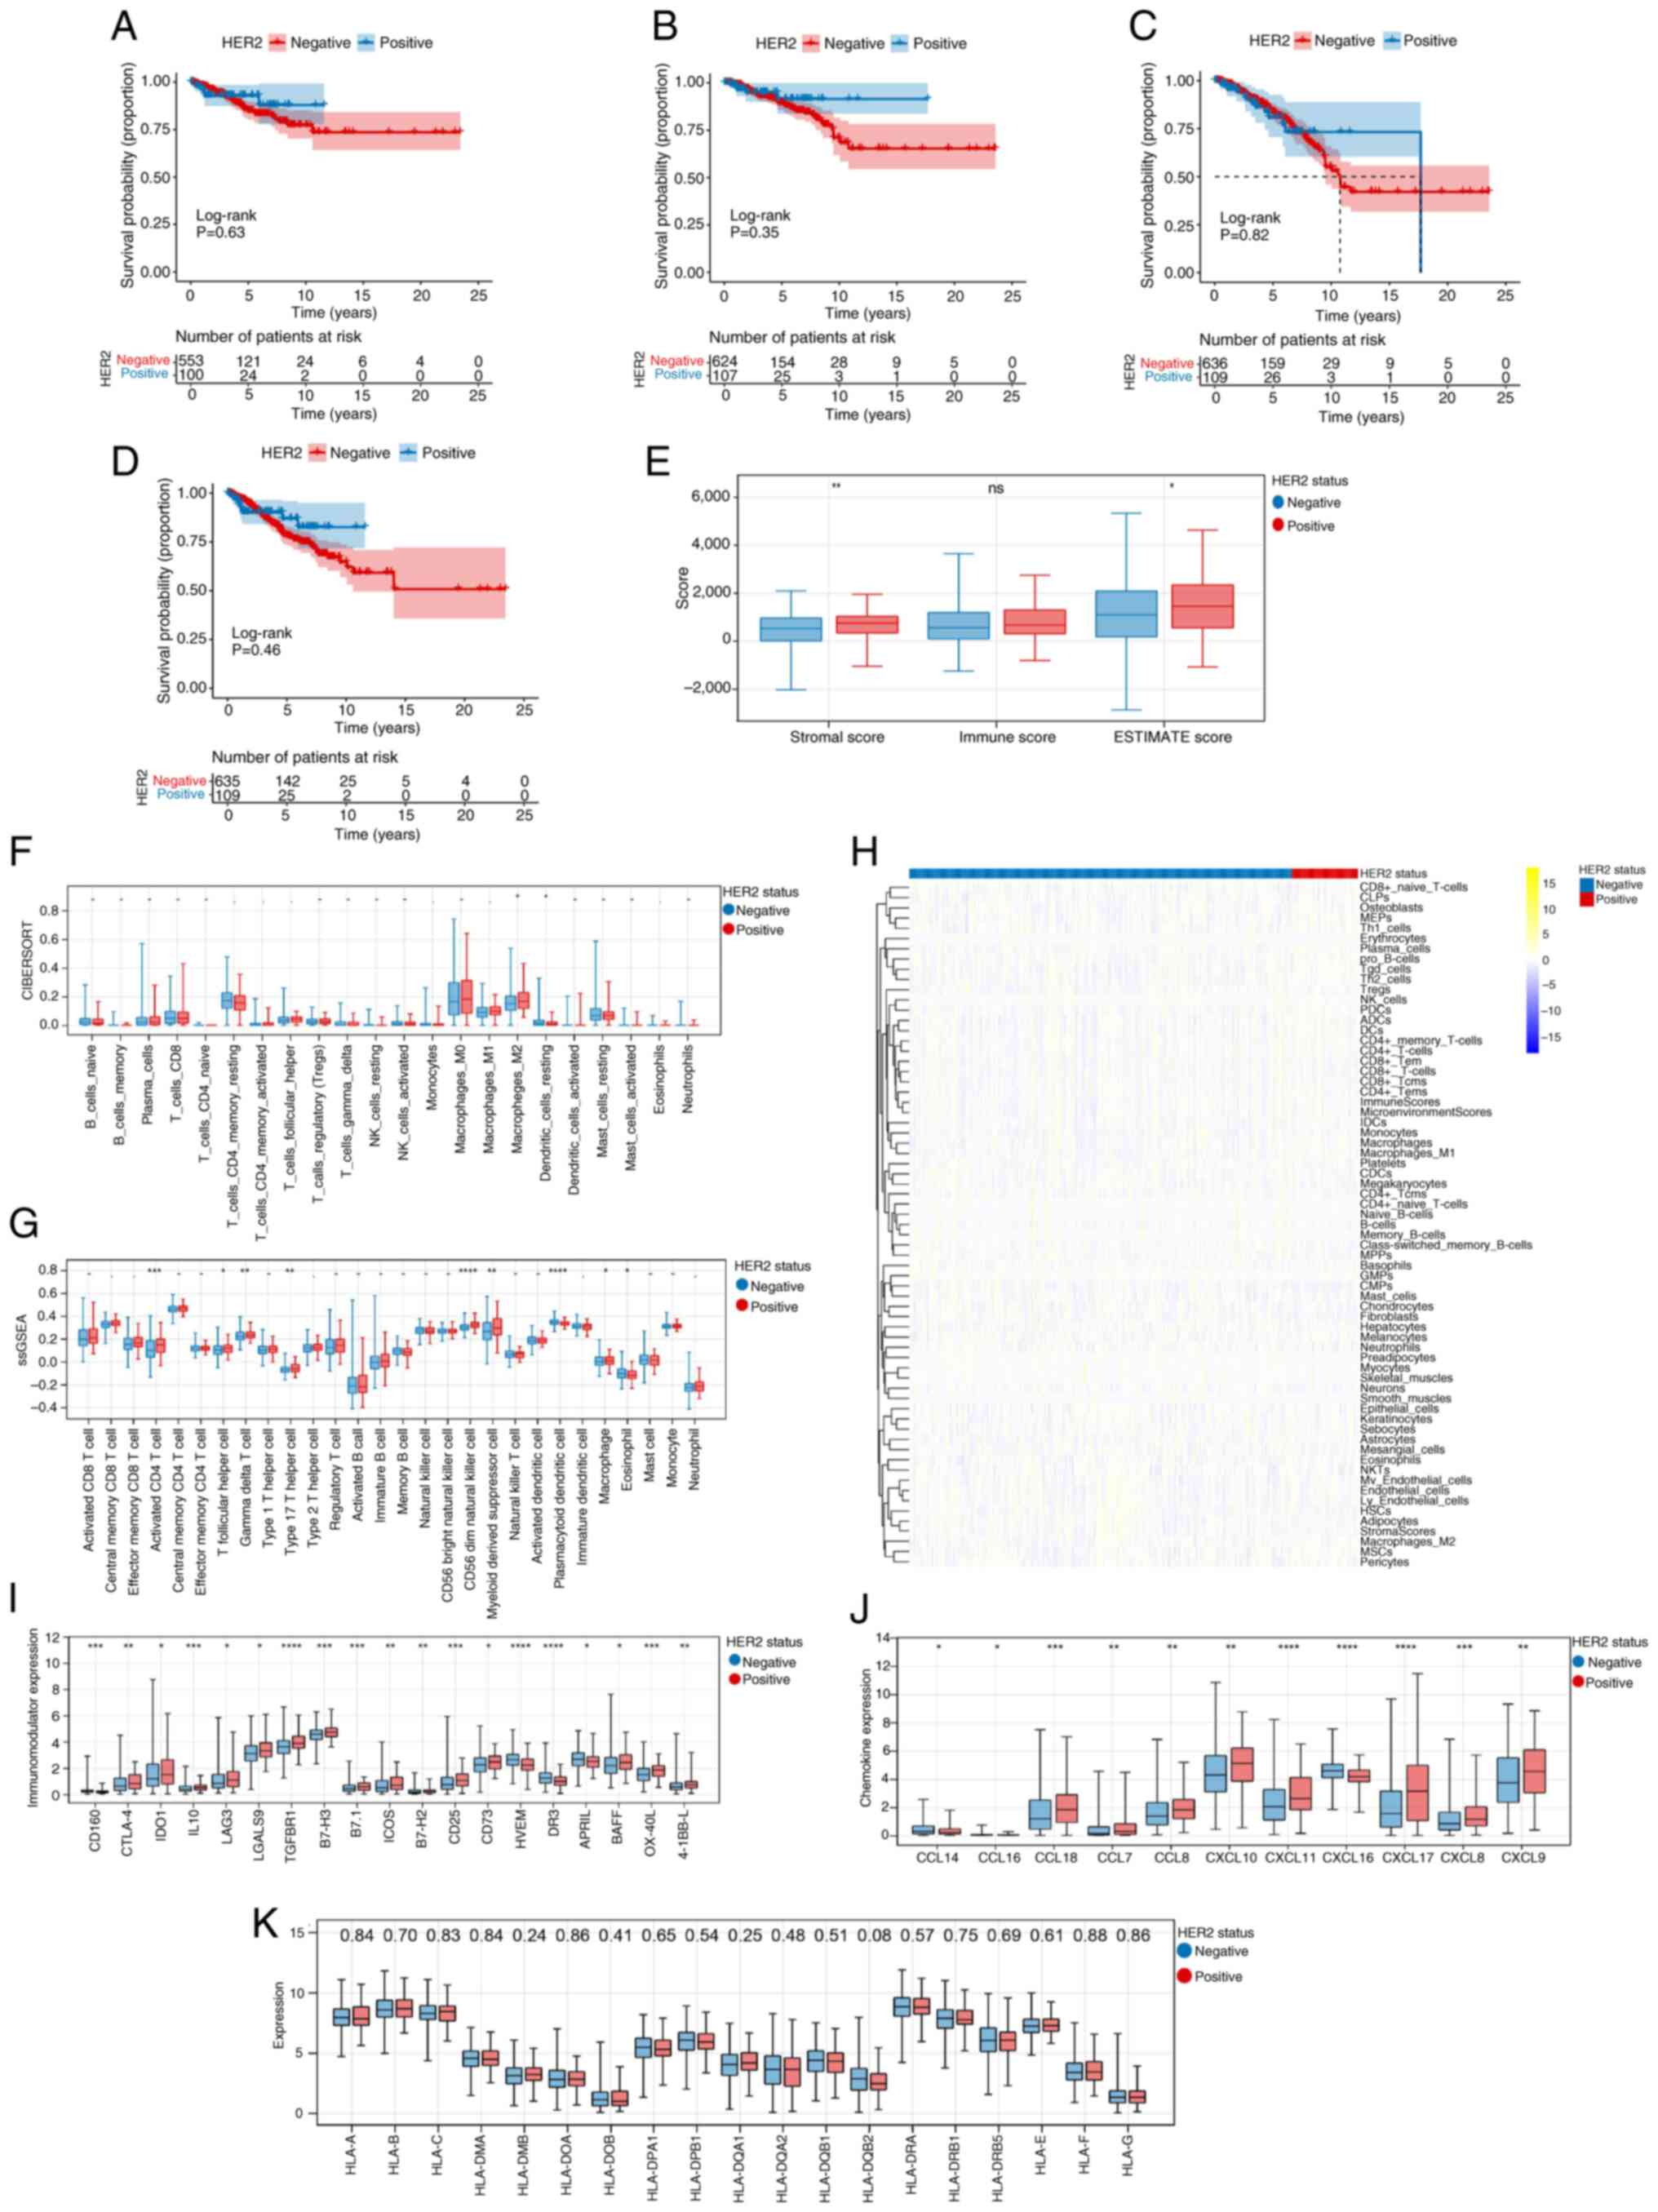 | Figure 1.Prognosis, clinical features and
tumor microenvironment analysis. Kaplan-Meier curves of (A)
disease-free survival, (B) disease-specific survival, (C) overall
survival and (D) progression-free survival in HER2-negative and
positive groups. Note: Survival curves were constructed using the
Kaplan-Meier method, and the log-rank test was employed to compare
survival differences between groups, provided the proportional
hazards assumption held. The two-stage survival analysis method
from the two-stage Hazard Rate Comparison package was applied when
this assumption was violated. (E) Differences in stromal, immune
and ESTIMATE scores between HER2-negative and positive groups. The
(F) ‘CIBERSORT’, (G) ‘Single-sample Gene Set Enrichment Analysis
(ssGSEA)’ and (H) ‘xCELL’ algorithms revealed the fraction of
immune cells in the HER2-negative and -positive groups. The numbers
displayed in the yellow/blue legend represent the standardized
expression levels (Z-scores). Differences in (I) Immunomodulator
expression levels, (J) chemokine genes and (K) HLA family genes
between HER2-negative and -positive groups. The numerical values
displayed at the top of the panel refer to P-values. *P<0.05,
**P<0.01, ***P<0.001, ****P<0.0001. ns, -, and . indicate
no significant difference; HER2, human epidermal growth factor
receptor 2; CIBERSORT, Cell-type Identification By Estimating
Relative Subsets Of RNA Transcripts; ssGSEA, single-sample Gene Set
Enrichment Analysis; NK, natural killer; T helper; HLA, human
leukocyte antigen; CCL, Chemokine (C-C motif) ligand; CXCL,
Chemokine (C-X-C motif) ligand; CLP, common lymphoid progenitors;
MEP, megakaryocyte-erythroid progenitors; Th, T helper cells; Tgd,
Tgd-like cells; iDC, immature dendritic cells; cDC, conventional
dendritic cells; MPP, multipotent progenitors; GMP,
granulocyte-macrophage progenitors; CMP, common myeloid
progenitors; NKT, natural killer T-cells; mv, mv-like cells; HSC,
hematopoietic stem cells; MSC, mesenchymal stem cells; Tregs,
regulatory T cells. |
TME
Fig. 1E shows that
the Stromal and ESTIMATE scores in HER2-positive group were higher
than those in the HER2-negative group. Moreover, the ‘CIBERSORT’
algorithm revealed that the fraction of M2 macrophages and resting
dendritic cells showed significant differences between the
different HER2 groups (Fig. 1F).
Additionally, the ‘ssGSEA’ and ‘xCELL’ algorithms revealed that
there were 9 types (Activated CD4 T cell, T follicular helper cell,
Gamma delta T cell, Type 17 T helper cell, CD56 bright natural
killer cell, Myeloid derived suppressor cell, Plasmacytoid
dendritic cell, Macrophage and Eosinophil) and 20 types of immune
cells, respectively, which showed marked differences between
different HER2 groups (Fig. 1G and
H, respectively). The present study also identified 19 immune
regulatory genes (Fig. 1I) and 11
chemokine genes (Fig. 1J) that
exhibited remarkable differences between the HER2-negative and
-positive groups. Fig. 1K
demonstrates the differential expression of HLA family genes across
distinct HER2 status groups.
Mutation analysis, immunotherapy
response and drug sensitivity analysis
Based on the TCGA-derived mutational profiles,
gene-specific mutation frequencies across breast cancer cohorts
were systematically analyzed. Fig. 2A
and B illustrates the hierarchical distribution of the top 20
most frequently mutated genes, with Fig. 2A and B demonstrating distinct
mutational landscapes between HER2-negative and HER2-positive
subtypes, respectively. Mutation analysis showed that, compared
with those of the HER2-negative group, the TMB values of the top 20
genes in the HER2-positive group were higher (Fig. 2C). Fig.
2D shows the top three chemotherapeutic drugs with significant
differences between the two groups. In addition, no significant
difference was observed in the TIDE score among the HER2-positive
and -negative groups, whereas the interferon γ score in the
HER2-positive group was higher than that in the HER2-negative group
(Fig. 2E). The data showed
remarkable discrepancies in the effector cell, immunosuppressive
cells and immune checkpoint IPS scores among the different HER2
groups (Fig. 2F). In addition, the
TLS scores showed remarkable differences among the HER2-positive
and -negative groups (Fig. 2G).
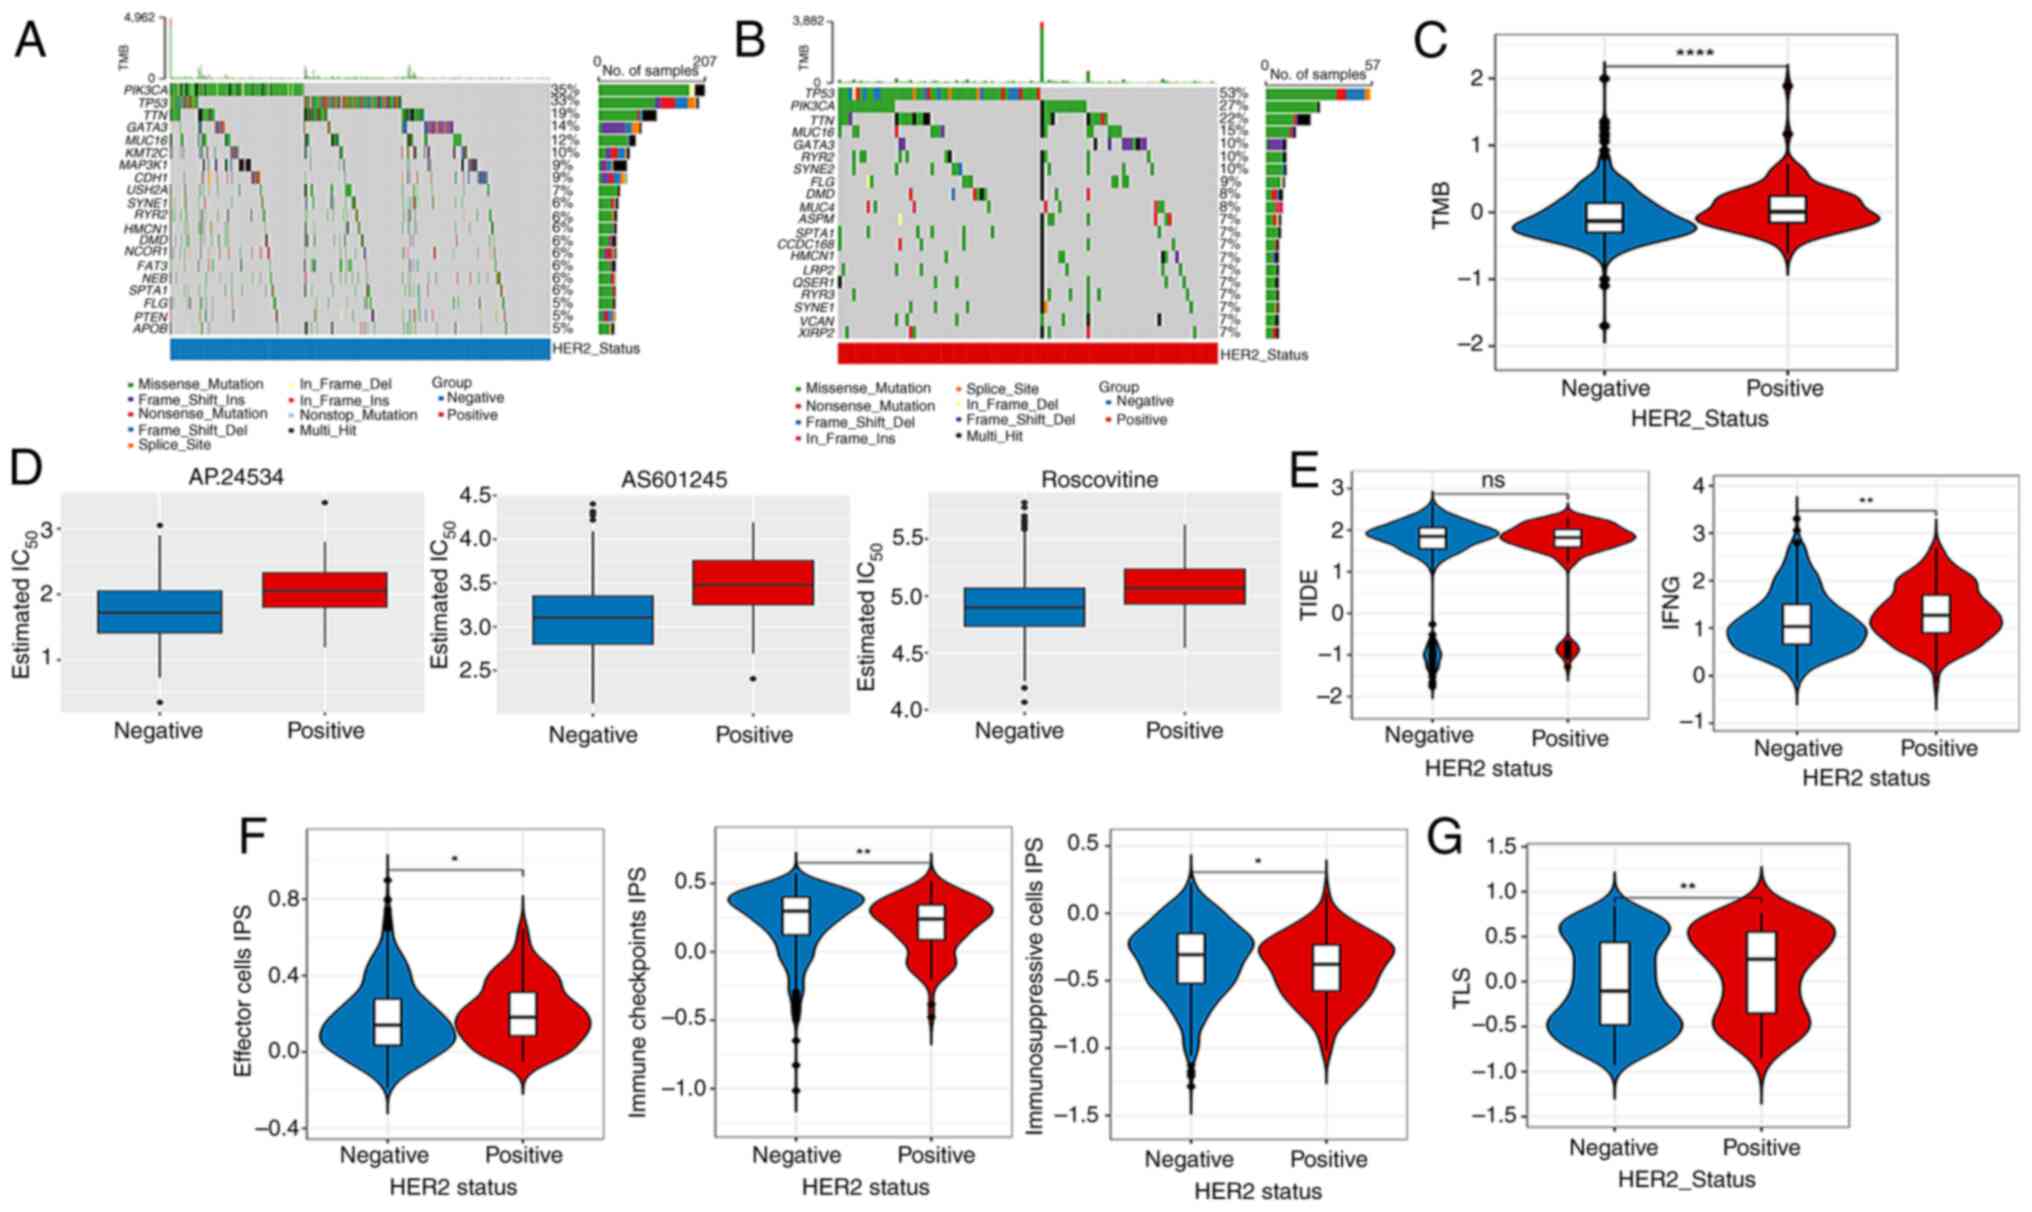 | Figure 2.Mutation analysis, drug sensitivity
analysis and immunotherapy response. Top 20 mutation genes in (A)
HER2-negative and (B) -positive samples. (C) Differences in TMB
values between the HER2-negative and -positive groups. (D) Top 3
chemotherapeutics with notable differences in their IC50
between the HER2-negative and -positive groups. Differences in (E)
TIDE, IFNG, (F) IPS, (G) TLS scores between HER2-negative and
-positive groups. ns, no obvious difference, *P<0.05,
**P<0.01, ****P<0.0001. ns, no significant difference; TMB,
tumor mutation burden; HER2, human epidermal growth factor receptor
2; Ins, insertion; Del, deletion; IC50, half maximal
inhibitory concentration; TIDE, Tumor Immune Dysfunction and
Exclusion; IFNG, interferon γ; IPS, immunophenoscore; TLS, tertiary
lymphoid structure. |
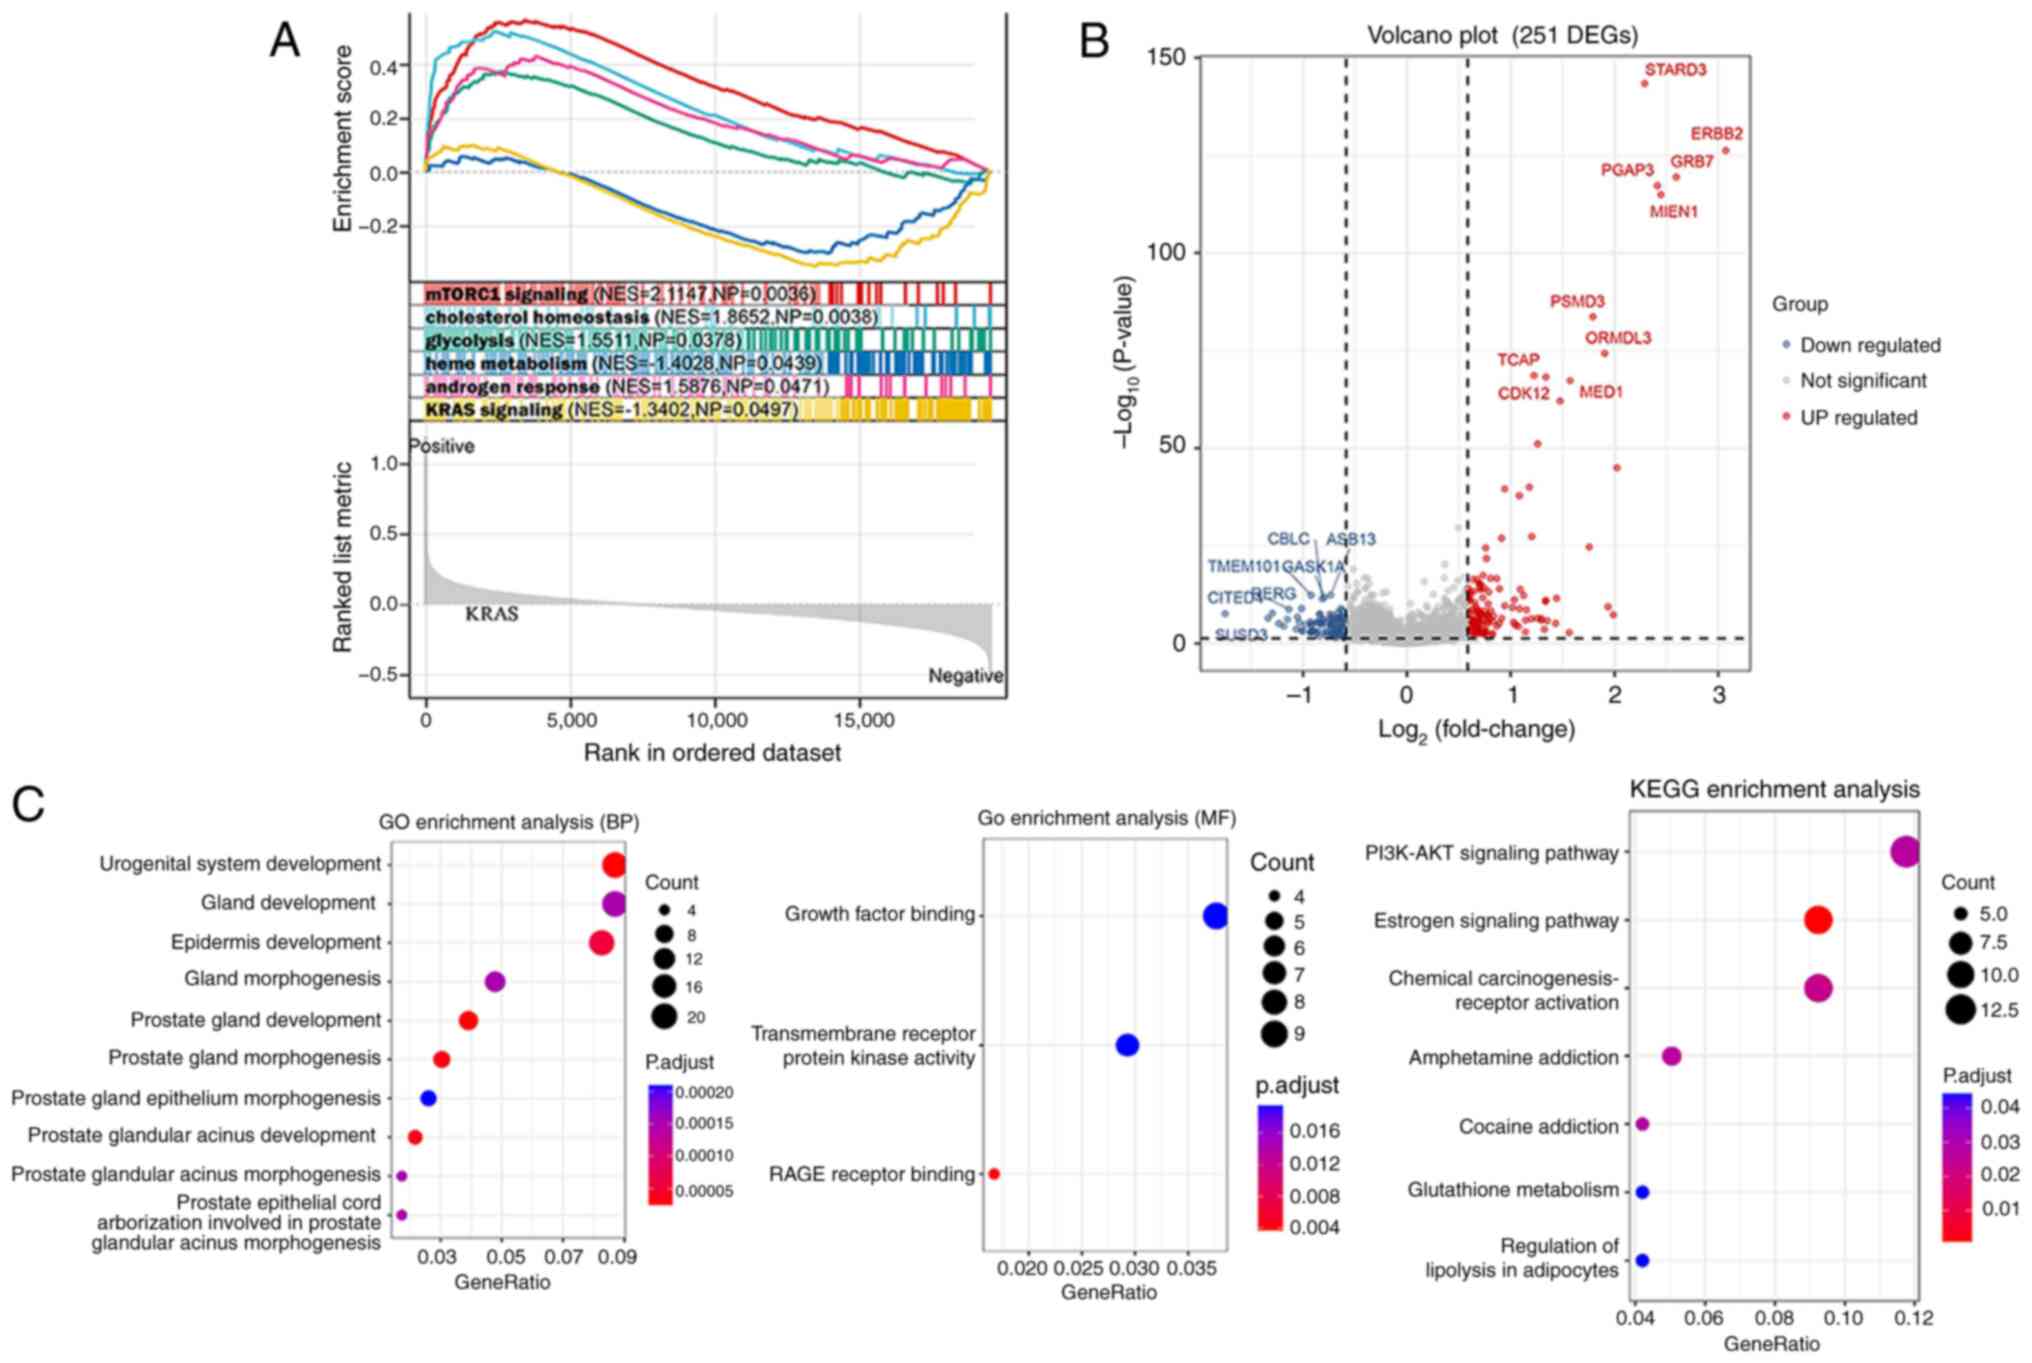
Enrichment analysis
GSEA identified six pathways of hallmark gene sets
between different HER2 groups, namely, mTORC1 signaling,
cholesterol homeostasis, glycolysis, heme metabolism, androgen
response and KRAS signaling (Fig.
3A). A total of 251 DEGs between different HER2 groups were
screened (Fig. 3B), and these DEGs
were enriched in the GO terms of urogenital system development and
RAGE receptor binding, and were involved in the following KEGG
pathways: Estrogen signaling pathway, chemical
carcinogenesis-receptor activation and PI3K-AKT signaling pathway
(Fig. 3C).
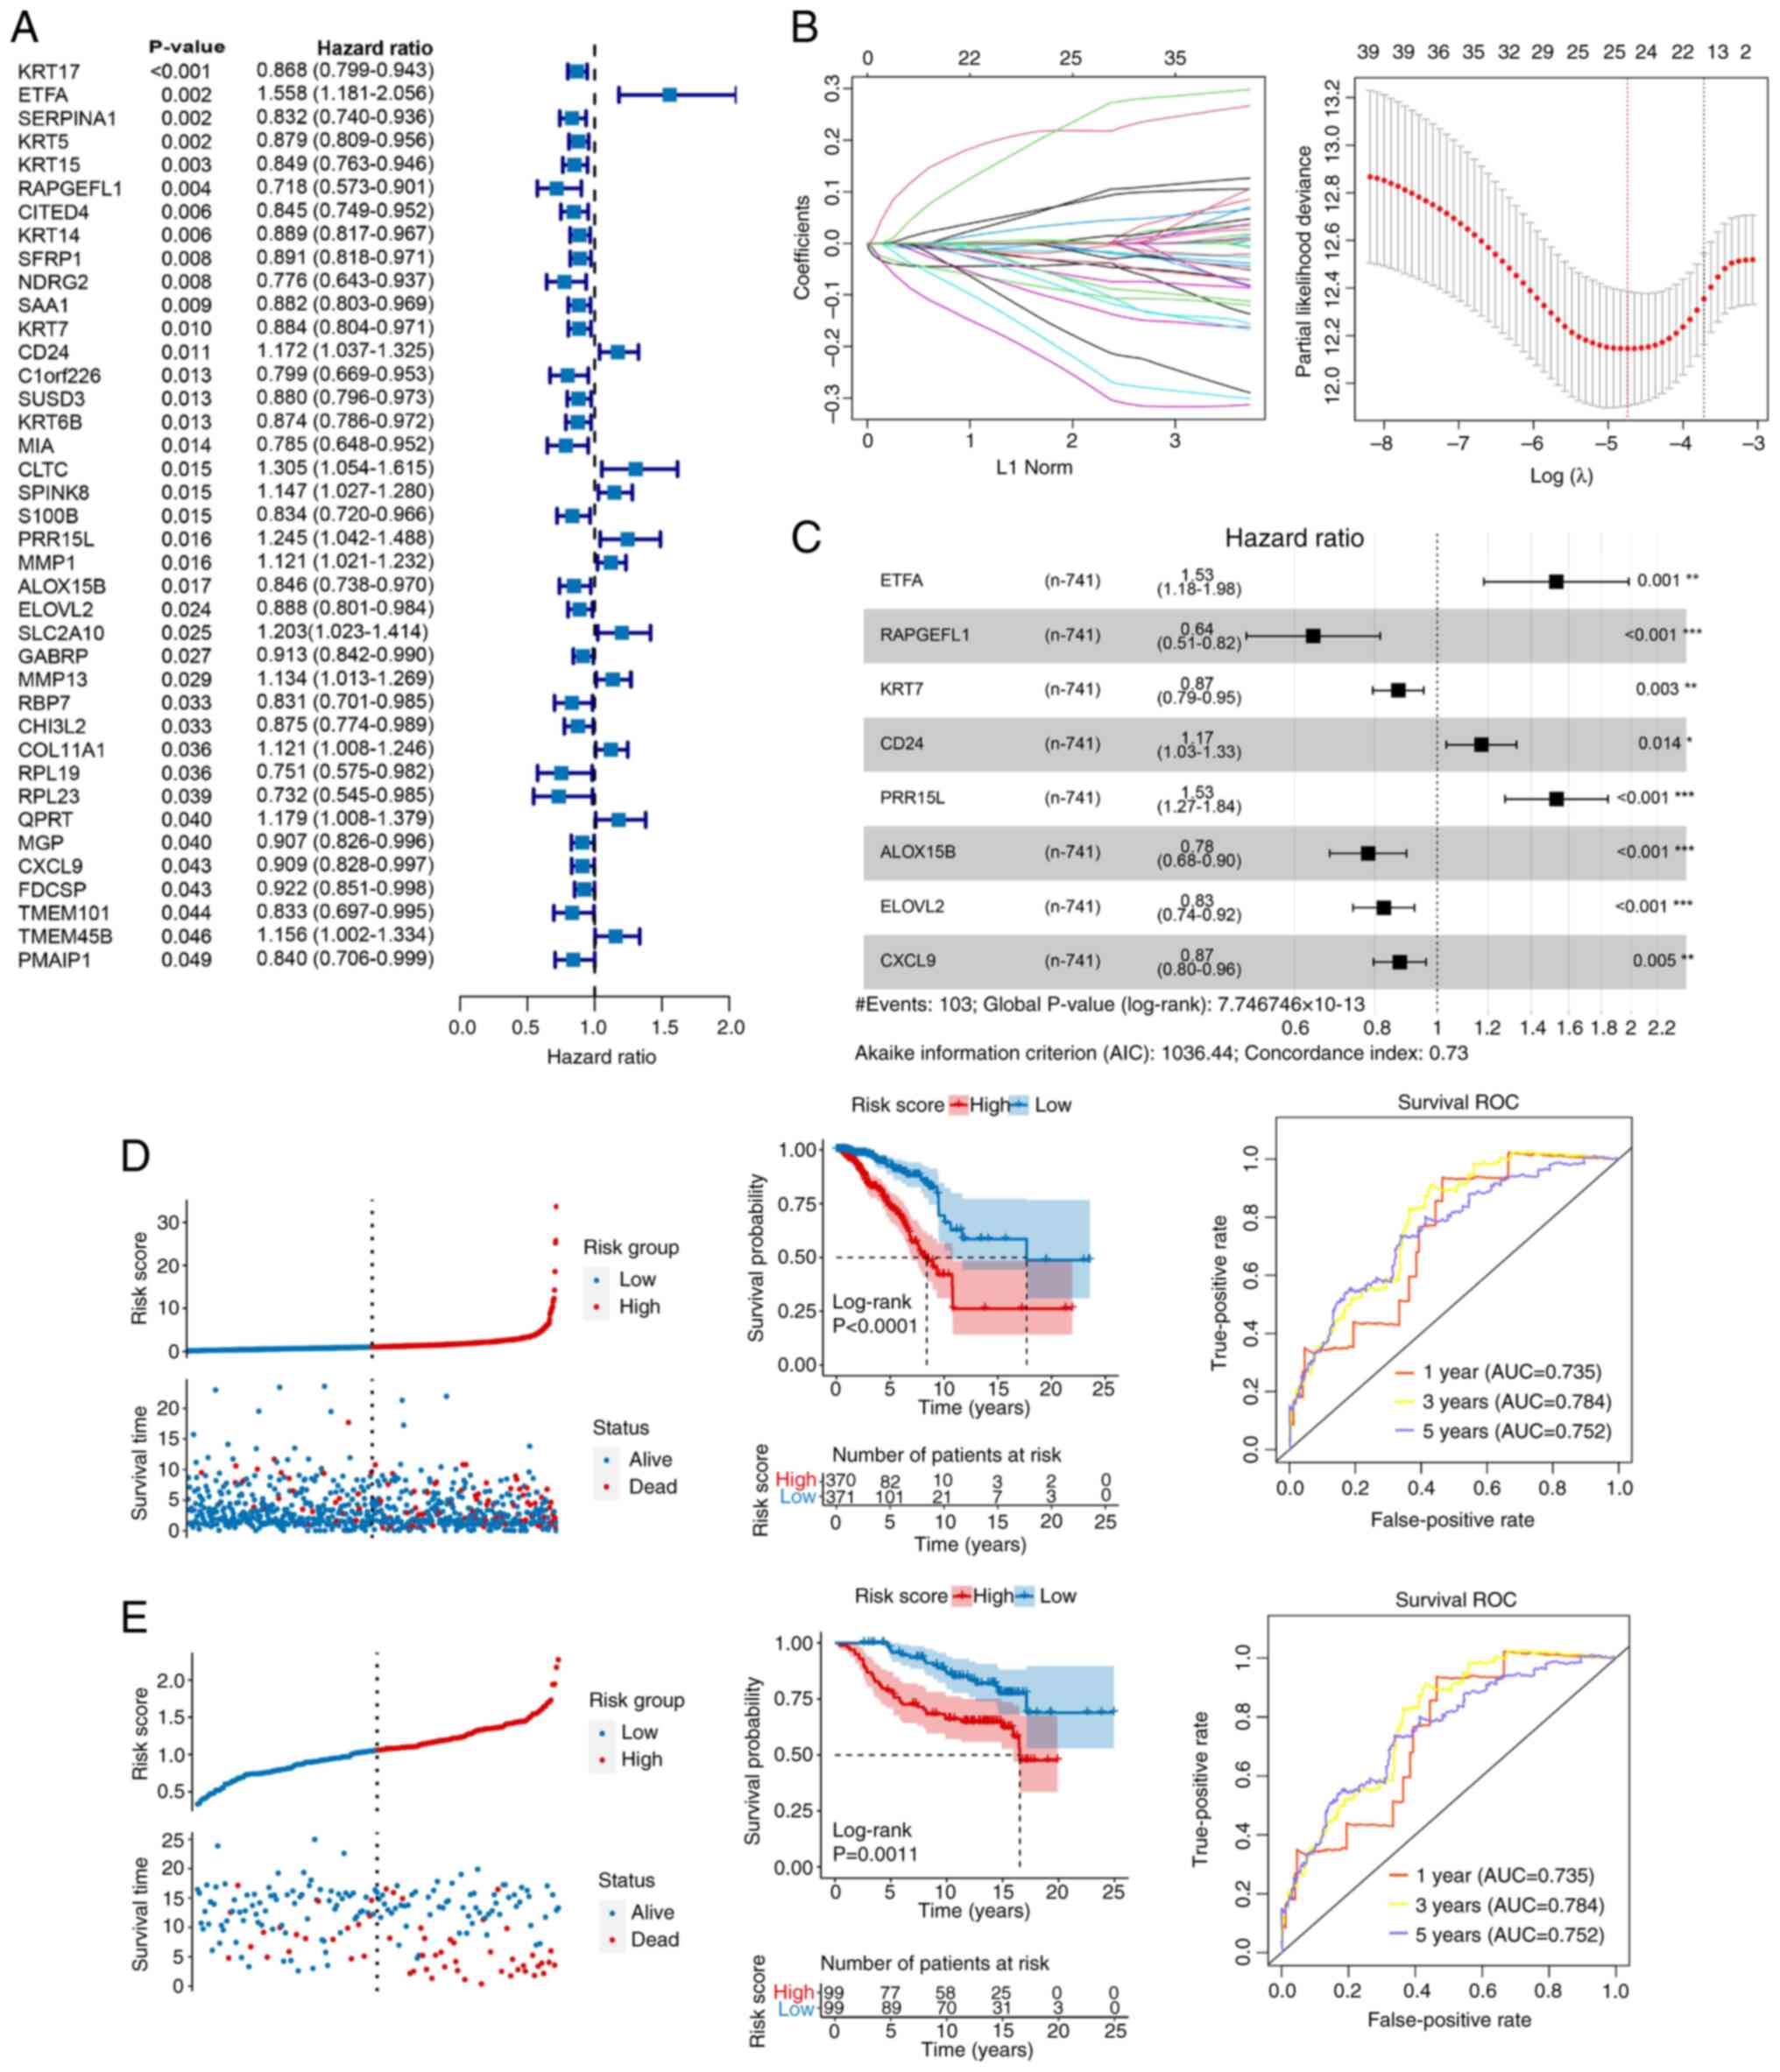
Construction and validation of a
prognostic risk model
A total of 39 prognostic related genes were screened
from the 251 DEGs (Fig. 4A).
Subsequently, LASSO regression analysis was performed using
univariate Cox regression with a P-value threshold of <0.05,
which narrowed down the candidates to 25 genes (Fig. 4B). Moreover, eight key genes were
identified after stepwise Cox regression analysis (Fig. 4C): ETFA, RAPGEFL1, KRT7, CD24,
PRR15L, ALOX15B, ELOVL2 and CXCL9. A risk model was constructed
based on the aforementioned key genes. As shown in Fig. 4D and E, compared with the low-risk
group, patients in the high-risk group had a notably poorer
prognosis (P<0.01), and AUC of the ROC curve was 0.735, 0.784
and 0.752 for the 1-, 3- and 5-year survival, respectively, in TCGA
dataset (Fig. 4D), vs. 0.787, 0.796
and 0.771, respectively, in the GSE7390 dataset (Fig. 4E).
Nomogram
Fig. 5A shows marked
differences in Risk score between different HER2 groups (positive
vs. negative), M stage (M0 vs. M1), T stage (T1 vs. T4, T2 vs. T4,
T3 vs. T4) and AJCC stage (I vs. II, I vs. IV, II vs. IV, III vs.
IV). Fig. 5B demonstrates that the
high-risk group exhibits a significant tendency toward
HER2-negative cases, whereas the low-risk group shows a higher
proportion of HER2-positive cases. The HER2 status indirectly
influences survival outcomes by affecting AJCC staging.
HER2-negative cases are more likely to be classified as early-stage
(I/II), associated with higher survival rates, while HER2-positive
tumors tend to progress to advanced stages (III/IV), linked to
elevated mortality risks. AJCC stage is strongly associated with
survival outcomes: stages I, II, and III primarily exhibit NO
(survival), whereas stage IV predominantly presents YES (death).
Univariate Cox regression analysis was performed on clinical
factors and risk score of the samples. Factors with P<0.05 were
selected for subsequent multivariate Cox regression analysis to
identify significant independent prognostic factors. Age, risk
score and M stage were considered as independent prognostic factors
(Fig. 5C and D). These factors were
then used to build a nomogram, demonstrating that each variable
independently contributed to survival probability prediction.
Increased age corresponded with lower survival rates, advanced M
stage significantly reduced survival probability, and higher risk
scores were associated with poorer prognoses. Total points provided
an intuitive prediction of outcomes, such as the 5-year survival
rate. Model validation revealed high discriminatory ability
(C-index=0.748) (Fig. 5E). The
survival rate model predicted by the nomogram shows overall
consistency with the actual survival rates for 1-, 3- and 5-year
predictions. Specifically, the 1-year survival rate predictions are
closely clustered around the ideal dashed line, indicating better
consistency. The 3-year survival rate data points are more
dispersed but still remain around the dashed line, demonstrating
good consistency. However, the 5-year survival rate data points
exhibit increased dispersion, with some deviating from the dashed
line, leading to a decline in consistency. Overall, the consistency
decreases as the predicted time span increases (Fig. 5F). Fig.
5G shows the marked association of these factors with patient
outcomes. The ROC for the nomogram suggested that the AUCs at 1, 3
and 5 years were 0.849, 0.779 and 0.790, respectively (Fig. 5H).
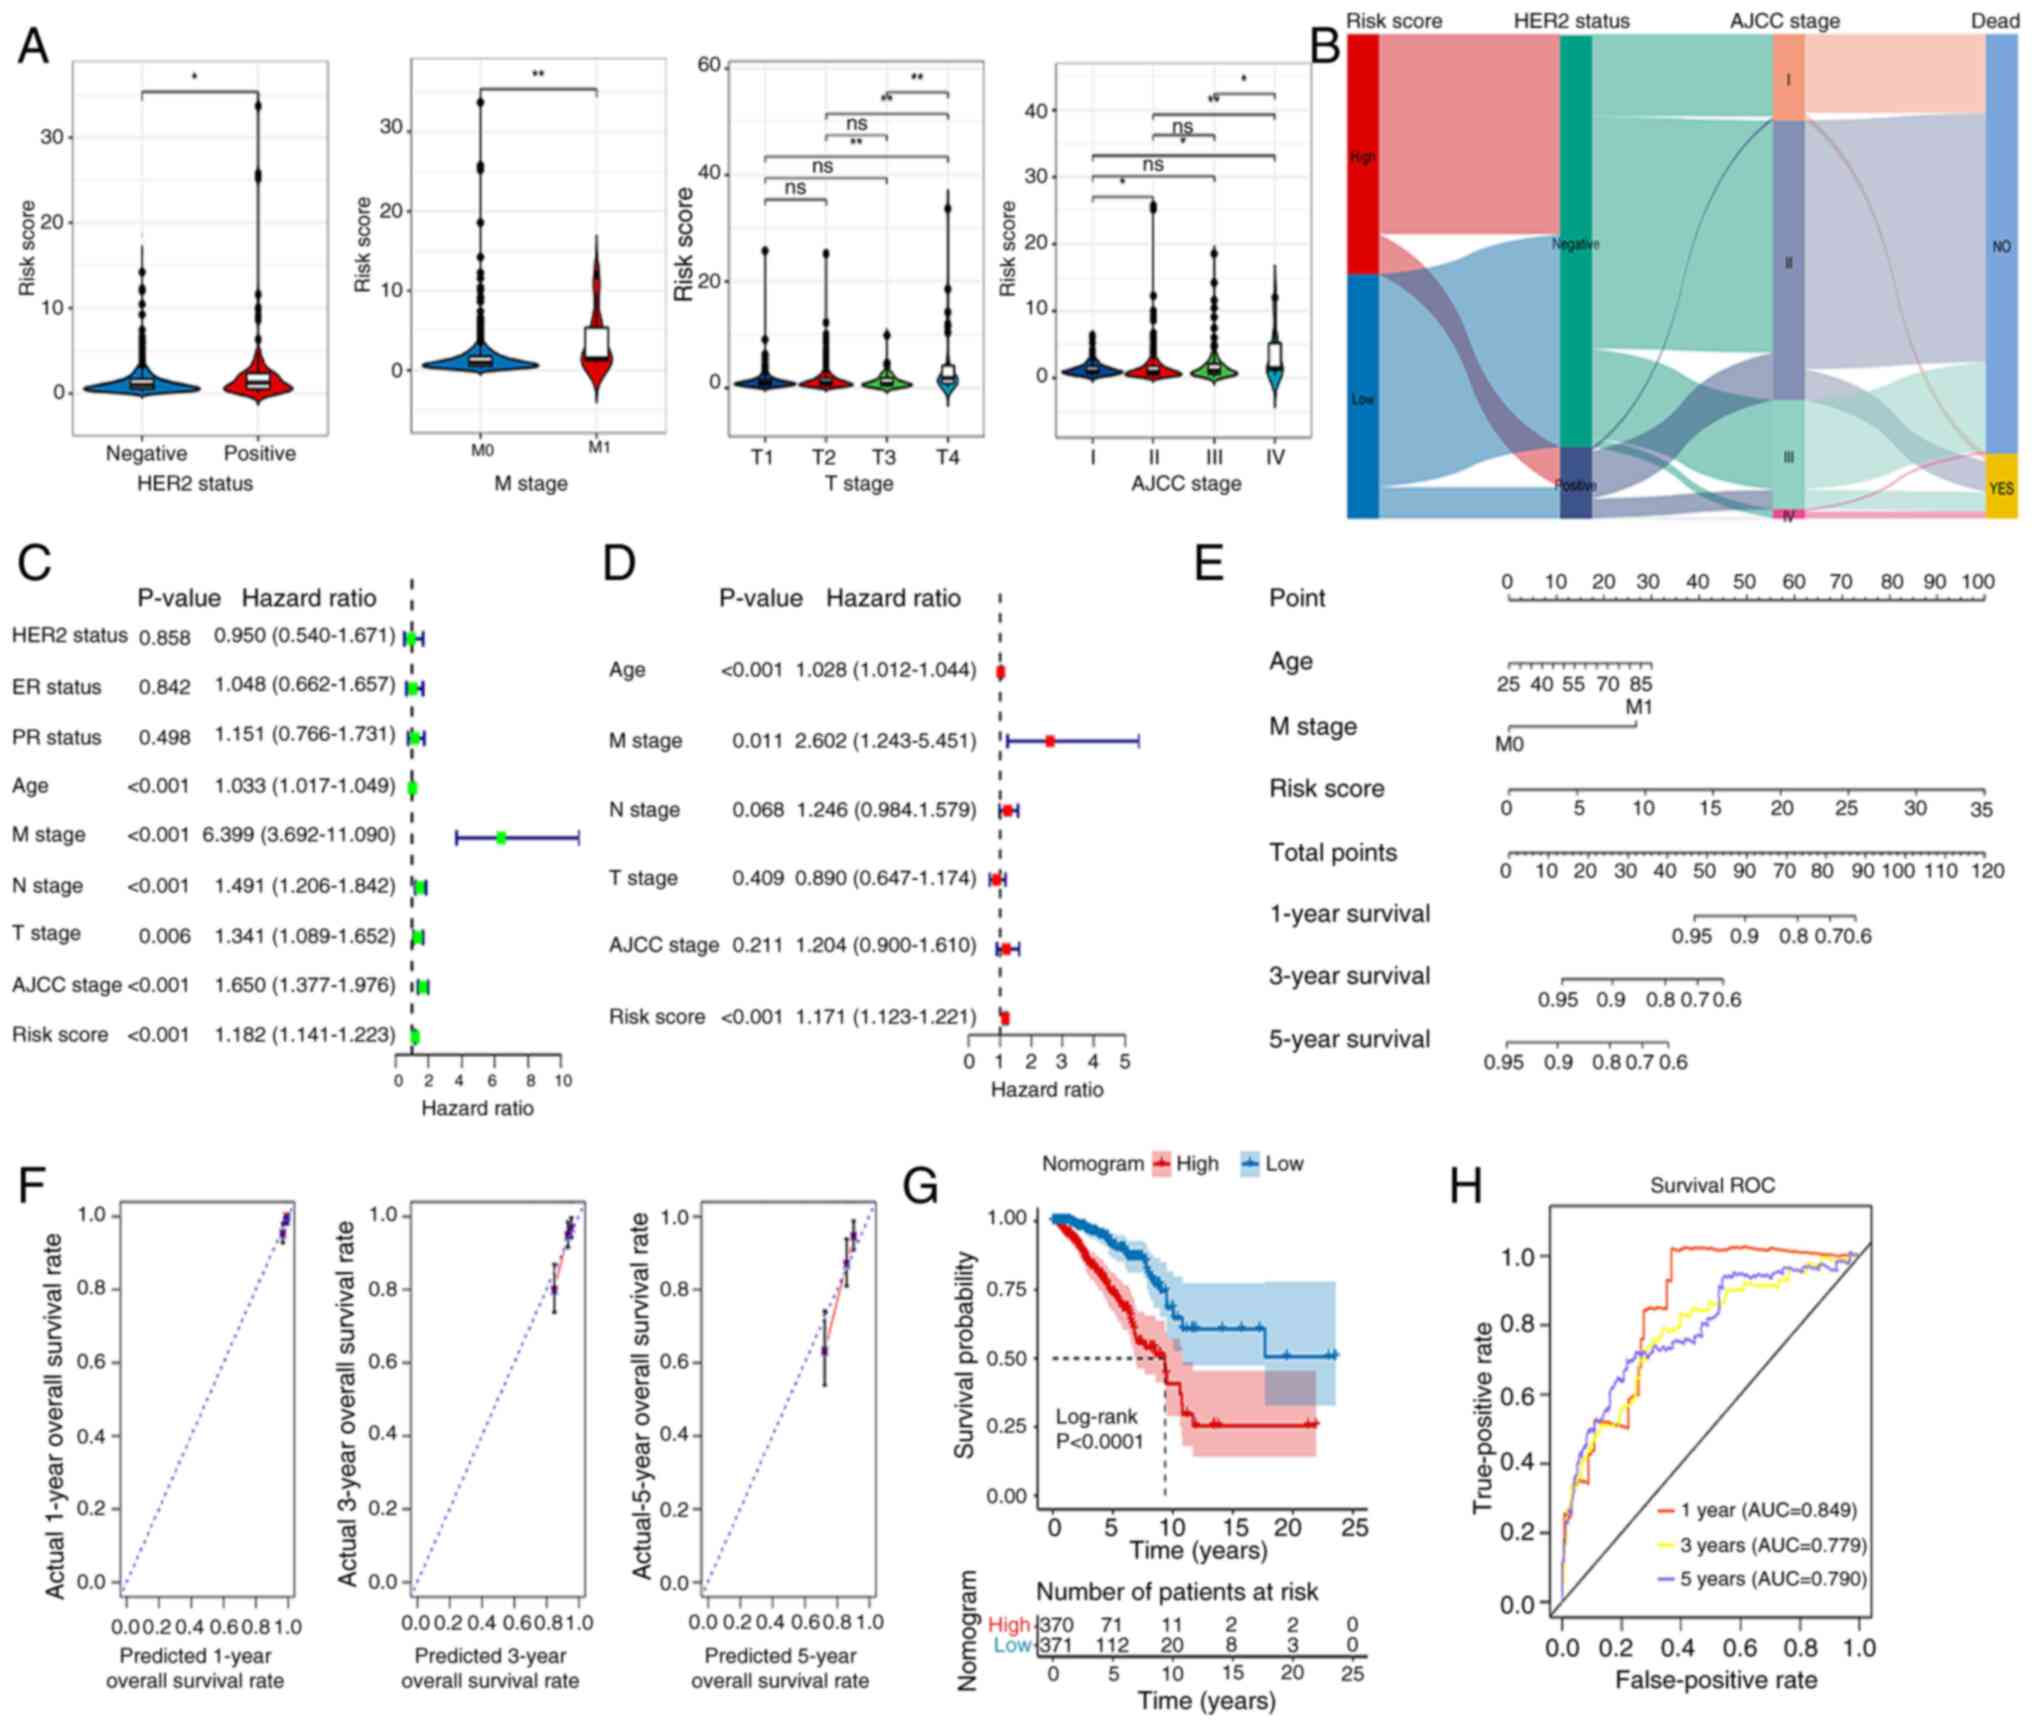 | Figure 5.Construction of a nomogram. (A)
Differences in RiskScore between different HER2-status groups and
clinical features. (B) Association between HER2 and RiskScores. (C)
Univariate and (D) multivariate analyses of clinical data and risk
group. (E) Nomogram for predicting 1-, 3- and 5-year overall
survival. (F) Calibration curve analysis of nomogram. (G)
Kaplan-Meier analysis of the nomogram. (H) AUCs for predicting 1-,
3- and 5-year OS. *P<0.05, **P<0.01. ns, no significant
difference; HER2, human epidermal growth factor receptor 2; ER,
estrogen receptor; PR, progesterone receptor; M, metastasis; N,
node; T, tumor; AJCC, American Joint Committee on Cancer; OS,
overall survival; AUC, area under the curve; ROC, receiver
operating characteristic. |
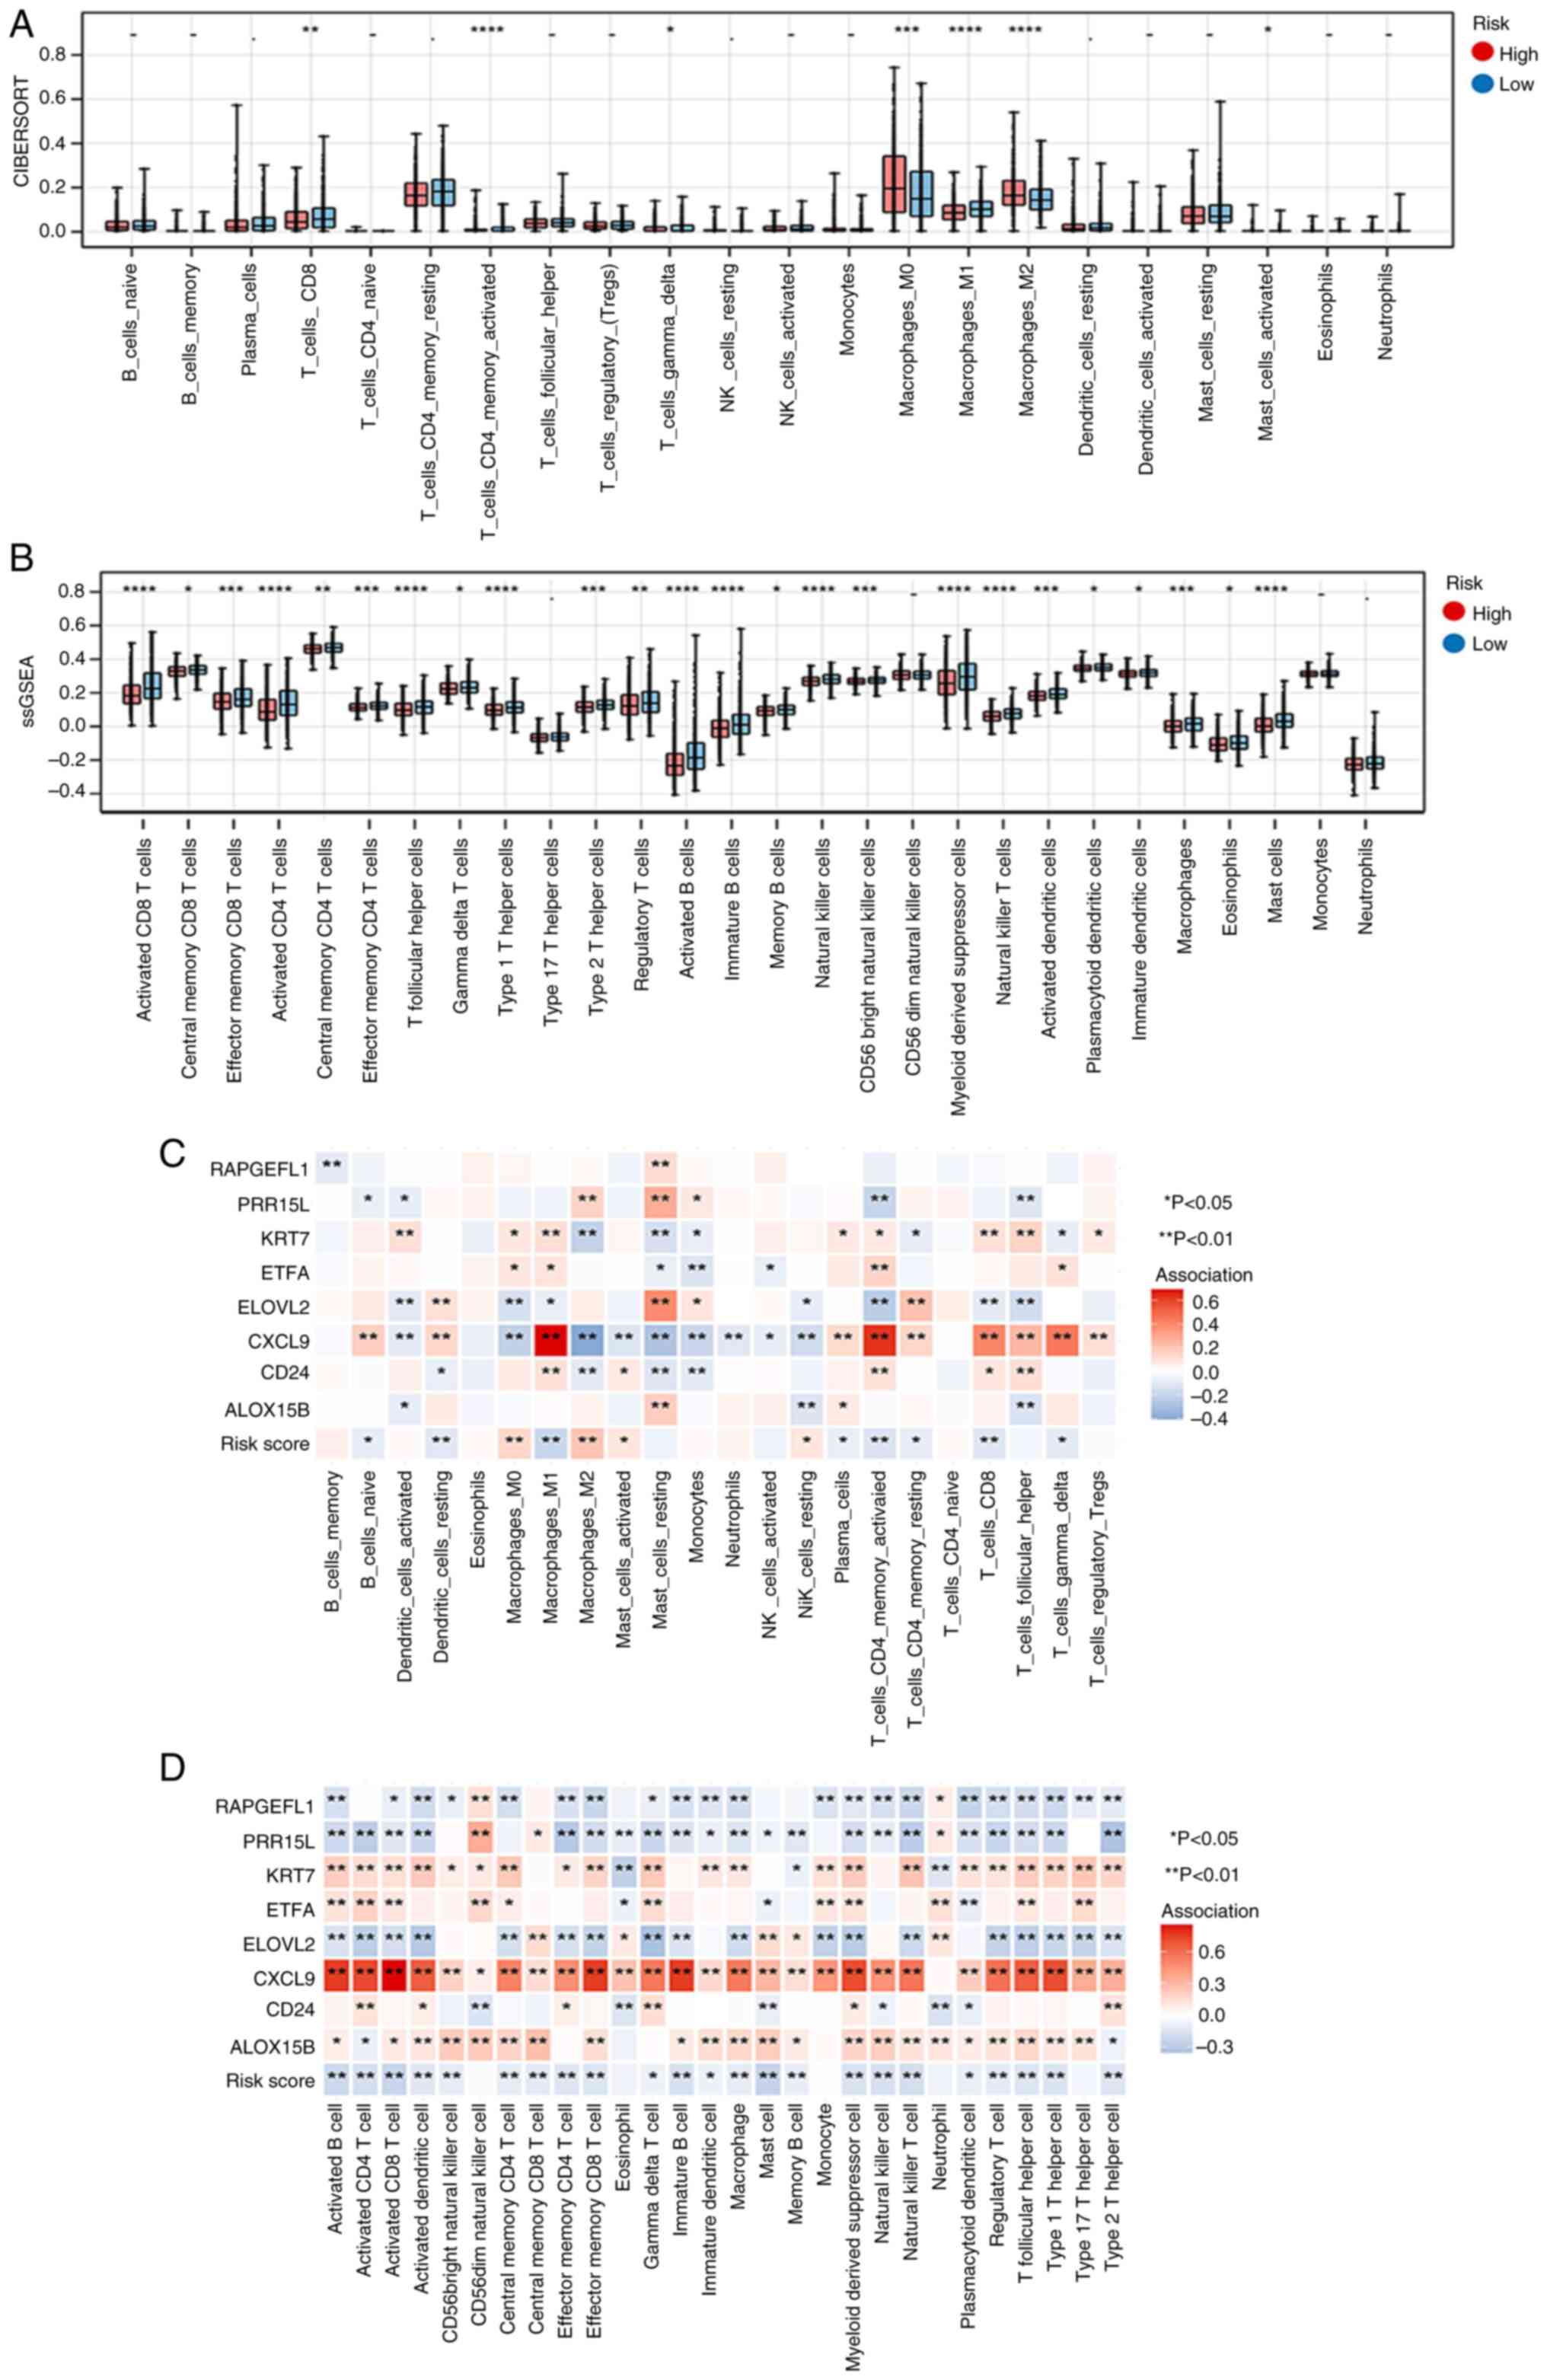
Association analysis of immunity and
RiskScore
A significant difference was observed in the
proportions of 7 and 24 immune cell types between the high- and
low-risk groups according to the results of ‘CIBERSORT’ and
‘ssGSEA’ analyses, respectively (Fig.
6A and B, respectively). The associations of 22 and 28 immune
cell types with eight key genes are shown in Fig. 6C and D, respectively.
Characteristics of crucial genes
Spearman's correlation test was utilized to analyze
the association between the expression levels of the aforementioned
eight key genes and the prognosis of patients with breast cancer
was analyzed revealed a positive trend in general (Fig. 7A). Based on the circular graph, the
chromosomal localization distribution and copy number variation
(CNV) status of 8 model genes were visually mapped, clearly
presenting the positions of each gene on the chromosome and their
CNV alteration characteristics (Fig.
7B). The gain and loss trends are displayed in Fig. 7C. Fig.
7D shows heatmaps of the aforementioned eight key genes.
Survival analysis showed that the prognosis of patients with high
expression of CD24, ETFA and PRR15L was worse than that of patients
with low expression, whereas RAPGEFL1, KRT7, ALOX15B, ELOVL2 and
CXCL9 showed the opposite trend (all P<0.05; Fig. 7E).
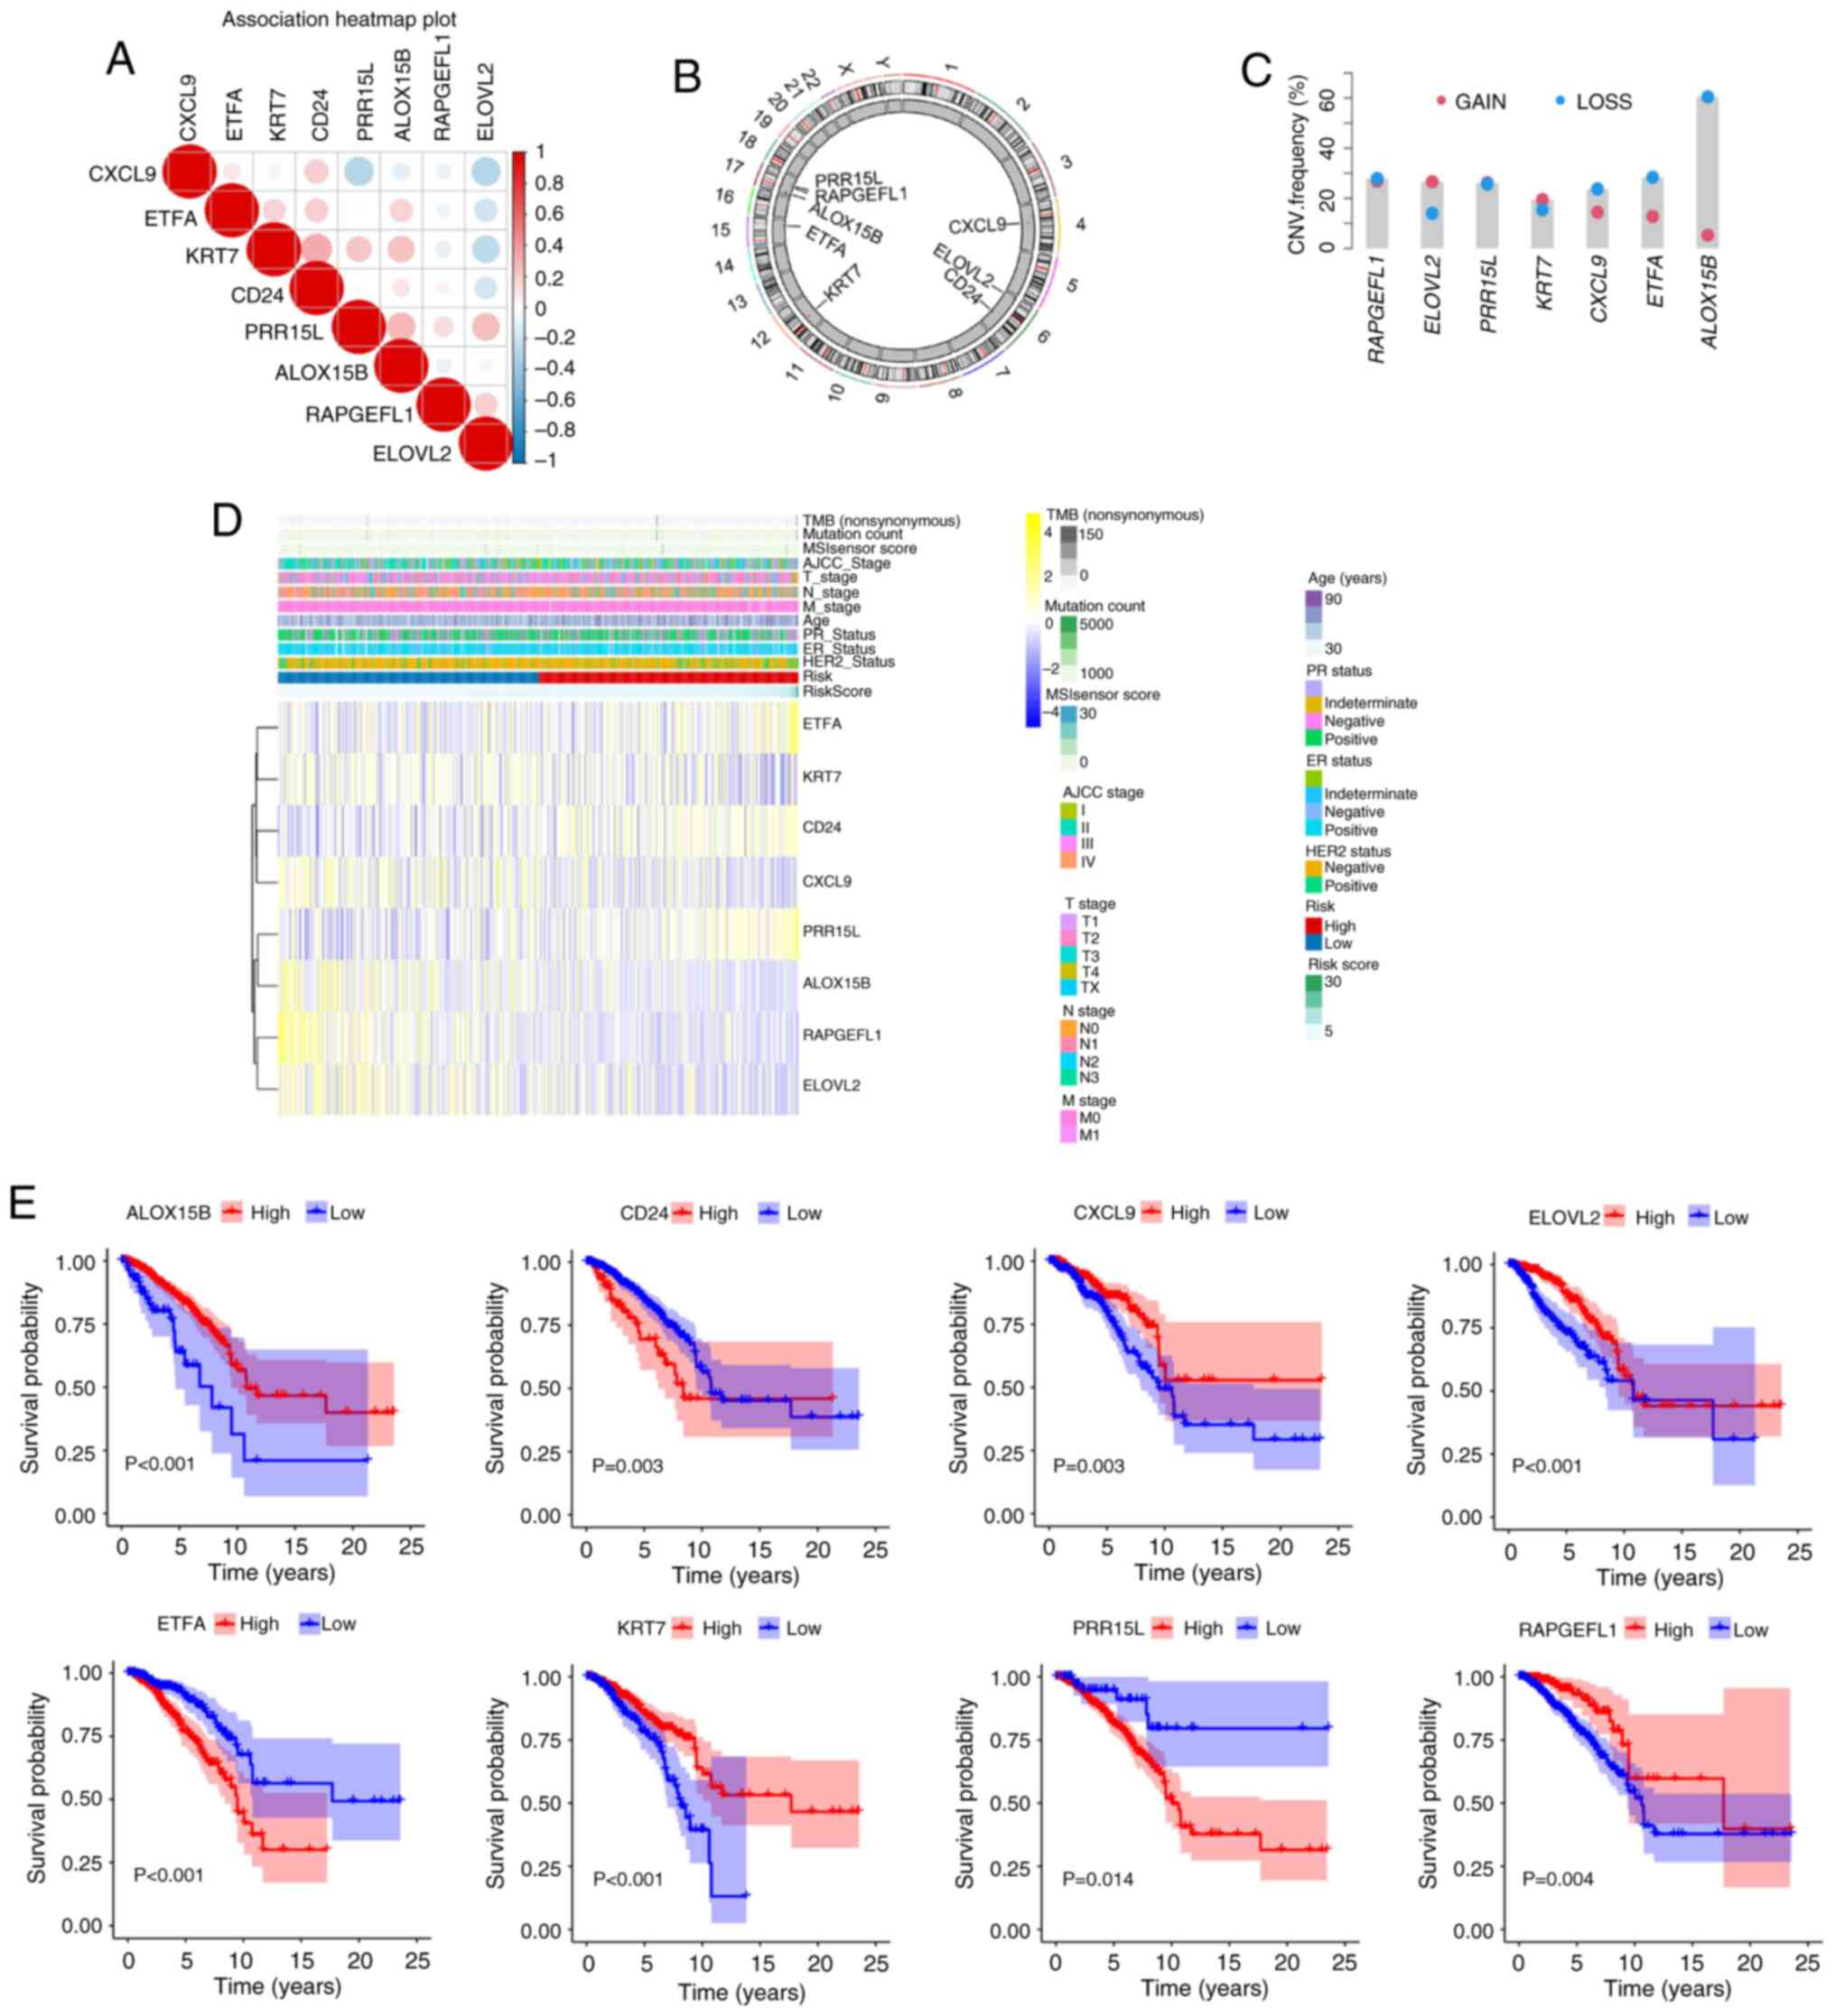 | Figure 7.Characteristics of key genes (ETFA,
RAPGEFL1, KRT7, CD24, PRR15L, ALOX15B, ELOVL2 and CXCL9). (A)
Analysis of the association between the expression levels of the
eight key genes and the prognosis of patients with breast cancer
was analyzed revealed a positive trend in general. (B) CNV changes
of the above eight key genes on chromosomes. (C) CNV changes (gain
and loss trends) of the aforementioned eight key genes (there is no
relevant information about gene CD24 so a graph cannot be drawn).
(D) Heatmap of the expression of eight crucial genes. (E) Survival
analysis patients with different levels of expression of the
aforementioned eight crucial genes. Note: Survival curves were
constructed using the Kaplan-Meier method, and the log-rank test
was employed to compare survival differences between groups,
provided the proportional hazards assumption held (ETFA, RAPGEFL1,
KRT7, PRR15L, ALOX15B, and CXCL9 genes). For time-to-event data
with intermediate events, the two-stage survival analysis method
from the Two Stage Hazard Rate Comparison (TSHRC) package (Version
0.1-6) was applied when the proportional hazards assumption was
violated (CD24 and ELOVL2 genes). CNV, copy number variation; TMB,
tumor mutation burden; M, metastasis; N, node; T, tumor; AJCC,
American Joint Committee on Cancer; HER2, human epidermal growth
factor receptor 2; ER, estrogen receptor; PR, progesterone
receptor. ETFA, electron transfer flavoprotein subunitα; RAPGEFL1,
rap guanine nucleotide exchange factor-like 1; KRT7, keratin 7;
CD24, cluster of differentiation 24; PRR15L, proline rich 15-like;
ALOX15B, arachidonate 15-lipoxygenase type B; ELOVL2, ELOVL fatty
acid elongase 2; CXCL9, C-X-C motif chemokine ligand 9. |
Single cell analysis
The GSE161529 single-cell dataset was used to
explore the expression of the aforementioned eight crucial genes in
the immune microenvironment, and the results revealed the
involvement of 11 cell types (Fig.
8A). The distribution and percentage of these cell types are
displayed in Fig. 8B. The largest
proportions corresponded to malignant and epithelial cells.
Fig. 8C shows the distribution of
the RiskScore in the 11 cell types. In addition, immune
microenvironment analysis revealed that the aforementioned eight
key genes were expressed in various immune cells (Fig. 8D).
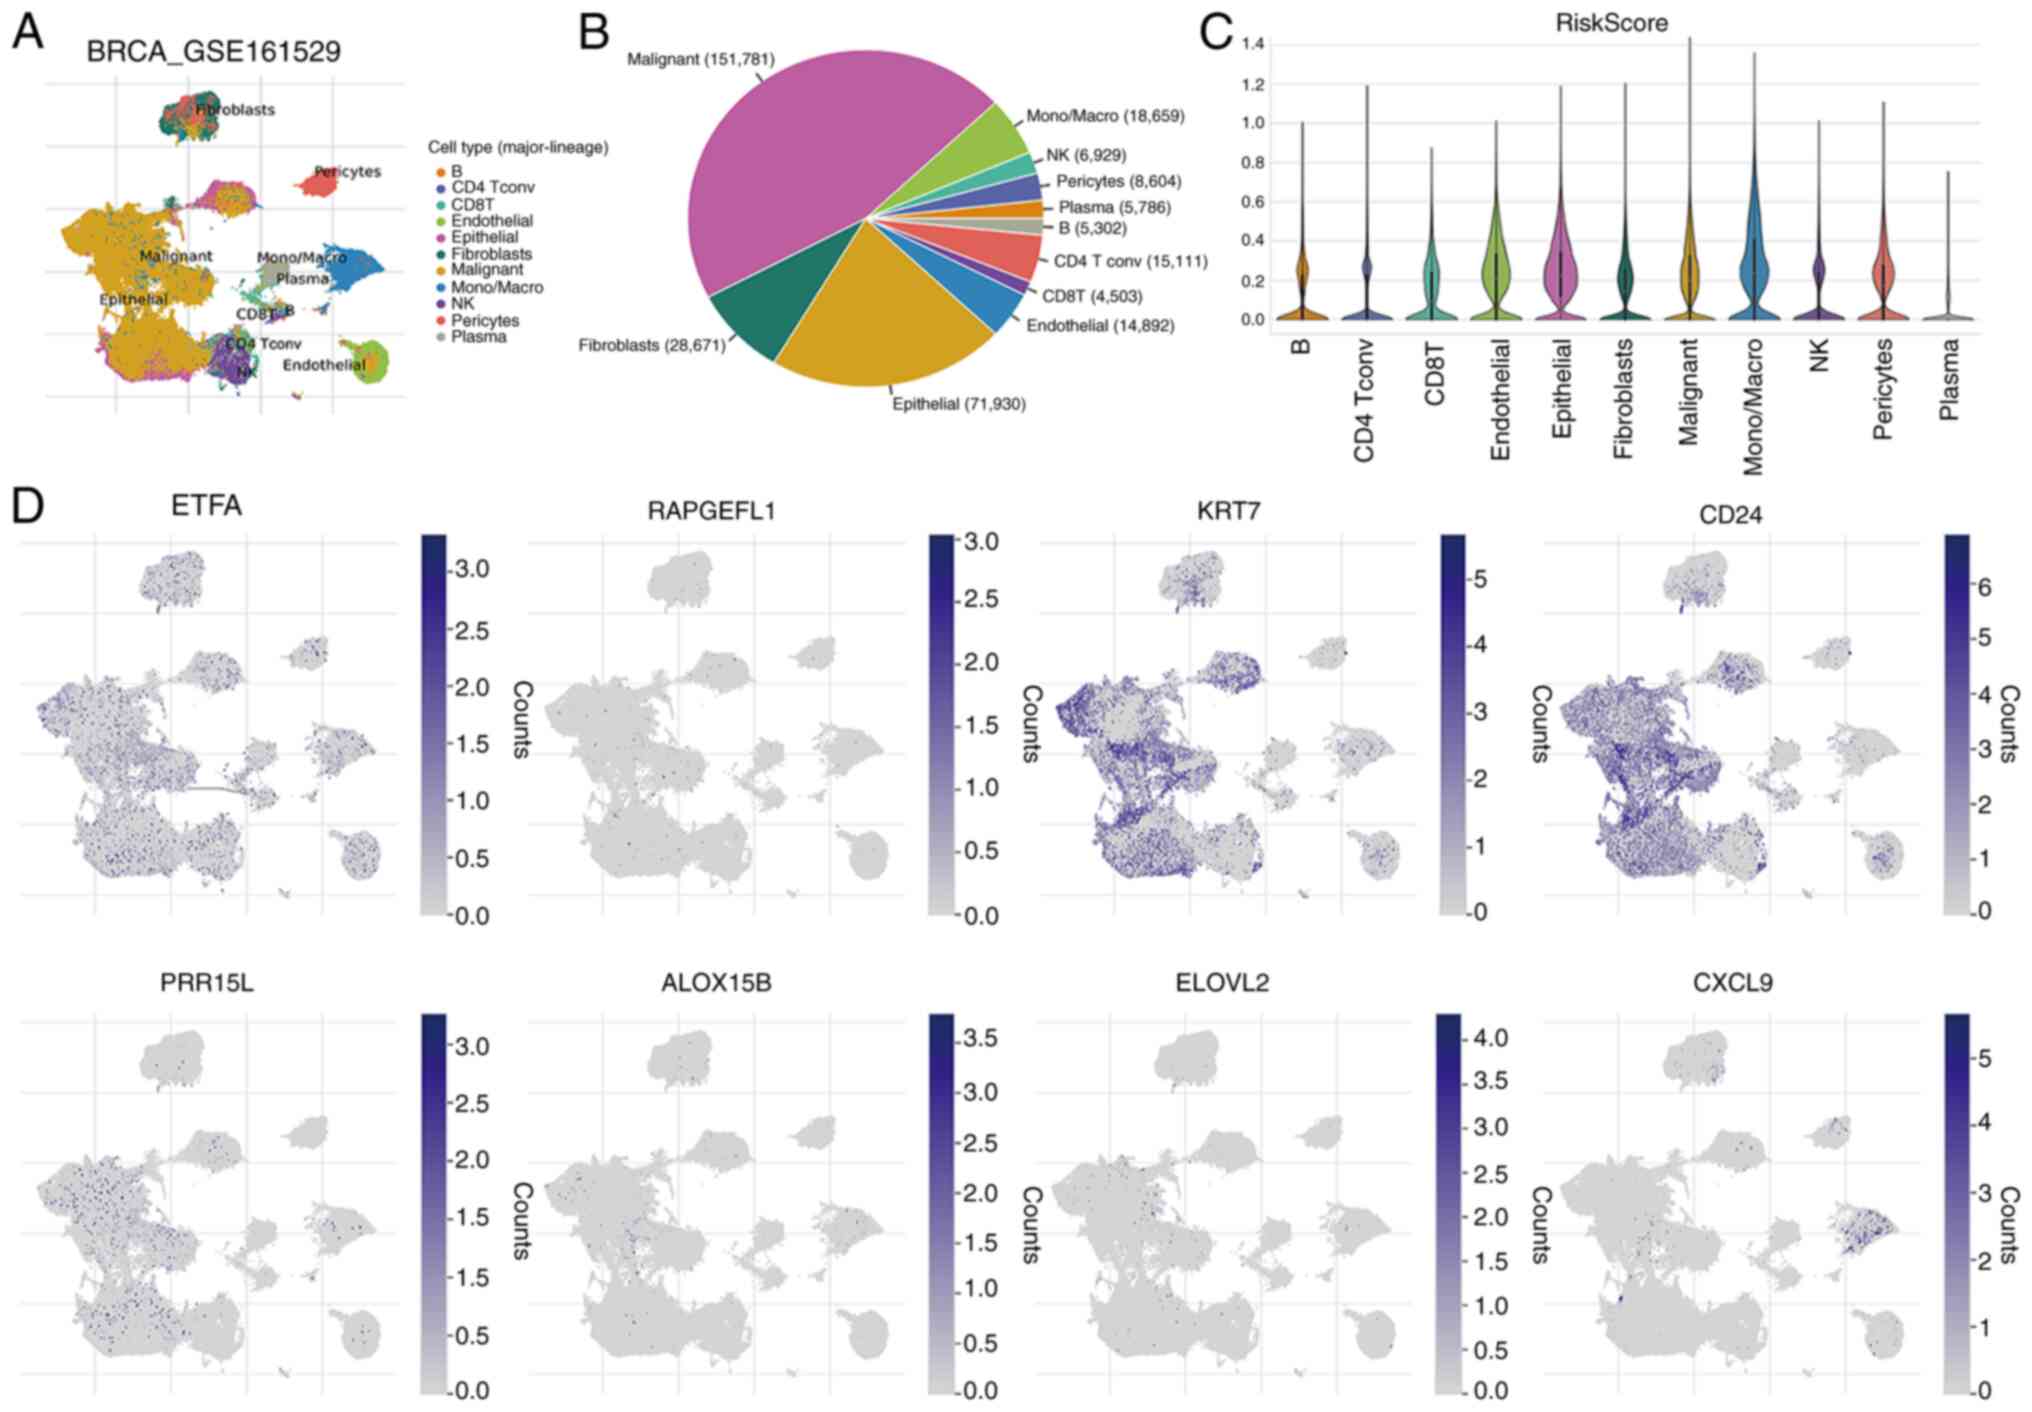 | Figure 8.Single cell analysis. (A) Levels of
eight key genes in 11 cell types based on the single-cell dataset
GSE161529. (B) Distribution and percentage of 11 cell types. (C)
Distribution of RiskScore in the above 11 cell types. (D)
Expression pattern of the aforementioned eight key genes in immune
cells. NK, natural killer; BRCA, breast invasive carcinoma; Tconv,
Tconvoluted; Mono/Macro, monocyte/macrophage; ETFA, electron
transfer flavoprotein subunitα; RAPGEFL1, rap guanine nucleotide
exchange factor-like 1; KRT7, keratin 7; CD24, cluster of
differentiation 24; PRR15L, proline rich 15-like; ALOX15B,
arachidonate 15-lipoxygenase type B; ELOVL2, ELOVL fatty acid
elongase 2; CXCL9, C-X-C motif chemokine ligand 9. |
Validation results
RT-qPCR was performed to validate the expression of
eight crucial genes (ETFA, RAPGEFL1, KRT7, CD24, PRR15L, ALOX15B,
ELOVL2 and CXCL9). As shown in Fig.
9, the assays confirmed that ETFA, RAPGEFL1, KRT7, CD24 and
PRR15L were significantly upregulated in the HER2-positive groups,
whereas ELOVL2, CXCL9 and ALOX15B were significantly downregulated,
compared with the HER2-negative group. ELOVL2 is a novel tumor
suppressor with low expression in breast cancer (31). In prostate cancer, high expression
of ELOVL2 suggests improved prognosis, and small hairpin RNA
targeting ELOVL2 promotes cell proliferation, colony formation,
migration and invasion, as well as the growth of subcutaneous
xenografts by activating the PI3K/AKT signaling pathway (32). Therefore, ELOVL2 was selected in the
present study for follow-up experiments.
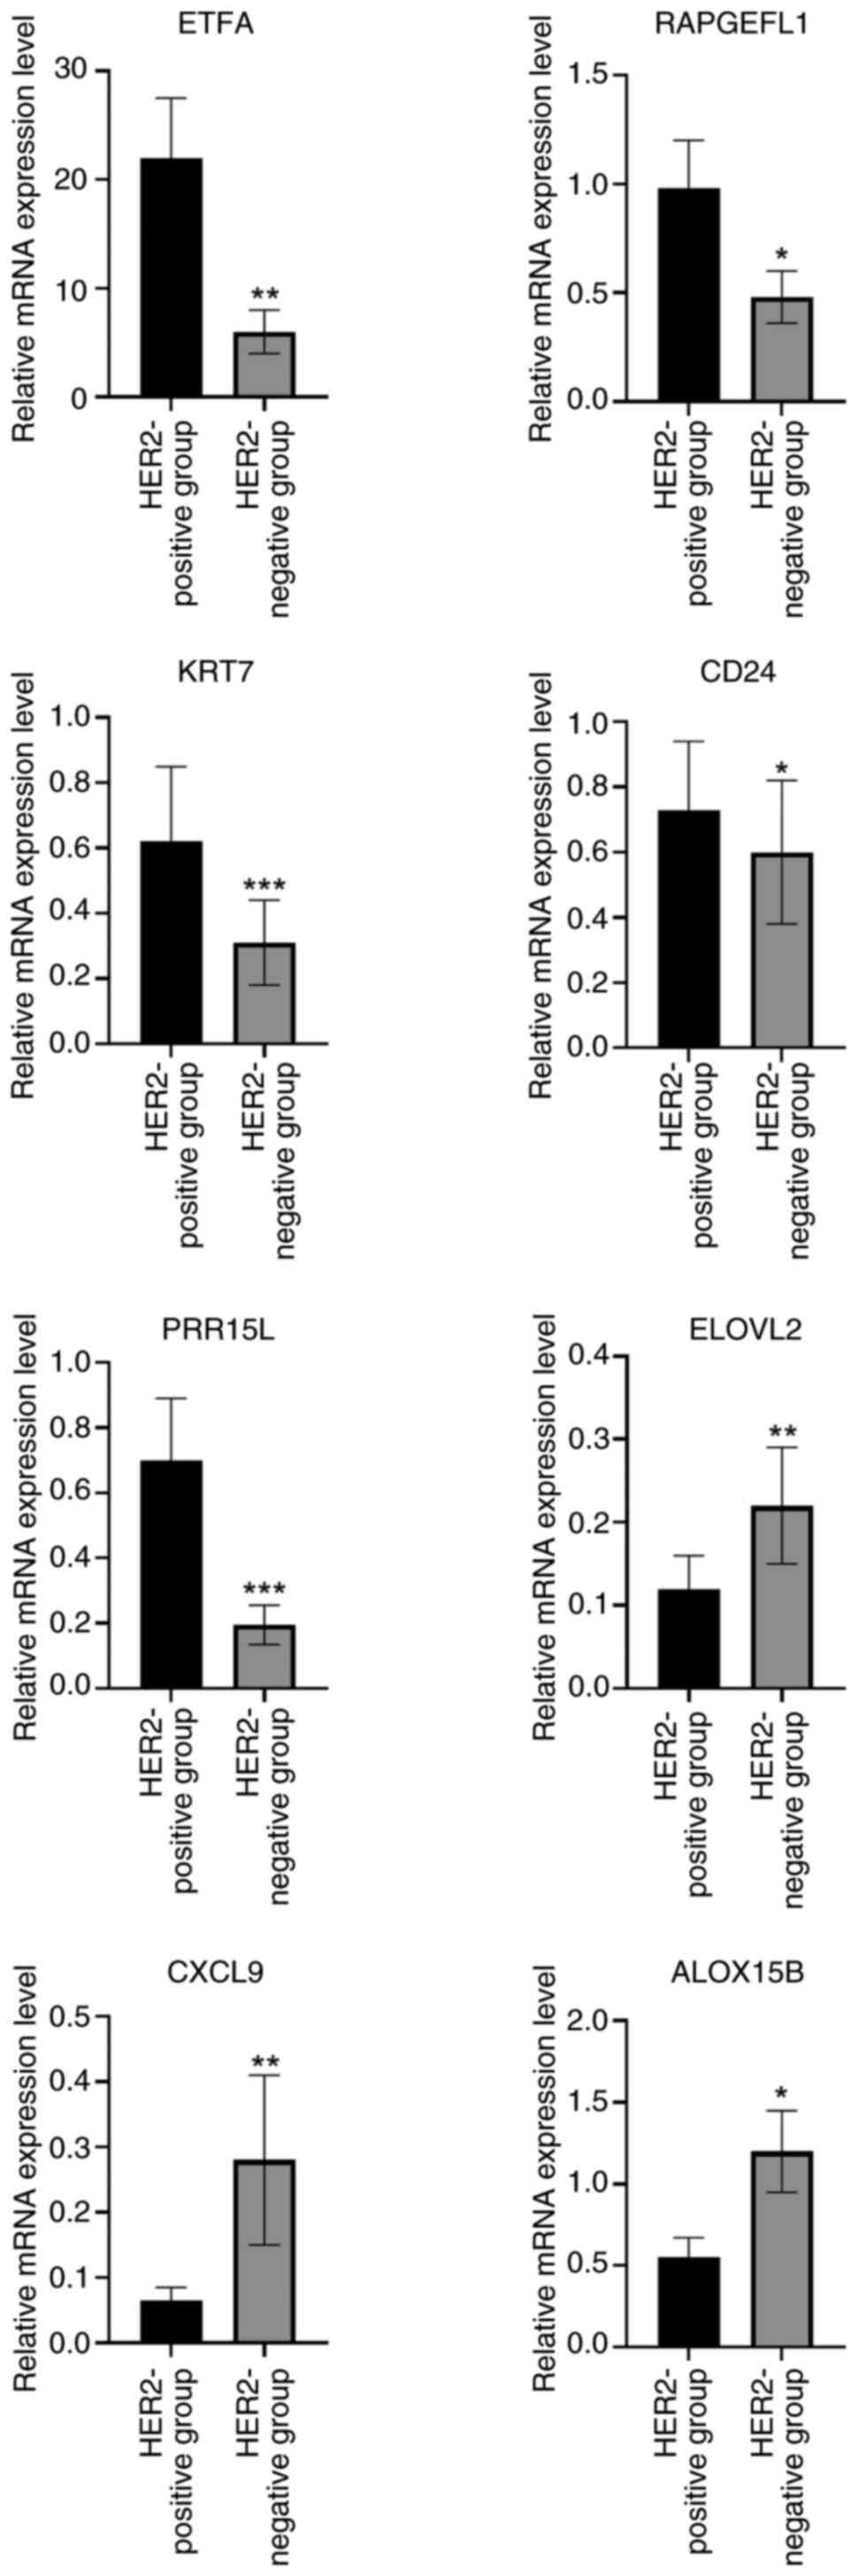 | Figure 9.RT-qPCR was performed to validate the
expression of eight crucial genes (ETFA, RAPGEFL1, KRT7, CD24,
PRR15L, ALOX15B, ELOVL2 and CXCL9). *P<0.05, **P<0.01,
***P<0.001. HER2, human epidermal growth factor receptor 2;
ETFA, electron transfer flavoprotein subunitα; RAPGEFL1, rap
guanine nucleotide exchange factor-like 1; KRT7, keratin 7; CD24,
cluster of differentiation 24; PRR15L, proline rich 15-like;
ALOX15B, arachidonate 15-lipoxygenase type B; ELOVL2, ELOVL fatty
acid elongase 2; CXCL9, C-X-C motif chemokine ligand 9. |
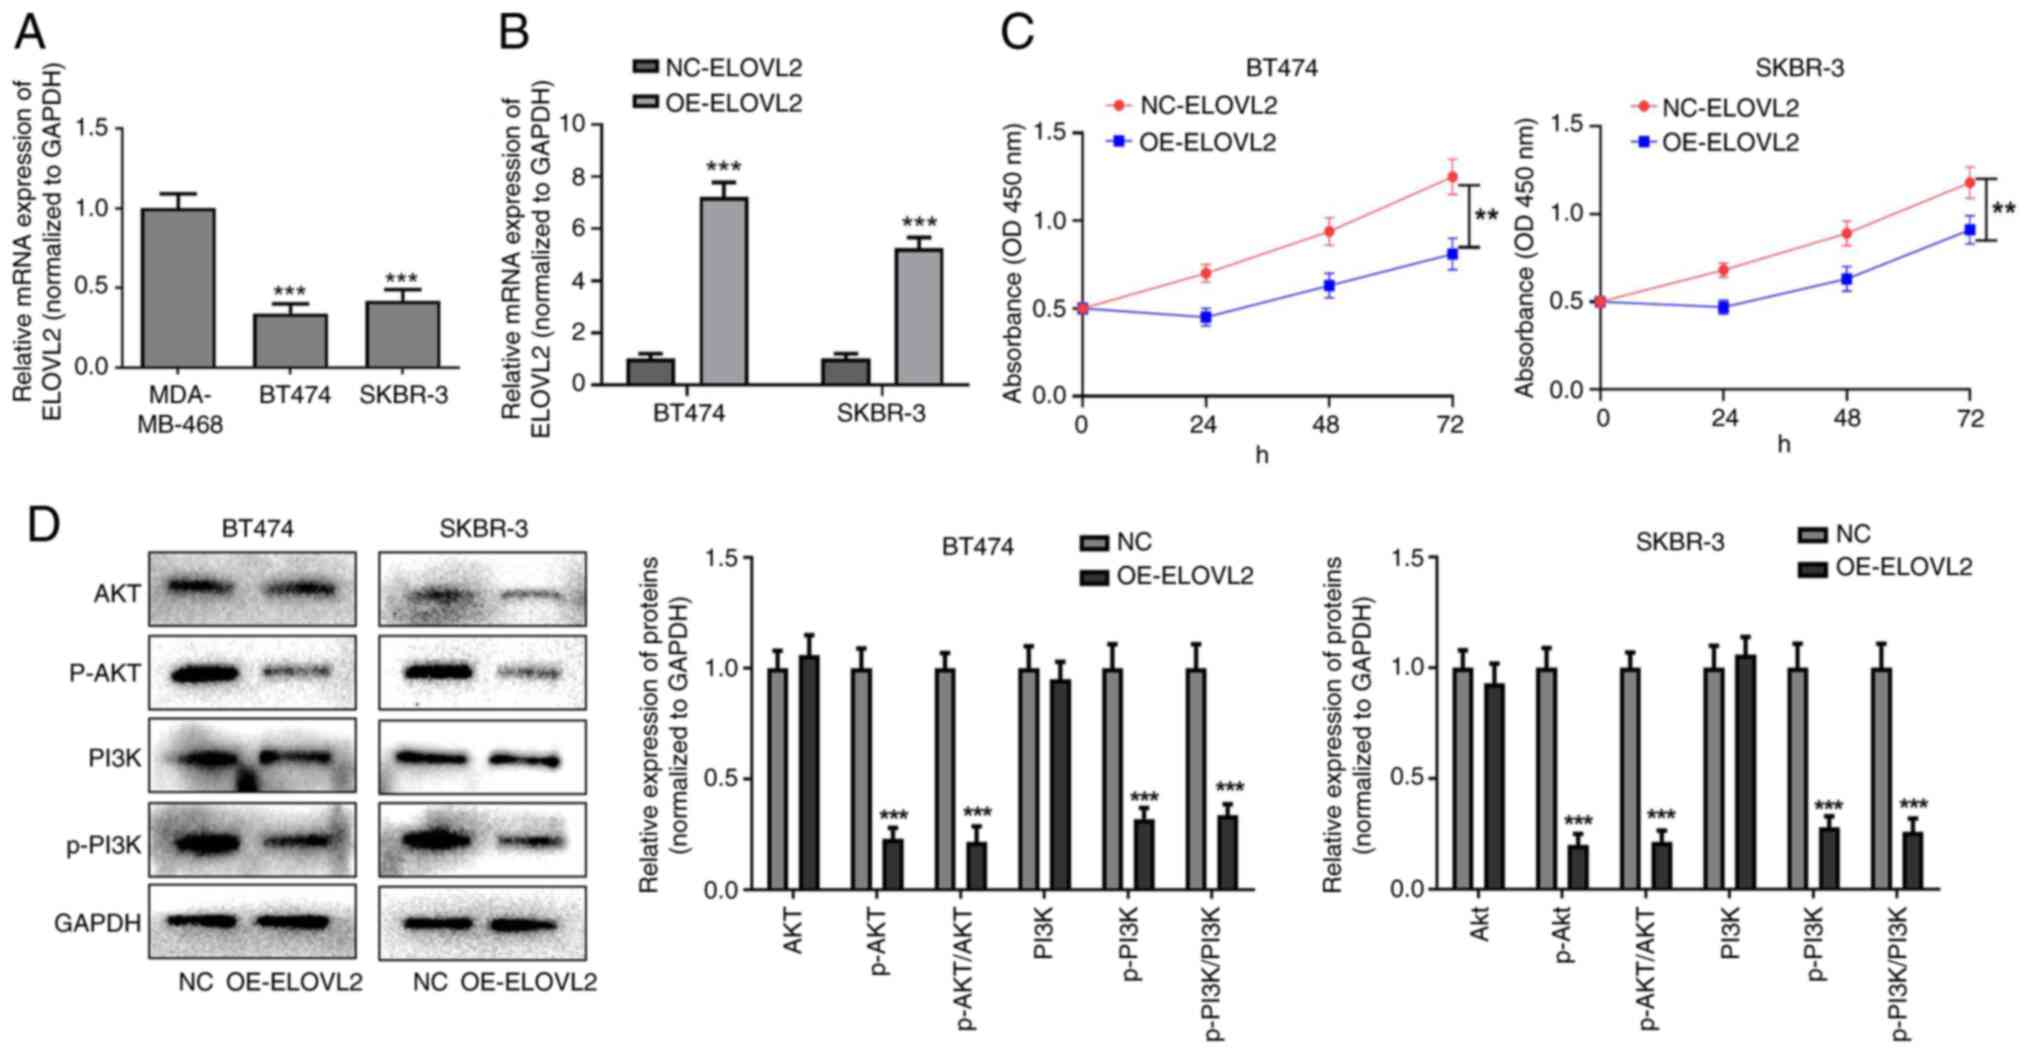
ELOVL2 overexpression inhibits the
proliferation of HER2-positive breast cancer cells by inhibiting
the PI3K-AKT pathway
The RT-qPCR results showed that the expression of
ELOVL2 was significantly lower in BT474 and SKBR-3 cells than in
MDA-MB-468 cells (P<0.001; Fig.
10A). In addition, RT-qPCR revealed that OE-ELOVL2
significantly increased the expression of ELOVL2 in BT474 and
SKBR-3 cells, suggesting successful transfection (P<0.001;
Fig. 10B). Furthermore, the CCK-8
proliferation assay showed that OE-ELOVL2 significantly inhibited
the proliferation of BT474 and SKBR-3 cells (P<0.01; Fig. 10C). Western blot analysis showed no
significant difference in the expression levels of PI3K or AKT in
the OE-ELOVL2 group compared to the negative control group, whereas
overexpression of ELOVL2 could decrease the levels of p-PI3K and
p-AKT proteins. In addition, compared with the corresponding
control group, the p-AKT/AKT and p-PI3K/PI3K ratios in the
OE-ELOVL2 groups of both BT474 and SKBR-3 cell lines were
significantly decreased (P<0.001; Fig. 10D). In conclusion, ELOVL2
overexpression inhibits HER2-positive breast cancer cell
proliferation by inhibiting the PI3K-AKT pathway.
Discussion
The oncogenic potential and activation of HER2 have
been well established in various human tumors (33). In the present study, HER2 expression
was significantly associated with ER status, PR status, N stage,
AJCC stage, mutation count and TMB in breast cancer. Therefore, the
molecular mechanisms underlying the involvement of HER2 in breast
cancer were investigated. A total of 251 DEGs between HER2-negative
and-positive groups were screened, and these DEGs were
significantly enriched in the KEGG pathways of estrogen signaling
pathway, chemical carcinogenesis-receptor activation and PI3K-AKT
signaling pathway. Numerous studies have shown that these pathways
are strongly associated with tumor progression. The PI3K/AKT
signaling pathway is activated through the generation of 3′
p-phosphoinositides, which plays a crucial role in multidrug
resistance in several cancer types such as breast cancer (34,35).
The chemical carcinogenesis receptor activation pathway is involved
in several diseases (36,37). Estrogen is involved in the
metabolism of normal physiological processes and diseases, and the
metabolic profile of endogenous breast cancer subtypes changes
according to estrogen receptor expression (38). Therefore, it can be proposed that
HER2-related DEGs participate in breast cancer progression through
these pathways. However, this conclusion needs to be verified
experimentally.
The TME plays a major role in tumorigenesis
(39,40). Stromal and ESTIMATE scores, known as
prognostic factors for tumors, are strongly linked to the tumor
immune microenvironment, with higher scores associated with worse
overall survival (41,42). The current results align with the
above findings, showing that stromal and ESTIMATE scores in the
HER2-positive group were increased compared to those in the
HER-negative group. Furthermore, the immune cell scores of the
HER2-negative and -positive groups were calculated. The ‘CIBERSORT’
and ‘xCELL’ algorithms revealed that the fraction of M2 macrophages
showed marked differences between different HER2 groups. An
increasing body of evidence indicates that M2 macrophages promote
tumor growth and invasion (43–45).
Yamaguchi et al (46)
reported that M2 macrophages are involved in the development of
peritoneal dissemination in gastric cancer. Additionally, the
present study also identified 19 checkpoint genes, and 11 chemokine
genes exhibited notable differences between the HER2-negative and
-positive groups. Therefore, it can be considered that these immune
cells, 19 checkpoint genes and 11 chemokine genes may participate
in the development of HER2-positive breast cancer, providing
reliable targets for immunotherapy of HER2-positive breast
cancer.
The IC50 differences of 138
chemotherapeutic agents between HER2-negative and -positive groups
were analyzed, and the top three chemotherapeutic agents with
significant differences were identified, including AS601245,
AP.24534 and roscovitine. Previous evidence suggests that
activation of c-Jun N-terminal kinase (JNK) can promote tumor
progression and is implicated in several types of tumors (47,48).
AS601245 is an inhibitor of JNK signaling (47), and Luo et al (49) suggested that AS601245 may be a new
inhibitor of breast cancer. AP.24534, known as ponatinib, is a
pan-fibroblast growth factor receptor inhibitor (50). Ponatinib is currently used for the
treatment of chronic myeloid leukemia (51), and is presently in clinical trials
as an anticancer drug (52).
Roscovitine is a small molecule that inhibits the activity of
cyclin-dependent kinases by competitively binding to ATP-binding
sites (53). Previous studies have
confirmed that roscovitine blocks the cell cycle of cancer cells
(54,55) and has synergistic effects with other
anticancer drugs (56). In the
present study, the IC50 values of the aforementioned top
three chemotherapy drugs were higher in the HER2-positive group
than in the HER2-negative group. Thus, AS601245, AP.24534 and
roscovitine show promise for clinical application in HER2-positive
breast cancer treatment.
In addition, a prognostic risk model was constructed
using ETFA, RAPGEFL1, KRT7, CD24, PRR15L, ALOX15B, ELOVL2 and
CXCL9. Numerous studies have demonstrated the importance of these
genes in various cancer types. Chen et al (57) revealed that ETFA expression was
upregulated in colorectal cancer, and that NBPF4 suppressed the
progression of colorectal cancer by controlling the activity of
EZH2-associated ETFA. Zhou et al (58) observed the amplification of
RAPGEFL1 in HER2-positive gastric cancer samples. KRT7
belongs to the family of genes known as keratins, which are highly
expressed in numerous types of cancer and facilitate tumor
progression (59,60). CD24 regulates the physiological
activity of cancer cells (61).
Furthermore, Li et al (62)
reported that p53 induced iron death in bladder cancer cells by
stimulating the lipoxygenase function of ALOX15B via suppression of
SLC7A11. Hu et al (32)
showed that ELOVL2 inhibited cell invasion, migration and
proliferation in prostate cancer by modulating the activity of the
cancer suppressor INPP4B. Seitz et al (63) demonstrated that CXCL9 inhibited
tumor progression and enhanced the efficacy of anti-PD-L1 treatment
in ovarian cancer. PRR15L is overexpressed in certain cancer types
(64). More importantly, RT-qPCR
analysis suggested that the expression of ETFA, RAPGEFL1, KRT7,
CD24, PRR15L, ALOX15B, ELOVL2 and CXCL9 was consistent with the
results of the bioinformatic analysis, indicating the reliability
and robustness of the present study. Therefore, the above eight
genes may be useful treatment targets for breast cancer.
Nomograms are valuable prognostic tools, including
personalized applications and intuitive visual representations
(65). In the current study, a
nomogram was built using age, M stage and RiskScore, which
demonstrated high accuracy in estimating the survival probabilities
of individuals diagnosed with breast cancer, with ROC curves
showing AUCs >0.75 at 1, 3 and 5 years, indicating an accurate
predictive capability for survival. Wang et al (66) constructed a prognostic model for
HER2-positive breast cancer based on nine autophagy-related genes
(ARGs). The analytical methods used in that study are consistent
with those used in the present study, and all the constructed
prognostic models exhibited good accuracy and predictive ability.
Zhao et al (67) constructed
a prognostic model for predicting male patients with HER2-positive
breast cancer, and the accuracy of this model was verified using
calibration curves and decision curve analysis. The model genes
found in the current study are different from those found in the
models of the studies by Wang et al (66) and Zhao et al (67), which may be due to the different
datasets selected. Wang et al (66) mainly studied ARGs, while Zhao et
al (67) studied male patients
with breast cancer, resulting in the selection of datasets and
final model genes that are not consistent with the present study.
Furthermore, a previous study found that a risk model composed of
PTGDR, PNOC and CCL23 was helpful in predicting the prognosis of
HER2-positive breast cancer, and that patients with low risk scores
may benefit from immunotherapy (68). In general, the current and previous
studies have shown that the constructed models are accurate and
reliable, and can help clinicians select appropriate treatment
strategies for HER2-positive breast cancer. However, these models
require further investigations. Therefore, in the present study,
the molecular mechanisms of the key gene ELOVL2 in HER2-positive
breast cancer were preliminarily explored. The results showed that
ELOVL2 overexpression inhibited the proliferation of HER2-positive
breast cancer cells by inhibiting the PI3K-AKT pathway, suggesting
that ELOVL2 is a potential target gene for the treatment of
patients with HER2-positive breast cancer, laying the foundation
for targeted therapy and improving the clinical adaptability of
this model.
However, the current study has several limitations.
First, the small sample size may have affected the accuracy of the
results. Second, the molecular mechanisms of key genes affecting
the prognosis of patients with HER2-positive breast cancer require
further exploration. Third, the screened drugs must be validated
experimentally. Therefore, future studies should collect additional
cases, include a larger number of clinical samples, and conduct
relevant clinical studies to provide effective personalized
treatment plans or targeted therapies for patients and to improve
their prognosis.
In conclusion, a valuable prognostic model that
included eight HER2-related genes was developed in the current
study. This model could accurately evaluate the survival rate of
patients with HER2-positive breast cancer, and provide effective
indicators or therapeutic targets for HER2-positive breast cancer.
The present findings provide a new direction for the development of
novel immunotherapeutic targets and personalized treatment for
HER2-positive breast cancer.
Acknowledgements
Not applicable.
Funding
The present study was supported by the Weifang City Science and
Technology Development Plan Project (grant no. 2022YX016).
Availability of data and materials
The data generated in the present study may be
requested from the corresponding author.
Authors' contributions
LH, CX, YS, FS, XS, HY, ML and NL contributed to the
conception and design of the study. Material preparation and
drafting of the manuscript were performed by LH and CX. Acquisition
of data was performed by YS and FS. Analysis and interpretation of
data were conducted by XS and XY. Statistical analysis was
performed by ML. Revision of the manuscript for important
intellectual content were conducted by NL. LH and CX confirm the
authenticity of all the raw data. All authors read and approved the
final version of the manuscript.
Ethics approval and consent to
participate
The present study was conducted in accordance with
the Declaration of Helsinki, and received ethics approval from the
Weifang Hospital of Traditional Chinese Medicine Ethics Committee
(approval no. WF2023-428/2023.4.23). All the participants provided
written informed consent for participation.
Patient consent for publication
Not applicable.
Competing interests
The authors declare that they have no competing
interests.
References
|
1
|
Giaquinto AN, Sung H, Newman LA, Freedman
RA, Smith RA, Star J, Jemal A and Siegel RL: Breast cancer
statistics 2024. CA Cancer J Clin. 74:477–495. 2024.
|
|
2
|
Xiong X, Zheng LW, Ding Y, Chen YF, Cai YW
and Wang LP: Huang L, Liu CC, Shao ZM and Yu KD: Breast cancer:
Pathogenesis and treatments. Signal Transduct Target Ther.
10:492025. View Article : Google Scholar
|
|
3
|
Xia C, Dong X, Li H, Cao M, Sun D, He S,
Yang F, Yan X, Zhang S, Li N and Chen W: Cancer statistics in China
and United States, 2022: Profiles, trends, and determinants. Chin
Med J (Engl). 135:584–590. 2022. View Article : Google Scholar
|
|
4
|
Yin Y, Song L, Shi D, Liu B, Li X, Yang M,
Liu B, Wang D and Qin J: Identification of recurrent insertions and
deletions in exon 18 and 19 of human epidermal growth factor
receptor 2 as potential drivers in non-small-cell lung cancer and
other cancer types. JCO Precis Oncol. 6:e21003252022. View Article : Google Scholar
|
|
5
|
Cheng X: A comprehensive review of HER2 in
cancer biology and therapeutics. Genes (Basel). 15:9032024.
View Article : Google Scholar
|
|
6
|
Marchiò C, Annaratone L, Marques A,
Casorzo L, Berrino E and Sapino A: Evolving concepts in HER2
evaluation in breast cancer: Heterogeneity, HER2-low carcinomas and
beyond. Semin Cancer Biol. 72:123–135. 2021. View Article : Google Scholar
|
|
7
|
Chen Z, Yang L, Yang Z, Wang Z, He W and
Zhang W: Ultrasonic-responsive piezoelectric stimulation enhances
sonodynamic therapy for HER2-positive breast cancer. J
Nanobiotechnology. 22:3692024. View Article : Google Scholar
|
|
8
|
Ocaña A, Amir E and Pandiella A: HER2
heterogeneity and resistance to anti-HER2 antibody-drug conjugates.
Breast Cancer Res. 22:152020. View Article : Google Scholar
|
|
9
|
Kang S and Kim SB: HER2-low breast cancer:
Now and in the future. Cancer Res Treat. 56:700–720. 2024.
View Article : Google Scholar
|
|
10
|
Shi Z, Liu Y, Fang X, Liu X, Meng J and
Zhang J: Efficacy and prognosis of HER2-low and HER2-zero in
triple-negative breast cancer after neoadjuvant chemotherapy. Sci
Rep. 14:168992024. View Article : Google Scholar
|
|
11
|
Rizvi AA, Karaesmen E, Morgan M, Preus L,
Wang J, Sovic M, Hahn T and Sucheston-Campbell LE: gwasurvivr: An R
package for genome-wide survival analysis. Bioinformatics.
35:1968–1970. 2019. View Article : Google Scholar
|
|
12
|
Chen B, Khodadoust MS, Liu CL, Newman AM
and Alizadeh AA: Profiling tumor infiltrating immune cells with
CIBERSORT. Methods Mol Biol. 1711:243–259. 2018. View Article : Google Scholar
|
|
13
|
Xiao B, Liu L, Li A, Xiang C, Wang P, Li H
and Xiao T: Identification and verification of immune-related gene
prognostic signature based on ssGSEA for osteosarcoma. Front Oncol.
10:6076222020. View Article : Google Scholar
|
|
14
|
Aran D: Cell-type enrichment analysis of
bulk transcriptomes using xCell. Methods Mol Biol. 2120:263–276.
2020. View Article : Google Scholar
|
|
15
|
Hu D, Zhou M and Zhu X: Deciphering
immune-associated genes to predict survival in clear cell renal
cell cancer. Biomed Res Int. 2019:25068432019. View Article : Google Scholar
|
|
16
|
Mayakonda A, Lin DC, Assenov Y, Plass C
and Koeffler HP: Maftools: Efficient and comprehensive analysis of
somatic variants in cancer. Genome Res. 28:1747–1756. 2018.
View Article : Google Scholar
|
|
17
|
Geeleher P, Cox N and Huang RS:
pRRophetic: An R package for prediction of clinical
chemotherapeutic response from tumor gene expression levels. PLoS
One. 9:e1074682014. View Article : Google Scholar
|
|
18
|
Reimand J, Isserlin R, Voisin V, Kucera M,
Tannus-Lopes C, Rostamianfar A, Wadi L, Meyer M, Wong J, Xu C, et
al: Pathway enrichment analysis and visualization of omics data
using g:Profiler, GSEA, Cytoscape and EnrichmentMap. Nat Protoc.
14:482–517. 2019. View Article : Google Scholar
|
|
19
|
Ritchie ME, Phipson B, Wu D, Hu Y, Law CW,
Shi W and Smyth GK: limma powers differential expression analyses
for RNA-sequencing and microarray studies. Nucleic Acids Res.
43:e472015. View Article : Google Scholar
|
|
20
|
Yu G, Wang LG, Han Y and He QY:
clusterProfiler: An R package for comparing biological themes among
gene clusters. OMICS. 16:284–287. 2012. View Article : Google Scholar
|
|
21
|
Tibshirani R: The lasso method for
variable selection in the Cox model. Stat Med. 16:385–395. 1997.
View Article : Google Scholar
|
|
22
|
Zhang S, Tong YX, Zhang XH, Zhang YJ, Xu
XS, Xiao AT, Chao TF and Gong JP: A novel and validated nomogram to
predict overall survival for gastric neuroendocrine neoplasms. J
Cancer. 10:5944–5954. 2019. View Article : Google Scholar
|
|
23
|
Wang L, Peng F, Li ZH, Deng YF, Ruan MN,
Mao ZG and Li L: Identification of AKI signatures and
classification patterns in ccRCC based on machine learning. Front
Med (Lausanne). 10:11956782023. View Article : Google Scholar
|
|
24
|
Gustavsson EK, Zhang D, Reynolds RH,
Garcia-Ruiz S and Ryten M: ggtranscript: An R package for the
visualization and interpretation of transcript isoforms using
ggplot2. Bioinformatics. 38:3844–3846. 2022. View Article : Google Scholar
|
|
25
|
Zhang H, Meltzer P and Davis S: RCircos:
An R package for Circos 2D track plots. BMC Bioinformatics.
14:2442013. View Article : Google Scholar
|
|
26
|
Pal B, Chen Y, Vaillant F, Capaldo BD,
Joyce R, Song X, Bryant VL, Penington JS, Di Stefano L, Tubau
Ribera N, et al: A single-cell RNA expression atlas of normal,
preneoplastic and tumorigenic states in the human breast. EMBO J.
40:e1073332021. View Article : Google Scholar
|
|
27
|
Han Y, Wang Y, Dong X, Sun D, Liu Z, Yue
J, Wang H, Li T and Wang C: TISCH2: Expanded datasets and new tools
for single-cell transcriptome analyses of the tumor
microenvironment. Nucleic Acids Res. 51(D1): D1425–D1431. 2023.
View Article : Google Scholar
|
|
28
|
Livak KJ and Schmittgen TD: Analysis of
relative gene expression data using real-time quantitative PCR and
the 2(−Delta Delta C(T)) method. Methods. 25:402–408. 2001.
View Article : Google Scholar
|
|
29
|
Kokot A, Gadakh S, Saha I, Gajda E,
Łaźniewski M, Rakshit S, Sengupta K, Mollah AF, Denkiewicz M,
Górczak K, et al: Unveiling the molecular mechanism of trastuzumab
resistance in SKBR3 and BT474 cell lines for HER2 positive breast
cancer. Curr Issues Mol Biol. 46:2713–2740. 2024. View Article : Google Scholar
|
|
30
|
Ogitani Y, Hagihara K, Oitate M, Naito H
and Agatsuma T: Bystander killing effect of DS-8201a, a novel
anti-human epidermal growth factor receptor 2 antibody-drug
conjugate, in tumors with human epidermal growth factor receptor 2
heterogeneity. Cancer Sci. 107:1039–1046. 2016. View Article : Google Scholar
|
|
31
|
Jeong D, Ham J, Kim HW, Kim H, Ji HW, Yun
SH, Park JE, Lee KS, Jo H, Han JH, et al: ELOVL2: A novel tumor
suppressor attenuating tamoxifen resistance in breast cancer. Am J
Cancer Res. 11:2568–2589. 2021.
|
|
32
|
Hu T, Zhang H, Du Y, Luo S, Yang X, Zhang
H, Feng J, Chen X, Tu X, Wang C and Zhang Y: ELOVL2 restrains cell
proliferation, migration, and invasion of prostate cancer via
regulation of the tumor suppressor INPP4B. Cell Signal.
96:1103732022. View Article : Google Scholar
|
|
33
|
Vranić S, Bešlija S and Gatalica Z:
Targeting HER2 expression in cancer: New drugs and new indications.
Bosn J Basic Med Sci. 21:1–4. 2021.
|
|
34
|
Rittler D, Baranyi M, Molnár E, Garay T,
Jalsovszky I, Varga IK, Hegedűs L, Aigner C, Tóvári J, Tímár J and
Hegedűs B: The antitumor effect of lipophilic bisphosphonate
BPH1222 in melanoma models: The role of the PI3K/Akt pathway and
the small G protein Rheb. Int J Mol Sci. 20:49172019. View Article : Google Scholar
|
|
35
|
Soltani A, Torki S, Ghahfarokhi MS, Jami
MS and Ghatrehsamani M: Targeting the phosphoinositide 3-kinase/AKT
pathways by small molecules and natural compounds as a therapeutic
approach for breast cancer cells. Mol Biol Rep. 46:4809–4816. 2019.
View Article : Google Scholar
|
|
36
|
Ye X, Liu J, Yuan X, Yang S, Huang Y and
Chen Y: Molecular mechanism of Salvia miltiorrhiza bunge in
treating cerebral infarction. Evid Based Complement Alternat Med.
2022:59923942022. View Article : Google Scholar
|
|
37
|
Wu X, Pan J, Yu JJ, Kang J, Hou S, Cheng
M, Xu L, Gong L and Li Y: DiDang decoction improves mitochondrial
function and lipid metabolism via the HIF-1 signaling pathway to
treat atherosclerosis and hyperlipidemia. J Ethnopharmacol.
308:1162892023. View Article : Google Scholar
|
|
38
|
Kulkoyluoglu-Cotul E, Arca A and
Madak-Erdogan Z: Crosstalk between estrogen signaling and breast
cancer metabolism. Trends Endocrinol Metab. 30:25–38. 2019.
View Article : Google Scholar
|
|
39
|
Hinshaw DC and Shevde LA: The tumor
microenvironment innately modulates cancer progression. Cancer Res.
79:4557–4566. 2019. View Article : Google Scholar
|
|
40
|
de Visser KE and Joyce JA: The evolving
tumor microenvironment: From cancer initiation to metastatic
outgrowth. Cancer Cell. 41:374–403. 2023. View Article : Google Scholar
|
|
41
|
Mao M, Yu Q, Huang R, Lu Y, Wang Z and
Liao L: Stromal score as a prognostic factor in primary gastric
cancer and close association with tumor immune microenvironment.
Cancer Med. 9:4980–4990. 2020. View Article : Google Scholar
|
|
42
|
Song J, Yang R, Wei R, Du Y, He P and Liu
X: Pan-cancer analysis reveals RIPK2 predicts prognosis and
promotes immune therapy resistance via triggering cytotoxic T
lymphocytes dysfunction. Mol Med. 28:472022. View Article : Google Scholar
|
|
43
|
Xia Y, Rao L, Yao H, Wang Z, Ning P and
Chen X: Engineering macrophages for cancer immunotherapy and drug
delivery. Adv Mater. 32:e20020542020. View Article : Google Scholar
|
|
44
|
Sun Y, Lian Y, Mei X, Xia J, Feng L, Gao
J, Xu H, Zhang X, Yang H, Hao X and Feng Y: Cinobufagin inhibits
M2-like tumor-associated macrophage polarization to attenuate the
invasion and migration of lung cancer cells. Int J Oncol.
65:1022024. View Article : Google Scholar
|
|
45
|
Zhang Y, Chen S, You L, He Z, Xu P and
Huang W: LINC00161 upregulated by M2-like tumor-associated
macrophages promotes hepatocellular carcinoma progression by
methylating HACE1 promoters. Cytotechnology. 76:777–793. 2024.
View Article : Google Scholar
|
|
46
|
Yamaguchi T, Fushida S, Yamamoto Y,
Tsukada T, Kinoshita J, Oyama K, Miyashita T, Tajima H, Ninomiya I,
Munesue S, et al: Tumor-associated macrophages of the M2 phenotype
contribute to progression in gastric cancer with peritoneal
dissemination. Gastric Cancer. 19:1052–1065. 2016. View Article : Google Scholar
|
|
47
|
Wu Q, Wu W, Jacevic V, Franca TCC, Wang X
and Kuca K: Selective inhibitors for JNK signalling: A potential
targeted therapy in cancer. J Enzyme Inhib Med Chem. 35:574–583.
2020. View Article : Google Scholar
|
|
48
|
Bubici C and Papa S: JNK signalling in
cancer: In need of new, smarter therapeutic targets. Br J
Pharmacol. 171:24–37. 2014. View Article : Google Scholar
|
|
49
|
Luo W, Han Y, Li X, Liu Z, Meng P and Wang
Y: Breast cancer prognosis prediction and immune pathway molecular
analysis based on mitochondria-related genes. Genet Res (Camb).
2022:22499092022. View Article : Google Scholar
|
|
50
|
Katoh M: FGFR inhibitors: Effects on
cancer cells, tumor microenvironment and whole-body homeostasis
(review). Int J Mol Med. 38:3–15. 2016. View Article : Google Scholar
|
|
51
|
Massaro F, Molica M and Breccia M:
Ponatinib: A review of efficacy and safety. Curr Cancer Drug
Targets. 18:847–856. 2018. View Article : Google Scholar
|
|
52
|
Katoh M and Nakagama H: FGF receptors:
Cancer biology and therapeutics. Med Res Rev. 34:280–300. 2014.
View Article : Google Scholar
|
|
53
|
Cicenas J, Kalyan K, Sorokinas A,
Stankunas E, Levy J, Meskinyte I, Stankevicius V, Kaupinis A and
Valius M: Roscovitine in cancer and other diseases. Ann Transl Med.
3:1352015.
|
|
54
|
Raynaud FI, Whittaker SR, Fischer PM,
McClue S, Walton MI, Barrie SE, Garrett MD, Rogers P, Clarke SJ,
Kelland LR, et al: In vitro and in vivo
pharmacokinetic-pharmacodynamic relationships for the
trisubstituted aminopurine cyclin-dependent kinase inhibitors
olomoucine, bohemine and CYC202. Clin Cancer Res. 11:4875–4887.
2005. View Article : Google Scholar
|
|
55
|
De Azevedo WF, Leclerc S, Meijer L,
Havlicek L, Strnad M and Kim SH: Inhibition of cyclin-dependent
kinases by purine analogues: Crystal structure of human cdk2
complexed with roscovitine. Eur J Biochem. 243:518–526. 1997.
View Article : Google Scholar
|
|
56
|
Lambert LA, Qiao N, Hunt KK, Lambert DH,
Mills GB, Meijer L and Keyomarsi K: Autophagy: A novel mechanism of
synergistic cytotoxicity between doxorubicin and roscovitine in a
sarcoma model. Cancer Res. 68:7966–7974. 2008. View Article : Google Scholar
|
|
57
|
Chen W, Di Z, Chen Z, Nan K, Gu J, Ge F,
Liu J, Zhang H and Miao C: NBPF4 mitigates progression in
colorectal cancer through the regulation of EZH2-associated ETFA. J
Cell Mol Med. 25:9038–9050. 2021. View Article : Google Scholar
|
|
58
|
Zhou C, Feng X, Yuan F, Ji J, Shi M, Yu Y,
Zhu Z and Zhang J: Difference of molecular alterations in
HER2-positive and HER2-negative gastric cancers by whole-genome
sequencing analysis. Cancer Manag Res. 10:3945–3954. 2018.
View Article : Google Scholar
|
|
59
|
An Q, Liu T, Wang MY, Yang YJ, Zhang ZD,
Liu ZJ and Yang B: KRT7 promotes epithelial-mesenchymal transition
in ovarian cancer via the TGF-β/Smad2/3 signaling pathway. Oncol
Rep. 45:481–492. 2021. View Article : Google Scholar
|
|
60
|
Song J, Ruze R, Chen Y, Xu R, Yin X, Wang
C, Xu Q and Zhao Y: Construction of a novel model based on
cell-in-cell-related genes and validation of KRT7 as a biomarker
for predicting survival and immune microenvironment in pancreatic
cancer. BMC Cancer. 22:8942022. View Article : Google Scholar
|
|
61
|
Altevogt P, Sammar M, Hüser L and
Kristiansen G: Novel insights into the function of CD24: A driving
force in cancer. Int J Cancer. 148:546–559. 2021. View Article : Google Scholar
|
|
62
|
Li X, Xiong W, Wang Y, Li Y, Cheng X and
Liu W: p53 activates the lipoxygenase activity of ALOX15B via
inhibiting SLC7A11 to induce ferroptosis in bladder cancer cells.
Lab Invest. 103:1000582023. View Article : Google Scholar
|
|
63
|
Seitz S, Dreyer TF, Stange C, Steiger K,
Bräuer R, Scheutz L, Multhoff G, Weichert W, Kiechle M, Magdolen V
and Bronger H: CXCL9 inhibits tumour growth and drives anti-PD-L1
therapy in ovarian cancer. Br J Cancer. 126:1470–1480. 2022.
View Article : Google Scholar
|
|
64
|
Mizuguchi Y, Sakamoto T, Hashimoto T,
Tsukamoto S, Iwasa S, Saito Y and Sekine S: Identification of a
novel PRR15L-RSPO2 fusion transcript in a sigmoid colon cancer
derived from superficially serrated adenoma. Virchows Arch.
475:659–663. 2019. View Article : Google Scholar
|
|
65
|
Wu J, Zhang H, Li L, Hu M, Chen L, Xu B
and Song Q: A nomogram for predicting overall survival in patients
with low-grade endometrial stromal sarcoma: A population-based
analysis. Cancer Commun (Lond). 40:301–312. 2020. View Article : Google Scholar
|
|
66
|
Wang F, Fang L, Fu B and Fan C:
Construction of a prognostic risk assessment model for HER2 +
breast cancer based on autophagy-related genes. Breast Cancer.
30:478–488. 2023. View Article : Google Scholar
|
|
67
|
Zhao L, Lin Z, Nong S, Li C, Li J, Lin C,
Safi SZ, Huang S and Ismail ISB: Development and validation of a
prognostic nomogram model for HER2-positive male breast cancer
patients. Asian Pac J Cancer Prev. 25:3199–3207. 2024. View Article : Google Scholar
|
|
68
|
Lin J, Zhao A and Fu D: Evaluating the
tumor immune profile based on a three-gene prognostic risk model in
HER2 positive breast cancer. Sci Rep. 12:93112022. View Article : Google Scholar
|