Introduction
Colon adenocarcinoma (COAD) is a highly malignant
gastrointestinal tumor characterized by difficulties in early
diagnosis and an unfavorable prognosis. According to the latest
global estimates, ~1.93 million new cases and >900,000
COAD-related deaths were reported in 2023, ranking COAD as the
third most common cancer and the second leading cause of
cancer-related mortality worldwide (1). Current therapeutic strategies,
including surgical resection, chemotherapy, radiotherapy and
targeted therapies (such as anti-EGFR and anti-VEGF agents), have
improved outcomes for patients with early-stage disease (2). However, patients with advanced-stage
COAD often derive limited survival benefit due to tumor
heterogeneity, therapeutic resistance and the lack of reliable
prognostic biomarkers, highlighting the urgent need for accurate
risk stratification models to support individualized treatment
strategies (3,4).
A previous study has underscored the critical roles
of RNA epigenetic modifications, particularly N6-methyladenosine
(m6A) methylation, and programmed cell death (PCD) in the
pathogenesis and progression of COAD (5). m6A, the most abundant internal
modification of mammalian mRNA, is dynamically regulated by
‘writers’ [methyltransferases such as methyltransferase-like 3
(METTL3)], ‘readers’ [recognition proteins such as YTH
domain-containing protein 1 (YTHDC1)] and ‘erasers’ (demethylases),
thereby influencing mRNA stability, splicing and translation
(6,7). This modification plays a crucial role
in regulating tumor cell behavior, including proliferation and
therapeutic response (8,9). In parallel, PCD comprises 14 regulated
forms of cell death, including apoptosis, pyroptosis, ferroptosis
and autophagy, which are essential for maintaining tissue
homeostasis but are frequently dysregulated in cancer, facilitating
tumor survival and treatment resistance (10,11).
Accumulating evidence indicates that m6A modification can regulate
PCD pathways by modulating the expression of key genes, thereby
influencing tumor cell fate and disease progression (12,13).
Despite these advances, most previous studies have
examined m6A modification and PCD in isolation, leaving a critical
gap in understanding their integrated prognostic value and
mechanistic interplay in COAD. In particular, the complex
interaction between epitranscriptomic regulation and downstream
cell death execution pathways during tumor progression has not been
adequately addressed (14–17). To date and to the best of our
knowledge, no comprehensive prognostic models have combined m6A
regulators with PCD-related genes to predict patient outcomes or
identify actionable therapeutic targets, which is essential for
linking epigenetic regulation to cell death control and optimizing
immunotherapy efficacy.
To address this gap, the present study aimed to
systematically investigate the prognostic and biological
significance of m6A modification in relation to PCD pathways in
COAD. By integrating transcriptomic data from multiple cohorts, an
m6A-PCD-based prognostic model was constructed to evaluate its
potential for patient stratification and therapeutic response
prediction. In addition, single-cell RNA sequencing datasets and
clinical sample validation were used to identify tumor-specific
genes associated with this signature. Functional experiments were
further performed to explore the potential role of key candidate
genes and to investigate the regulatory relationship between m6A
modification and PCD-related molecular mechanisms in COAD.
Materials and methods
Cell line culture and
transfection
Human colon cancer cell lines, RKO and LOVO, were
cultured in RPMI-1640 medium (BioSharp Life Sciences) supplemented
with 10% fetal bovine serum (Gibco; Thermo Fisher Scientific, Inc.)
and 1% penicillin-streptomycin (Gibco; Thermo Fisher Scientific,
Inc.) at 37°C in a humidified atmosphere containing 5%
CO2. Small interfering (si)RNAs targeting METTL3, YTHDC1
and STK25 were synthesized by Shanghai GenePharma Co., Ltd. To
ensure efficient gene silencing and reduce potential off-target
effects, different siRNA sequences targeting the same gene were
evaluated in the two cell lines, and the siRNA exhibiting the
highest knockdown efficiency in each cell line was used for
subsequent experiments. Transient transfections were performed
using siRNA-Mate Plus transfection reagent (Shanghai GenePharma
Co., Ltd.) according to the manufacturer's instructions. The siRNA
premix was prepared at a concentration of 1.5 pmol/µl (~1.5 µM).
Cells were transfected at 37°C in a 5% CO2 incubator,
and transfection efficiency was assessed 48 h post-transfection.
RNA extraction and subsequent RNA-based experiments were performed
48 h after transfection. The siRNA sequences used in the present
study were as follows (5′-3′): RKO: siMETTL3-Homo-929 sense,
GUGCAAGAAUUCUGUGACUTT; siMETTL3-Homo-929 antisense,
AGUCACAGAAUUCUUGCACTT; siYTHDC1-Homo-1883 sense,
GCGUCGACCAGAAGAUUAUTT; siYTHDC1-Homo-1883 antisense,
GCGUCGACCAGAAGAUUAUTT; siSTK25-Homo-518 sense,
GAGACAUACAUUGCCACGATT; and siSTK25-Homo-518 antisense,
UCGUGGCAAUGUAUGUCUCTT. LOVO: siMETTL3-Homo-208 sense,
GCACUUGGAUCUACGGAAUTT; siMETTL3-Homo-208 antisense,
AUUCCGUAGAUCCAAGUGCTT; siYTHDC1-Homo-1595 sense,
GCUGGGAGGUGUCUUUAAATT; siYTHDC1-Homo-1595 antisense,
UUUAAAGACACCUCCCAGCTT; siSTK25-Homo-288 sense,
GCAUCGAUAACCACACAAATT; and siSTK25-Homo-288 antisense,
UUUGUGUGGUUAUCGAUGCTT.
Patient tissue samples
Colon cancer tissues and matched adjacent normal
tissues were collected from 10 patients who underwent radical
surgical resection at Fujian Medical University Union Hospital
(Fuzhou, China) between December 1, 2025, and December 31, 2025.
Adjacent normal tissues were obtained from areas located at least 5
cm away from the tumor margin. The cohort included 5 male and 5
female patients, with a median age of 55.5 years (range, 35–74
years). The inclusion criterion was histologically confirmed colon
adenocarcinoma in patients who had not received preoperative
chemotherapy or radiotherapy. Patients who had received neoadjuvant
therapy or had incomplete clinical information were excluded.
Written informed consent was obtained from all participants, and
the study was approved by the Institutional Ethics Committee of
Fujian Medical University Union Hospital (approval no.
2025KY307).
Cell apoptosis assay
Cell apoptosis was assessed by flow cytometry using
an Annexin V-FITC/PI Apoptosis Detection Kit (Beyotime
Biotechnology). Briefly, cells were resuspended in binding buffer,
incubated with Annexin V-FITC and PI in the dark for 30 min at room
temperature. Samples were analyzed using a BD FACSCanto II flow
cytometer (BD Biosciences), and data were processed using FlowJo
software (version 10.8.1; BD Biosciences).
Western blotting
Cell pellets derived from paired tumor and adjacent
normal tissues were lysed in RIPA buffer (cat. no. P0013B; Beyotime
Biotechnology), and protein concentrations were determined using a
BCA Protein Assay Kit. Equal amounts of protein (40 µg) were
separated on 10% gels using SDS-PAGE and transferred onto PVDF
membranes. Membranes were blocked with 5% non-fat milk for 2 h at
room temperature and then incubated overnight at 4°C with the
primary STK25 polyclonal antibody (cat. no. 25821-1-AP, 1:1,000
dilution; Proteintech Group, Inc.). The membranes were also
incubated with GAPDH antibody (cat. no. 60004-1-Ig; 1:5,000
dilution; Proteintech Group, Inc.) as a loading control. After
three washes with TBST (TBS containing 0.05% Tween-20; 5 min each),
membranes were incubated with horseradish peroxidase-conjugated
secondary antibodies (cat. no. A0208; 1:5,000 dilution; Beyotime
Biotechnology) for 1 h at room temperature. Membranes were washed
again as aforementioned and protein bands were detected using an
enhanced chemiluminescence detection kit (cat. no. P0018; Beyotime
Biotechnology), with reagents A and B mixed at a 1:1 ratio in the
dark. The chemiluminescent signals were captured using a ChemiDoc
XRS+ imaging system (Bio-Rad Laboratories, Inc.).
Reverse transcription-quantitative PCR
(RT-qPCR)
Total RNA from the cells was extracted using QIAzol
reagent (Qiagen, Inc.). Subsequently, 2 µg of total RNA was
reverse-transcribed into cDNA using a commercial reverse
transcription kit (PrimeScript™ RT Reagent Kit; cat. no. RR047A;
Takara Bio, Inc.) according to the manufacturer's instruction. PCR
amplification was performed using SYBR GREEN qPCR Master Mix TB
Green® Premix Ex Taq™ II; cat. no. RR820A; Takara Bio,
Inc.) on an ABI 7500 Real-Time PCR System (Applied Biosystems;
Thermo Fisher Scientific, Inc.). The thermocycling conditions were
as follows: Initial denaturation at 95°C for 30 sec, followed by 40
cycles of 95°C for 5 sec and 60°C for 34 sec. GAPDH was used as an
internal control. Relative gene expression levels were calculated
using the 2-ΔΔCq method (18). The primer sequences used were as
follows (5′-3′): STK25 forward, GCACAGCAAGCCCTTCAAGG; STK25
reverse, CGTCCCCTTGTGAAGCTTGC; METTL3 forward,
CTACGGAATCCAGAGGCAGCATTG; METTL3 reverse,
GAGATGGCAAGACAGATGGACACAG; YTHDC1 forward, TGGAGAGGAGGAGGAGGAAGAGG;
YTHDC1 reverse, CGGACAGCACGAACGGAAGATG; GAPDH forward,
CAAGGCTGTGGGCAAGGTCATC; and GAPDH reverse,
GTGTCGCTGTTGAAGTCAGAGGAG.
RNA immunoprecipitation (RIP)
assay
RIP assays were performed using a RIP Kit (cat. no.
17-700; Merck KGaA) according to the manufacturer's instructions.
Briefly, magnetic beads were incubated overnight at 4°C with 5 µg
of antibodies against METTL3 (Cohesion Biosciences Limited; cat.
no. CQA1783) or YTHDC1 (Abcam; cat. no. ab264375) or normal IgG as
a negative control (Beyotime Biotechnology, cat. no. A7016). The
antibody-conjugated beads were then incubated with 500 µg of cell
lysates, followed by washing five times using the RIP washing
buffer provided in the kit. RNA-protein complexes were digested
with proteinase K at 55°C for 30 min, and the bound RNA was
subsequently eluted using the RIP elution buffer supplied with the
kit, purified and analyzed by RT-qPCR to determine enrichment
levels. The enrichment of target transcripts (STK25 mRNA) was
assessed. The aforementioned primers used in the RT-qPCR were used
for the analysis.
m6A methylated RIP-qPCR
(MeRIP-qPCR)
MeRIP was performed using the MeRIP m6A Kit (cat.
no. GS-ET-001A; Cloud-Seq Biotech Ltd. Co.) following the
manufacturer's protocol. Briefly, 5 µg of chemically fragmented RNA
was immunoprecipitated using 5 µg of anti-m6A antibody. The
precipitated RNA and input RNA (control) were then analyzed by
RT-qPCR using specific primers for STK25 (5′-3′): Forward,
TTCTGAAGGGCCTGGATTATCTGC and reverse,
TTCTTGGGAATCAGGAACAGGACGC.
Gene set sources and The Cancer Genome
Atlas (TCGA) data processing
Gene sets associated with different forms of PCD
were curated from published literature (19,20)
and databases (FerrDb, www.zhounan.org/ferrdb; HADb, http://autophagy.lu/clustering/index.html). For each
PCD type, a corresponding gene list was compiled based on these
sources. The number in parentheses indicates the number of genes
included in each gene set. Specifically, the curated gene sets
included: Apoptosis (n=580), autophagy (n=525), lysosome-dependent
cell death (n=220), necroptosis (n=105), ferroptosis (n=104),
pyroptosis (n=64), immunogenic cell death (n=40), cuproptosis
(n=21), entotic cell death (n=19), NETotic cell death (n=10),
alkaliptosis (n=8), parthanatos (n=7), oxeiptosis (n=5) and
disulfidptosis (n=4). The gene expression dataset for COAD was
obtained from TCGA database (https://www.cancer.gov/ccg/research/genome-sequencing/tcga).
Data preprocessing was conducted using the R package (version
4.5.0), TCGAbiolinks (version 2.30.1). Raw expression matrices were
subjected to quality control (QC) with the
TCGAanalyze_Preprocessing function (cor.cut=0.6) to remove
low-quality samples. Technical biases were corrected using the
TCGAanalyze_Normalization function and low-expression genes were
filtered out with the TCGAanalyze_Filtering function
(qnt.cut=0.25). Differential expression analysis between tumor and
adjacent normal tissues was performed using the edge R package
(version 3.42.4). Genes with P<0.05 were considered
significantly differentially expressed genes (DEGs). PCD-related
DEGs were identified by intersecting the DEG list with predefined
PCD-related gene sets. Gene Ontology (GO) and Kyoto Encyclopedia of
Genes and Genomes (KEGG) pathway enrichment analyses of upregulated
and downregulated DEGs were conducted separately using the enrichGO
and enrichKEGG functions from the clusterProfiler (version
4.8.1).
Construction of the MCDI clinical
prediction model
Univariate Cox regression analysis of PCD-related
genes was performed using the survival (version 3.5–5) R package.
Spearman correlation analysis between PCD-related genes and m6A
regulators was conducted using the Hmisc package (version 5.1–1).
Genes that were significant in the univariate analysis and
correlated with m6A regulators were combined and LASSO Cox
regression was applied using the glmnet package (version 4.1–8) to
select the final signature genes. The risk score for each patient,
designated the MCDI, was calculated using the following formula:
MCDI = (0.011510365 × ATG13 exp.) + (−0.013042804 × CARS1 exp.) +
(−0.020456124 × DEF8 exp.) + (0.016717586 × FBH1 exp.) +
(0.020419640 × FLCN exp.) + (0.016380593 × IDUA exp.) +
(−0.031405568 × ING5 exp.) + (0.048748645 × MIR210 exp.) +
(0.025716205 × PIDD1 exp.) + (0.009329190 × PIP4K2B exp.) +
(−0.015689712 × PLA2G15 exp.) + (0.033027922 × STK25 exp.) +
(0.099700295 × TGFB2 exp.) + (0.015789901 × TRADD exp.) +
(0.001302880 × TRAF2 exp.) + (0.346873020 × TRIM6 exp.) +
(0.068723205 × TRIM68 exp.) + (0.006337617 × TYK2 exp.) +
(−0.014371960 × USP21 exp.) + (−0.012858944 × WDR6 exp.) +
(0.003176967 × ZFYVE1 exp.). Within these formulae, ‘exp.’
designates the normalized expression level of each gene in the TCGA
dataset.
Construction of the similarity network
for the 21 PCD-related genes
A co-expression network among the 21 signature genes
was constructed based on Spearman correlation analysis
(|R|>0.15, P<0.05) and visualized using Cytoscape software
(version 3.10.1; Cytoscape Consortium).
Differential expression analysis
between high- and low-risk groups in TCGA-COAD dataset
Differential expression analysis between the
MCDI-defined high- and low-risk groups in the TCGA-COAD cohort was
conducted using the edge R package (version 3.42.4). Patients were
stratified into high- and low-risk groups according to the optimal
cutoff value of the MCDI score determined by the surv_cutpoint
function in the survminer (version 0.4.9) R package. Gene
expression data were first normalized using the Trimmed Mean of
M-values method. Genes with a false discovery rate (FDR) <0.05
and an absolute log2 fold change (|log2FC|)>1 were considered
statistically significant DEGs. The resulting DEG list was
subsequently used for functional enrichment analyses.
Independent prognostic value of
MCDI
Clinical data from the TCGA-COAD cohort and external
validation cohorts (GSE39582, GSE33113, GSE38832, GSE67501,
GSE78220) (21–25), including age, sex, overall tumor
stage (Stages I–IV) and T, N and M stages of the TNM system, were
collected. Univariate and multivariate Cox regression analyses were
performed, incorporating these clinical variables alongside the
MCDI score, to assess the independent prognostic value of the MCDI
in predicting patient survival. Additionally, a prognostic nomogram
was constructed using multivariate Cox regression combined with
stepwise regression, integrating the MCDI score and clinical
characteristics (age, sex, overall stage, T stage and N stage). The
nomogram was visualized using the regplot (version 1.1) R
package.
Correlation analysis between MCDI and
immune checkpoint gene expression
The association between the MCDI score and the
expression levels of immunomodulatory genes was assessed by
calculating Spearman correlation coefficients using the rcorr
function from the R Hmisc package.
Tumor immune microenvironment
analysis
The relative proportions of 22 immune cell types in
each TCGA-COAD sample were estimated using the CIBERSORT tool
(https://github.com/Moonerss/CIBERSORT). The Tumor
Immune Dysfunction and Exclusion (TIDE) score for each sample was
calculated via the online TIDE tool (http://tide.dfci.harvard.edu/) to predict potential
responses to immune checkpoint blockade (ICB) therapy. Somatic
mutation data (simple nucleotide variation) for the TCGA-COAD
cohort were obtained from the Genomic Data Commons portal
(https://portal.gdc.cancer.gov) using the
TCGAbiolinks R package. Tumor mutational burden (TMB) was
calculated with the maftools package (version 2.8.05), normalizing
by an exonic capture region size of 38 Mb, and the resulting values
were log-transformed. Microsatellite instability (MSI) status data
were retrieved from the TCGA-COAD phenotype dataset available
through the UCSC Xena database (https://xenabrowser.net/datapages/).
Single-cell RNA sequencing (scRNA-seq)
data analysis
In total, 2 colon cancer-related scRNA-seq datasets
(GSE132465 and GSE205506) were used for analysis (26,27).
Data processing and analysis were conducted using the Seurat R
package (v4.4.0). QC was applied to remove low-quality cells. After
QC, data were normalized and integrated to correct for batch
effects using the reciprocal principal component analysis (RPCA)
method. Cells were clustered and annotated into six major cell
types based on canonical marker genes. Epithelial cells were then
extracted and divided into tumor and control groups according to
the sample type. These epithelial cells were subjected to
unsupervised re-clustering to identify distinct subpopulations. The
copy number variation (CNV) profile of each epithelial subcluster
was assessed using the inferCNV (version 1.18.1) R package to
evaluate malignant potential. Malignant epithelial subpopulations
were identified based on CNV inference for downstream analyses.
Expression patterns of the gene of interest (STK25) and a known
colorectal cancer malignant epithelial marker (carcinoembryonic
antigen-related cell adhesion molecule 6; CEACAM6) were examined
within these malignant cells. Differential expression analysis
between tumor and control groups was performed using the
FindMarkers function. The MCDI score was then calculated for each
single cell and its distribution was visualized across different
cell types, sample groups and epithelial subpopulations.
Correlation analysis of STK25 with
COAD
The association between STK25 expression and
clinical parameters (MCDI, T stage, N stage, M stage and age) in
the TCGA-COAD cohort was assessed. Kaplan-Meier survival curves
were generated using the ggsurvplot function from the survminer
(version 0.4.9) R package to visualize the impact of STK25
expression levels on patient overall survival (OS).
Prediction of upstream m6A regulators
for STK25
To investigate the expression correlation between
STK25 and 23 known m6A regulatory enzymes, Spearman rank
correlation analysis was performed to calculate correlation
coefficients (ρ) and corresponding P-values. Results were
visualized using the ggplot2 (version 3.5.1) R package.
The RM2Target database (http://rm2target.canceromics.org/), which provides
information on potential associations between m6A regulators and
their target genes, was subsequently utilized. STK25 was input as
the target gene to search for potential m6A regulatory enzymes
modulating its expression. During screening, a confidence score
threshold >4 was applied to ensure high reliability of the
results. Based on this criterion, two potential m6A regulators were
identified: YTHDC1 and METTL3.
Protein-protein interaction (PPI)
network construction
To explore potential functional interactions among
the signature genes, a protein-protein interaction (PPI) network
was constructed using the STRING database (version 12.0; http://string-db.org/). The list of the 21 signature
genes was uploaded to STRING, and interactions with a minimum
required interaction score >0.4 (medium confidence) were
retained. The resulting interaction network was then imported into
Cytoscape (version 3.10.1; http://cytoscape.org/) for visualization and network
analysis.
Statistical analysis
Statistical analyses were conducted using R software
(version 4.3.2) and GraphPad Prism (version 9; Dotmatics). Data are
presented as the mean ± standard deviation. Comparisons between two
groups were performed using both paired and unpaired two-tailed
Student's t-test. For comparisons among multiple groups, one-way
analysis of variance (ANOVA) followed by the Tukey post hoc test
was applied. When the data did not follow a normal distribution,
the Wilcoxon rank-sum test was used. The χ2 test was
applied for categorical variables. Spearman correlation analysis
was performed to evaluate associations between continuous
variables. Two-sided P<0.05 was considered to indicate a
statistically significant difference. Multivariate Cox proportional
hazards regression analysis was performed on the 21 PCD-related
genes using the coxph function in the R survival package to assess
whether their expression levels were independent prognostic
factors.
Results
Dysregulation of PCD Genes in
COAD
To characterize the landscape of PCD in COAD, the
TCGA-COAD transcriptomic dataset was analyzed, focusing on 1,379
genes representing 14 distinct PCD modalities curated from the
literature and databases (Fig. 1A).
Differential expression analysis revealed widespread dysregulation
of PCD-related genes in tumor tissues compared with adjacent normal
tissues, with 438 genes significantly upregulated and 393
downregulated (Fig. 1B).
![Transcriptomic landscape of
programmed cell death-related genes in COAD. (A) The set of 1,379
genes covering the 14 programmed cell death pathways analyzed in
the present study. (B) Volcano plot illustrating differentially
expressed genes between tumor and normal tissues in the TCGA-COAD
cohort. Gray dots indicate genes without significant differential
expression (P≥0.05), whereas red and blue dots denote genes
significantly upregulated and downregulated in tumor tissues,
respectively (P<0.05). Bubble plots showing (C) GO and (D) KEGG
enrichment analyses of the differentially expressed genes. Bubble
size reflects enrichment significance [-log2(P-value)],
and color indicates the direction of regulation (red, upregulated
gene sets; blue, downregulated gene sets). COAD, colon
adenocarcinoma; TCGA, The Cancer Genome Atlas; abs, absolute value;
FC, fold-change; GO, Gene Ontology; KEGG, Kyoto Encyclopedia of
Genes and Genomes.](/article_images/ol/31/6/ol-31-06-15610-g00.jpg) | Figure 1.Transcriptomic landscape of
programmed cell death-related genes in COAD. (A) The set of 1,379
genes covering the 14 programmed cell death pathways analyzed in
the present study. (B) Volcano plot illustrating differentially
expressed genes between tumor and normal tissues in the TCGA-COAD
cohort. Gray dots indicate genes without significant differential
expression (P≥0.05), whereas red and blue dots denote genes
significantly upregulated and downregulated in tumor tissues,
respectively (P<0.05). Bubble plots showing (C) GO and (D) KEGG
enrichment analyses of the differentially expressed genes. Bubble
size reflects enrichment significance [-log2(P-value)],
and color indicates the direction of regulation (red, upregulated
gene sets; blue, downregulated gene sets). COAD, colon
adenocarcinoma; TCGA, The Cancer Genome Atlas; abs, absolute value;
FC, fold-change; GO, Gene Ontology; KEGG, Kyoto Encyclopedia of
Genes and Genomes. |
GO enrichment analysis showed that upregulated PCD
genes were primarily involved in apoptosis- and autophagy-related
processes, including ‘regulation of apoptotic signaling pathway’,
‘intrinsic apoptotic signaling pathway’ and ‘regulation of
autophagy’. Downregulated genes were enriched in pathways
associated with ‘regulation of autophagy’, ‘lysosomal organization’
and ‘myeloid leukocyte mediated immunity’, indicating that multiple
PCD-related processes are transcriptionally altered in COAD rather
than uniformly activated or suppressed (Fig. 1C).
KEGG analysis revealed similar patterns: ‘Lysosome’
and ‘Necroptosis’ pathways were enriched among the upregulated
genes, whereas ‘autophagy - animal’, ‘Lysosome’, ‘Apoptosis’ and
‘Necroptosis’ pathways were enriched among downregulated genes
(Fig. 1D). The recurrence of
apoptosis-, autophagy- and lysosome-related terms in both
upregulated and downregulated gene sets suggests broad remodeling
of these pathways in COAD, involving simultaneous activation and
inhibition of distinct gene subsets within the same cell death
networks.
Overall, these results indicate that PCD-related
pathways undergo complex transcriptional alterations in COAD,
providing a molecular foundation for subsequent integrative
analysis of m6A modification and PCD.
Integration of m6A regulation and PCD
genes in COAD
To develop an integrated m6A-PCD prognostic model, a
systematic analysis of 1,379 genes across 14 PCD pathways was first
conducted from the TCGA-COAD cohort. Univariate Cox regression
identified 109 PCD-related genes significantly associated with OS
(P<0.05; Fig. 2A). Concurrently,
Spearman correlation analysis showed that 957 PCD genes were
significantly co-expressed with multiple m6A regulators
(|R|>0.2, P<0.05; Fig. 2B),
indicating extensive transcriptional interplay between m6A
modification and PCD in COAD. By integrating differential
expression, survival association and m6A correlation analyses, 31
overlapping hub genes that were dysregulated, prognostically
relevant and co-expressed with m6A regulators were identified
(Fig. 2C). Subsequent LASSO Cox
regression refined this panel to a 21-gene core signature,
constituting the MCDI (Fig. 2D), of
which 15 genes were upregulated and 6 were downregulated in COAD
tumors (Fig. 2E).
 | Figure 2.Construction of the MCDI. (A) Volcano
plot of the univariate Cox regression analysis for PCD-related
genes. Dot size corresponds to the HR value; red dots denote risk
factors (HR>1), blue dots indicate protective factors (HR<1)
and gray dots represent genes with P≥0.05. (B) Heatmap illustrating
Spearman correlations between differentially expressed PCD-related
genes and 23 m6A regulators in the TCGA-COAD cohort. The color
gradient reflects the correlation coefficients. (C) Venn diagram
showing the overlap among the prognostic genes identified by
univariate Cox regression, tumor-normal differentially expressed
genes and genes associated with m6A regulators, yielding 31 hub
genes. (D) Coefficient profiles from the LASSO-Cox regression,
showing the trajectories of model coefficients as log(λ) increases.
The vertical dashed line indicates the optimal λ value determined
by the minimum criterion, corresponding to 21 genes with non-zero
coefficients. (E) Box plots depicting the expression levels of the
21 genes comprising the MCDI signature in tumor versus adjacent
normal tissues in the TCGA-COAD cohort. (F) Protein-protein
interaction network of the 21 PCD-related genes. Nodes represent
genes, edges indicate significant co-expression relationships and
node colors denote the primary cell death modality associated with
each gene. (G) Forest plot from multivariate Cox regression
analysis of the 21 genes, identifying MIR210, STK25, TGFB2, TRIM6
and TRIM68 as independent prognostic factors. MCDI, m6A-PCD
integrated signature; HR, hazard ratio; PCD, programmed cell death;
TCGA, The Cancer Genome Atlas; COAD, colon adenocarcinoma; MIR210,
microRNA-210; STK25, serine/threonine kinase 25; TGFB2,
transforming growth factor β2; TRIM6, tripartite motif containing
6; TRIM68, tripartite motif containing 68; DEGs, differentially
expressed genes. |
To investigate functional relationships, a
protein-protein interaction network was constructed, revealing a
central cluster of highly connected hub proteins including FBH1,
STK25, TYK2, DEF8, PLA2G15, PIP4K2B, ATG13, ING5, WDR6 and USP21
surrounded by peripheral nodes (Fig.
2F). These core genes may serve as key integrators linking m6A
modification with PCD regulation, potentially underlying the
heterogeneous cell-death dynamics and immune responses observed in
COAD.
Development and validation of the MCDI
prognostic signature for COAD
Using the 21 key m6A-regulated PCD genes identified
above, a prognostic model for COAD, termed the MCDI, was
constructed. Patients in both the internal validation cohort
(TCGA-COAD) and external validation cohorts (GSE39582, GSE33113 and
GSE38832) were stratified into high- and low-risk groups based on
the median MCDI score. Each patient received a composite MCDI score
calculated from the expression levels of the 21 genes, with higher
scores indicating a higher predicted mortality risk. Kaplan-Meier
analysis demonstrated that patients in the high-risk group had a
significantly shorter OS time than those in the low-risk group in
both the internal (TCGA-COAD) and external validation cohorts (all
log-rank P<0.001), confirming the robust and reproducible
prognostic performance of the model (Fig. 3A and B). Time-dependent ROC curve
analysis was performed to evaluate the predictive performance of
the MCDI model. The area under the ROC curve (AUC) was calculated
to assess prognostic accuracy. In the training cohort, the AUC
values for predicting 1- and 3-year overall survival were 0.609 and
0.572, respectively. In the testing cohort, the AUC values
increased to 0.783 and 0.711, respectively. Similar predictive
performance was observed in the validation cohorts, with AUC values
of 0.805 and 0.699, and 0.584 and 0.635 for 1- and 3-year survival
(Fig. 3C), indicating a moderate
but stable prognostic performance of the MCDI model across
different cohorts.
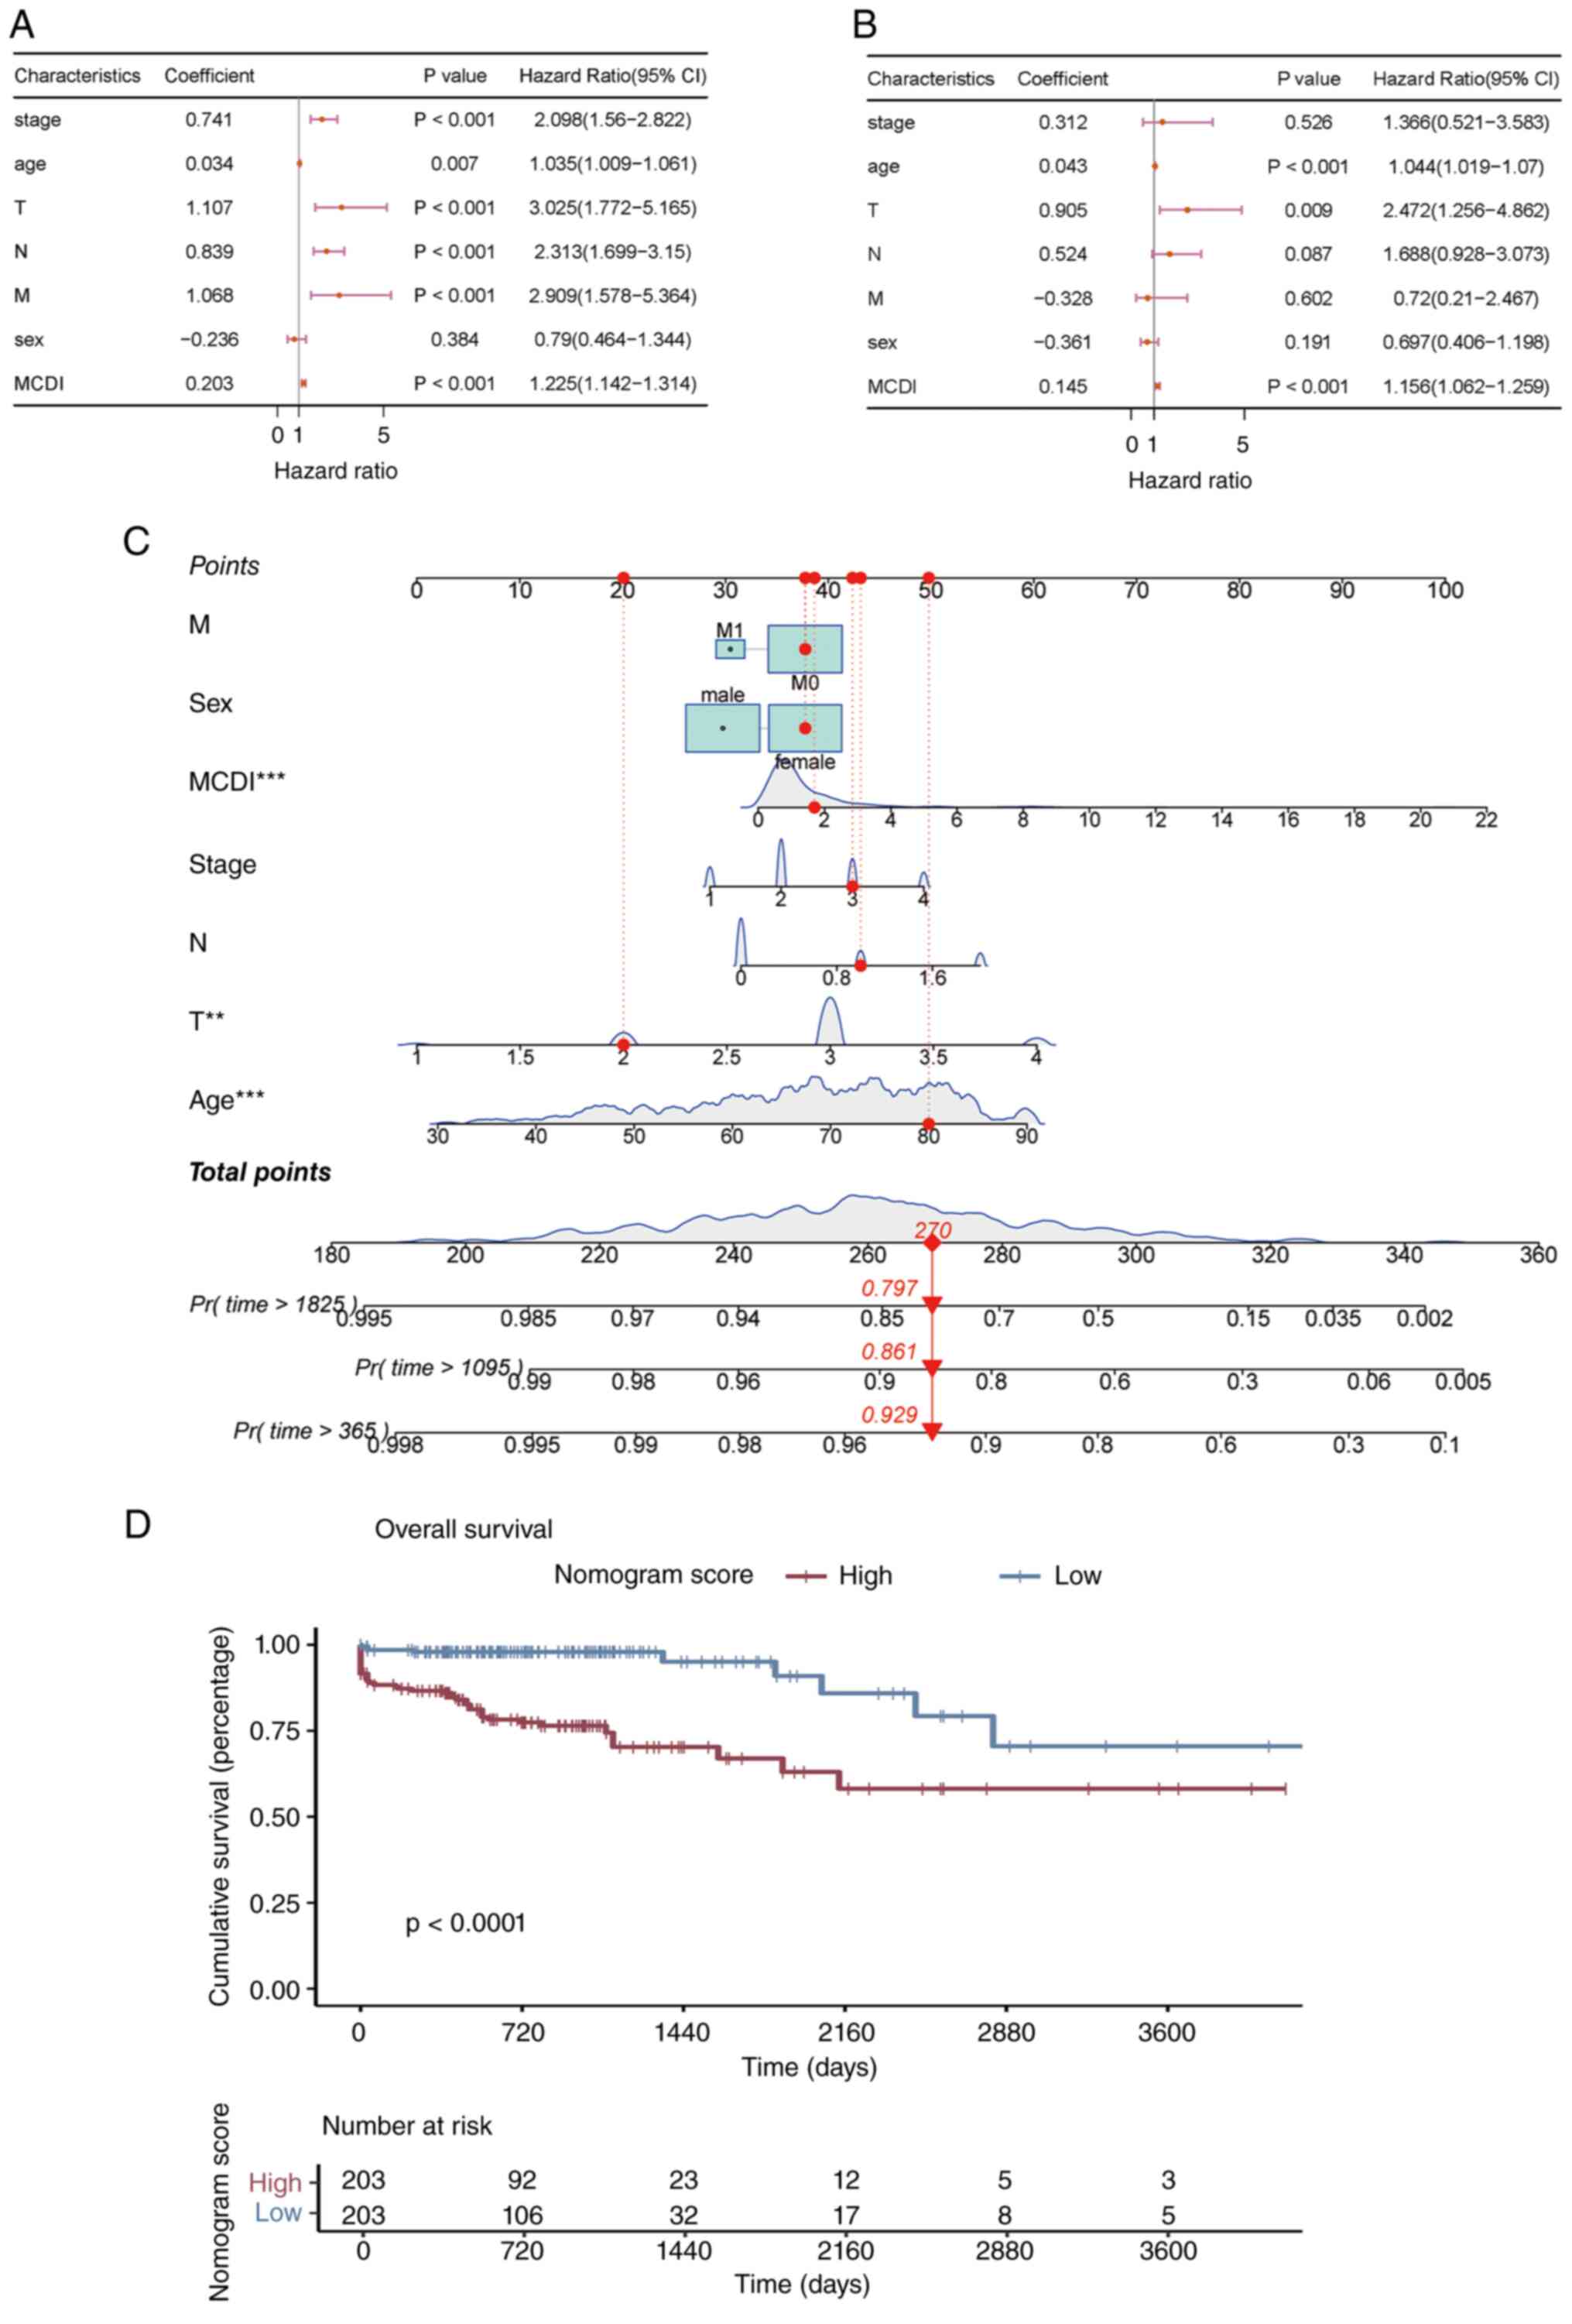
 | Figure 3.Validation of the MCDI. (A)
Distribution of MCDI scores, corresponding risk group assignment,
and survival status of patients in the TCGA-COAD, GSE39582,
GSE33113 and GSE38832 cohorts. (B) Kaplan-Meier overall survival
curves comparing high- and low-risk groups stratified by the median
MCDI score in the TCGA-COAD, GSE39582, GSE33113 and GSE38832
cohorts. (C) Time-dependent receiver operating characteristic
curves evaluating the performance of the MCDI model in predicting
1- and 3-year overall survival in the TCGA-COAD, GSE39582, GSE33113
and GSE38832 cohorts. MCDI, m6A-PCD integrated signature; PCD,
programmed cell death; TCGA, The Cancer Genome Atlas; COAD, colon
adenocarcinoma; AUC, area under the curve. |
To explore the biological basis of MCDI-based risk
stratification, a comprehensive transcriptomic comparison between
the high- and low-risk groups in the TCGA-COAD cohort was
performed. Differential expression analysis using the edge R
package, with thresholds of FDR <0.05 and |log2FC|>1,
identified 2,520 significantly dysregulated genes, including 802
upregulated and 1,718 downregulated genes in high-risk patients
compared with low-risk patients (Fig.
4a).
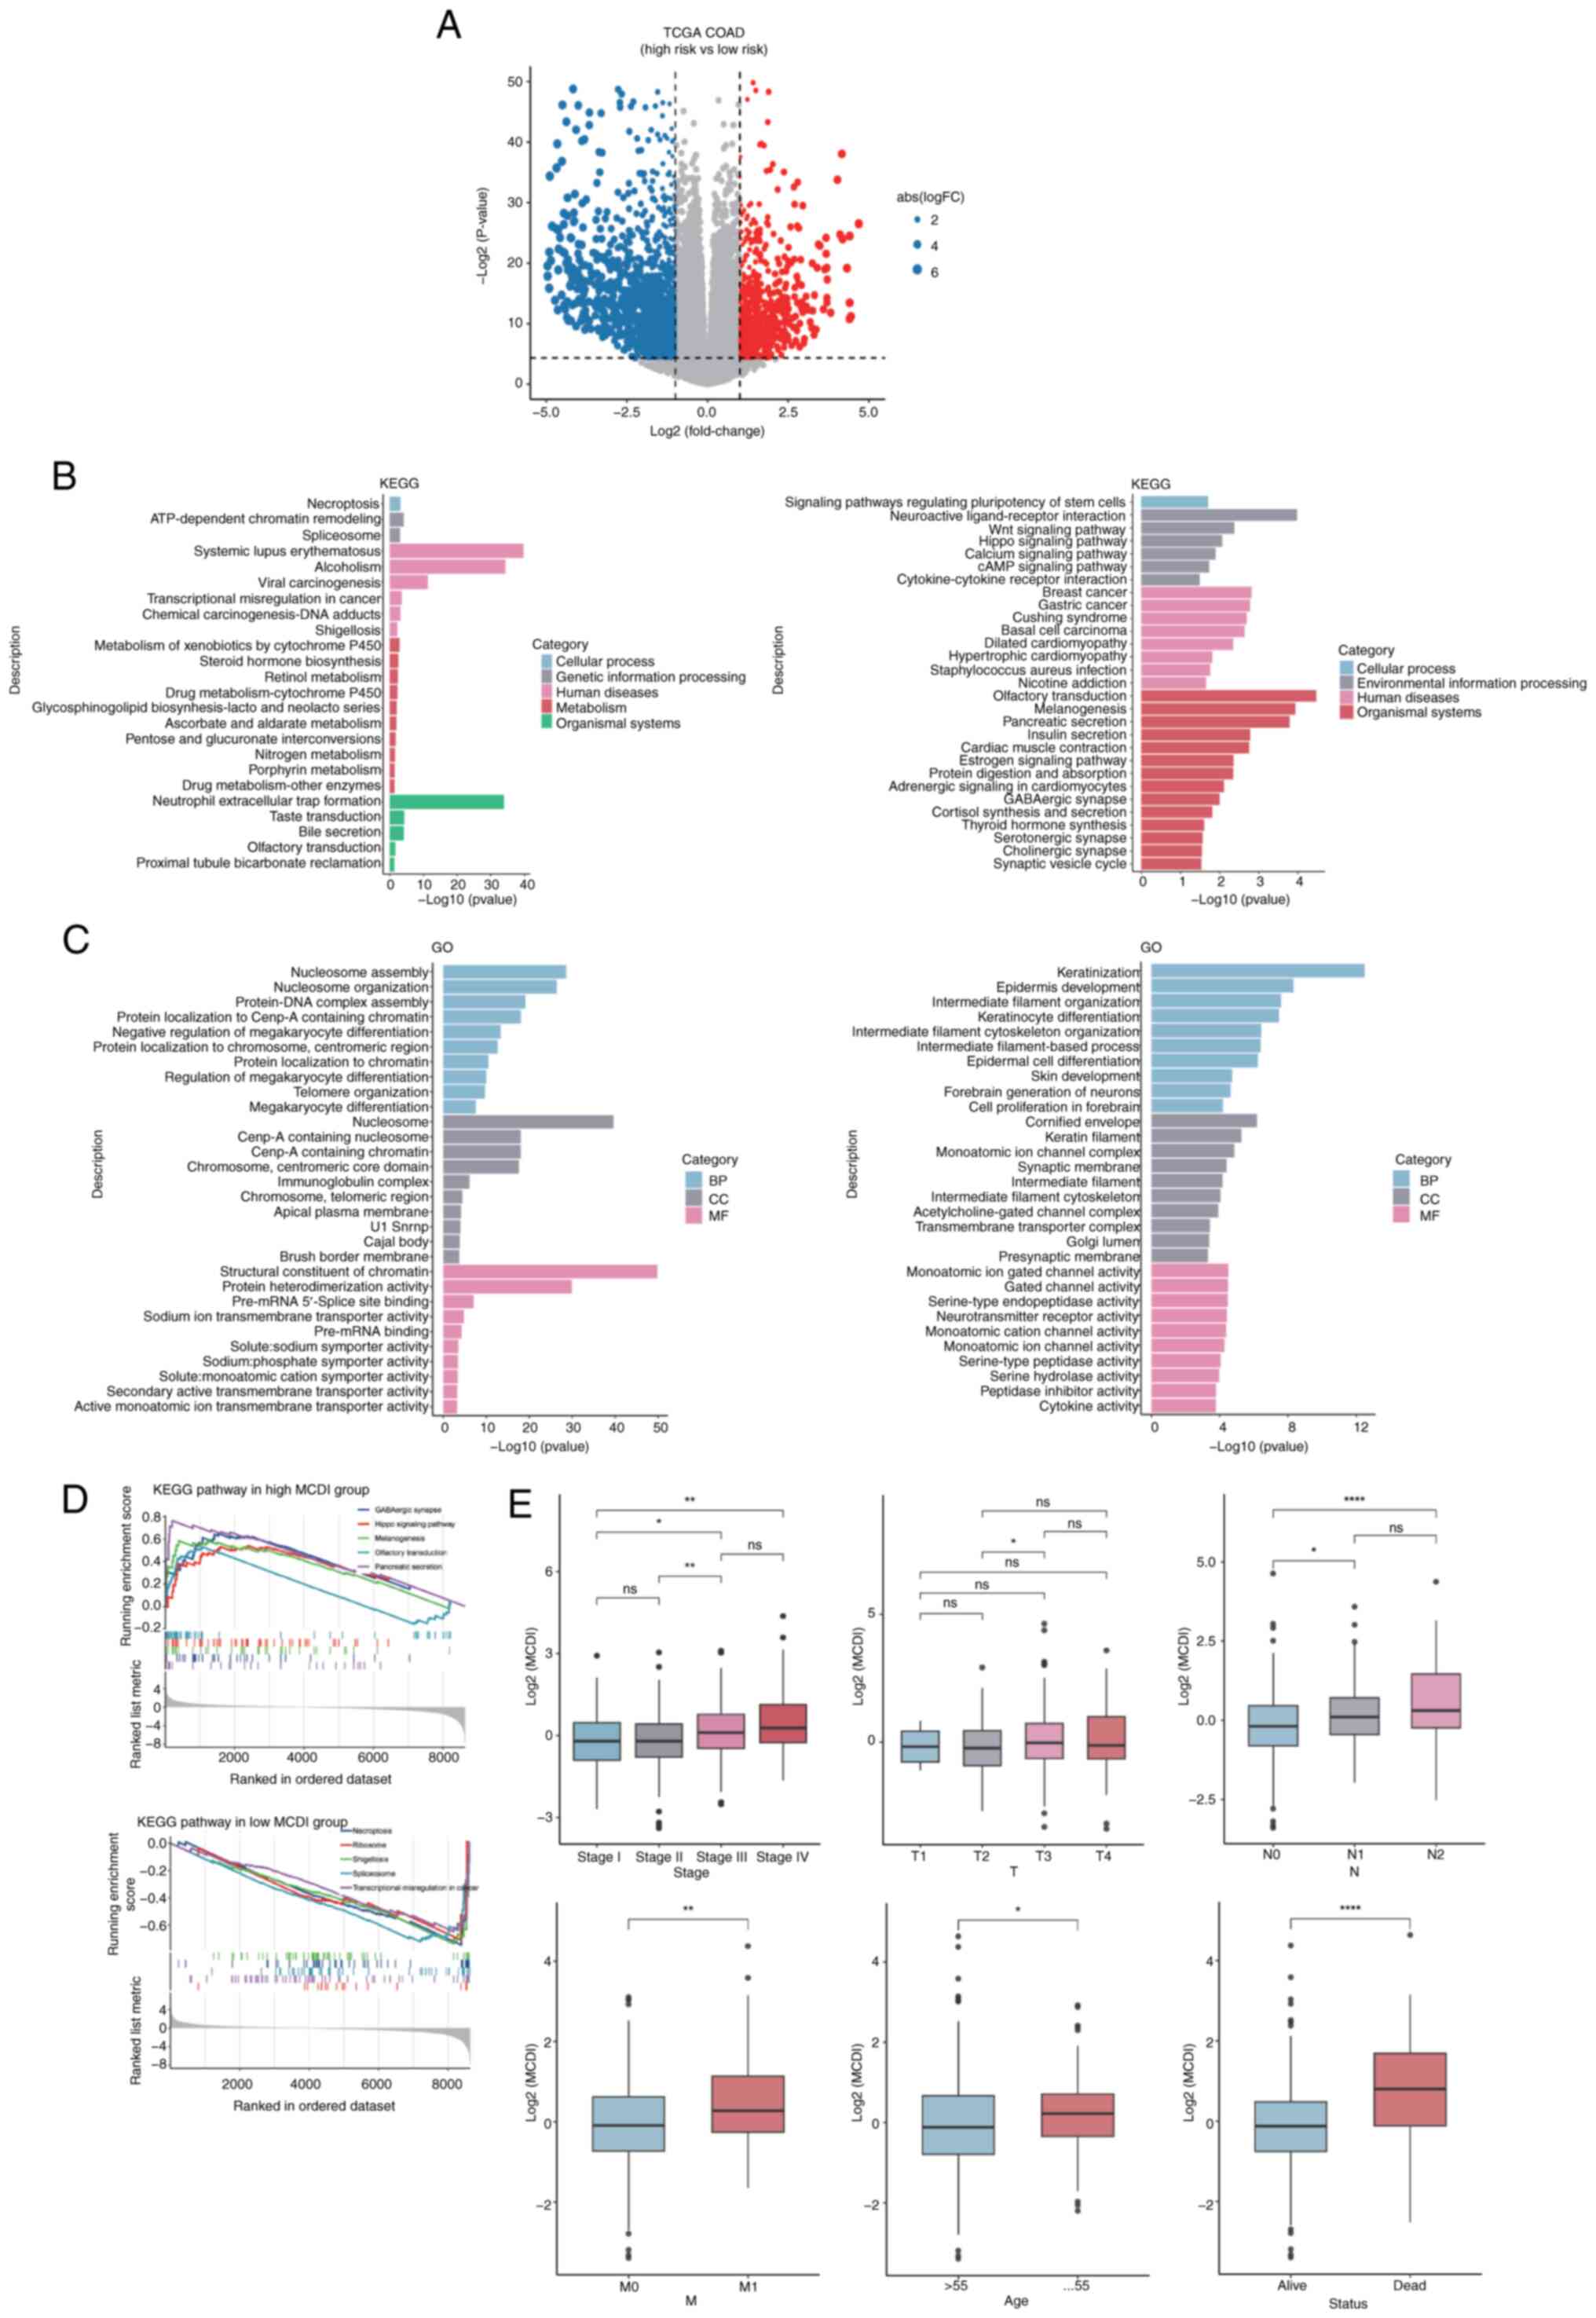 | Figure 4.Biological characteristics and
clinical associations of MCDI-based risk stratification. (A)
Volcano plot showing differentially expressed genes between the
MCDI-defined high- and low-risk groups in the TCGA-COAD cohort.
Gray dots indicate genes without significant differences, whereas
red and blue dots denote genes significantly upregulated and
downregulated in the high-risk group, respectively (false discovery
rate <0.05 and |log2FC|>1). (B) KEGG pathway
enrichment analysis and (C) GO functional enrichment analysis of
differentially expressed genes between the high- and low-MCDI risk
groups. (D) Gene Set Enrichment Analysis illustrating
representative pathways differentially enriched between the high-
and low-MCDI groups. (E) Box plots depicting the distribution of
MCDI scores across clinicopathological subgroups, including overall
tumor stage, T stage, N stage, M stage, age and survival status.
*P<0.05, **P<0.01, ****P<0.0001. ns, not significant;
MCDI, m6A-PCD integrated signature; PCD, programmed cell death;
TCGA, The Cancer Genome Atlas; COAD, colon adenocarcinoma; FC,
fold-change; KEGG, Kyoto Encyclopedia of Genes and Genomes; GO,
Gene Ontology; BP, biological process; CC, cellular component; MF,
molecular function. |
Functional enrichment analysis of these DEGs was
subsequently performed to elucidate their biological significance.
GO and KEGG pathway analyses consistently indicated that the DEGs
were highly enriched in processes related to apoptosis, autophagy,
lysosomal function and immune regulation (Fig. 4B-D). Further association analyses
with clinical characteristics showed that the MCDI score increased
progressively with tumor advancement. Patients with advanced-stage
clinicopathological features tended to exhibit higher MCDI scores.
Stage IV tumors showed significantly higher MCDI scores compared
with Stage I and Stage II tumors, whereas differences between other
stage groups were not statistically significant (Fig. 4E). For T stage, a significant
difference was observed only between T2 and T3 tumors, while other
comparisons were not significant. Regarding lymph node status,
patients with N1 or N2 disease exhibited significantly higher MCDI
scores than those with N0, although no significant difference was
observed between N1 and N2 groups. In addition, patients with
distant metastasis (M1) showed significantly higher MCDI scores
than those without metastasis (M0). MCDI scores were also modestly
higher in patients aged >55 years and were significantly
elevated in deceased patients compared with those alive (Fig. 4E). Although differences across
early-stage and age subgroups were relatively modest, patients who
died exhibited significantly higher MCDI scores than those who
remained alive, suggesting that elevated MCDI is associated with
poorer survival outcomes.
To determine whether the MCDI serves as an
independent prognostic indicator beyond conventional clinical
parameters, clinicopathologic data from the TCGA-COAD cohort were
analyzed. Cox regression analyses confirmed the independent
prognostic value of the MCDI. In univariate analysis, tumor stage,
age, T, N and M stages and MCDI were all significant predictors of
OS (Fig. 5A). All clinically
relevant variables, including sex, were simultaneously entered into
the multivariate Cox model. Although sex did not reach statistical
significance in univariate analysis, it was included as a
pre-specified covariate based on its clinical relevance, to control
for potential confounding on the primary variables of interest
(age, T stage, and MCDI).(Fig. 5B).
Based on these findings, a prognostic nomogram integrating MCDI
score, age and T stage was constructed to provide individualized
survival probability estimates (Fig.
5C). Patients were stratified into high- and low-score groups
using the surv_cutpoint function. Kaplan-Meier analysis revealed a
marked survival difference between these groups (log-rank
P<0.001; Fig. 5D).
Collectively, these results establish MCDI as a
reliable and independent prognostic indicator for COAD, linking
m6A-regulated PCD gene expression with disease progression, patient
survival and immune-related molecular alterations.
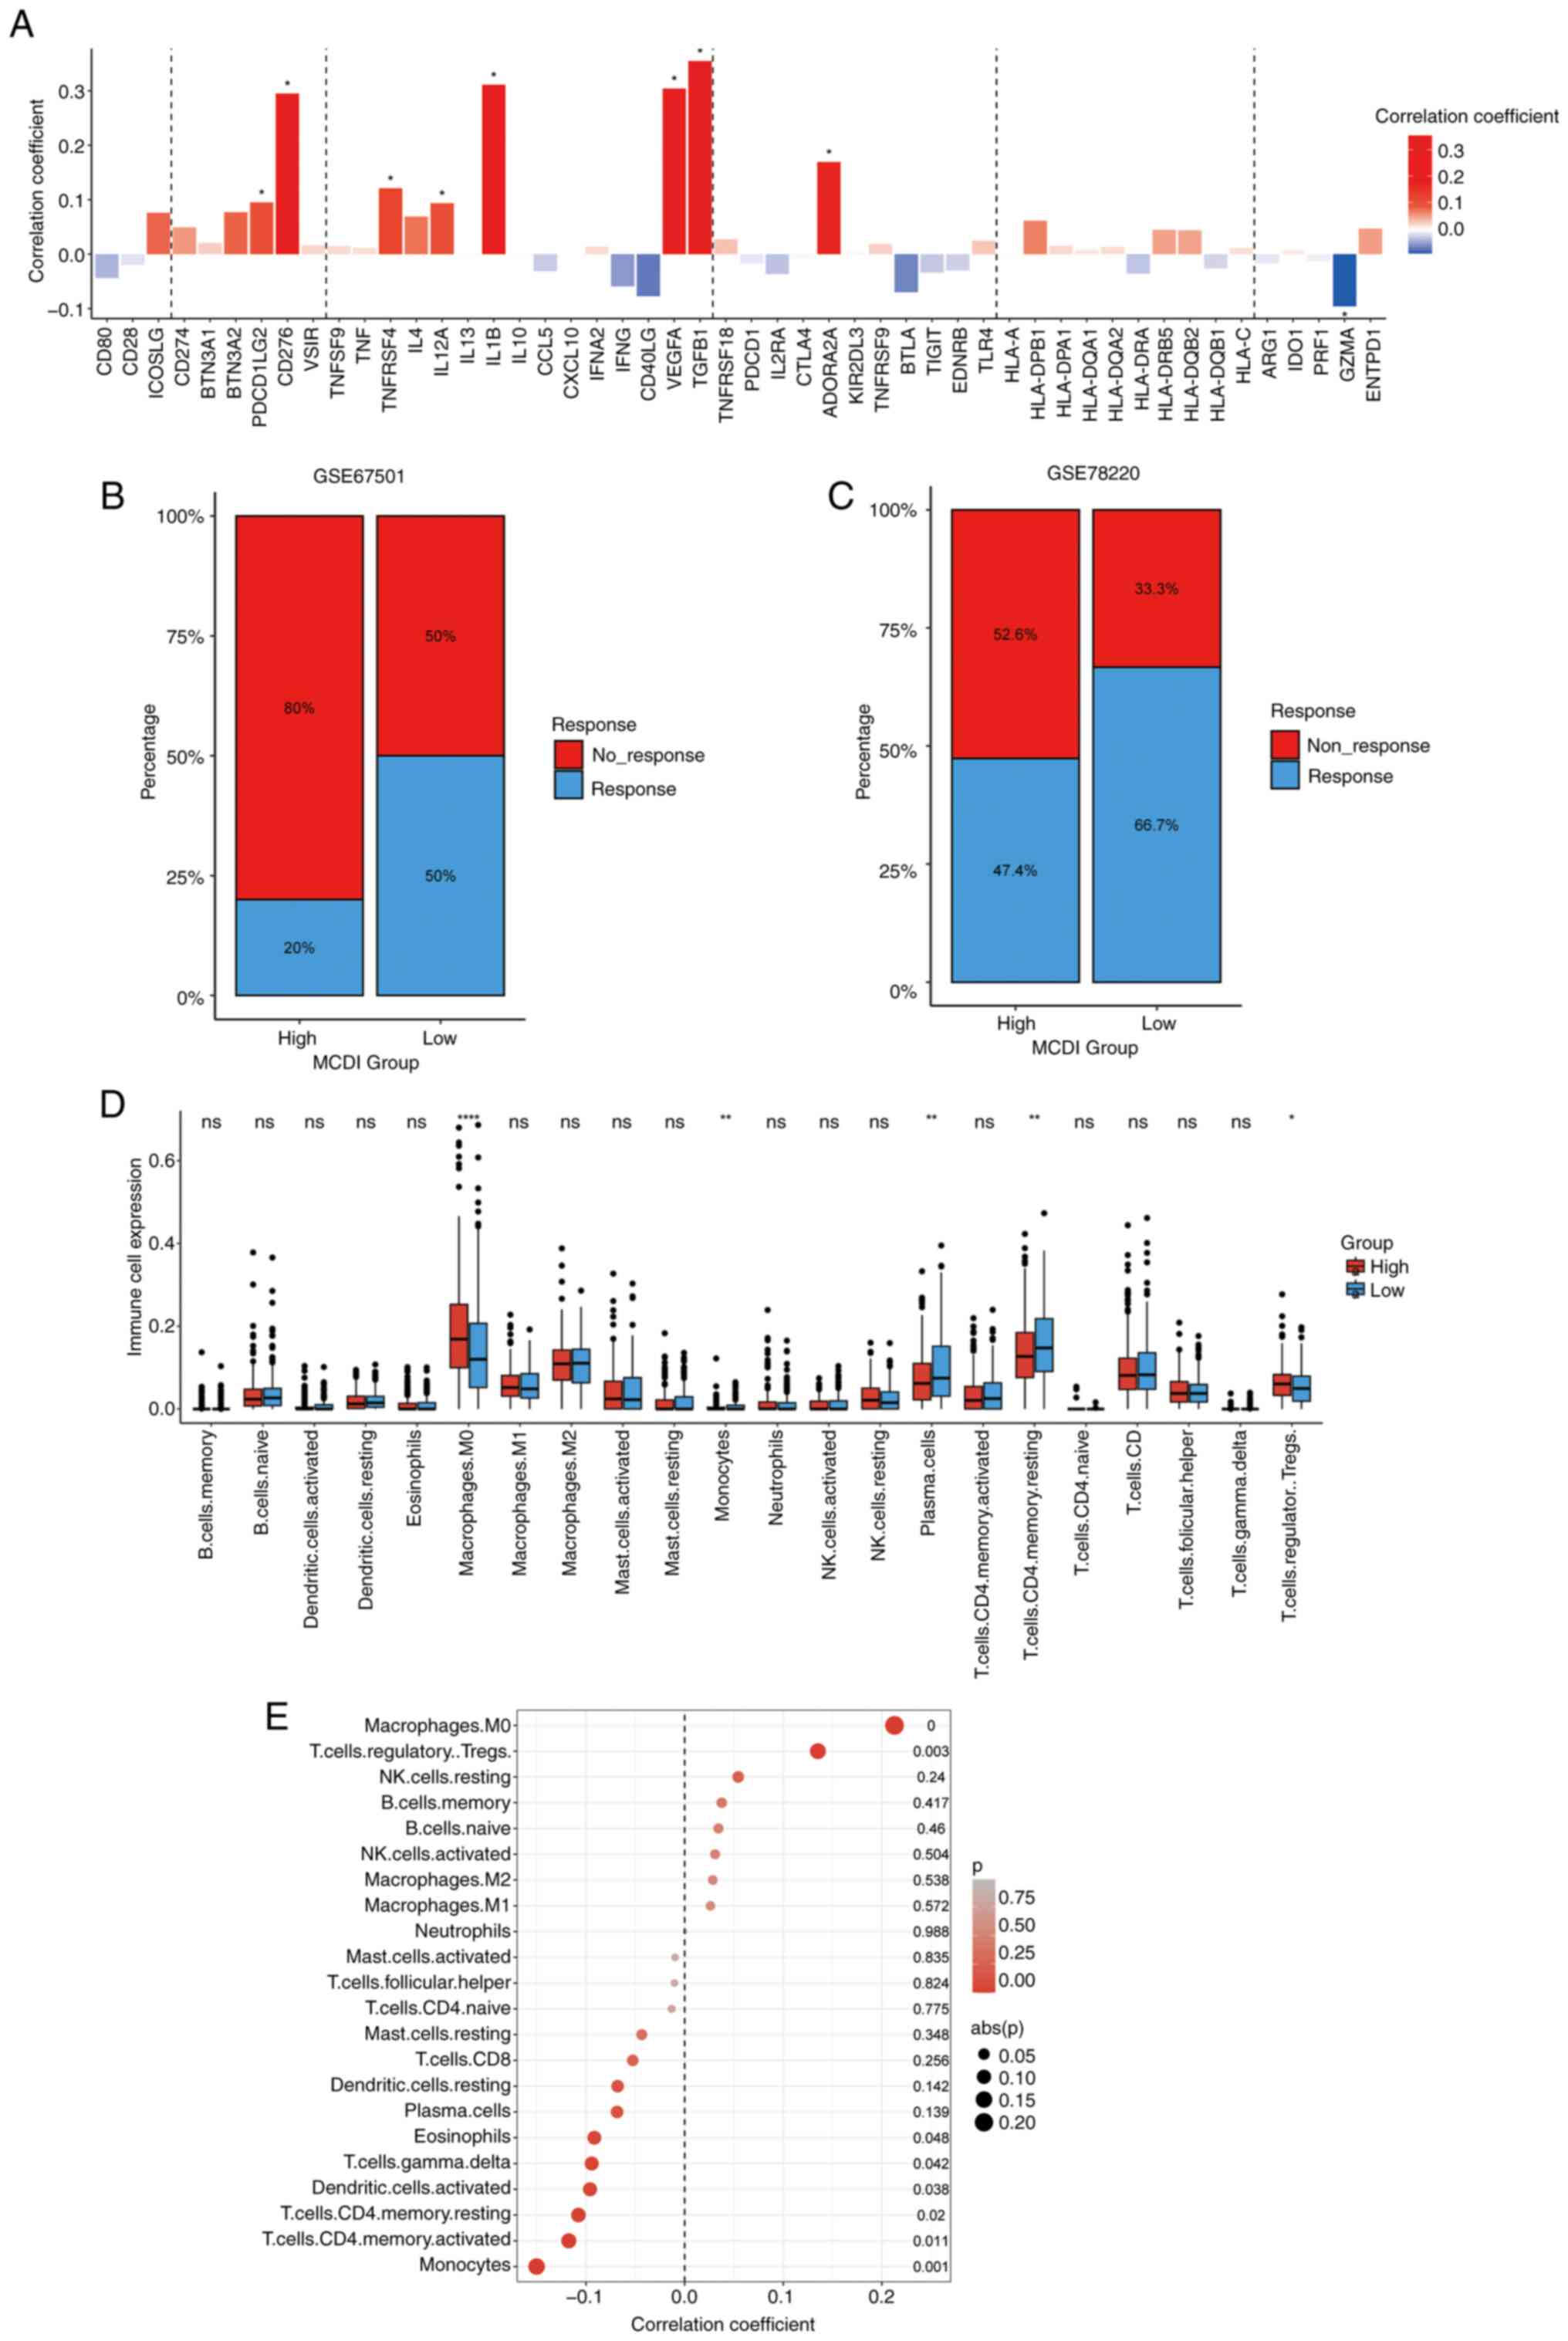
MCDI predicts immunotherapy response
and characterizes the immune microenvironment in COAD
Given the enrichment of immune-related pathways in
the MCDI-associated gene signature, its immunologic and therapeutic
relevance were systematically evaluated. First, the relationship
between the MCDI score and the expression of key immunomodulators
in the TCGA-COAD cohort was assessed. Spearman correlation analysis
revealed that MCDI score was significantly associated with a broad
array of molecules, including PDCD1LG2 (PD-L2), CD276 (B7-H3),
TNFRSF4 (OX40), IL12A, IL1B, VEGFA, TGFB1 and ADORA2A, indicating
potential immunoregulatory significance of the MCDI signature
(Fig. 6A).
To further evaluate its predictive value for ICB
therapy, the MCDI model was applied to independent immunotherapy
cohorts (GSE67501, renal cell carcinoma; GSE78220, melanoma). In
both datasets, patients with high MCDI scores exhibited markedly
lower response rates to anti-PD-L1 treatment compared with those
with low scores, suggesting that MCDI-low tumors may be more
responsive to ICB therapy (Fig. 6B and
C).
To elucidate the cellular composition of the tumor
immune microenvironment, the CIBERSORT tool was applied to estimate
the relative abundances of 22 immune cell types in TCGA-COAD
samples. This analysis revealed significant differences in immune
cell composition between the MCDI-defined risk groups. Compared
with the low-risk group, the high-risk group exhibited
significantly increased infiltration of M0 macrophages, plasma
cells, CD4+ memory resting T cells and regulatory T cells (Tregs),
whereas monocytes were significantly decreased. Other immune cell
types did not show significant differences between the two groups
(Fig. 6D and E).
Consistent with these findings, TIDE analysis was
performed to quantitatively assess immune evasion potential. The
MCDI-high group showed significantly higher TIDE scores, indicating
a microenvironment with enhanced immune evasion and impaired
antitumor immune activity (Fig.
7A-C). The relationship between MCDI risk score and two key
genomic biomarkers for immunotherapy (TMB and MSI status) were
further examined. No significant association or correlation was
observed between the MCDI and either TMB or MSI in the TCGA-COAD
cohort (Fig. 7D-F), suggesting that
the prognostic and immunological features captured by the MCDI may
operate independently of these established biomarkers.
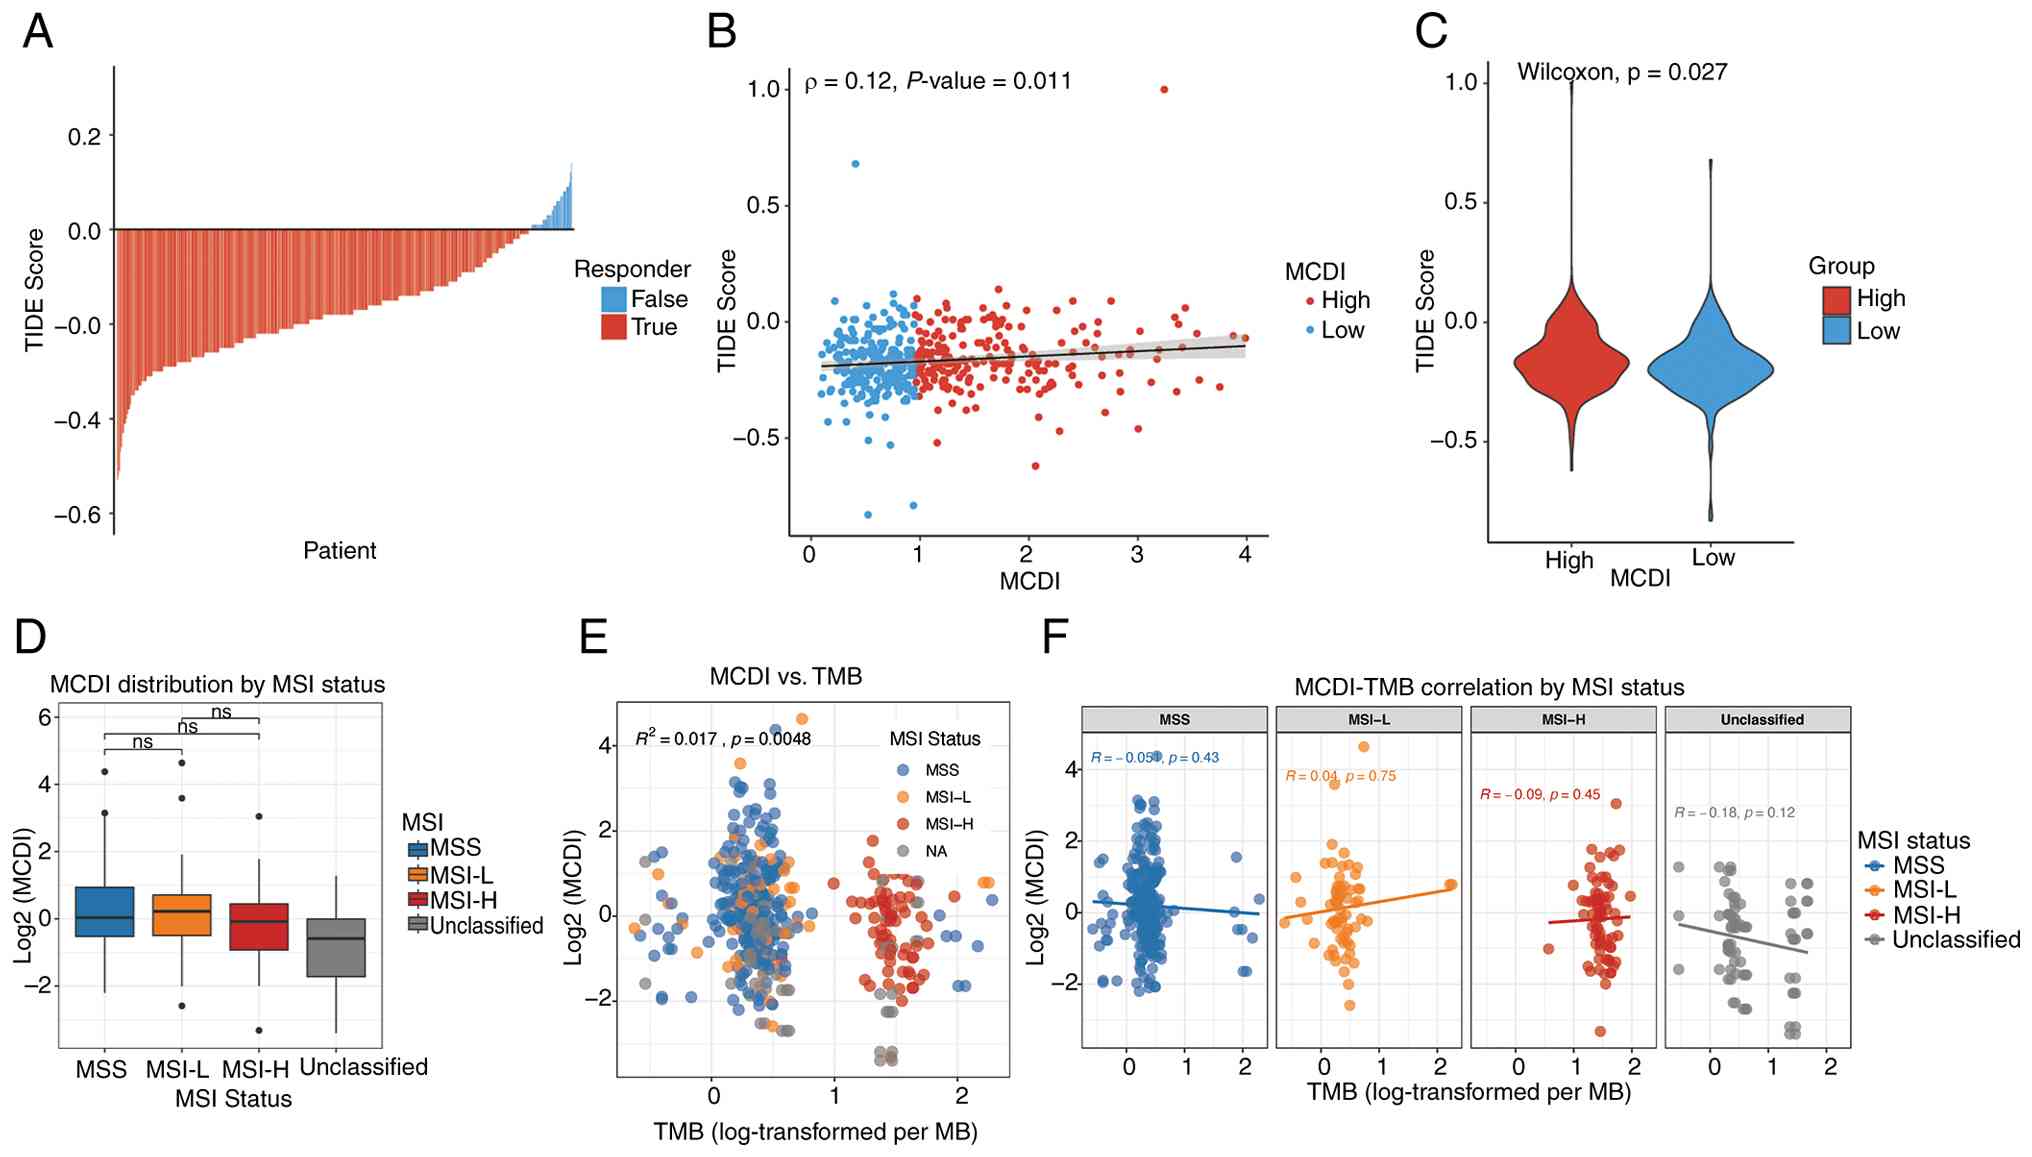 | Figure 7.Association of MCDI score with immune
evasion potential and genomic biomarkers. (A) Distribution of TIDE
scores between responders and non-responders to immune checkpoint
inhibitors in the TCGA-COAD cohort. (B) Scatter plot showing the
Spearman correlation between the MCDI score and the TIDE score. (C)
Violin plot comparing TIDE scores between the high- and low-MCDI
groups. (D) Distribution of MCDI scores across MSI subtypes. Box
plots show no significant differences among MSS, MSI-L, MSI-H and
unclassified groups. (E) Correlation between MCDI and TMB. The
scatter plot shows a weak but statistically significant positive
correlation. (F) MSI subtype-stratified correlation analysis:
Scatter plots showing MCDI-TMB correlations within each MSI
subtype. ns, not significant; MCDI, m6A-PCD integrated signature;
TIDE, Tumor Immune Dysfunction and Exclusion; PCD, programmed cell
death; TCGA, The Cancer Genome Atlas; COAD, colon adenocarcinoma;
MSS, microsatellite stable; MSI-L, microsatellite instability-low;
MSI-H, microsatellite instability-high; TMB, tumor mutational
burden. |
Together, these results indicate that MCDI may not
only predict patient prognosis but also reflect distinct
immunological states and potential responsiveness to immune
checkpoint inhibitors in COAD.
Single-cell profiling identifies STK25
as a tumor-enriched MCDI core gene in COAD
To identify key genes driving MCDI-associated
phenotypes, multivariate Cox regression analysis was first
performed on the 21-gene signature. This analysis highlighted 5
genes (MIR210, STK25, TGFB2, TRIM6 and TRIM68) as independent
prognostic factors for COAD (Fig.
2G). To examine the cellular context of these genes, scRNA-seq
data from colon cancer tissues (GSE132465) were analyzed. After
stringent QC and batch-effect correction via RPCA integration, six
major cell populations were identified (epithelial, stromal,
myeloid and T, B and mast cells) and annotated based on canonical
marker gene expression (Fig. 8A-C).
To systematically evaluate core prognostic gene expression across
cell types, a dot plot was generated for STK25, TGFB2, TRIM68 and
TRIM6 (Fig. 8D), revealing distinct
cell-type-specific expression patterns.
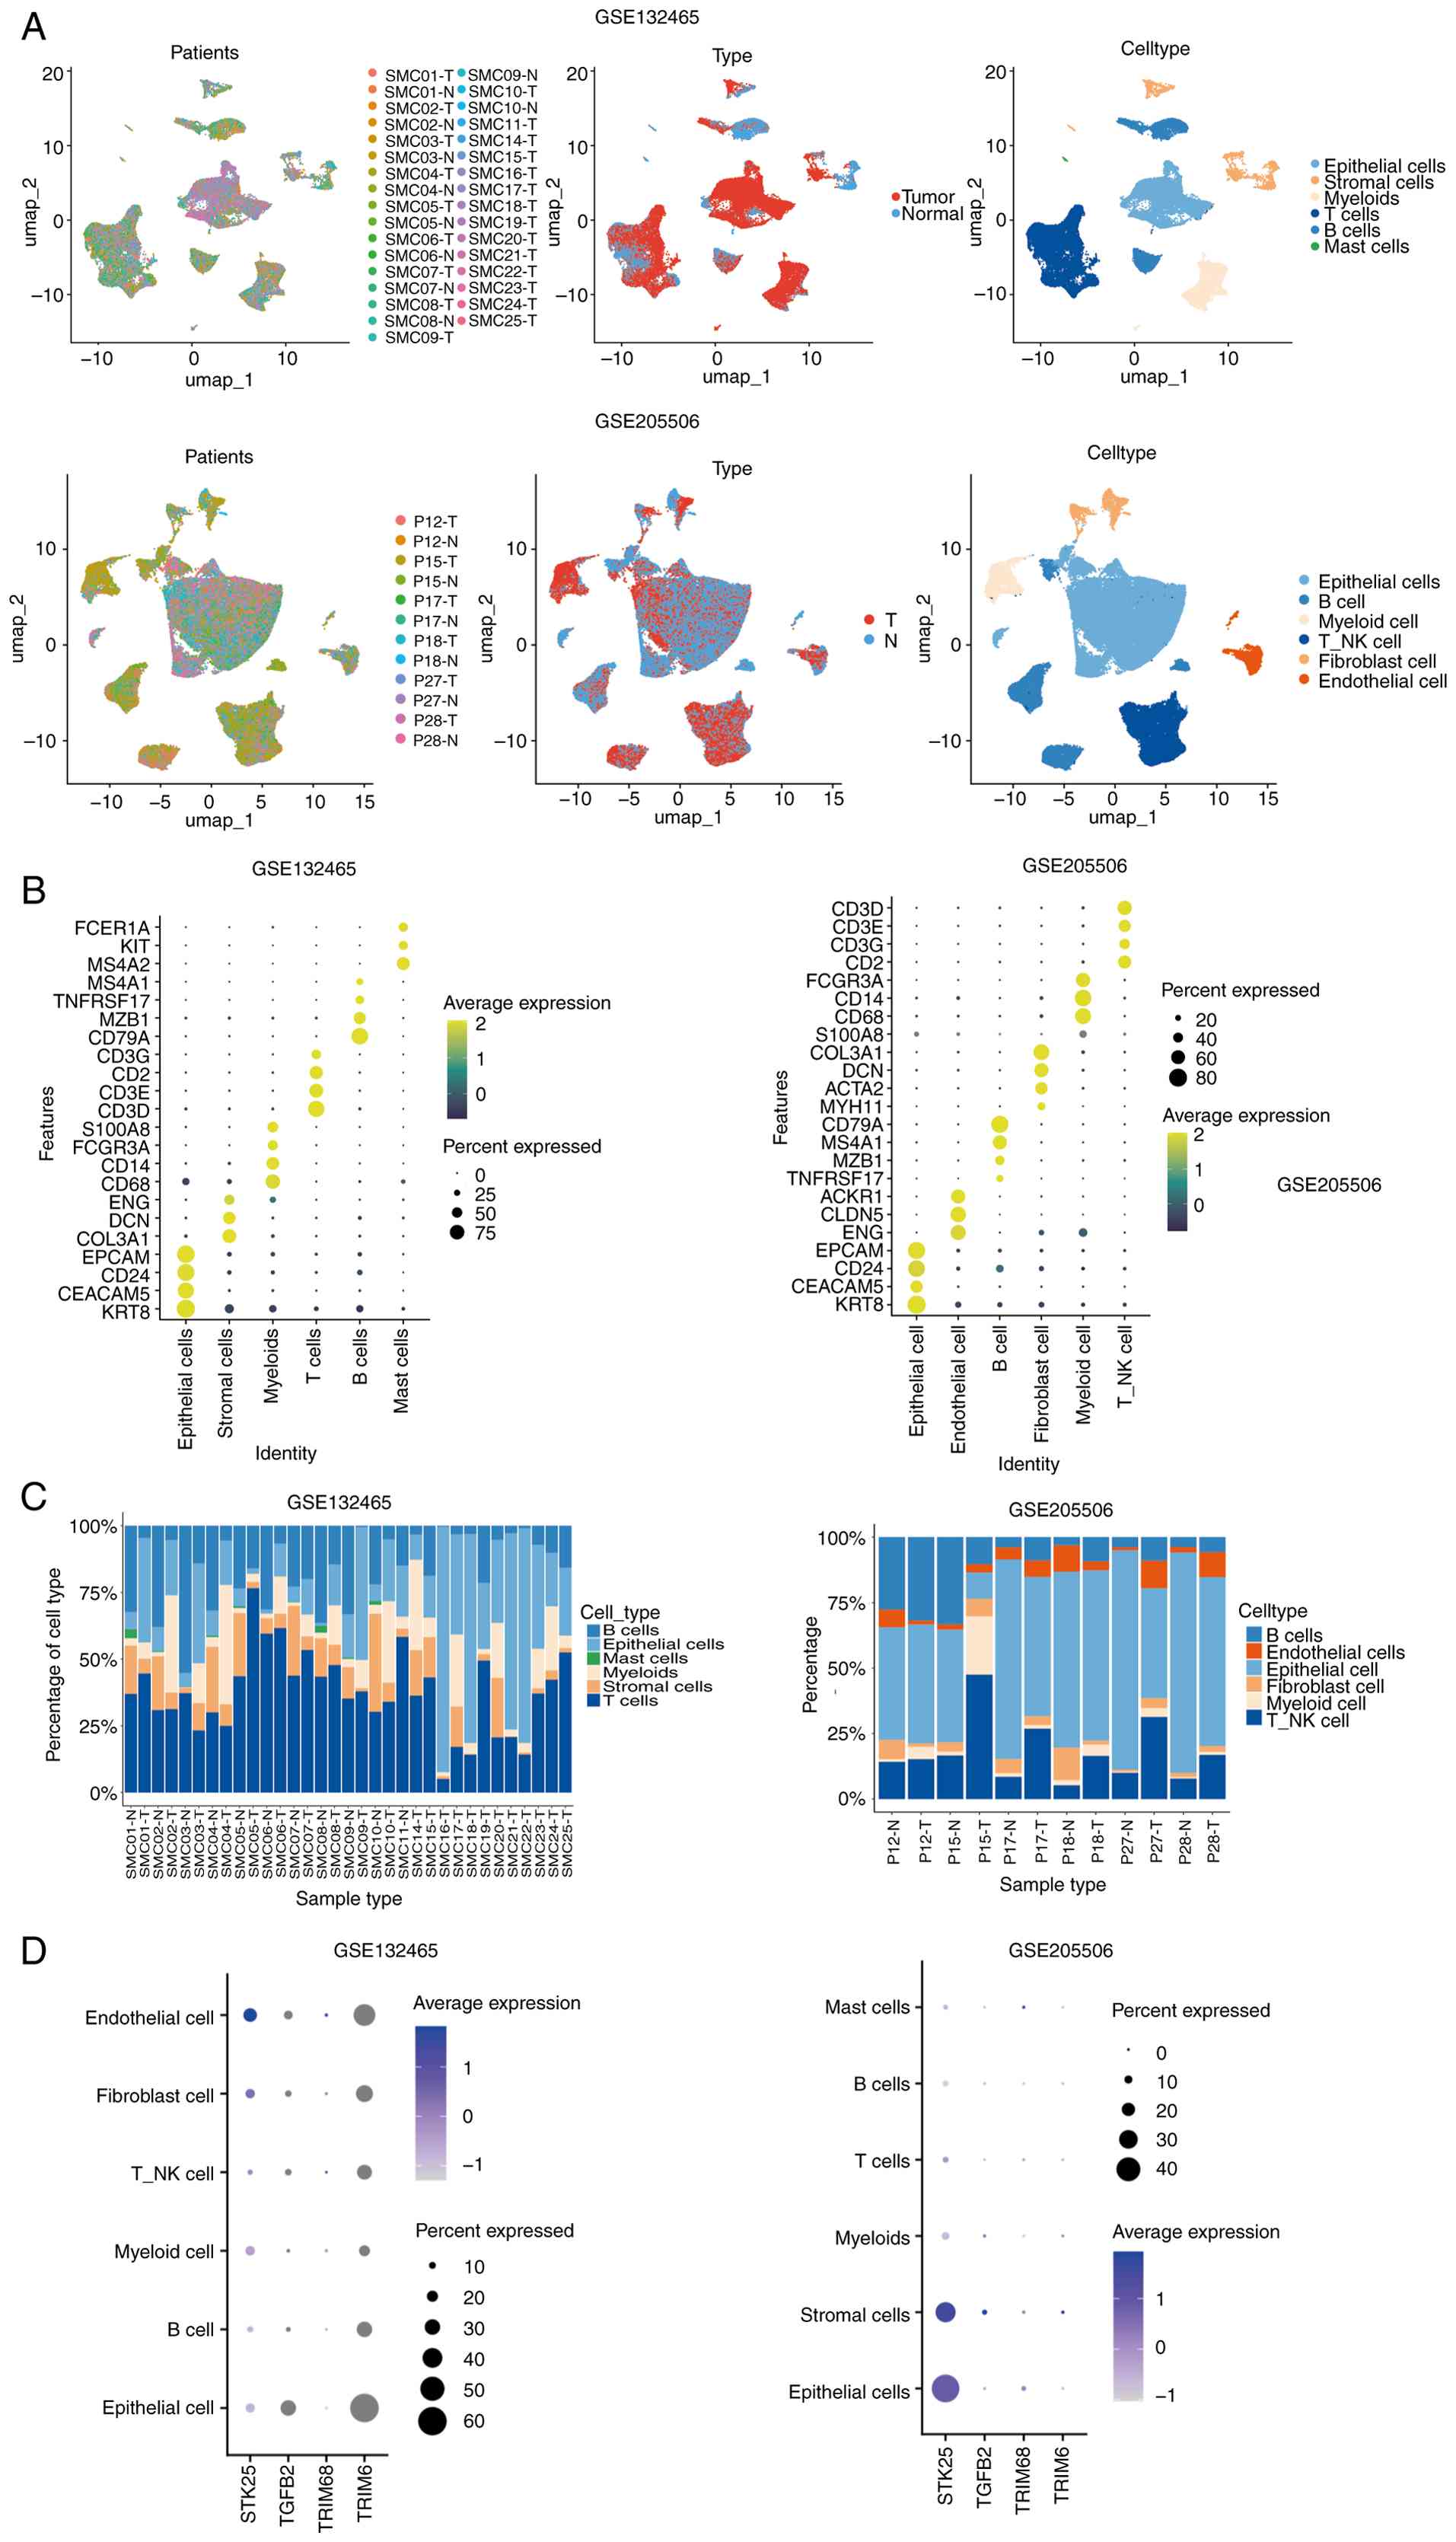 | Figure 8.Single-cell transcriptomic atlas of
COAD tissues reveals cell-type-specific expression patterns. (A)
UMAP visualization of cells from COAD tissues, annotated by patient
origin, tissue type and the six major identified cell types. (B)
Bubble plots showing the expression of 23 canonical marker genes
across the six cell types. Bubble size indicates the proportion of
cells expressing each marker and color intensity reflects the
average expression level. (C) Bar charts illustrating the relative
proportions of the different cell types within COAD tissues. (D)
Dot plots depicting the expression patterns of STK25, TGFB2, TRIM68
and TRIM6 across the six major cell types. Dot size represents the
percentage of cells expressing each gene and color intensity
indicates the average expression level. COAD, colon adenocarcinoma;
STK25, serine/threonine kinase 25; TGFB2, transforming growth
factor β2; TRIM68, tripartite motif containing 68; TRIM6,
tripartite motif containing 6; T_NK, natural killer T cells. |
STK25 was markedly upregulated in tumor epithelial
cells compared with epithelial cells derived from adjacent normal
tissues, highlighting its elevated expression in the malignant
epithelial compartment, whereas TRIM6, TRIM68 and TGFB2 were
expressed at low or undetectable levels in this cell type (Fig. 9A and B). Notably, STK25 expression
was also enriched in mast cells within tumor tissues, suggesting
potential roles in both epithelial and immune compartments
(Fig. 9C). Consistent with this
pattern, the MCDI score projected at the single-cell level was
predominantly enriched in epithelial and mast cell populations from
tumor tissues. Notably, enrichment was also observed in stromal
cells, paralleling the STK25 distribution and further supporting
its contribution to the high-risk phenotype (Fig. 9D and E).
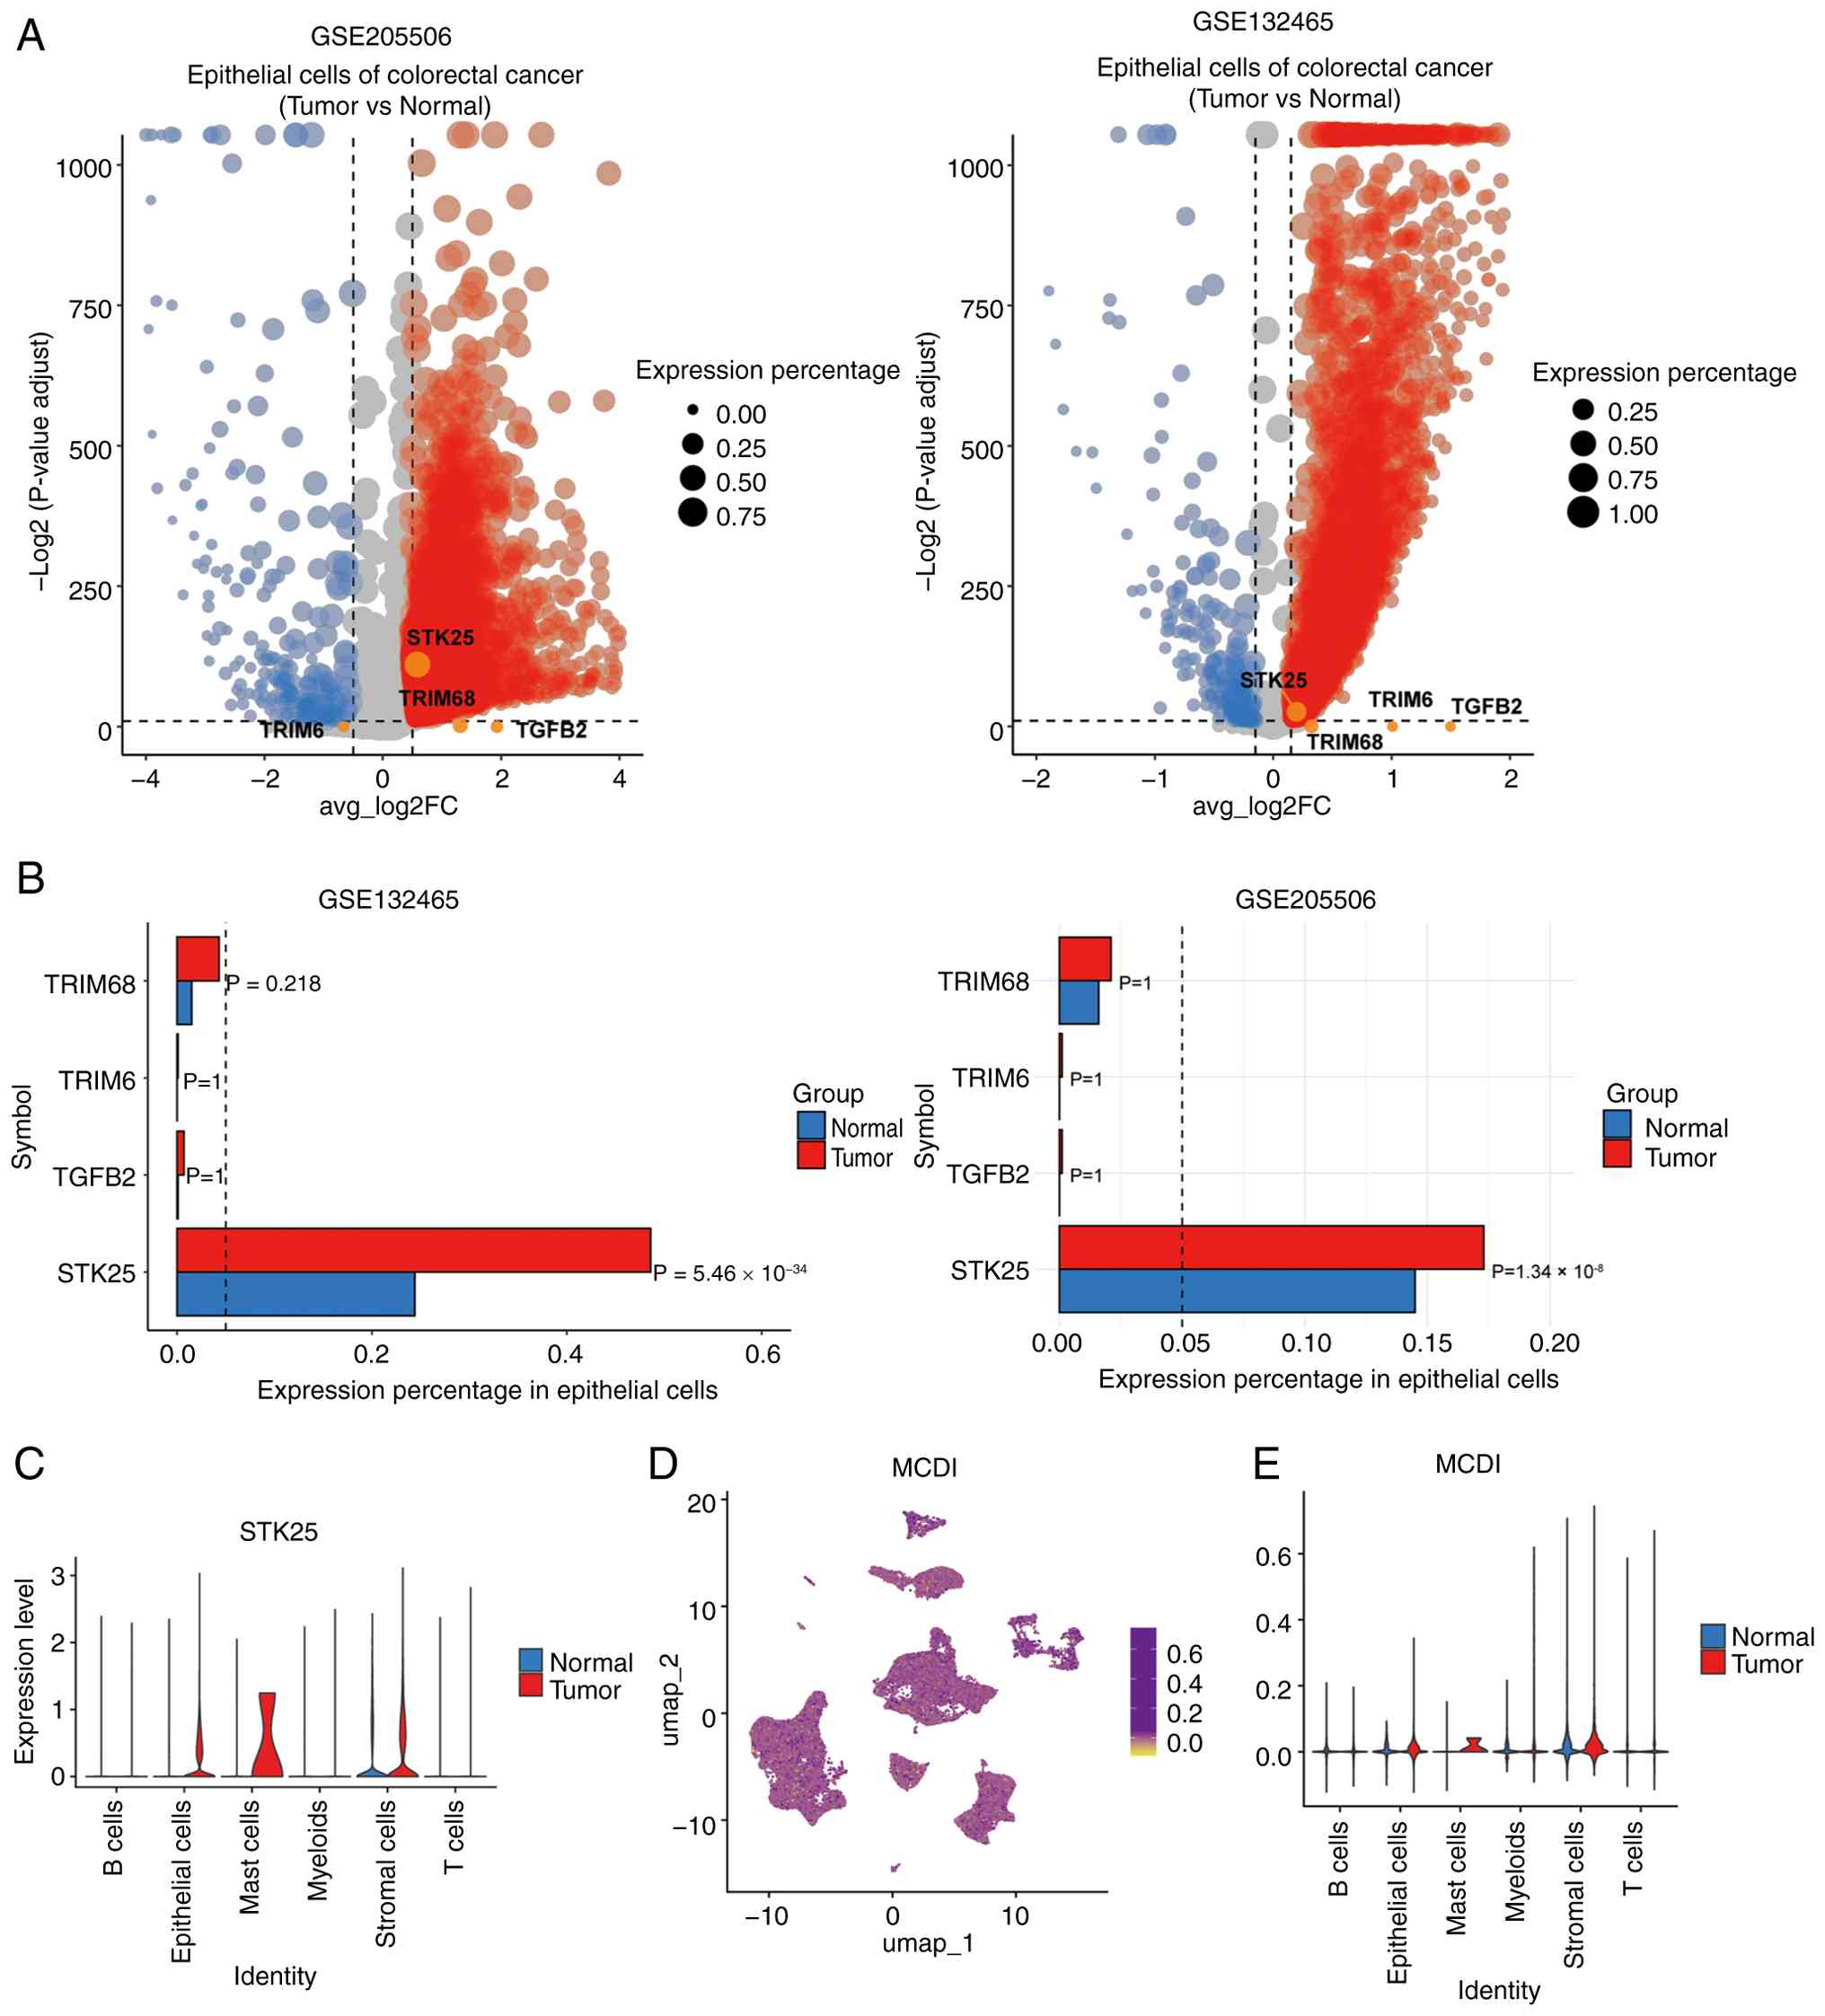 | Figure 9.Tumor epithelial cell-specific
enrichment of STK25 and MCDI score distribution at single-cell
resolution. (A) Volcano plots of differentially expressed genes
between tumor-derived and normal epithelial cells. Red and blue
dots indicate genes significantly upregulated and downregulated in
tumor epithelial cells, respectively. (B) Bar plots summarizing the
mean expression proportion, fold change and adjusted P-values for
TRIM68, TRIM6, TGFB2 and STK25 in tumor versus normal epithelial
cells. (C) Violin plot illustrating STK25 expression levels across
different cell types. (D) UMAP plot showing the single-cell-level
distribution of the MCDI score. (E) Violin plot depicting the
distribution of MCDI scores across different cell types. MCDI,
m6A-PCD integrated signature; PCD, programmed cell death; STK25,
serine/threonine kinase 25; TRIM68, tripartite motif containing 68;
TRIM6, tripartite motif containing 6; TGFB2, transforming growth
factor β2. |
To confirm the reproducibility of the single-cell
observations, particularly the tumor-specific enrichment of STK25
in epithelial cells, an independent colon cancer scRNA-seq dataset
(GSE205506) was analyzed. Consistently, STK25 was markedly
upregulated in tumor-derived epithelial cells, whereas TRIM6,
TRIM68 and TGFB2 remained minimally expressed across cell types
(Fig. 8A-D).
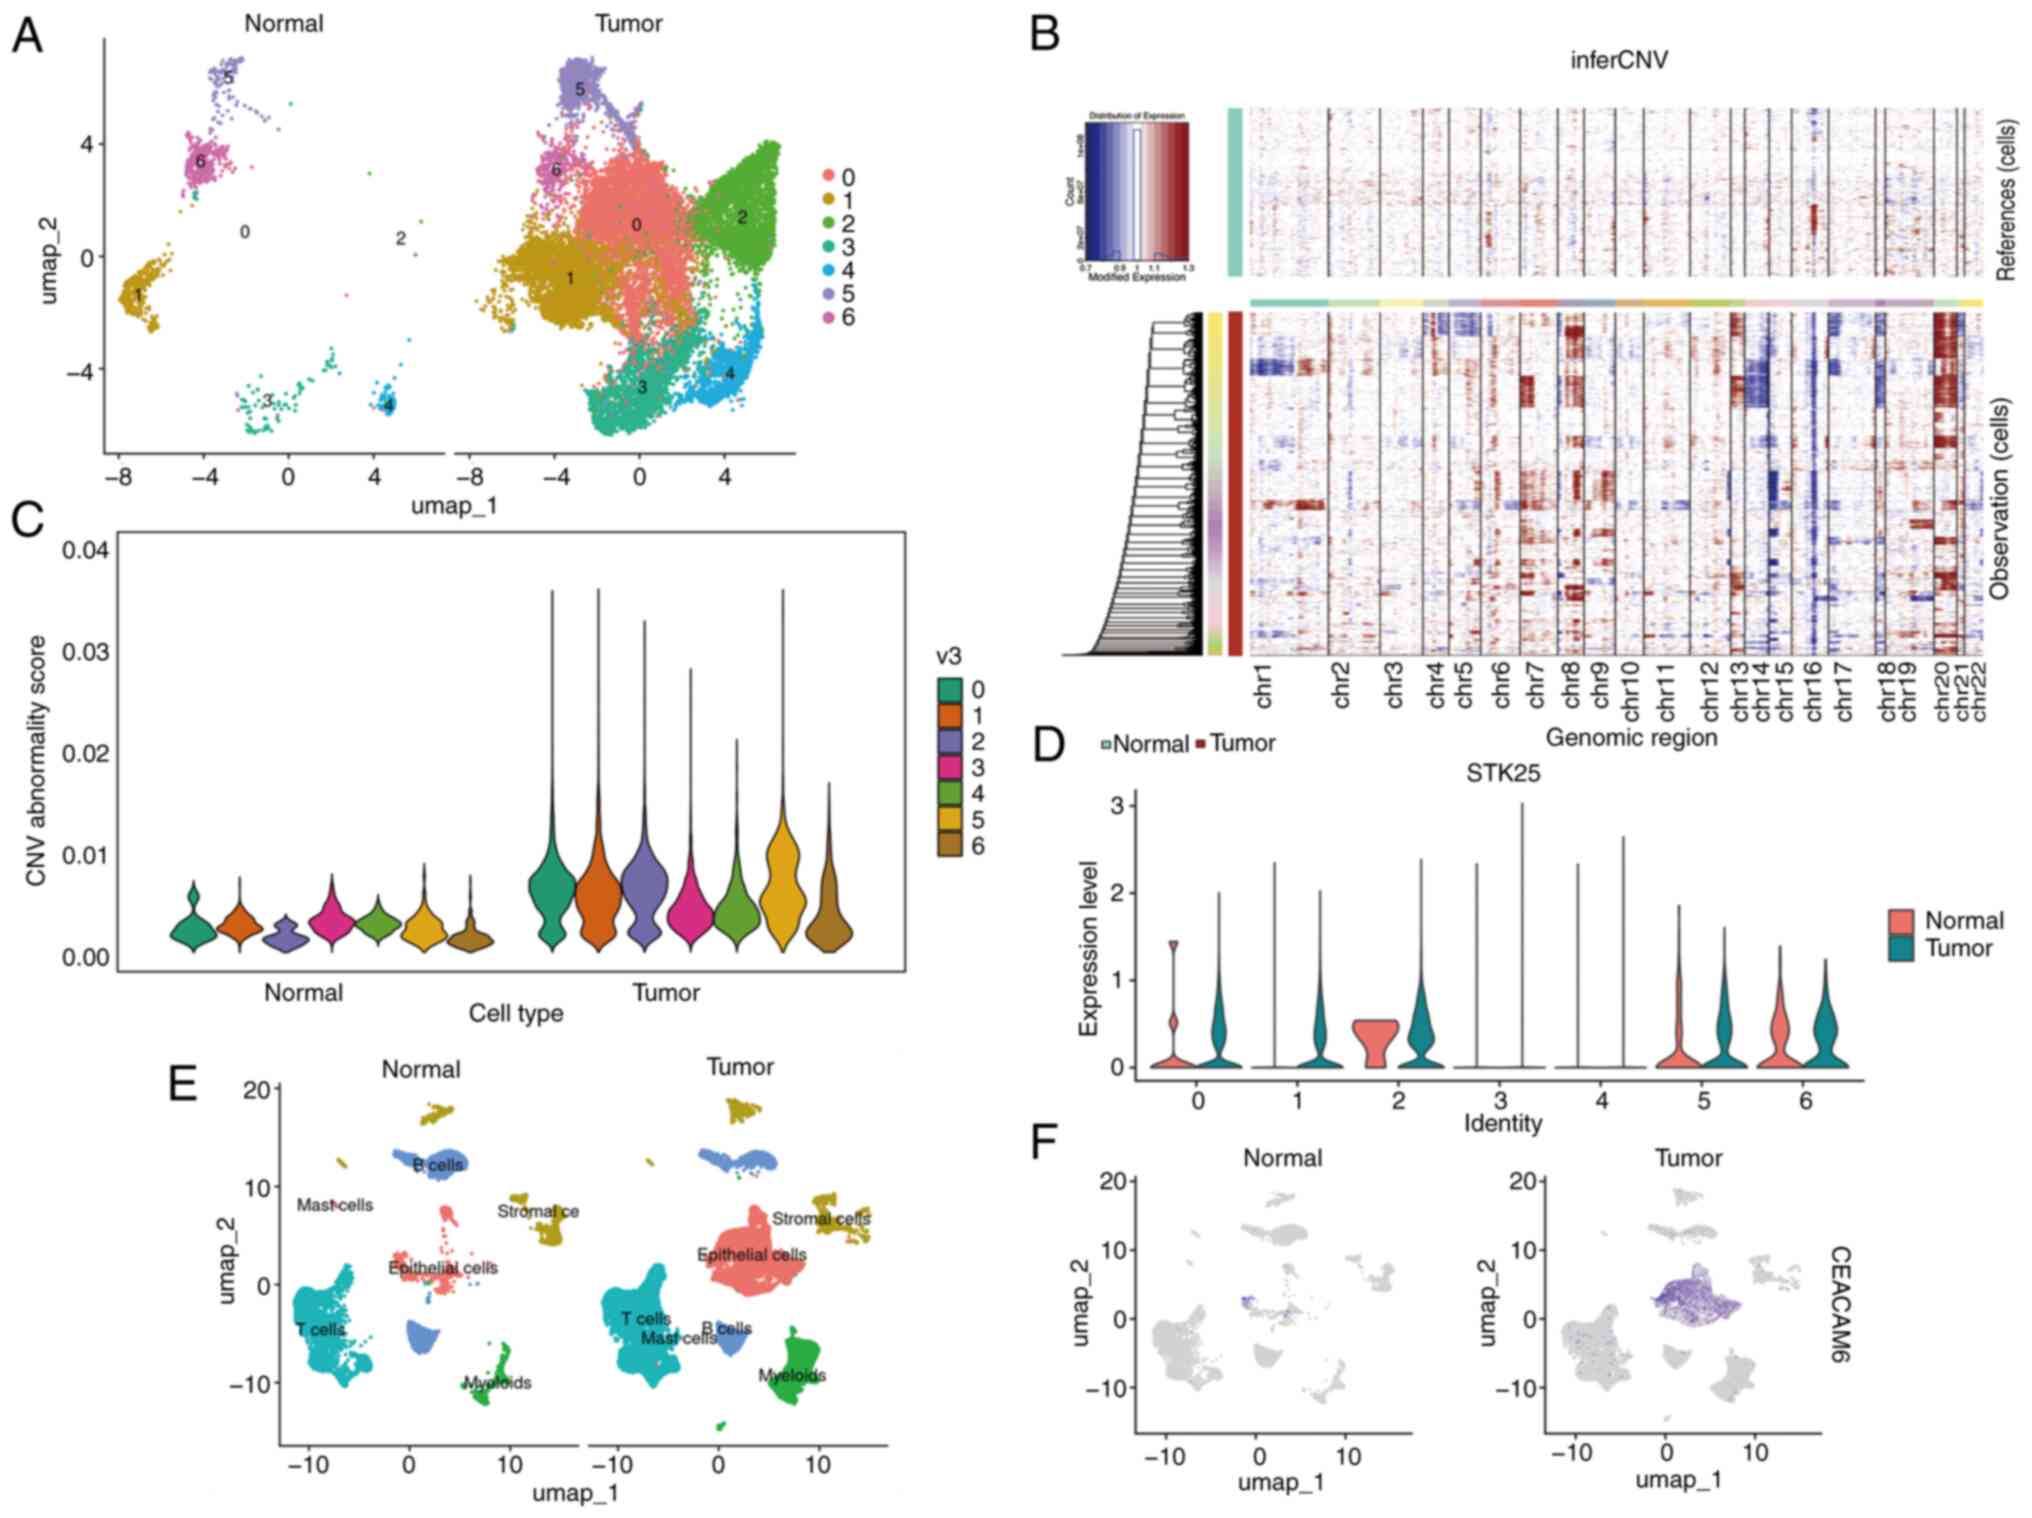
To further validate the epithelial origin of STK25
enrichment and its association with malignancy, re-clustering of
epithelial cells from the integrated GSE132465 dataset was
performed, identifying 7 distinct subclusters (Cluster 0–6)
(Fig. 10A). Subsequent inferCNV
analysis, visualized via a heatmap of chromosomal CNVs (Fig. 10B) and violin plots comparing CNV
aberration scores (Fig. 10C),
revealed that Clusters 0, 1, 2 and 5 exhibited significantly
elevated CNV scores relative to the normal control group,
indicating that these subclusters represent malignant epithelial
cells. Notably, within the GSE132465 cohort, high STK25 expression
(Fig. 10D), along with the
established malignant epithelial marker CEACAM6 (Fig. 10E and F), was predominantly
concentrated in these CNV-defined malignant subclusters (Clusters
0, 1, 2 and 5) from tumor samples, providing cross-validation and
confirming tumor-specific enrichment.
Collectively, these results consistently highlighted
STK25 as a tumor-enriched, prognostically relevant MCDI core gene,
supporting its selection for further functional investigation.
STK25 expression is associated with
tumor progression and apoptosis suppression in COAD
The expression profile and clinical significance of
STK25 in COAD was next evaluated. The Wilcoxon rank-sum test
revealed that STK25 expression was significantly higher in patients
with elevated MCDI scores. STK25 expression did not show
significant differences across tumor stages (T stage) or distant
metastasis status (M stage). However, higher expression levels were
observed in patients with lymph node metastasis, particularly in
the N2 group (Fig. 11A). Although
STK25 expression showed a modest upward trend in distant metastasis
(M stage), this did not reach statistical significance. Notably,
younger patients exhibited slightly higher STK25 expression than
older patients (Fig. 11A).
Patients were divided into high- and low-expression groups based on
the median STK25 level. Kaplan-Meier survival analysis demonstrated
that patients with high STK25 expression had a significantly poorer
OS compared with those with low expression (Fig. 11B), indicating that elevated STK25
may be associated with aggressive tumor behavior and an unfavorable
prognosis.
 | Figure 11.Clinical significance, expression
validation and oncogenic function of STK25. (A) Box plots depicting
the association between STK25 expression and clinical parameters,
including MCDI score, T stage, N stage, M stage and patient age
(old, >55 years; young, ≤55 years). Comparisons were performed
using the Wilcoxon rank-sum test. (B) Kaplan-Meier overall survival
curves comparing patients with high versus low STK25 expression,
stratified by the median expression level, in the The Cancer Genome
Atlas-colon adenocarcinoma cohort. (C) RT-qPCR validation of
relative STK25 mRNA expression in 10 paired colon cancer and
adjacent normal tissue samples. (D) Western blot validation of
STK25 protein expression in three representative paired colon
cancer and adjacent normal tissues, with GAPDH as the loading
control. (E) Validation of STK25 knockdown efficiency in RKO and
LOVO cells using siRNA, measured by RT-qPCR. (F) Apoptosis analysis
in LOVO cells after STK25 knockdown, assessed by Annexin V-FITC/PI
flow cytometry. *P<0.05, ***P<0.001, ****P<0.0001.
RT-qPCR, reverse transcription-quantitative PCR; MCDI, m6A-PCD
integrated signature; PCD, programmed cell death; STK25,
serine/threonine kinase 25; siRNA, small interfering RNA; NC,
negative control. |
To validate the differential expression results,
qPCR and western blot analyses were performed on paired tumor and
adjacent normal tissues, which consistently showed markedly higher
STK25 expression in tumor tissues (Fig. 11C and D). Functional assays further
explored the biological role of STK25; STK25 knockdown in LOVO
cells, confirmed by qPCR (Fig.
11E), significantly increased apoptosis, as measured by flow
cytometry (Fig. 11F).
Collectively, these findings indicated that STK25
may promote colon cancer progression, at least in part by
suppressing apoptosis, supporting its role as a potential oncogenic
driver and therapeutic target.
METTL3/YTHDC1-mediated m6A
modification stabilizes STK25 mRNA in COAD
The upstream mechanisms driving STK25 upregulation
were next investigated, focusing on potential regulation via
m6A-dependent post-transcriptional modification. Spearman
correlation analysis between STK25 and 23 known m6A regulators in
the TCGA-COAD cohort revealed a distinct pattern: STK25 expression
was positively correlated with PCIF1, ZC3H7B, YTHDF1, HNRNPD,
METTL3, GNL3 and YTHDC1, while negatively correlated with METTL14,
RBM27, YTHDC2, RBM15, YTHDF3, WTAP and MSI2 (Fig. 12A).
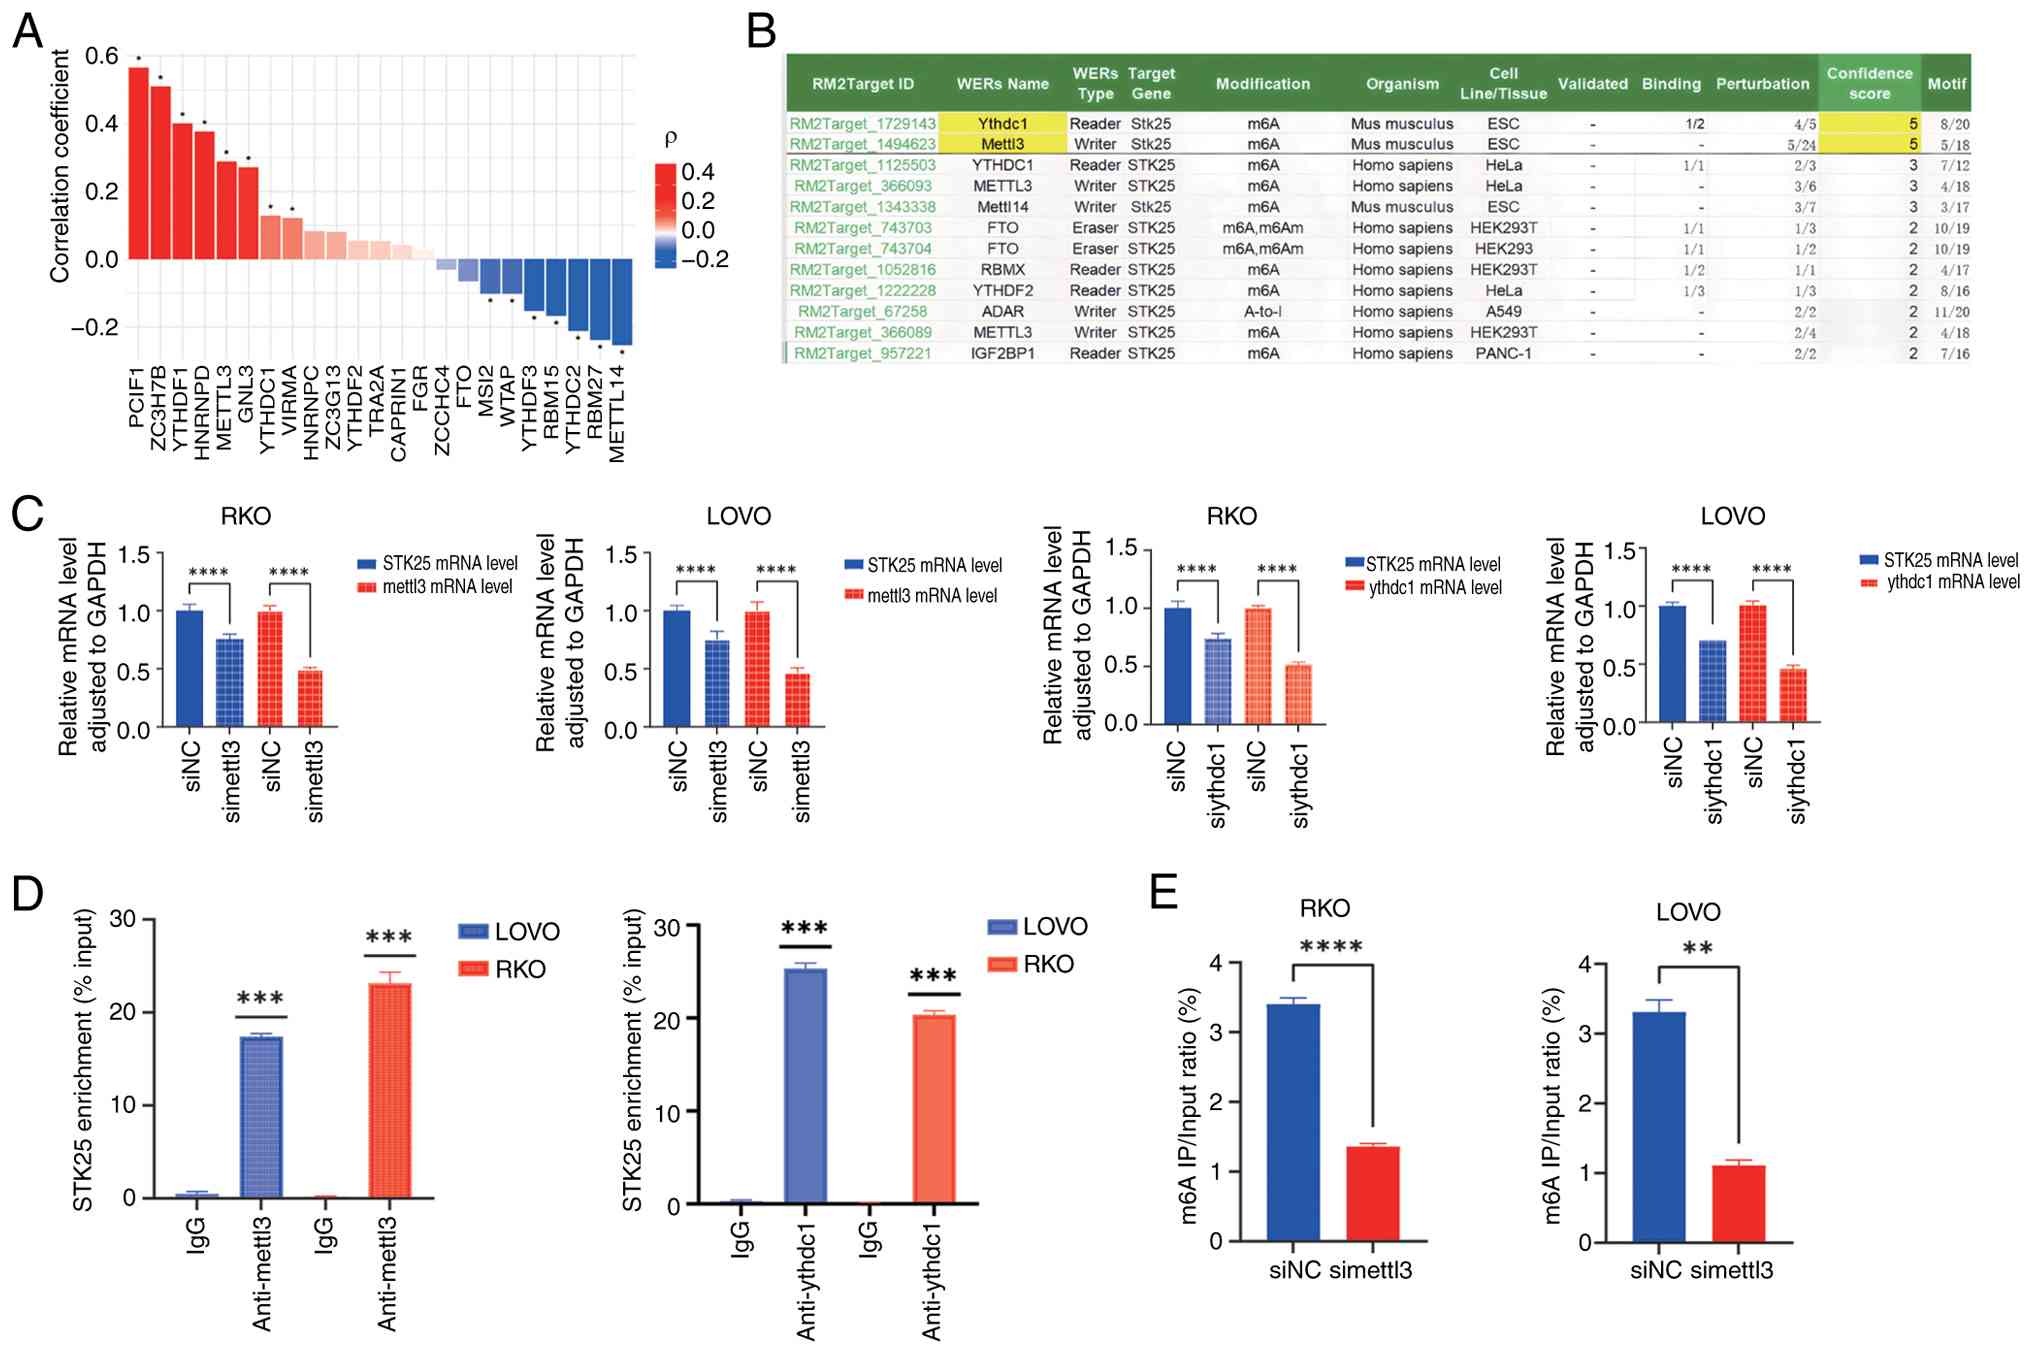 | Figure 12.METTL3/YTHDC1 regulates STK25 mRNA
stability via m6A modification. (A) Bar plot showing Spearman
correlation coefficients between STK25 and 23 m6A regulators. Red
bars indicate positive correlations; blue bars indicate negative
correlations and color intensity reflects correlation strength. (B)
Credibility scores of m6A regulators predicted to target STK25, as
obtained from the RM2Target database. (C) Reverse
transcription-qPCR analysis of STK25 mRNA levels in RKO and LOVO
cells following knockdown of METTL3 or YTHDC1. (D) RIP assay using
METTL3 and YTHDC1 antibodies, showing enrichment of STK25 mRNA
compared with IgG control. (E) MeRIP-qPCR analysis of m6A
modification on STK25 mRNA in control and METTL3-knockdown cells,
demonstrating decreased m6A enrichment upon METTL3 knockdown.
*P<0.05, **P<0.01, ***P<0.001,
****P<0.0001. qPCR, quantitative PCR; RIP, RNA
immunoprecipitation; MeRIP, methylated RNA immunoprecipitation;
METTL3, methyltransferase-like 3; YTHDC1, YTH domain containing 1;
STK25, serine/threonine kinase 25; si, small interfering RNA; NC,
negative control. |
To identify the most credible upstream regulators,
the RM2Target database was queried using STK25 as the target gene.
METTL3 and YTHDC1 emerged as the highest-confidence regulators
predicted to target STK25 (Fig.
12B), as they showed the highest confidence scores in RM2Target
and were supported by binding and perturbation evidence. Both
regulators also exhibited positive associations with STK25
expression, suggesting a potential regulatory mechanism involving
m6A installation by METTL3 and subsequent recognition by YTHDC1.
Functionally, METTL3, as an m6A ‘writer’, deposits m6A markers on
RNA, while YTHDC1, a nuclear m6A ‘reader’, binds methylated
transcripts to enhance stability. Consistent with this mechanism,
knocking down METTL3 or YTHDC1 expression in RKO and LOVO cells
reduced STK25 mRNA levels (Fig.
12C).
To determine if this regulation is direct, RIP
assays were performed using antibodies against METTL3 and YTHDC1.
RIP-qPCR demonstrated significant enrichment of STK25 transcripts
in both METTL3 and YTHDC1 IPs compared with IgG controls (Fig. 12D), confirming direct physical
interaction with STK25 mRNA. Finally, MeRIP-qPCR was conducted to
verify METTL3-mediated m6A modification of STK25. Following METTL3
knockdown, m6A enrichment on STK25 mRNA was significantly reduced
(Fig. 12E).
Collectively, these results demonstrated that
METTL3-catalyzed m6A methylation and YTHDC1 recognition
cooperatively enhanced STK25 mRNA stability, establishing an
m6A-YTHDC1-STK25 axis that promotes COAD progression, with METTL3
knockdown effectively suppressing STK25 expression.
Discussion
In the present study, an integrated MCDI for COAD
capable of stratifying patient survival and predicting response to
PD-1/PD-L1 immunotherapy was developed. Within this signature,
STK25 emerged as a previously unrecognized, tumor-enriched driver
that may promote tumor progression by suppressing apoptosis.
Mechanistically, a novel m6A-dependent METTL3-YTHDC1-STK25 axis was
uncovered, which may stabilize STK25 mRNA and a possible direct
link between m6A regulation and PCD in COAD was established.
Despite continued reliance on clinicopathological
indicators, prognostic performance in COAD remains inconsistent
across genetically heterogeneous patients (12,28–31).
This inconsistency is further compounded by prior studies, which
largely modeled either m6A regulation or individual PCD pathways in
isolation (32–41). By contrast, the present study
integrated these layers into a single transcriptomic signature, the
MCDI, providing independent risk stratification of the TCGA-COAD
cohort, which was externally validated using GSE39582, GSE33113 and
GSE38832 (31,42). This integrative strategy captured
complementary biological information: m6A functions upstream at the
post-transcriptional level, whereas PCD represents downstream
execution programs that determine cell fate (43–45).
Therefore, joint modeling provides a more comprehensive readout of
tumor state than either layer alone, enhancing discriminative power
and robustness, as confirmed by the internal TCGA and external
cohort validations. By coupling the global regulatory influence of
m6A with the key effector pathways of PCD, the model captures
regulatory mechanisms that are shared across diverse molecular
backgrounds. This integrative design enables the model to maintain
predictive performance across heterogeneous tumor subtypes,
consistent with its independent prognostic value across clinical
strata observed in the present study (4,6,46–48).
Compared with previous models focusing on a single
dimension either m6A regulation alone or individual PCD pathways
(49,50), the integrated approach of the
present study demonstrates improved predictive performance. In the
external validation cohorts (GSE39582 and GSE38832), the MCDI
achieved AUC values of 0.783–0.805 for 1-year and 0.699–0.711 for
3-year OS, outperforming recently reported single-mechanism
prognostic signatures, including those by Ma et al (51) (1-year AUC: 0.66; 3-year AUC: 0.67),
Qiao et al (52) (AUC range:
0.516–0.607) and Zhu et al (53) (1-year AUC: 0.67; 3-year AUC:
0.67).
Beyond this performance advantage, the MCDI
framework not only offers improved risk stratification but also
enhances mechanistic insight and clinical relevance. Conventional
single-dimensional models are often limited to identifying
correlations, whereas the integrated analysis of the present study
led to the discovery of a novel METTL3-YTHDC1-STK25 regulatory
axis. Experimental validation demonstrated that this axis may
stabilize STK25 mRNA in an m6A-dependent manner, thereby
suppressing cancer cell apoptosis. This finding directly links
upstream epitranscriptomic regulation with downstream execution of
cell death, providing a mechanistic explanation for the prognostic
power of the MCDI, an insight rarely achievable with single-pathway
models.
Furthermore, since PCD modalities shape antitumor
immunity (54,55) and m6A broadly regulates transcripts
involved in both immune function and PCD (56), an integrated signature such as the
MCDI naturally connects to immune checkpoint activity and can
predict PD-1/PD-L1 responsiveness. Notably, in the present study,
no significant association was observed between the MCDI score and
the TMB or MSI status. This may reflect two possibilities: First,
that the direct clinical utility of MCDI for predicting response to
current immune checkpoint inhibitors requires further validation;
second, more plausibly, that the model captures a distinct
biological mechanism operating independently of the conventional
TMB/MSI framework. High MCDI scores were associated with the
enrichment of M0 macrophages and Tregs, a reduction in cytotoxic
immune cells and an increased immune evasion potential, as
indicated by the TIDE scores, delineating a unique
immunosuppressive microenvironment. These observations suggest that
tumor-intrinsic properties shaped by the m6A-PCD network may
represent an alternative pathway of immune evasion. Therefore, the
strength of the MCDI lies in uncovering biological mechanisms that
function independently of TMB/MSI, rather than serving as a direct
substitute for existing predictive biomarkers. This integrated
framework enhances mechanistic interpretability by linking pathway
imbalances to traceable epigenetic regulation.
The core prognostic gene STK25 within the MCDI
signature exemplifies the mechanistic link between m6A regulation
and PCD while providing novel insights into its clinical relevance.
Previous studies have associated STK25 with tumor progression
through metabolic and signaling pathways promoting lipid metabolic
reprogramming and proliferation via striatin-AMP-activated protein
kinase-acetyl-CoA carboxylase 1 in hepatocellular carcinoma
(57) and facilitating COAD growth
by restraining autophagy through JAK2-STAT3 (58). While these reports established
biological plausibility, they did not position STK25 within a
clinically validated, multi-gene framework or define its spatial
distribution in human tumors. The present study extends these
findings by embedding STK25 within an integrated m6A-PCD prognostic
context. Within the MCDI, STK25 functions as an independent risk
factor in COAD: higher expression was associated with a poorer OS,
advanced T/N stage and tumor-enriched expression localized
primarily to epithelial cells, with additional expression in
mast-cell compartments, at single-cell resolution. Thus, beyond
pathway-centric observations, STK25 is now linked to a risk model
that generalizes across clinical strata and may be related to
immunotherapy response, enhancing its clinical relevance for
patient stratification and mechanistic hypothesis generation.
Mechanistically, the present study delineated a
previously unreported m6A-dependent METTL3-YTHDC1-STK25 axis in
COAD. METTL3 (m6A writer) and YTHDC1 (nuclear reader) may cooperate
to stabilize STK25 mRNA and perturbation of either component may
reduce STK25 levels and increase apoptosis. These findings suggest
that STK25 functions as a mechanistically relevant effector rather
than merely a correlative marker. This may explain its sustained
upregulation in tumors and its integration with the cell
death-related biology captured by the MCDI model. Moreover, the
results highlight potential therapeutic intervention points both
upstream, through modulation of m6A writer/reader activity, and
downstream, through targeting STK25-mediated anti-apoptotic
effects. Consistent with the findings of the present study, prior
studies have shown that METTL3-mediated m6A modification promotes
oncogenic signaling in colon cancer through multiple downstream
targets, including JAK1-STAT3 activation via YTHDF1-mediated
translation (59) and m6A-dependent
silencing of suppressor of cytokine signaling 2 mRNA (60). These convergent observations
underscore METTL3 as a central m6A writer orchestrating key
oncogenic pathways in COAD, with the METTL3-YTHDC1-STK25 axis
adding a distinct apoptosis-regulatory dimension.
Although the MCDI prognostic model developed in the
present study demonstrated significant value for predicting colon
cancer outcomes, several limitations should be acknowledged: i)
Cohort size and validation depth: The model was primarily
constructed and validated using publicly available cohorts such as
TCGA, which have relatively limited sample sizes. Future studies
should incorporate multi-center, large-sample prospective cohorts
to further assess the generalizability and stability of the model,
particularly across diverse ethnicities, clinical stages and
treatment backgrounds. ii) Need for improved predictive
performance: While the model demonstrated promising discriminative
ability in survival prediction, further optimization is possible.
Integrating additional data modalities, such as methylation and
proteomics, as well as radiomics and clinicopathological features,
may improve risk stratification and enhance predictive performance.
iii) Mechanistic validation of the METTL3/YTHDC1-STK25 axis:
Although the findings of the present study robustly supported this
regulatory axis via correlation analysis, knockdown experiments,
RIP and MeRIP-qPCR assays, further mechanistic studies such as
direct measurement of STK25 mRNA stability (including actinomycin D
chase assays) and functional rescue experiments are warranted to
fully delineate the post-transcriptional regulatory mechanism.
While these limitations may affect the generalizability of the
findings of the present study, they also provide clear directions
for future research. Subsequent work should focus on expanding the
validation cohorts, optimizing the model architecture and deeper
mechanistic exploration to facilitate clinical translation of the
MCDI model.
In conclusion, the present study described a robust,
integrated MCDI that predicts survival and PD-1/PD-L1 immunotherapy
response in COAD. Additionally, a previously unreported
METTL3-YTHDC1-STK25 axis that links epitranscriptomic regulation to
apoptosis resistance was identified. This framework combined
prognostic stratification with mechanistic insight, supporting
clinical translation: MCDI may enable risk prediction and patient
stratification, while the STK25-m6A axis may provide actionable
therapeutic targets and potential biomarkers. Future research
should focus on validation of the MCDI framework in dedicated COAD
immunotherapy cohorts to clarify its clinical predictive value and
to explore combination strategies targeting the immunosuppressive
microenvironment it delineates, potentially through core effectors
such as STK25.
Acknowledgements
Not applicable.
Funding
This research was supported by the Operating Funds for Fujian
Clinical Research Center for Digestive System Tumors and Upper
Gastrointestinal Diseases (grant no. 2022YGPT004), the National Key
Clinical Specialty Construction Projects of Fujian Province, China
(grant no. 2023-1594) and the Construction Project of Fujian
Province Minimally Invasive Medical Center (grant no. 2021-76).
Availability of data and materials
The data generated in the present study may be
requested from the corresponding author.
Authors' contributions
HZY and FLC conducted the experiments, performed
bioinformatics analyses, interpreted the data and drafted the
manuscript. ZHC and ZXL were responsible for sample collection.
XYH, THL and FLC conceived and designed the study. FLC supervised
the project and provided critical revisions. All authors read and
approved the final manuscript. HZY and FLC confirm the authenticity
of all the raw data.
Ethics approval and consent to
participate
This study was approved by the Ethics Committee of
Fujian Medical University Union Hospital (approval no. 2025KY307).
All participants provided written informed consent after being
fully informed about the study procedures.
Patient consent for publication
Not applicable.
Competing interests
The authors declare that they have no competing
interests.
References
|
1
|
Bray F, Laversanne M, Sung H, Ferlay J,
Siegel RL, Soerjomataram I and Jemal A: Global cancer statistics
2022: GLOBOCAN estimates of incidence and mortality worldwide for
36 cancers in 185 countries. CA Cancer J Clin. 74:229–263.
2024.PubMed/NCBI
|
|
2
|
Ciardiello D, Guerrera LP, Maiorano BA,
Parente P, Latiano TP, Di Maio M, Ciardiello F, Troiani T,
Martinelli E and Maiello E: Immunotherapy in advanced anal cancer:
Is the beginning of a new era? Cancer Treat Rev. 105:1023732022.
View Article : Google Scholar : PubMed/NCBI
|
|
3
|
Miller KD, Nogueira L, Devasia T, Mariotto
AB, Yabroff KR, Jemal A, Kramer J and Siegel RL: Cancer treatment
and survivorship statistics, 2022. CA Cancer J Clin. 72:409–436.
2022.PubMed/NCBI
|
|
4
|
Wu Q, Fu X, He X, Liu J, Li Y and Ou C:
Experimental prognostic model integrating
N6-methyladenosine-related programmed cell death genes in
colorectal cancer. Science. 27:1087202024.
|
|
5
|
Chen J, Ye M, Bai J, Hu C, Lu F, Gu D, Yu
P and Tang Q: Novel insights into the interplay between m6A
modification and programmed cell death in cancer. Int J Biol Sci.
19:1748–1763. 2023. View Article : Google Scholar : PubMed/NCBI
|
|
6
|
Liu L, Li H, Hu D, Wang Y, Shao W, Zhong
J, Yang S, Liu J and Zhang J: Insights into N6-methyladenosine and
programmed cell death in cancer. Mol Cancer. 21:322022. View Article : Google Scholar : PubMed/NCBI
|
|
7
|
Boulias K and Greer EL: Biological roles
of adenine methylation in RNA. Nat Rev Genet. 24:143–160. 2023.
View Article : Google Scholar : PubMed/NCBI
|
|
8
|
Jiang X, Liu B, Nie Z, Duan L, Xiong Q,
Jin Z, Yang C and Chen Y: The role of m6A modification in the
biological functions and diseases. Signal Transduct Target Ther.
6:742021. View Article : Google Scholar : PubMed/NCBI
|
|
9
|
Liu J, Harada BT and He C: Regulation of
gene expression by N6-methyladenosine in cancer. Trends Cell Biol.
29:487–499. 2019. View Article : Google Scholar : PubMed/NCBI
|
|
10
|
Wei S, Han C, Mo S, Huang H and Luo X:
Advancements in programmed cell death research in antitumor
therapy: A comprehensive overview. Apoptosis. 30:401–421. 2025.
View Article : Google Scholar : PubMed/NCBI
|
|
11
|
Park W, Wei S, Kim BS, Kim B, Bae SJ, Chae
YC, Ryu D and Ha KT: Diversity and complexity of cell death: A
historical review. Exp Mol Med. 55:1573–1594. 2023. View Article : Google Scholar : PubMed/NCBI
|
|
12
|
Sun ZQ, Ma S, Zhou QB, Yang SX, Chang Y,
Zeng XY, Ren WG, Han FH, Xie X, Zeng FY, et al: Prognostic value of
lymph node metastasis in patients with T1-stage colorectal cancer
from multiple centers in China. World J Gastroenterol.
23:8582–8590. 2017. View Article : Google Scholar : PubMed/NCBI
|
|
13
|
Qu Y, Gao N, Zhang S, Gao L, He B, Wang C,
Gong C, Shi Q, Li Z, Yang S and Xiao Y: Role of N6-methyladenosine
RNA modification in cancer. Med Comm. 5:e7152024.2020.
|
|
14
|
Chen X, Xu M, Xu X, Zeng K, Liu X, Pan B,
Li C, Sun L, Qin J, Xu T, et al: METTL14-mediated
N6-methyladenosine modification of SOX4 mRNA inhibits tumor
metastasis in colorectal cancer. Mol Cancer. 19:1062020. View Article : Google Scholar : PubMed/NCBI
|
|
15
|
Liu Y, Guo F, Guo W, Wang Y, Song W and Fu
T: Ferroptosis-related genes are potential prognostic molecular
markers for patients with colorectal cancer. Clin Exp Med.
21:467–477. 2021. View Article : Google Scholar : PubMed/NCBI
|
|
16
|
Wu LS, Liu Y, Wang XW, Xu B, Lin YL, Song
Y, Dong Y, Liu JL, Wang XJ, Liu S, et al: LPS enhances the
chemosensitivity of oxaliplatin in HT29 cells via GSDMD-mediated
pyroptosis. Cancer Manag Res. 12:10397–10409. 2020. View Article : Google Scholar : PubMed/NCBI
|
|
17
|
He Q, Li Z, Yin J, Li Y, Yin Y, Lei X and
Zhu W: Prognostic significance of autophagy-relevant gene markers
in colorectal cancer. Front Oncol. 11:5665392021. View Article : Google Scholar : PubMed/NCBI
|
|
18
|
Livak KJ and Schmittgen TD: Analysis of
relative gene expression data using real-time quantitative PCR and
the 2(−Delta Delta C(T)) method. Methods. 25:402–408. 2001.
View Article : Google Scholar : PubMed/NCBI
|
|
19
|
Cao K, Zhu J, Lu M, Zhang J, Yang Y, Ling
X, Zhang L, Qi C, Wei S, Zhang Y and Ma J: Analysis of multiple
programmed cell death-related prognostic genes and functional
validations of necroptosis-associated genes in oesophageal squamous
cell carcinoma. EBioMedicine. 99:1049202024. View Article : Google Scholar : PubMed/NCBI
|
|
20
|
Wang R, Li Z and Shen J: Predicting
prognosis and drug sensitivity in bladder cancer: An insight into
pan-programmed cell death patterns regulated by M6A modifications.
Sci Rep. 14:183212024. View Article : Google Scholar : PubMed/NCBI
|
|
21
|
Marisa L, de Reyniès A, Duval A, Selves J,
Gaub MP, Vescovo L, Etienne-Grimaldi MC, Schiappa R, Guenot D,
Ayadi M, et al: Gene expression classification of colon cancer into
molecular subtypes: Characterization, validation, and prognostic
value. PLoS Med. 10:e10014532013. View Article : Google Scholar : PubMed/NCBI
|
|
22
|
Kemper K, Versloot M, Cameron K, Colak S,
de Sousa e Melo F, de Jong JH, Bleackley J, Vermeulen L, Versteeg
R, Koster J and Medema JP: Mutations in the Ras-Raf Axis underlie
the prognostic value of CD133 in colorectal cancer. Clin Cancer
Res. 18:3132–3141. 2012. View Article : Google Scholar : PubMed/NCBI
|
|
23
|
Tripathi MK, Deane NG, Zhu J, An H, Mima
S, Wang X, Padmanabhan S, Shi Z, Prodduturi N, Ciombor KK, et al:
Nuclear factor of activated T-cell activity is associated with
metastatic capacity in colon cancer. Cancer Res. 74:6947–6957.
2014. View Article : Google Scholar : PubMed/NCBI
|
|
24
|
Ascierto ML, McMiller TL, Berger AE,
Danilova L, Anders RA, Netto GJ, Xu H, Pritchard TS, Fan J, Cheadle
C, et al: The intratumoral balance between metabolic and
immunologic gene expression is associated with anti-PD-1 response
in patients with renal cell carcinoma. Cancer Immunol Res.
4:726–733. 2016. View Article : Google Scholar : PubMed/NCBI
|
|
25
|
Hugo W, Zaretsky JM, Sun L, Song C, Moreno
BH, Hu-Lieskovan S, Berent-Maoz B, Pang J, Chmielowski B, Cherry G,
et al: Genomic and transcriptomic features of response to anti-PD-1
therapy in metastatic melanoma. Cell. 165:35–44. 2016. View Article : Google Scholar : PubMed/NCBI
|
|
26
|
Lee HO, Hong Y, Etlioglu HE, Cho YB,
Pomella V, Van den Bosch B, Vanhecke J, Verbandt S, Hong H, Min JW,
et al: Lineage-dependent gene expression programs influence the
immune landscape of colorectal cancer. Nat Genet. 52:594–603. 2020.
View Article : Google Scholar : PubMed/NCBI
|
|
27
|
Li J, Wu C, Hu H, Qin G, Wu X, Bai F,
Zhang J, Cai Y, Huang Y, Wang C, et al: Remodeling of the immune
and stromal cell compartment by PD-1 blockade in mismatch
repair-deficient colorectal cancer. Cancer Cell. 41:1152–1169.e7.
2023. View Article : Google Scholar : PubMed/NCBI
|
|
28
|
Liao CK, Yu YL, Lin YC, Hsu YJ, Chern YJ,
Chiang JM and You JF: Prognostic value of the C-reactive protein to
albumin ratio in colorectal cancer: An updated systematic review
and meta-analysis. World J Surg Oncol. 19:1392021. View Article : Google Scholar : PubMed/NCBI
|
|
29
|
Huang X, Liu H, Liao X, Xiao Z, Huang Z
and Li G: Prognostic factors for T1-2 colorectal cancer after
radical resection: Lymph node distribution is a valuable predictor
of its survival. Asian J Surg. 44:241–246. 2021. View Article : Google Scholar : PubMed/NCBI
|
|
30
|
Pathak PS, Chan G, Deming DA and Chee CE:
State-of-the-art management of colorectal cancer: Treatment
advances and innovation. Am Soc Clin Oncol Educ Book.
44:e4384662024. View Article : Google Scholar : PubMed/NCBI
|
|
31
|
Zygulska AL and Pierzchalski P: Novel
diagnostic biomarkers in colorectal cancer. Int J Mol Sci.
23:8522022. View Article : Google Scholar : PubMed/NCBI
|
|
32
|
Zhang L, Mao Z, Yin K and Wang S: Review
of METTL3 in colorectal cancer: From mechanisms to the therapeutic
potential. Int J Biol Macromol. 277:1342122024. View Article : Google Scholar : PubMed/NCBI
|
|
33
|
Huang H, Weng H and Chen J: m6A
modification in coding and non-coding RNAs: Roles and therapeutic
implications in cancer. Cancer Cell. 37:270–288. 2020. View Article : Google Scholar : PubMed/NCBI
|
|
34
|
Ma M, Wang W, Li L, Wang X, Huang Q, Zhou
C, Huang Y, Zhao G and Ye L: RBM15 facilities lung adenocarcinoma
cell progression by regulating RASSF8 stability through N6
methyladenosine modification. Transl Oncol. 46:1020182024.
View Article : Google Scholar : PubMed/NCBI
|
|
35
|
An Y and Duan H: The role of m6A RNA
methylation in cancer metabolism. Mol Cancer. 21:142022. View Article : Google Scholar : PubMed/NCBI
|
|
36
|
Huang YY, Bao TY, Huang XQ, Lan QW, Huang
ZM, Chen YH, Hu ZD and Guo XG: Machine learning algorithm to
construct cuproptosis- and immune-related prognosis prediction
model for colon cancer. World J Gastrointest Oncol. 15:372–388.
2023. View Article : Google Scholar : PubMed/NCBI
|
|
37
|
Hu G, Yao H, Wei Z, Li L, Yu Z, Li J, Luo
X and Guo Z: A bioinformatics approach to identify a
disulfidptosis-related gene signature for prognostic implication in
colon adenocarcinoma. Sci Rep. 13:124032023. View Article : Google Scholar : PubMed/NCBI
|
|
38
|
Zhu J, Kong W and Xie Z: Expression and
prognostic characteristics of ferroptosis-related genes in colon
cancer. Int J Mol Sci. 22:56522021. View Article : Google Scholar : PubMed/NCBI
|
|
39
|
Zhou J, Guo H, Liu L, Feng M, Yang X and
Hao S: Pyroptosis patterns of colon cancer could aid to estimate
prognosis, microenvironment and immunotherapy: Evidence from
multi-omics analysis. Aging (Albany NY). 14:7547–7567. 2022.
View Article : Google Scholar : PubMed/NCBI
|
|
40
|
Zhu Q, Wu X, Ma L and Xue H:
Apoptosis-associated gene expression profiling is one new prognosis
risk predictor of human rectal cancer. Dis Markers.
2022:45968102022. View Article : Google Scholar : PubMed/NCBI
|
|
41
|
Chen S, Wang Y, Wang B, Zhang L, Su Y, Xu
M and Zhang M: A signature based on 11 autophagy genes for
prognosis prediction of colorectal cancer. PLoS One.
16:e02587412021. View Article : Google Scholar : PubMed/NCBI
|
|
42
|
Tsimberidou AM, Fountzilas E, Bleris L and
Kurzrock R: Transcriptomics and solid tumors: The next frontier in
precision cancer medicine. Semin Cancer Biol. 84:50–59. 2022.
View Article : Google Scholar : PubMed/NCBI
|
|
43
|
Gao L, Jiang Z, Han Y, Li Y and Yang X:
Regulation of pyroptosis by ncRNA: A novel research direction.
Front Cell Dev Biol. 10:8405762022. View Article : Google Scholar : PubMed/NCBI
|
|
44
|
Yang X, Mei C, Ma X, Du J, Wang J and Zan
L: m6A methylases regulate myoblast proliferation, apoptosis and
differentiation. Animals (Basel). 12:7732022. View Article : Google Scholar : PubMed/NCBI
|
|
45
|
Zhu TY, Hong LL and Ling ZQ: Oncofetal
protein IGF2BPs in human cancer: Functions, mechanisms and
therapeutic potential. Biomark Res. 11:622023. View Article : Google Scholar : PubMed/NCBI
|
|
46
|
Gao Y, Guo Q and Yu L: m6A modification of
RNA in cervical cancer: Role and clinical perspectives. RNA Biol.
21:49–61. 2024. View Article : Google Scholar : PubMed/NCBI
|
|
47
|
Zhou Y, Cao P and Zhu Q: The regulatory
role of m6A in cancer metastasis. Front Cell Dev Biol.
13:15396782025. View Article : Google Scholar : PubMed/NCBI
|
|
48
|
Zhang X, Cao Y, Liu J, Wang W, Yan Q and
Wang Z: Comprehensive analysis of m6A-related programmed cell death
genes unveils a novel prognostic model for lung adenocarcinoma. J
Cell Mol Med. 29:e702552025. View Article : Google Scholar : PubMed/NCBI
|
|
49
|
Wu Q, Chen L, Miao D, Jin Y and Zhu Z:
Prognostic signature based on m6A-related lncRNAs to predict
overall survival in pancreatic ductal adenocarcinoma. Sci Rep.
12:30792022. View Article : Google Scholar : PubMed/NCBI
|
|
50
|
Yin L, Feng S, Sun Y, Jiang Y, Tang C and
Sun D: Identification of a five m6A-relevant mRNAs signature and
risk score for the prognostication of gastric cancer. J
Gastrointest Oncol. 13:2234–2248. 2022. View Article : Google Scholar : PubMed/NCBI
|
|
51
|
Ma B, Bao S and Li Y: Identification and
validation of m6A-GPI signatures as a novel prognostic model for
colorectal cancer. Front Oncol. 13:11457532023. View Article : Google Scholar : PubMed/NCBI
|
|
52
|
Qiao S, Yang S, Hua H, Mao C, Li X, Cheng
C, Guo H and Lu W: Identification of prognostic biomarkers in
colorectal cancer through multi-omics profiling of programmed cell
death pathways. J Gastrointest Oncol. 16:1503–1520. 2025.
View Article : Google Scholar : PubMed/NCBI
|
|
53
|
Zhu H, Yang Y and Zhou Z: Construction and
clinical application of a risk model based on N6-methyladenosine
regulators for colorectal cancer. PeerJ. 12:e187192024. View Article : Google Scholar : PubMed/NCBI
|
|
54
|
Zhu ZZ, Zhang G and Liu J: Establishment
of a novel prognostic prediction model for gastric cancer based on
necroptosis-related genes. Pathol Oncol Res. 28:16106412022.
View Article : Google Scholar : PubMed/NCBI
|
|
55
|
Xia J, Zhuo W, Deng L, Yin S, Tang S, Yi
L, Feng C, Zhong X, He Z, Sun B and Zhang C: BDNF is a prognostic
biomarker involved in the immune infiltration of lung
adenocarcinoma and associated with programmed cell death. Oncol
Lett. 29:1912025. View Article : Google Scholar : PubMed/NCBI
|
|
56
|
Yan Y, Yin J, Ding Q, Lu Y, Gou S, Xu X
and Li Y: M6A RNA modification: Focusing on non-small cell lung
cancer progression, therapeutic strategies and challenges. Front
Oncol. 15:16223592025. View Article : Google Scholar : PubMed/NCBI
|
|
57
|
Zhang Y, Xu J, Qiu Z, Guan Y, Zhang X,
Zhang X, Chai D, Chen C, Hu Q and Wang W: STK25 enhances
hepatocellular carcinoma progression through the STRN/AMPK/ACC1
pathway. Cancer Cell Int. 22:42022. View Article : Google Scholar : PubMed/NCBI
|
|
58
|
Chen J, Gao P, Peng L, Liu T, Wu F, Xu K,
Chen L, Tan F, Xing P, Wang Z, et al: Downregulation of STK25
promotes autophagy via the janus kinase 2/signal transducer and
activator of transcription 3 pathway in colorectal cancer. Mol
Carcinog. 61:572–586. 2022. View Article : Google Scholar : PubMed/NCBI
|
|
59
|
Sun Y, Gong W and Zhang S: METTL3 promotes
colorectal cancer progression through activating JAK1/STAT3
signaling pathway. Cell Death Dis. 14:7652023. View Article : Google Scholar : PubMed/NCBI
|
|
60
|
Xu J, Chen Q, Tian K, Liang R, Chen T,
Gong A, Mathy N.W, Yu T and Chen X: m6A methyltransferase METTL3
maintains colon cancer tumorigenicity by suppressing SOCS2 to
promote cell proliferation. Oncol Rep. 44:973–986. 2020. View Article : Google Scholar : PubMed/NCBI
|