Introduction
Lung cancer is a leading cause of cancer-related
mortality worldwide and ranks second in incidence among all cancer
types (1,2). In the United States alone, ~234,580
new cases and 125,070 mortalities are projected for 2024,
representing the highest mortality burden of any malignancy
(2). It is primarily classified
into small cell lung cancer and non-small cell lung cancer (NSCLC)
(3). NSCLC accounts for nearly 85%
of all diagnoses, with lung adenocarcinoma (LUAD) emerging as the
most prevalent histological subtype, constituting ~40% of all lung
cancer cases (1). Epidermal growth
factor receptor (EGFR) mutation is a key driver gene mutation in
NSCLC, with research in this area being central to clinical
targeted therapy (4). In patients
with EGFR-mutated NSCLC, the clinical use of tyrosine kinase
inhibitors (TKIs) has markedly improved treatment efficacy and
driven key progress in NSCLC management (5,6). While
the adverse effects of TKIs are milder compared with traditional
chemotherapy (7), numerous
patients, including those with LUAD, continue to face challenges
such as poor treatment response, adverse reactions and unfavorable
survival outcomes (8). Currently,
biomarkers, such as lactate dehydrogenase (LDH), are employed in
the diagnosis and evaluation of lung cancer. Elevated LDH activity,
due to tumor cells' reliance on anaerobic metabolism for energy,
has been linked to the onset and progression of lung cancer and is
frequently used as a diagnostic adjunct in clinical practice
(9). However, the specificity and
prognostic value of existing biomarkers remain insufficient,
highlighting the need to identify more effective biomarkers to
enhance prognostic evaluation and enable personalized treatment.
Tumor metabolic reprogramming is a hallmark of cancer, with
metabolic abnormalities serving a critical role in tumor
initiation, proliferation, invasion and other processes (10). Research into tumor metabolic
pathways has thus become a vital avenue for discovering novel
biomarkers and therapeutic targets (11).
Polyamines are aliphatic cations present in all
mammalian cells and are essential for optimal growth in nearly
every cell type (12). The three
primary polyamines produced in mammalian cells are putrescine,
spermidine and spermine (13). In
normal cells, polyamine levels are tightly regulated by
biosynthetic and catabolic enzymes (14). Abnormal regulation of polyamine
metabolism and uptake in cancer cells leads to notably higher
levels of these compounds compared with normal cells. Such
dysregulation is associated with the initiation and progression of
various types of cancers, including breast, colon and lung cancers
(15,16). The elevated polyamine levels
contribute to disease progression by promoting cell proliferation,
malignant transformation and other oncogenic processes, ultimately
leading to worse prognoses (17).
Due to these clinical observations and the essential role of
polyamines in tumor growth, the polyamine pathway represents a
promising therapeutic target for cancer treatment. However, there
is limited research on the role of polyamine metabolism in LUAD
using bioinformatics approaches (18,19).
Therefore, the specific molecular mechanisms of polyamine
metabolism-related genes (PMRGs) in LUAD require further
investigation.
Mendelian randomization (MR) is grounded in
Mendelian genetic laws, where genotypes (genetic variations) are
randomly assigned to offspring (20). This random assignment allows genetic
variation to be used in studying causal relationships, helping
eliminate confounding factors and enhancing the reliability of
causal inference (21). By
leveraging genetic variations such as single nucleotide
polymorphisms (SNPs), which are associated with exposure factors,
MR serves as a tool to assess causal relationships between
exposures and outcomes. Through these assumptions and principles,
MR provides a more accurate and reliable framework for causal
inference, serving a critical role in genetics, epidemiology and
clinical research (20).
In contrast to traditional transcriptomics,
single-cell RNA sequencing (scRNA-seq) enables gene expression
analysis at the individual cellular level, revealing intercellular
variations and heterogeneities that conventional transcriptomic
methods cannot capture. With higher resolution, scRNA-seq can more
precisely detect gene expression differences between cells
(22). This technology is widely
used in cancer research to explore the complexities of the tumor
microenvironment, cancer cell interactions and tumor heterogeneity
(23). In lung cancer, scRNA-seq
can uncover gene expression patterns across various cell types
within the tumor and its microenvironment, providing insights into
molecular mechanisms, potential therapeutic targets and drug
resistance mechanisms (24). For
example, a study analyzed clinical biopsy samples from patients
with metastatic lung cancer using scRNA-seq, mapping >20,000
cancer and tumor microenvironment cells and offering valuable
insights for lung cancer diagnosis and treatment (25).
Against this backdrop, the present study
hypothesizes that polyamine metabolic dysregulation serves a
central role in LUAD initiation and progression by modulating
specific gene networks and influencing patient prognosis by
regulating cellular functions within the tumor microenvironment. To
validate this hypothesis, the present study developed a polyamine
metabolism-based prognostic model and investigated the molecular
mechanisms driving LUAD progression using integrated bioinformatics
approaches. Specifically, weighted gene co-expression network
analysis (WGCNA) was performed to identify key module genes
associated with polyamine metabolic phenotypes. Additionally, MR
analysis was performed to identify driver genes through causal
inference, analyze the expression patterns and functions of
prognostic genes at single-cell resolution using scRNA-seq and
combine these findings with experimental validation. This approach
aims to provide a comprehensive understanding of the role of
polyamine metabolism in LUAD, offering novel insights for clinical
management and prognostic evaluation of patients with LUAD. In
contrast to conventional transcriptomic analyses based primarily on
observational correlations, the present study adopts a triangulated
framework by integrating transcriptome data, scRNA-seq and MR. The
application of MR enables the inference of causal relationships
between PMRGs and LUAD risk, thereby providing a more robust
biological foundation for the identified prognostic signature that
transcends mere statistical association.
Materials and methods
Data source
The transcriptome dataset, along with relevant
clinical data, was obtained from 59 control tissue samples and 513
LUAD tumor tissue samples in The Cancer Genome Atlas (TCGA)-LUAD
dataset from TCGA database (https://cancergenome.nih.gov/) (26). Additionally, the GSE30219 (GPL570)
dataset included 85 LUAD tumor tissue samples and 14 control tissue
samples retrieved from the GEO database (https://www.ncbi.nlm.nih.gov/geo/query/acc.cgi?acc=GSE30219)
(27). The GSE31210 dataset
(GPL570) comprised 226 LUAD tumor tissue samples, while the
GSE131907 (GPL16791) single-cell dataset included 11 LUAD tumor
tissue samples and 11 control tissue samples, also sourced from the
GEO database (https://www.ncbi.nlm.nih.gov/geo/query/acc.cgi?acc=GSE131907)
(27). A total of 59 PMRGs were
retrieved from the Molecular Signatures Database (MSigDB)
(https://www.gsea-msigdb.org/gsea/msigdb/index.jsp).
Genome-wide association summary statistics for differentially
expressed (DE)-PMRGs and 65,864 patients with LUAD were collected
from the Genome Wide Association Studies (GWAS) database
(https://www.ebi.ac.uk/gwas/). The GWAS
data for LUAD (ieu-a-984) included 11,245 patients with LUAD and
54,619 controls with 10,345,176 SNPs, which were used as the
summary association statistics for the outcome.
Differential expression analysis and
module gene identification
Principal component analysis (PCA) clustering
analysis was performed on TCGA-LUAD dataset to investigate
clustering patterns between LUAD and normal samples using the
plotPCA function from the ‘DEseq2’ (28) R package (V1.38.0; Posit Software,
PBC). The primary aim of the present study was to identify
differentially expressed genes (DEGs) in LUAD and correlate them
with PMRG functional modules. The ‘DEseq2’ R package was utilized
to identify DEGs in TCGA-LUAD tumor tissues compared with control
tissues (adjusted P<0.05 and |log2 fold change (FC)|
>2) (28). The ‘ggplot2’ package
(V3.4.4) (29) and the ‘pheatmap’
package (V1.0.12) (30) were used
to generate volcano plots and heatmaps, respectively. To control
the false discovery rate (FDR) arising from multiple comparisons,
P-values were adjusted using the Benjamini-Hochberg method. DEGs
were identified based on the criteria of adjusted P<0.05 and
log2FC >2.
WGCNA
To explore the core gene modules associated with
PMRG functions, the single sample gene set enrichment analysis
(ssGSEA) method (31) was applied
to determine the enrichment fraction of PMRGs (PMRG scores) within
individual samples. The PMRG scores were treated as traits in WGCNA
performed using the ‘WGCNA’ package in R (V1.71) (32) to identify module genes highly
associated with PMRG scores. Initially, hierarchical clustering was
applied to the samples to identify and remove any outliers. A soft
threshold (β) with connectivity close to 0 was chosen by setting
R2>0.85. A scale-free network was constructed based
on the selected soft threshold, which divided all genes into
multiple modules visually distinguished by different colors
(minModuleSize=200; deepSplit=3; mergeCutHeight=0.25). Spearman
correlations between these modules and PMRG scores were computed
and the genes within the modules that exhibited the highest
positive and negative correlations were selected as the module
genes associated with PMRG scores.
Identification of DE-PMRGs and
functional annotation analysis
The core genes (DE-PMRGs) that were differentially
expressed and associated with the function of PMRGs were identified
through intersection analysis, forming the basis for subsequent
causal verification and model construction. DEGs and PMRG module
genes were intersected using the ‘VennDiagram’ R package (V1.7.3)
(33) to obtain DE-PMRGs.
Enrichment analysis of DE-PMRGs was performed using the
‘clusterProfiler’ R package (V4.7.1.003) (34), including Gene Ontology (GO) and
Kyoto Encyclopedia of Genes and Genomes (KEGG) pathway analysis,
with a significance level of P<0.05 considered statistically
significant. To investigate protein-protein interactions (PPIs)
within the DE-PMRG group, the STRING online network tool
(https://string-db.org/) was used to examine
protein associations, with a significance threshold of P<0.05
(interaction score >0.7). A network diagram was generated and
visualized using Cytoscape software (V3.9.1) (35).
MR analysis
To verify the causal relationship between DE-PMRGs
and LUAD and eliminate confounding factors, two-sample MR and
multivariate MR analyses were conducted using the
‘extract_instruments’ function from the ‘TwoSampleMR’ R package
(V0.5.7) (36). In this analysis,
DE-PMRGs were the exposure of interest, LUAD was the outcome and
SNPs served as instrumental variables (IVs). The MR method relied
on the following assumptions: i) IVs are strongly associated with
DE-PMRG risk; ii) IVs influence LUAD risk only through their effect
on DE-PMRG risk; and iii) IVs are independent of confounders.
GWAS data for expression quantitative trait loci of
DE-PMRGs were used as the summary association statistics for the
exposure. The exposure factors were assessed, and IVs were screened
using the ‘TwoSampleMR’ R package (V0.5.7) (36) function ‘extract_instruments’ to
identify IVs with significant associations with the exposure
factors (P=5×10⁻⁸). IVs for linkage disequilibrium were
removed (clump=TRUE; r2=0.001; kb=100). The
‘extract_outcome_data’ function was used to retrieve the outcome
data and eliminate IVs significantly associated with the outcome.
Simultaneously, IVs with an F-value <10 were excluded
(F=β2exposure/se2exposure).
A total of five MR methods, including MR Egger
(37), weighted median (38), inverse variance weighted (IVW)
(39), simple mode (40) and weighted mode (41), were employed to perform robust
causal analyses. A significant causal effect of DE-PMRGs on LUAD
was determined using P<0.05 from the IVW method among the five
MR approaches. The ‘mr_heterogeneity’ function within the
‘TwoSampleMR’ R package (42) was
used to perform a heterogeneity test (Cochran's Q test; P>0.05).
The ‘mr_pleiotropy’ function (43)
was used to evaluate horizontal pleiotropy (P>0.05). Finally,
the ‘directionality_test’ function (44) was used for Steiger analysis, with
correct_causal_direction=TRUE and P<0.05 as the criteria for
establishing the causal relationship.
Construction and validation of risk
model
To identify genes associated with the prognosis of
LUAD, univariate Cox regression analysis was performed on the MR
acquisition genes using the ‘survival’ package (V3.8-3), based on
LUAD samples with survival data from TCGA-LUAD dataset. This aimed
to initially screen genes related to LUAD prognosis (criteria, HR≠1
and adjusted P<0.05). The proportional hazards (PH) assumption
test was performed for the genes obtained from univariate Cox
regression (P>0.05). In the univariate Cox regression analysis,
FDR correction was applied to the P-values to account for multiple
testing. Genes with an adjusted P<0.05 and HR=1 were considered
candidate prognostic markers for further least absolute shrinkage
and selection operator (Lasso) regression analysis. Subsequently,
the ‘glmnet’ package (V4.1.4) was used to conduct Lasso analysis on
the candidate prognostic genes. At the optimal λ value, the Lasso
model minimized the error rate and successfully identified
prognostic genes with non-zero regression coefficients, analyzed
through 10-fold cross-validation. The risk model was constructed by
multiplying the coefficients derived from Lasso regression by the
gene expressions: Risk score=Σ[coef(gene_i) × expr(gene_i)] for i=1
to n. Based on their risk scores, individuals were divided into
high-risk and low-risk groups, using the optimal cutoff value of
−0.5605245. Survival differences between these groups were analyzed
using Kaplan-Meier curves via the ‘survminer’ package (V0.4.9)
(https://CRAN.R-project.org/package=survminer).
Additionally, reciever operating characteristic (ROC) curves were
generated using the ‘survivalROC’ package (V1.0.3) (https://CRAN.R-project.org/package=survivalROC). The
validity of the risk model was further assessed by replicating the
analysis in the GSE30219 dataset. The differential expression of
prognostic genes between LUAD tumor and control tissues was
examined using Wilcoxon tests (P<0.05) on TCGA-LUAD, GSE30219
and GSE31210 datasets, visualized with box plots generated using
the ‘ggplot2’ package (V3.4.4) (29).
Developing an independent prognostic
risk score and clinical characteristic analysis
To enhance the clinical applicability of the model,
a nomogram was constructed by integrating clinical features and
risk scores. Univariate and multivariate Cox regression analyses
were performed to assess the potential of risk score and various
clinical characteristics [including sex, age, stage, tumor (T),
lymph node (N) and metastasis (M) staging] as independent
predictors in patients with LUAD (criteria, HR≠1 and P<0.05).
The ‘rms’ R package (V6.5-0) (45)
was used to generate the nomogram, predicting 3-, 5- and 7-year
overall survival (OS) based on clinical characteristics and risk
score. Calibration curves [‘rms’ R package V6.5-0 (45)] and decision curves (‘ggDCA’ R
package V1.6.0) (46) were
generated to assess the performance of the nomogram.
To explore the relationship between clinical
characteristics and risk scores, the Wilcoxon test was used to
examine differences in risk scores across various subgroups based
on clinical features within TCGA-LUAD dataset (P<0.05).
Analysis of chromosomal and
subcellular localisation of prognostic genes
To examine the molecular localization of prognostic
genes and provide insights into their functional mechanisms, the
distribution of prognostic genes on chromosomes was analyzed using
the ‘Circos’ R package (V1.2.2) (47). Subcellular localization was also
assessed to identify the specific cellular regions where the
prognostic genes are located. mRNA sequences (FASTA format files)
of prognostic genes were obtained from the National Center for
Biotechnology Information's GENE database (https://www.ncbi.nlm.nih.gov/gene/?term=) and analyzed
for subcellular localization using the mRNALocater online database
(http://bio-bigdata.cn/). The results were
visualized by plotting histograms using the ‘ggplot2’ R package
(V3.4.4) (29).
GeneMANIA and friends analysis
To expand the functional association network of
prognostic genes and identify potential synergistic genes,
GeneMANIA (http://www.genemania.org/) was
employed to analyze genes related to the functions of prognostic
genes. GeneMANIA was used to predict genes associated with the
functional roles of prognostic genes and their corresponding
functions.
The functional similarity of prognostic genes was
assessed using GO term-based Friends analysis with the ‘GOSemSim’ R
package (V2.24.0) (48). Similarity
scores were averaged, ranked from high to low and the results were
visualized.
Construction of regulatory
networks
To explore the upstream regulatory mechanisms of
prognostic genes, a multi-level regulatory network was constructed.
The miRDB (http://mirdb.org) and TargetScan
(https://targetscan.org) databases, accessed
through the ‘multiMiR’ R package (V1.20.0) (49), were used to predict upstream
microRNAs (miRNAs/miR) associated with the prognostic genes. The
intersection of miRNAs identified from both databases was
determined using the ‘VennDiagram’ R package (V1.2.3) (33), resulting in a target miRNA set. The
Starbase database (https://rnasysu.com/encori/) was then used to predict
upstream long non-coding RNAs (lncRNAs) for the target miRNAs.
Additionally, the hTFtarget database (http://bioinfo.life.hust.edu.cn/hTFtarget) was
utilized to predict transcription factors (TFs) regulating the
prognostic genes. The lncRNA-miRNA-prognostic gene and
TF-prognostic gene-miRNA regulatory networks were subsequently
constructed using Cytoscape software.
Gene set enrichment analysis (GSEA) of
prognostic models
To examine the functional differences between high-
and low-risk groups and uncover the potential biological mechanisms
underlying the model, GSEA was performed for GO and KEGG pathways
in TCGA-LUAD dataset, comparing samples with high and low risk
scores. Pathways were considered enriched if they met the criteria
of normalized enrichment score >1 and P<0.05, with the top
five most significantly enriched pathways ranked by their
P-values.
Immune microenvironment analysis
To explore the association between risk models and
the tumor immune microenvironment and provide a basis for
immunotherapy, the present study utilized the ssGSEA algorithm in
the training set and performed the Wilcoxon test to compare
differences between high- and low-risk groups (P<0.05).
Additionally, a correlation analysis was conducted in TCGA-LUAD
dataset using Spearman's rank correlation coefficient to examine
the relationship between prognostic genes and differential immune
cell populations, with a significance threshold of Ρ>0.3 and
P<0.05.
Drug sensitivity analyses
To identify individualized therapeutic drugs based
on risk models and enhance their clinical applicability, the
present study screened for candidate drugs in the Genomics of Drug
Sensitivity in Cancer 2 database (https://www.cancerrxgene.org/), prioritizing those
associated with risk scores. Half-maximal inhibitory concentration
(IC50) values for various drugs were calculated for both
risk groups using the ‘oncoPredict’ tool (V1.2.0) (50). Spearman's analysis, conducted using
the R package ‘psych’ (V2.3.6) (https://CRAN.R-project.org/package=psych), was used to
assess the correlation between drug IC50 values and risk
scores. The Wilcoxon test was then employed to compare
IC50 expression for common chemotherapeutic agents
between high- and low-risk groups, with statistical significance
set at P<0.05.
scRNA-seq analysis
To analyze the cellular expression characteristics
and key cell populations of prognostic genes at the single-cell
level, the ‘seurat’ R package (V5.0.1) was used to process
single-cell data from GSE131907, which were converted into Seurat
objects (51). Quality control was
applied to select high-quality cells, characterized by a gene count
between 300 and 10,000 per cell and a mitochondrial proportion
<10%. The LogNormalize method (52) was applied to normalize feature
expression measurements of each cell against total expression.
These normalized values were scaled by a factor of 10,000 and
logarithmically transformed. The FindVariableFeatures function was
used to identify highly variable genes (HVGs). PCA was performed to
reduce the dimensionality of these genes, and relevant principal
components (PCs) were selected for cluster analysis using the
Uniform Manifold Approximation and Projection (UMAP) method
(53). Significant marker genes
within clusters were identified using the Find All Markers
function, which facilitated cell type identification based on
marker expression (Table SI).
These marker genes were compared with those reported in the
literature (27) to identify
distinct cell clusters. To pinpoint key cell clusters, differential
expression of prognostic genes between annotated LUAD and control
tissue cells was compared using the Wilcoxon test (P<0.05), with
significant genes defining the key clusters.
Enrichment analysis of key cell
clusters
To elucidate the biological pathways through which
key cell clusters function, functional enrichment analysis was
performed on key cell clusters from LUAD samples using the R
package ‘ReactomeGSA’ (V4.3.0) (54) to explore signaling pathways
associated with LUAD progression.
Cellular communication and pseudotime
analyses
Cell communication among annotated cells was
analyzed in CellPhoneDB (http://www.cellchat.org/), using the CellChatDB.human
database as a reference. The ‘CellChat’ package (V1.6.1) (55) was utilized to investigate
cell-to-cell interactions (P<0.05). The single-cell data,
pre-processed and annotated via Seurat, served as the input. Based
on the built-in human ligand-receptor database of CellChat,
significantly overexpressed ligands or receptors were first
identified across different cell populations. Communication
probabilities between cell types were then calculated, and
significant interactions were determined through 1,000 permutation
tests. Subsequent analyses involved signaling pathway mapping,
identification of communication patterns and network centrality
evaluation to pinpoint key interaction axes. The core results were
visualized for further interpretation. To uncover the developmental
trajectories and interactions of key cell clusters, pseudotime
analysis was conducted using the Monocle algorithm (V2.30.0)
(56). This approach aimed to
investigate the differentiation direction and explore the effect of
prognostic gene expression on the differentiation degree of key
cell clusters.
Prognostic gene expression analysis
and reverse transcription-quantitative PCR (RT-qPCR)
To validate the expression patterns of prognostic
genes, clinical sample experiments were conducted to enhance the
reliability of the research. Differential expression between LUAD
and control samples was analyzed using the Wilcoxon test
(P<0.05) in TCGA and GSE30219 datasets. To further validate
these findings, 10 clinical samples (5 LUAD and 5 control samples)
were prospectively recruited between December 2022 and June 2023
from patients undergoing radical surgery at Hunan Cancer Hospital
(Changsha, China). All participants provided written informed
consent prior to sample collection. The study protocol was approved
by the Ethics Committee of Hunan Cancer Hospital (approval no.
SBQLL-2022-127). All clinical procedures were performed in strict
accordance with the approved guidelines and the Declaration of
Helsinki. The inclusion criteria for patients with LUAD in the
present study were: i) Pathologically confirmed LUAD; ii) patients
who underwent radical surgery; and iii) no prior history of
radiotherapy or chemotherapy before the operation. The exclusion
criteria included: i) Presence of other primary malignancies; ii)
secondary lung cancer; and iii) samples with poor RNA integrity or
microbial contamination. Regarding the control group, the control
samples were obtained from adjacent healthy lung tissues (located
≥5 cm away from the tumor margin) from the same patients with LUAD,
rather than from separate healthy individuals.
RT-qPCR was used to assess gene expression. Total
RNA was extracted using the Trizol kit (Ambion; Thermo Fisher
Scientific, Inc.; cat. no. 15596-018CN), and cDNA was synthesized
via reverse transcription using the SureScript First Strand cDNA
Synthesis Kit (Wuhan Servicebio Technology Co., Ltd). Each RT-qPCR
reaction contained 3 µl cDNA, 5 µl 2X Universal Blue SYBR Green
qPCR Master Mix (Wuhan Servicebio Technology Co., Ltd) and 1 µl
each forward and reverse primer (10 µm; Table SII). The amplification protocol
began with 95°C for 1 min, followed by 40 cycles of denaturation at
95°C for 20 sec, annealing at 55°C for 20 sec and extension at 72°C
for 30 sec. The results were analyzed using the 2−ΔΔCq
method (57) with GAPDH as the
internal reference gene (Table
SIII). Gene expression differences between LUAD and control
samples were compared using GraphPad Prism 5 (Dotmatics;
P<0.05).
Statistical analysis
Statistical analyses were performed using R (V4.2.2;
Posit Software, PBC), with group comparisons conducted using the
Wilcoxon test. Statistical significance was defined as P<0.05,
unless otherwise specified. For high-throughput data analyses,
including differential expression and initial prognostic gene
screening, multiple testing corrections (FDR/Benjamini-Hochberg
method) were systematically applied to minimize false-positive
results. A P-value or adjusted P-value of <0.05 was considered
to indicate a statistically significant difference.
Results
DE-PMRGs identification
PCA was performed on TCGA-LUAD dataset to
characterize the distribution patterns of LUAD samples vs. normal
samples. The analysis revealed a noticeable separation between the
two groups in the PCA space (Fig.
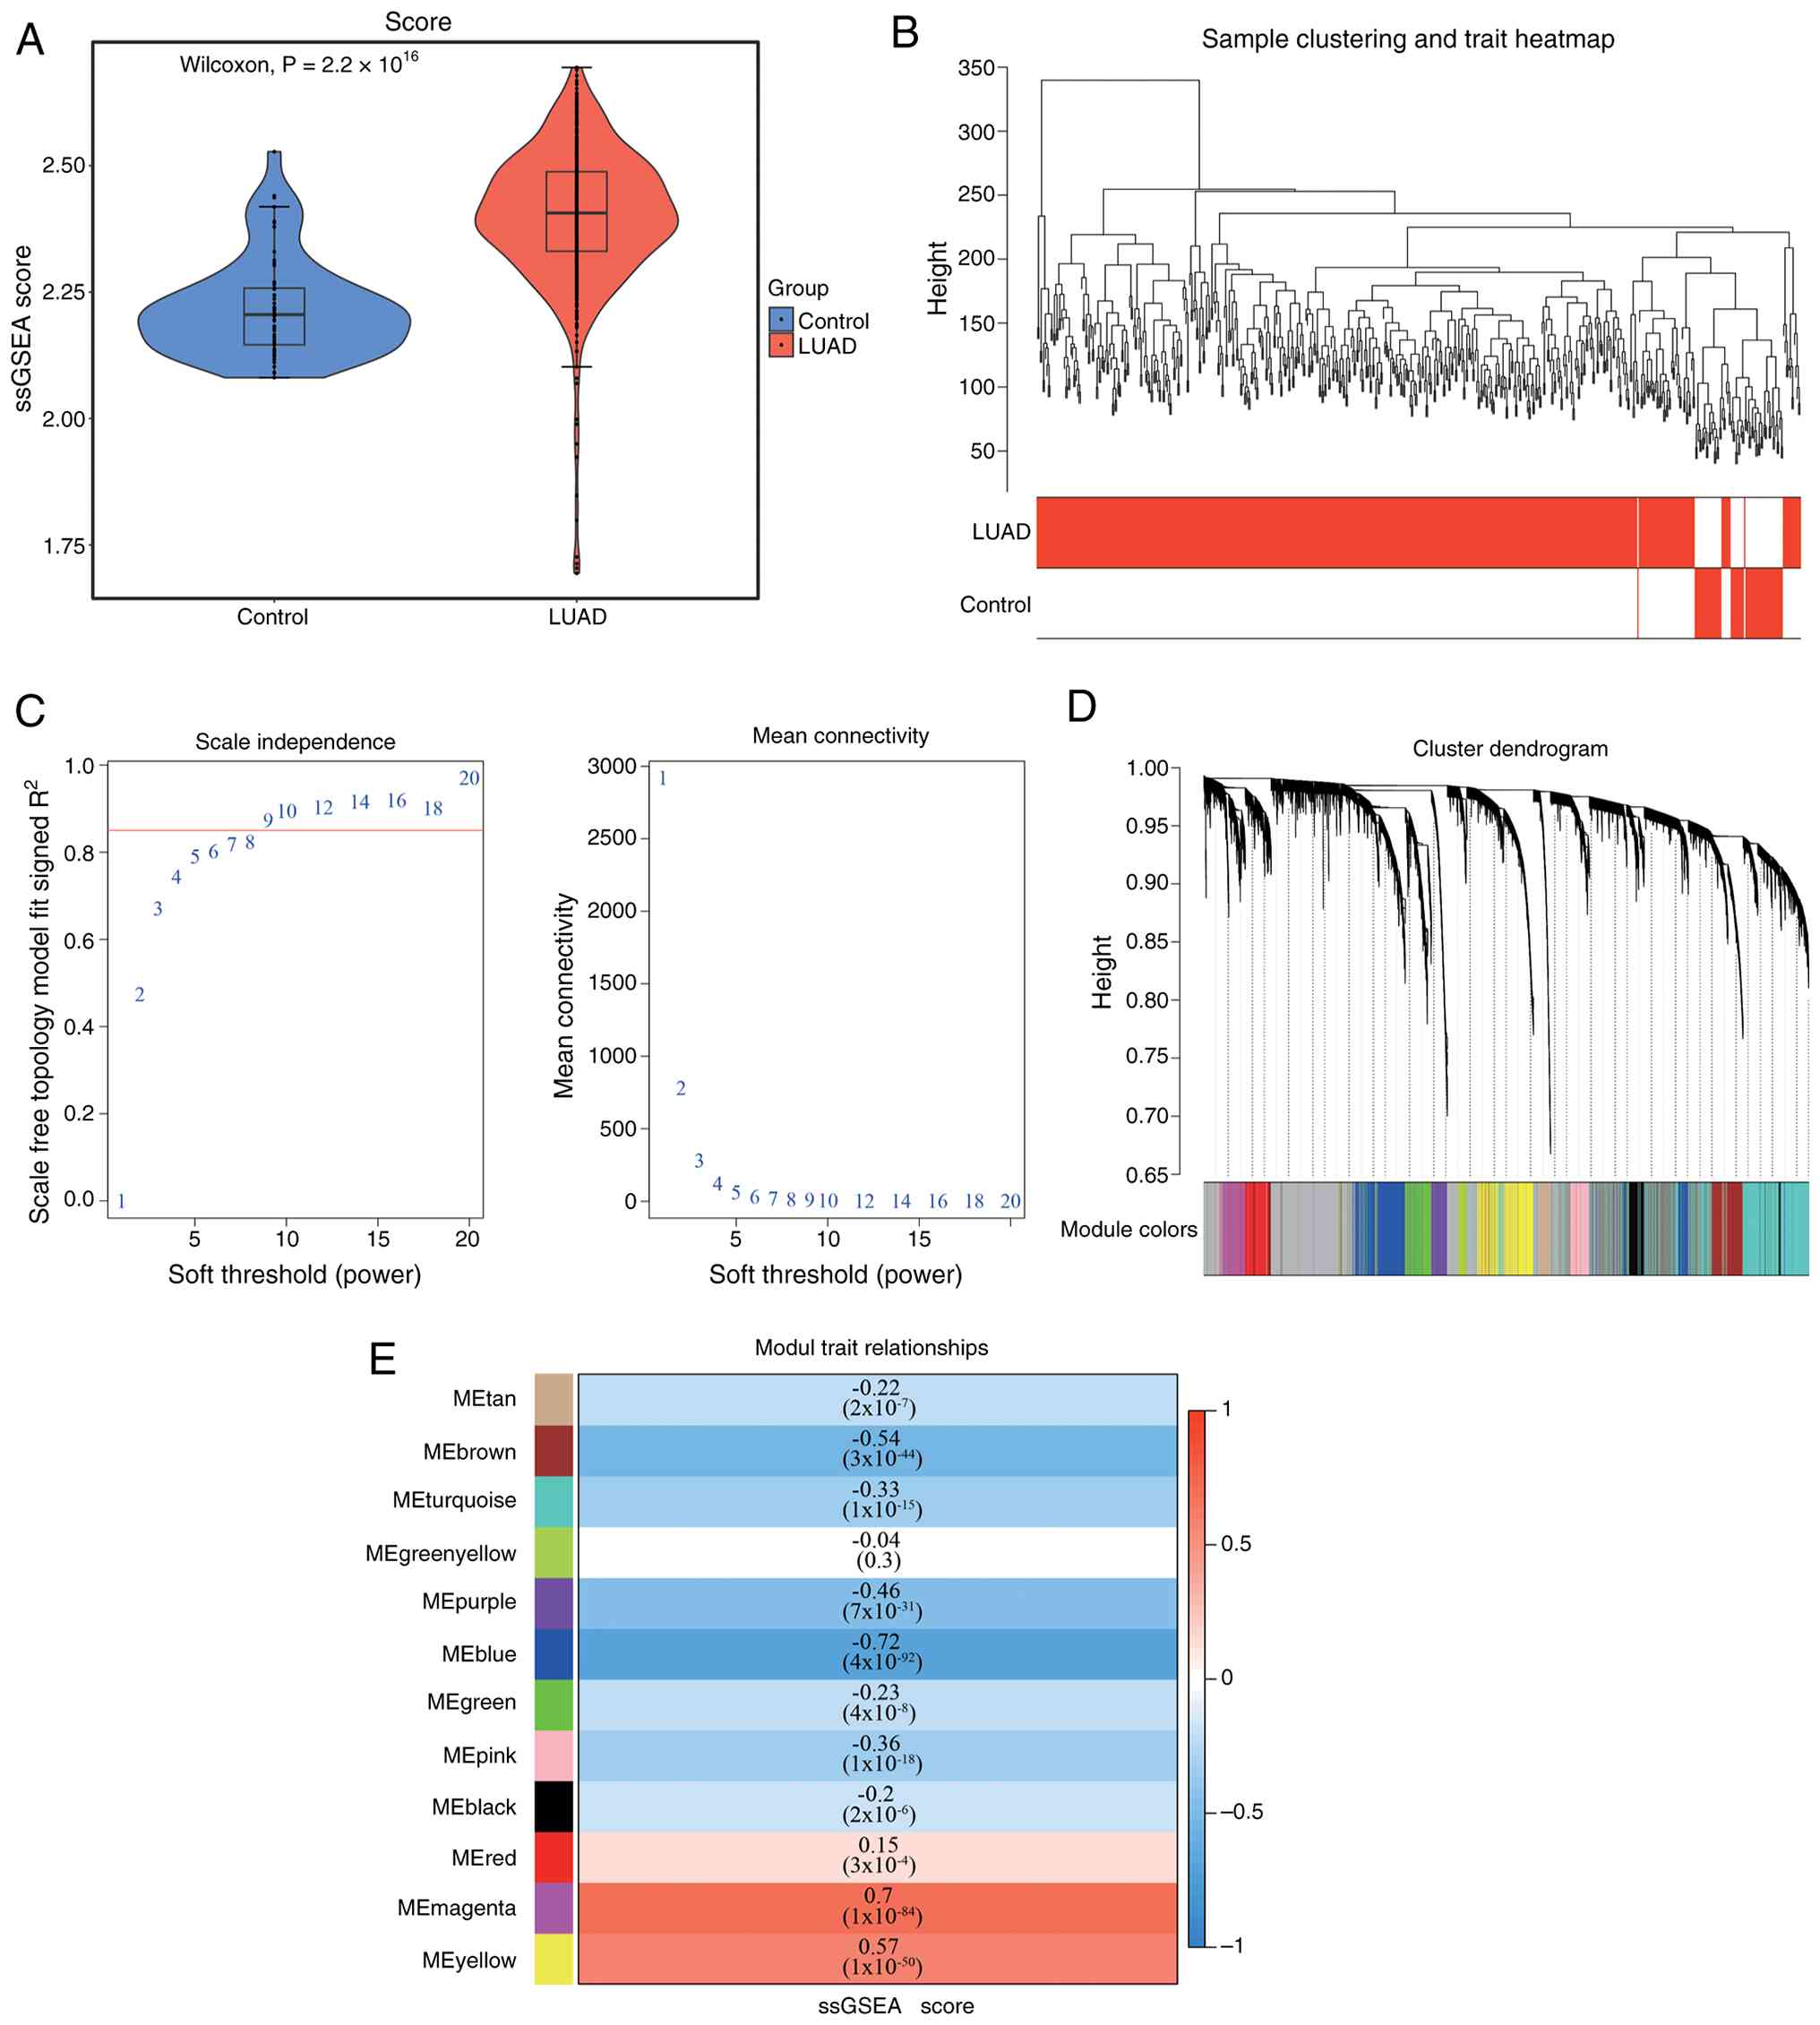
S1). To identify polyamine-related module genes in LUAD,
differential analysis of PMRG scores was conducted between LUAD and
control groups, showing significant differences (P<0.05;
Fig. 1A). Following WGCNA (β=9;
R2=0.85) and module-gene screening (Fig. 1B and C), the MEblue module showed
the lowest correlation with PMRG scores (R=−0.72; P<0.05), while
the MEmagenta module exhibited the highest correlation (R=0.70;
P<0.05). These two modules identified 2,882 module genes
(Fig. 1D and E). Using TCGA-LUAD
data, 2,253 DEGs were found between LUAD and control samples, with
1,684 upregulated and 569 downregulated (Fig. 2A and B). By intersecting DEGs with
module genes, 470 DE-PMRGs were identified (Fig. 2C).
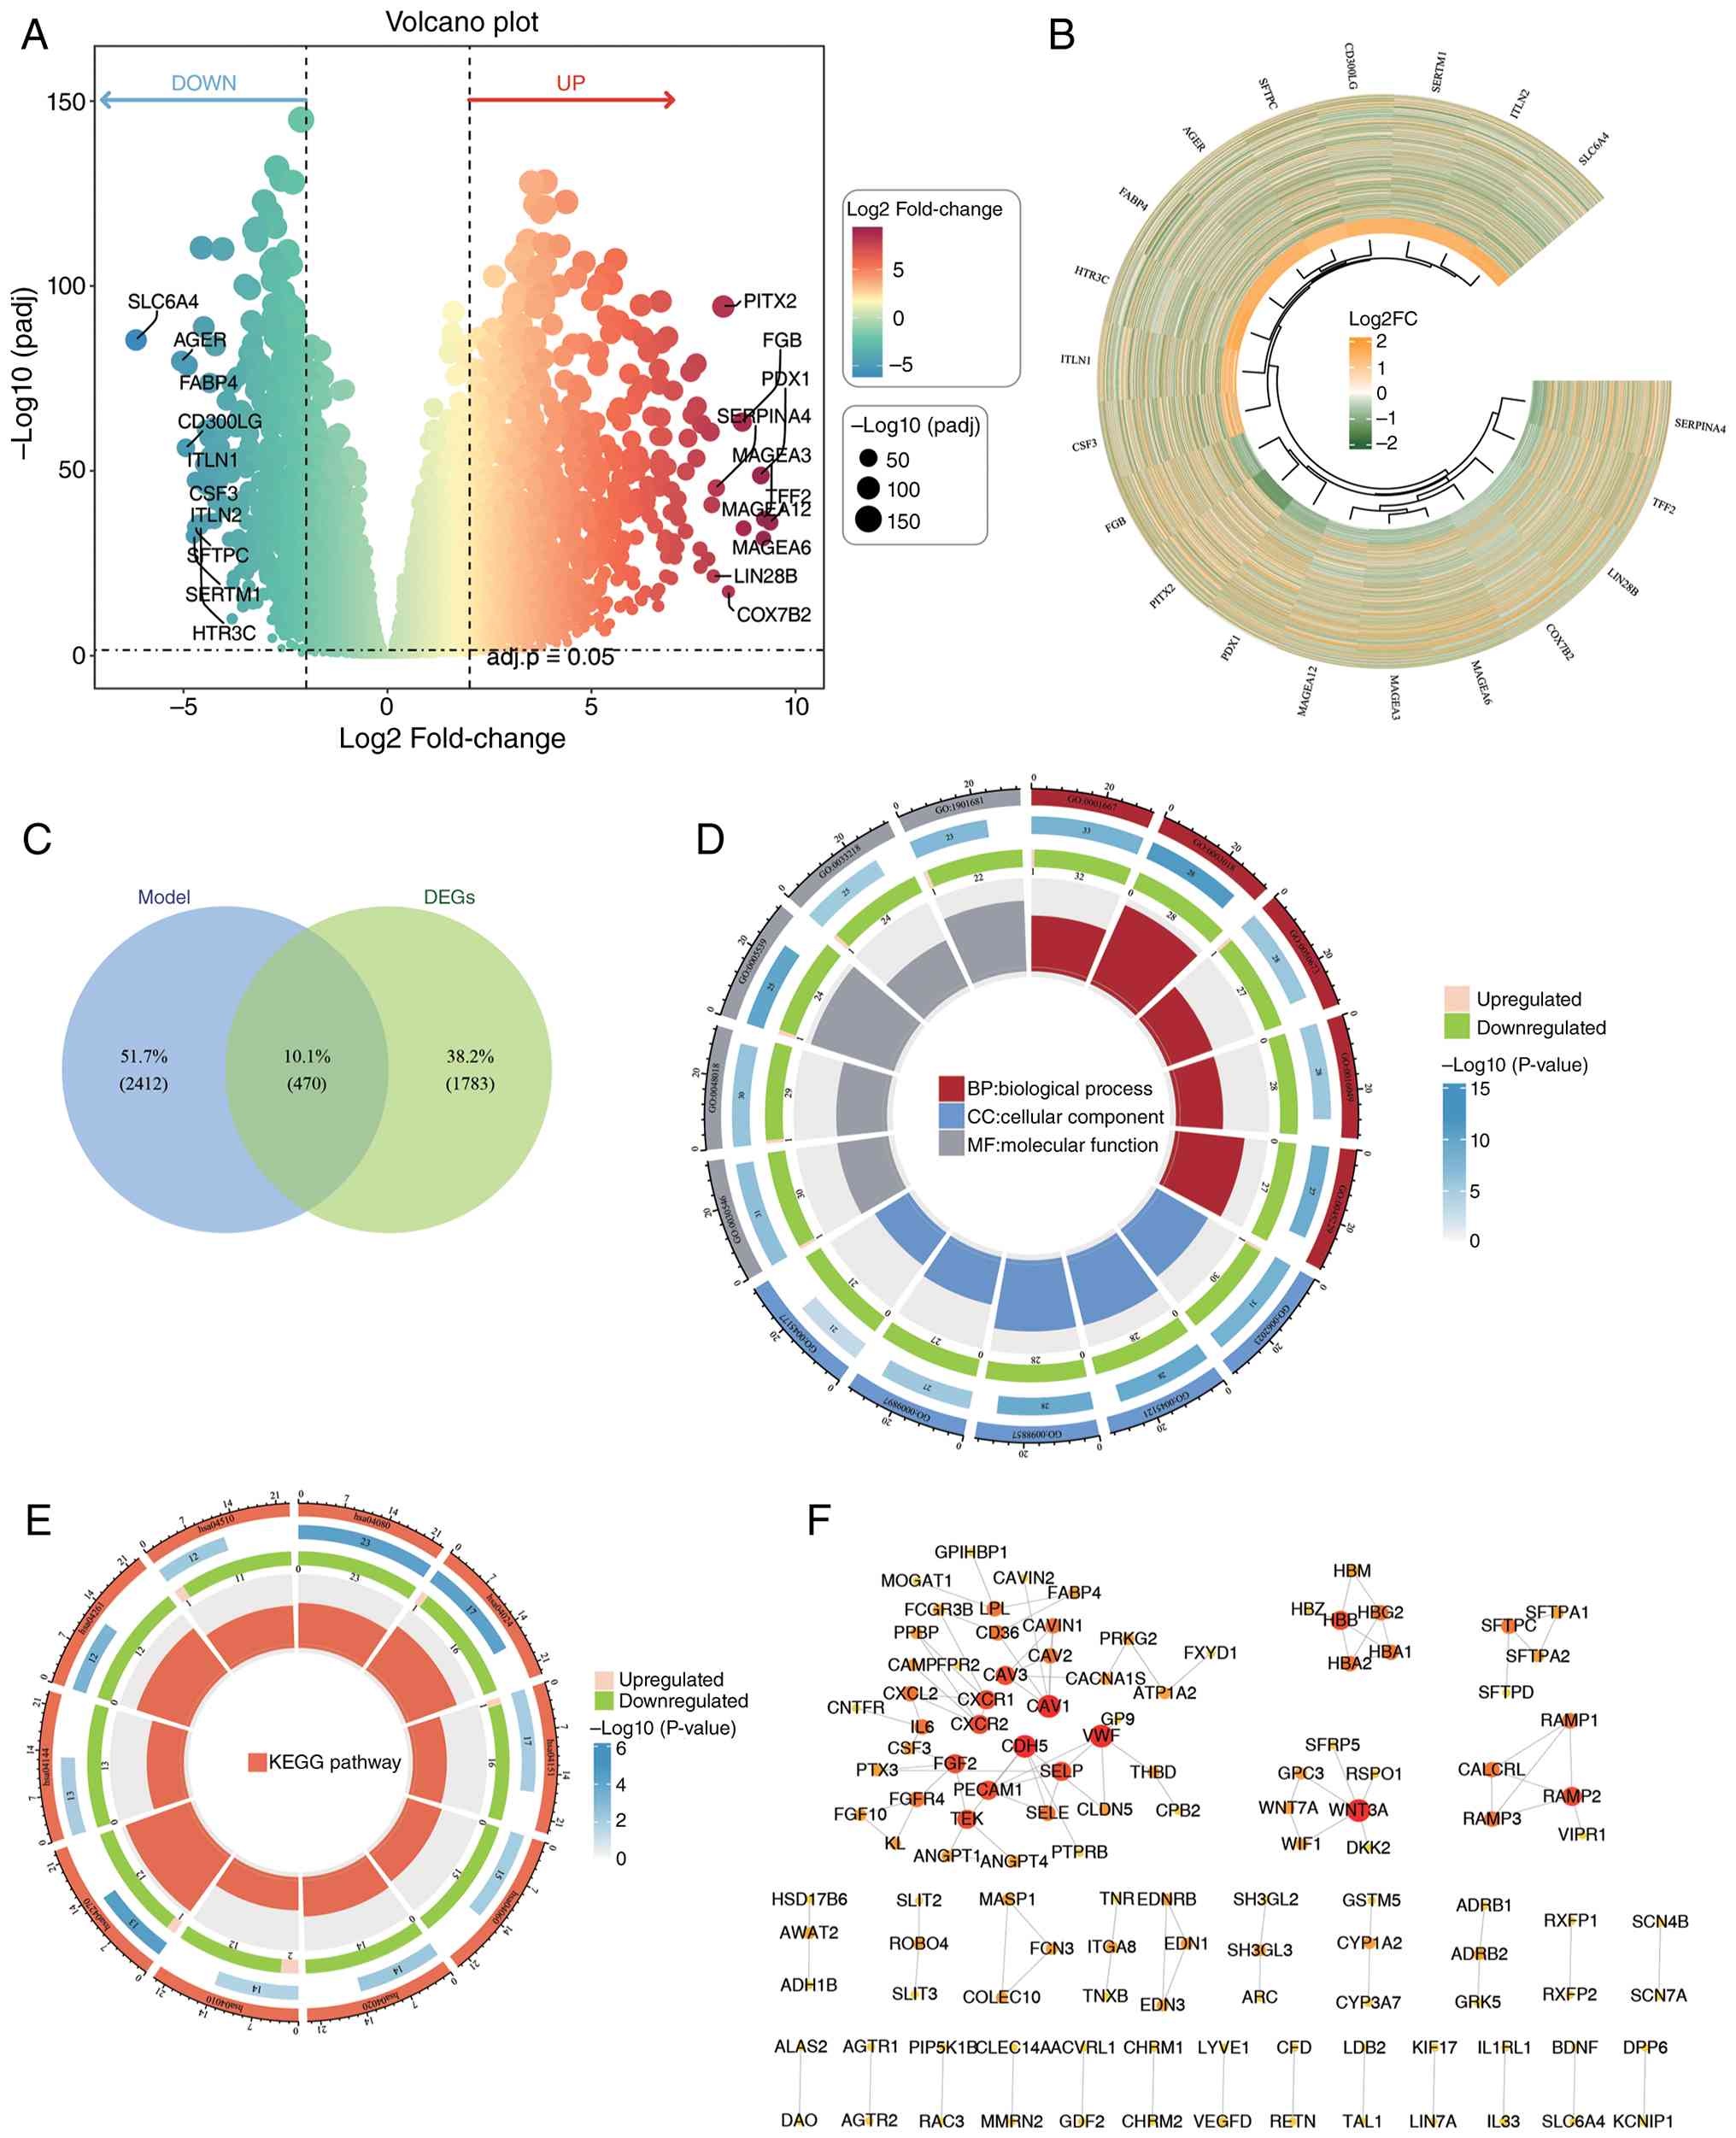 | Figure 2.DEGs identification, functional
enrichment analysis and PPI network between LUAD and control
tissue. (A) Volcano plot highlighting the top 10 upregulated and
downregulated DEGs. The vertical axis represents
-log10(adj.P-value), and the horizontal axis denotes the fold
change (log2FC); each dot corresponds to one gene, with
circles representing individual samples. (B) Heatmap displaying
gene expression: Top 10 upregulated and top 10 downregulated genes
ranked by log2FC. (C) Identification of 470 DE-PMRGs. (D
and E) GO and KEGG enrichment analysis of DE-PMRGs: From the
outermost to the innermost circle: (1) The first layer shows GO functional IDs
across three categories: BP, CC and MF. (2) The second layer: Color intensity
indicates significance, with the length, width and numerical labels
representing the number of genes enriched in each function.
(3) The third layer: The number and
trend (indicated by color) of upregulated and downregulated genes
in each function. (4) The innermost
layer: the color of each block represents different functional
categories and the size corresponds to the RichFactor of each
pathway. (F) PPI network of DE-PMRGs. DEGs, differentially
expressed genes; PPI, protein-protein interactions; KEGG, Kyoto
Encyclopedia of Genes and Genomes; GO, Gene Ontology; DE-PMRGs,
differentially expressed polyamine metabolism-related genes; FC,
fold change; BP, biological process; CC, cellular component; MF,
molecular function; padj, adjusted P-value. |
Functional enrichment analysis and PPI
network
The DE-PMRGs were involved in 1,399 GO terms,
including 1,158 biological process (BP), 114 cellular component
(CC) and 127 molecular function (MF) terms, as well as 45 KEGG
pathways (Fig. 2D and E).
Specifically, these were associated with ‘ameboidal-type cell
migration’ and ‘vascular processes in the circulatory system in
BP’, ‘collagen-containing extracellular matrix’ and ‘membrane
rafts’ in CC, ‘signaling receptor activator activity’ and
‘receptor-ligand activity’ in MF and ‘vascular smooth muscle
contraction’ in KEGG pathways. The PPI network analysis revealed
extensive protein interactions among most DE-PMRGs, suggesting a
synergistic regulation of LUAD malignant phenotypes (Fig. 2F).
Identification of 30 candidate
genes
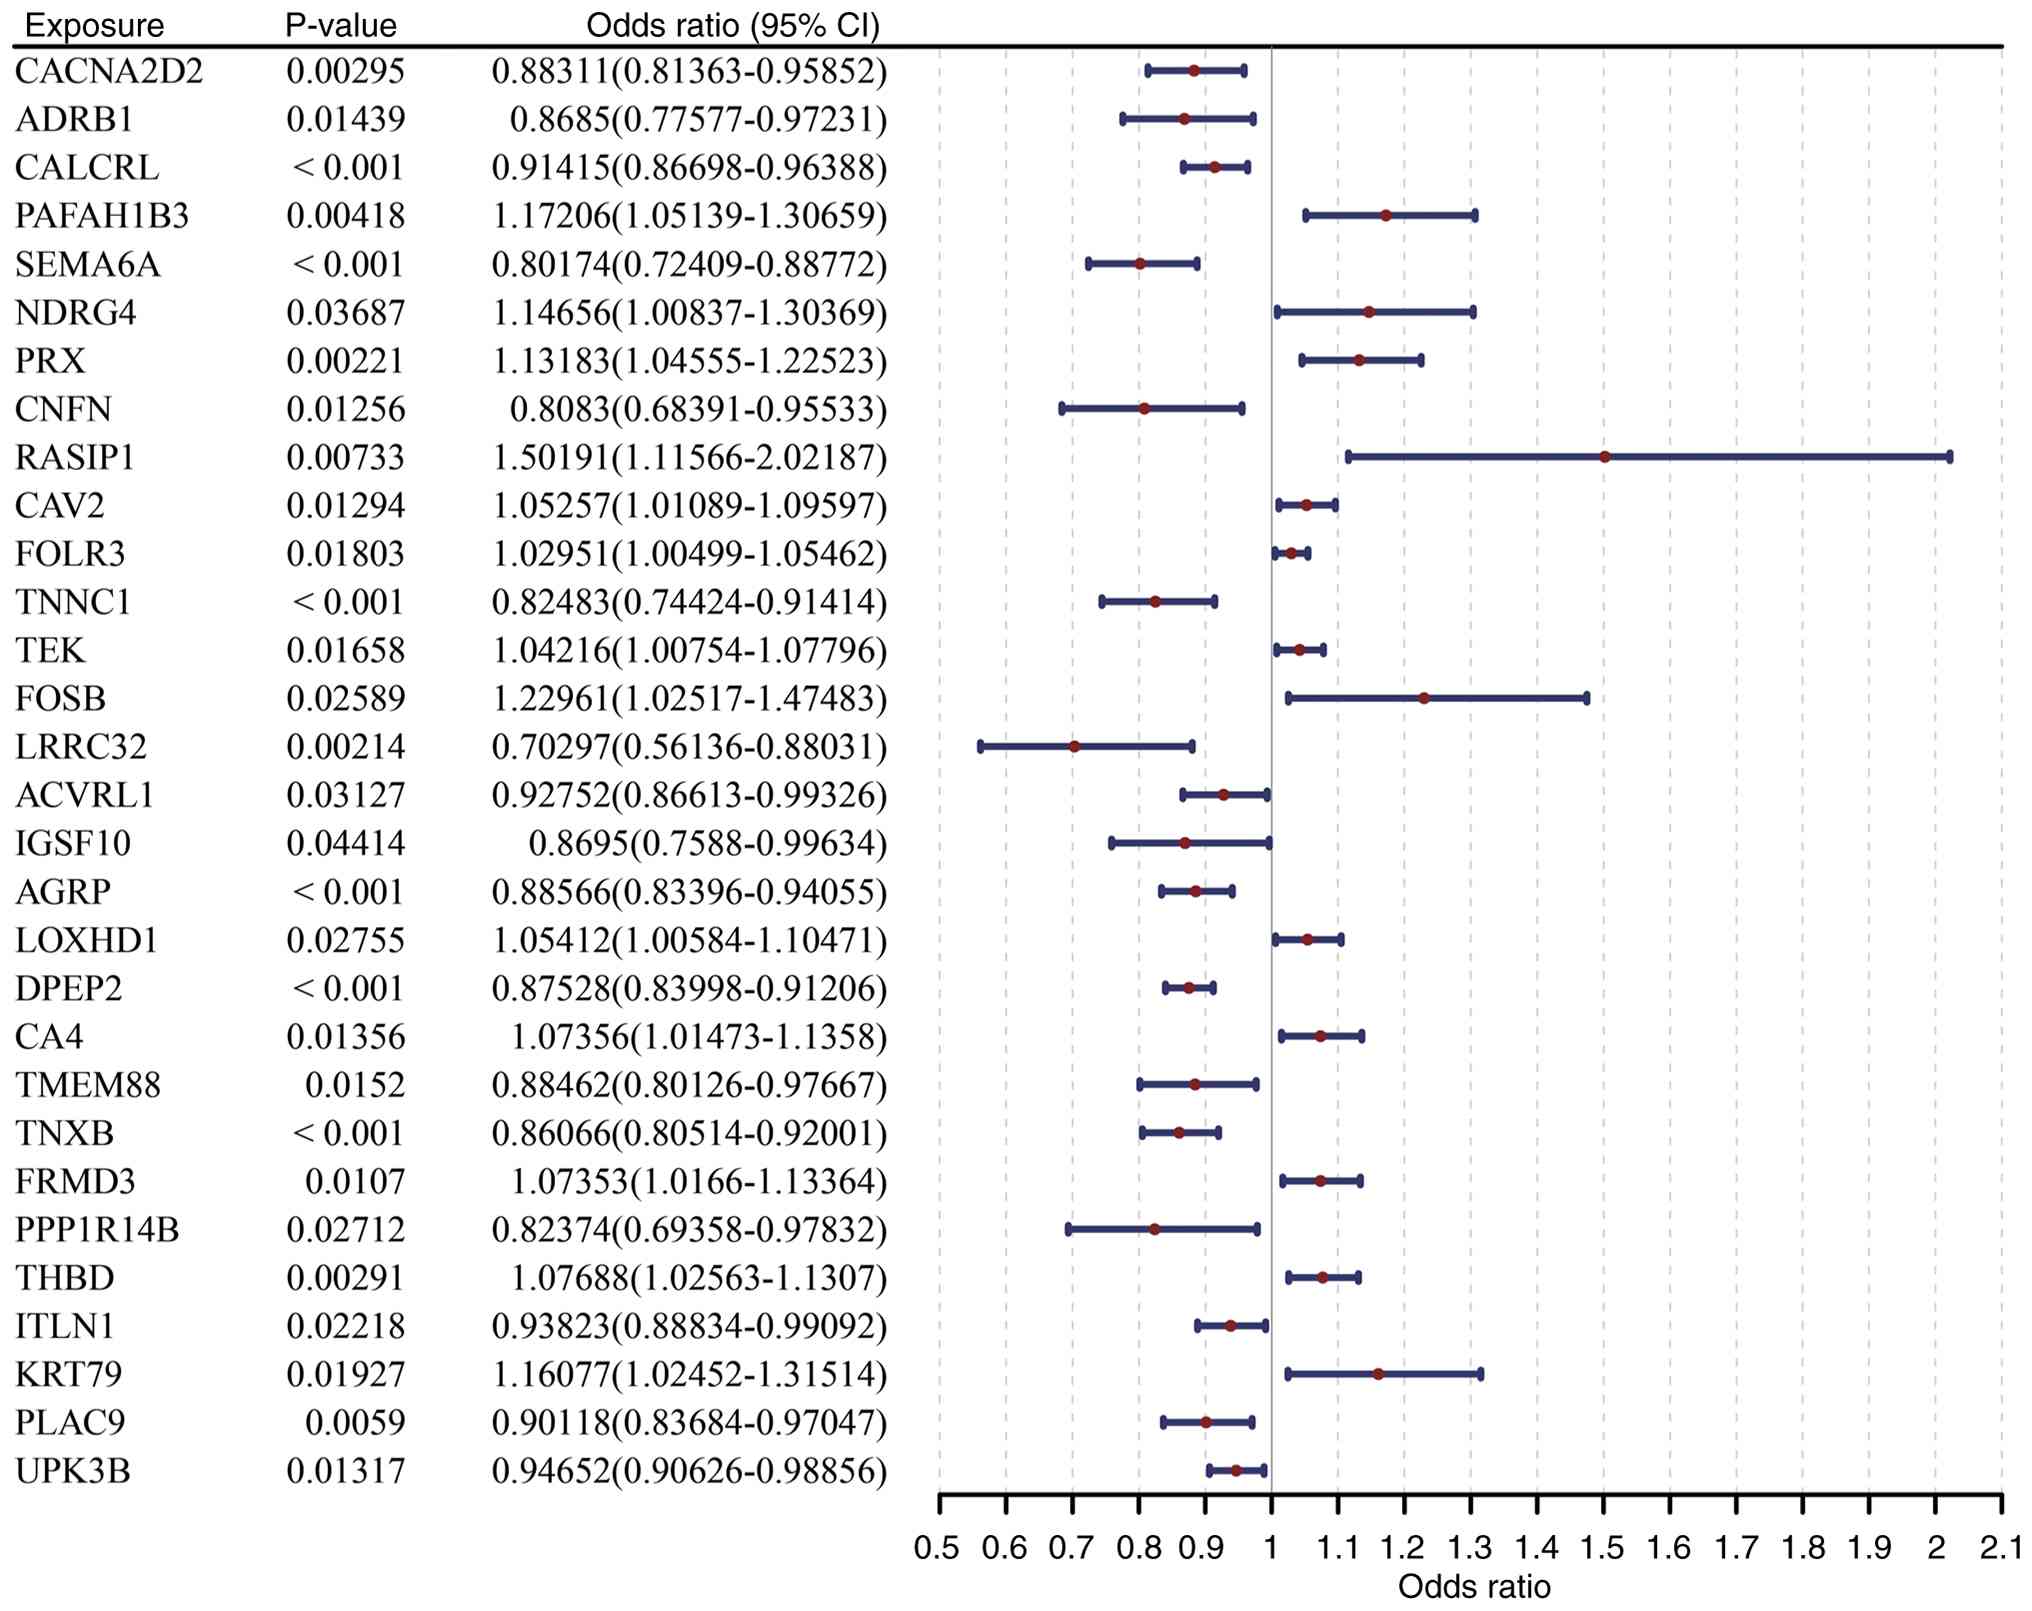
MR analysis primarily based on the results from the
IVW algorithm identified 30 DE-PMRGs significantly causally
associated with LUAD (P<0.05; Fig.
3; Table SIV). Among these, 17
genes, including activin A receptor like type 1 and adenoreceptor
β-1 (ADRB1), were protective factors for LUAD occurrence [odds
ratio (OR) <1], indicating their potential to inhibit
tumorigenesis and progression via polyamine metabolism regulation.
A total of 13 genes, including carbonic anhydrase 4 (CA4) and
caveolin 2, were identified as risk factors (OR >1), with their
abnormal expression potentially promoting LUAD malignant
transformation by disrupting polyamine metabolism. Correlation
scatterplots of SNP-exposure factor effects and SNP-outcome effects
confirmed the high consistency between the present study results
and the IVW findings (Fig. S2).
The forest plots further corroborated the consistency of the IVW
results (Fig. S3, Fig. S4, Fig.
S5, Fig. S6, Fig. S7). MR randomness testing indicated
that the 30 candidate genes adhered to Mendel's second law
(Fig. S8). The heterogeneity test
(Q-P-value >0.05) indicated no heterogeneity among the samples
(Table SV). The horizontal
pleiotropy test showed P>0.05, suggesting no significant
confounding effects (Table SVI).
SNP elimination tests further confirmed the reliability and
stability of the MR results (Fig.
S9, Fig. S10, Fig. S11, Fig. S12, Fig. S13). Steiger filtering analysis of
the SNPs from the 30 selected candidate genes revealed that all
SNPs had a TRUE direction, excluding reverse causality
interference. This preliminary analysis supports the causal
association between these DE-PMRGs and LUAD (Table SVII).
Development and verification of risk
models
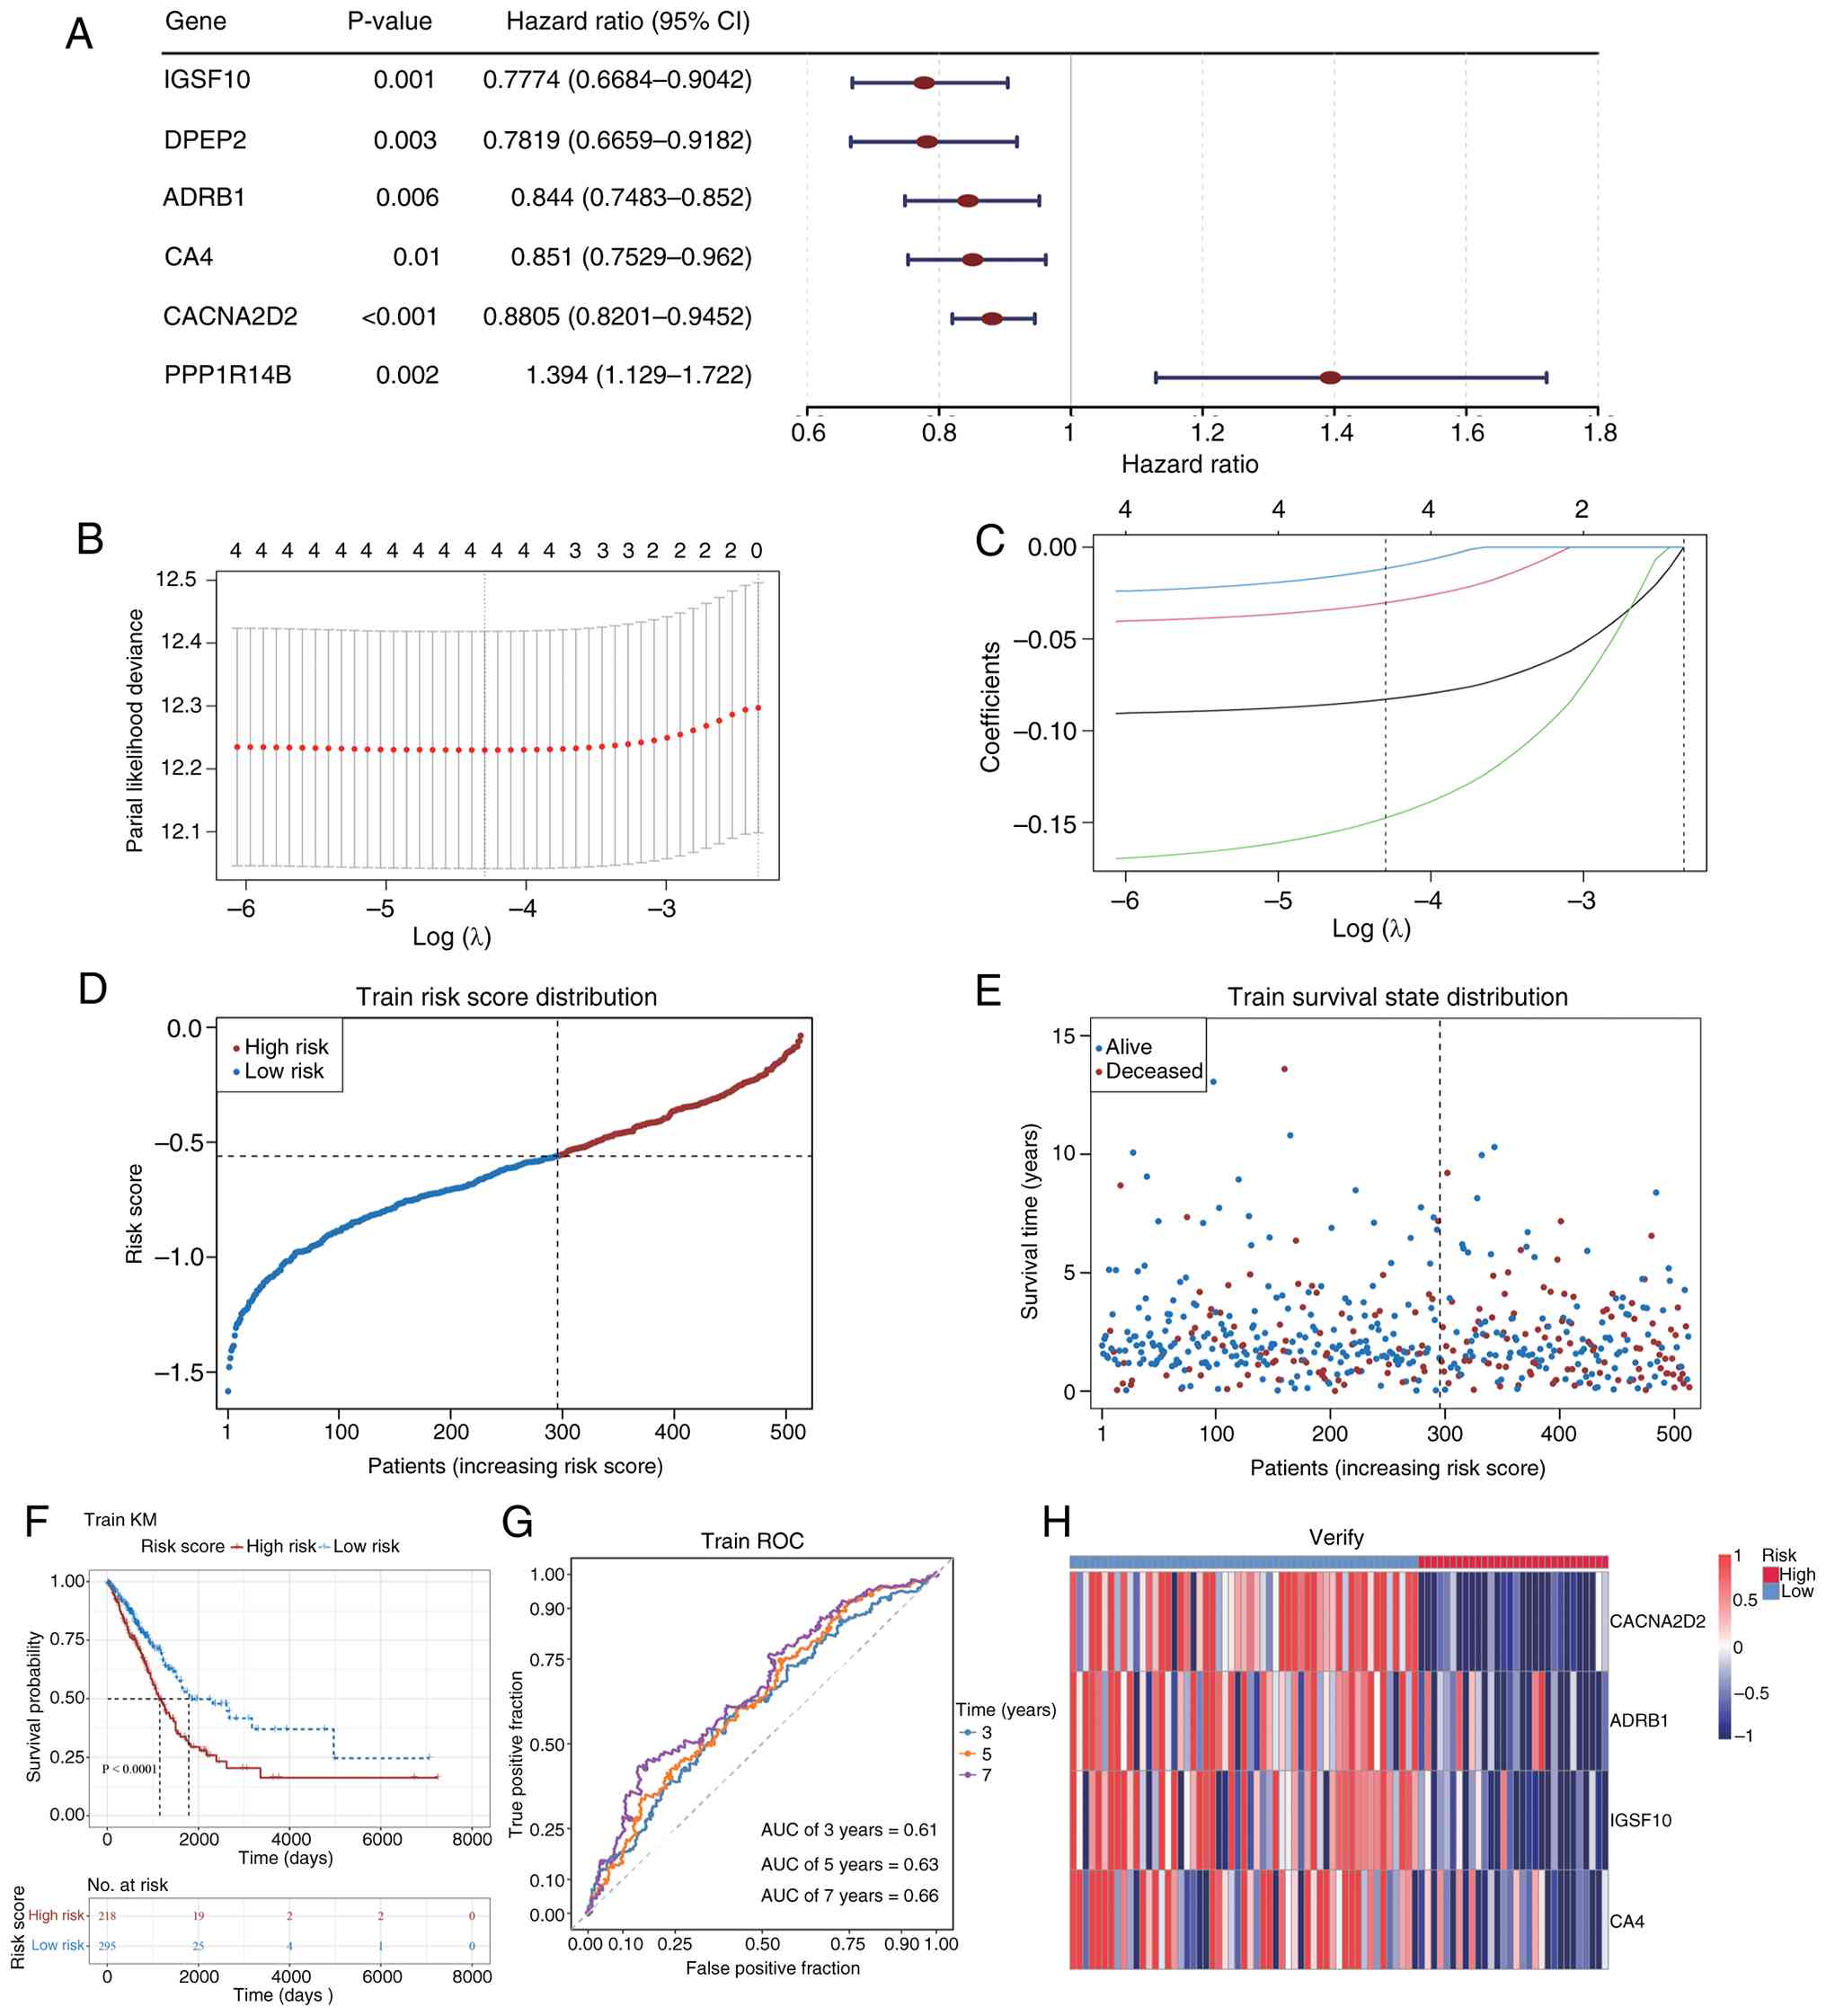
Univariate Cox regression and the PH assumption test
identified four genes [calcium voltage-gated channel auxiliary
subunit α2δ2 (CACNA2D2), ADRB1, immunoglobulin superfamily member
10 (IGSF10) and CA4] as prognostic markers (Fig. 4A; Table
I). These four genes were selected at λ=0.01362608
[log(λ)=−4.29577] under the condition of the lowest evaluated error
rate, indicating their retention in the model (Fig. 4B and C). A risk score model was
constructed using gene expression and regression coefficients
(Table II). LUAD samples from TCGA
dataset were categorized into high-risk and low-risk groups based
on the optimal risk score cutoff (Fig.
4D and E). Kaplan-Meier survival analysis revealed a
significantly lower survival rate in the high-risk group compared
with the low-risk group (P<0.0001; Fig. 4F). ROC curve analysis demonstrated
that the model's area under the curve (AUC) values for predicting
3-, 5- and 7-year survival rates of patients with LUAD were all
>0.6, suggesting modest but consistent predictive performance
(Fig. 4G). The prognostic gene
heatmap showed significant downregulation of IGSF10, ADRB1, CA4 and
CACNA2D2 in LUAD samples (Fig.
4H).
 | Table I.Test of the proportional hazards
assumption. |
Table I.
Test of the proportional hazards
assumption.
| Gene | χ2 | df | P-value |
|---|
| CACNA2D2 |
0.0968983245862793 | 1 |
0.755584002022931 |
| ADRB1 |
1.84307799655053 | 1 |
0.174590615317016 |
| IGSF10 |
1.40028673042861 | 1 |
0.236675568527714 |
| DPEP2 |
6.60470088373115 | 1 |
0.010170988792036 |
| CA4 |
0.173824923446468 | 1 |
0.676734610858642 |
| PPP1R14B |
4.09566218136085 | 1 |
0.0429933856854411 |
| Table II.Prognostic gene regression
coefficients. |
Table II.
Prognostic gene regression
coefficients.
| Gene | Coefficient |
|---|
| CACNA2D2 | −0.0828842 |
| ADRB1 | −0.0302789 |
| IGSF10 | −0.147514 |
| CA4 | −0.0116366 |
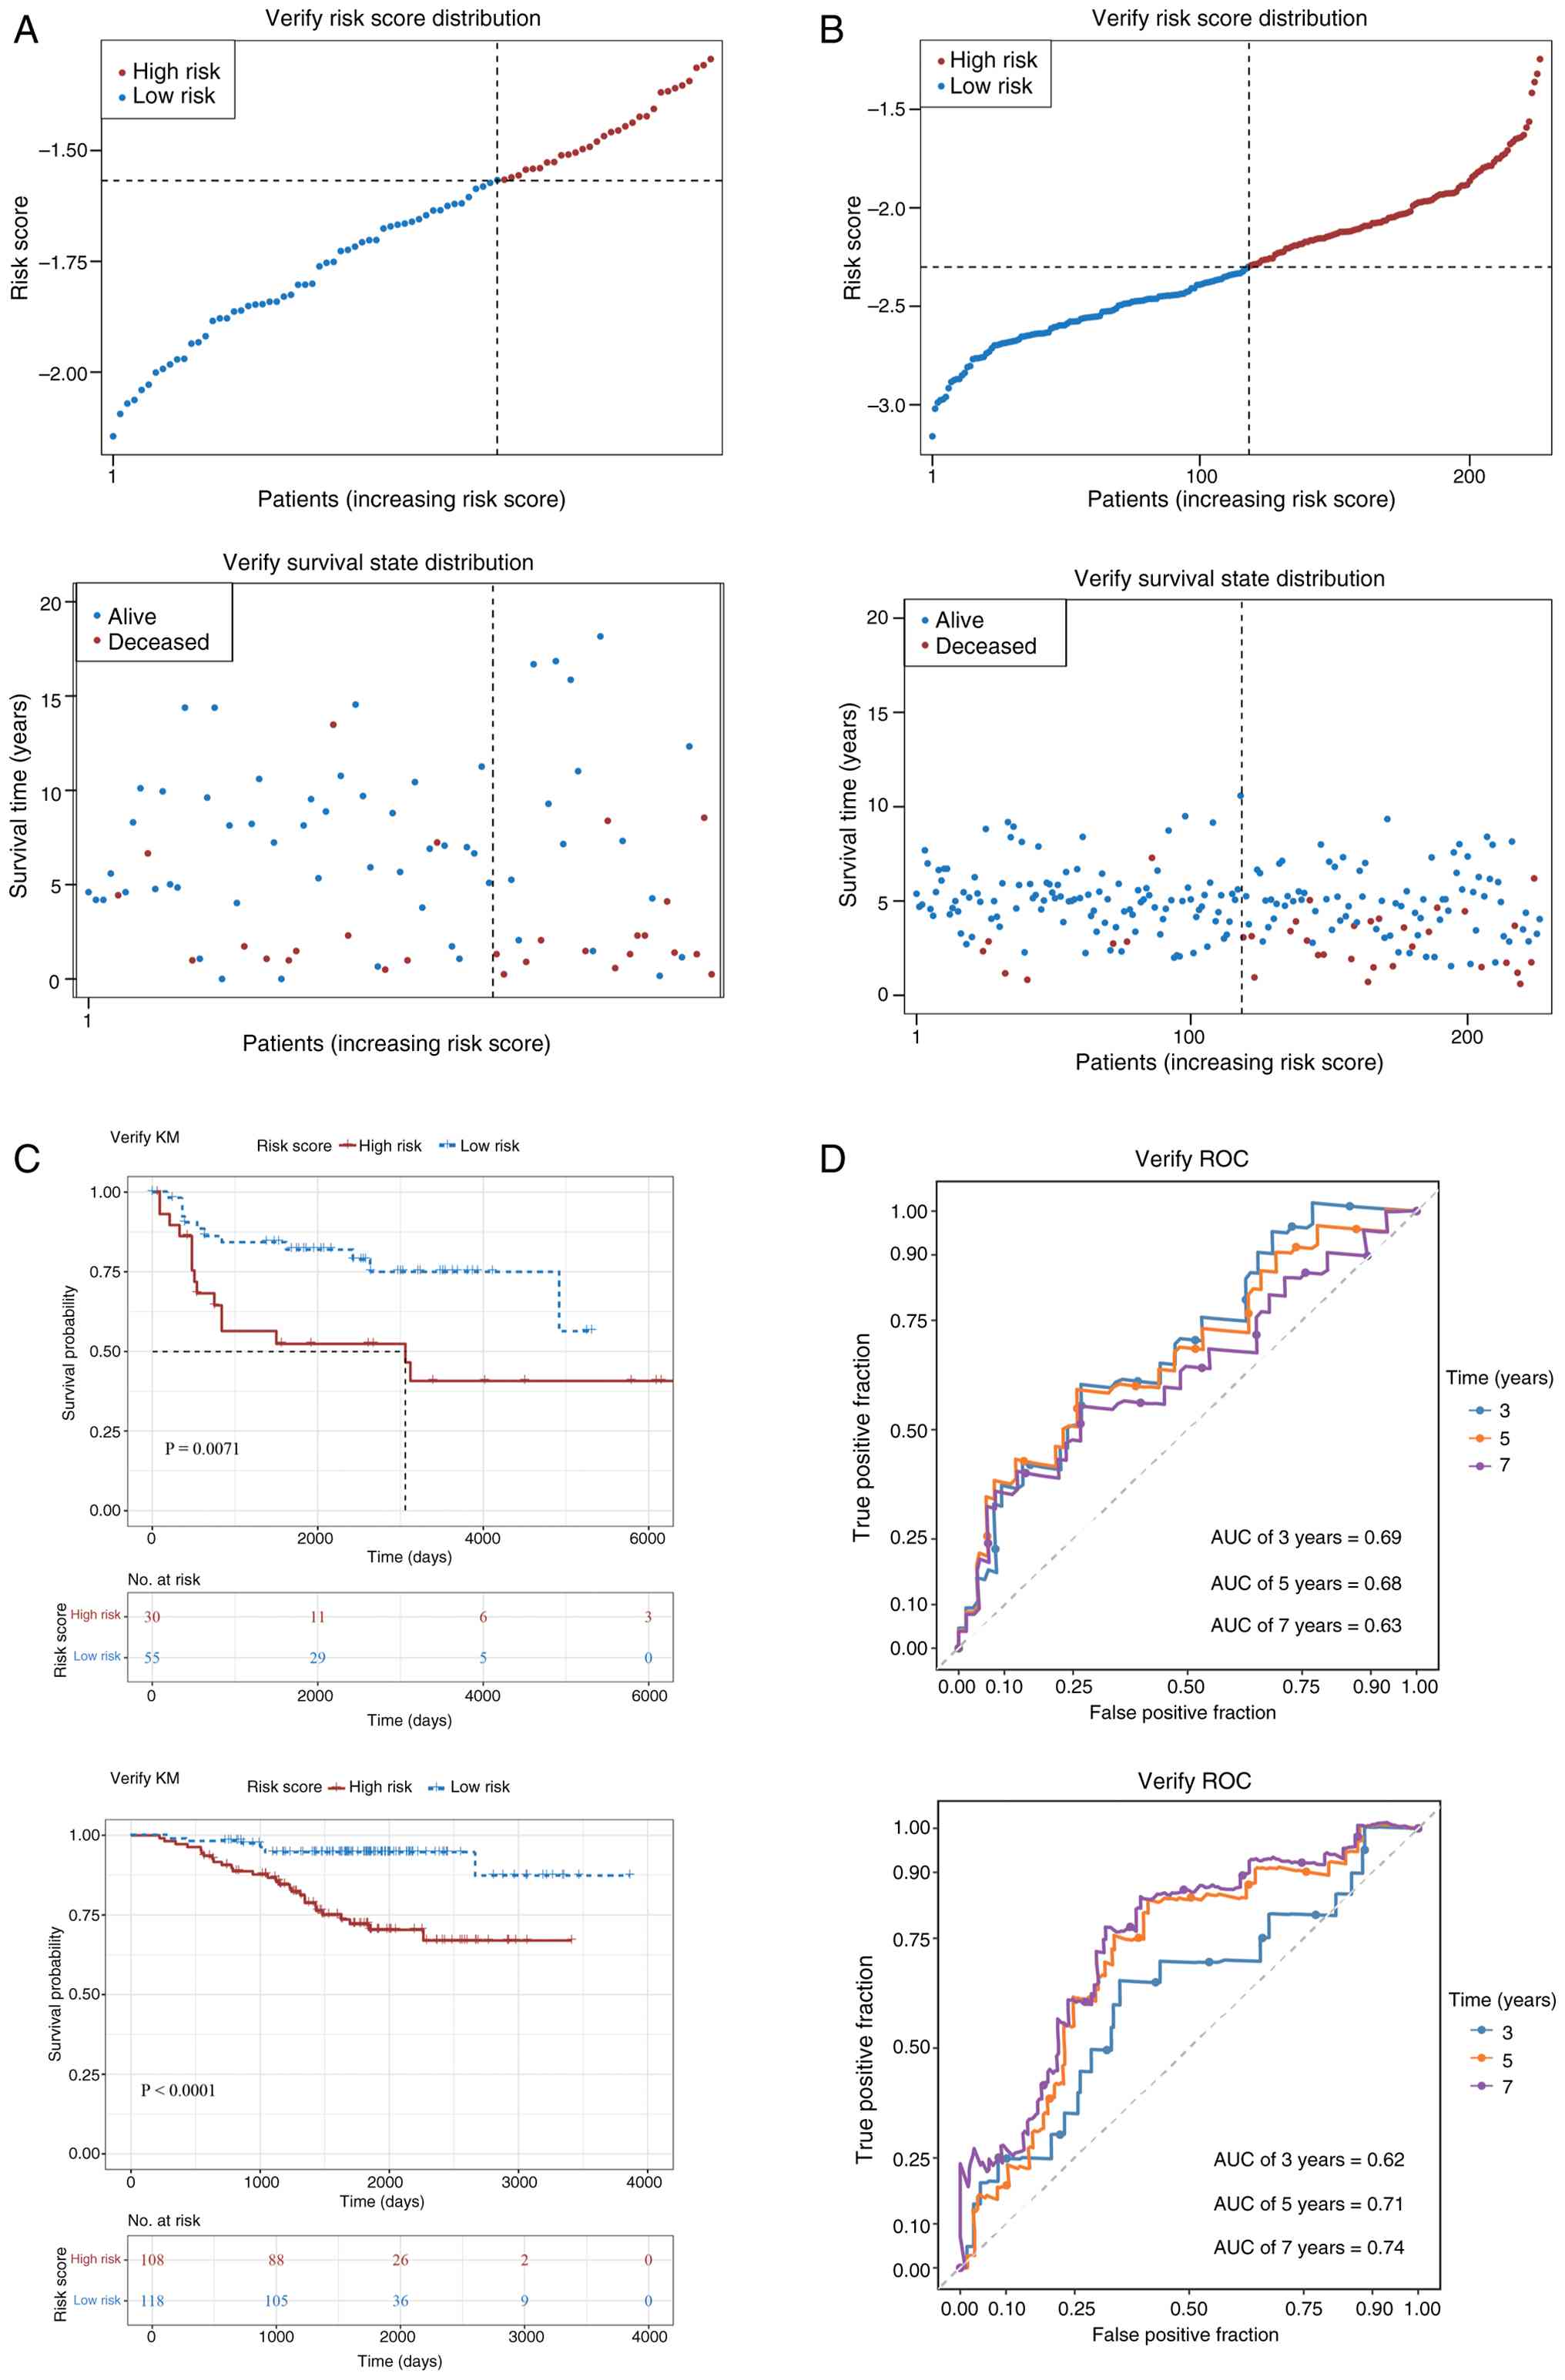
Using the same methodology, LUAD samples in the
GSE30219 and GSE31210 datasets were similarly divided into
high-risk and low-risk groups (Fig. 5A
and B). The survival time of patients in the high-risk group
was significantly shorter than that in the low-risk group (Fig. 5C). ROC curve analysis also showed
that the AUC values for predicting 3-, 5- and 7-year survival rates
were >0.6, further supporting the stability of the model
(Fig. 5D). These results
demonstrate that the prognostic model constructed in the present
study exhibits high accuracy and stability across both datasets,
affirming its clinical value for predicting the outcomes of
patients with LUAD.
Independent prognostic and LUAD
nomogram construction
Univariate Cox regression identified seven factors
(including risk score, age and stage) that correlated with
prognosis (P<0.05; Fig. 6A). The
PH assumption test (P>0.05) and multivariate analysis confirmed
risk score, T stage, M stage and N stage as independent prognostic
factors (P<0.05; Fig. 6B,
Table III). A nomogram was
developed incorporating these independent prognostic factors
(Fig. 6C), allowing for the
prediction of survival outcomes for patients with LUAD at 3-, 5-
and 7 years. The prognostic model demonstrated certain diagnostic
potential in predicting the probabilities of 3-, 5- and 7-year
survival (Fig. 6D). Decision curve
analysis indicated that the net benefit curve corresponding to the
nomogram remained a significant distance from the extreme curves
(‘All’ and ‘None’) for the 3-, 5- and 7-year assessments.
Furthermore, the net benefit of the nonogram surpassed that of
individual variables such as T stage, N stage and M stage across
the entire threshold probability range, suggesting that the model
provides superior net benefits for clinical decision-making in the
individualized prognostic assessment of patients with LUAD
(Fig. 6E and F). Variations in risk
assessment within subgroups defined by clinical features in
TCGA-LUAD revealed significant disparities in risk scores across
subgroups based on age, T stage, N stage and overall clinical stage
(P<0.05; Fig. 6G).
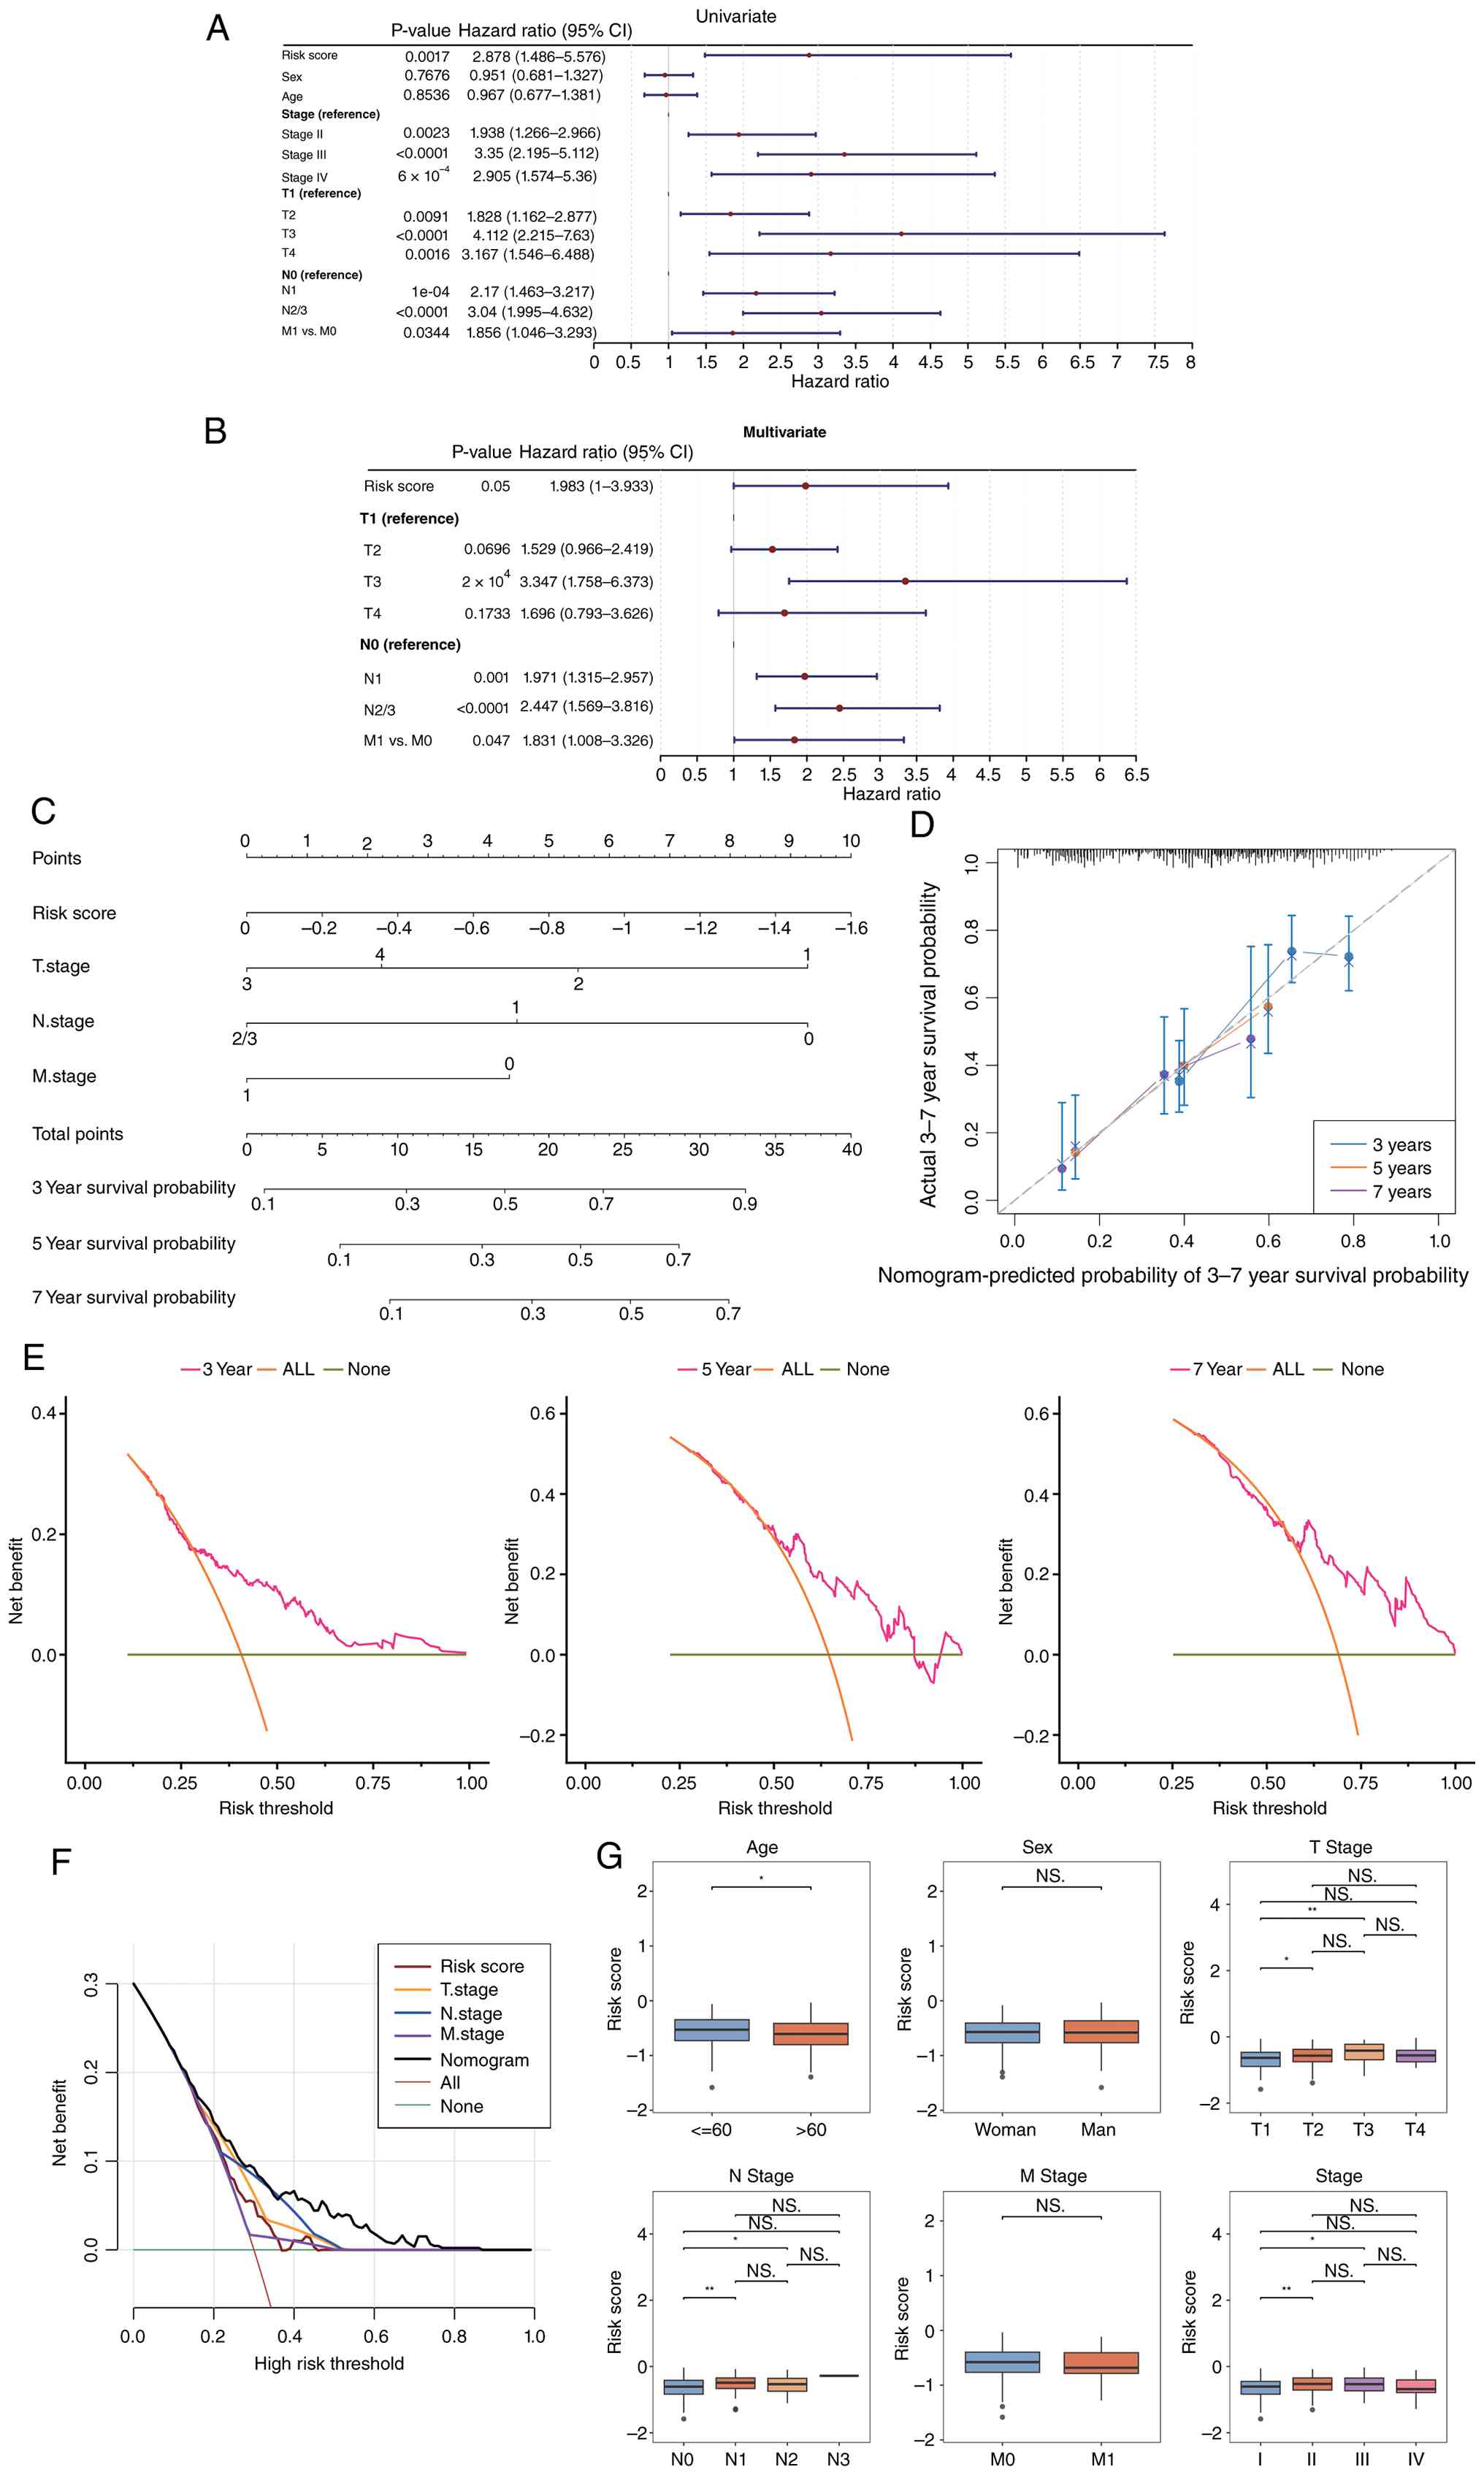 | Figure 6.Independent prognostic factors and
LUAD nomogram construction. (A) Univariate and (B) multivariate Cox
regression analyses for screening independent prognostic factors in
LUAD. (C) Nomogram model: Variables in the model are key genes, and
‘Total Points’ represents the sum of individual scores
corresponding to the values of all variables. (D) Calibration curve
of the nomogram model with predicted probability on the x-axis,
actual probability on the y-axis. A calibration curve slope closer
to 1 reflects higher model prediction accuracy. (E and F) Decision
curve analysis curve with threshold probability on the x-axis, and
net benefit rate (after subtracting harms from benefits) is on the
y-axis. (G) Box plot showing risk score differences across clinical
characteristics. *P<0.05 and **P<0.01. ns, not significant;
OS, overall survival; T, tumour; N, lymph node; M, metastasis;
LUAD, lung adenocarcinoma, |
| Table III.Test of the proportional hazards
assumption. |
Table III.
Test of the proportional hazards
assumption.
| Characteristic | χ2 | df | P-value |
|---|
| Risk score |
0.24141431262829 | 1 |
0.623186484679978 |
| Stage |
9.02122082345755 | 3 |
0.0290100705831387 |
| T stage |
2.54548021781013 | 3 |
0.467127830054141 |
| N stage |
5.39966572425955 | 2 |
0.0672167462647642 |
Exploration of prognostic genes
The GeneMANIA database identified 20 genes
associated with the functions of prognostic genes, including solute
carrier family 4 (SLC4) member 4, SLC4 member 1 and alkaline
ceramidase 2. These prognostic genes were predicted to be involved
in 105 functions, such as peptide hormone secretion, insulin
secretion, regulation of hormone secretion and voltage-gated cation
channel activity, among others (Fig.
7A). The functional similarity of prognostic genes was ranked
from highest to lowest based on the average similarity scores.
Results indicated that IGSF10, ADRB1, CA4 and CACNA2D2 exhibited
low mean functional similarity (threshold >0.5; Fig. 7B).
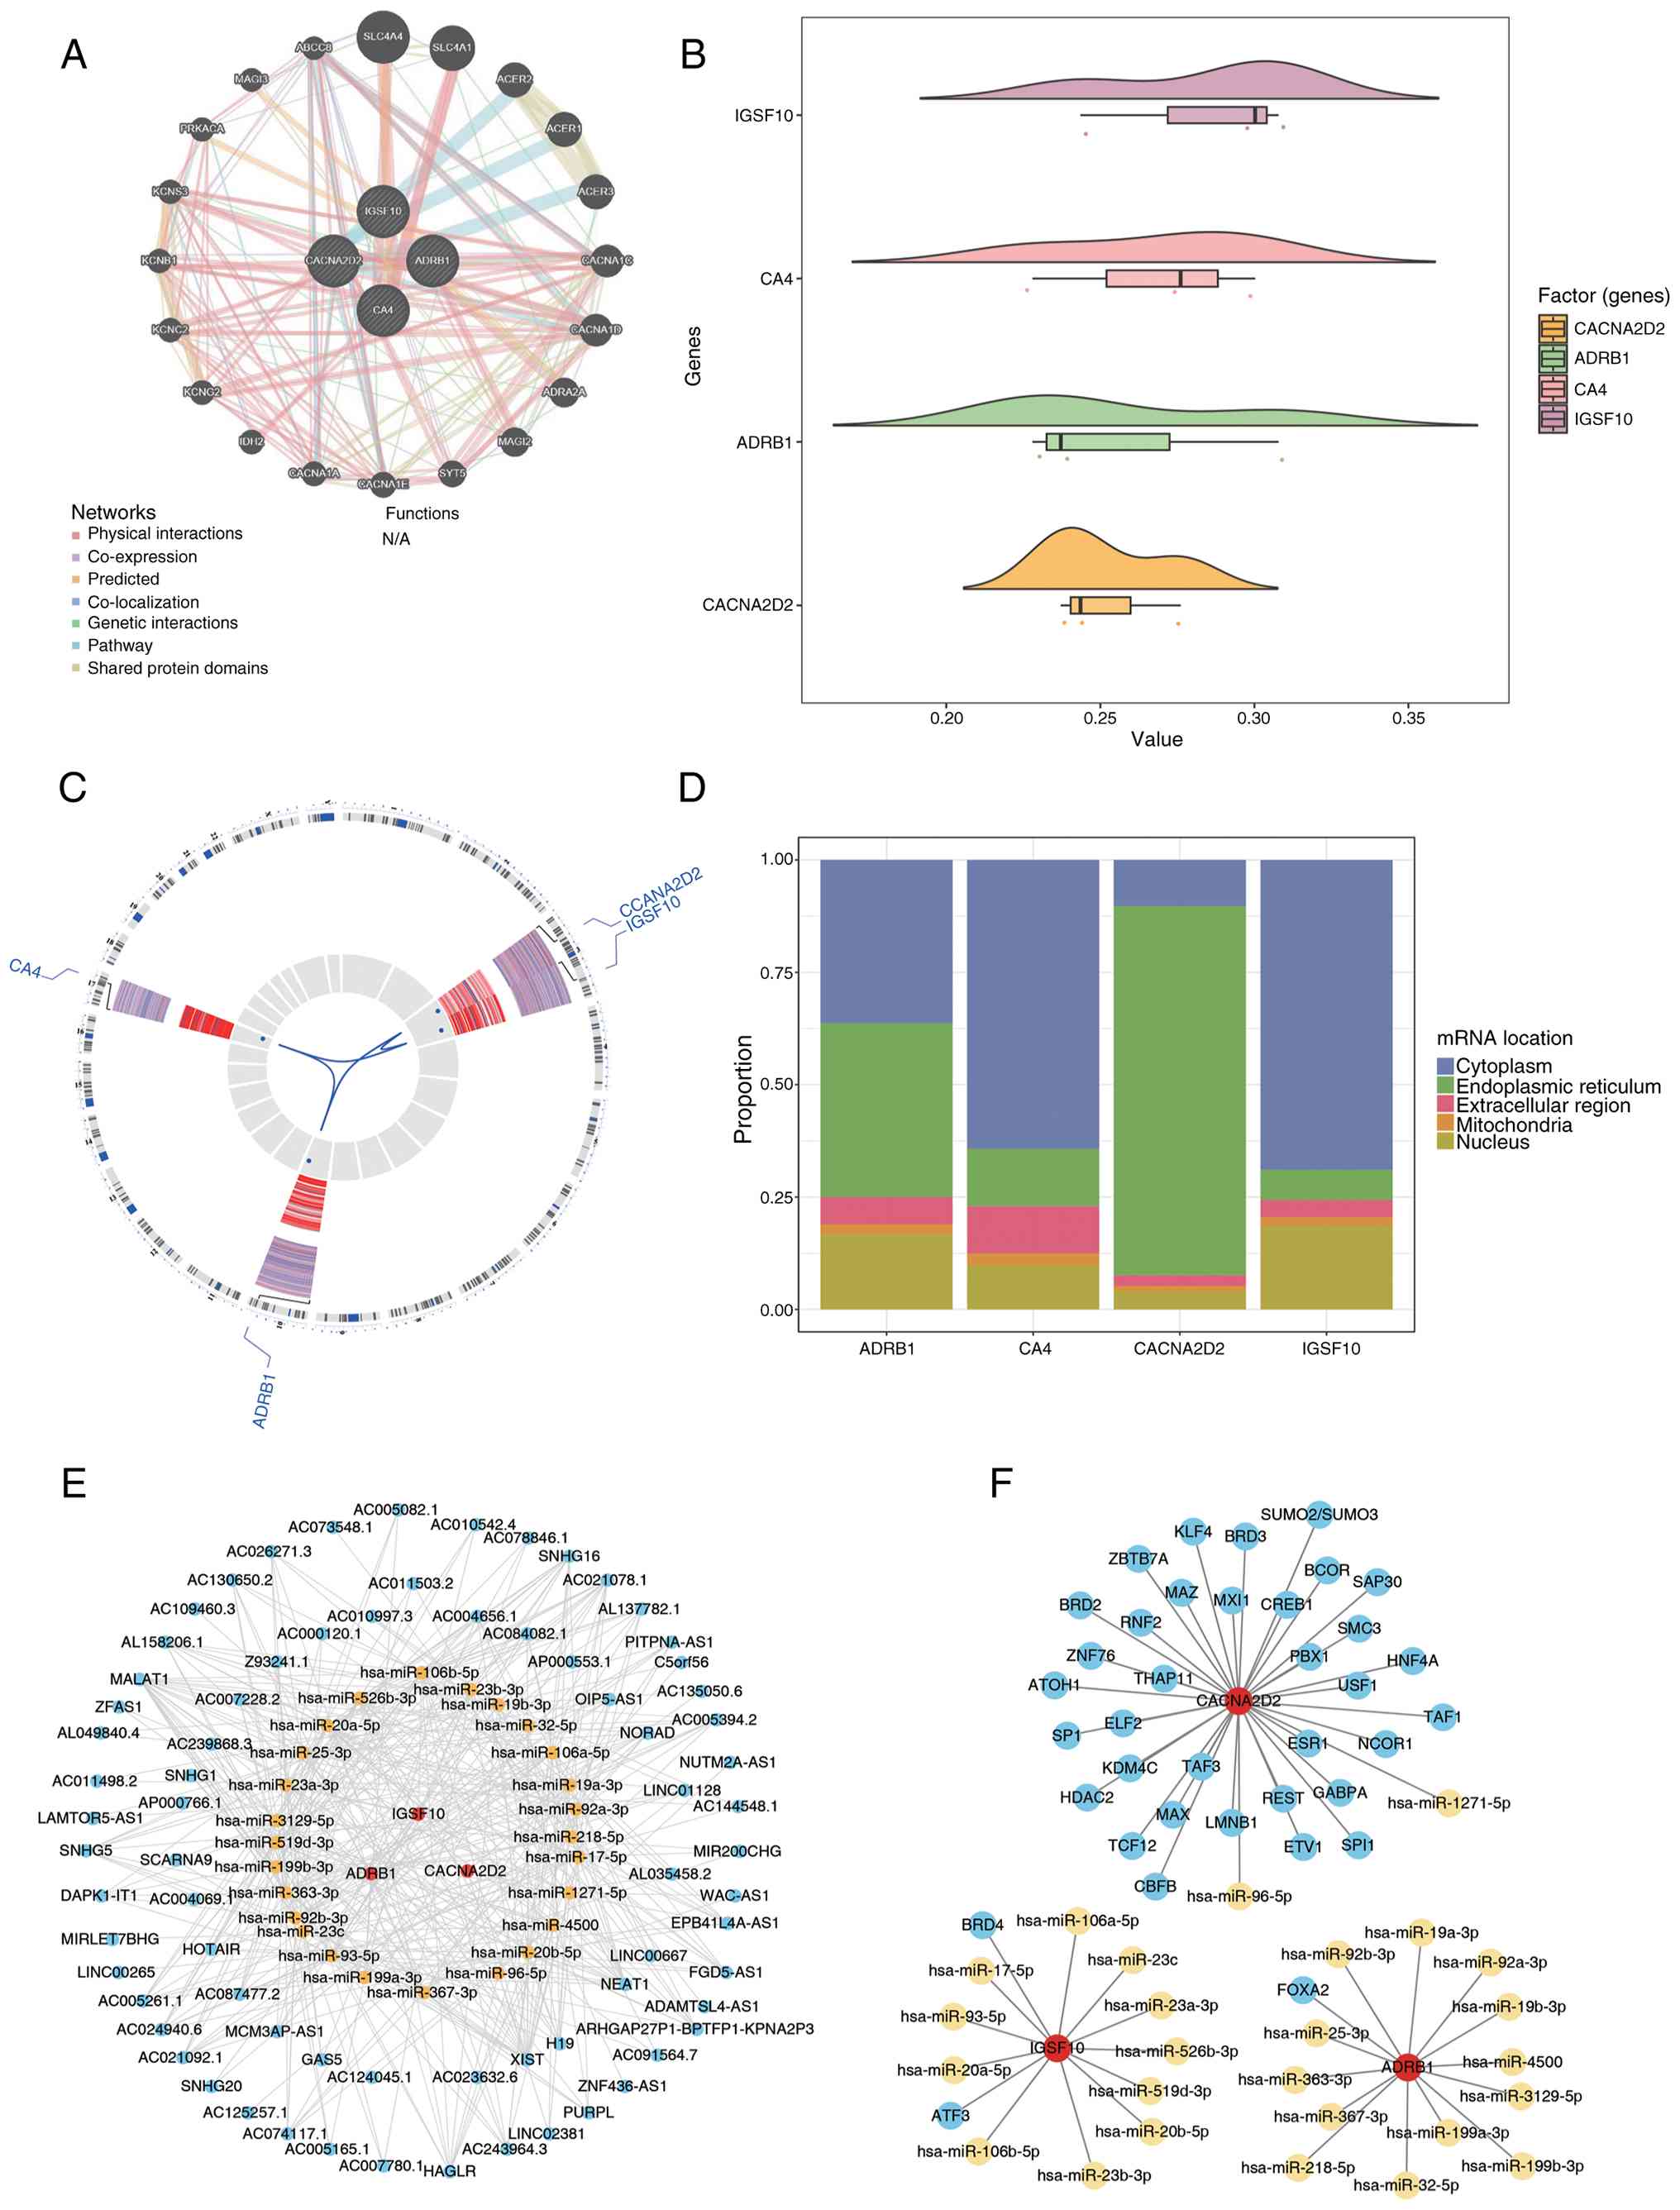 | Figure 7.Prognostic gene-related genes and
functional similarity analysis. (A) GeneMANIA database analysis
network diagram. A total of 20 genes associated with prognostic
gene functions were predicted. The large central circle represents
prognostic genes, and the small outer circles represent genes
correlated with prognostic genes. (B) Functional similarity cloud
rain diagram. The horizontal axis denotes the similarity score, and
the vertical axis represents prognostic genes. (C) Chromosomal
localization of prognostic genes: The first ring shows gene names,
with red indicating upregulated genes and blue indicating
downregulated genes; the second ring represents the chromosomal
locations of genes; the third ring displays the expression profiles
of genes in samples; the fourth ring presents the log2FC
values of genes, where blue indicates log2FC <0 and
red indicates log2FC >0. (D) Subcellular localization
of prognostic genes: The horizontal axis represents prognostic
genes, the vertical axis denotes the percentage and different
colors correspond to distinct subcellular localizations. (E)
lncRNA-mRNA-miRNA regulatory network where red represents
prognostic genes, yellow represents miRNA and blue represents
lncRNA. (F) TF-mRNA-miRNA network diagram where red represents
prognostic genes, blue represents TF and yellow represents miRNA.
FC, fold change, lncRNA, long non-coding RNAs; TF, transcription
factor; miRNA/miR, microRNA. |
Chromosomal localization revealed that ACNA2D2 and
IGSF10 were primarily located on chromosome 2, ADRB1 on chromosome
10 and CA4 on chromosome 17 (Fig.
7C). Subcellular localization analysis showed that ADRB1,
IGSF10 and CA4 were predominantly located in the cytoplasm, whereas
CACNA2D2 was primarily localized in the endoplasmic reticulum
(Fig. 7D).
The miRDB and TargetScan databases predicted
upstream miRNAs for the prognostic genes, identifying 97 and 111
miRNAs, respectively. A total of 26 target miRNAs were common
between the two databases. The upstream lncRNAs of these target
miRNAs were predicted using the Starbase database, resulting in the
identification of 73 lncRNAs. The lncRNA-miRNA-mRNA regulatory
network was then constructed (Fig.
7E). Notably, lncRNAs XIST and NEAT1 co-regulated OLFML2B via
hsa-miR-18a-5p. Additionally, 37 TFs (such as FOXA2, histone
deacetylase 2 and TATA-box binding protein associated factor 3)
were predicted to regulate IGSF10, ADRB1 and CACNA2D2 in the
hTFtarget database. Both IGSF10 and ADRB1 were found to be
simultaneously regulated by CEBPB in the miRNA-mRNA-TF network
(Fig. 7F).
Enrichment, immune cell infiltration,
and drug sensitivity analysis of high- and low-risk groups
At a significance threshold of P<0.05, the
high-risk group was significantly enriched for 756 GO pathways,
including structural components of ribosomes, ribosomal subunits,
complex-containing mitochondrial proteins and oxidative
phosphorylation (Fig. 8A). In KEGG
pathway analysis, 29 pathways were significantly enriched in the
high-risk group, such as proteasome, ribosome and pentose phosphate
pathways, while the low-risk group was enriched in 11 KEGG
pathways, including ‘α-linolenic acid metabolism’ and ‘taste
transduction’ (Fig. 8B).
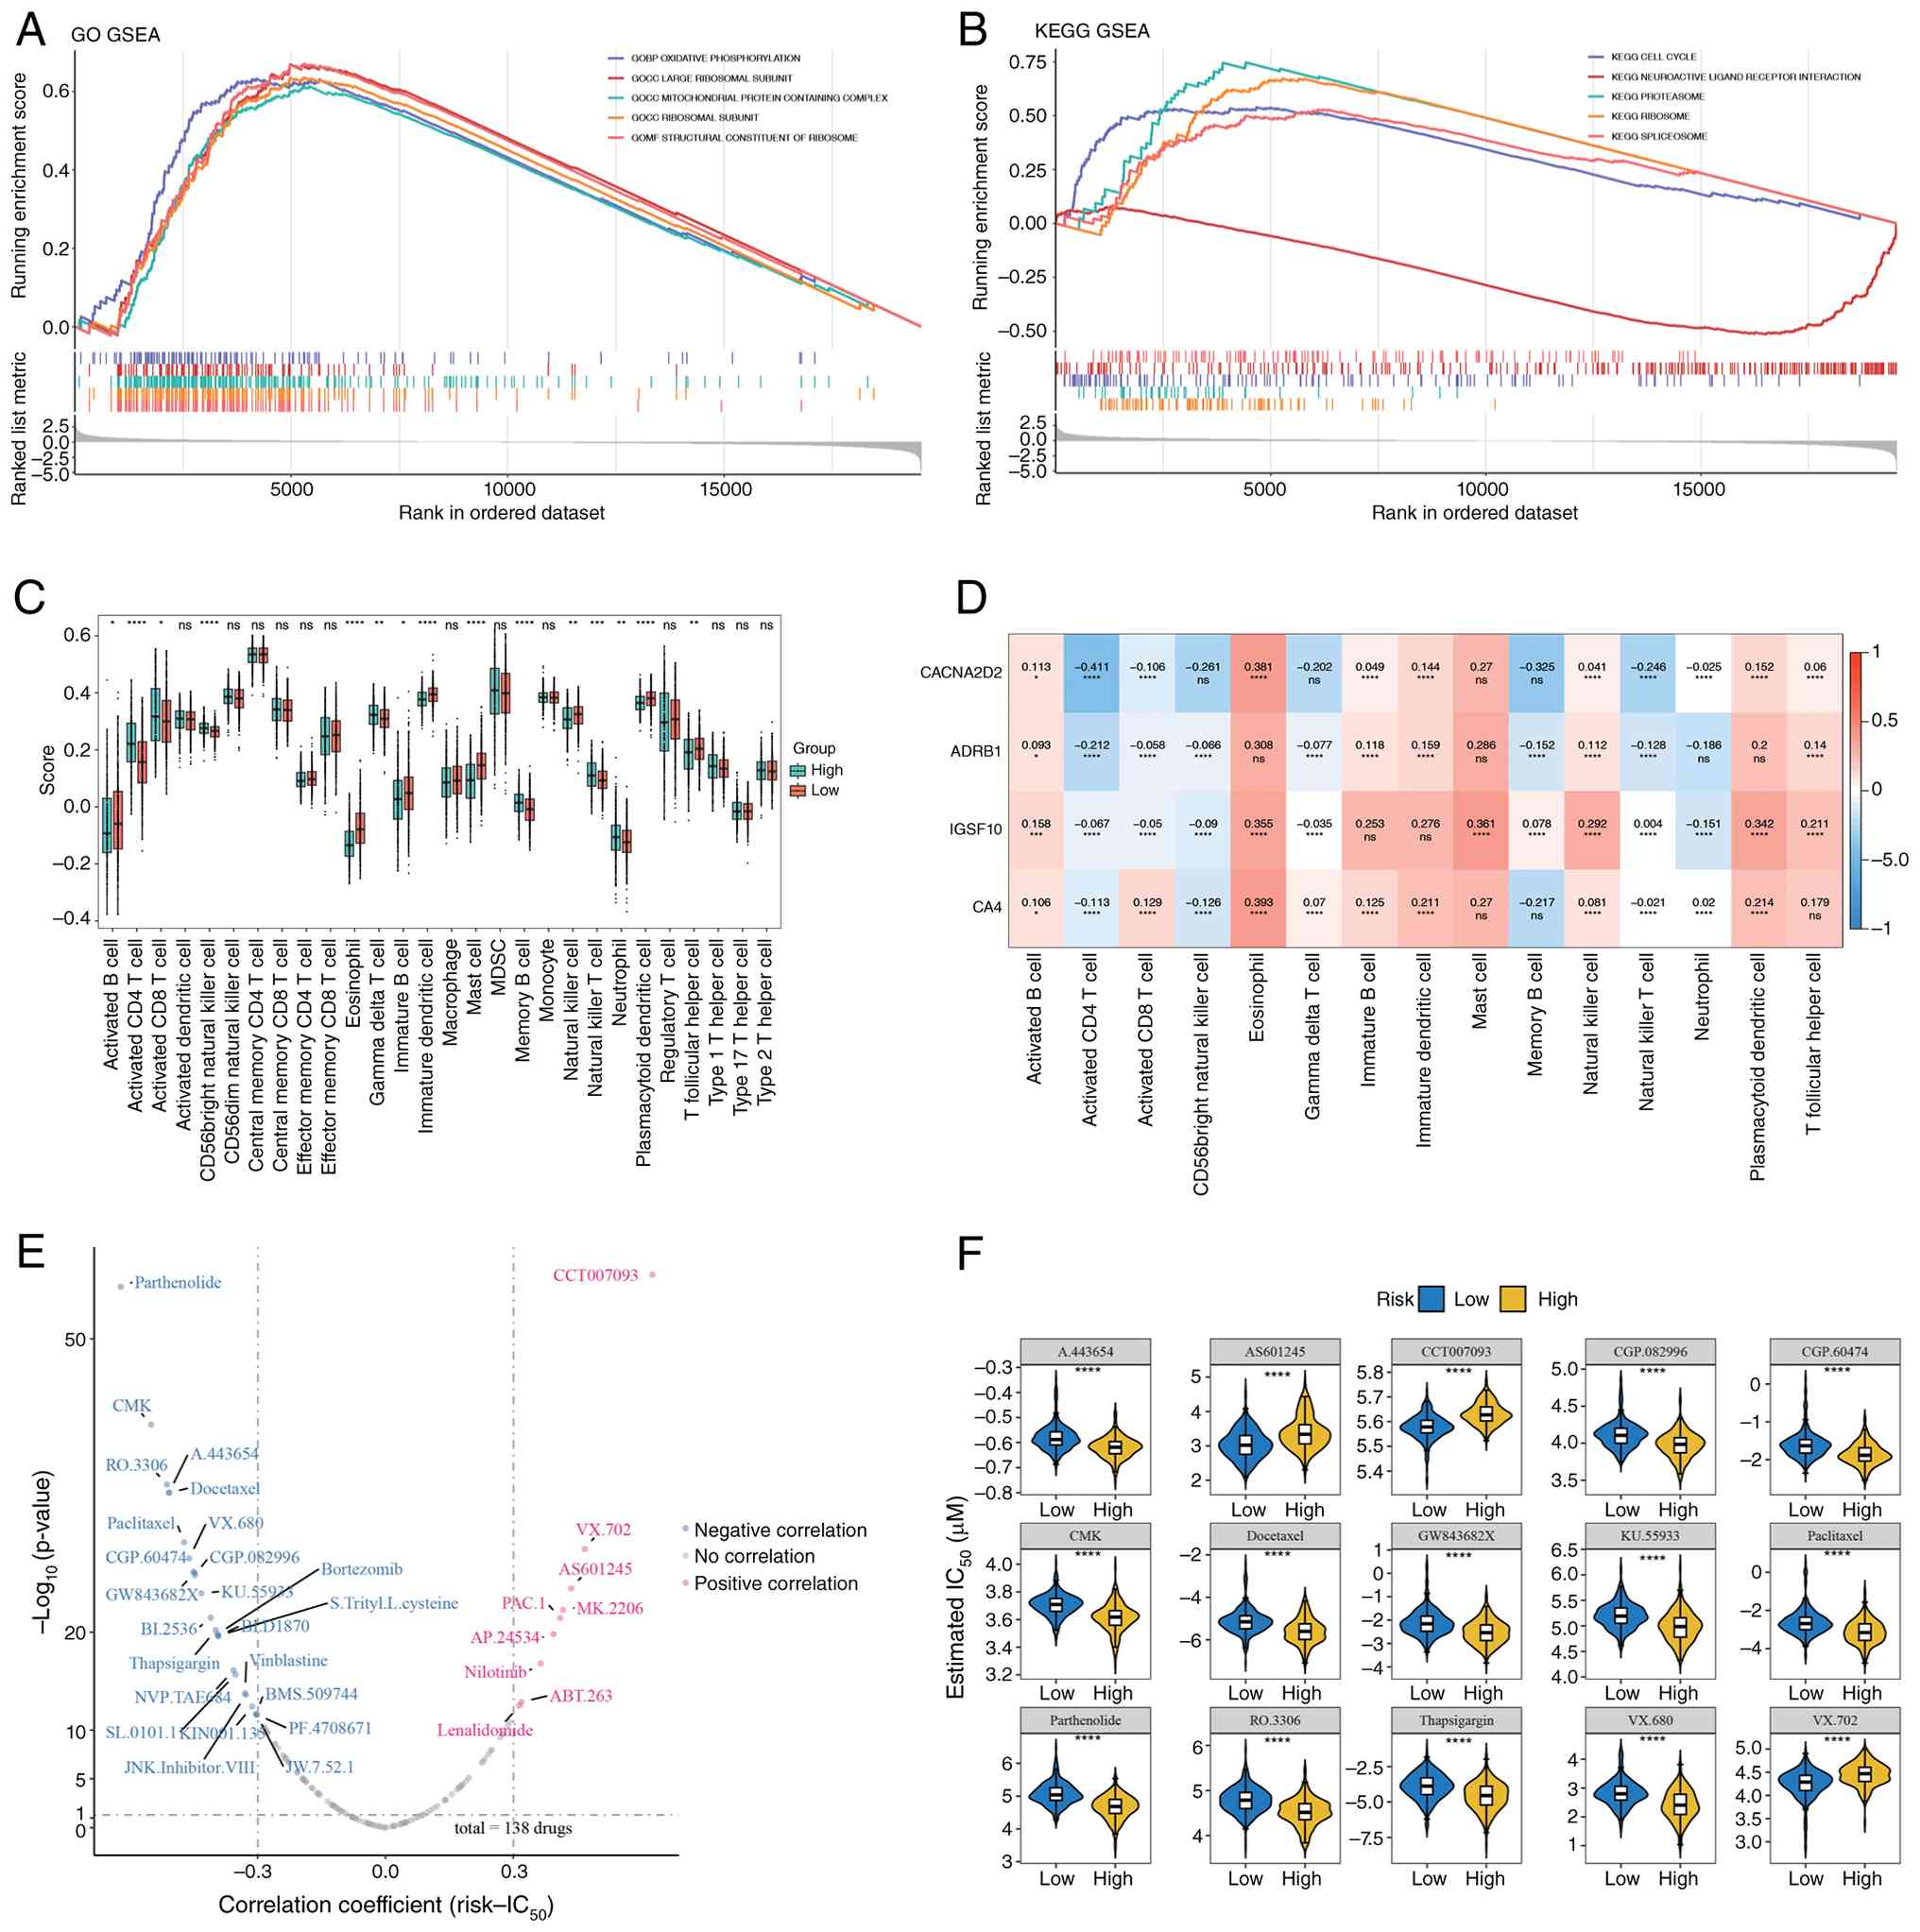 | Figure 8.Enrichment analysis, immune cell
infiltration and drug sensitivity analysis. (A) GSEA for GO
categories, GOBP, GOCC and GOMF, in high-vs. low-risk groups. (B)
GSEA for KEGG pathways. (C) Box plot showing differences in 15
immune cell populations; red bars represent high-risk and blue bars
represent low-risk samples (n=513). (D) Correlation heatmap between
prognostic genes and immune cells. (E) Spearman correlation
analysis between risk scores and drug IC50 values. (F)
Differential sensitivity of 15 antineoplastic drugs between risk
groups. All data are presented as median values. *P<0.05,
**P<0.01, ***P<0.001 and ****P<0.0001 (Wilcoxon test). ns,
not significant' KEGG, Kyoto Encyclopedia of Genes and Genomes; GO,
Gene Ontology; GOBP, Gene Ontology Biological Process; GOCC, Gene
Ontology Cellular Component; GOMF, Gene Ontology Molecular
Function; GSEA, gene set enrichment analysis; MDSC, myleoid-derived
suppressor cells. |
Immune infiltration analysis revealed significant
variations in 15 immune cell types between high- and low-risk
groups, including CD56+ natural killer cells, memory B
cells and T follicular helper cells (Fig. 8C). Additionally, eosinophils showed
a strong positive correlation with all prognostic genes (Fig. 8D).
A total of 33 drugs were identified with significant
correlations between their IC50 values and risk scores
(|cor| >0.3; P<0.05), including CCT007093, Parthenolide, CMK,
RO-3306 and A-443654 (Fig. 8E).
Among these, the IC50 values of 15 drugs showed
significant differences between the high- and low-risk groups, with
drugs such as Parthenolide, CMK and RO-3306 exhibiting lower
IC50 values in the high-risk group (P<0.05; Fig. 8F).
Significant enrichment of signalling
pathways and identification of key cell clusters
After filtering, the GSE131907 dataset retained
83,883 cells and 25,498 genes (Fig.
S14A). The data were standardized, and 2,000 HVGs were
extracted (Fig. S14B). Clustering
analysis of the top 20 PCs identified 21 distinct cell clusters
(Fig. S14C and E). A total of
eight cell types were annotated based on marker genes, including
epithelial cells, fibroblasts, endothelial cells, T lymphocytes,
natural killer cells, B lymphocytes, myeloid cells and mast cells
(Fig. 9A). The edited genes are
highly expressed in all cell types (Fig. S14D). Cell proportion analysis in
both LUAD and control groups showed that T lymphocytes and myeloid
cells represented relatively high proportions in both groups
(Fig. 9B). Significant differential
expression of prognostic genes was observed in epithelial cells
between LUAD and control tissues, leading to the selection of
epithelial cells as a key cell cluster for subsequent analysis
(P<0.01; Fig. 9C). Enriched
signaling pathways in epithelial cells included TWIK releasing
acid-sensitive K+ channels (TASK), ATP-sensitive
potassium channels and the binding of phenylacetate to glutamine
(Fig. 9D). Pseudotime analysis
revealed that epithelial cells differentiated across three distinct
stages and 19 clusters. Cluster 19 was predominantly localized in
stage 2, while cluster 12 was primarily found in stages 1 and 3,
with cluster 9 predominantly observed in stage 3 (Fig. 9E). In pseudotime, the expression of
ADRB1 and IGSF10 in epithelial cells tended to increase, while the
expression of CACNA2D2 initially increased and then decreased
(Fig. 9F). Cell communication
analysis highlighted frequent and intense interactions between
epithelial and myeloid cells, suggesting a synergistic role for
these two cell types in tumor microenvironment remodeling and
immune regulation (Fig. 9G).
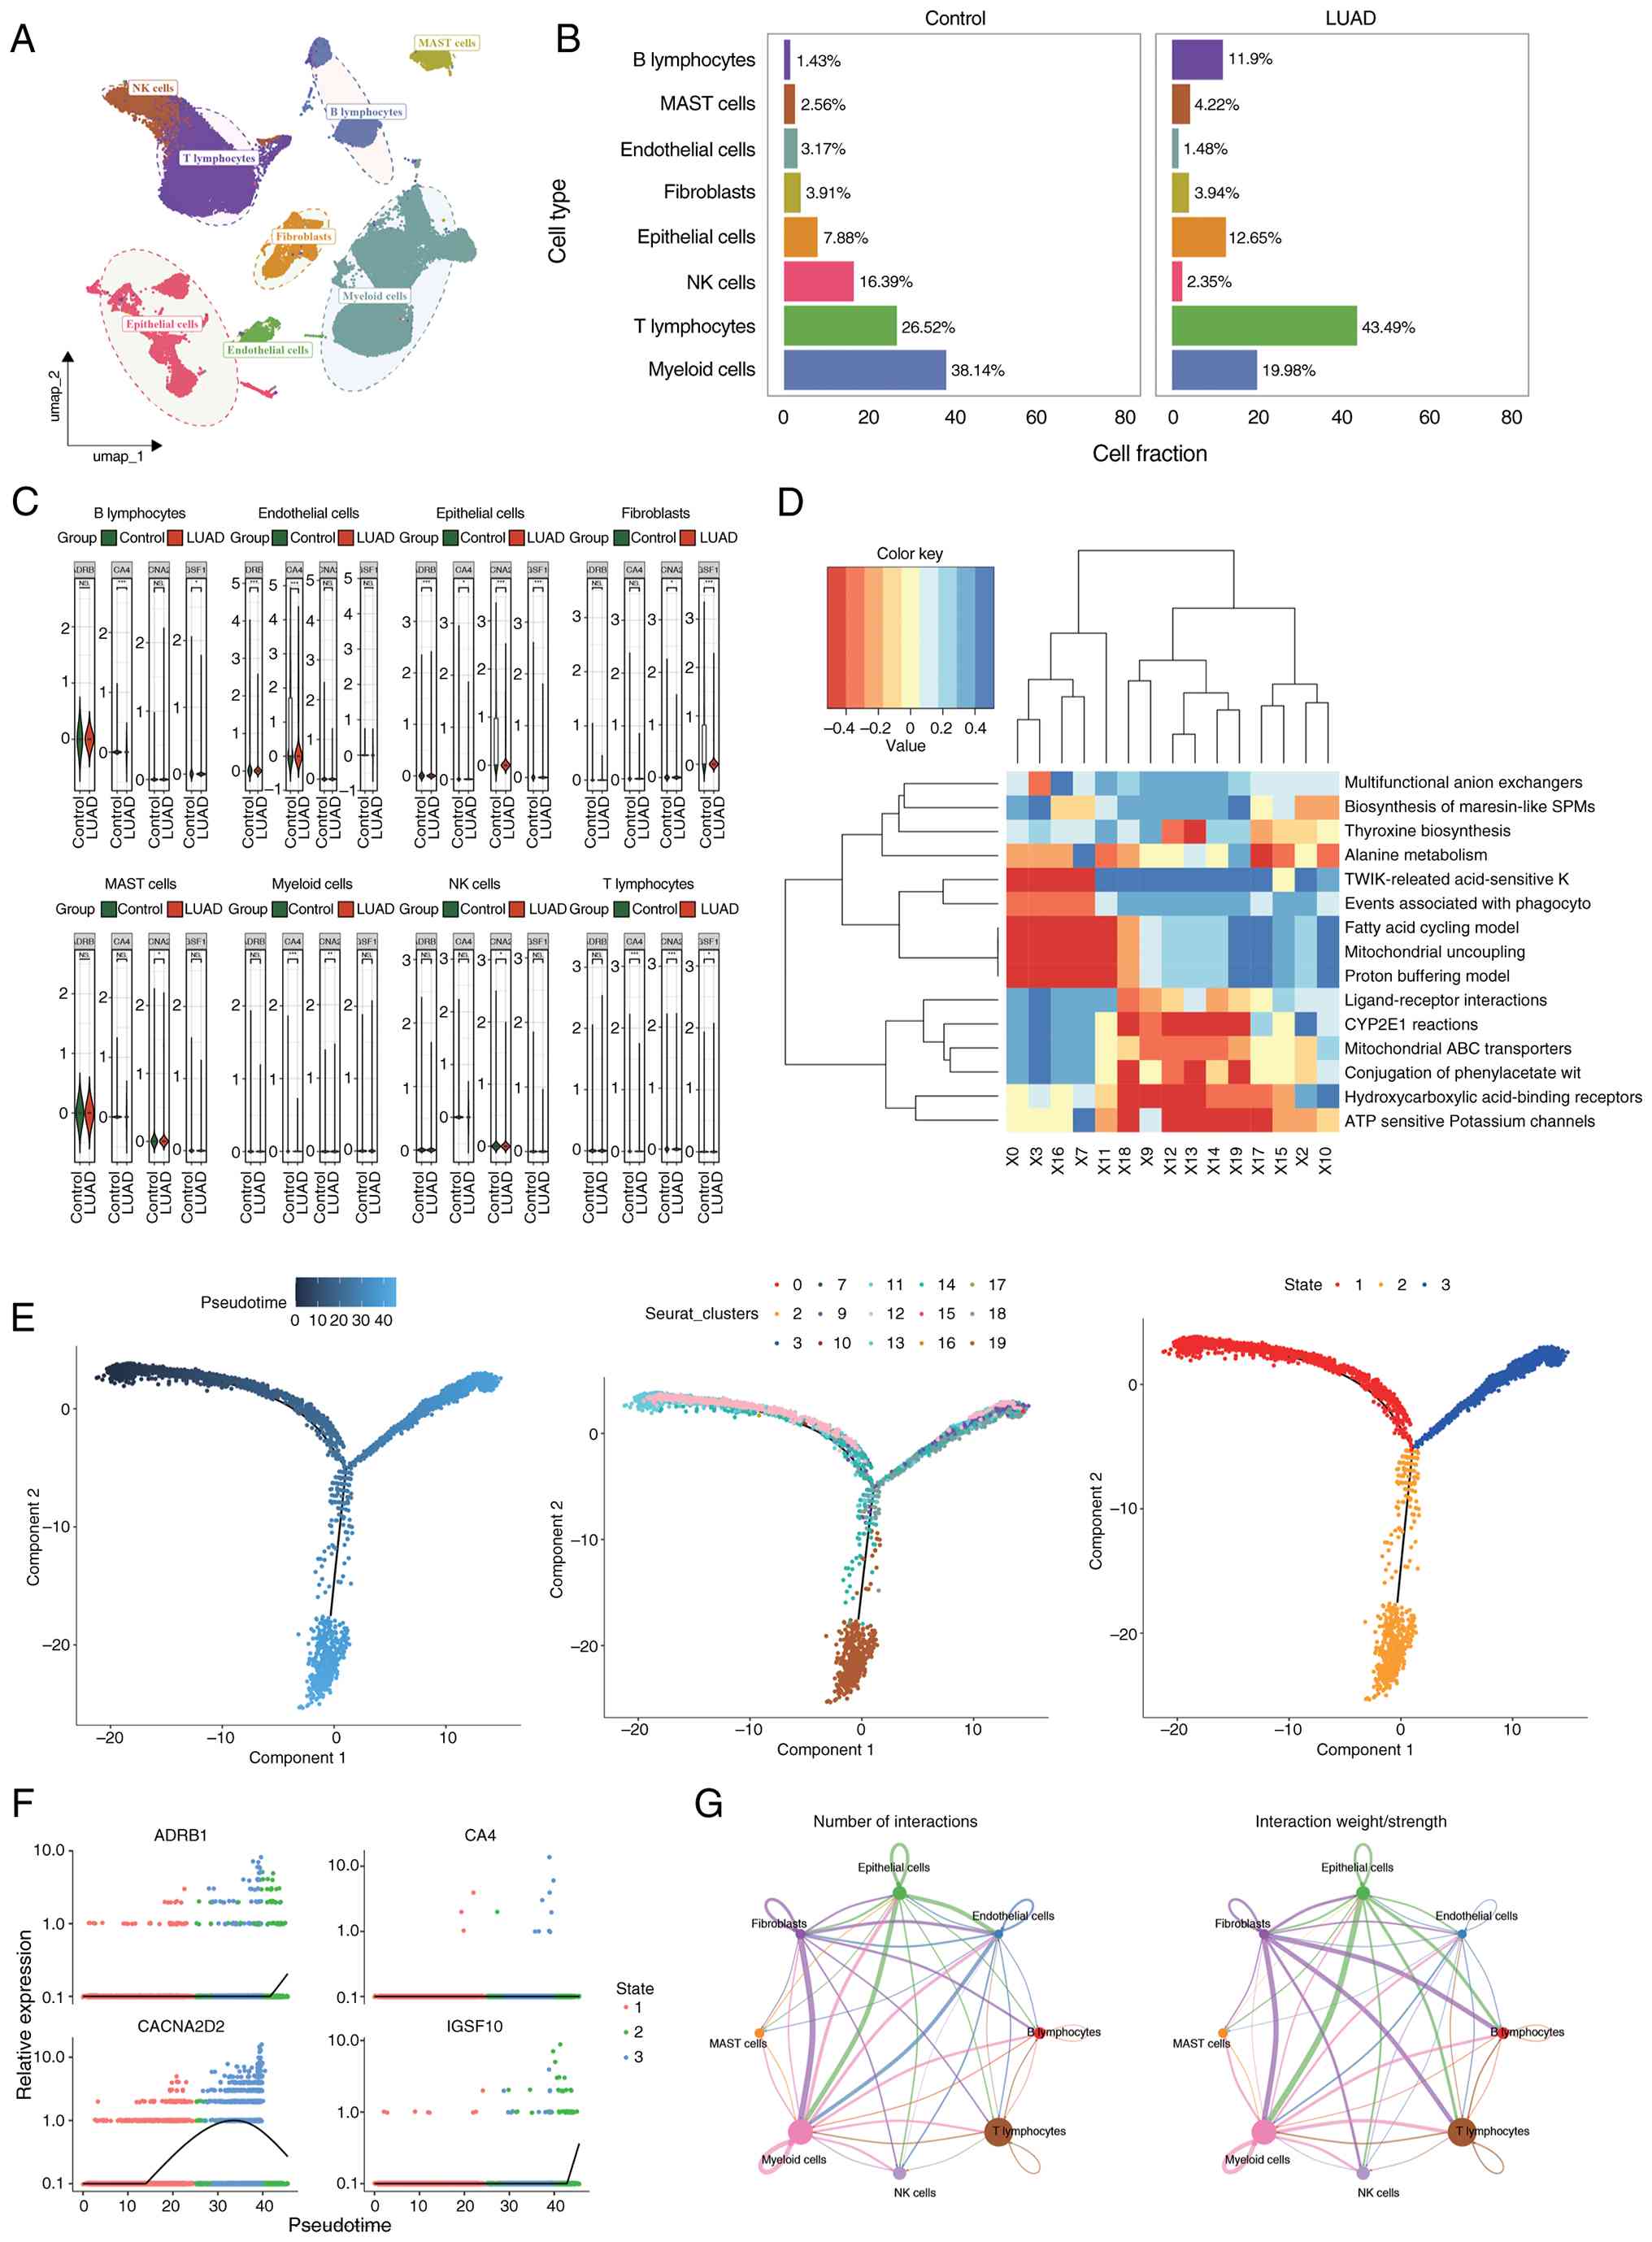 | Figure 9.Significant enrichment of signaling
pathways and identification of key cell clusters. (A) Annotated
UMAP clustering diagram: Eight cell types were annotated according
to marker genes, including epithelial cells, fibroblasts,
endothelial cells, T lymphocytes, NK cells, B lymphocytes, myeloid
cells and mast cells. (B) Proportion chart of each cell type in
LUAD and control groups. (C) Violin plot of prognostic gene
expression between the LUAD and control groups. (D) Enrichment
analysis heatmap of cells. (E) Proposed temporal trajectory
diagram: trajectory diagram of different cell subpopulations and
their differentiation stages. (F) Expression of prognostic genes in
different temporal stages. (G) Quantitative diagram of cell
communication interactions and probability intensity values of cell
communication interactions. *P<0.05, **P<0.01 and
***P<0.001 were considered statistically significant. NK,
natural killer; LUAD, lung adenocarcinoma; UMAP, Uniform Manifold
Approximation and Projection. |
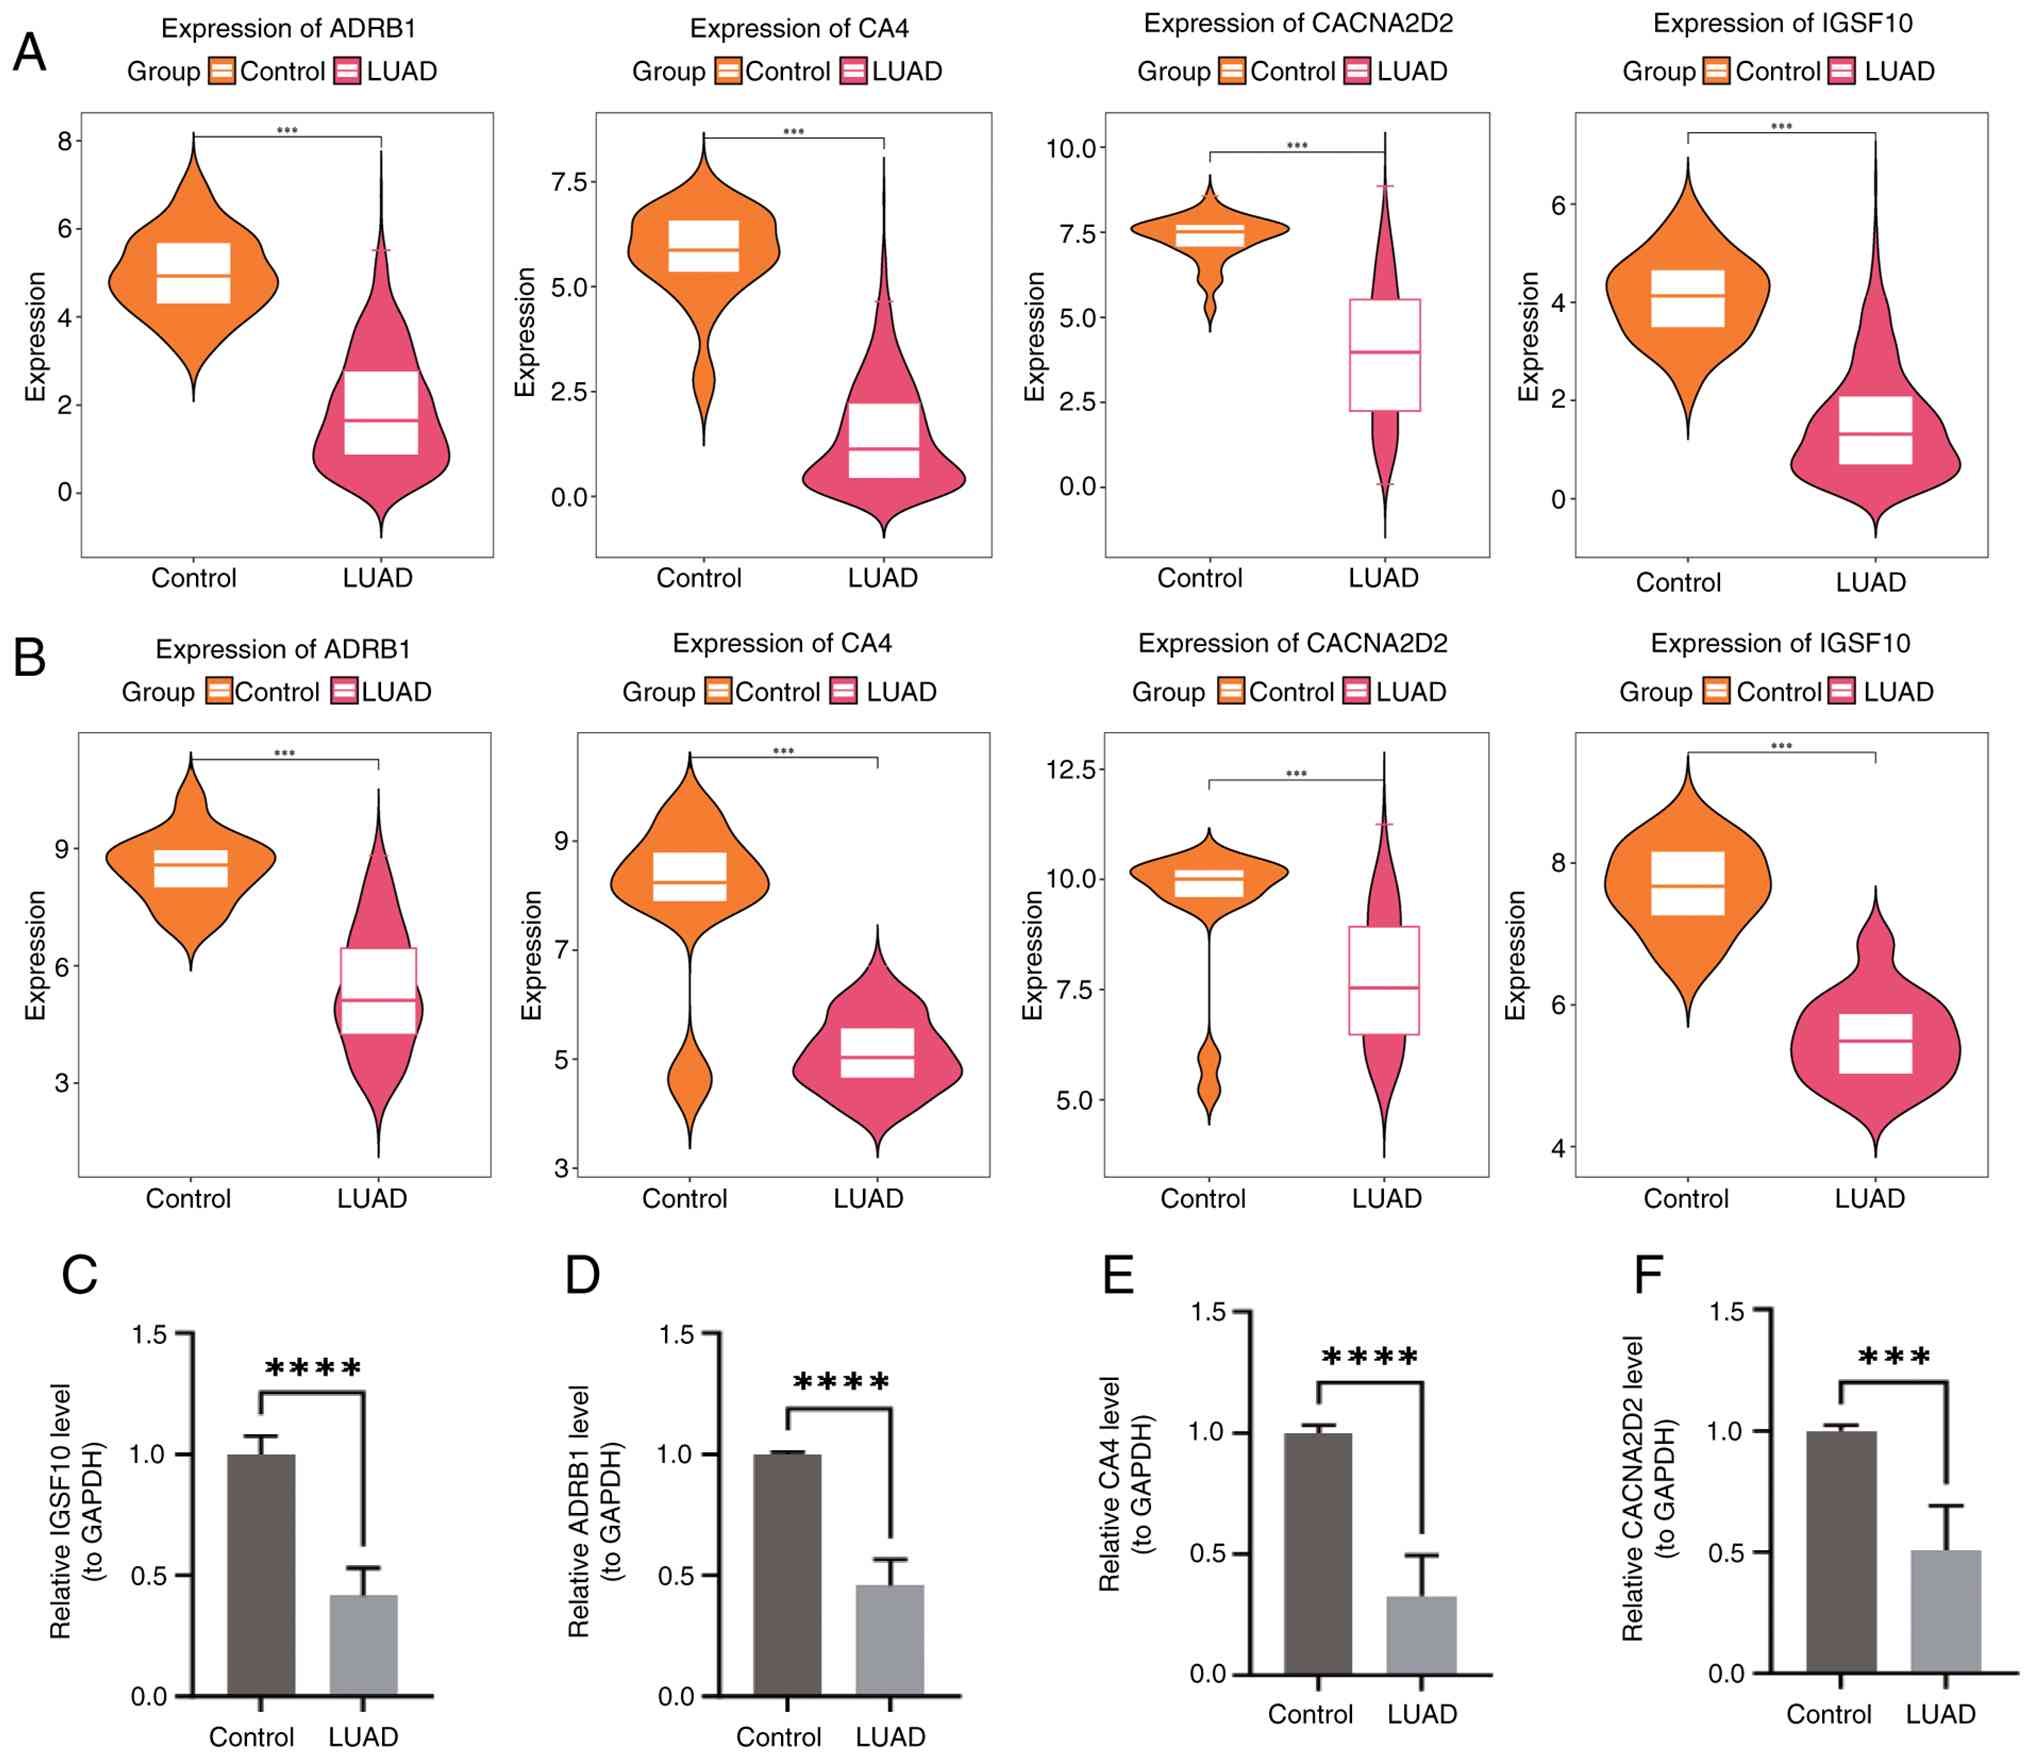
Validation of prognostic gene
expression
Wilcoxon test analysis revealed notable differences
in the expression levels of the four prognostic genes between LUAD
and control samples, with notable downregulation in LUAD samples
(Fig. 10A and B). Consistent with
these findings, RT-qPCR results (Fig.
10C-F) corroborated the dataset outcomes, indicating that these
four genes could potentially improve the prognosis of patients with
LUAD. To validate the expression levels of the four prognostic
genes, RT-qPCR was performed on clinical samples. As shown in
Fig. 10C-F, the mRNA expression
levels of CACNA2D2, ADRB1, IGSF10 and CA4 were significantly lower
in LUAD tissues compared with control tissues (all P<0.01),
consistent with the bioinformatic predictions.
Discussion
The notable role of polyamine metabolism in tumor
cell proliferation and malignant transformation underscores its
potential as a key determinant of prognosis in LUAD (18,19).
In the present study, a robust prognostic evaluation system was
constructed and refined through a triangulated approach. The
resulting four-gene prognostic model (ADRB1, CACNA2D2, IGSF10 and
CA4) provided moderate predictive insights for 3-, 5- and 7-year
survival outcomes in both TCGA-LUAD and GSE30219 datasets. Notably,
while previously reported polyamine-related models showed
fluctuating performance over time (19), the current model demonstrated a
degree of long-term stability, maintaining modest but consistent
AUC values >0.6 for up to 7 years. This observation suggests
that the simplified four-gene signature potentially captures more
fundamental biological traits associated with late-stage LUAD
progression, although further optimization is required to enhance
its robust predictive power.
MR analysis provided critical evidence for the
causal association between these prognostic genes and LUAD risk,
transcending mere transcriptomic correlation. The four prognostic
genes identified, ADRB1, CACNA2D2, IGSF10 and CA4, collectively
reflect the systematic impact of polyamine metabolic dysregulation.
CA4 and CACNA2D2 appear to function as tumor suppressors by
inhibiting Wnt signaling and modulating calcium signaling,
respectively (50,58). Conversely, the sustained increase in
ADRB1 may influence cell differentiation by regulating the
metabolic microenvironment, while IGSF10 serves as a protective
factor against metastasis (59,60).
These genes likely operate within a hyperactive polyamine
metabolism network where metabolites such as spermidine stabilize
RNA structure and enhance translation initiation efficiency,
directly regulating oxidative phosphorylation and protein stability
to drive tumor initiation and growth (61,62).
Immune infiltration analysis revealed a critical
molecular relationship between eosinophils and LUAD prognosis. A
significant reduction in eosinophil abundance was observed in
high-risk patients, alongside a strong positive correlation between
eosinophil levels and the expression of all four prognostic genes.
As eosinophils can directly kill tumor cells by releasing effector
molecules such as granzymes and eosinophil cationic protein
(63), the downregulation of these
prognostic genes likely impairs eosinophil recruitment or survival.
For instance, high expression of CA4 and IGSF10 may facilitate
immune cell adhesion and reshape the tumor microenvironment to
enhance antitumor immunity (64,65).
CA4 functions as a tumor suppressor by inhibiting the Wnt signaling
pathway through the WTAP-WT1-TBL1 axis (55). As Wnt activation is associated with
immune exclusion, CA4-mediated inhibition may promote a more
permissive environment for immune infiltration. Concurrently, as a
member of the immunoglobulin superfamily, IGSF10 possesses
structural domains essential for cell recognition and adhesion.
Recent evidence suggests that such superfamily members are critical
components of immune-associated glycopeptides that facilitate the
recruitment and attachment of immune cells to specific tissues
(56). Therefore, the identified
gene signature provides a potential bridge between metabolic
reprogramming and the suppression of the antitumor immune
response.
At the single-cell resolution, epithelial cells
emerged as a key cluster, with dynamic fluctuations in prognostic
gene expression during differentiation. Frequent and intense
interactions between epithelial and myeloid cells were highlighted,
suggesting a synergistic role in microenvironment remodeling.
Epithelial cells appear to recruit myeloid cells via chemokines
such as C-C motif chemokine ligand 2 and C-X-C motif chemokine
ligand 1, which in turn create an immunosuppressive environment
through the release of cytokines such as TGF-β and IL-10 (66,67).
This epithelial-myeloid axis forms a pro-cancer cycle that
accelerates tumor invasion, offering clear targets for subsequent
experimental research and personalized immunotherapy
strategies.
Beyond molecular mechanisms, the present study
identified marked differences in the sensitivity to 15 chemotherapy
drugs between risk groups. Specifically, high-risk patients
exhibited lower IC50 values for drugs such as
Parthenolide, CMK and RO-3306, indicating higher potential
sensitivity. The CDK1 inhibitor RO-3306, which blocks cell cycle
progression, may be particularly effective in high-risk groups
characterized by uncontrolled cell cycles due to polyamine
dysregulation (68). Furthermore,
the regulatory network analysis suggested that oncogenic molecules,
such as miR-106b-5p and lncRNAs such as HOTAIR or MALAT1, precisely
modulate the expression of the prognostic genes (69,70).
These findings provide a biological foundation for selecting
individualized therapeutic strategies based on risk
stratification.
Despite these insights, several limitations exist.
The clinical validation via RT-qPCR was based on a small sample
size (n=5), which limits the statistical robustness and
universality of the experimental findings. Future research should
focus on multi-center collaborations to collect more comprehensive
clinical samples for large-scale validation. Moreover, subsequent
work should clarify the regulatory mechanisms of ADRB1 and CACNA2D2
through knockdown or overexpression experiments in cell lines to
confirm their effects on LUAD proliferation and metastasis.
Functional experiments should also be conducted to clarify the core
regulatory molecules involved in epithelial-myeloid interactions,
thereby enhancing the reliability and translational value of the
prognostic model.
While the present study provides a robust causal
framework using MR and single-cell mapping, the lack of direct
functional validation should be acknowledged as a limitation. To
further elucidate the molecular mechanisms of the identified
polyamine-related signature, future research should focus on
several experimental directions. First, loss-of-function and
gain-of-function assays (such as short hairpin RNA-mediated
knockdown or plasmid-based overexpression) of ADRB1, CACNA2D2,
IGSF10 and CA4 should be performed in LUAD cell lines to evaluate
their direct impact on cell proliferation, migration and invasion.
Second, to bridge the gap between metabolism and signaling,
dual-luciferase reporter assays and immunoprecipitation should be
employed to investigate the regulatory crosstalk between polyamine
pathways and calcium signaling. Finally, validation of the
protein-level expression of these genes via immunohistochemistry is
needed in an expanded clinical cohort with conduction of in
vitro drug sensitivity testing to confirm the translational
potential of a risk model in guided therapy.
Supplementary Material
Supporting Data
Supporting Data
Supporting Data
Supporting Data
Acknowledgements
Not applicable.
Funding
The present study was supported by the National Natural Science
Foundation of China Cultivation Program of Hunan Cancer Hospital
(grant no. 2020NSFC-B003), Hunan Medical Association (grant no.
HMA202101011) and Hunan Provincial Natural Science Foundation
(grant no. 2021JJ31124).
Availability of data and materials
The data generated in the present study may be
requested from the corresponding author.
Authors' contributions
HY collected, analyzed and interpreted the data,
contributed to conception, design and drafted the manuscript. JC
and LZ performed the experiments and supervised the present study.
JZ designed, revised, supervised the present study and edited the
manuscript. HY and JZ were involved in conceptualization and
funding acquisition. All authors read and approved the final
version of the manuscript. JC and LZ confirm the authenticity of
all the raw data.
Ethics approval and consent to
participate
The present study was approved by the Ethics
Committee of Hunan Cancer Hospital (approval no. SBQLL-2022-127).
Informed consent was obtained in writing from all participants.
Patient consent for publication
Not applicable.
Competing interests
The authors declare that they have no competing
interests.
References
|
1
|
Qi C, Ma J, Sun J, Wu X and Ding J: The
role of molecular subtypes and immune infiltration characteristics
based on disulfidptosis-associated genes in lung adenocarcinoma.
Aging (Albany NY). 15:5075–5095. 2023.PubMed/NCBI
|
|
2
|
Siegel RL, Giaquinto AN and Jemal A:
Cancer statistics, 2024. CA Cancer J Clin. 74:12–49.
2024.PubMed/NCBI
|
|
3
|
Howlader N, Forjaz G, Mooradian MJ, Meza
R, Kong CY, Cronin KA, Mariotto AB, Lowy DR and Feuer EJ: The
effect of advances in lung-cancer treatment on population
mortality. N Engl J Med. 383:640–649. 2020. View Article : Google Scholar : PubMed/NCBI
|
|
4
|
Obradovic J, Nisevic-Lazovic J, Sekerus V,
Milasin J, Perin B and Jurisic V: Investigating the frequencies of
EGFR mutations and EGFR single nucleotide polymorphisms genotypes
and their predictive role in NSCLC patients in Republic of Serbia.
Mol Biol Rep. 52:3502025. View Article : Google Scholar : PubMed/NCBI
|
|
5
|
Jurisic V, Vukovic V, Obradovic J,
Gulyaeva LF, Kushlinskii NE and Djordjevic N: EGFR polymorphism and
survival of NSCLC patients treated with TKIs: A systematic review
and meta-analysis. J Oncol. 2020:19732412020. View Article : Google Scholar : PubMed/NCBI
|
|
6
|
Jurisic V, Obradovic J, Pavlovic S and
Djordjevic N: Epidermal growth factor receptor gene in
non-small-cell lung cancer: The importance of promoter polymorphism
investigation. Anal Cell Pathol (Amst). 2018:61921872018.PubMed/NCBI
|
|
7
|
Obradovic J, Todosijevic J and Jurisic V:
Side effects of tyrosine kinase inhibitors therapy in patients with
non-small cell lung cancer and associations with EGFR
polymorphisms: A systematic review and meta-analysis. Oncol Lett.
25:622023. View Article : Google Scholar : PubMed/NCBI
|
|
8
|
Skoulidis F and Heymach JV: Co-occurring
genomic alterations in non-small-cell lung cancer biology and
therapy. Nat Rev Cancer. 19:495–509. 2019. View Article : Google Scholar : PubMed/NCBI
|
|
9
|
Jurisic V, Radenkovic S and Konjevic G:
The actual role of LDH as tumor marker, biochemical and clinical
aspects. Adv Exp Med Biol. 867:115–124. 2015. View Article : Google Scholar : PubMed/NCBI
|
|
10
|
Faubert B, Solmonson A and DeBerardinis
RJ: Metabolic reprogramming and cancer progression. Science.
368:eaaw54732020. View Article : Google Scholar : PubMed/NCBI
|
|
11
|
Lim SA: Metabolic reprogramming of the
tumor microenvironment to enhance immunotherapy. BMB Rep.
57:388–399. 2024. View Article : Google Scholar : PubMed/NCBI
|
|
12
|
Kim DG, Du J, Miao C, Jung JH, Park SC and
Kim DK: The possible roles for polyamines in the initiation process
of SV40 DNA replication in vitro. Oncol Rep. 19:535–539.
2008.PubMed/NCBI
|
|
13
|
Baroli G, Sanchez JR, Agostinelli E,
Mariottini P and Cervelli M: Polyamines: The possible missing link
between mental disorders and epilepsy (Review). Int J Mol Med.
45:3–9. 2020.PubMed/NCBI
|
|
14
|
Zahedi K, Barone S and Soleimani M:
Polyamines and their metabolism: From the maintenance of
physiological homeostasis to the mediation of disease. Med Sci
(Basel). 10:382022.PubMed/NCBI
|
|
15
|
Rossi MN and Cervelli M: Polyamine
metabolism and functions: Key roles in cellular health and disease.
Biomolecules. 14:15702024. View Article : Google Scholar : PubMed/NCBI
|
|
16
|
Casero RA Jr, Murray Stewart T and Pegg
AE: Polyamine metabolism and cancer: Treatments, challenges and
opportunities. Nat Rev Cancer. 18:681–695. 2018. View Article : Google Scholar : PubMed/NCBI
|
|
17
|
Nowotarski SL, Woster PM and Casero RA Jr:
Polyamines and cancer: Implications for chemotherapy and
chemoprevention. Expert Rev Mol Med. 15:e32013. View Article : Google Scholar : PubMed/NCBI
|
|
18
|
Du M, Meng X, Zhou B, Song W, Shi J, Liang
M and Gao Y: A risk score based on polyamine metabolism and
chemotherapy-related genes predicts prognosis and immune cells
infiltration of lung adenocarcinoma. J Cell Mol Med. 28:e183872024.
View Article : Google Scholar : PubMed/NCBI
|
|
19
|
Li Z, Wu Y, Yang W, Wang W, Li J, Huang X,
Yang Y, Zhang X and Ye X: Characterization of polyamine metabolism
predicts prognosis, immune profile, and therapeutic efficacy in
lung adenocarcinoma patients. Front Cell Dev Biol. 12:13317592024.
View Article : Google Scholar : PubMed/NCBI
|
|
20
|
Davey Smith G and Hemani G: Mendelian
randomization: Genetic anchors for causal inference in
epidemiological studies. Hum Mol Genet. 23:R89–R98. 2014.
View Article : Google Scholar : PubMed/NCBI
|
|
21
|
Burgess S, Small DS and Thompson SG: A
review of instrumental variable estimators for Mendelian
randomization. Stat Methods Med Res. 26:2333–2355. 2017. View Article : Google Scholar : PubMed/NCBI
|
|
22
|
Carangelo G, Magi A and Semeraro R: From
multitude to singularity: An up-to-date overview of scRNA-seq data
generation and analysis. Front Genet. 13:9940692022. View Article : Google Scholar : PubMed/NCBI
|
|
23
|
Bridges K and Miller-Jensen K: Mapping and
validation of scRNA-Seq-derived cell-cell communication networks in
the tumor microenvironment. Front Immunol. 13:8852672022.
View Article : Google Scholar : PubMed/NCBI
|
|
24
|
Zhang P, Liu J, Pei S, Wu D, Xie J, Liu J
and Li J: Mast cell marker gene signature: Prognosis and
immunotherapy response prediction in lung adenocarcinoma through
integrated scRNA-seq and bulk RNA-seq. Front Immunol.
14:11895202023. View Article : Google Scholar : PubMed/NCBI
|
|
25
|
Maynard A, McCoach CE, Rotow JK, Harris L,
Haderk F, Kerr DL, Yu EA, Schenk EL, Tan W, Zee A, et al:
Therapy-induced evolution of human lung cancer revealed by
single-cell RNA sequencing. Cell. 182:1232–1251.e22. 2020.
View Article : Google Scholar : PubMed/NCBI
|
|
26
|
Shen Y, Li D, Liang Q, Yang M, Pan Y and
Li H: Cross-talk between cuproptosis and ferroptosis regulators
defines the tumor microenvironment for the prediction of prognosis
and therapies in lung adenocarcinoma. Front Immunol.
13:10290922022. View Article : Google Scholar : PubMed/NCBI
|
|
27
|
Kim N, Kim HK, Lee K, Hong Y, Cho JH, Choi
JW, Lee JI, Suh YL, Ku BM, Eum HH, et al: Single-cell RNA
sequencing demonstrates the molecular and cellular reprogramming of
metastatic lung adenocarcinoma. Nat Commun. 11:22852020. View Article : Google Scholar : PubMed/NCBI
|
|
28
|
Love MI, Huber W and Anders S: Moderated
estimation of fold change and dispersion for RNA-seq data with
DESeq2. Genome Biol. 15:5502014. View Article : Google Scholar : PubMed/NCBI
|
|
29
|
Gustavsson EK, Zhang D, Reynolds RH,
Garcia-Ruiz S and Ryten M: Ggtranscript: An R package for the
visualization and interpretation of transcript isoforms using
ggplot2. Bioinformatics. 38:3844–3846. 2022. View Article : Google Scholar : PubMed/NCBI
|
|
30
|
Gu Z and Hubschmann D: Make Interactive
complex Heatmaps in R. Bioinformatics. 38:1460–1462. 2022.
View Article : Google Scholar : PubMed/NCBI
|
|
31
|
Subramanian A, Tamayo P, Mootha VK,
Mukherjee S, Ebert BL, Gillette MA, Paulovich A, Pomeroy SL, Golub
TR, Lander ES and Mesirov JP: Gene set enrichment analysis: A
knowledge-based approach for interpreting genome-wide expression
profiles. Proc Natl Acad Sci USA. 102:15545–15550. 2005. View Article : Google Scholar : PubMed/NCBI
|
|
32
|
Langfelder P and Horvath S: WGCNA: An R
package for weighted correlation network analysis. BMC
Bioinformatics. 9:5592008. View Article : Google Scholar : PubMed/NCBI
|
|
33
|
Chen H and Boutros PC: VennDiagram: A
package for the generation of highly-customizable Venn and Euler
diagrams in R. BMC Bioinformatics. 12:352011. View Article : Google Scholar : PubMed/NCBI
|
|
34
|
Wu T, Hu E, Xu S, Chen M, Guo P, Dai Z,
Feng T, Zhou L, Tang W, Zhan L, et al: clusterProfiler 4.0: A
universal enrichment tool for interpreting omics data. Innovation
(Camb). 2:1001412021.PubMed/NCBI
|
|
35
|
Shannon P, Markiel A, Ozier O, Baliga NS,
Wang JT, Ramage D, Amin N, Schwikowski B and Ideker T: Cytoscape: A
software environment for integrated models of biomolecular
interaction networks. Genome Res. 13:2498–2504. 2003. View Article : Google Scholar : PubMed/NCBI
|
|
36
|
Hemani G, Zheng J, Elsworth B, Wade KH,
Haberland V, Baird D, Laurin C, Burgess S, Bowden J, Langdon R, et
al: The MR-Base platform supports systematic causal inference
across the human phenome. Elife. 7:e344082018. View Article : Google Scholar : PubMed/NCBI
|
|
37
|
Burgess S and Thompson SG: Interpreting
findings from Mendelian randomization using the MR-Egger method.
Eur J Epidemiol. 32:377–389. 2017. View Article : Google Scholar : PubMed/NCBI
|
|
38
|
Bowden J, Davey Smith G, Haycock PC and
Burgess S: Consistent estimation in mendelian randomization with
some invalid instruments using a weighted median estimator. Genet
Epidemiol. 40:304–314. 2016. View Article : Google Scholar : PubMed/NCBI
|
|
39
|
Burgess S, Scott RA, Timpson NJ, Davey
Smith G, Thompson SG and Consortium EI: Using published data in
Mendelian randomization: A blueprint for efficient identification
of causal risk factors. Eur J Epidemiol. 30:543–552. 2015.
View Article : Google Scholar : PubMed/NCBI
|
|
40
|
Chen X, Kong J, Diao X, Cai J, Zheng J,
Xie W, Qin H, Huang J and Lin T: Depression and prostate cancer
risk: A Mendelian randomization study. Cancer Med. 9:9160–9167.
2020. View Article : Google Scholar : PubMed/NCBI
|
|
41
|
Hu J, Song J, Chen Z, Yang J, Shi Q, Jin
F, Pang Q, Chang X, Tian Y, Luo Y and Chen L: Reverse causal
relationship between periodontitis and shortened telomere length:
Bidirectional two-sample Mendelian random analysis. Front Immunol.
13:10576022022. View Article : Google Scholar : PubMed/NCBI
|
|
42
|
Lu L, Wan B, Li L and Sun M:
Hypothyroidism has a protective causal association with
hepatocellular carcinoma: A two-sample Mendelian randomization
study. Front Endocrinol (Lausanne). 13:9874012022. View Article : Google Scholar : PubMed/NCBI
|
|
43
|
Verbanck M, Chen CY, Neale B and Do R:
Detection of widespread horizontal pleiotropy in causal
relationships inferred from Mendelian randomization between complex
traits and diseases. Nat Genet. 50:693–398. 2018. View Article : Google Scholar : PubMed/NCBI
|
|
44
|
Dong Q, Chen D, Zhang Y, Xu Y, Yan L and
Jiang J: Constipation and cardiovascular disease: A two-sample
Mendelian randomization analysis. Front Cardiovasc Med.
10:10809822023. View Article : Google Scholar : PubMed/NCBI
|
|
45
|
Xu J, Yang T, Wu F, Chen T, Wang A and Hou
S: A nomogram for predicting prognosis of patients with cervical
cerclage. Heliyon. 9:e211472023. View Article : Google Scholar : PubMed/NCBI
|
|
46
|
Vickers AJ and Elkin EB: Decision curve
analysis: A novel method for evaluating prediction models. Med
Decis Making. 26:565–574. 2006. View Article : Google Scholar : PubMed/NCBI
|
|
47
|
Zhang H, Meltzer P and Davis S: RCircos:
An R package for Circos 2D track plots. BMC Bioinformatics.
14:2442013. View Article : Google Scholar : PubMed/NCBI
|
|
48
|
Yu G, Li F, Qin Y, Bo X, Wu Y and Wang S:
GOSemSim: An R package for measuring semantic similarity among GO
terms and gene products. Bioinformatics. 26:976–978. 2010.
View Article : Google Scholar : PubMed/NCBI
|
|
49
|
Ru Y, Kechris KJ, Tabakoff B, Hoffman P,
Radcliffe RA, Bowler R, Mahaffey S, Rossi S, Calin GA, Bemis L and
Theodorescu D: The multiMiR R package and database: Integration of
microRNA-target interactions along with their disease and drug
associations. Nucleic Acids Res. 42:e1332014. View Article : Google Scholar : PubMed/NCBI
|
|
50
|
Maeser D, Gruener RF and Huang RS:
oncoPredict: An R package for predicting in vivo or cancer patient
drug response and biomarkers from cell line screening data. Brief
Bioinform. 22:bbab2602021. View Article : Google Scholar : PubMed/NCBI
|
|
51
|
Hao Y, Hao S, Andersen-Nissen E, Mauck WM
III, Zheng S, Butler A, Lee MJ, Wilk AJ, Darby C, Zager M, et al:
Integrated analysis of multimodal single-cell data. Cell.
184:3573–3587.e29. 2021. View Article : Google Scholar : PubMed/NCBI
|
|
52
|
Hao Y, Stuart T, Kowalski MH, Choudhary S,
Hoffman P, Hartman A, Srivastava A, Molla G, Madad S,
Fernandez-Granda C and Satija R: Dictionary learning for
integrative, multimodal and scalable single-cell analysis. Nat
Biotechnol. 42:293–304. 2024. View Article : Google Scholar : PubMed/NCBI
|
|
53
|
Becht E, McInnes L, Healy J, Dutertre CA,
Kwok IWH, Ng LG, Ginhoux F and Newell EW: Dimensionality reduction
for visualizing single-cell data using UMAP. Nat Biotechnol. Dec
3–2018.doi: 10.1038/nbt.4314 (Epub ahead of print). PubMed/NCBI
|
|
54
|
Griss J, Viteri G, Sidiropoulos K, Nguyen
V, Fabregat A and Hermjakob H: ReactomeGSA-Efficient Multi-Omics
comparative pathway analysis. Mol Cell Proteomics. 19:2115–2125.
2020. View Article : Google Scholar : PubMed/NCBI
|
|
55
|
Jin S, Guerrero-Juarez CF, Zhang L, Chang
I, Ramos R, Kuan CH, Myung P, Plikus MV and Nie Q: Inference and
analysis of cell-cell communication using CellChat. Nat Commun.
12:10882021. View Article : Google Scholar : PubMed/NCBI
|
|
56
|
Qiu X, Mao Q, Tang Y, Wang L, Chawla R,
Pliner HA and Trapnell C: Reversed graph embedding resolves complex
single-cell trajectories. Nat Methods. 14:979–982. 2017. View Article : Google Scholar : PubMed/NCBI
|
|
57
|
Livak KJ and Schmittgen TD: Analysis of
relative gene expression data using real-time quantitative PCR and
the 2(−Delta Delta C(T)) method. Methods. 25:402–408. 2001.
View Article : Google Scholar : PubMed/NCBI
|
|
58
|
Mitra S, Mazumder Indra D, Basu PS, Mondal
RK, Roy A, Roychoudhury S and Panda CK: Alterations of RASSF1A in
premalignant cervical lesions: Clinical and prognostic
significance. Mol Carcinog. 51:723–733. 2012. View Article : Google Scholar : PubMed/NCBI
|
|
59
|
Ling B, Ye G, Qin C, Liao X, Yang R, Su L
and Qi G: IGSF10 inhibits the metastasis of lung adenocarcinoma via
the Spi-B/Integrin-beta1 signaling pathway. J Biochem Mol Toxicol.
38:e236932024. View Article : Google Scholar : PubMed/NCBI
|
|
60
|
Li Q, Xu S, Ren Y, Zhang C, Li K and Liu
Y: Single-cell RNA sequencing reveals adrb1 as a sympathetic
nerve-regulated immune checkpoint driving T cell exhaustion and
impacting immunotherapy in esophageal squamous cell carcinoma.
Front Immunol. 16:15207662025. View Article : Google Scholar : PubMed/NCBI
|
|
61
|
Dever TE and Ivanov IP: Roles of
polyamines in translation. J Biol Chem. 293:18719–18729. 2018.
View Article : Google Scholar : PubMed/NCBI
|
|
62
|
Al-Habsi M, Chamoto K, Matsumoto K, Nomura
N, Zhang B, Sugiura Y, Sonomura K, Maharani A, Nakajima Y, Wu Y, et
al: Spermidine activates mitochondrial trifunctional protein and
improves antitumor immunity in mice. Science. 378:eabj35102022.
View Article : Google Scholar : PubMed/NCBI
|
|
63
|
Davis BP and Rothenberg ME: Eosinophils
and cancer. Cancer Immunol Res. 2:1–8. 2014. View Article : Google Scholar : PubMed/NCBI
|
|
64
|
Zhang J, Tsoi H, Li X, Wang H, Gao J, Wang
K, Go MY, Ng SC, Chan FK, Sung JJ and Yu J: Carbonic anhydrase IV
inhibits colon cancer development by inhibiting the Wnt signalling
pathway through targeting the WTAP-WT1-TBL1 axis. Gut.
65:1482–1493. 2016. View Article : Google Scholar : PubMed/NCBI
|
|
65
|
Xu Z, Liu Y, He S, Sun R, Zhu C, Li S, Hai
S, Luo Y, Zhao Y and Dai L: Integrative proteomics and
N-Glycoproteomics analyses of rheumatoid arthritis synovium reveal
immune-associated Glycopeptides. Mol Cell Proteomics.
22:1005402023. View Article : Google Scholar : PubMed/NCBI
|
|
66
|
Jin Y, Wang Y and Yang R: Chemokine ligand
2: Beyond chemotaxis-a multifaceted role in tumor progression.
Front Immunol. 16:16854742025. View Article : Google Scholar : PubMed/NCBI
|
|
67
|
Ohnuki H, Jiang K, Wang D, Salvucci O,
Kwak H, Sanchez-Martin D, Maric D and Tosato G: Tumor-infiltrating
myeloid cells activate Dll4/Notch/TGF-β signaling to drive
malignant progression. Cancer Res. 74:2038–2049. 2014. View Article : Google Scholar : PubMed/NCBI
|
|
68
|
Huang Y, Fan Y, Zhao Z, Zhang X, Tucker K,
Staley A, Suo H, Sun W, Shen X, Deng B, et al: Inhibition of CDK1
by RO-3306 exhibits anti-tumorigenic effects in ovarian cancer
cells and a transgenic mouse model of ovarian cancer. Int J Mol
Sci. 24:123752023. View Article : Google Scholar : PubMed/NCBI
|
|
69
|
Martinez-Terroba E, Plasek-Hegde LM,
Chiotakakos I, Li V, de Miguel FJ, Robles-Oteiza C, Tyagi A, Politi
K, Zamudio JR and Dimitrova N: Overexpression of Malat1 drives
metastasis through inflammatory reprogramming of the tumor
microenvironment. Sci Immunol. 9:eadh54622024. View Article : Google Scholar : PubMed/NCBI
|
|
70
|
Ling B, Liao X, Tang Q, Ye G, Bin X, Wang
J, Pang Y and Qi G: MicroRNA-106b-5p inhibits growth and
progression of lung adenocarcinoma cells by downregulating IGSF10.
Aging (Albany NY). 13:18740–18756. 2021. View Article : Google Scholar : PubMed/NCBI
|